Evaluation of Wildlife Mitigation Measures, US93...
32
Evaluation of Evaluation of Wildlife Mitigation Measures, Wildlife Mitigation Measures, US93 US93 Evaro Evaro - - Polson: Polson: Preconstruction Monitoring and Preconstruction Monitoring and Research Results Research Results Marcel Huijser, Amanda Hardy, Marcel Huijser, Amanda Hardy, Julie Fuller, Angela Kociolek, Julie Fuller, Angela Kociolek, Meredith Evans, Pat McGowen Meredith Evans, Pat McGowen September 19th, 2007 September 19th, 2007 For ACE Conference, Missoula, MT For ACE Conference, Missoula, MT
Transcript of Evaluation of Wildlife Mitigation Measures, US93...

Evaluation of Evaluation of Wildlife Mitigation Measures, Wildlife Mitigation Measures, US93 US93 EvaroEvaro--Polson:Polson:
Preconstruction Monitoring and Preconstruction Monitoring and Research ResultsResearch ResultsMarcel Huijser, Amanda Hardy, Marcel Huijser, Amanda Hardy, Julie Fuller, Angela Kociolek, Julie Fuller, Angela Kociolek, Meredith Evans, Pat McGowenMeredith Evans, Pat McGowen
September 19th, 2007September 19th, 2007For ACE Conference, Missoula, MTFor ACE Conference, Missoula, MT

Trend animalTrend animal--vehicle collisionsvehicle collisions
100000
200000
300000
400000
500000
1990
1991
1992
1993
1994
1995
1996
1997
1998
1999
2000
2001
2002
2003
2004
# A
VCs
2000000
4000000
6000000
8000000
# ALL C
RA
SHES
AVCs All Crashes
AVCs: P < 0.001, R2 = 0.89GES (General Estimates SystemSub-sample for every US state)Huijser et al., in prep.
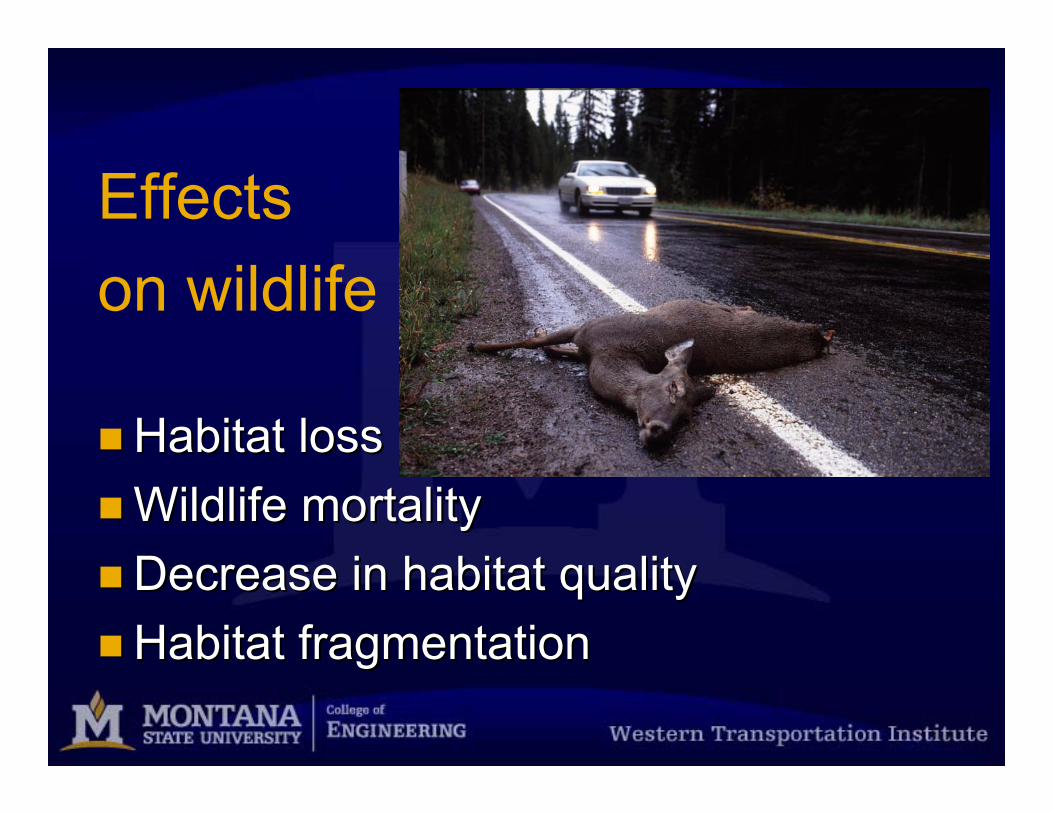
Effects on wildlife
Habitat loss Habitat loss Wildlife mortalityWildlife mortality Decrease in habitat qualityDecrease in habitat quality Habitat fragmentationHabitat fragmentation
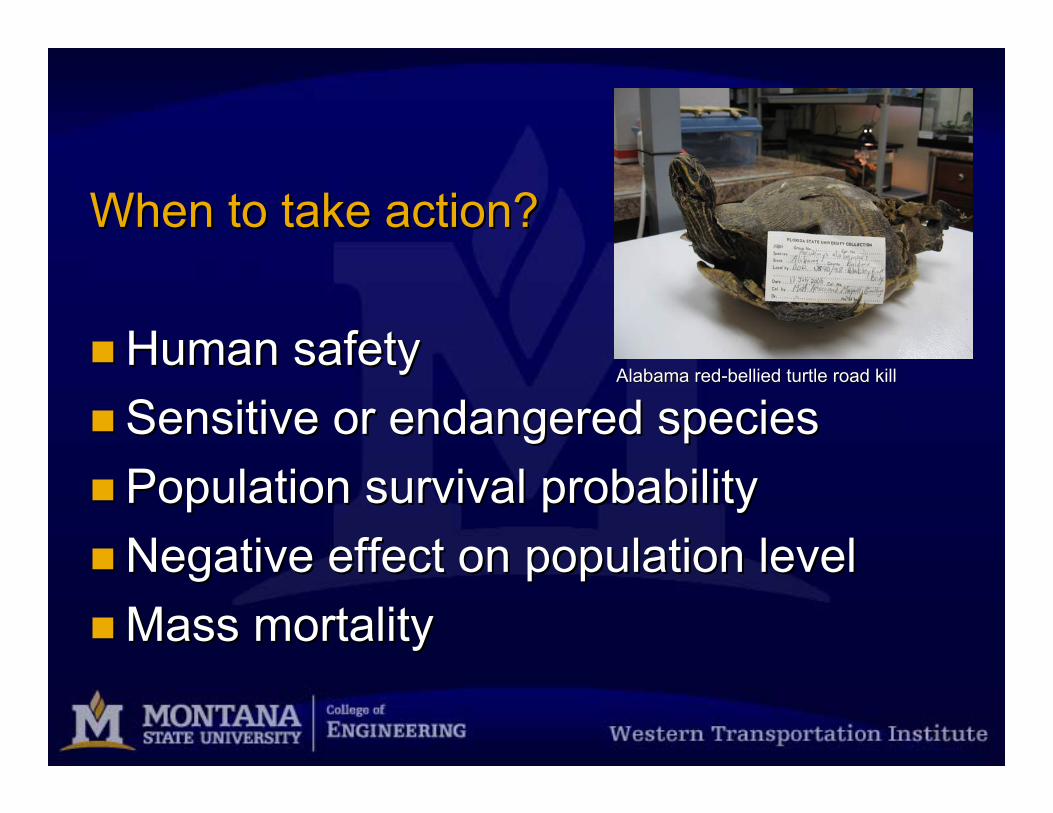
When to take action?When to take action?
Human safety Human safety Sensitive or endangered speciesSensitive or endangered species Population survival probabilityPopulation survival probability Negative effect on population levelNegative effect on population levelMass mortalityMass mortality
Alabama redAlabama red--bellied turtle road killbellied turtle road kill

Mitigation is goodMitigation is good……..But not necessarily the ultimate solutionBut not necessarily the ultimate solution
Negative impacts of infrastructureNegative impacts of infrastructure AvoidAvoid MitigateMitigate CompensateCompensateSource: Source: CuperusCuperus et al., 1999et al., 1999

Road effect
zone
Habitat
Mitigate
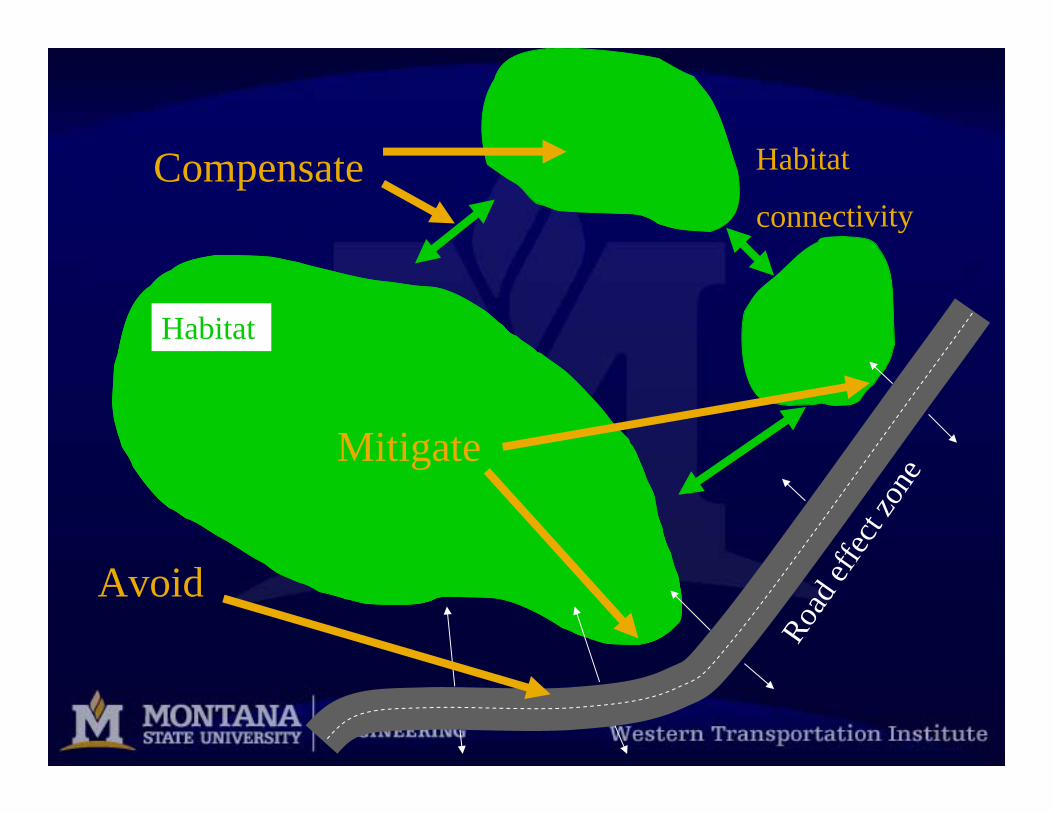
Habitat
Habitat
connectivityCompensate
Mitigate
Avoid
Road e
ffect
zone

II--75 Florida75 Florida
TCH Banff NPTCH Banff NP SR 260 Arizona, Tonto NFSR 260 Arizona, Tonto NFClevengerClevenger
Fences in combination with Fences in combination with crossing structurescrossing structures
US 93 Montana US 93 Montana

Study area: US Hwy 93Study area: US Hwy 9356 mi56 mi
Agriculture
Residential areas
Access roads
Short fence sections
Cultural values

Goals and ScopeGoals and Scope•• EffectivenessEffectiveness mitigation:mitigation:
– Animal-vehicle collisions– Animal crossings of US 93
•• Before Before –– AfterAftercomparison comparison
•• Focus:Focus:– deer, black bear– 3 areas with concentration
mitigation measures(Evaro, Ravalli Curves, Ravalli Hill)

OutlineOutlineThis presentation:This presentation:•• AnimalAnimal--vehicle collision (AVC) datavehicle collision (AVC) data•• Animal crossing (Xing) dataAnimal crossing (Xing) data•• Study design and sample sizeStudy design and sample size•• Measures of effectivenessMeasures of effectiveness
Additional activities:Additional activities:•• Black bear (Karin McCoy, University of Montana, Black bear (Karin McCoy, University of Montana, MScMSc))•• Deer (Whisper Camel, Montana State University, Deer (Whisper Camel, Montana State University, MScMSc))•• Western painted turtle (Kathy Griffin, University of Montana, PhWestern painted turtle (Kathy Griffin, University of Montana, PhD)D)•• Traffic dataTraffic data•• PhotoPhoto--monitoring railroad underpassmonitoring railroad underpass

Road kill (animal-vehicle collision and carcass data)
92%
1%5%
1%2%
DEER
BLACK BEAR
GRIZZLY BEAR
OTHER(WILD)
OTHER (DOM.)
(Sources: MDT, MHP and MTFWP)2002—2005N=392

Deer and Black Bear road killDeer and Black Bear road kill
4 7 9 7 10 1426 30 33 29
98
83 8396
0
20
40
60
80
100
120
1992
1993
1994
1995
1996
1997
1998
1999
2000
2001
2002
2003
2004
2005
Year
Rep
orte
d D
eer-V
ehic
le C
ollis
ions
0 0 01
01
5
23
1
89
21
0
2
4
6
8
10
1992 1994 1996 1998 2000 2002 2004
Bea
r Kill
ed
Deer
Black bear
2002/2003: 2002/2003: WTI and WTI and MDT stress MDT stress importance importance of reporting of reporting AVC/AC AVC/AC
1998: 1998: mandatory MDT mandatory MDT carcass carcass reportingreporting
2002/2003: 2002/2003: Increased Increased search and search and reporting reporting effort effort MScMScstudystudy

Location deer road kill and Location deer road kill and mitigation measuresmitigation measures
Ninepipesmitigation not
yet determined
0
5
10
15
20
6 11 16 21 26 31 36 41 46 51 56
Mile Post
Dee
r Kill
s
Deer Kills (2002-2005) West Fencing East Fencing Xing Structures Ninepipes

Expected reduction deerExpected reduction deer--vehicle vehicle collisionscollisions
•• Literature: 87% reduction (Literature: 87% reduction (79-99%)• US93: 30% (16.6 mi out of 56 mi) fenced• Expected overall reduction: 26%
Complications:Complications:• Not homogenous
distribution? ↑• Many gaps ↓

Power analyses (deer)Power analyses (deer)
Whole Area
0
10
20
30
40
0 5 10 15 20
Years Post-Construction Survey
Perc
ent D
etec
tabl
e D
iffer
ence
One-Tailed 44--5 years 5 years monitoring monitoring needed at a needed at a minimumminimum

BeforeBefore62 (38) Tracking beds62 (38) Tracking beds
Random locationsRandom locationsEach 100 m longEach 100 m long5 double beds5 double beds
Estimate based on a sampleEstimate based on a sample
Deer and black bear Deer and black bear crossingscrossings

AfterAfter
Tracking bedsTracking beds
FenceFence
FenceFence
FenceFence
FenceFence
Not an estimate but a measurementNot an estimate but a measurement
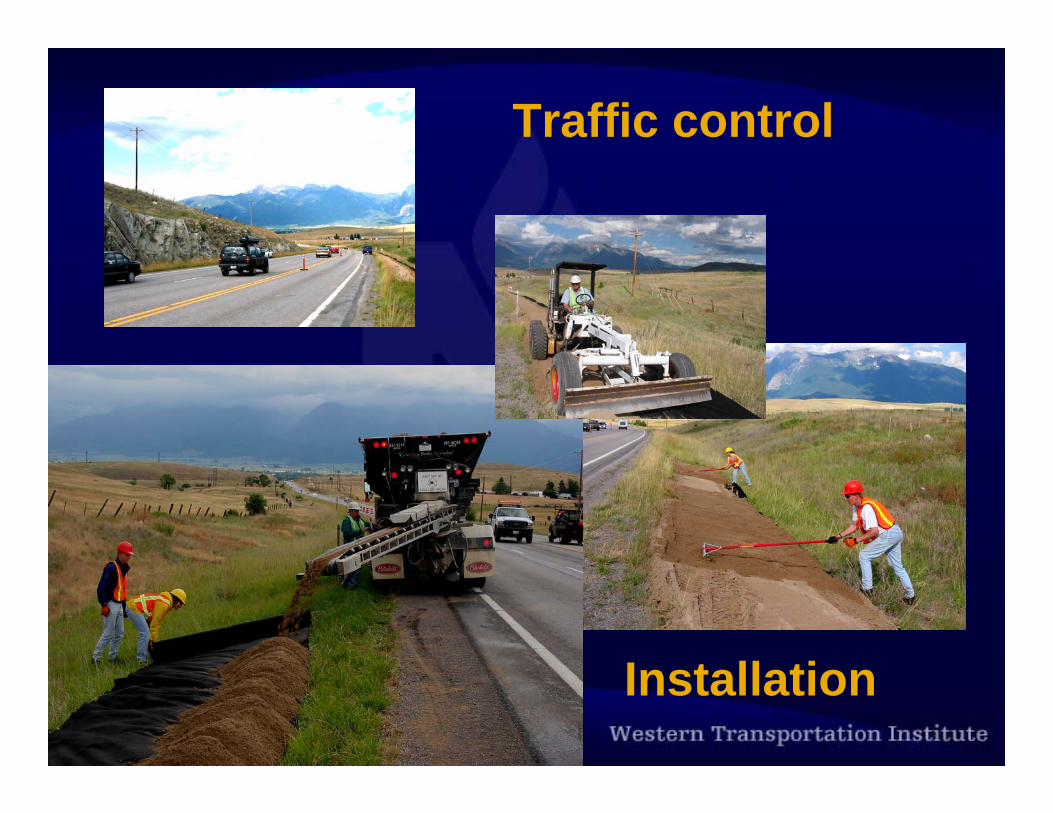
Traffic control
Installation

Deer
Black bear
Skunk
Check and erase
Twice a week
Jun-Oct

Tracks observed (2003Tracks observed (2003--2005)2005)
0
500
1000
1500
2000
2500
3000
3500
B. BEAR(n=205)
CANINE(n=767)
DEER(n=3136)
SM.MAMMAL(n=22)
MED.MAMMAL(n=869)
LG.MAMMAL(n=68)
OTHER(DOM)
(n=113)
OTHER(WILD)(n=10)
UNKNOWN(n=7)
Trac
ks R
ecor
ded Possible
Probable
Certain

Classification of tracksClassification of tracks
5m
100m tracking bed110m
2
2
3
1 = Crossing2, 3 = “Parallel” movements4 = Presence
4

Classification tracksClassification tracks
0
100
200
300
400
500
600
700
cross parallel presence crossingand other
unspecified
Dee
r Beh
avio
rs (C
ount
) 2003
2004
2005
0
10
20
30
40
50
60
70
80
cross parallel presence crossingand other
unspecified
Bea
r Beh
avio
rs (C
ount
)
2003
2004
2005
Deer
Black bear
0
10
20
30
40
50
60
70
80
cross parallel presence crossingand other
unspecified
Bea
r Beh
avio
rs (C
ount
)
2003
2004
2005
Black bear
Less directional
More directional
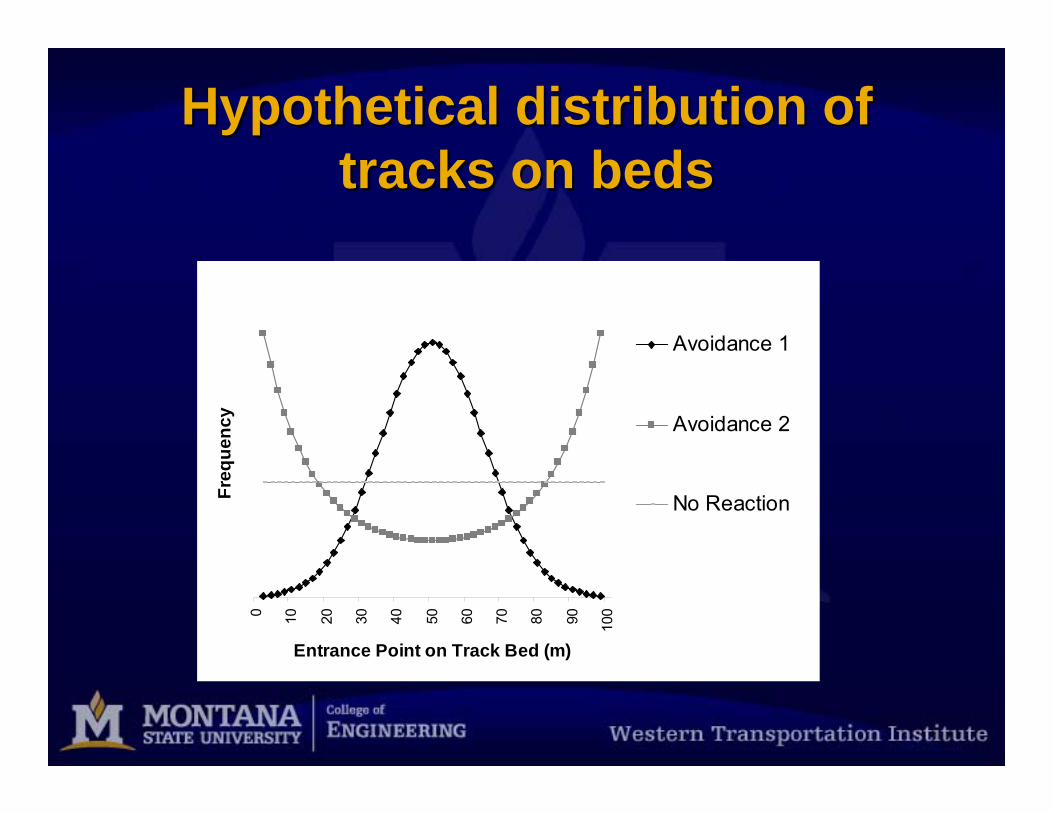
Hypothetical distribution of Hypothetical distribution of tracks on bedstracks on beds
0 10 20 30 40 50 60 70 80 90 100
Entrance Point on Track Bed (m)
Freq
uenc
y
Avoidance 1
Avoidance 2
No Reaction
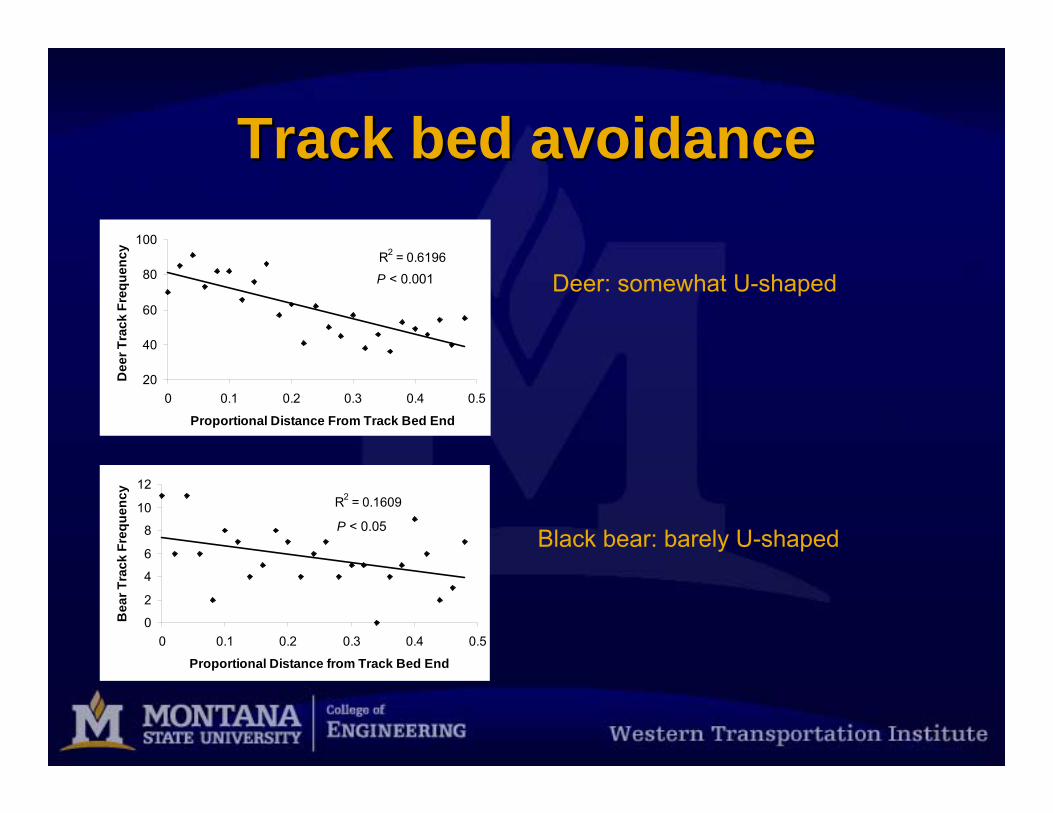
Track bed avoidanceTrack bed avoidance
R2 = 0.6196
20
40
60
80
100
0 0.1 0.2 0.3 0.4 0.5
Proportional Distance From Track Bed End
Dee
r Tra
ck F
requ
ency
R2 = 0.1609
0
2
4
6
8
10
12
0 0.1 0.2 0.3 0.4 0.5
Proportional Distance from Track Bed End
Bea
r Tra
ck F
requ
ency
Deer: somewhat U-shaped
Black bear: barely U-shaped
P < 0.001
P < 0.05
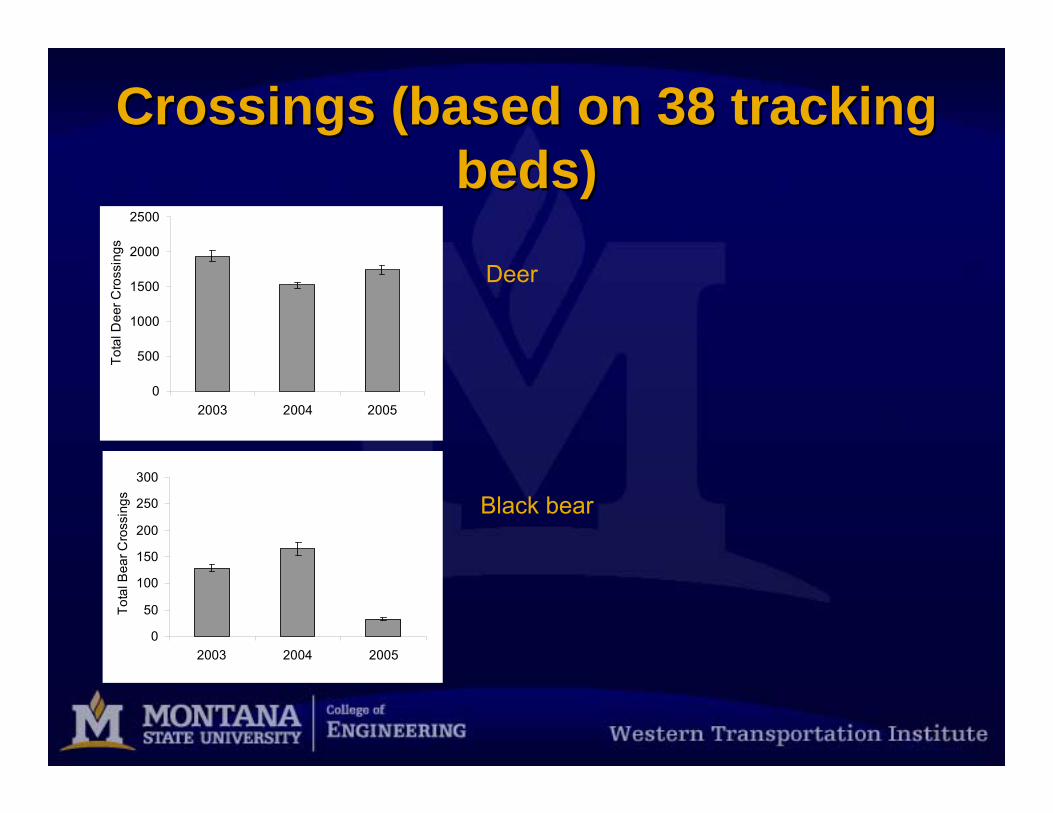
Crossings (based on 38 tracking Crossings (based on 38 tracking beds)beds)
Deer
Black bear
0
500
1000
1500
2000
2500
2003 2004 2005
Tota
l Dee
r Cro
ssin
gs
0
50
100
150
200
250
300
2003 2004 2005
Tota
l Bea
r Cro
ssin
gs

Control for population Control for population size/densitysize/density
0
2
4
6
8
10
2004 2005
Mea
n Pe
llet G
roup
s pe
r Tra
nsec
t
EVARO RAVALLI CURVESDeer:
pellet group
surveys
Black bear:
Hair snare
stations: DNA
(McCoy, 2005)
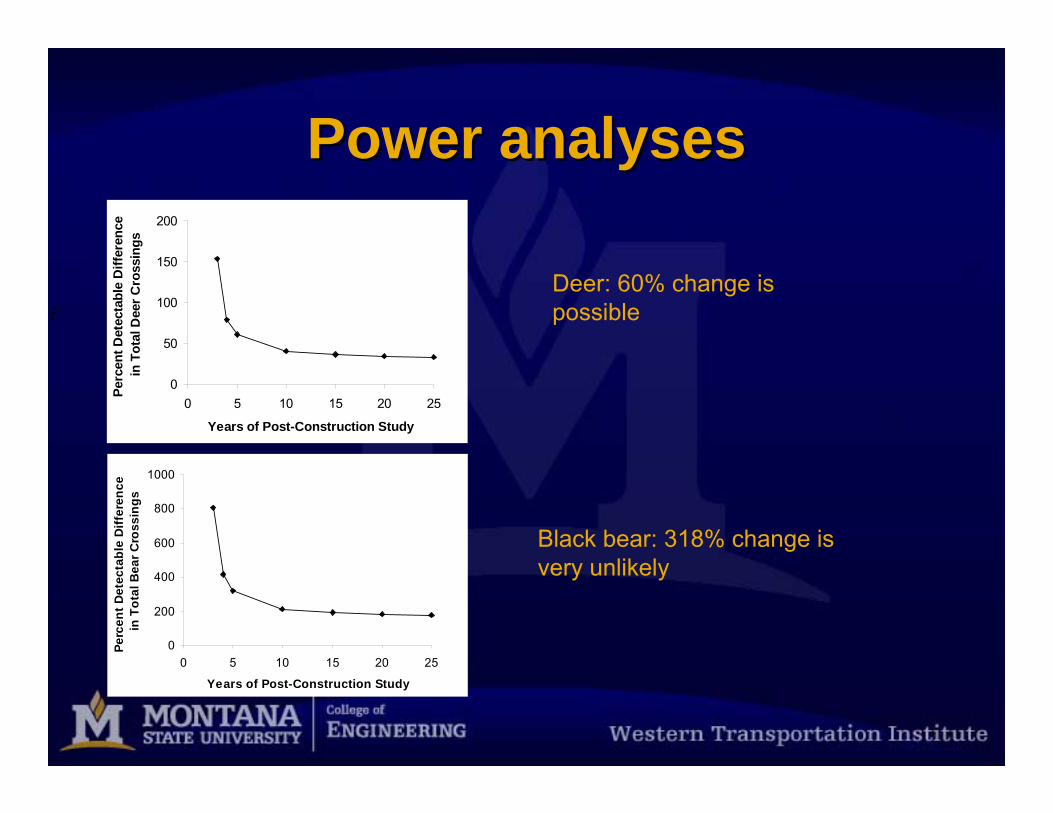
Power analysesPower analyses
0
50
100
150
200
0 5 10 15 20 25
Years of Post-Construction Study
Perc
ent D
etec
tabl
e D
iffer
ence
in
Tot
al D
eer C
ross
ings
0
200
400
600
800
1000
0 5 10 15 20 25
Years of Post-Construction Study
Perc
ent D
etec
tabl
e D
iffer
ence
in
Tot
al B
ear C
ross
ings
Deer: 60% change is possible
Black bear: 318% change is very unlikely

Learning curveLearning curve
Phase 3A Overpass passage - Ungulates
0
200
400600
800
1000
1200
deer elk
Freq
uenc
y
97-98 98-99 99-00 00-01 01-02
Phase 3A Overpass passage - Carnivores
05
101520253035
blbear grbear wolf coug
Freq
uenc
y97-98 98-99 99-00 00-01 01-02
Source: Clevenger et al.Source: Clevenger et al.

Measures of EffectivenessMeasures of Effectiveness
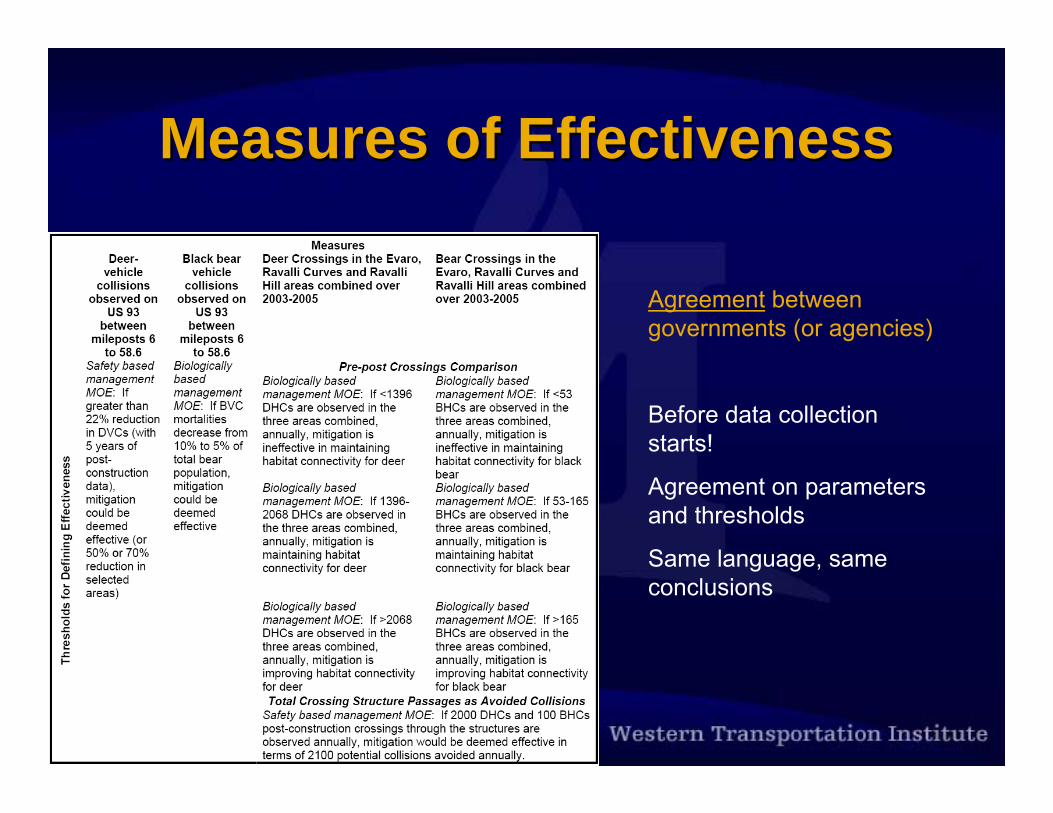
Measures of EffectivenessMeasures of Effectiveness
Agreement between governments (or agencies)
Before data collection starts!
Agreement on parameters and thresholds
Same language, same conclusions
Questions?Questions?
•• Download report:Download report:Hardy, A.R., J.Fuller, M. P. Huijser, A. Kociolek, M. Evans. 200Hardy, A.R., J.Fuller, M. P. Huijser, A. Kociolek, M. Evans. 2007. 7. Evaluation of Wildlife Crossing Evaluation of Wildlife Crossing Structures and Fencing on US Highway 93 Structures and Fencing on US Highway 93 EvaroEvaro to Polson. to Polson. Phase I: Preconstruction Data Phase I: Preconstruction Data Collection and Finalization of Evaluation Plan. Final Report. FHCollection and Finalization of Evaluation Plan. Final Report. FHWA/MTWA/MT--0606--008/1744008/1744--1. 1. Western Western Transportation Institute, College of Engineering, Montana State Transportation Institute, College of Engineering, Montana State University, Bozeman, MT, USA. University, Bozeman, MT, USA.
Available from the internet: Available from the internet: http://www.mdt.mt.gov/research/projects/env/wildlife_crossing.shhttp://www.mdt.mt.gov/research/projects/env/wildlife_crossing.shtmltml
•• Contact Marcel HuijserContact Marcel Huijser– [email protected]– 406-543-2377