EVALUATION OF VON MISES STRESSES IN FOUR BONE …
113
EVALUATION OF VON MISES STRESSES IN FOUR BONE QUALITIES IN AN IMPLANT SUPPORTED MANDIBULAR POSTERIOR CROWN BY 3D FINITE ELEMENT ANALYSIS A Dissertation submitted to the THE TAMILNADU DR. MGR MEDICAL UNIVERSITY In partial fulfillment of the requirements for the degree of MASTER OF DENTAL SURGERY (BRANCH – I) (PROSTHODONTICS AND CROWN & BRIDGE) 2015 – 2018
Transcript of EVALUATION OF VON MISES STRESSES IN FOUR BONE …

EVALUATION OF VON MISES STRESSES IN FOUR
BONE QUALITIES IN AN IMPLANT SUPPORTED
MANDIBULAR POSTERIOR CROWN BY 3D
FINITE ELEMENT ANALYSIS
A Dissertation submitted to the
THE TAMILNADU DR. MGR MEDICAL UNIVERSITY
In partial fulfillment of the requirements
for the degree of
MASTER OF DENTAL SURGERY
(BRANCH – I)
(PROSTHODONTICS AND CROWN & BRIDGE)
2015 – 2018

CERTIFICATE
This is to certify that DR.V.P. KIRUTHIGA,, Post Graduate student (2015 - 2018) in
the Department of Prosthodontics and Crown and Bridge, has done this dissertation
titled “EVALUATION OF VON MISES STRESSES IN FOUR BONE
QUALITIES IN AN IMPLANT SUPPORTED MANDIBULAR
POSTERIOR CROWN BY 3D FINITE ELEMENT ANALYSIS” under
my direct guidance and supervision in partial fulfillment of the regulations laid down
by The Tamil Nadu Dr. M.G.R. Medical University, Guindy, Chennai – 32
for M.D.S. in Prosthodontics and Crown & Bridge (Branch I) Degree
Examination.
Guided by Head of the institution
PROF.Dr.C.SABARIGIRINATHAN.M.D.S. PROF.Dr.B.SARAVANAN.M.D.S.,Ph.D.
Head of the Department PRINCIPAL
Department of Prosthodontics, Tamil Nadu Govt Dental College
Tamilnadu Govt Dental College & and Hospital, Chennai - 600 003.
Hospital, Chennai – 600 003.
DECLARATION
I, Dr. V.P KIRUTHIGA do hereby declare that the dissertation titled
“ EVALUATION OF VON MISSES STRESSES IN FOUR BONE TYPES IN A
IMPLANT SUPPORTED MANDIBULAR POSTERIOR CROWN BY 3D
FINITE ELEMENT ANALYSIS” was done in the Department of Prosthodontics,
Tamil Nadu Government Dental College & Hospital, Chennai 600 003. I have utilized
the facilities provided in the Government Dental College for the study in partial
fulfilment of the requirements for the degree of Master of Dental Surgery in the
speciality of Prosthodontics and Crown & Bridge (Branch I) during the course
period 2015-2018 under the conceptualization and guidance of my dissertation guide,
PROF. Dr. C. SABARIGIRINATHAN.MDS., and my Co-guide, Associate
Prof. Dr. P. RUPKUMAR, M.D.S.
I declare that no part of the dissertation will be utilized for gaining financial
assistance for research or other promotions without obtaining prior permission from
the Tamil Nadu Government Dental College & Hospital.
I also declare that no part of this work will be published either in the print or
electronic media except with those who have been actively involved in this
dissertation work and I firmly affirm that the right to preserve or publish this work
rests solely with the prior permission of the Principal, Tamil Nadu Government
Dental College & Hospital, Chennai 600 003, but with the vested right that I shall be
cited as the author(s).
Signature of the PG student Signature of the HOD Signature of the
Co- Guide
Signature of the Head of the Institution

TRIPARTITE AGREEMENT
This agreement herein after the “Agreement” is entered into on this day,
___________________ between the Tamil Nadu Government Dental College and
Hospital represented by its Principal having address at Tamil Nadu Government
Dental College and Hospital, Chennai-3, (hereafter referred to as, ‘the College’)
And
Dr. C. SABARIGIRINATHAN,M.D.S., aged 50 years working as Professor
and Head of Department of Prosthodontics and crown and bridge at Tamil Nadu
Government Dental College and Hospital, Chennai-3 having residence address at
E/32, Anna Nagar (East), Chennai- 102 (herein after referred to as the ‘Researcher
and Principal investigator’) and Dr. P. RUPKUMAR, M.D.S., aged 45 years
working as Associate Professor, Department of Prosthodontics and crown and bridge
at Tamil Nadu Government Dental College and Hospital, Chennai-3 having residence
at NO. 24 GA, Tharangini apartment, Arunachalam road, Saligramam, Chennai – 93
(herein after referred to as the ‘Researcher and Principal co- investigator’)
And
Dr. V.P KIRUTHIGA aged 32 years currently studying as Post Graduate
student in the Department of Prosthodontics and Crown & Bridge, Tamil Nadu
Government Dental College and Hospital, Chennai-3 having residence address at
No.16/7 Vallalar Nagar 1st Street, Cuddalore-1. (herein after referred to as the
‘PG/Research student and Co- investigator’).
Whereas the ‘PG/Research student as part of her curriculum undertakes to
research on the study titled “EVALUATION OF VON MISSES STRESSES IN
FOUR BONE TYPES IN AN IMPLANT SUPPORTED MANDIBULAR
POSTERIOR CROWN BY 3D FINITE ELEMENT ANALYSIS” for which purpose
the Researcher and Principal investigator shall act as Principal investigator and the
College shall provide the requisite infrastructure based on availability and also

provide facility to the PG/Research student as to the extent possible as a Co-
investigator.
Whereas the parties, by this agreement have mutually agreed to the various
issues including in particular the copyright and confidentiality issues that arise in this
regard. Now this agreement witness as follows:
1. The parties agree that all the research material and ownership therein shall
become the vested right of the college, including in particular all the copyright
in the literature including the study, research and all other related papers.
2. To the extent that the College has legal right to do go, shall grant to licence or
assign the copyright do vested with it for medical and/or commercial usage of
interested persons/entities subject to a reasonable terms/conditions including
royalty as deemed by the college.
3. The royalty so received by the college shall be equally by all the parties.
4. The PG/Research student and PG/Principal Investigator shall under no
circumstances deal with the copyright, confidential information and know how
generated during the course of research/study in any manner whatsoever,
while shall sole vest with the manner whatsoever and for any purpose without
the express written consent of the college.
5. All expenses pertaining to the research shall be decided upon by the Principal
investigator/Co-investigator or borne sole by the PG/Research student (Co-
investigator).
6. The College shall provide all infrastructure and access facilities within and in
other institutes to the extent possible. This includes patient interactions,

introductory letters, recommendation letters and such other acts required in
this regard.
7. The principal investigator shall suitably guide the student research right from
selection of the research topic and area till its completion. However the
selection and conduct of research, topic and area research by the student
researcher under guidance from the principal investigator shall be subject to
the prior approval, recommendations and comments of the Ethical Committee
of the college constituted for this purpose.
8. It is agreed that as regards other aspects not covered under this agreement, but
which pertain to the research undertaken by the Student Researcher, under
guidance from the Principal Investigator, the decision of the college shall be
binding and final.
9. If any dispute arises as to the matters related or connected to this agreement
herein, it shall be referred to arbitration in accordance with the provisions of
the Arbitration and Conciliation Act, 1996.
In witness whereof the parties herein above mentioned have on this the
day month and year herein above mentioned set their hands to this agreement
in the presence of the following two witnesses.
College represented by its Principal Guide Co-guide
Witnesses PG Student
1.
2.
MY ACKNOWLEDGEMENT AND SINCERE
THANKS TO MY GUIDE
With immense pleasure and honour I take this opportunity to express my humble
and heartfelt gratitude to my mentor, a relentless source of inspiration and dissertation
guide Dr.C.SABARIGIRINATHAN,M.D.S., Professor and head of department,
Department of Prosthodontics, Tamil Nadu Government Dental College and Hospital,
for his able guidance and support. I am grateful for his help at various stages of the
dissertation. Without his help this dissertation would not have come out in a befitting
manner. Each word said to describe the experience as his student, which was a boon
in disguise, would be an understatement. His esteemed and able guidance made this
dissertation a possibility. His dedication to work which made us realize the worth of
discovering our own capabilities. His unprecedented calm and patient personality, an
unfailing, caring and understanding demeanour made each endeavour easier.

ACKNOWLEDGEMENT
I am extremely thankful to my chief DR.C.SABARIGIRINATHAN,M.D.S.,
Professor and Head of the Department and my Guide, Department of prosthodontics,
Tamil Nadu Government Dental College and Hospital, Chennai, I consider it my
utmost privilege and honor to express my most sincere and heartfelt gratitude to my
esteemed for his wholehearted support, constant guidance, help, encouragement,
valuable suggestions and support he has rendered at various stages of the dissertation.
I also thank him for the valuable guidance; he has given throughout my post
graduation. Without his immense help this dissertation would not have come out in a
befitting manner. I am thankful to Dr.P.RUPKUMAR, M.D.S., Associate Professor,
Co-Guide for guiding and helping me at different stages of this study.
My sincere thanks to Prof. Dr.B.SARAVANAN, M.D.S., Ph.D. Principal,
Tamil Nadu Government Dental College and Hospital for his kind help, valuable
suggestions in this study and permitting me to use all the facilities in the institution. I
also thank him for the valuable guidance he has given throughout the period of my
post graduate course.
My sincere thanks to Dr.A.MEENAKSHI,M.D.S., Professor, Department of
Prosthodontics, Tamilnadu Government Dental College and Hospital for her valuable
guidance throughout my study.
My sincere thanks to Dr.K.VINAYAGAVEL,M.D.S., Professor, Department
of Prosthodontics, Tamilnadu Government Dental College and Hospital for his
valuable guidance throughout my study.
I am thankful to Associate Professors, Dr.G.Sriramprabu, M.D.S.,
Dr. M. Rajakumar, M.D.S., for helping me at different stages of this study.

I am thankful to Assistant Professors, Dr.T.Jeyanthikumari, M.D.S.,
Dr.S.Vinayagam, M.D.S., Dr.J.Gandhimathi, M.D.S., Dr.V.Parimala, M.D.S.,
Dr.M.Kanmani, M.D.S., Dr.V.Harishnath, M.D.S., Dr.Preethichandran, M.D.S.,
and Dr.SivaSakthiKumar, M.D.S., for helping me at different stages of this study.
I thank Dr. Mohammed Junaith, M.D.S., for helping me, to carry out the
statistical analysis of the various test results.
I express my sincere thanks to Mageshwaran Baskaran, CAE analyst, HCL
technologies, Chennai. Thiyagarajan Palanivel ,CAE analyst, Mahindra technologies.
I express my heartfelt gratitude to my sister, a FEA analyst herself who introduced
me to the whole new world of FEA and my family and friends for their constant support
and motivation.
I owe my sincere thanks to all my Colleagues, Senior and Junior
postgraduates in the department for their constant encouragement and timely help.
Above all I thank the LORD GOD ALMIGHTY for giving me the strength and
courage to complete this monumental task.

CONTENTS
SL NO. TITLE PAGE NO.
1. INTRODUCTION 1-3
2. AIM AND OBJECTIVES 4
3. REVIEW OF LITERATURE 5-17
4. MATERIALS AND METHODS 18-30
5. RESULTS 49-59
6. DISCUSSION 60-68
7. SUMMARY & CONCLUSION 69-70
8. BIBLIOGRAPHY 71-83
9. ANNEXURE 84-87
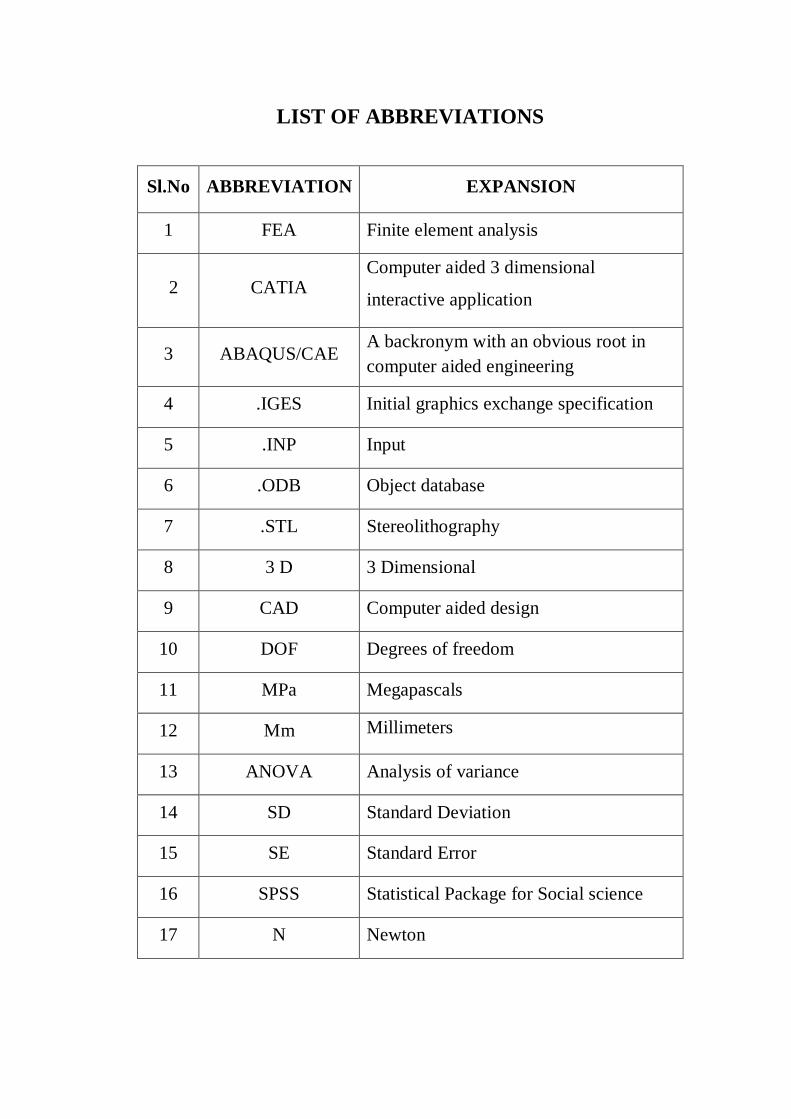
LIST OF ABBREVIATIONS
Sl.No ABBREVIATION EXPANSION
1 FEA Finite element analysis
2 CATIA Computer aided 3 dimensional
interactive application
3 ABAQUS/CAE A backronym with an obvious root in
computer aided engineering
4 .IGES Initial graphics exchange specification
5 .INP Input
6 .ODB Object database
7 .STL Stereolithography
8 3 D 3 Dimensional
9 CAD Computer aided design
10 DOF Degrees of freedom
11 MPa Megapascals
12 Mm Millimeters
13 ANOVA Analysis of variance
14 SD Standard Deviation
15 SE Standard Error
16 SPSS Statistical Package for Social science
17 N Newton

LIST OF TABLES
SL.
NO. TITLE
Tables Showing Calculated Values
1.
Comparison of von mises stresses of Abutments in D1,
D2, D3, D4 models subjected to forces at different
angulations.
2.
Comparison of von mises stresses of Connecting screw
in D1, D2, D3, D4 models subjected to forces at
different angulation
3.
Comparison of von mises stresses of Implants in D1,
D2, D3, D4 models subjected to forces at different
angulation
4.
Comparison of von mises stresses of Co – Cr crowns
in D1, D2, D3, D4 models subjected to forces at
different angulations
5.
Comparison of von mises stresses of Feldspathic
porcelain in D1, D2, D3, D4 models subjected to forces at different angulations
6.
Comparison of von mises stresses of Cortical bone in
D1, D2, D3, D4 models subjected to forces at different angulations
7.
Comparison of von mises stresses of Cancellous bone
in D1, D2, D3, D4 models subjected to forces at different angulations
8.
Multiple comparison of von mises stresses in
Abutments D1, D2, D3, D4 models subjected to forces at different angulations
9.
Multiple comparison of von mises stresses in
Connecting screw D1, D2, D3, D4 models subjected to forces at different angulations
10.
Multiple comparison of von mises stresses in Implants
D1, D2, D3, D4 models subjected to forces at different angulations.
11.
Multiple comparison of von mises stresses in Co – Cr
alloy D1, D2, D3, D4 models subjected to forces at
different angulations.
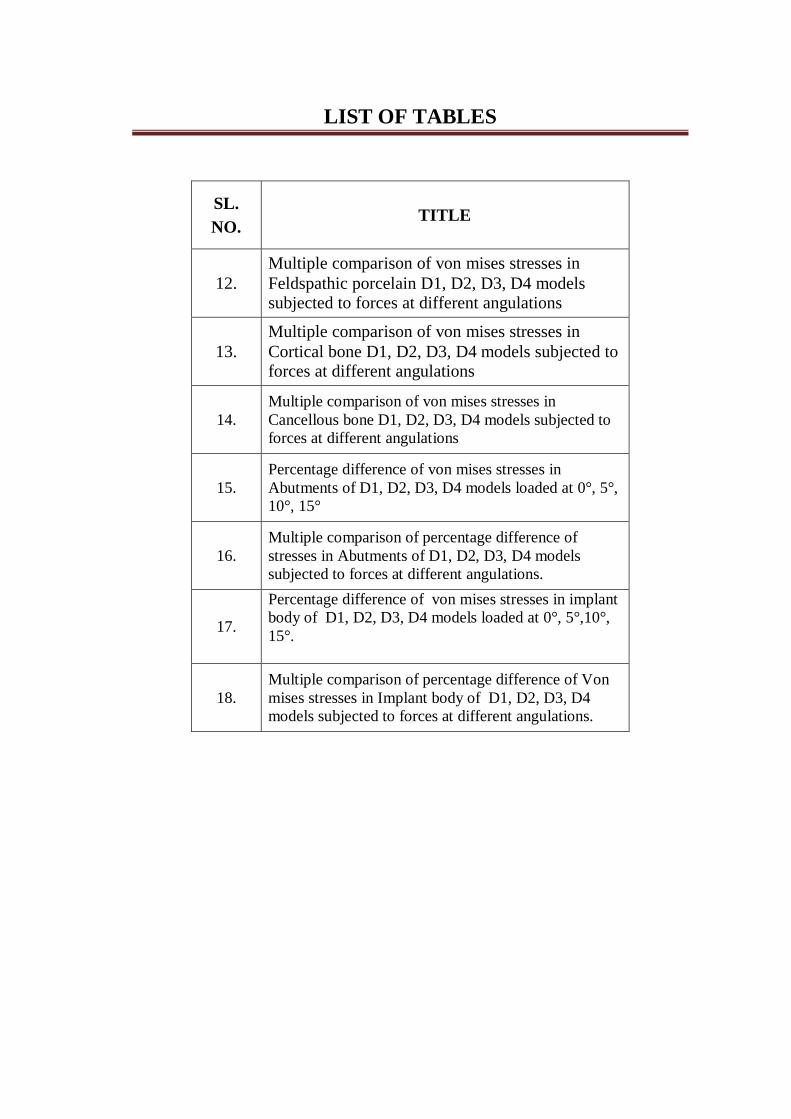
LIST OF TABLES
SL.
NO. TITLE
12.
Multiple comparison of von mises stresses in
Feldspathic porcelain D1, D2, D3, D4 models subjected to forces at different angulations
13.
Multiple comparison of von mises stresses in
Cortical bone D1, D2, D3, D4 models subjected to forces at different angulations
14.
Multiple comparison of von mises stresses in
Cancellous bone D1, D2, D3, D4 models subjected to
forces at different angulations
15.
Percentage difference of von mises stresses in
Abutments of D1, D2, D3, D4 models loaded at 0°, 5°,
10°, 15°
16.
Multiple comparison of percentage difference of
stresses in Abutments of D1, D2, D3, D4 models
subjected to forces at different angulations.
17.
Percentage difference of von mises stresses in implant
body of D1, D2, D3, D4 models loaded at 0°, 5°,10°,
15°.
18.
Multiple comparison of percentage difference of Von
mises stresses in Implant body of D1, D2, D3, D4
models subjected to forces at different angulations.
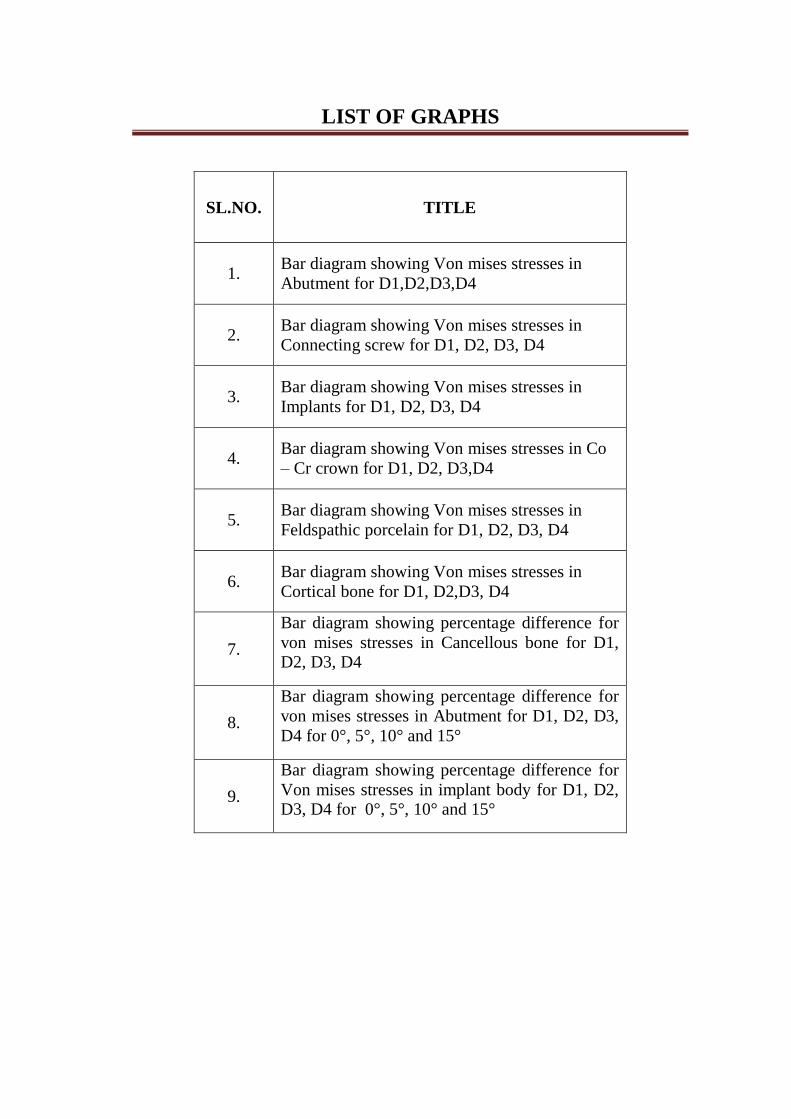
LIST OF GRAPHS
SL.NO. TITLE
1. Bar diagram showing Von mises stresses in
Abutment for D1,D2,D3,D4
2. Bar diagram showing Von mises stresses in
Connecting screw for D1, D2, D3, D4
3. Bar diagram showing Von mises stresses in
Implants for D1, D2, D3, D4
4. Bar diagram showing Von mises stresses in Co
– Cr crown for D1, D2, D3,D4
5. Bar diagram showing Von mises stresses in
Feldspathic porcelain for D1, D2, D3, D4
6. Bar diagram showing Von mises stresses in
Cortical bone for D1, D2,D3, D4
7.
Bar diagram showing percentage difference for
von mises stresses in Cancellous bone for D1, D2, D3, D4
8.
Bar diagram showing percentage difference for
von mises stresses in Abutment for D1, D2, D3,
D4 for 0°, 5°, 10° and 15°
9.
Bar diagram showing percentage difference for
Von mises stresses in implant body for D1, D2, D3, D4 for 0°, 5°, 10° and 15°
ABSTRACT
Introduction: It has been half a decade since the invention of
osseointegration by Branemark in 1952, implants seem to have taken the
limelight as they provide ideal aesthetics and masticatory efficiency. However
the success rate of an implant restoration depends on wide array of factors
among which biomechanics play a crucial role. Taking that into account the
present study was conducted to evaluate the stresses generated in and around
the implant structure in different bone qualities varying in their densities.
Key words: FEA (finite element analysis), Von mises stresses, Modulus of
elasticity, Loading angle, Bone density (D1, D2, D3, D4)
Aim of the study: To analyse the stress distribution patterns in the
implant and surrounding bone in D1, D2, D3, D4 types of bone subjected to
different loading conditions in terms of angulation of forces applied.
Materials and Methods: Four CAD models namely D1, D2, D3, D4
were fabricated using simulation software and were meshed into a finite model
with nodes and elements and was finally transferred to the analysing software
(ABAQUS) and a series of 16 test runs in each individual load angulation was
conducted and the results of stress concentration on seven regions of interest in
the implant and the surrounding structures were obtained and the data was
checked for statistical significance using SPSS software
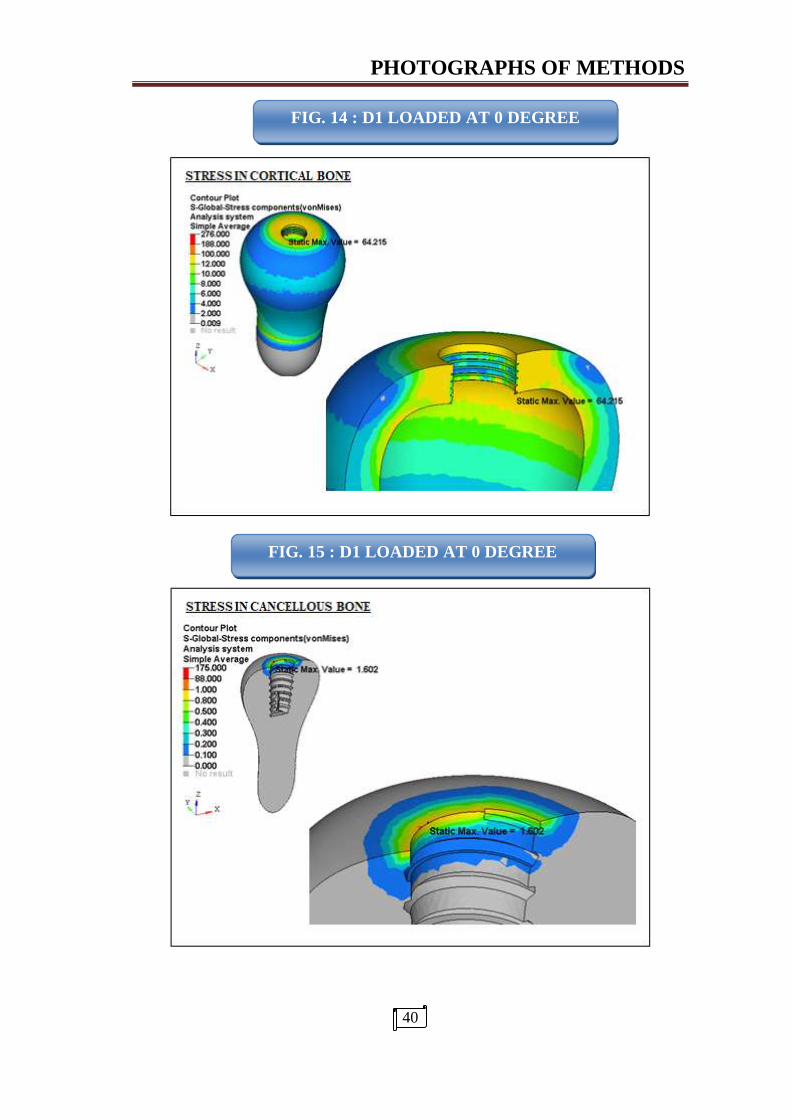
Results: The maximum stresses among the seven regions of interest
Abutment, Connecting screw, Implant, Cortical bone, Cancellous bone, Co - Cr
crown, feldspathic porcelain were recorded at the neck of the implant for all the

4 bone qualities irrespective of the loading conditions and the cancellous bone
was recorded with the least stresses in all the four bone qualities. The stresses
recorded in all the seven region of the model showed a gradual increase in
stresses as the loading angulation changed from 0 degrees to 15 degrees for all
the four models and there was a significant percentage difference in the
increase in von mises stresses as each five degree increase in angulation
Conclusion: Within the limits of the study it can be concluded that most
of the occlusal force gets concentrated as stress in the neck of the implant
region and among the seven region of interest taken for account in the study the
D1 bone quality shows lesser stress recordings compared to D4 bone qualities.
And all the components in the four models showed a steady increase of stress
when loaded at 0° and 15°. And the 0 degree load. Where the load is applied
parallel to the long axis of the implant shows less stresses and a uniform
distribution.
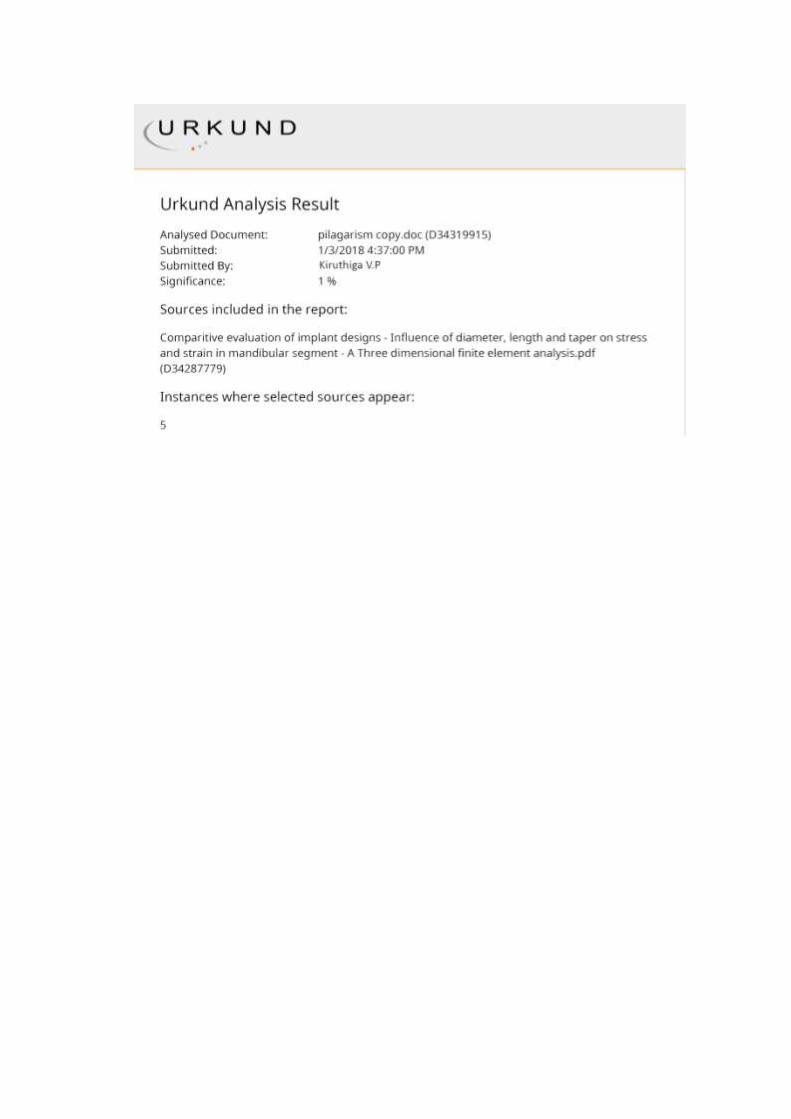

CERTIFICATE – II
This is to certify that this dissertation work titled “EVALUATION OF VON
MISES STRESSES IN FOUR BONE QUALITIES IN AN IMPLANT SUPPORTED
MANDIBULAR CROWN BY USING 3D FINITE ELEMENT ANALYSIS.
of the candidate DR.V.P. KIRUTHIGA with registration Number
241511001 for the award of MASTER OF DENTAL SURGERY in the
branch of PROSTHODONTICS AND CROWN & BRIDGE. I personally
verified the urkund.com website for the purpose of plagiarism Check. I
found that the uploaded thesis file contains from introduction to
conclusion pages and result shows 1% percentage of plagiarism in the
dissertation.
Guide & Supervisor sign with Seal.
ABSTRACT
Introduction: It has been half a decade since the invention of osseointegration by
Branemark in 1952, implants seem to have taken the limelight as they provide ideal
aesthetics and masticatory efficiency. However the success rate of a implant
restoration depends on wide array of factors among which biomechanics play a
crucial role. Taking that into account the present study was conducted to evaluate the
stresses generated in and around the implant structure in different bone qualities
varying in their densities.
Key words: FEA (finite element analysis), von mises stresses, modulus of elasticity,
loading angle, bone density (D1, D2, D3, D4)
Aim of the study: To analyse the stress distribution patterns in the implant and
surrounding bone in D1, D2, D3, D4 types of bone subjected to different loading
conditions in terms of angulation of forces applied.
Materials and Methods: Four CAD models namely D1, D2, D3, D4 were fabricated
using simulation software and were meshed into a finite model with nodes and
elements and was finally transferred to the analysing software (ABAQUS) and a
series of 16 test runs in each individual load angulation was conducted and the results
of stress concentration on seven regions of interest in the implant and the surrounding
structures were obtained and the data was checked for statistical significance using
SPSS software.
Results: The maximum stresses among the seven regions of interest ( Abutment,
Connecting screw, Implant, Cortical bone, Cancellous bone, Co - Cr crown,
feldspathic porcelain were recorded at the neck of the implant for all the 4 bone
qualities irrespective of the loading conditions and the cancellous bone was recorded
with the least stresses in all the four bone qualities. The stresses recorded in all the
seven region of the model showed a gradual increase in stresses as the loading
angulation changed from 0 degrees to 15 degrees for all the four models and there was

a significant percentage difference in the increase in von mises stresses for each five
degree increase in angulation.
Conclusion: Within the limits of the study it can be concluded that most of the
occlusal force gets concentrated as stress in the neck of the implant region and among
the seven region of intrest taken for account in the study the D1 bone quality shows
lesser stress recordings compared to D4 bone qualities. And all the components in the
four models showed a steady increase of stress when loaded at 0° and 15°.And in the
0° degree load ie. Where the load is applied parallel to the long axis of the implant
shows less stresses and a uniform distribution..
introduction
1
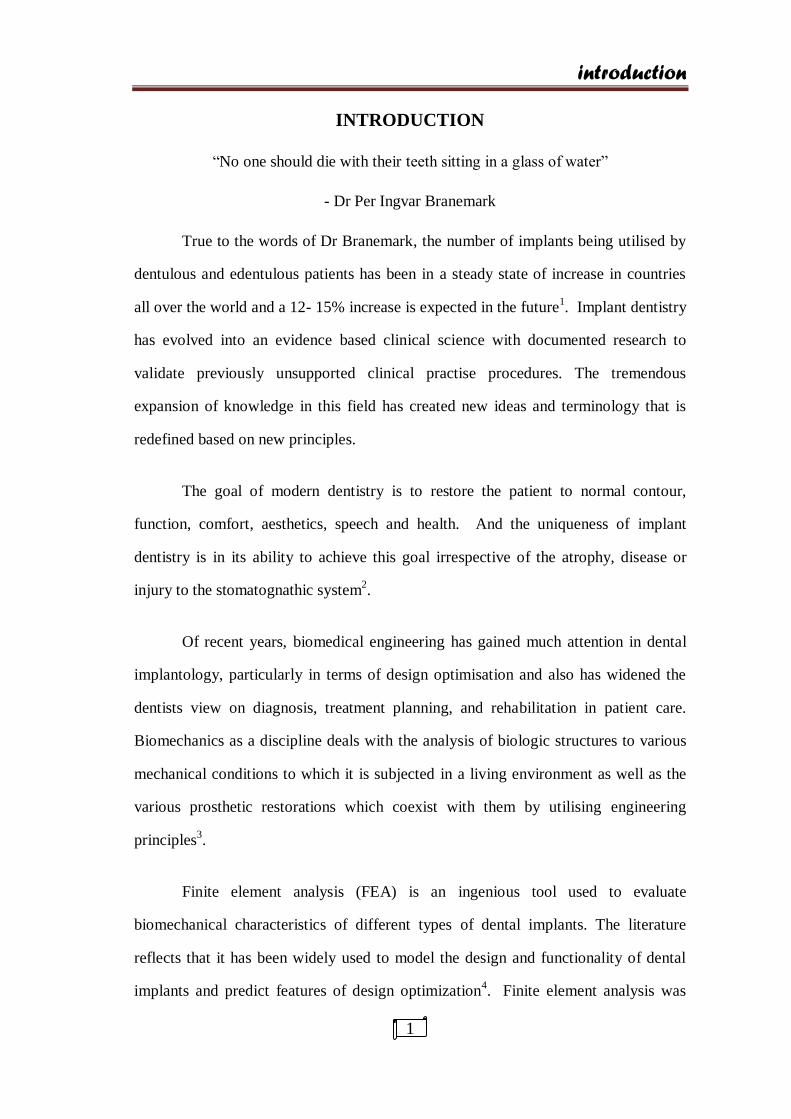
INTRODUCTION
“No one should die with their teeth sitting in a glass of water”
- Dr Per Ingvar Branemark
True to the words of Dr Branemark, the number of implants being utilised by
dentulous and edentulous patients has been in a steady state of increase in countries
all over the world and a 12- 15% increase is expected in the future1. Implant dentistry
has evolved into an evidence based clinical science with documented research to
validate previously unsupported clinical practise procedures. The tremendous
expansion of knowledge in this field has created new ideas and terminology that is
redefined based on new principles.
The goal of modern dentistry is to restore the patient to normal contour,
function, comfort, aesthetics, speech and health. And the uniqueness of implant
dentistry is in its ability to achieve this goal irrespective of the atrophy, disease or
injury to the stomatognathic system2.
Of recent years, biomedical engineering has gained much attention in dental
implantology, particularly in terms of design optimisation and also has widened the
dentists view on diagnosis, treatment planning, and rehabilitation in patient care.
Biomechanics as a discipline deals with the analysis of biologic structures to various
mechanical conditions to which it is subjected in a living environment as well as the
various prosthetic restorations which coexist with them by utilising engineering
principles3.
Finite element analysis (FEA) is an ingenious tool used to evaluate
biomechanical characteristics of different types of dental implants. The literature
reflects that it has been widely used to model the design and functionality of dental
implants and predict features of design optimization4.
Finite element analysis was

introduction
2
initially developed in the early 1960’s to solve structural problems in the aerospace
industry, Which was further utilised to solve problems in heat transfer, fluid flow,
mass transport and electromagnetics. Later it was adopted by the field of dentistry,
proving its efficiency to be better than photoelastic study in terms of easy modelling
and more defined stress analysis5.
A key factor for success or failure of a dental implant is the manner in which
stresses are transferred to the surrounding bone6. Though forces on teeth are applied
as occlusal bite force during chewing cycles, the surrounding structures such as the
tongue and perioral musculature also exert a slight but continuous transverse force on
the teeth. Vertical and oblique loads from mastication bring about axial forces and
bending moments and results in stress concentration in the bone as well as in the
implants5. Forces and moments transferred from implants to the surrounding bone
depend on angle of loading, the interfacial zone, implant geometry, the prosthesis
type, and the quantity and quality of the surrounding bone7. Researches can calculate
stress distribution and the related strain rates and displacements in the surrounding
bone and the implant body by FEA.
Bone metabolism is regulated by two mechanisms namely, hormonal and
biomechanical. And research implies that among these the biomechanical regulation
plays a major role as it can maintain bone mass even in situations of calcium
demand8.The osteocytes are extremely sensitive to mechanical forces and through
series of steps initiates bone formation when the stresses are kept at a ideal9,10
.
However when the stresses are at pathological levels, the bone cells stimulate the
cytokines and cause bone resorption. So when the bone is stressed above the
physiologic overload zone it may actually lead to the failure of implant and cause
marginal bone resorption11
.

introduction
3
The external (cortical) and internal structure (trabecular) of the bone may be
described in terms of quality or density which mirrors a number of biomechanical
properties, such as strength, modulus of elasticity, osseointegration and stress
distribution surrounding a loaded dental implant12,13
. The strength of bone is directly
proportional to its density. As the density increases the load bearing capacity of the
bone also increases and an actual 10 fold increase in strength may be depicted as one
moves from D1 to D4 bone types which naturally improves the success rate for dense
bone qualities and the literature also reveals that the implants placed in anterior
mandible are more likely to be successful than those placed in maxilla of poor bone
qualities14
.
A tooth is designed for vertical loading, likewise the implants are also
designed to withstand forces which act parallel to its long axis. An axial load imparts
a compressive stress without any lateral force component and hence they can be borne
well than the shear component of force which results due to a lateral load, since the
bone is strongest to compression, 30% weaker to tensile stresses and 65% weaker to
shear stresses15
. So offset loads of any form, be it a vertical cantilever, force acting on
an angulated abutment or due to occlusal prematurity may generate shear forces and
may weaken the integrity of the restoration.
Hence in this study, the finite element method is used to evaluate stresses in an
implant supported mandibular crown along with its surrounding structures in four
different bone types subjected to four different offset loadings.

Aim and Objectives
4
AIMS:
To evaluate and compare the amount of stresses in implant supported crown
and the surrounding structures in four different bone qualities in different angles of
loading.
OBJECTIVES:
1. To evaluate the amount of stress transmitted to the supporting structures by
loading an implant supported crown axially and different angulations
a.5°
b.10°
c.15°
d.90°
2. To evaluate the amount of stress distribution in four different bone qualities
a.D1
b.D2
c.D3
d.D4
3. To evaluate the amount of stress within the implant components,
a. Abutment
b. Connecting screw
c. Implant body
d. Cobalt chromium crown
e. Feldspathic porcelain
f. Cortical bone
g. Cancellous bone
Review of Literature
5
REVIEW OF LITERATURE
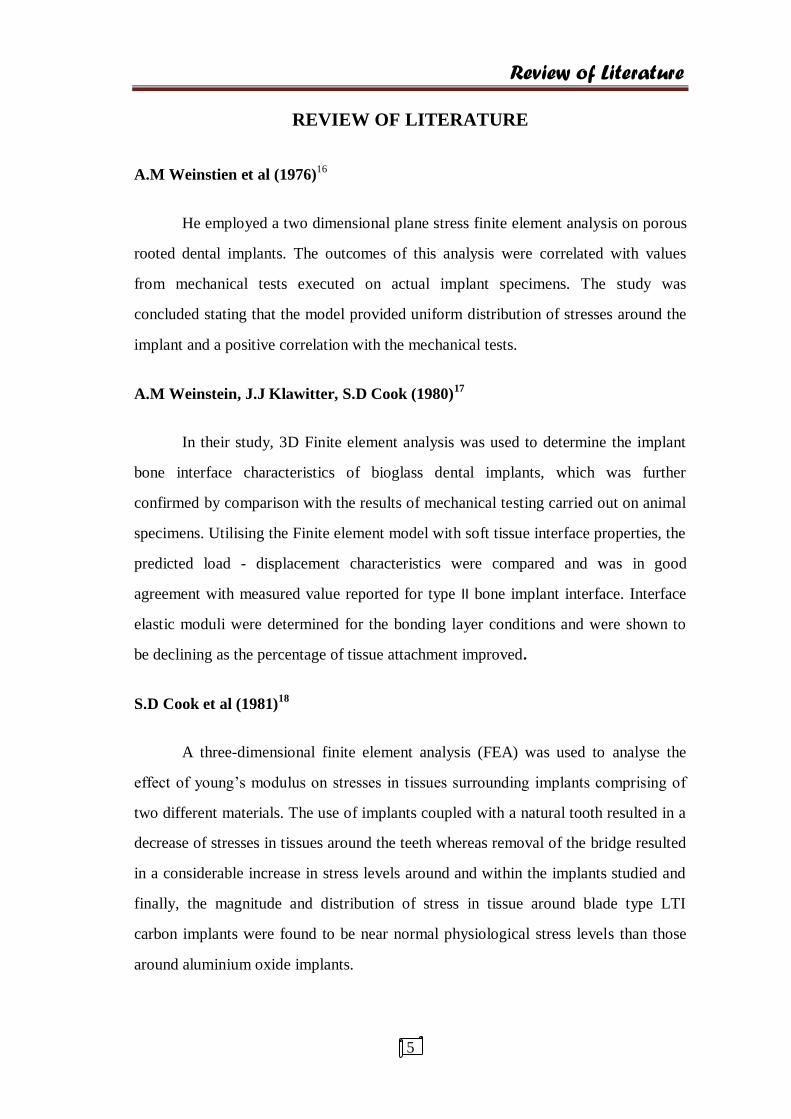
A.M Weinstien et al (1976)16
He employed a two dimensional plane stress finite element analysis on porous
rooted dental implants. The outcomes of this analysis were correlated with values
from mechanical tests executed on actual implant specimens. The study was
concluded stating that the model provided uniform distribution of stresses around the
implant and a positive correlation with the mechanical tests.
A.M Weinstein, J.J Klawitter, S.D Cook (1980)17
In their study, 3D Finite element analysis was used to determine the implant
bone interface characteristics of bioglass dental implants, which was further
confirmed by comparison with the results of mechanical testing carried out on animal
specimens. Utilising the Finite element model with soft tissue interface properties, the
predicted load - displacement characteristics were compared and was in good
agreement with measured value reported for type II bone implant interface. Interface
elastic moduli were determined for the bonding layer conditions and were shown to
be declining as the percentage of tissue attachment improved.
S.D Cook et al (1981)18
A three-dimensional finite element analysis (FEA) was used to analyse the
effect of young’s modulus on stresses in tissues surrounding implants comprising of
two different materials. The use of implants coupled with a natural tooth resulted in a
decrease of stresses in tissues around the teeth whereas removal of the bridge resulted
in a considerable increase in stress levels around and within the implants studied and
finally, the magnitude and distribution of stress in tissue around blade type LTI
carbon implants were found to be near normal physiological stress levels than those
around aluminium oxide implants.

Review of Literature
6
Cook et al (1982)19
They studied 3D FEA models of 3 cylindrical porous rooted implants in order
to evaluate their biomechanical response, which were verified with experimentally
determined values for the same three implants retrieved from dogs mandible after two
years of function and histologic analysis of the same indicated that the assumption of
a direct bone - implant interface was not a better representation for these kind of
porous rooted endosteal implants.
Borchers L. Reichert P (1983)20
He evaluated the distribution of stresses in the bone around a ceramic dental
implant using a 3D finite element model, which was subjected to axial and non- axial
loading at different phases of development of the interfacial zone. And the study was
concluded that the crestal regions recorded the highest stress concentrations when
loaded in a transverse direction and in spongy bone.
Ragnar Adell, Bo Eriksson, ULF Lekholm, Per Ingvar Branemark, Torsten Jemt
(1990) – A 15 year follow up study21
This study was conducted on 700 patients both male and female with a age
group that ranged from 19 to 79 years in whom 4,636 implants were placed and
reviewed through annual clinical and radiographic evaluation over a period of 15
years and the prosthesis stability was 95% for maxilla at 5 and 10 years whereas for
the mandible it was a solid 99% throughout the study period and they also obeyed the
specific criteria given by Albrektson et al.

Review of Literature
7
Reiger et al (1990)22
He conducted studies on six endosteal implants with similar modulus of
elasticity which were loaded axially in order to compare the stresses among them
using two dimensional finite element analysis method. And based on the results, a
cylindrical implant design directed most of the applied axial load to the apical bone
while the tapered design provided better stress distribution.
Bertil friberg, Torsten jemt, ULF lekholm23
A three year period retrospective study
A total of 899 patients were involved in the study with 4641 implants placed
in both upper and lower jaws with the study group comprising a mean age group of
57.5 years and the patients were regularly followed up from the first surgical
procedure to the final restoration. And the failure rates accounted to about 1.5% of
which most of the failures were in the maxillary jaw with poor bone qualities. And
length seemed to play a role too, as many failures occurred in short implants.
Meijer H J et al (1992)24
He, along with his colleagues conducted a two dimensional finite element
analysis on two implants connected by a bar on a mandibular model in order to
evaluate the stresses within and surrounding the design, taking into consideration the
height and length of the mandible along with various superstructures. And it was
concluded that the length of the mandible had no influence over the stresses, whereas
the height of the mandible largely influenced the stress patterns. And the stresses were
highly concentrated near the neck of the implant and in shorter length implants and
also a model with a solitary abutment showed a more uniform stress distribution when
compared with a model with connected abutments.
Review of Literature
8
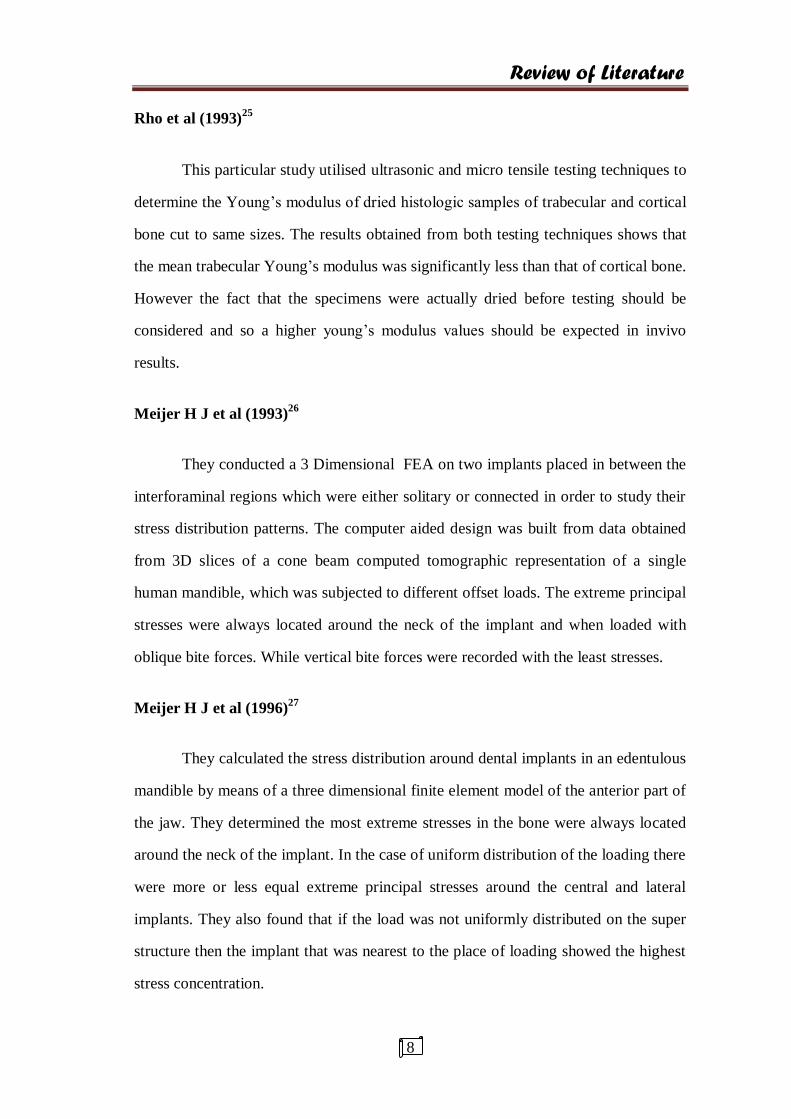
Rho et al (1993)25
This particular study utilised ultrasonic and micro tensile testing techniques to
determine the Young’s modulus of dried histologic samples of trabecular and cortical
bone cut to same sizes. The results obtained from both testing techniques shows that
the mean trabecular Young’s modulus was significantly less than that of cortical bone.
However the fact that the specimens were actually dried before testing should be
considered and so a higher young’s modulus values should be expected in invivo
results.
Meijer H J et al (1993)26
They conducted a 3 Dimensional FEA on two implants placed in between the
interforaminal regions which were either solitary or connected in order to study their
stress distribution patterns. The computer aided design was built from data obtained
from 3D slices of a cone beam computed tomographic representation of a single
human mandible, which was subjected to different offset loads. The extreme principal
stresses were always located around the neck of the implant and when loaded with
oblique bite forces. While vertical bite forces were recorded with the least stresses.
Meijer H J et al (1996)27
They calculated the stress distribution around dental implants in an edentulous
mandible by means of a three dimensional finite element model of the anterior part of
the jaw. They determined the most extreme stresses in the bone were always located
around the neck of the implant. In the case of uniform distribution of the loading there
were more or less equal extreme principal stresses around the central and lateral
implants. They also found that if the load was not uniformly distributed on the super
structure then the implant that was nearest to the place of loading showed the highest
stress concentration.
Review of Literature
9
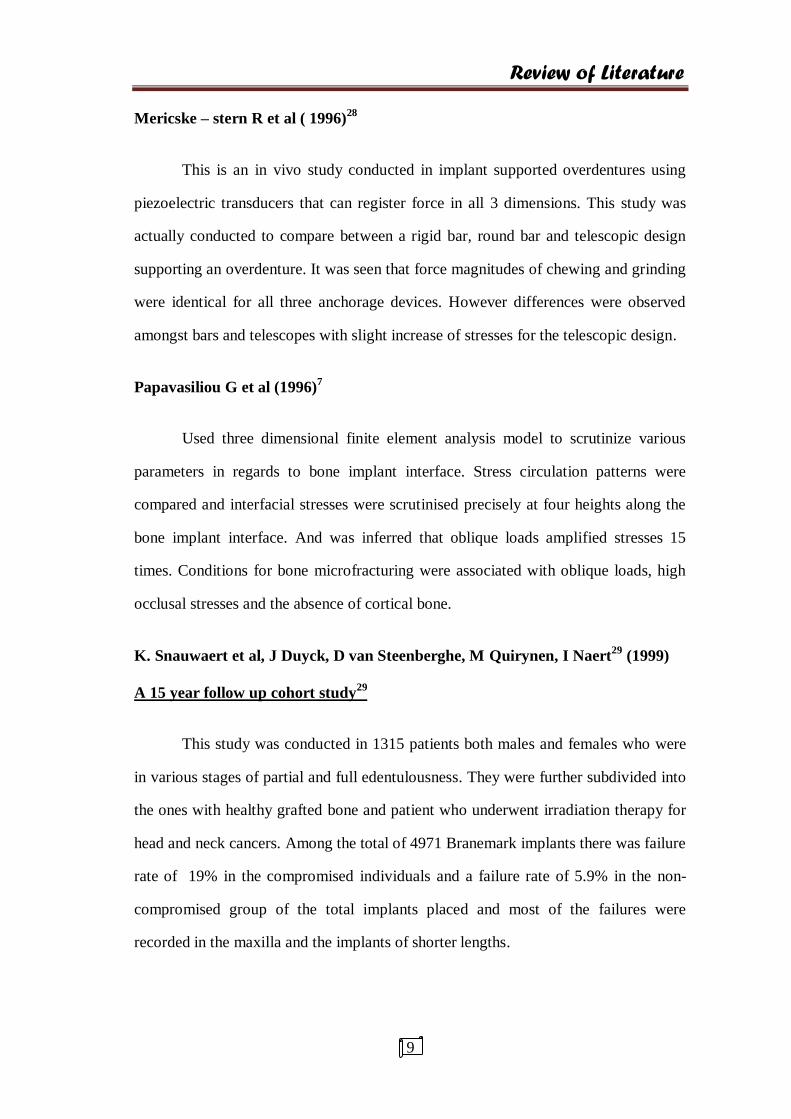
Mericske – stern R et al ( 1996)28
This is an in vivo study conducted in implant supported overdentures using
piezoelectric transducers that can register force in all 3 dimensions. This study was
actually conducted to compare between a rigid bar, round bar and telescopic design
supporting an overdenture. It was seen that force magnitudes of chewing and grinding
were identical for all three anchorage devices. However differences were observed
amongst bars and telescopes with slight increase of stresses for the telescopic design.
Papavasiliou G et al (1996)7
Used three dimensional finite element analysis model to scrutinize various
parameters in regards to bone implant interface. Stress circulation patterns were
compared and interfacial stresses were scrutinised precisely at four heights along the
bone implant interface. And was inferred that oblique loads amplified stresses 15
times. Conditions for bone microfracturing were associated with oblique loads, high
occlusal stresses and the absence of cortical bone.
K. Snauwaert et al, J Duyck, D van Steenberghe, M Quirynen, I Naert29
(1999)
A 15 year follow up cohort study29
This study was conducted in 1315 patients both males and females who were
in various stages of partial and full edentulousness. They were further subdivided into
the ones with healthy grafted bone and patient who underwent irradiation therapy for
head and neck cancers. Among the total of 4971 Branemark implants there was failure
rate of 19% in the compromised individuals and a failure rate of 5.9% in the non-
compromised group of the total implants placed and most of the failures were
recorded in the maxilla and the implants of shorter lengths.
Review of Literature
10
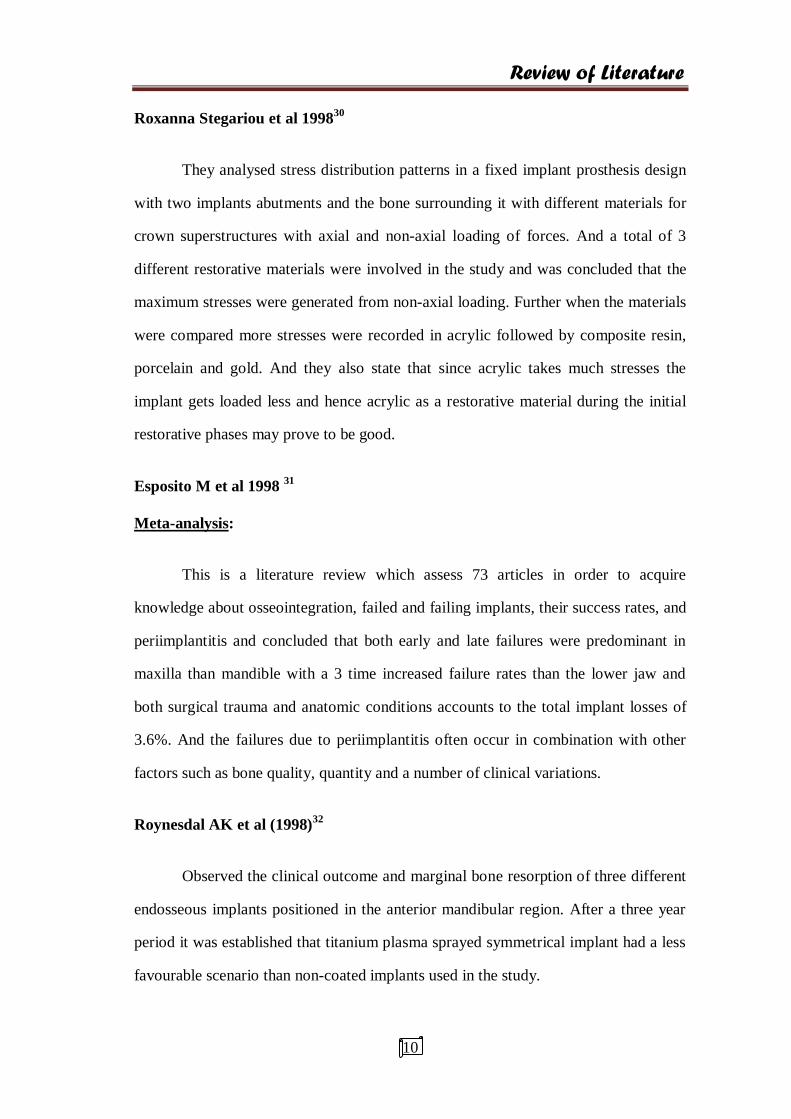
Roxanna Stegariou et al 199830
They analysed stress distribution patterns in a fixed implant prosthesis design
with two implants abutments and the bone surrounding it with different materials for
crown superstructures with axial and non-axial loading of forces. And a total of 3
different restorative materials were involved in the study and was concluded that the
maximum stresses were generated from non-axial loading. Further when the materials
were compared more stresses were recorded in acrylic followed by composite resin,
porcelain and gold. And they also state that since acrylic takes much stresses the
implant gets loaded less and hence acrylic as a restorative material during the initial
restorative phases may prove to be good.
Esposito M et al 1998 31
Meta-analysis:
This is a literature review which assess 73 articles in order to acquire
knowledge about osseointegration, failed and failing implants, their success rates, and
periimplantitis and concluded that both early and late failures were predominant in
maxilla than mandible with a 3 time increased failure rates than the lower jaw and
both surgical trauma and anatomic conditions accounts to the total implant losses of
3.6%. And the failures due to periimplantitis often occur in combination with other
factors such as bone quality, quantity and a number of clinical variations.
Roynesdal AK et al (1998)32
Observed the clinical outcome and marginal bone resorption of three different
endosseous implants positioned in the anterior mandibular region. After a three year
period it was established that titanium plasma sprayed symmetrical implant had a less
favourable scenario than non-coated implants used in the study.
Review of Literature
11
Teixeira ER et al (1998)33
They conducted finite element analysis in implants with more concentration
on the distribution of stresses in the periimplant region. The researchers innovated the
3 D model by unification of elements which were placed farther, thereby reducing the
number of elements, time duration and the computer memory. The results propose
that it is possible to develop a replica of FEA implant model of the mandible with less
range and fewer elements without actually altering stress distribution.
David L.Cochran (1999)34
They performed an investigation on endosteal implants which varied in their
surface modifications. The study reveals that implants with rough surfaces proved to
be more successful than the ones with smooth surface topography. But in single
implant crowns there was no significant difference in success rates between the two
types. And also the implants placed in mandible had better success rates than those in
maxilla.
Vollmer et al35
(2000)
This study was conducted to compare the finite element analysis with that of
in vitro loading conditions. The FEA part of the study was conducted by constructing
a mandibular model from the results obtained from a CBCT in order to analyse stress,
strain and deformation. And the results were concluded stating that there was a good
correlation between the two methodologies. So the FEA method can be used to
analyse biomechanics since it is both accurate and a cost effective method.
Beat r. merz et al (2000)36
This research presents a comparison between morse taper and the butt joint
connections between an implant and an abutment. They conducted a non-linear
Review of Literature
12
dynamic 3D FE analysis in order to compare them with long term fitness in mind.
Hence they concluded that the conical abutment condition seemed to be better in
comparison with the other type of connection.
J P Geng et al (2001)37
This study is a review of literature about finite element analysis and its
applications in dentistry. The reviewers explains in detail about geometric modelling
of the living structures and dental implants, the various loading and boundary
conditions. He has tabulated the various material properties and their significance and
the qualities of bone such as its non homogenicity. And finally the advantages and
limitations of the method.
Baris Simsek et al (2004)38
Conducted a study to evaluate the effects of different inter implant distances in
different implant systems on stress distribution in the bone around titanium implants
under vertical, horizontal and oblique loads in buccolingual, mesiodistal, and vertical
directions in the posterior mandibular region by finite element analysis and reported
that 1 cm inter implant distance was the optimum for two implant fixtures adjacent to
each other, they found out that 2 cm distance increased the tensile stresses under
vertical and mesiodistal loads whereas in the 0.5 cm distance there was an increase in
compressive stresses in all three directional forces.
J P Geng et al39
(2004)
This study compared force distribution between stepped screw and cylindrical
screw implants using 2 dimensional finite element analysis with axial, transverse and
oblique loading conditions with varying elastic modulus for cortical bone and
Review of Literature
13
trabecular bone and the maximum von mises stresses generated were found to be
17.9% lower in stepped screw implant area in the trabecular bone which is because of
the low stiffness of the stepped screw implant.
Gary R O’ Brien et al, Aron Gonshor, Alan Balfour (2004)40
A 6 year prospective study
He conducted studies on a total of 620 dental implants. Out of the total
number of implants, 386 implants were a prototype HA coated implants which he
claims to be a unique stress diversion surface system developed by a combination of
mathematical modelling, digital radiography (isodensity) and FEA and the remaining
234 were grit blasted commercially available implant systems which were placed in
both augmented and non- augmented bone types and the prototype obtained a slightly
higher survival rate (96.6%) than the existing implant system and the maximum stress
concentration were at the crest of the ridge.
Sevimay et al, (2005)41
In this study, a 3 D Finite element analysis was conducted on an implant
crown embedded in the mandible simulating four different bone qualities. Each model
was subjected to axial loading in order to evaluate the stress distribution patterns. The
neck of the implant had the highest stresses and the D1 bone quality recorded the least
stresses followed by a gradual increase of stresses as one moves towards D4.
Porter J et al, (2005)42
Meta analysis:
This is a review of literature about success and failures of dental implants. The
reviewers conducted an extensive study on articles which mainly centred around meta
analysis and multicentre studies and they gleaned that the main factors for implant
Review of Literature
14
survival was based on patient factors such as age, bone quality and quantity, oral
hygiene, systemic disease, smoking, parafunctional habits, the biomechanical factors
such as prosthesis design, length, position and the direction of loading of implants.
Omar lutfi koca et al (2005)43
They conducted a study utilising a finite element model of posterior
mandible with varying crestal bone heights (4, 5, 7, 10 and 13 mm ) with a vertical
loading protocol, and stated that in supporting bone levels of 4 and 5 mm, the
maximum stresses were localised in wide areas and particularly in the neck of the
implant whereas in 7, 10, 13 mm stresses were localised in narrow areas and the
maximum von mises stresses were recorded on the palatal cortical bone for all
irrespective of the crestal bone levels.
M. Karl et al (2007)44
They analysed six different implants supported FPD’s with strain gauges on
the pontics of the prosthesis on vertical loading and concluded that the same
magnitude for both three unit and five unit prosthesis were derived through FEA
results. However the in vivo measurements revealed a higher stress values for the five
unit prosthesis. The strain gauge values show low von misses stresses for the cement
retained prosthesis than the screw retained prosthesis and an overall reduction in von
mises stresses in the apical area of the implant for all the groups.
Heoung – jae chun et al (2006)45
This study investigated the effect of different abutment types on stress
distribution in bone with inclined loads using finite element analysis. Separate models
with internal hex and external hex were modelled to study the effect of abutment
types on stress distribution. It was found that internal hex implant system generated
Review of Literature
15
lowest von mises stresses for all loading condition because of reduction of bending
effect by sliding in the tapered joints between implant and abutment concluding the
abutment type had significant effect on stress distribution in bone.
Jose henrieque rubo et al, (2008)46
In this study finite element analysis was conducted on an implant supported
prosthesis consisting of five implants with a bar framework loaded in a vertical
direction. And it was concluded that each increment of 5 mm cantilever length
augmented the stresses by approximately 30- 37 % on the compact bone. They also
observed that stiffer the cancellous bone the more stress they seemed to bear and the
cortical bone was comparatively loaded less and diminished stress was observed with
increase in the length of implant.
Arun kumar et al, (2012)47
In this study, two implants one with a straight abutment and the other with an
angulated abutment which were assigned to be in groups containing different bone
qualities were assessed by loading with a static load. The highest stresses were in the
angulated abutment in the poorer bone qualities such as the D4 type and the cervical
region was the one with greater stress Concentration compared to the rest of the
design.
Marcello bighetti toniollo et al (2012)48
This study was conducted in two dental implants, with morse taper connection with
same diameter and varying lengths of 11 and 13mm lengths. A FEA was conducted to find
out the effect of stresses and stability in terms of comparison between those fixtures that were
implanted into the cortical bone and those implanted in trabecular bone. And the results of the
study concluded that the stability was better for implants positioned in cortical bone than
Review of Literature
16
those placed completely in trabecular bone. Yet implants placed slightly below the neck of the
crest has a added advantage of lesser crestal bone loss.
Miyuki omari et al (2015)49
This study was conducted in order to compare between the values obtained
from FEA analysis and an experimental model which were subjected to forces by
Instron load analyser. A FEA model and an actual physical model was constructed
and subjected to same loading conditions and the data obtained was statistically
analysed by availing coefficient of variance. The results report a variance of 5 – 10%
between the two methods.
Fellippo Ramos Verri et al (2015)50
The researches plotted the von misses stresses, principal stresses and
displacement in monocortical and bicortical implant placement in the anterior maxilla
using 3D finite element method with loading at different directions and depicts
bicortical technique to be best from a biomechanical perspective. Oblique loads
augmented the stresses in all techniques especially in the fixation screws and the
cervical area of the implant.
Julius Maminskas et al, al Girdas Puisys, Ritva Kuvoppala, Aune Raustia
Gintaras Juodys Balys (2016)51
A systematic review
This study was conducted by collecting data from online search performed on
MEDLINE and EMBASE databases for a past five year period from the time the
study was done. The study included finite element analysis which varied in their
analyses ranging from influence of length and diameter of implants, the load
characteristics, the implant abutment connection, different bone densities,
Review of Literature
17
osseointegration, on generation of stresses, strains and other biomechanics and
concluded that offset forces acting on implants, cantilever in the system, misfit in the
implant abutment connection, the magnitude of force and the difference in properties
of restorative materials brought about periimplant strain.
Camilla lima de Andrade et al52
(2016)
This study conducted a three dimensional finite element analysis on a single
implant design with a zirconia superstructure in four different types of implants which
varied in their implant abutment connection on thread design and implant body shapes
and the bone design was simulated such that of posterior maxilla with poor bone
quality. The results states that the maximum stress and strains were present in the
posterior maxilla models with external hexagon connection irrespective of the implant
body types.
Materials and Methods
18
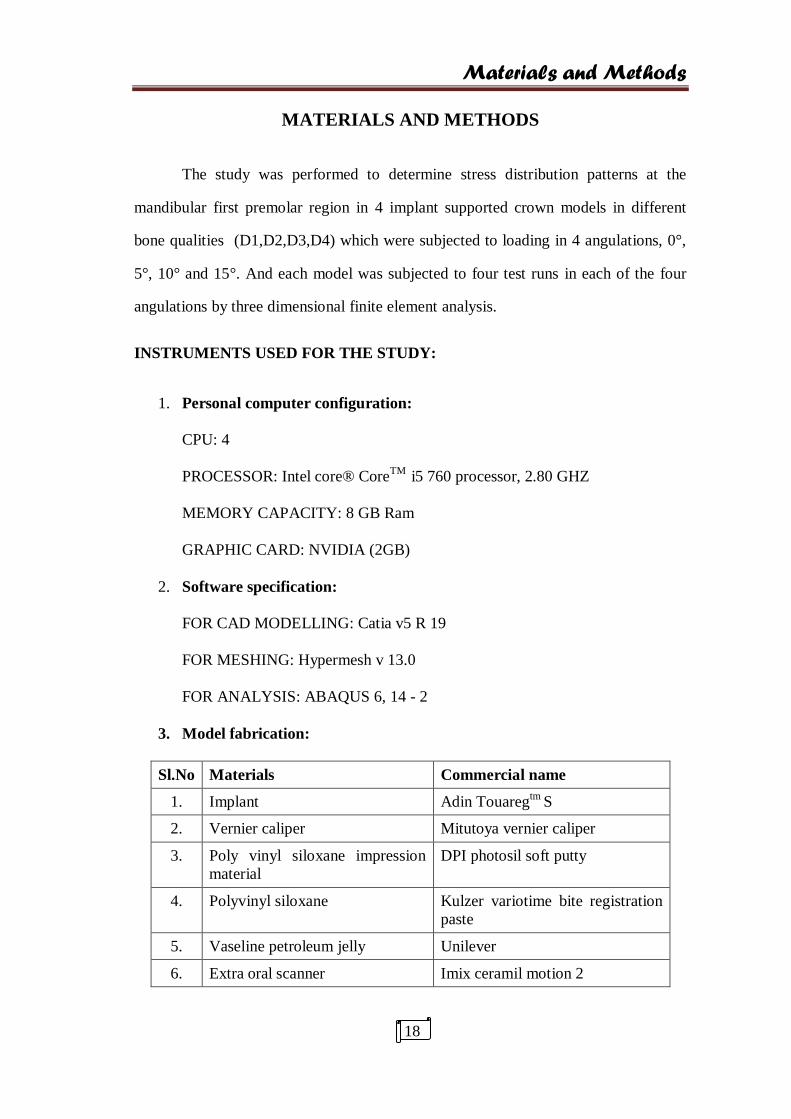
MATERIALS AND METHODS
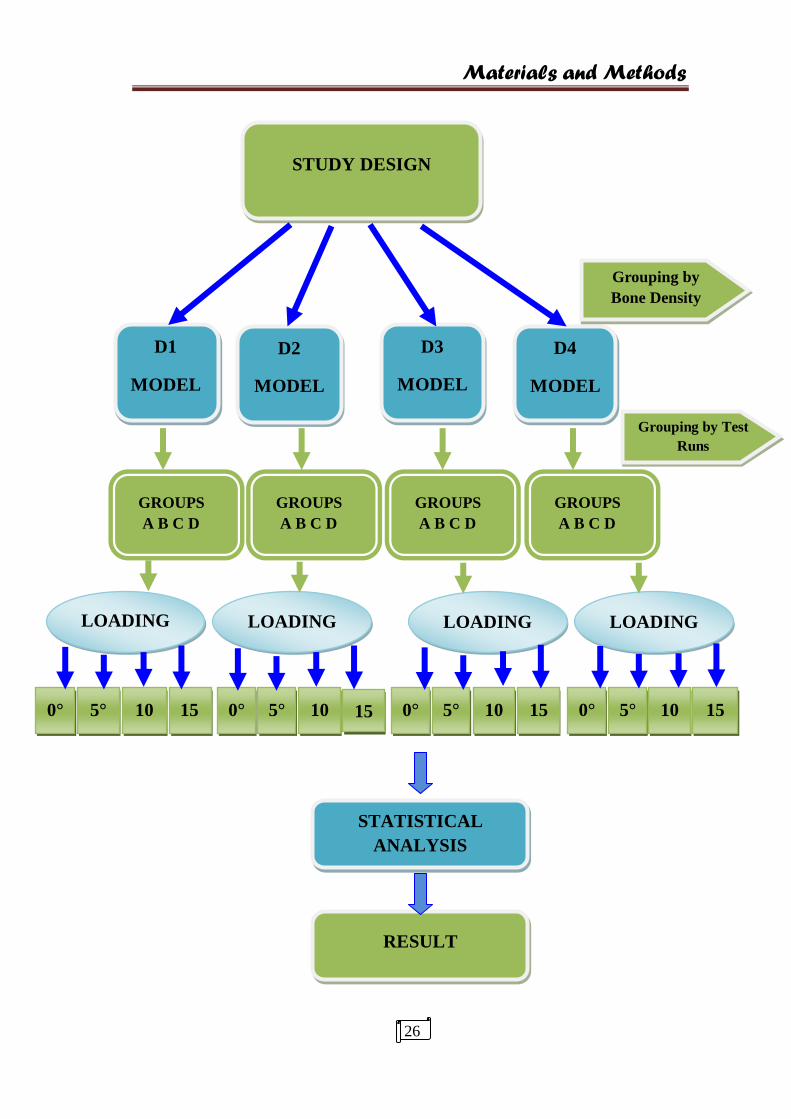
The study was performed to determine stress distribution patterns at the
mandibular first premolar region in 4 implant supported crown models in different
bone qualities (D1,D2,D3,D4) which were subjected to loading in 4 angulations, 0°,
5°, 10° and 15°. And each model was subjected to four test runs in each of the four
angulations by three dimensional finite element analysis.
INSTRUMENTS USED FOR THE STUDY:
1. Personal computer configuration:
CPU: 4
PROCESSOR: Intel core® CoreTM
i5 760 processor, 2.80 GHZ
MEMORY CAPACITY: 8 GB Ram
GRAPHIC CARD: NVIDIA (2GB)
2. Software specification:
FOR CAD MODELLING: Catia v5 R 19
FOR MESHING: Hypermesh v 13.0
FOR ANALYSIS: ABAQUS 6, 14 - 2
3. Model fabrication:
Sl.No Materials Commercial name
1. Implant Adin Touaregtm
S
2. Vernier caliper Mitutoya vernier caliper
3. Poly vinyl siloxane impression
material
DPI photosil soft putty
4. Polyvinyl siloxane Kulzer variotime bite registration
paste
5. Vaseline petroleum jelly Unilever
6. Extra oral scanner Imix ceramil motion 2

Materials and Methods
19
INPUT FOR THE CAD MODEL:
IMPLANT MODEL:
Implant: Diameter : 4.2 mm
Length : 10 mm
See fig.
BONE MODEL:
Sl.No Bone quality Bone model
1. D1 Homogenous compact bone
2. D2 Thick compact bone(2mm) surrounding a core of
dense trabecular bone
3. D3 Thin layer of cortical bone(1mm) surrounding a core
of dense Trabecular bone
4. D4 Thin layer of cortical bone(1mm) surrounding a core
of low density trabecular bone
The bone models were designed according to Lekhlom and Zarb (1985)53
classification.
MESH MODEL:
Sl.
No. Constituent parts
Numbers
1. Nodes 323910
2. Elements 1691090
3. Degree of freedom 323910×3
1691090×3

Materials and Methods
20
Loading Pattern:
A total force of 300 N as a single static load is applied at the buccal cusp
(150N) and distal fossa (150N) as point loads in centric occlusion at the vertical axis
(perpendicular to the occlusal plane) and also as offset loads in 5°, 10°, 10° and 15°.
The models were subjected to forces from four different angulations,
1. 0 Degree angulation
2. 5 Degree angulation
3. 10 Degree angulation
4. 15 Degree angulation
BOUNDARY CONDITIONS:
Restricted in all degrees of freedom in the x, y, and z directions
MATERIAL PROPERTIES:
SL.
NO COMPONENT MATERIAL
YOUNG’S
MODULOUS
(N/mm2 /Mpa)
POISSONS
RATIO
DENSITY
(Ton/mm3)
1. Abutment Titanium
alloy
110000 0.35 4.96 e^-9
2. Connecting
Screw
Titanium
alloy
110000 0.35 4.96 e^-9
3. Implant body Titanium
alloy
110000 0.35 4.96 e^-9
4. Crown
superstructure
Co – Cr alloy 218000 0.33 9.15 e^-9
Feldspathic
porcelain
82800 0.35 2.75 e^-9
5. Bone Dense
trabecular
1370 0.30 2.09 e^-9
Low dense
Trabecular
1100 0.30 2.09 e^-9
Cortical 13700 0.30 2.09 e^-9

Materials and Methods
21
YIELD STRENGTH:
SL.NO MATERIAL PROPERTIES YIELD STRESS
(0.2%)
1. Titanium*
860
2. Co – Cr alloy 500
3. Feldspathic porcelain 380
4. Cortical bone* 188
5. Trabecular bone* 88 – 121
* 54
FEA:
STEPS IN FEA:
1. Pre processing
a. Solid modelling
b. Meshing
c. Boundary conditions
2. Processing
3. Post processing
a. Result interpretation

Materials and Methods
22
Step 1:
PRE PROCESSING:
This step includes drafting of the body to be analysed. With the details
collected by measuring the actual implant and data obtained from stereolithographic
image, In the present study a CAD model of the posterior mandibular segment
comprising of an implant supported crown was fabricated and the periphery was
plotted as x, y, z and restricted in all degrees of freedom.
Working steps:
Constructing geometric data of the structure to be analysed
Importing the data
Geometry check/cleanup
Deciding the element type
Assigning material properties to the structure
Loading conditions to which the model is subjected
In our study an implant supported crown (mandibular premolar crown) was
designed along with the surrounding bone block (28.6mm – 16.5mm). It was designed
by values obtained by two methods which were from the size and dimension of actual
implant measured by vernier calliper and stereolithograhic images obtained by
making putty impression of actual implant and positive models obtained with bite
registration paste which was scanned with IMIX extraoral scanner. Each of the
implant components (abutment, connecting screw and implant body) were drafted
separately and for the crown structure the metal and feldspathic porcelain was given a
thickness of 0.2mm and 1.8mm respectively and as for the shape of the premolar
crown standard values of premolar tooth was assigned (wheelers oral anatomy)55
and
Materials and Methods
23
the bone (both cortical and cancellous) was designed according to Zarb and
Lekholms classification for each of the different bone types and the boundary
conditions were assigned as x, y, z for the mesial, distal, buccal and lingual, and
apical sides of the model, shortly the lower part of the bone is arrested in all DOF (Tx,
Ty, Tz, Rx, Ry and Rz).
Models were created using hypermesh software and later the model was
imported to ABAQUS through IGES (initial graphics exchange specification) for
proceeding with the analysis.
MATERIAL PROPERTIES:
FEA assigns the following mechanical properties for the material components
1. HOMOGENOUS : The properties are uniform throughout the structure.
2. ISOTROPIC : Iso – same Tropic – direction the properties remain the same in
any given direction.
3. LINEARLY STATIC: The strain/deformation are proportional to the applied
loads.
ELEMENT TYPE:
The models were meshed with tetrahedron elements throughout the model.
PROCESSING:
The geometric CAD data was checked for errors and a cleanup before meshing
was done. The CAD model was subjected to meshing using hypermesh software. And
a load of 150 N each was given at the buccal cusp tip and distal fossa (control points).
So a total of 300 N56
was applied on the premolar simulating a centric occlusion bite
force and displacement seen at nodes.
Materials and Methods
24
WORKING STEPS:
1. Providing of a control data.
2. The different layers of the body to be analysed are represented as different
areas.
3. Utilizing the hypermesh software and meshing done.
The ABAQUS Software was employed to generate input data for the stress
analysis. Geometric and elastic parameters of all components were entered into the
computer program.
The model thus created was given life like properties by inducing into the
different layers their modulus of elasticity, poissons ratio and density. And thus the
stress values were propagated when load tested.
LOADING:
The model was loaded at two points namely buccal cusp tip and distal fossa
simultaneously with 150 N each as static load so as to simulate centic occlusion and
every individual model was loaded from four different angles,
Which were,
1. 0 degrees ( parallel to the long axis of tooth)
2. 5 degrees
3. 10 degrees
4. 15 degrees
The model depicted stresses both numerically and by colour code.

Materials and Methods
25
POST PROCESSING:
Once the result data was obtained as numerical values and colour coded they
were tabulated and analysed for computation of the results.
COLOUR CODING:
The result was given as von misses stresses in megapascals. Since Von mises
are the ones which are used for ductile materials and shear stresses generated by
loading at an angle and hence appropriate for the present study.
Materials and Methods
26
STUDY DESIGN
D1
MODEL
D2
MODEL
D3
MODEL
D4
MODEL
GROUPS
A B C D
GROUPS
A B C D
GROUPS
A B C D
GROUPS
A B C D
LOADING LOADING LOADING LOADING
0° 5°
10
°
0°
15
°
5°
10
°
15
°
0°
5°
15
°
10
°
0°
15
°
10
°
5°
STATISTICAL
ANALYSIS
RESULT
Grouping by
Bone Density
Grouping by Test
Runs
Materials and Methods
27
OVERVIW OF FEM:
FEA is an acknowledged methodology based on sound principles designed for
engineering. Its development can actually be traced way back to Hrennikoff (1941)57
and Courant (1943)58
while the practical application of the method is linked with
Leonard Oganesyan (1960). It is a problem solving tool which was later adapted to
various fields. In simple words, FEA takes up a complex problem and breaks it into
small pieces ie converts a solid structure of infinite elements into finite elements to
arrive at a solution.
APPLICATIONS:
Mechanical/aerospace/civil/automotive engineering
Structural/stress analysis
Static/dyanamic
Linear/non linear
Fluid flow
Heat transfer
Electromagnetic fields
Solid mechanics
Acoustics
Biomechanics
TERMINOLOGY59
:
FEM:
Any continuous object has infinite degrees of freedom. This method reduces
degrees of freedom from infinite to finite with the help of discretization (ie) meshing
(nodes and elements) in order to solve a complex problem.

Materials and Methods
28
ELEMENTS:
It is the entity which joins the nodes and forms a specific shape such as
triangular, quadrilateral etc. and it is desirable that various elements can be created to
offer users with the needed flexibility to meet the requirement.
NODES:
All the calculations are made at limited number of nodes. They are present in
or outside the boundaries of the model to be meshed.
DEGREES OF FREEDOM:
The minimum number of parameters (motion, co-ordinates, temperature etc.)
required to define position of any entity completely in space is known as DOF.
YIELD STRENGTH:
It is the stress at which a specific amount of plastic deformation is produced,
which is usually taken as a 0.2% of unstressed length.
STRESS:
Stress = force/area
TYPES:
Normal stress: acts perpendicular to the cross section a causes compression and
elongation
Shear stress: acts parallel to the cross section causes distortion

Materials and Methods
29
VON MISES STRESS:
It is based on distortion energy or shear strain energy (Theory of failure).
These are the stresses above which the material yields or deforms. Hence
recommended for ductile materials
Failure Criteria:
Shear strain energy (multiaxial loading) = shear strain energy at yield point.
NATURE OF STRESS:
FORCE:
F = Mass/area
TYPES:
(Based on region of application)
NATURE OF STRESS
1D
UNIAXIAL
LESS COMMON
2D
BIAXIAL
LESS COMMON
3D
TRIAXIAL/REAL LIFE SITUVATION
FORCE
POINT AREA
PRESSURE TRACTION
LINE VOLUME
GRAVITATIONAL CENTRIFUGAL
Materials and Methods
30
CONCEPT OF FEA:
ADVANTAGES:
1. Increased visualisation
2. Decreased design cycle time
3. Reduction in the number of prototypes
4. Number of testing times reduced
5. Optimum design
DISADVANTAGES:
1. Precise material properties are needed for the results to be accurate
2. It entails a large amount of the computer’s memory capacity and time
3. The results are generated as a large amount of numerical data, which again is a
time consuming procedure to extract the required results.
PROBLEM DOMAIN
COLLECTION OF SUB DOMAINS
SUB DOMAIN
SET OF ELEMENTS
RECOMBINING ALL SET OF ELEMENTS
ONE GLOBAL SYSTEM
SOLUTION
Photographs Of Methods
31
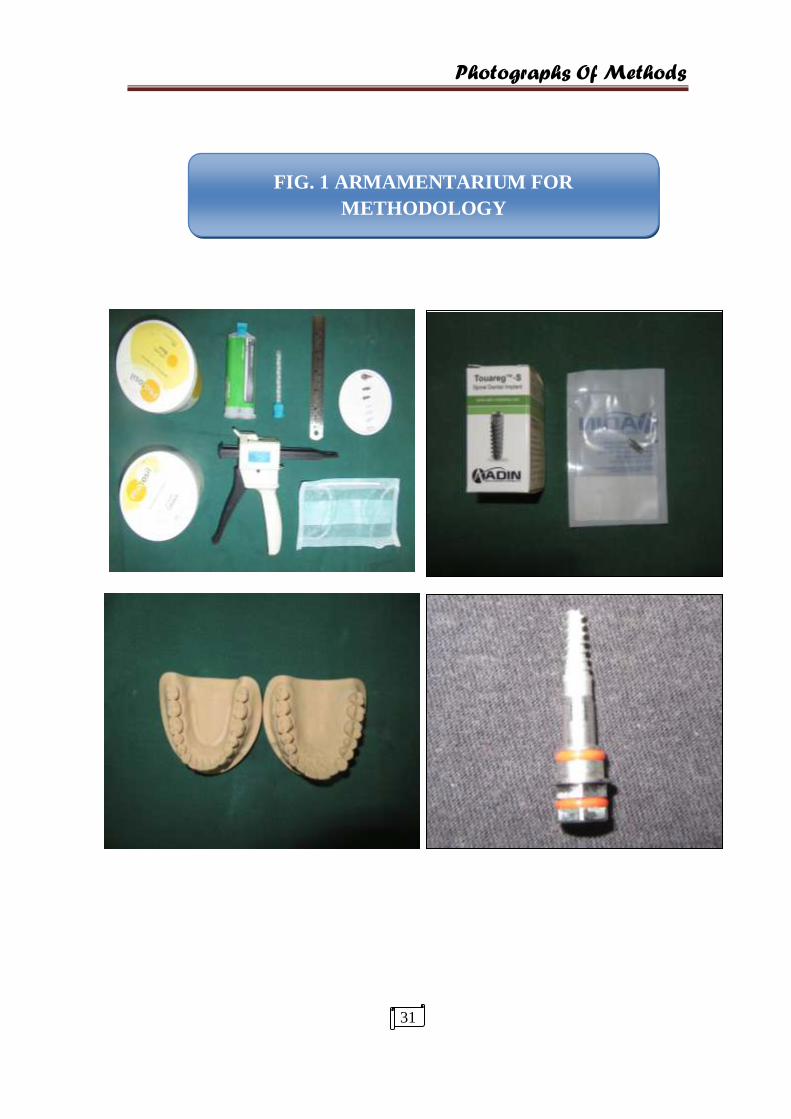
FIG. 1 ARMAMENTARIUM FOR
METHODOLOGY

Photographs Of Methods
32
FIG.2 IMPRSSION OF THE IMPLANT MODEL
ARMAMENTARIUM FOR STERIOLITHOGRAPHY
EXTRA ORAL SCANNER

Photographs Of Methods
33
FIG. 3. IMPLANT DIMENSIONS AND STEREOLITHOGRAPHIC
MODEL
FIG. 4. GEOMETRY OF IMPLANT MODEL

Photographs Of Methods
34
Fig. 5 CAD MODEL OF THE D1,D2, D3, D4
BONE MODELS
FIG. 6 MESHING OF THE BONE MODELS

Photographs Of Methods
35
z
FIG. 7 LOADING OF THE FINITE ELEMENT MODEL
PHOTOGRAPHS OF METHODS
37
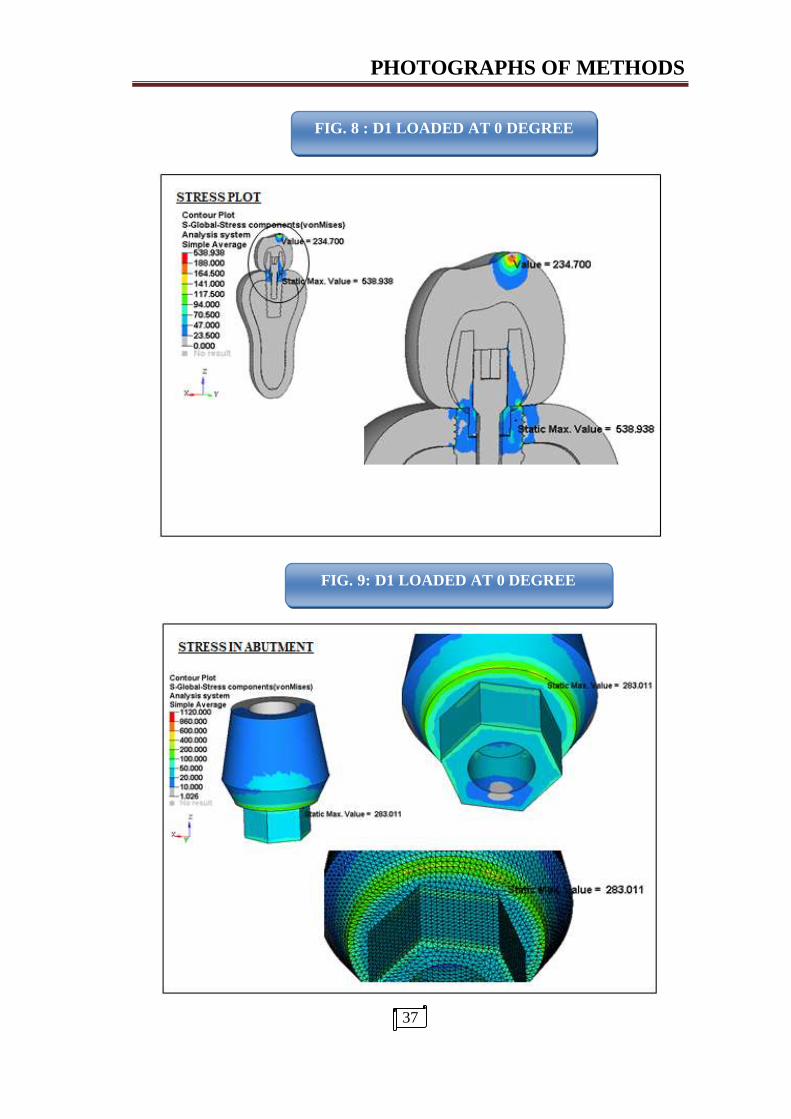
FIG. 8 : D1 LOADED AT 0 DEGREE
DEGREE
FIG. 9: D1 LOADED AT 0 DEGREE
PHOTOGRAPHS OF METHODS
38
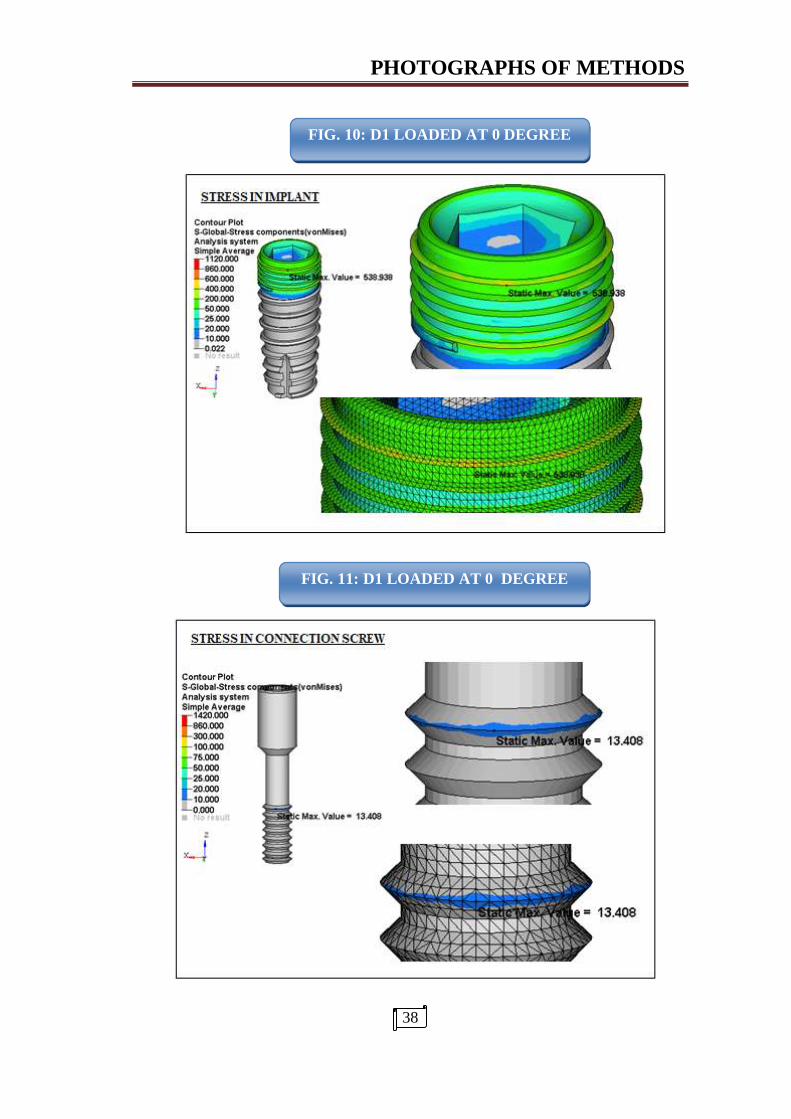
FIG. 10: D1 LOADED AT 0 DEGREE
FIG. 11: D1 LOADED AT 0 DEGREE

PHOTOGRAPHS OF METHODS
39
FIG. 13: D1 LOADED AT 0 DEGREE
FIG. 12 D1 LOADED AT 0 DEGREE
PHOTOGRAPHS OF METHODS
40
FIG. 14 : D1 LOADED AT 0 DEGREE
FIG. 15 : D1 LOADED AT 0 DEGREE
PHOTOGRAPHS OF METHODS
41
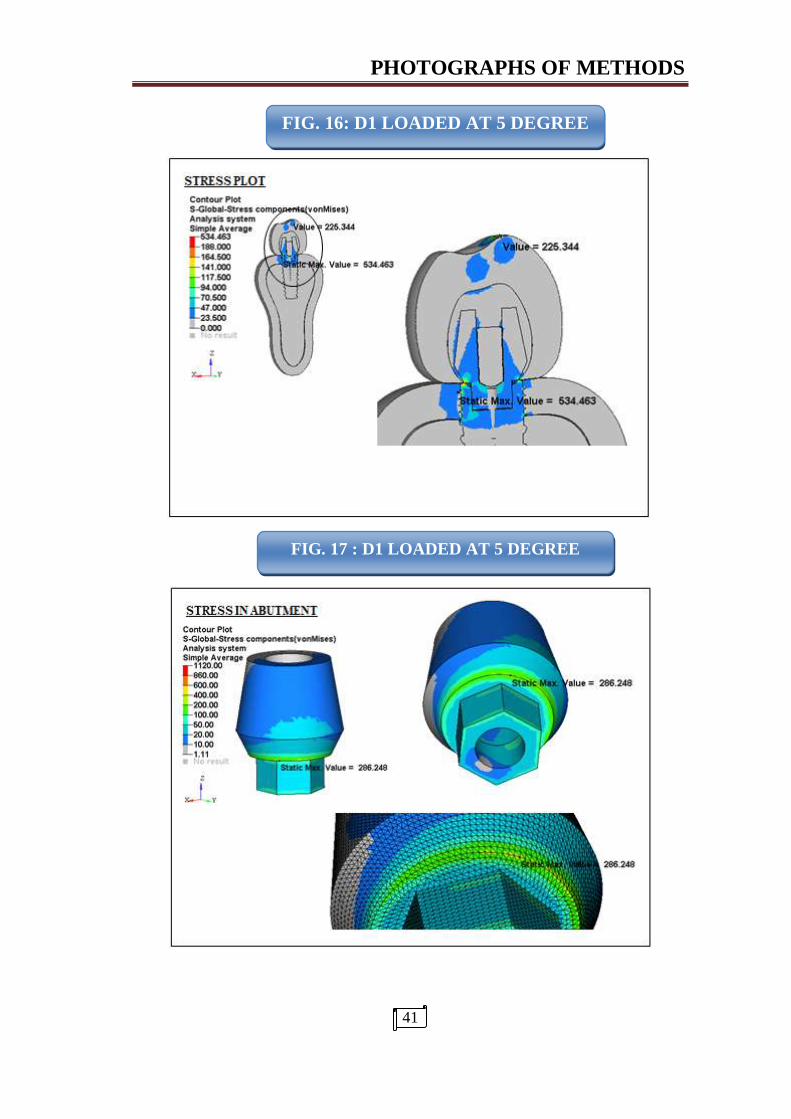
FIG. 16: D1 LOADED AT 5 DEGREE
FIG. 17 : D1 LOADED AT 5 DEGREE

PHOTOGRAPHS OF METHODS
42
FIG. 18 D1 LOADED AT 5 DEGREE
FIG. 19 : D1 LOADED AT 5 DEGREE
PHOTOGRAPHS OF METHODS
43
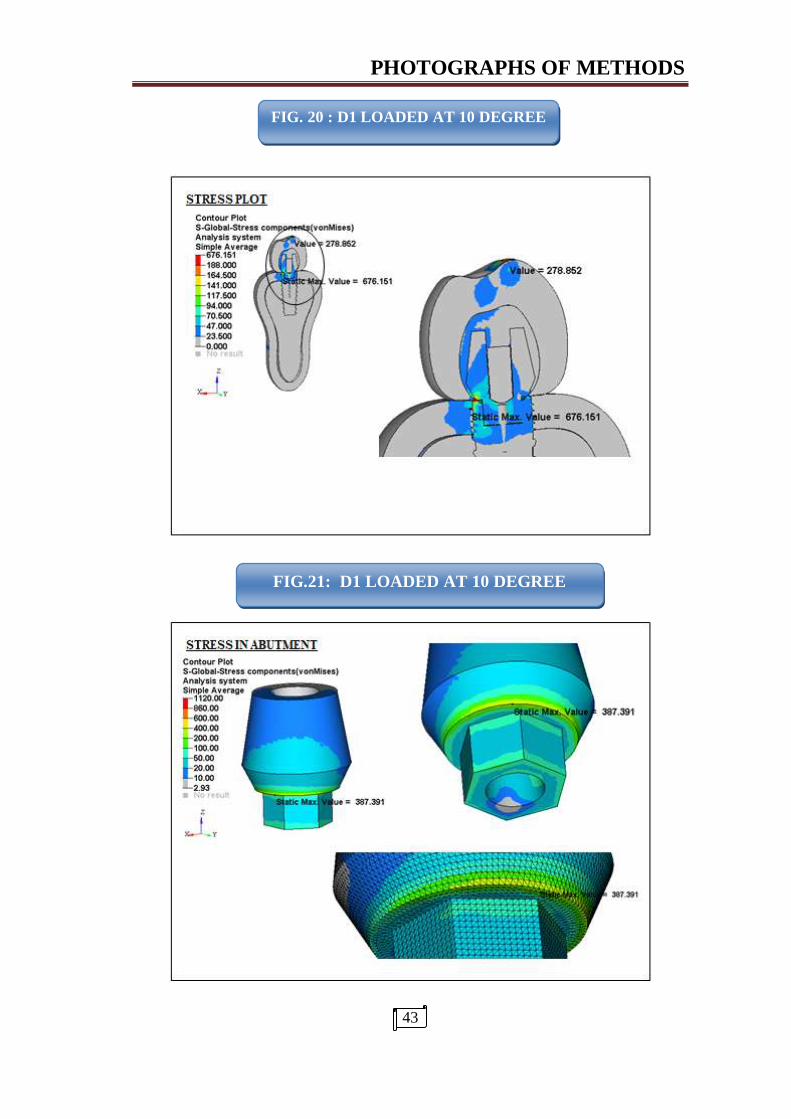
FIG.21: D1 LOADED AT 10 DEGREE
FIG. 20 : D1 LOADED AT 10 DEGREE

PHOTOGRAPHS OF METHODS
44
FIG. D1 LOADED AT 10 DEGREE
FIG. 23: D1 LOADED AT 10 DEGREE
FIG. 22: D1 LOADED AT 10 DEGREES

PHOTOGRAPHS OF METHODS
45
FIG. 24 D1 LOADED AT 15 DEGREE
FIG. 25 : D1 LOADED AT 15 DEGREE

PHOTOGRAPHS OF METHODS
46
FIG. 26: D2 LOADED AT 0 DEGREE
FIG. 27 : D2 LOADED AT 0 DEGREE

PHOTOGRAPHS OF METHODS
47
FIG. 29: D3 LOADED AT 0 DEGREE
FIG. 28: D3 LOADED AT 0 DEGREE

PHOTOGRAPHS OF METHODS
48
FIG.30 D4 LOADED AT 0 DEGREE
FIG. 31 : D4 LOADED AT 0 DEGREE

CERTIFICATE - II
This is to certify that this dissertation work titled ………………………………..
of the candidate ………………………………………… with registration Number
……………for the award of …………………………………………… in the branch of
………………….. . I personally verified the urkund.com website for the
purpose of plagiarism Check. I found that the uploaded thesis file
contains from introduction to conclusion pages and result shows ………
percentage of plagiarism in the dissertation.
Guide & Supervisor sign with Seal.
Tables
49
ANOVA TEST
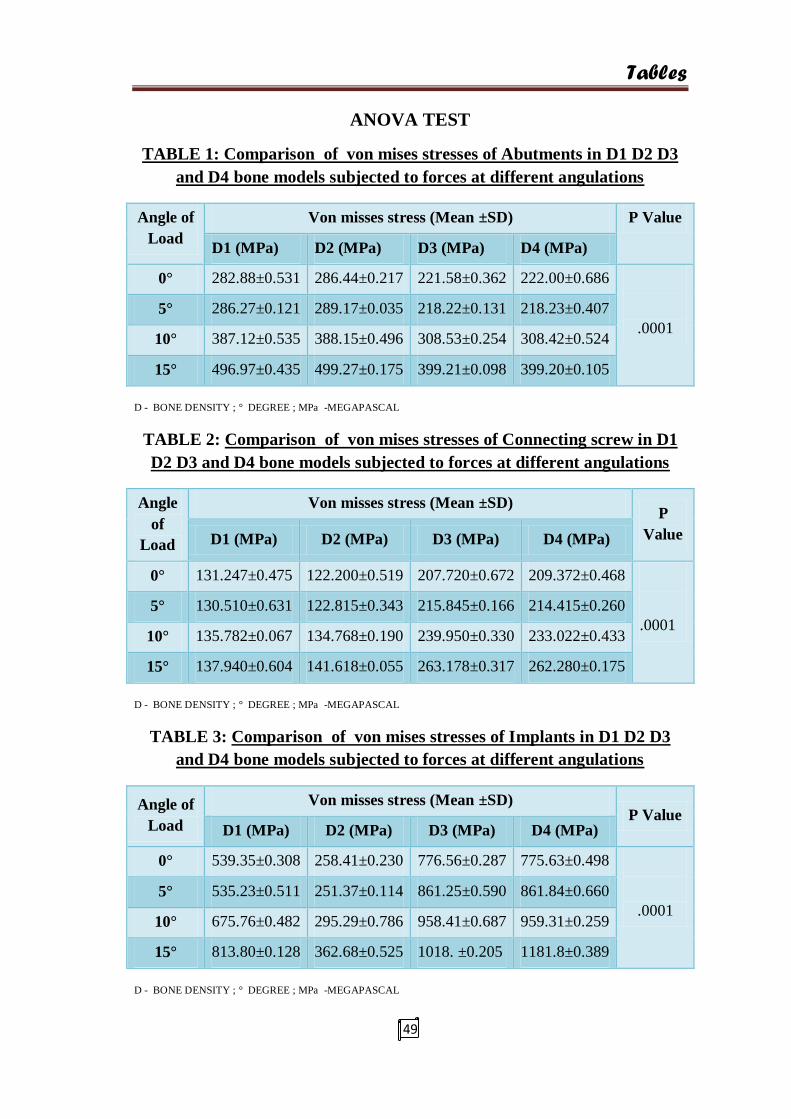
TABLE 1: Comparison of von mises stresses of Abutments in D1 D2 D3
and D4 bone models subjected to forces at different angulations
Angle of
Load
Von misses stress (Mean ±SD) P Value
D1 (MPa) D2 (MPa) D3 (MPa) D4 (MPa)
0° 282.88±0.531 286.44±0.217 221.58±0.362 222.00±0.686
.0001
5° 286.27±0.121 289.17±0.035 218.22±0.131 218.23±0.407
10° 387.12±0.535 388.15±0.496 308.53±0.254 308.42±0.524
15° 496.97±0.435 499.27±0.175 399.21±0.098 399.20±0.105
D - BONE DENSITY ; ° DEGREE ; MPa -MEGAPASCAL
TABLE 2: Comparison of von mises stresses of Connecting screw in D1
D2 D3 and D4 bone models subjected to forces at different angulations
Angle
of
Load
Von misses stress (Mean ±SD) P
Value D1 (MPa) D2 (MPa) D3 (MPa) D4 (MPa)
0° 131.247±0.475 122.200±0.519 207.720±0.672 209.372±0.468
.0001
5° 130.510±0.631 122.815±0.343 215.845±0.166 214.415±0.260
10° 135.782±0.067 134.768±0.190 239.950±0.330 233.022±0.433
15° 137.940±0.604 141.618±0.055 263.178±0.317 262.280±0.175
D - BONE DENSITY ; ° DEGREE ; MPa -MEGAPASCAL
TABLE 3: Comparison of von mises stresses of Implants in D1 D2 D3
and D4 bone models subjected to forces at different angulations
Angle of
Load
Von misses stress (Mean ±SD) P Value
D1 (MPa) D2 (MPa) D3 (MPa) D4 (MPa)
0° 539.35±0.308 258.41±0.230 776.56±0.287 775.63±0.498
.0001
5° 535.23±0.511 251.37±0.114 861.25±0.590 861.84±0.660
10° 675.76±0.482 295.29±0.786 958.41±0.687 959.31±0.259
15° 813.80±0.128 362.68±0.525 1018. ±0.205 1181.8±0.389
D - BONE DENSITY ; ° DEGREE ; MPa -MEGAPASCAL

Tables
50
TABLE 4: Comparison of von mises stresses of Co-Cr crowns in D1 D2
D3 and D4 models subjected to forces at different angulations
Angle of
Load
Von misses stress (Mean ±SD) P Value
D1 (MPa) D2(MPa) D3 (MPa) D4 (MPa)
0° 379.49±0.477 380.93±0.899 372.37±0.336 371.84±0.477
.0001
5° 391.94±0.194 392.14±0.533 390.34±0.097 390.13±0.464
10° 499.71±0.497 498.20±0.180 493.00±0.682 492.95±1.206
15° 675.27±1.100 672.57±0.318 651.85±0.854 650.92±0.405
D - BONE DENSITY ; ° DEGREE ; MPa -MEGAPASCAL
TABLE 5: Comparison of von mises stresses in Feldspathic porcelain of
D1 D2 D3 and D4 models subjected to forces at different angulations
Angle of
Load
Von misses stress (Mean ±SD) P Value
D1 (MPa) D2 (MPa) D3 (MPa) D4 (MPa)
0° 234.66±0.044 234.93±0.391 234.46±0.244 235.24±0.500
.0001
5° 225.79±1.381 226.30±0.895 225.64±0.491 224.28±0.777
10° 281.27±0.135 230.47±0.161 231.21±0.488 230.91±0.474
15° 250.07±0.747 249.46±0.516 250.04±0.480 249.18±0.712
D - BONE DENSITY ; ° DEGREE ; MPa -MEGAPASCAL
TABLE 6: Comparison of von mises stresses in Cortical bone of D1 D2
D3 and D4 models subjected to forces at different angulations
Angle of
Load
Von misses stress (Mean ±SD) P Value
D1 (MPa) D2 (MPa) D3 (MPa) D4 (MPa)
0° 63.931±0.541 59.312±0.491 179.56±0.372 179.02±0.648
.0001
5° 67.403±0.464 62.239±0.086 192.83±0.839 192.45±0.462
10° 75.292±0.197 78.289±0.563 237.80±0.546 236.97±0.752
15° 91.077±0.250 93.954±0.674 295.07±0.172 295.20±0.097
D - BONE DENSITY ; ° DEGREE ; MPa -MEGAPASCAL
Tables
51
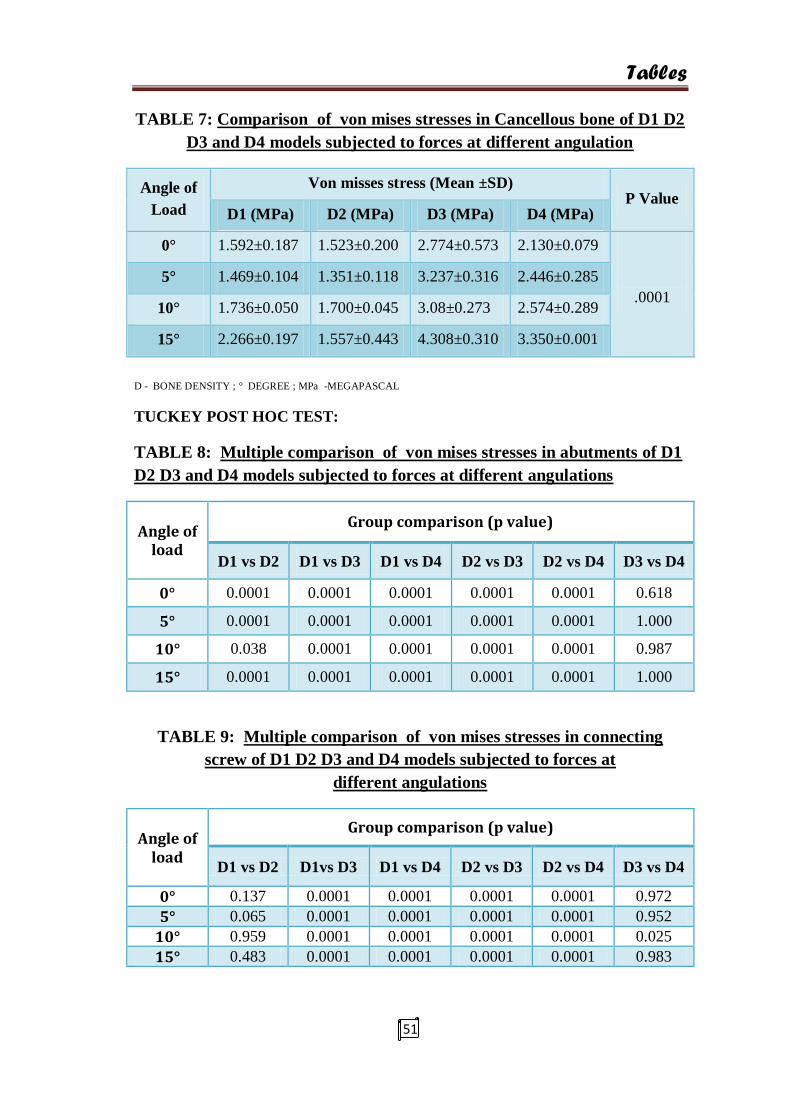
TABLE 7: Comparison of von mises stresses in Cancellous bone of D1 D2
D3 and D4 models subjected to forces at different angulation
Angle of
Load
Von misses stress (Mean ±SD) P Value
D1 (MPa) D2 (MPa) D3 (MPa) D4 (MPa)
0° 1.592±0.187 1.523±0.200 2.774±0.573 2.130±0.079
.0001
5° 1.469±0.104 1.351±0.118 3.237±0.316 2.446±0.285
10° 1.736±0.050 1.700±0.045 3.08±0.273 2.574±0.289
15° 2.266±0.197 1.557±0.443 4.308±0.310 3.350±0.001
D - BONE DENSITY ; ° DEGREE ; MPa -MEGAPASCAL
TUCKEY POST HOC TEST:
TABLE 8: Multiple comparison of von mises stresses in abutments of D1
D2 D3 and D4 models subjected to forces at different angulations
Angle of load
Group comparison (p value)
D1 vs D2 D1 vs D3 D1 vs D4 D2 vs D3 D2 vs D4 D3 vs D4
0° 0.0001 0.0001 0.0001 0.0001 0.0001 0.618
5° 0.0001 0.0001 0.0001 0.0001 0.0001 1.000
10° 0.038 0.0001 0.0001 0.0001 0.0001 0.987
15° 0.0001 0.0001 0.0001 0.0001 0.0001 1.000
TABLE 9: Multiple comparison of von mises stresses in connecting
screw of D1 D2 D3 and D4 models subjected to forces at
different angulations
Angle of load
Group comparison (p value)
D1 vs D2 D1vs D3 D1 vs D4 D2 vs D3 D2 vs D4 D3 vs D4
0° 0.137 0.0001 0.0001 0.0001 0.0001 0.972
5° 0.065 0.0001 0.0001 0.0001 0.0001 0.952
10° 0.959 0.0001 0.0001 0.0001 0.0001 0.025
15° 0.483 0.0001 0.0001 0.0001 0.0001 0.983
Tables
52
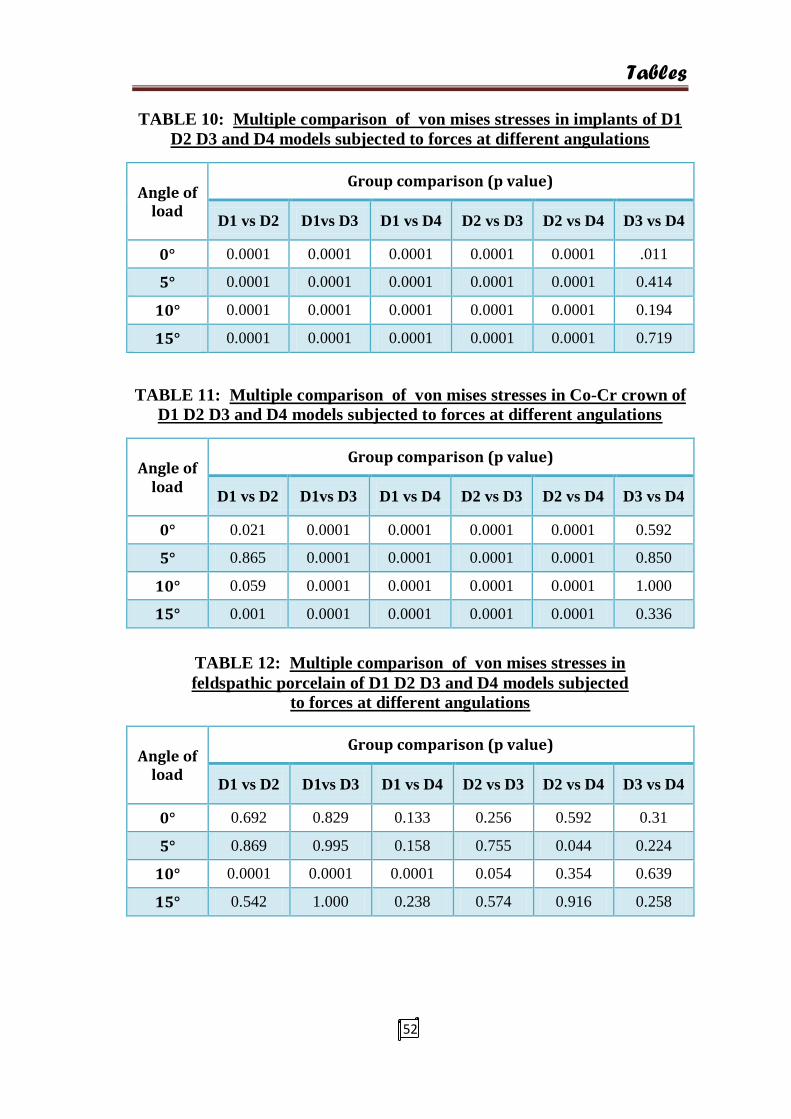
TABLE 10: Multiple comparison of von mises stresses in implants of D1
D2 D3 and D4 models subjected to forces at different angulations
Angle of load
Group comparison (p value)
D1 vs D2 D1vs D3 D1 vs D4 D2 vs D3 D2 vs D4 D3 vs D4
0° 0.0001 0.0001 0.0001 0.0001 0.0001 .011
5° 0.0001 0.0001 0.0001 0.0001 0.0001 0.414
10° 0.0001 0.0001 0.0001 0.0001 0.0001 0.194
15° 0.0001 0.0001 0.0001 0.0001 0.0001 0.719
TABLE 11: Multiple comparison of von mises stresses in Co-Cr crown of
D1 D2 D3 and D4 models subjected to forces at different angulations
Angle of load
Group comparison (p value)
D1 vs D2 D1vs D3 D1 vs D4 D2 vs D3 D2 vs D4 D3 vs D4
0° 0.021 0.0001 0.0001 0.0001 0.0001 0.592
5° 0.865 0.0001 0.0001 0.0001 0.0001 0.850
10° 0.059 0.0001 0.0001 0.0001 0.0001 1.000
15° 0.001 0.0001 0.0001 0.0001 0.0001 0.336
TABLE 12: Multiple comparison of von mises stresses in
feldspathic porcelain of D1 D2 D3 and D4 models subjected
to forces at different angulations
Angle of load
Group comparison (p value)
D1 vs D2 D1vs D3 D1 vs D4 D2 vs D3 D2 vs D4 D3 vs D4
0° 0.692 0.829 0.133 0.256 0.592 0.31
5° 0.869 0.995 0.158 0.755 0.044 0.224
10° 0.0001 0.0001 0.0001 0.054 0.354 0.639
15° 0.542 1.000 0.238 0.574 0.916 0.258
Tables
53
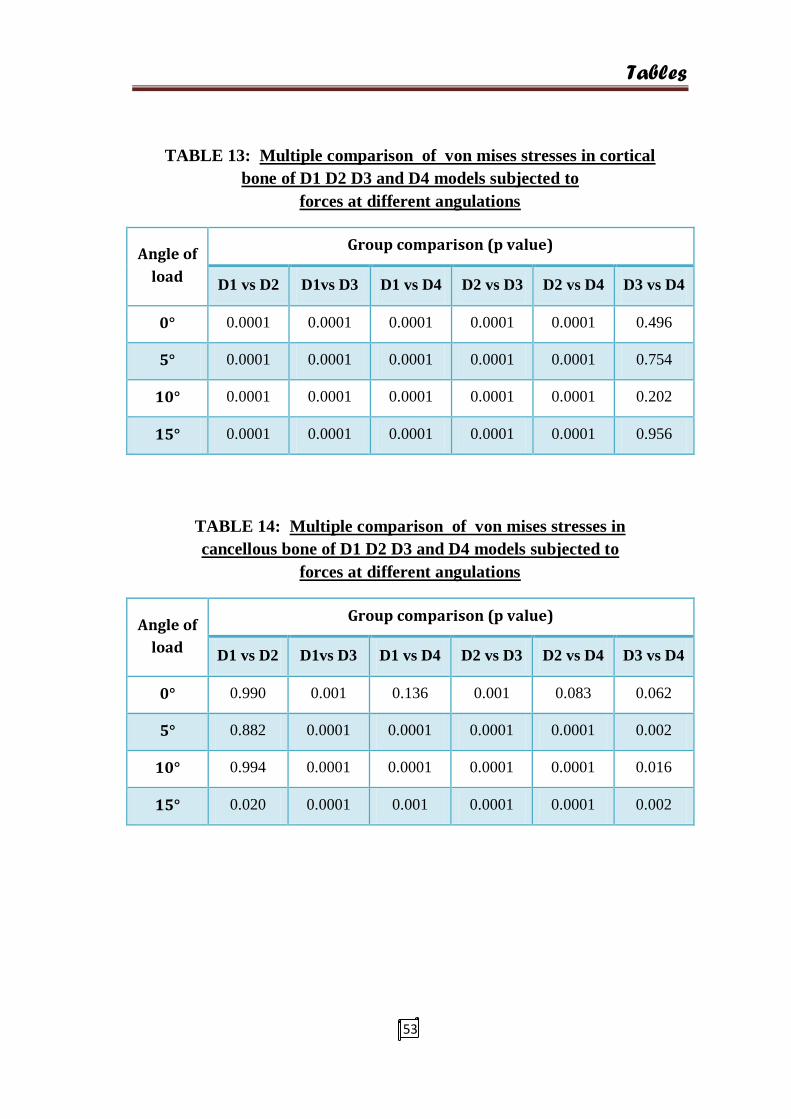
TABLE 13: Multiple comparison of von mises stresses in cortical
bone of D1 D2 D3 and D4 models subjected to
forces at different angulations
Angle of
load
Group comparison (p value)
D1 vs D2 D1vs D3 D1 vs D4 D2 vs D3 D2 vs D4 D3 vs D4
0° 0.0001 0.0001 0.0001 0.0001 0.0001 0.496
5° 0.0001 0.0001 0.0001 0.0001 0.0001 0.754
10° 0.0001 0.0001 0.0001 0.0001 0.0001 0.202
15° 0.0001 0.0001 0.0001 0.0001 0.0001 0.956
TABLE 14: Multiple comparison of von mises stresses in
cancellous bone of D1 D2 D3 and D4 models subjected to
forces at different angulations
Angle of
load
Group comparison (p value)
D1 vs D2 D1vs D3 D1 vs D4 D2 vs D3 D2 vs D4 D3 vs D4
0° 0.990 0.001 0.136 0.001 0.083 0.062
5° 0.882 0.0001 0.0001 0.0001 0.0001 0.002
10° 0.994 0.0001 0.0001 0.0001 0.0001 0.016
15° 0.020 0.0001 0.001 0.0001 0.0001 0.002
Tables
54
ANOVA:
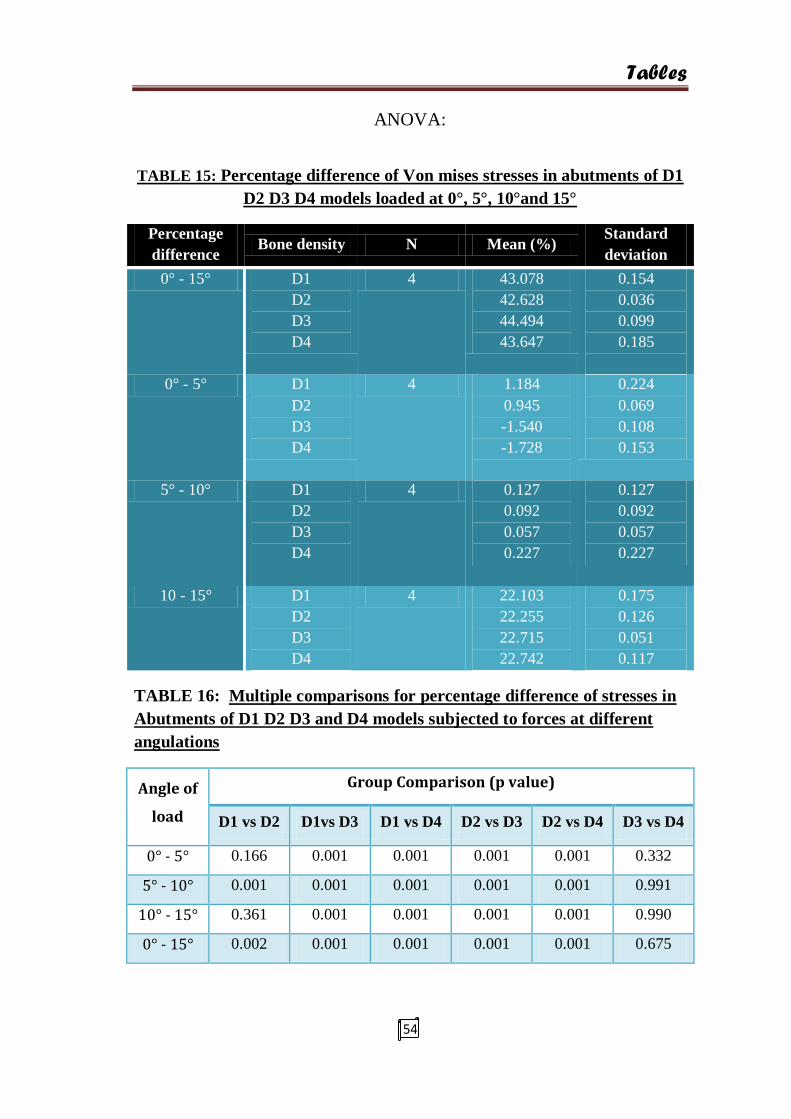
TABLE 15: Percentage difference of Von mises stresses in abutments of D1
D2 D3 D4 models loaded at 0°, 5°, 10°and 15°
Percentage
difference Bone density N Mean (%)
Standard
deviation
0° - 15° D1
D2
D3
D4
4 43.078
42.628
44.494
43.647
0.154
0.036
0.099
0.185
0° - 5° D1
D2
D3
D4
4 1.184
0.945
-1.540
-1.728
0.224
0.069
0.108
0.153
5° - 10° D1
D2
D3
D4
4 0.127
0.092
0.057
0.227
0.127
0.092
0.057
0.227
10 - 15° D1
D2
D3
D4
4 22.103
22.255
22.715
22.742
0.175
0.126
0.051
0.117
TABLE 16: Multiple comparisons for percentage difference of stresses in
Abutments of D1 D2 D3 and D4 models subjected to forces at different
angulations
Angle of
load
Group Comparison (p value)
D1 vs D2 D1vs D3 D1 vs D4 D2 vs D3 D2 vs D4 D3 vs D4
0° - 5° 0.166 0.001 0.001 0.001 0.001 0.332
5° - 10° 0.001 0.001 0.001 0.001 0.001 0.991
10° - 15° 0.361 0.001 0.001 0.001 0.001 0.990
0° - 15° 0.002 0.001 0.001 0.001 0.001 0.675

Tables
55
ANOVA:
TABLE 17: Percentage difference of Von mises stresses in Implant body
of D1 D2 D3 D4 models loaded at 0°, 5°, 10°and 15°
Percentage
Difference Bone density N Mean (%)
Standard
deviation
0° - 5° D1
D2
D3
D4
4 -0.769
-2.801
9.833
10.002
0.054
0.110
0.091
0.086
5° - 10° D1
D2
D3
D4
4 20.796
14.874
10.140
10.160
0.116
0.248
0.037
0.052
10° - 15° D1
D2
D3
D4
4 16.962
18.579
18.881
18.825
0.048
0.130
0.043
0.016
0 - 15° D1
D2
D3
D4
4 33.725
28.749
34.274
34.368
0.044
0.043
0.035
0.046
TABLE 18: Multiple comparisons for percentage difference of
stresses in implant body of D1 D2 D3 and D4 models subjected
to forces at different angulations
Angle of
load
Group comparison (p value)
D1 vs D2 D1vs D3 D1 vs D4 D2 vs D3 D2 vs D4 D3 vs D4
0° - 5° 0.001 0.001 0.001 0.001 0.001 0.076
5° - 10° 0.001 0.001 0.001 0.001 0.001 0.997
10° - 15° 0.001 0.001 0.001 0.001 0.002 0.714
0° - 15° 0.001 0.001 0.001 0.001 0.001 0.400
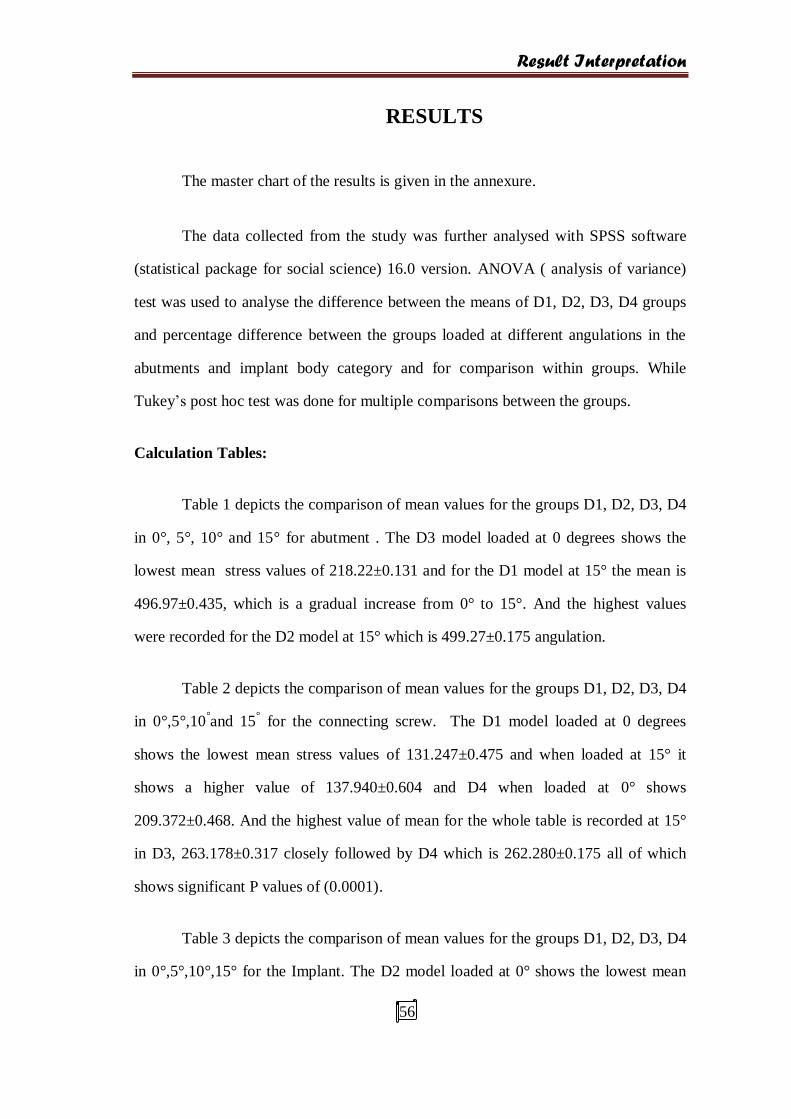
Result Interpretation
56
RESULTS
The master chart of the results is given in the annexure.
The data collected from the study was further analysed with SPSS software
(statistical package for social science) 16.0 version. ANOVA ( analysis of variance)
test was used to analyse the difference between the means of D1, D2, D3, D4 groups
and percentage difference between the groups loaded at different angulations in the
abutments and implant body category and for comparison within groups. While
Tukey’s post hoc test was done for multiple comparisons between the groups.
Calculation Tables:
Table 1 depicts the comparison of mean values for the groups D1, D2, D3, D4
in 0°, 5°, 10° and 15° for abutment . The D3 model loaded at 0 degrees shows the
lowest mean stress values of 218.22±0.131 and for the D1 model at 15° the mean is
496.97±0.435, which is a gradual increase from 0° to 15°. And the highest values
were recorded for the D2 model at 15° which is 499.27±0.175 angulation.
Table 2 depicts the comparison of mean values for the groups D1, D2, D3, D4
in 0°,5°,10°and 15
° for the connecting screw. The D1 model loaded at 0 degrees
shows the lowest mean stress values of 131.247±0.475 and when loaded at 15° it
shows a higher value of 137.940±0.604 and D4 when loaded at 0° shows
209.372±0.468. And the highest value of mean for the whole table is recorded at 15°
in D3, 263.178±0.317 closely followed by D4 which is 262.280±0.175 all of which
shows significant P values of (0.0001).
Table 3 depicts the comparison of mean values for the groups D1, D2, D3, D4
in 0°,5°,10°,15° for the Implant. The D2 model loaded at 0° shows the lowest mean

Result Interpretation
57
stress value of 258.41±0.230 and the highest mean stress values are in D4 at 0° which
is 775.63±0.498 and at 15° it is 1181.8±0.38.
Table 4 depicts the comparison of mean values in the Co – Cr crown in groups
D1, D2, D3, D4 at 0 °,5°,10°,15°. The lowest mean values were recorded in D4 at 0°
as 371.84±0.477 and the highest mean stress values were recorded for D1 at 15° as
675.27±1.100 and all the values had significant P values.
Table 5 depicts the comparison of mean von misses stress values in groups
D1, D2, D3, D4 at 0 °,5°,10°,15° in Feldspathic porcelain. The lowest mean values
were recorded in D4 at 5° as 224.28±0.777 and the mean values recorded at 10° in D1
was 281.27±0.135 and all the values in the table had significant P values of 0.0001.
Table 6 depicts the comparison of mean von mises stress values in groups D1,
D2, D3, D4 at 0 °,5°,10°,15° in cortical bone. The lowest mean values were recorded
in D2 at 0 degrees as 59.312±0.491 and the highest stresses were recorded in D4 at
15° as 295.20±0.097.
Table 7 depicts the comparison of mean stresses in D1, D2, D3, D4 at 0
°,5°,10°,15° in cancellous bone. The lowest mean values were recorded in D2 at 5° as
1.351±0.118, and the highest mean stress values were recorded for D3 at 15°. And all
the values were statistically significant.
Table 8 depicts the multiple inter group comparison of mean stresses by
Tuckey‘s post hoc test in D1, D2, D3, D4 at 0°,5°,10°,15° in abutments which was
highly significant (0.0001) for D1 vs D2, D1 vs D3, D1 vs D4, D2 vs D3, D2 vs
D4.Whereas the D3 vs D4 shown P values as 0.6, 1, 0.9,1 for 0,5,10 and 15 degree
angulations.

Result Interpretation
58
Table 9 depicts the multiple inter group comparison of mean stresses in D1,
D2, D3, D4 at 0°,5°,10°,15° in the connecting screw which was highly significant
(0.0001) for, D1 vs D3, D1 vs D4, D2 vs D3 ,D2 vs D4. Whereas the D3 vs D4
groups showed P values of 0.9, 0.9, 0.02, 0.9 and D1 vs D2 groups showed P values
of 0.1, 0.06, 0.9, 0.4 for 0, 5, 10, 15 degrees.
Table 10 depicts the multiple inter group comparison of mean stresses in the
implant category in D1, D2, D3, D4 at 0°,5°,10°,15° in implant which was highly
significant (0.0001) in D1 vs D2, D1 vs D3, D1 vs D4, D2 vs D3, D2 vs D4 whereas
the p values for D3 vs D4 were 0.01,0.4,0.1,0.7 in 0, 5,10, 15, degrees.
Table 11 depicts the multiple inter group comparison of mean stresses in D1,
D2, D3, D4 at 0°,5°,10°,15° in Co – Cr crown which was highly significant (0.0001)
in D1 vs D3, D1 vs D4, D2 vs D3,D2 vs D4. And P values of 0.02,0.8,0.05,0.001 in
D1 vs D2 and 0.5,0.8,1,0.3 in D3 vs D4 groups.
Table 12 depicts the multiple inter group comparison of mean stresses in D1,
D2, D3, D4 at 0°,5°,10°,15°in Feldspathic porcelain which was significant at 0.05
level for D1 vs D2, D1 vs D3, D1 vs D4, D2 vs D3, D2 vs D4, D3 vs D4 groups.
Table 13 depicts the multiple inter group comparison of mean stresses in D1,
D2, D3, D4 at 0°,5°,10°,15° in cortical bone which was highly significant (0.0001) for
D1 vs D2, D1 vs D3, D1 vs D4, D2 vs D3, D2 vs D4. And the P values were 0.4, 0.7,
0.2, 0.9 for D3 vs D4 groups.
Table 14 depicts the multiple inter group comparison of mean stresses in D1,
D2, D3, D4 at 0°,5°,10°,15° in the cancellous bone which was significant in 0.05 level
for D1 vs D2, D1 vs D3, D1 vs D4, D2 vs D3, D2 vs D4,D3 vs D4.
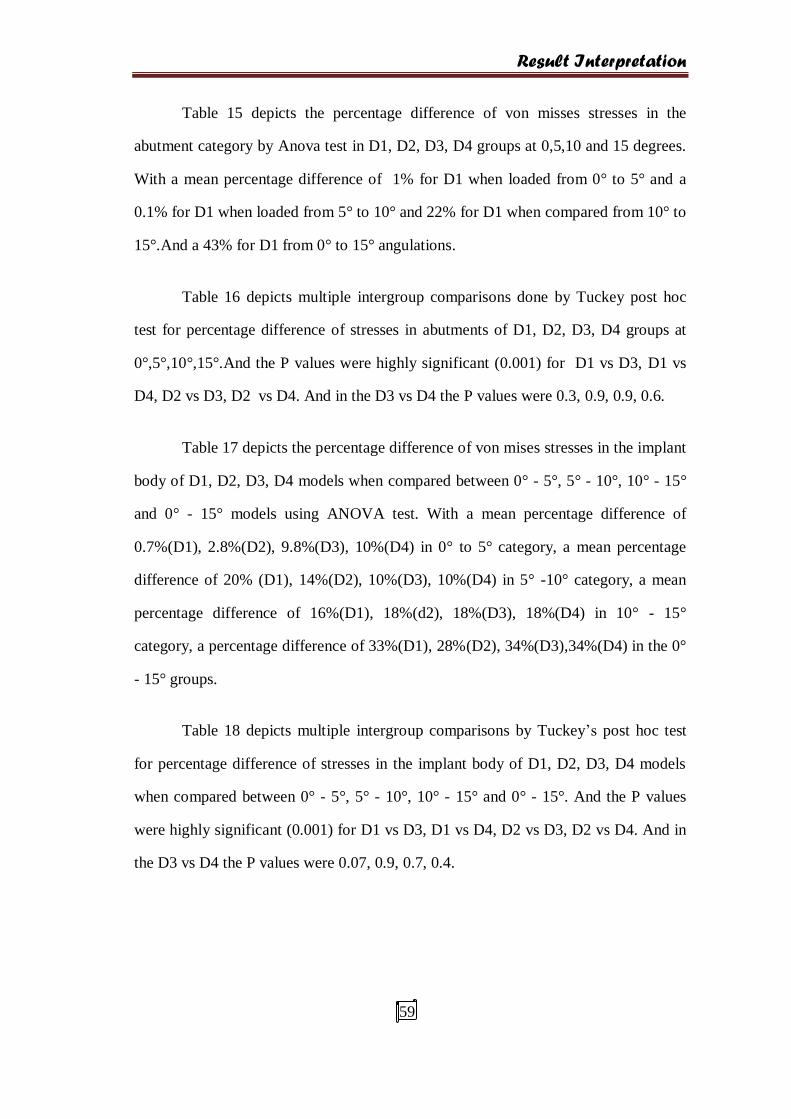
Result Interpretation
59
Table 15 depicts the percentage difference of von misses stresses in the
abutment category by Anova test in D1, D2, D3, D4 groups at 0,5,10 and 15 degrees.
With a mean percentage difference of 1% for D1 when loaded from 0° to 5° and a
0.1% for D1 when loaded from 5° to 10° and 22% for D1 when compared from 10° to
15°.And a 43% for D1 from 0° to 15° angulations.
Table 16 depicts multiple intergroup comparisons done by Tuckey post hoc
test for percentage difference of stresses in abutments of D1, D2, D3, D4 groups at
0°,5°,10°,15°.And the P values were highly significant (0.001) for D1 vs D3, D1 vs
D4, D2 vs D3, D2 vs D4. And in the D3 vs D4 the P values were 0.3, 0.9, 0.9, 0.6.
Table 17 depicts the percentage difference of von mises stresses in the implant
body of D1, D2, D3, D4 models when compared between 0° - 5°, 5° - 10°, 10° - 15°
and 0° - 15° models using ANOVA test. With a mean percentage difference of
0.7%(D1), 2.8%(D2), 9.8%(D3), 10%(D4) in 0° to 5° category, a mean percentage
difference of 20% (D1), 14%(D2), 10%(D3), 10%(D4) in 5° -10° category, a mean
percentage difference of 16%(D1), 18%(d2), 18%(D3), 18%(D4) in 10° - 15°
category, a percentage difference of 33%(D1), 28%(D2), 34%(D3),34%(D4) in the 0°
- 15° groups.
Table 18 depicts multiple intergroup comparisons by Tuckey’s post hoc test
for percentage difference of stresses in the implant body of D1, D2, D3, D4 models
when compared between 0° - 5°, 5° - 10°, 10° - 15° and 0° - 15°. And the P values
were highly significant (0.001) for D1 vs D3, D1 vs D4, D2 vs D3, D2 vs D4. And in
the D3 vs D4 the P values were 0.07, 0.9, 0.7, 0.4.

GRAPHS
Graph 1: Bar diagram Showing Von Mises Stresses
In abutment for D1, D2, D3, D4
Graph 2: Bar diagram Showing Von Mises Stresses In Connecting
Screw for D1, D2, D3, D4
0
100
200
300
400
500
600
0° 5° 10° 15°
D1
D2
D3
D4
ANGLE OF LOAD
STRESS
0
5
10
15
20
25
30
35
40
45
50
0° 5° 10° 15°
D1
D2
D3
D4
ANGLE OF LOAD
STRESS

GRAPHS
Graph 3: Bar diagram showing von mises stresses in
Implant for D1, D2, D3, D4
Graph 4: Bar diagram showing von mises stresses in Co – Cr crown
for D1, D2, D3, D4
0
5
10
15
20
25
30
35
40
45
50
0° 5° 10° 15°
D1
D2
D3
D4
ANGLE OF LOAD
STRESS
0
200
400
600
800
1000
1200
0° 5° 10° 15°
D1
D2
D3
D4
ANGLE OF LOAD
STRESS
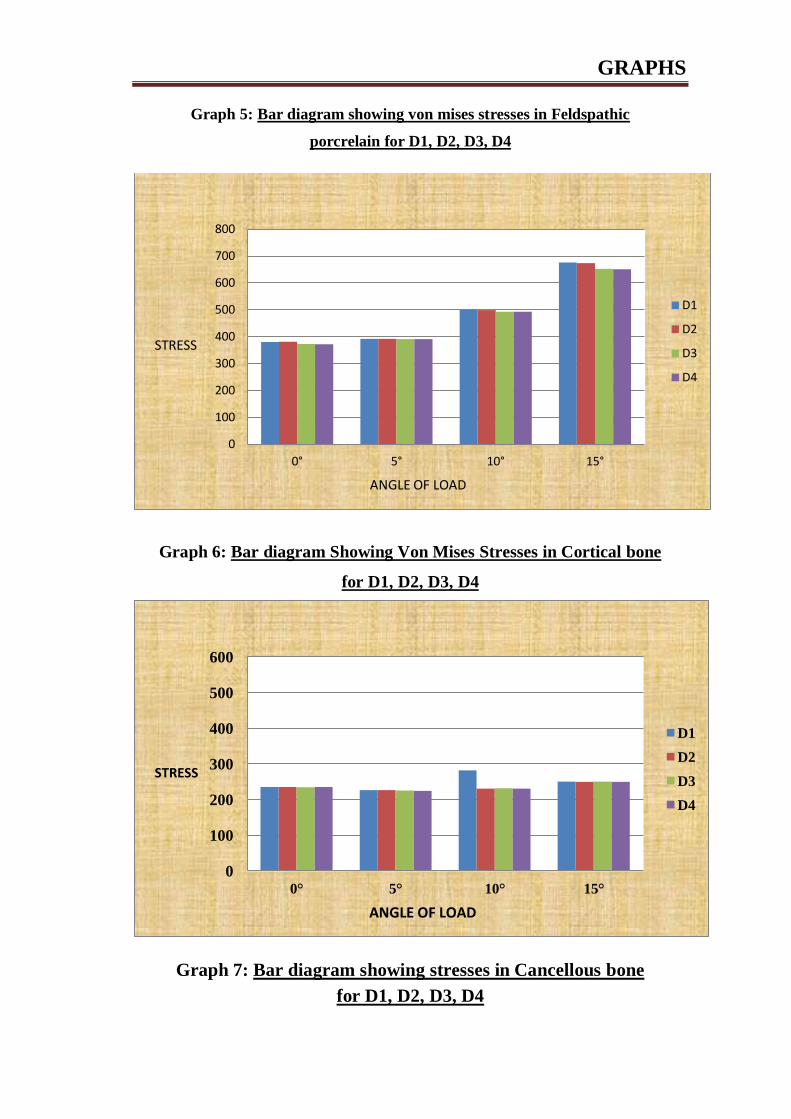
GRAPHS
Graph 5: Bar diagram showing von mises stresses in Feldspathic
porcrelain for D1, D2, D3, D4
Graph 6: Bar diagram Showing Von Mises Stresses in Cortical bone
for D1, D2, D3, D4
Graph 7: Bar diagram showing stresses in Cancellous bone
for D1, D2, D3, D4
0
100
200
300
400
500
600
700
800
0° 5° 10° 15°
D1
D2
D3
D4
ANGLE OF LOAD
STRESS
0
100
200
300
400
500
600
0° 5° 10° 15°
D1
D2
D3
D4
ANGLE OF LOAD
STRESS

GRAPHS
Graph 8: Bar diagram showing percentage difference for stresses
in Abutment for D1, D2, D3, D4 for 0°, 5°, 10° and 15°
0
50
100
150
200
250
300
0° 5° 10° 15°
D1
D2
D3
D4
ANGLE OF LOAD
STRESS (MEAN)
0
5
10
15
20
25
30
35
40
45
50
0° - 5° 5° - 10° 10° - 15° 0° - 15°
D1
D2
D3
D4
ANGLE OF LOAD
STRESS

GRAPHS
Graph 9: Bar diagram showing percentage difference for von
mises stresses in Implant body for D1, D2, D3, D4 for 0°, 5°, 10° and 15°
0
5
10
15
20
25
30
35
40
45
50
0° - 5° 5° - 10° 10° - 15° 0° - 15°
D1
D2
D3
D4
ANGLE OF LOAD
STRESS

Discussion
60
DISCUSSION
Stress in a biologic environment is challenging, more so when there is a
mismatch in relationship between the two materials in this instance modulus of
elasticity of titanium (young’s modulus for Ti is 10 times more than cortical bone and
20 times more for trabecular bone60
) and bone and when the cellular biomechanics
are involved additionally. While this may bring about an imbalance in the stress
patterns which may lead to marginal bone loss eventually affecting the success of the
implant restoration.
Biomechanics In Bone
STRESS: (internal force)
Stress = force/ area
The magnitude of stress depends on two variables,
a. Force magnitude
b. Cross sectional area over which the force is dissipated
so in order to minimize and equally distribute stress the above two dependent
variables has to be regulated but it is not possible for dentist to control the force
completely however the functional surface area can be controlled through careful
treatment planning.
STRAIN: (external force)
Strain = change in length/ original length

Discussion
61
Is the relative change in shape or size of an object due to an externally applied
force.
Strain regulates the cellular activities of bone. When bone has ideal strain the
bone remains organised and load bearing. When the strain is greater, it may be in a
pathologic overload zone61
, which cause bone loss. Therefore it is hypothesised that
occlusal stresses beyond the physiologic limit of bone may result in strain significant
enough to cause bone resorption. After a specific implant system is decided, the only
way to control strain on tissues is to control the applied stress.
Bone is a unique structure that is able to change in relation to a number of
factors including hormones, vitamins, minerals and mechanical impact. However
biomechanical parameters such as amount of strain transmitted to bone are
predominant. In 1888, Kulman62
identified similarities between the patterns of
trabecular bone in the femur and tension trajectories in construction beam concepts
used by Eiffel. In 1892, Wolfe63
elaborated on the same concept and published an
article where he states that bone is constantly modelled and remodelled according to
the biomechanical needs. “Every change in form and function of bone or its function
alone is followed by certain definite changes in the internal architecture and equally
definitive alteration in its external conformation in accordance with mathematical
laws.
In the present study, A total of 16 test runs was done on 4 CAD models in all
four angulations with a load of 300 N56
in order to evaluate the stress distribution
patterns in 7 regions of interest within the model.

Discussion
62
Loading criteria in the Study
The greatest natural forces acting on teeth are those that occur during
mastication64
and the forces applied are perpendicular to the occlusal plane in the
posterior region. Apart from this a constant slight force is supplied by the perioral
musculature and tongue. According to studies the normal maximum bite force ranges
from 45 to 550 psi (200N - 2446N)65
. The maximum bite force for the natural teeth or
implants in the second premolar region is 583 ± 99 N (van eijden56
, 1991). Implants
lack occlusal awareness so the velocity of the occlusal force before contact is not
reduced. Hence the force factors in implant prosthesis are to be thoroughly evaluated
so as deleterious stresses are not generated66
. Hence in this study a 300 N bite force
was assigned for loading the models in order to analyse the implant complex survival
even during the higher end of occlusal forces but also well within the normal bite
forces incurred in the premolar region.
Not only does the magnitude and duration of force plays a significant role in
the survival of the prosthesis but equally important are the mechanical properties of
the implant and the crown superstructure. Titanium as a biocompatible material is
well documenteds1
. Titanium alloy, in comparison with grade 1, grade 2, grade 3,
grade 4 Ti has the highest yield strength of 860MPa67,768
.And a tensile strength of 930
MPa which is greater than most of the restorative materials used in dentistry.
Density :
ρ = m/V ; where m – mass V - volume
Bone density is directly proportional to strength and elastic modulus of bone.
In dense bone there is less stress under a given load when compared with softer bone
types 69,70
The elastic modulus differs for all four qualities in a way that it is more for

Discussion
63
densest bone (D1 type), And the least for the poor bone types. And as the young’s
modulus increases the stiffness of the bone is increased wherein the strength of the
bone is also increased and hence it is more ideal for load bearing.
Von misses stress distribution in different regions within the model:
In the present study the von mises stresses for the abutment, connecting screw
and implant in all 4 implant types were least for the D1, D2 models and highest
stresses are seen in the D3, D4 model. And among them the maximum stresses were
found in the neck of the implant compared to other components.
Adell et al21
conducted a 15 year follow up on 700 people who were regularly
reviewed by annual clinical and radiographic methods. And the survival rates for
maxillary implants were given for 5, 10 and 15 year time interval. And it was
estimated that there was 78% survival at 15 years whereas in maxilla it was 99% at all
time intervals throughout the study and states a 10% increased success rate in anterior
mandible (dense bone) than in anterior maxilla.
Snauwaert et al
29 from his 15 year follow up study on 4971 implants in 1315
patients who were divided into two groups such as physical well and ill patient
(maxilla and mandible) with 6 – 12 month recall period and implant failures were
11.6% in the non - compromised whereas in the compromised patients it was 40.6%
and concluded that too they were more frequent in the maxilla.
Enguist et al71
a retrospective study on implant supported over dentures
which stated that there was more of failures in maxilla even before the loading of the
prosthesis, while the mandibular overdentures showed a survival rate of 99% . And
observed that 78% of all reported implant failures were in poor bone density types in
overdentures.

Discussion
64
Johns B jr72
et al along with Torsten Jemt, Robin Heath MR, conducted a
multicentre study on 133 patients with 117 implants in maxilla and 393 implants in
the mandible and researches reports that most of the failed implants were from the
maxilla and that too with poorer bone qualities.
Robert A jaffin73
et al, carried out a five year study on 1054 branemark
implants placed in different bone types and reported a 3% failure rates out of which
10% of implant failures were found to be in type 4 bone described by the authors as
the ones with thin cortical bone and medullary strength with less dense trabeculae.
Similarly smedberg et al74
conducted clinical trails and reported 36% failure
in poor bone types. Hermann et al found that implant failures were strongly correlated
to patient factors including bone quality especially when combined with poor quality
bone.
This study was conducted in 899 patients as a 3 year follow up by Bertil
Friberg et al, Torsten jemt, ULF Lekholm75
and a total of 4641 branemark dental
implants were followed up right from stage 1 procedure to the completion of final
restoration which revealed only 1.5% failure among them most were the ones in
maxilla in which the bone was resorbed and the overall quality of bone was also poor.
Hutton et al76
conducted a 3 year follow up study involving 133 patients who
were implanted with 510 implants of which a combination of implants and
overdentures were placed in the maxilla and mandible and the failure rates in
maxilla(27.6%) were approximately nine times that of mandibular
overdentures(3.3%). And it was inferred that the patients with the least dense bone
quality were more likely of failures. And as a whole all of these failures were not
principally related to surgical healing but rather happened after prosthetic loading.

Discussion
65
Similarly clinical studies were conducted by Hoar J E77
, Kline R78
,
Steiganga79
, Weng80
, Higuchi D
81, Minsk L
82 and concluded that bone density was a
definite factor for prognosis of implant restoration.
Similar FEA studies were carried out by Mattes danza83
, Tada S84
, Qian L85
,
Himmlova L86
, Sutpideler M87
, Cruz M88
and concluded that the lower the bone
quality, higher the distribution of stress within the bone.
The composite beam analysis88
is an engineering principle that states when
two materials of different elastic modulus are placed together a stress concentration
increase will be seen in where the two materials first come in contact similarly when
two different entities (such as bone and titanium) with different material properties
coexist in a clinical situation the crestal bone and the neck of implant are subjected to
this biomechanical imbalance with augmented stress levels thereby bringing about a
typical V shaped marginal bone loss as it progresses from the crest to the apex of the
implant and the same V shaped stress distribution can be seen in photoelastic and
finite element studies when the implant and surrounding structures were loaded with
occlusal forces89
Bindermann90
et al in 1970 conducted studies on 54 implant models using
two dimensional finite element analysis and concluded that implants tolerated axial
loads better than oblique loads and the highest stresses were recorded at the crestal
regions of the bone.
In this study the maximum stresses were recorded at the neck of the implant
irrespective of the bone qualities and angulation of loads so this area seems to be the
weakest link in the design as this is the region where two different materials with
different young’s modulus meet. Hence under similar mechanical loading conditions

Discussion
66
implants generate greater stress ad strains to the overall bone and at the crest of the
bone compared with natural teeth91
Stress distribution for abutments and implant bodies influenced by
loading angulations:
In the present study the von mises stresses on the abutment recorded a mean of
43% difference in stress values between a abutment loaded at 0° and 15°. A 27%
difference in stresses for 5° and 10° was observed. And a 22% increase for 10° to 15°
with significant P value of (0.001).
The percentage difference recorded for stresses in implant bodies were a mean
of 32% difference in stress values between those loaded at 0° and 15°. A 4% for
implants loaded at 0 and 5 degrees. A 13% between 5° and 10° loaded implants and a
18% increase for 10° and 15° angle difference.
Papavasiliou et al7 along with his colleagues conducted studies on IMZ
implants through FEA simulations to find out the load values where there will be
microfractures he introduced varying conditions such as difference in restorative
materials, the bone quality etc. and reported that oblique forces are deleterious with as
much as a 15% increase in stress levels and a 200N increase in force increased the
levels of stress to about 10 times.
Clelland93
NL et al conducted studies on six implants loaded in three different
angulation to analyse stress distribution patterns by photoelastic strain analysis and
strain gauges and reports that there was significant increase in stress and strain rates
for each increase in angulation of abutments.
Discussion
67
Misch et al98
describes that the magnitude and direction of force are
predominatly determined by patient factors such as age, gender arch location,
masticatory dynamics, crown height, parafunction. Any oclusal load applied to the
implant is divided into,
a. normal force (compressive and tensile)
b. shear force
Not only bone is weakest to shear loads but forces applied at an angle to the
bone also further affects the physiologic limit of the compressive and tensile limits of
the bone and the angled load typically increases the shear component
99. A 15°
angulation of force increases the buccal component of force by 25.9% and a 30 degree
increases it by 50%.
Finite element studies were conducted individually by Soltesez U100
, Akca
K101
, Sertgoz A102
, Ha CY103
, Falk H104
on dental implants which simulated a wide
array of clinical situations with different loading patterns and reported that non axial
loads increased the stresses distributed to the implant and the surrounding bone.
Ko CC et al105
conducted studies on various simulation models through FEA
and elucidated that maximum stresses were on the crest and apex region of the
alveolus. And reported about the middle thirds, however in many studies the stresses
on interfacial region were difficult to analyse due to the complexity of that area. By
utilising the homogenous theory he has also reported microstrain values in the
interfacial zone.
Discussion
68
Barbier and Shepers109
conducted studies on implants loaded in dogs which
were loaded both axially and non – axially and inferred that greater strains were
recorded for the off axis loads.
Rangert B106
conducted a retrospective study on implant fracture with 39
patients as his study group in whom both anterior and posterior implants were taken
into consideration. The study concludes that most of the fractures seemed to take
place in which there was cantilevered load to the implants and other overload
situations such as bruxism.
A similar retrospective study was conducted by Kinsel R P107
wherein he
analysed porcelain failures in implant supported crowns and implant supported fixed
partial dentures. And concluded that there was a seven fold increase in failures in
bruxers, where there is a occlusal overload due to offset shear forces.
Duyck J108
he conducted a invivo study on 13 implant supported full
prosthesis subjected to forces from various angulations and reported that there was a
definite magnification of stresses and that they needed additional implants to bear the
additional loads generated.
It is necessary to conduct further studies to analyse stress distribution in order
to evaluate fatigue failure, microstrains rates for loading at different angulations, and
finally the evaluation of von mises stresses at the unique interfacial zone through
other experimental methods such as strain gauges and photoelasticity should be
undertaken and finally the gold standards such as prospective longitudinal and
multicentre clinical studies are the ones to conform the predictions made from the
finite element analysis presented here.

Summary and Conclusion
69
SUMMARY AND CONCLUSION
Implant dentistry is the second oldest discipline in dentistry. The history of
implants dates back to ancient civilization several thousand years ago. Ages later,
Branemark started experimenting the microcirculation in bone marrow, which lead to
the invention of osseointegration subsequently dental implants in the early 1960’s. In
this study finite element methodology was used to study the stress patterns in seven
different zones of which three of them were the implant parts and the rest four were
the crown superstructures and the surrounding bone.
All four CAD models were created using CATIA V5 R19 software and then
converted into a mesh model by Hypermesh V 13.0 and the final analysis was
conducted by ABAQUS 6.14-2 analysis software by loading at vertical axis and offset
loading with an angle change brought about in increments of 5° scale with a load of
300 N. The result obtained was further subjected to statistical analysis.
Well within the limits of the study, The following conclusions are drawn
1. The highest recorded von mises stresses were in the neck of the implant region
for D1, D2, D3, D4 densities.
2. The von mises stresses for all the seven regions of interest showed highest
values (deleterious stresses) for the D4 bone quality.
3. The least stresses compared to other groups were recorded for all 7 regions in
the D1 model.
4. The highest stresses were recorded for the D1, D2, D3, D4 bone models when
loaded at a 15 degree angulation to the long axis of the implant

Summary and Conclusion
70
5. Likewise, the least stresses among the models loaded in different angulations
were for the 0 degree angulation (parallel to the long axis of the implant
body).
Conclusion:
In conclusion, the findings of the study indicates,
In D1 bone quality (dense) the stresses recorded were less and uniform well
within the limits of the structures involved whereas in D4 bone quality (less
dense) the stresses recorded were of deleterious quality that could bring about
deformation.
The maximum stresses were recorded in the region of neck of the implant for
all four bone models.
The stresses were gradually increased as the angulation of the loading
increases from 0° to 15°.

Bibliography
71
BIBLIOGRAPHY
1. Millennium research group: U.S markets for dental implants 2006 USDI 06,
Toronto Jun 2006.
2. Tatum OH: The omni implant system, Brimingham, AL,1988, Alabama implant
Congress.
3. National institute of health consensus development conference statement of
dental implants, J dent edu. 52.: 824 – 827, 13-15,1988.
4. Farah J W, craig et al finite element analysis of a restored axisymmetric first
Molar J Dent Res. 1974 53(4); 859-66
5. Misch C E: Density of bone : Effect on treatment plans, surgical approach healing
and progressive loading Int J Oral Implantol. 6:23-31,1990.
6. Branemark P.I. ,Zarb G, AlbrekktsonT. Tissue integrated prosthesis.
osseointegration in clinical dentistry Berlin, Germany : quintessesence pub. Co.
inc. 1985;11- 76
7. Papavassiliou G, Kamposiora P, Bayne SC Felton DA.3D FEA of stress
distribution around single tooth implants as a function of bony support, prosthesis
type, loading during function J. Prosthet Dent. 2001;85:585-598
8. Marks SC, Popoff SN. Bone cell biology: The regulation of development,
structure and function in the skeleton. Ann J. Anat183:1-44, 1988.
Bibliography
72
9. Turner C H, Pavalko F M: Mechanotransduction and functional response of
skeleton to physical stress; The mechanisms and mechanics of bone adaptation, J
Orthop. Sci 3:346-355,1998.
10. Crowin S C Moss salentijn L Moss M L. Candidates for the mechanosensory
system in bone J Biomech Engg.113.191 – 197, 1991.
Oct – Dec; 13(4): 225-232
11. Quirynen M, Naert I, Steenberge D, Fixture design and overload influence on
marginal bone loss and fixture success in the Branemark implant system, Clin. Oral
Implants Res. 3; 104 -111, 1992.
12. Misch CE: Bone character; Second vital implant criterion, Dent Today 7:
39 – 40,1988.
13. Misch C E progressive bone loading, Pract Periodont Aesthetic Dent. 2(6);
27-30,1990
14. Misch C E, Qu Z, Bidez B W: Mechanical properties of trabecular bone in the
human mandible implications of dental implant treatment planning and surgical
placement. J Oral Maxillofac.surg. 57:700 – 706, 1999.
15. Reilly D T, A J Burstein, J Biomech 1975
16. A.M .Weinstein, J.J Klawitter, Anand S.C. schuessler R. A 3D finite element
analysis of porous rooted J. Dent Res.1976 Sep – Oct; 55(5):772-7
Bibliography
73
17. A.M. Weinstein ,J.J Klawitter, S.D Cook, Implant bone interface characteristics
of Bioglass dental implants. Journal of Biomedical material research Vol 14 23-29,
(1980)
18. S.D Cook, J,J. Klawitter and A.M Weinstein. The influence of implant elastic
modulus on the stress distribution aroundLTI carbon and Aluminium oxide dental
implant. Journal of Biomedical research Vol. 15 879-887 (1981)
19. Cook S.D, Weinstein A.M, Klawitter J.J. A 3D finite element analysis of a
porous rooted Co- Cr – Mo alloy dental implant J. Dent Res 1982 Jan 61(1) 25 – 9
20. Borchers L. Riechert P. Three dimensional stress distribution around a dental
implant at different stages of interface development. J Dent Res. 1983 Feb; 62 :
1559
21. Adelle R, Lekholm U, Rockler B, et al : A 15 year study of osseointegrated
implants in the treatment of edentulous jaws. Int J Oral Surgery 6;387-416 1981.
22. Reiger M.R. Mayberry M. Brose M.O. Finite element analysis of six endosseous
J. Prosthet Dent 1990 Jun;63(6) : 671-6
23. Bretil Friberg DDS, Phd., Jemt DDS , ULS Lekholm DDS, Phd , Early failures
in 4641, consequetively placed branemark dental implants, A study from stage 2
surgeory to the connection of completed prosthesis 1991, Feb( 142 – 146) . Int. J of
Oral maxillofac. Implants.

Bibliography
74
24. Meijer H.J , Kupier J.H, Starman F.J., Bosmann F. Stress distribution around
dental implants, influence of super structure, length of implants, and height of
mandible. J Prosthet Dent 1992 July;68(1)
25. Rho J, Ashman R.B and Turner C.H . Youngs modulus of trabecular and cortical
bone material, ultrasonic and microtensile measurements. J. Biomech 1993 26(2)
;111-9
26. Meijer H J , Starman F J, Steen W H , Bosmann F. A 3D FEA of bone around
dental implantsin an edentulous human mandible. Arch Oral Biol 1993 Jun;38(6);
491-6
27. Meijer H J , Starman F J, Steen W H , Bosmann F.Loading conditions of
endosseous implants in an edentulous human mandible, A 3D Finite element study
J. Oral Rehabil. 1996 Nov. 23 (11) :757-63
28. Meriscke- stern R. Piotti M sirles G. 3D invivo force measurements on
mandibular implants supporting overdentures . A comparative study Clin Oral
Implant. Res. 1996 Dec.7(4) : 387 – 96
29. Snauwaert K ,Duyck J, Van steenberghe D, Quirynen M, Naert I, time
dependent failure rate and marginl bone loss of implants supported prosthesis a 15
year old follow up study Clin Oral Investig 2000 March 4(1) ; 13 – 20
30. Roxanna stegariou, Haruka kusakari, Shingo nishiyama, Osamu miyakawa,
Influence of prosthesis material on stress distribution in bone and implant. A 3D
finite element analysis Int. J. Oral maxillofac. Implants 1998;13

Bibliography
75
31. Espositio M , Hirsch J M , Lekholm U, Thomsen P. Biologic factors contributing
to failures of osseintegrated oral implants success criteria in epidemiology Eur.
J.Oral Sci 1998 Feb ;106(1):527 – 51.
32. Roynesdal A K , Ambjornsen E, stoone S, Haens H R. A comparative clinical
study of 3 different endosseous implant in edentulous mandible. Int. J Oral
Maxillofac Implants 1998 Jul – Aug ;13(4) ; 000 – 5
33. Teixeria ER, Sato Y, Akagawa Y, Shindoi N; A comparative evaluation of
mandibular FEA models with different lengths and elements for implant
biomechanics J Oral Rehab. 1998 Apr; 25(4):299 – 300
34. David L Cochran. A comparision of endosseus dental implant surfaces J
Periodontol 1999; 70:1523 - 1539
35. Volmer D, Meyer U, Jios U, Veghe A, Piffo J. Experimental and finite element
study of a human mandible. European association for craniomaxillofacial surgeory
2000; 28 :91- 6
36. Beat R Merz , Stephen Hunenback, C Belser, Mechanics of Implant- Abutment
connection. A 8 degree taper compared to a butt joint connection Int. J Oral
Maxillofac Implants 2000: 15;519-526
37. J P Geng , Keson B C, Gui pong liu, Application of FEA in implant dentistry. A
review of literature J P rosthet Dent 2001: 85; 585 – 98

Bibliography
76
38. B. Simesk, Erkan Erkman, Dervis yilmaz, A. Esar, Effects of different inter
implant distances on stress distribution around endosseous implants in posterior
mandible. A 3 D FEA. Med. Engg. Physics 28(2006) 199-213
39. Geng JP, Xu W, Tan KBC, Liu GR. Finite element analysis of a stepped dental
implant J Oral Implantol. 2004 ; 30: 223-233
40. Gary R O’ brian, Aron Gonshor, Alan balfour. A 6 year prospective study of
620 stress diversion surface dental implants. Vol. xxx/no. 6/2004 Journal of oral
implantology
41. M.Sevimay, F Turhan, M A Kilicarlson, G Eskitagliou. 3D effects of different
bone qualities in stress distribution in a implant supported crown. J Prosthet Dent
2005 93 ;227-34
42. Porter J, Von fraunhofer J A, Success and failure of dental implant. A literature
review with treatment consideration Gen. Dent. 2005 Nov – Dec 53 (6) 4323;23
43. Omar Lutfi Koca, Gurcan eskitascioglu, Aslihan Usuamez, 3D FEA on
functional stresses in different bone location produced by implants placed in
maxillary posterior region of sinus floor. J Prosthet Dent 2005;93:38-44
44. M Karl, Winter, A J Dickinson, M G wichman, S M Heckman. Different bone
loading patterns due to fixation of 3 unit and 5 unit implant prosthesis. Australian
Dental Journal 2007; 52(1) ;47-54
45. Heoung J Chun, Ha shik shin, Chong Hung Han, Han Soo Hong Lee.
Influence of implant abutment type on stress distribution in bone under various

Bibliography
77
loading conditions using FEA N ov 2005. The international journal of oral
maxillofacial surgeory
46. Jose Henrieque Rubo,E A Capello Rouza, Finite element analysis of stress in
bone adjacent to dental implants Vol. xxx/no.5 2008 journal of oral implantology
47. G. Arun kumar, B. Mahesh , Dadu George, 3D FEA of stress distribution around
implant in straight angled abutments in different bone qualities J Indian
Prosthodont Soc. Dec 2013 13(4): 466 – 472
48. Marcello bighetti toniollo, A P Marcello, D Palharas, P L caleffi, D B sorgini
mattos. Morse taper implants in in different bone levels: A FEA of stress
distribution Braz. Journal of Oral Sciences Oct/Dec 2012 – Vol. 11 no.4
49. Miyuki Omari, Yuji Sota, Naboru Kitagawa,Yuta Shimora, Manabu Ito. A
Biomechanical investigation of mandibular molar Reproducibility and Validity of
FEA model Int journal of implant dentistry, 2015 1: 40
50. Fellipo Ramos Verri, Ronaldo Silva Cruz, Lemos Batista, Almedia, Gonsales
verri Influence of Bicortical technique in internal connection placed in
premaxillary area by 3D FEA
51. Julius Maninskas, Algridas puisys, Rito Kuopalla, Auna Raustia, G J Balys
The prosthetic influence of biomechanics on periimplant strain: A systematic
literature review of finite element analysis Taylor and Francis online Vol. 20, 2017
Issue 2
Bibliography
78
52. C L De Andrade, M A Carvallho, A B Cury, BS maior, Biomechanial effect of
prosthetic connection and implant body shape in low quality bone of maxillary
posterior single implant supported restoration. The International Journal of oral and
maxillofac.Vol. 31 issue 4 Jul-Aug 2016
53. Lekholm U, Zarb GA: Patient selection and preparation. In Branemark P – I, Zarb
GA, Albrektsson T, Tissue integrated prosthesis,osseointegration in clinical
dentistry,1985 Quintessence
54. Dental implant prosthetics Ed. 2 Carl .E.Misch, DDS, MDS,PhD.
55. Wheeler’s Dental anatomy, physiology, and occlusion 10th
Edition.
56. Van Eijden TM 3D analysis of human bite force magnitude and moment, Arch
Oral Biol, 36:535 – 531, 1991
57. Hrennikoff A 1941. Solutions of problems of elasticity by the framework method
– Journal of applied mathematics 8;4: 169 – 175
58. Courant R.1943. Variational methods for solution of problems of equilibrium and
vibrations. Bulletin of American mathematical society 49:1-23
59. Practical finite element analysis first edition Nitin Gokhale, Sanjay S Deshpande,
Sanjeev V Bedekar, Anand N Thite.
60. Bidez MW, Misch CE: Forces transferrin implant dentistry, basic concepts and
principles, J Oral Implantol18: 264 – 274,1992.
Bibliography
79
61. Frost HM: Mechanical adaptation. Frost’s mechanostat theory. In Martin RB, Burr
DB. Newyork 1989, Raven press.
62. Kulmann C: The graphics statics 1, 1888 Zurich.
63. J Wolff: The gazettes of transformation, Berlin ,1892
64. Picton DC, Johns RB, Wills DJ, et al: The relationship between the mechanisms
of tooth and implant support Oral Sci Rev.5:3 – 22, 1971.
65. Braun S, Bantelon HP Knat WP et al A study of bite force: Angle Orthod65:367
– 372,1995.
66. Haraldson T, Carlsson GE: Bite force and oral function in patients with
osseointegrated implant, Scand J Dent Res. 85:200 – 208, 1977.
67. ASTM F 1472 93. Standard specification for wrought Ti 6Al 4V alloy for surgical
implant application, Philadelphia 1993, American society for testing and materials.
68. ASTM F 136 96: Standard specification for wrought Ti 6Al 4V. Alloy for surgical
implant application, Philadelphia 1996.
69. Browns SA, Lemons JE,: Medical application of Ti and its alloys ASTM
Philadelphia 1996.
70. Rice JC, Cowins SC, Bowman JA: On the dependence of the elasticity and
strength and strength of cancellous bone on apparent density J Biomech 25 ;155-
168, 1988

Bibliography
80
71. Engquist B, Bergendal T, Kallus T et al: A retrospective multicentre evaluation
of osseointegrated implants supporting overdentures. Int J Oral Maxillofac 3 129 –
124,1988.
72. Johns B, Jemt T, Heath MR et al; A multicentre study of overdentures supported
by Branemark implants, Int J Oral Maxillofac implants. 513-522, 1992.
73. Jaffin RA, Berman CL, The excessive loss of branemark fixtures in type IV bone,
A five year analysis J periodontal.62 2-4 1991
74. Smedberg JI, Lothigius E, Bodin L: A clinical and radiological 2 year follow up
study of maxillary overdentures. Oral Clin Imp. Res.4:39-46,1993.
75. Friberg B, Jemt T, Lekholm U. Early failures in, 4641 consecutively placed
branemark dental implants. A study from stage I surgery to the connection of
complete prosthesis; Int J Oral Maxillofac. Implants. 6 142 - 146, 1991
76. Hutton JE, Heath MR, Chai JH : Factors related to success and failure rates of 3
year follow up in a multicenter study of overdentures. Int J Oral Maxillofac
Implants 10 33- 42 1995.
77. Hoar JE, Hazen R, et al. Bone quality based implant system: A prospective study
of first two years of prosthetic loading, J Oral Implantol 25 ;185-197, 1999
78. Kline R, Hoar JE, Beck GH. A prospective multicentre clinical investigation of
bone quality based dental implant system , Implant dent 11 224-234 2002.
79. Steigenga JT, Alshamari KF, Nociti FH, Misch CE. Dental implant design and
its relationship to long term implant success: Implant Dent 12;306-317, 2003.

Bibliography
81
80. Weng D, Jacobson Z, Tarnow D et al : A prospective multicentre clinical trial of
3i machined surface implants, results after 6 years of follow up; Int. J Oral
Maxillofac Implants 18: 417 - 423,2003.
81. Higuchi KW, Folmer T, Kultje C: Implant survival rates in partially edentulous
patient: A three year prospective multicentre study, J Oral Maxillofac Surgery 53:
264 -268 1995
82. Minsk L, Polson A, Wiesgold A, :Outcome failures of endosseous implants from a
clinical training centre, Compend Contin Educ Dent. 17: 848-859, 1996.
83. Mattes Danza, Annalisa palmieri, Francessca farinella, GB Carinni, Spinelli
AG, 3D FEA to detect stress distribution in spiral implant and surrounding bone.
Dent Res J Autum 6(2) 59 – 64 2009
84. Tada s, Stegariou R, Kitamura E. influence of implant design on bone quality on
stress/strain distribution in bone around implants: A 3D FEA, Int J Oral Maxillofac
Implants.18: 357- 368,2003
85. Qian L, Mitsugu T, yasuyuki M, Kiyoshi K: Effects of implant diameter,
insertion depth, loading angle and stress strain fields in implant jaw bone system.
A finite element analysis. Int. J. Oral Maxillofac Imp.2009 Vol 4 5;77-86.
86. Himmlova L, Dostalova T, Kacovsky A Konvickova S. Influence of length and
diameter on stress distribution A FEA:J Prosthet Dent Jan 91(1) 20-5 2004.
87. Cruz M, Wassal T, Toledo EM, Da Silva, Barra LP, Cruz S, Finite element
analysis of dental prosthesis supported by straight and angled abutments. Int J Oral
Maxillofac. Imp:2009 May-Jun;24
Bibliography
82
88. Baumeister T, Avallone EA. Mark’s standard textbook of mechanical engineers
Ed. 8 Newyork, 1978 Mc Grawhill.
89. Kilamura E, Slegariou R, Nomura S. Biomechanical aspects of marginal bone
resorption around osseointegrated implants based in a 3D FEA Clin Oral Implant
Res. 15: 401-412, 2004.
90. Bindemamnn I: NIH grant study on two dimensional FEA study of 54 implant
body designs,1973
91. Cleeland NL, Gilat A : The effect of abutment angulation on stress transfer for an
implant, J Prosthodont 1:24-28,1992.
92. Misch CE, Bidez MW: Occlusion and crestal bone resorption: Etiology and
treatment planning stategies for implants Science and practise of occlusion journal,
Chicago,1997 Quintessence.
93. Soltesez U, Siegele D, Riedmuller J, Stress concentration and bone resorption in
the jaw for dental implants with shoulders. Clinical application of biomaterials,
new york 1982, john wiley.
94. Akca K, Iplikcioglu H Finite element stress analysis of the effect of short implant
usage in place of cantilever extensions in mandibular posterior edentulousness J
Oral Rehabil April 2002 29:4 350 (6).
95. Sertgoz A Guvener S Finite element analysis of the effect of cantilever and
implant length on stress distribution in implant supported prosthesis J Prosthet Dent
Aug 1996, 76(2): 165,9

Bibliography
83
96. Ha C- Y, Lim Y J, Kim M J, The influence of abutment angulation on screw
loosening of implants in anterior maxilla, J Oral Maxillofac Implants 26:45-55,
2011.
97. Falk H, Laurel L, Lundgreen D: Occlusal interferences and cantilever joint stress
in in implant supported prostheses occluding with complete dentures, Int J Oral
Maxillofac Implants 5:70-70-77,1990.
98. Ko CC, Kohn D H, Hollister S J: Micromechanics of implant tissue interfaces, J
Oral Implantol 18;220 – 230,1992.
99. Barbier L and Shepers E:Adaptive bone remodelling around oral implants under
axial and non axial loading conditions in dog mandible, Int J Oral Maxillofac
Implants 12(2);215-223, 1997.
100. Rangert B, Krogh PH, Langer B: Bending overload and implant fracture : A
retrospective clinical analysis, Int J Oral Maxillofac Implants 7:40-44,1995.
101. Kinsel RP, Kin D Retrospective analysis of porcelain failures of metal ceramic
crowns and fixed partial dentures supported by 729 implants in 152 patients:
Patient specific and implant specific predictors of ceramic failure, J Prosthet Dent
101 (6): 388-394,2009.102
102. Duyuck J, Oosterwyck H, Vander Sloten J: Magnitude and distribution of
occlusal forces on oral implants supporting fixed prostheses. An invivo study, Clin
Oral Implants Res 11:465-475,2000

Annexure
84
SL.NO D1(0°) D2(0°) D3(0°) D4(0°)
1. Abutment 283.011
283.033
282.122
283.362
286.363
286.671
286.542
286.172
221.847
221.911
221.432
221.142
221.853
222.331
222.714
221.121
2. Connecting
screw
13.408
13.425
12.422
13.244
12.408
12.777
11.542
12.153
20.612
21.022
21.522
19.932
20.632
21.059
21.546
20.512
3. Implant 538.938
539.555
539.612
539.282
258.598
258.598
257.123
258.323
776.319
776.319
776.721
776.886
776.338
771.183
770.558
775.432
4. Co-Cr 379.130
379.152
380.151
379.540
380.085
381.043
382.142
380.448
372.031
372.681
372.127
372.632
372.039
372.064
371.123
372.121
5. Porcelain 234.700
234.701
234.642
234.612
234.695
234.696
235.512
234.821
234.581
234.684
234.122
234.447
234.581
235.480
235.155
235.742
6. Cortical
bone
64.215
64.159
63.120
64.232
59.163
59.685
58.682
59.721
179.176
179.998
179.332
179.721
179.179
179.648
179.147
178.112
7. Cancellous
bone
1.602
1.663
1.772
1.332
1.392
1.449
1.432
1.822
2.630
3.072
3.357
2.630
2.130
2.226
2.741
2.031
8. Neck of
Implant
539.128
539.121
538.111
538.177
259.121
259.120
259.131
259.322
778.111
778.101
777.110
778.120
777.125
772.121
771.447
777.612
TABLE 1
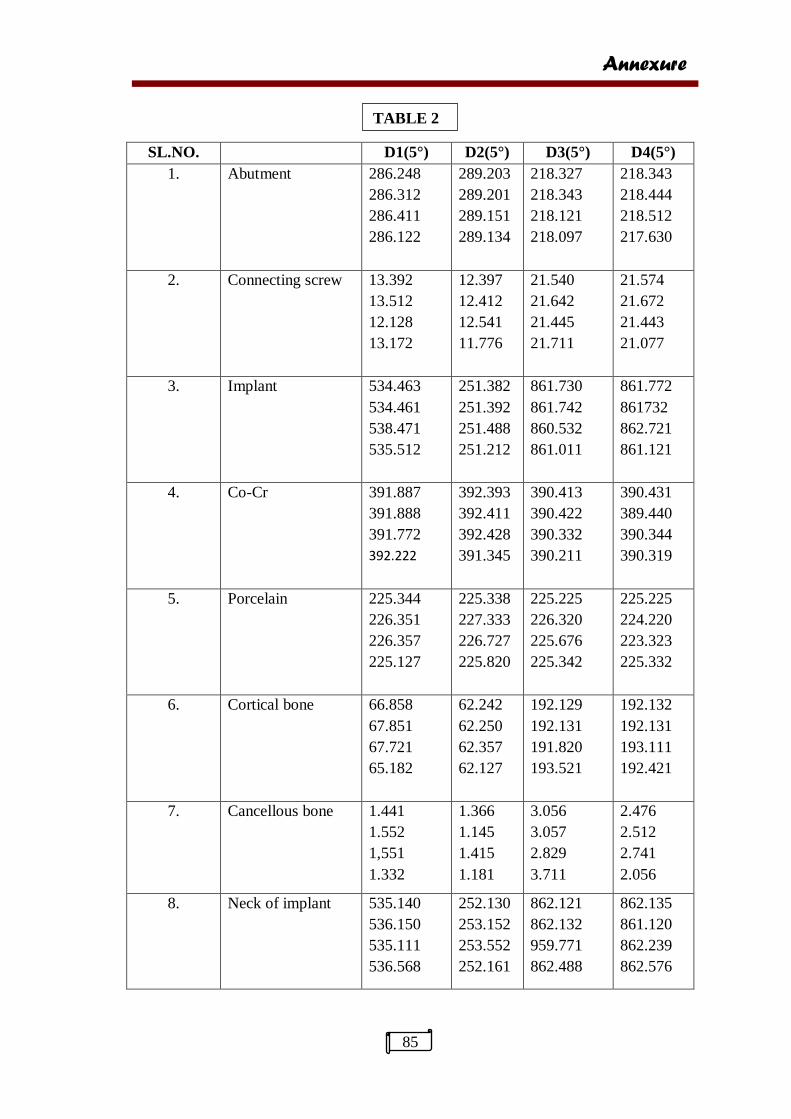
Annexure
85
SL.NO. D1(5°) D2(5°) D3(5°) D4(5°)
1. Abutment 286.248
286.312
286.411
286.122
289.203
289.201
289.151
289.134
218.327
218.343
218.121
218.097
218.343
218.444
218.512
217.630
2. Connecting screw 13.392
13.512
12.128
13.172
12.397
12.412
12.541
11.776
21.540
21.642
21.445
21.711
21.574
21.672
21.443
21.077
3. Implant 534.463
534.461
538.471
535.512
251.382
251.392
251.488
251.212
861.730
861.742
860.532
861.011
861.772
861732
862.721
861.121
4. Co-Cr 391.887
391.888
391.772
392.222
392.393
392.411
392.428
391.345
390.413
390.422
390.332
390.211
390.431
389.440
390.344
390.319
5. Porcelain 225.344
226.351
226.357
225.127
225.338
227.333
226.727
225.820
225.225
226.320
225.676
225.342
225.225
224.220
223.323
225.332
6. Cortical bone
66.858
67.851
67.721
65.182
62.242
62.250
62.357
62.127
192.129
192.131
191.820
193.521
192.132
192.131
193.111
192.421
7. Cancellous bone 1.441
1.552
1,551
1.332
1.366
1.145
1.415
1.181
3.056
3.057
2.829
3.711
2.476
2.512
2.741
2.056
8. Neck of implant 535.140
536.150
535.111
536.568
252.130
253.152
253.552
252.161
862.121
862.132
959.771
862.488
862.135
861.120
862.239
862.576
TABLE 2
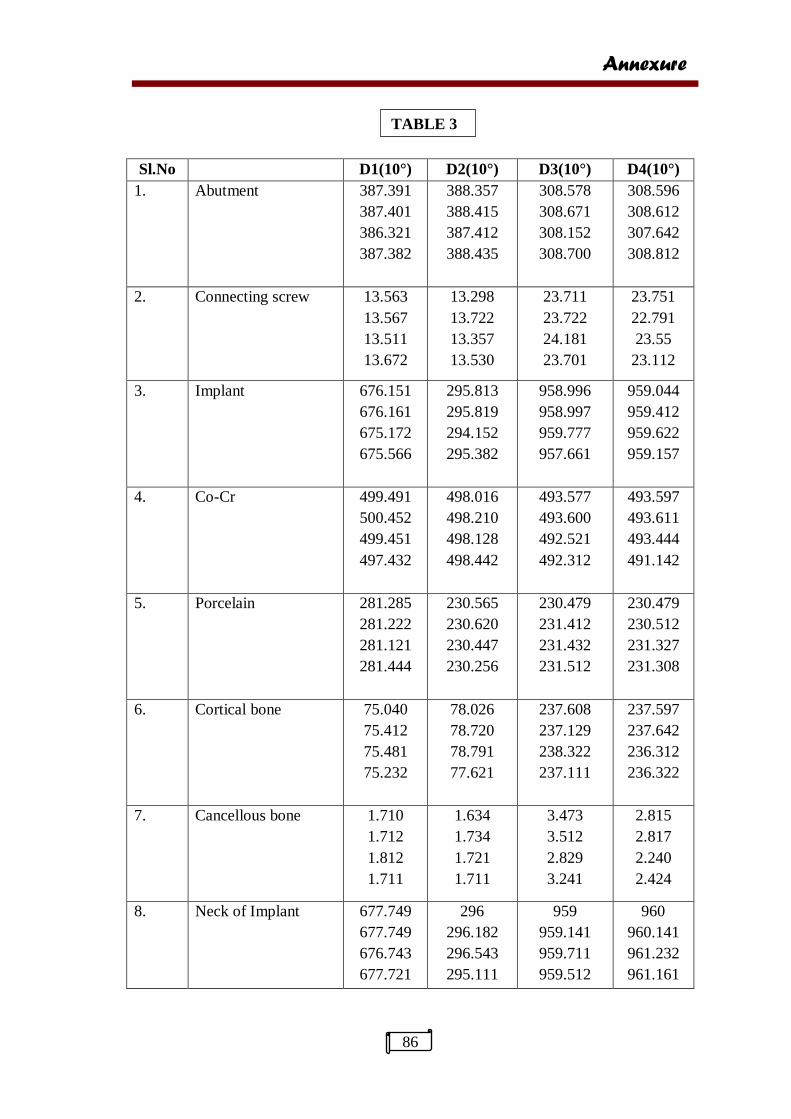
Annexure
86
Sl.No D1(10°) D2(10°) D3(10°) D4(10°)
1. Abutment 387.391
387.401
386.321
387.382
388.357
388.415
387.412
388.435
308.578
308.671
308.152
308.700
308.596
308.612
307.642
308.812
2. Connecting screw 13.563
13.567
13.511
13.672
13.298
13.722
13.357
13.530
23.711
23.722
24.181
23.701
23.751
22.791
23.55
23.112
3. Implant 676.151
676.161
675.172
675.566
295.813
295.819
294.152
295.382
958.996
958.997
959.777
957.661
959.044
959.412
959.622
959.157
4. Co-Cr 499.491
500.452
499.451
497.432
498.016
498.210
498.128
498.442
493.577
493.600
492.521
492.312
493.597
493.611
493.444
491.142
5. Porcelain 281.285
281.222
281.121
281.444
230.565
230.620
230.447
230.256
230.479
231.412
231.432
231.512
230.479
230.512
231.327
231.308
6. Cortical bone 75.040
75.412
75.481
75.232
78.026
78.720
78.791
77.621
237.608
237.129
238.322
237.111
237.597
237.642
236.312
236.322
7. Cancellous bone 1.710
1.712
1.812
1.711
1.634
1.734
1.721
1.711
3.473
3.512
2.829
3.241
2.815
2.817
2.240
2.424
8. Neck of Implant 677.749
677.749
676.743
677.721
296
296.182
296.543
295.111
959
959.141
959.711
959.512
960
960.141
961.232
961.161
TABLE 3
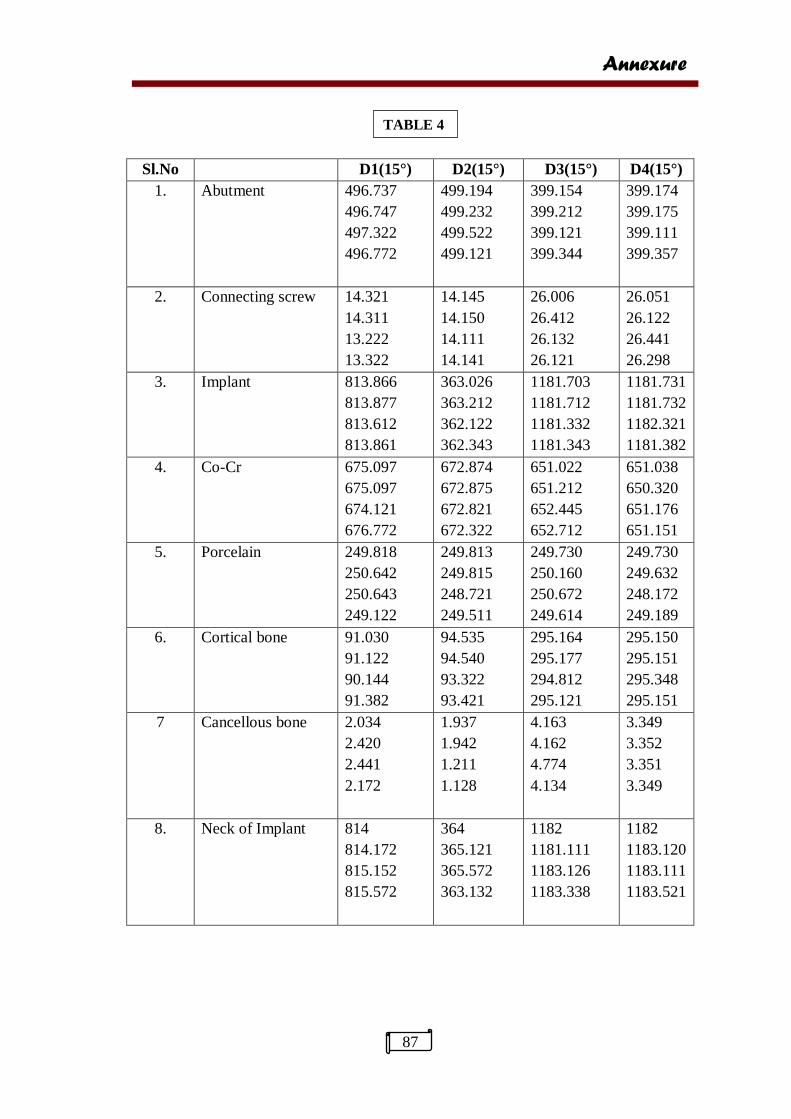
Annexure
87
Sl.No D1(15°) D2(15°) D3(15°) D4(15°)
1. Abutment 496.737
496.747
497.322
496.772
499.194
499.232
499.522
499.121
399.154
399.212
399.121
399.344
399.174
399.175
399.111
399.357
2. Connecting screw 14.321
14.311
13.222
13.322
14.145
14.150
14.111
14.141
26.006
26.412
26.132
26.121
26.051
26.122
26.441
26.298
3. Implant 813.866
813.877
813.612
813.861
363.026
363.212
362.122
362.343
1181.703
1181.712
1181.332
1181.343
1181.731
1181.732
1182.321
1181.382
4. Co-Cr 675.097
675.097
674.121
676.772
672.874
672.875
672.821
672.322
651.022
651.212
652.445
652.712
651.038
650.320
651.176
651.151
5. Porcelain 249.818
250.642
250.643
249.122
249.813
249.815
248.721
249.511
249.730
250.160
250.672
249.614
249.730
249.632
248.172
249.189
6. Cortical bone 91.030
91.122
90.144
91.382
94.535
94.540
93.322
93.421
295.164
295.177
294.812
295.121
295.150
295.151
295.348
295.151
7 Cancellous bone 2.034
2.420
2.441
2.172
1.937
1.942
1.211
1.128
4.163
4.162
4.774
4.134
3.349
3.352
3.351
3.349
8. Neck of Implant 814
814.172
815.152
815.572
364
365.121
365.572
363.132
1182
1181.111
1183.126
1183.338
1182
1183.120
1183.111
1183.521
TABLE 4