Evaluation of the Uncanny Valley in CG Characters of the Uncanny Valley in CG Characters Laura M....
9
Evaluation of the Uncanny Valley in CG Characters Laura M. Flach Rafael H. de Moura Soraia R. Musse Virtual Humans Simulation Lab FACIN/PUCRS Vanderson Dill M´ arcio S. Pinho Virtual Reality Group FACIN/PUCRS Christian Lykawka FACIN/PUCRS Abstract This paper revisits the Uncanny Valley subject in order to evaluate its effects on the perception of characters that currently use computer graphics, animation and computer simulation. It is based on surveys that generated hundreds of samples and showed preliminary results about new criteria and correlations regarding the familiarity of the characters with the public. The analysis of famil- iarity in those characters showed great agreement with the original curve of the uncanny valley. Fu- ture enhancements are then suggested to add new dimensions to the original graph. Keywords:: Uncanny Valley, Computer Graphics, Modern Media, Movies, Games Author’s Contact: {laura.flach,vanderson.dill}@acad.pucrs.br 1 Introduction This paper studies the effects of the uncanny val- ley caused by CG characters, first presented by Mori in 1970 [Mori 1970] for robots. According to his work, robots made too similar to real hu- mans can fall into the ”uncanny valley”, where too high degree of human realism evokes an unpleas- ant impression in the viewer. The increasing ex- posure of virtual characters to the general public motivated our group to test the original hypoth- esis using more up-to-dated samples from movies and games 1 . Our study is an evaluation on how people perceive CG characters that are presented in modern dig- ital media. We try to answer: Does the uncanny valley exists in CG characters? Does previously know the character affects the empathy with it? Moreover, does adding movement to this char- acters changes the shape of the uncanny valley curve, like Mori [Mori 1970] suggested? 1 Images from movies and games where used here for scientific purpose. To answer these questions, we proposed an evalu- ation methodology based on a questionnaire with subjects. First, we selected representative char- acters from recent and well known movies and games, and other characters that are unknown. In order to evaluate the public’s empathy with the chosen characters, we conducted a two-stages questionnaire. In the first stage we presented still images and, in the second stage, videos with the performance of the same characters in the same scenes. As the results, more than two hundred of analysed samples leaded to conclusions that indicated the uncanny valley hypothesis is valid for CG char- acters. The following sections cover the related works on the subject, the model for evaluation (including the details of both surveys), obtained results and final considerations. 2 Related Work In 1970, the roboticist Masahiro Mori [Mori 1970] published a theory on how humans react emo- tionally to artificial beings. According to Mori, robots should not be made too similar to real hu- mans because such robots can fall into the ”un- canny valley”, where too high degree of human realism evokes an unpleasant impression in the viewer. Mori plotted the industrial robots on a hypothetical graph of familiarity versus appear- ance (Figure 1). For creatures, including robots, movement is gen- erally a sign of life [Mori 1970]. As show in Fig- ure 1, adding movement changes the shape of the uncanny valley by exaggerating the peaks and valley. To reproduce human like movements, sim- ilarity of velocity and acceleration are required. For example, a robot has 29 artificial muscles in the face to make human like facial expressions, and laughing is a kind of sequence of face dis- tortions, where the distortion speed is an impor- tant factor. If we cut the speed in half, laughing looks unnatural. This illustrates how slight vari- ations in movement can cause a robot, puppet, or prosthetic hand to tumble down into the uncanny valley. SBC - Proceedings of SBGames 2012 Computing Track – Full Papers XI SBGames – Brasi ́ lia – DF – Brazil, November 2nd - 4th, 2012 108
Transcript of Evaluation of the Uncanny Valley in CG Characters of the Uncanny Valley in CG Characters Laura M....
Evaluation of the Uncanny Valley in CG Characters
Laura M. FlachRafael H. de Moura
Soraia R. MusseVirtual Humans Simulation Lab
FACIN/PUCRS
Vanderson DillMarcio S. Pinho
Virtual Reality GroupFACIN/PUCRS
Christian LykawkaFACIN/PUCRS
Abstract
This paper revisits the Uncanny Valley subject inorder to evaluate its effects on the perception ofcharacters that currently use computer graphics,animation and computer simulation. It is basedon surveys that generated hundreds of samplesand showed preliminary results about new criteriaand correlations regarding the familiarity of thecharacters with the public. The analysis of famil-iarity in those characters showed great agreementwith the original curve of the uncanny valley. Fu-ture enhancements are then suggested to add newdimensions to the original graph.
Keywords:: Uncanny Valley, ComputerGraphics, Modern Media, Movies, Games
Author’s Contact:
{laura.flach,vanderson.dill}@acad.pucrs.br
1 Introduction
This paper studies the effects of the uncanny val-ley caused by CG characters, first presented byMori in 1970 [Mori 1970] for robots. Accordingto his work, robots made too similar to real hu-mans can fall into the ”uncanny valley”, where toohigh degree of human realism evokes an unpleas-ant impression in the viewer. The increasing ex-posure of virtual characters to the general publicmotivated our group to test the original hypoth-esis using more up-to-dated samples from moviesand games1.
Our study is an evaluation on how people perceiveCG characters that are presented in modern dig-ital media. We try to answer: Does the uncannyvalley exists in CG characters? Does previouslyknow the character affects the empathy with it?Moreover, does adding movement to this char-acters changes the shape of the uncanny valleycurve, like Mori [Mori 1970] suggested?
1Images from movies and games where used herefor scientific purpose.
To answer these questions, we proposed an evalu-ation methodology based on a questionnaire withsubjects. First, we selected representative char-acters from recent and well known movies andgames, and other characters that are unknown.In order to evaluate the public’s empathy withthe chosen characters, we conducted a two-stagesquestionnaire. In the first stage we presented stillimages and, in the second stage, videos with theperformance of the same characters in the samescenes.
As the results, more than two hundred of analysedsamples leaded to conclusions that indicated theuncanny valley hypothesis is valid for CG char-acters. The following sections cover the relatedworks on the subject, the model for evaluation(including the details of both surveys), obtainedresults and final considerations.
2 Related Work
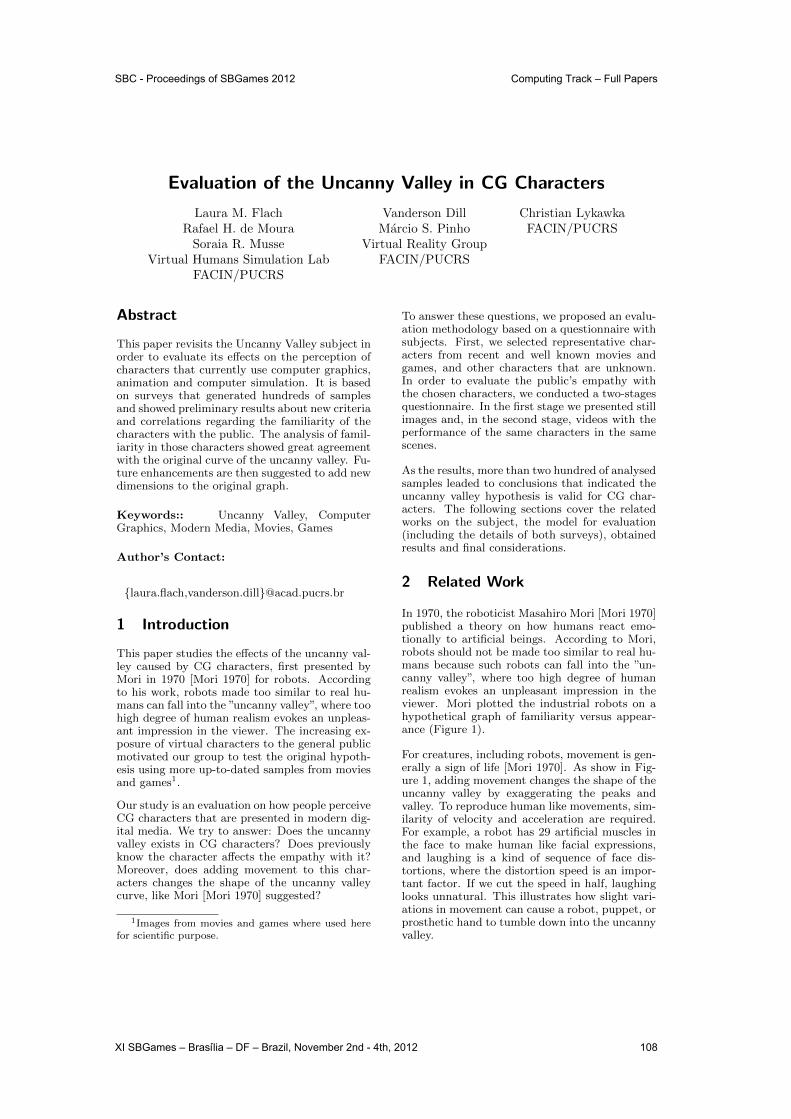
In 1970, the roboticist Masahiro Mori [Mori 1970]published a theory on how humans react emo-tionally to artificial beings. According to Mori,robots should not be made too similar to real hu-mans because such robots can fall into the ”un-canny valley”, where too high degree of humanrealism evokes an unpleasant impression in theviewer. Mori plotted the industrial robots on ahypothetical graph of familiarity versus appear-ance (Figure 1).
For creatures, including robots, movement is gen-erally a sign of life [Mori 1970]. As show in Fig-ure 1, adding movement changes the shape of theuncanny valley by exaggerating the peaks andvalley. To reproduce human like movements, sim-ilarity of velocity and acceleration are required.For example, a robot has 29 artificial muscles inthe face to make human like facial expressions,and laughing is a kind of sequence of face dis-tortions, where the distortion speed is an impor-tant factor. If we cut the speed in half, laughinglooks unnatural. This illustrates how slight vari-ations in movement can cause a robot, puppet, orprosthetic hand to tumble down into the uncannyvalley.
SBC - Proceedings of SBGames 2012 Computing Track – Full Papers
XI SBGames – Brasilia – DF – Brazil, November 2nd - 4th, 2012 108
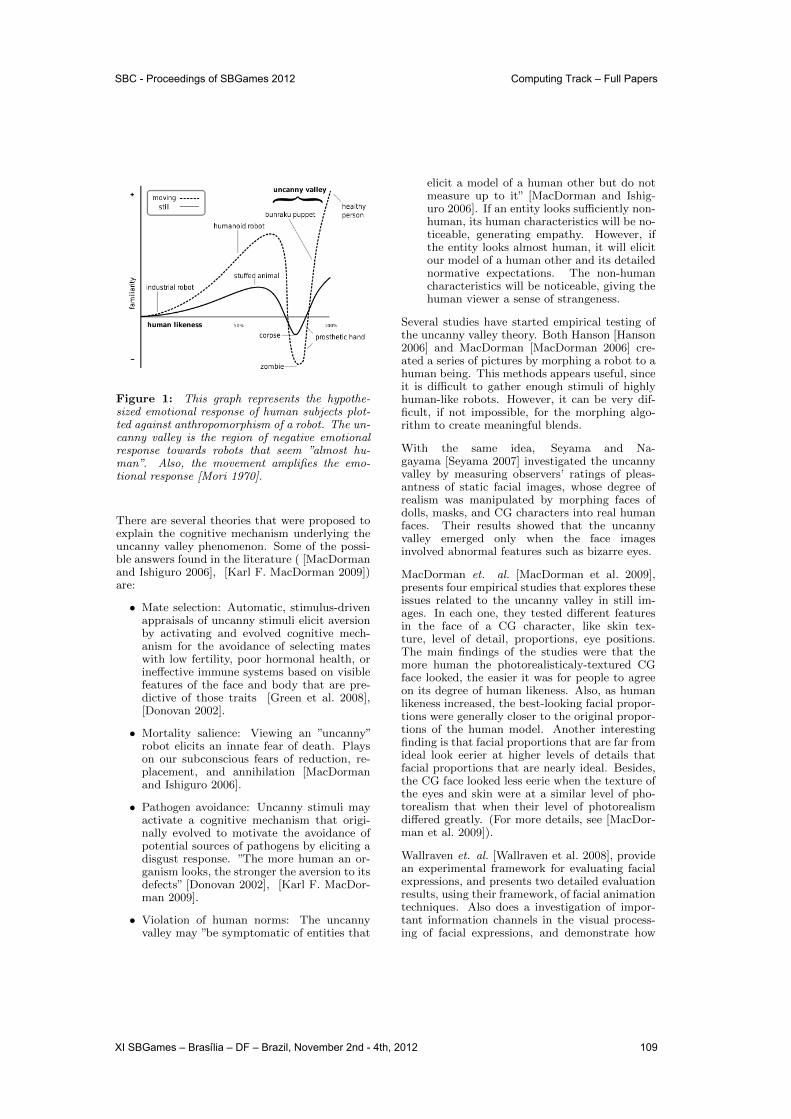
Figure 1: This graph represents the hypothe-sized emotional response of human subjects plot-ted against anthropomorphism of a robot. The un-canny valley is the region of negative emotionalresponse towards robots that seem ”almost hu-man”. Also, the movement amplifies the emo-tional response [Mori 1970].
There are several theories that were proposed toexplain the cognitive mechanism underlying theuncanny valley phenomenon. Some of the possi-ble answers found in the literature ( [MacDormanand Ishiguro 2006], [Karl F. MacDorman 2009])are:
• Mate selection: Automatic, stimulus-drivenappraisals of uncanny stimuli elicit aversionby activating and evolved cognitive mech-anism for the avoidance of selecting mateswith low fertility, poor hormonal health, orineffective immune systems based on visiblefeatures of the face and body that are pre-dictive of those traits [Green et al. 2008],[Donovan 2002].
• Mortality salience: Viewing an ”uncanny”robot elicits an innate fear of death. Playson our subconscious fears of reduction, re-placement, and annihilation [MacDormanand Ishiguro 2006].
• Pathogen avoidance: Uncanny stimuli mayactivate a cognitive mechanism that origi-nally evolved to motivate the avoidance ofpotential sources of pathogens by eliciting adisgust response. ”The more human an or-ganism looks, the stronger the aversion to itsdefects” [Donovan 2002], [Karl F. MacDor-man 2009].
• Violation of human norms: The uncannyvalley may ”be symptomatic of entities that
elicit a model of a human other but do notmeasure up to it” [MacDorman and Ishig-uro 2006]. If an entity looks sufficiently non-human, its human characteristics will be no-ticeable, generating empathy. However, ifthe entity looks almost human, it will elicitour model of a human other and its detailednormative expectations. The non-humancharacteristics will be noticeable, giving thehuman viewer a sense of strangeness.
Several studies have started empirical testing ofthe uncanny valley theory. Both Hanson [Hanson2006] and MacDorman [MacDorman 2006] cre-ated a series of pictures by morphing a robot to ahuman being. This methods appears useful, sinceit is difficult to gather enough stimuli of highlyhuman-like robots. However, it can be very dif-ficult, if not impossible, for the morphing algo-rithm to create meaningful blends.
With the same idea, Seyama and Na-gayama [Seyama 2007] investigated the uncannyvalley by measuring observers’ ratings of pleas-antness of static facial images, whose degree ofrealism was manipulated by morphing faces ofdolls, masks, and CG characters into real humanfaces. Their results showed that the uncannyvalley emerged only when the face imagesinvolved abnormal features such as bizarre eyes.
MacDorman et. al. [MacDorman et al. 2009],presents four empirical studies that explores theseissues related to the uncanny valley in still im-ages. In each one, they tested different featuresin the face of a CG character, like skin tex-ture, level of detail, proportions, eye positions.The main findings of the studies were that themore human the photorealisticaly-textured CGface looked, the easier it was for people to agreeon its degree of human likeness. Also, as humanlikeness increased, the best-looking facial propor-tions were generally closer to the original propor-tions of the human model. Another interestingfinding is that facial proportions that are far fromideal look eerier at higher levels of details thatfacial proportions that are nearly ideal. Besides,the CG face looked less eerie when the texture ofthe eyes and skin were at a similar level of pho-torealism that when their level of photorealismdiffered greatly. (For more details, see [MacDor-man et al. 2009]).
Wallraven et. al. [Wallraven et al. 2008], providean experimental framework for evaluating facialexpressions, and presents two detailed evaluationresults, using their framework, of facial animationtechniques. Also does a investigation of impor-tant information channels in the visual process-ing of facial expressions, and demonstrate how
SBC - Proceedings of SBGames 2012 Computing Track – Full Papers
XI SBGames – Brasilia – DF – Brazil, November 2nd - 4th, 2012 109
the experimental results can be used to improvethe perceptual quality of animation techniques.The most important insights which can be gainedfrom their research are that accurate simulationof facial motion (rigid head motion and non-rigiddeformations) is important for recognizing ani-mated faces fast and accurately, and for perceiv-ing intensity, sincerity and typicality of animatedfaces. The perceived intensity of animated facialexpressions can be increased by enhancing shapeand motion information and including eye mo-tion. As long as motion information is available,degrading shapes and texture does not have a no-ticeable effect on recognition (at least not for theexperimental settings used).
Chaminade et. al. [Chaminade et al. 2007], useda biological motion classification task to investi-gate the influence of discrete variations of ani-mated characters’ appearance on the perceptionof its actions. The participants had to classifya short running motion as ’Biological’ or ’Arti-ficial’, corresponding to the motion capture andkey-framing techniques used to animate the char-acters. They reported that the response of per-ceiving a motion as biological decreases with an-thropomorphism of the characters used to ren-der the motion, and a fMRI investigation foundthat the response bias towards ”biological” is cor-related with an increase of activity in regions ofthe brain involved in mentalizing and a decreaseof activity in regions belonging to the mirror sys-tem. This results suggests that the actions ofcharacters favouring mentalizing, not motor res-onance, are perceived as biological.
Our study is a evaluation on how people perceiveCG characters that are present in daily routine ofusing modern digital media, like watching moviesand playing electronic games. The difference fromprevious evaluations of uncanny valley is the useof CG characters that are ”normal human beings”,i.e. without morphing or any other operation thatcould lead in abnormal features. The charactersused here were created independently and chosenfor cover the widest range possible in terms ofhuman likeness level.
3 Model for Evaluation
The study was guided by a main question:How do people perceive Computer Graphics-made characters? To answer this question, a sur-vey based on a questionnaire was taken. Thequestionnaire was made to answer some primi-tive questions: Can we perceive the uncanny val-ley effect in CG characters? Does it make anydifference in a person’s perception to previouslyknow the character? Does static images and video
lead different perceptions? Additionally, in casea person felt discomfort by looking to a charac-ter, which parts of the face most influenced inthat discomfort? The following topics presentsdetailed descriptions of how the characters andthe questions were chosen, and how the surveyitself was conducted.
3.1 The Characters
A central issue in the construction of an appropri-ate question form is the choice of the charactersbeing presented. Considering the questions thatmust be covered, we tried to choose a not verylarge number of characters to avoid a too longform. Criteria for choosing the characters wereset in order to obtain a group that allowed us tocover all the questions above. The first criterionwas the human likeness of each character. Thisfeature is necessary because it is present in theuncanny valley graph (the horizontal axis). Thesecond criterion was if the characters are or notwell-known, to answer the question about previ-ously knowing the character. Is important to notehere, that it wasn’t necessary to precisely definethese features nor to previously order the char-acters according to them. The goal was to coverthe widest range of features possible.
To cover the human likeness feature, we cho-sen characters intended to represent accuratelya human, like ”Emily” (C.7 in Figure 2). Car-toon characters were chosen to represent the min-imum of human likeness, like ”Mr. Incredible”(C.3). To cover many intermediate possibili-ties in this range, were chosen characters like”Obama’s” cartoon (C.2) and the moustache manfrom the movie ”Cloudy with a Chance of Meat-balls” (C.13).
To evaluate if the character is well-known or notit was taken into account the origin of the char-acter. So, we choosed characters from cinema,like the character of the ”Beowulf” movie (C.6),games, like C.11 from ”Heavy Rain” and C.4from ”Half Life”, and others from the ComputerGraphics community. In general, the populationdoesn’t know the characters C.1, C.5, C.7, C.14,C.15, C.16 and C.17. We assume here that cin-ema is a more comprehensive media than games,older people play less electronic games than watchmovies. Also we include in the set charactersbased on real people, like ”Clint Eastwood”(C.12)and ”Obama” (C.2).
Some constraints were considered when choos-ing the characters. The expression in the videoneeded to be neutral, i.e. no strong emotionsshould be shown by the character. The charac-ter had to be a human being and must be in a
SBC - Proceedings of SBGames 2012 Computing Track – Full Papers
XI SBGames – Brasilia – DF – Brazil, November 2nd - 4th, 2012 110
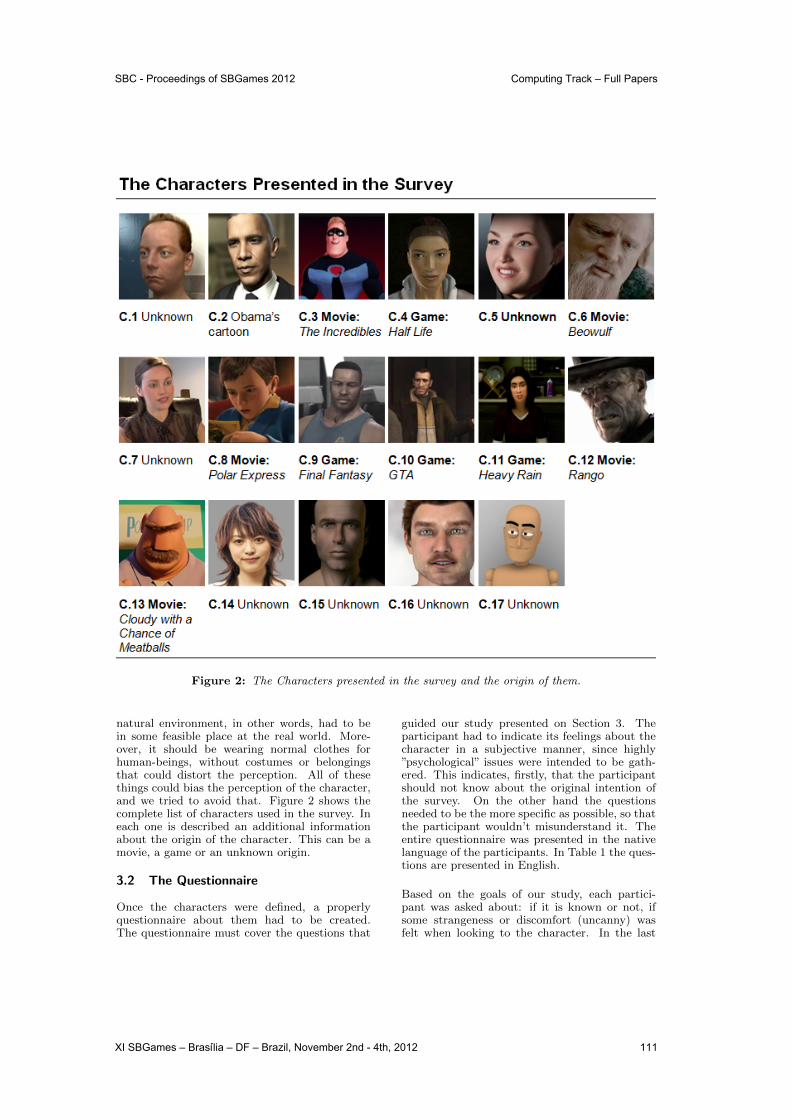
Figure 2: The Characters presented in the survey and the origin of them.
natural environment, in other words, had to bein some feasible place at the real world. More-over, it should be wearing normal clothes forhuman-beings, without costumes or belongingsthat could distort the perception. All of thesethings could bias the perception of the character,and we tried to avoid that. Figure 2 shows thecomplete list of characters used in the survey. Ineach one is described an additional informationabout the origin of the character. This can be amovie, a game or an unknown origin.
3.2 The Questionnaire
Once the characters were defined, a properlyquestionnaire about them had to be created.The questionnaire must cover the questions that
guided our study presented on Section 3. Theparticipant had to indicate its feelings about thecharacter in a subjective manner, since highly”psychological” issues were intended to be gath-ered. This indicates, firstly, that the participantshould not know about the original intention ofthe survey. On the other hand the questionsneeded to be the more specific as possible, so thatthe participant wouldn’t misunderstand it. Theentire questionnaire was presented in the nativelanguage of the participants. In Table 1 the ques-tions are presented in English.
Based on the goals of our study, each partici-pant was asked about: if it is known or not, ifsome strangeness or discomfort (uncanny) wasfelt when looking to the character. In the last
SBC - Proceedings of SBGames 2012 Computing Track – Full Papers
XI SBGames – Brasilia – DF – Brazil, November 2nd - 4th, 2012 111
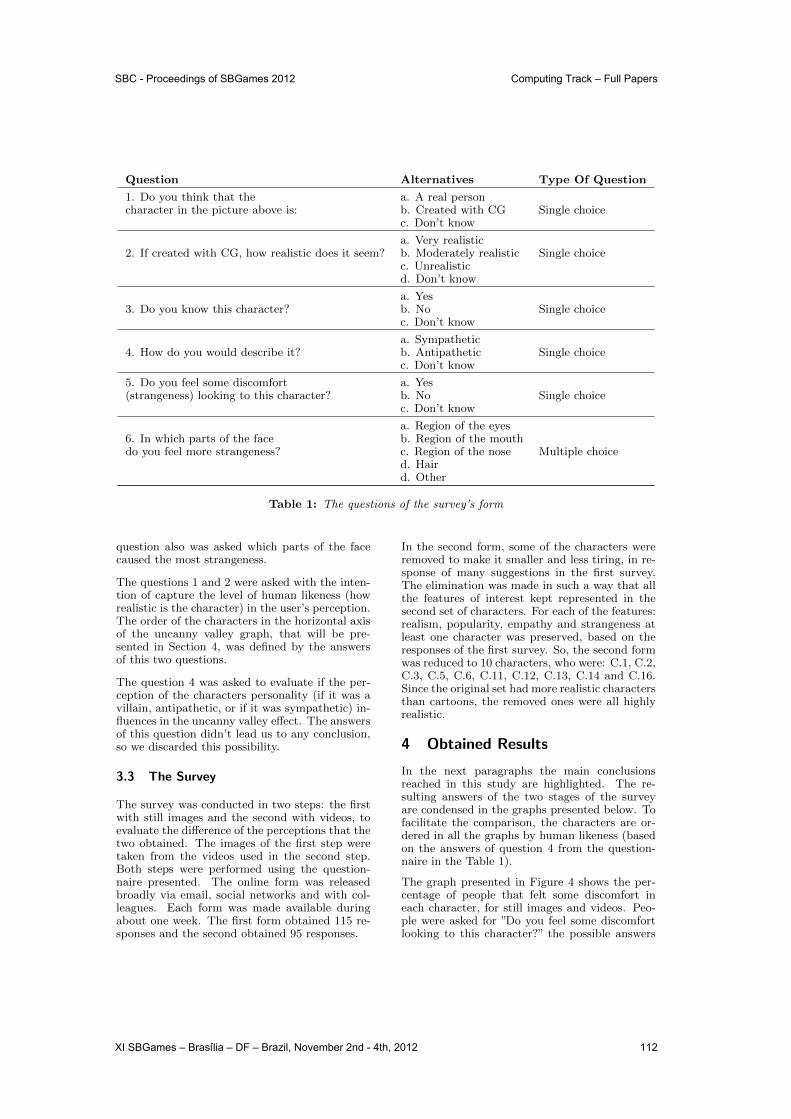
Question Alternatives Type Of Question
1. Do you think that the a. A real personcharacter in the picture above is: b. Created with CG Single choice
c. Don’t know
a. Very realistic2. If created with CG, how realistic does it seem? b. Moderately realistic Single choice
c. Unrealisticd. Don’t know
a. Yes3. Do you know this character? b. No Single choice
c. Don’t know
a. Sympathetic4. How do you would describe it? b. Antipathetic Single choice
c. Don’t know
5. Do you feel some discomfort a. Yes(strangeness) looking to this character? b. No Single choice
c. Don’t know
a. Region of the eyes6. In which parts of the face b. Region of the mouthdo you feel more strangeness? c. Region of the nose Multiple choice
d. Haird. Other
Table 1: The questions of the survey’s form
question also was asked which parts of the facecaused the most strangeness.
The questions 1 and 2 were asked with the inten-tion of capture the level of human likeness (howrealistic is the character) in the user’s perception.The order of the characters in the horizontal axisof the uncanny valley graph, that will be pre-sented in Section 4, was defined by the answersof this two questions.
The question 4 was asked to evaluate if the per-ception of the characters personality (if it was avillain, antipathetic, or if it was sympathetic) in-fluences in the uncanny valley effect. The answersof this question didn’t lead us to any conclusion,so we discarded this possibility.
3.3 The Survey
The survey was conducted in two steps: the firstwith still images and the second with videos, toevaluate the difference of the perceptions that thetwo obtained. The images of the first step weretaken from the videos used in the second step.Both steps were performed using the question-naire presented. The online form was releasedbroadly via email, social networks and with col-leagues. Each form was made available duringabout one week. The first form obtained 115 re-sponses and the second obtained 95 responses.
In the second form, some of the characters wereremoved to make it smaller and less tiring, in re-sponse of many suggestions in the first survey.The elimination was made in such a way that allthe features of interest kept represented in thesecond set of characters. For each of the features:realism, popularity, empathy and strangeness atleast one character was preserved, based on theresponses of the first survey. So, the second formwas reduced to 10 characters, who were: C.1, C.2,C.3, C.5, C.6, C.11, C.12, C.13, C.14 and C.16.Since the original set had more realistic charactersthan cartoons, the removed ones were all highlyrealistic.
4 Obtained Results
In the next paragraphs the main conclusionsreached in this study are highlighted. The re-sulting answers of the two stages of the surveyare condensed in the graphs presented below. Tofacilitate the comparison, the characters are or-dered in all the graphs by human likeness (basedon the answers of question 4 from the question-naire in the Table 1).
The graph presented in Figure 4 shows the per-centage of people that felt some discomfort ineach character, for still images and videos. Peo-ple were asked for ”Do you feel some discomfortlooking to this character?” the possible answers
SBC - Proceedings of SBGames 2012 Computing Track – Full Papers
XI SBGames – Brasilia – DF – Brazil, November 2nd - 4th, 2012 112
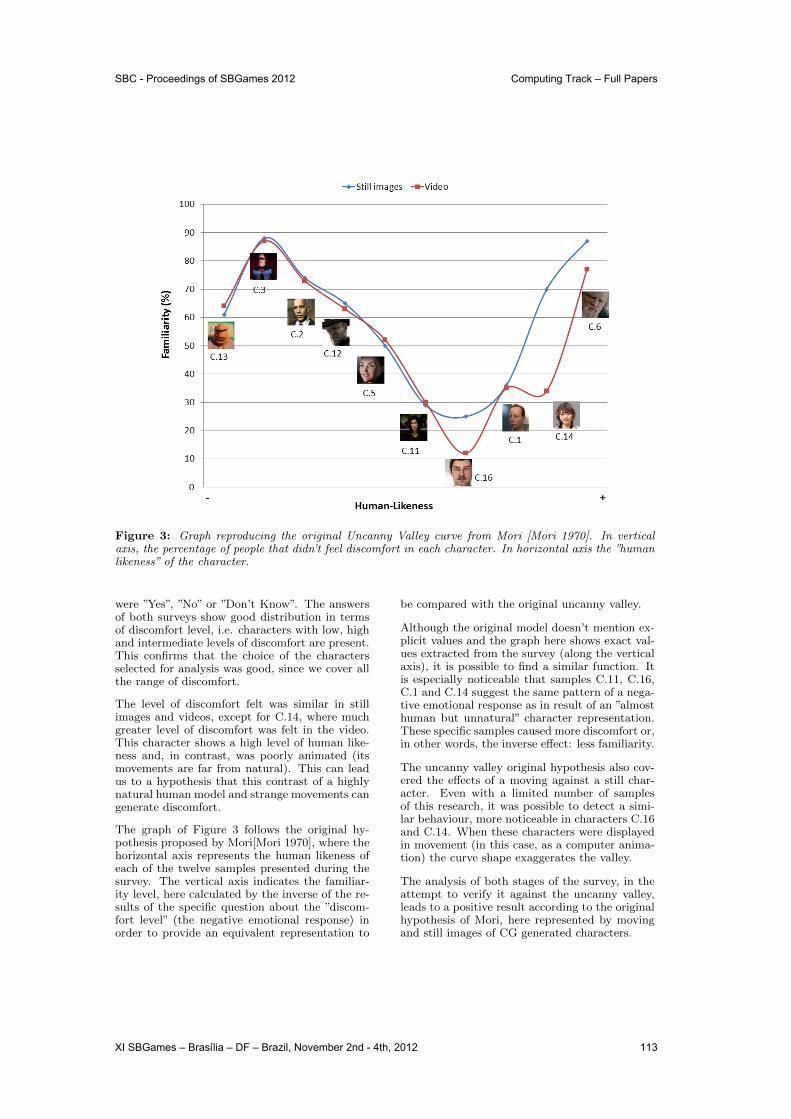
Figure 3: Graph reproducing the original Uncanny Valley curve from Mori [Mori 1970]. In verticalaxis, the percentage of people that didn’t feel discomfort in each character. In horizontal axis the ”humanlikeness” of the character.
were ”Yes”, ”No” or ”Don’t Know”. The answersof both surveys show good distribution in termsof discomfort level, i.e. characters with low, highand intermediate levels of discomfort are present.This confirms that the choice of the charactersselected for analysis was good, since we cover allthe range of discomfort.
The level of discomfort felt was similar in stillimages and videos, except for C.14, where muchgreater level of discomfort was felt in the video.This character shows a high level of human like-ness and, in contrast, was poorly animated (itsmovements are far from natural). This can leadus to a hypothesis that this contrast of a highlynatural human model and strange movements cangenerate discomfort.
The graph of Figure 3 follows the original hy-pothesis proposed by Mori[Mori 1970], where thehorizontal axis represents the human likeness ofeach of the twelve samples presented during thesurvey. The vertical axis indicates the familiar-ity level, here calculated by the inverse of the re-sults of the specific question about the ”discom-fort level” (the negative emotional response) inorder to provide an equivalent representation to
be compared with the original uncanny valley.
Although the original model doesn’t mention ex-plicit values and the graph here shows exact val-ues extracted from the survey (along the verticalaxis), it is possible to find a similar function. Itis especially noticeable that samples C.11, C.16,C.1 and C.14 suggest the same pattern of a nega-tive emotional response as in result of an ”almosthuman but unnatural” character representation.These specific samples caused more discomfort or,in other words, the inverse effect: less familiarity.
The uncanny valley original hypothesis also cov-ered the effects of a moving against a still char-acter. Even with a limited number of samplesof this research, it was possible to detect a simi-lar behaviour, more noticeable in characters C.16and C.14. When these characters were displayedin movement (in this case, as a computer anima-tion) the curve shape exaggerates the valley.
The analysis of both stages of the survey, in theattempt to verify it against the uncanny valley,leads to a positive result according to the originalhypothesis of Mori, here represented by movingand still images of CG generated characters.
SBC - Proceedings of SBGames 2012 Computing Track – Full Papers
XI SBGames – Brasilia – DF – Brazil, November 2nd - 4th, 2012 113
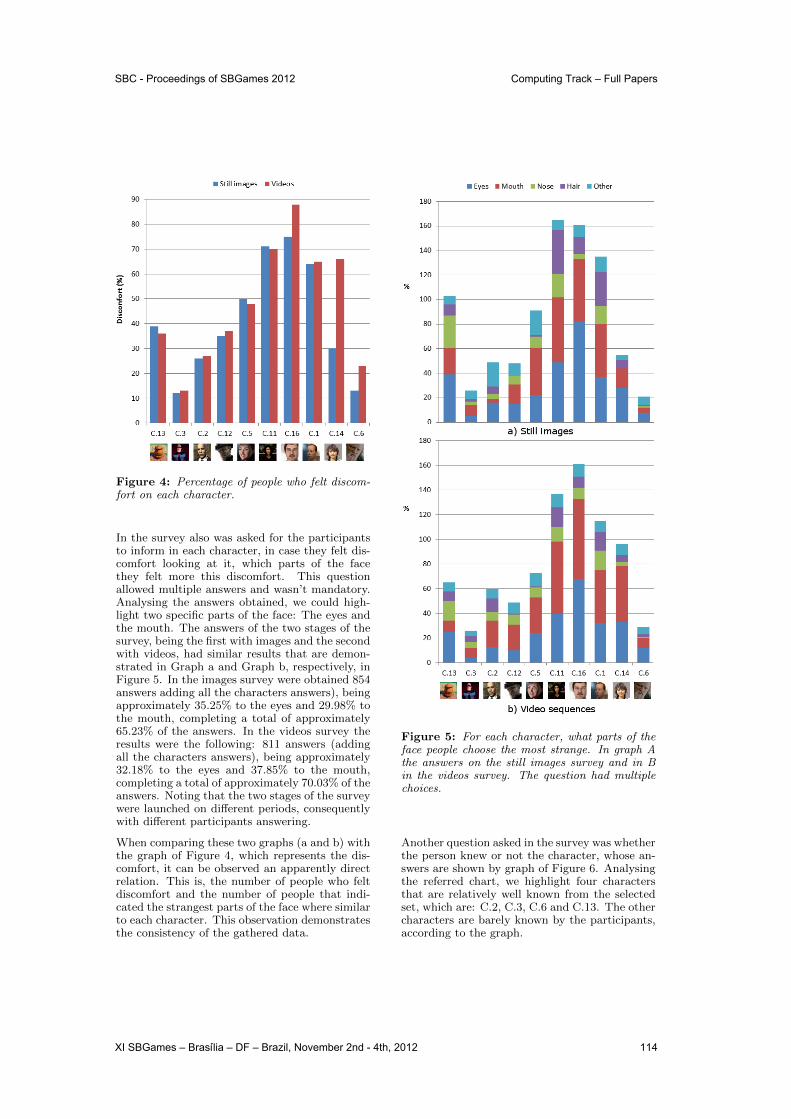
Figure 4: Percentage of people who felt discom-fort on each character.
In the survey also was asked for the participantsto inform in each character, in case they felt dis-comfort looking at it, which parts of the facethey felt more this discomfort. This questionallowed multiple answers and wasn’t mandatory.Analysing the answers obtained, we could high-light two specific parts of the face: The eyes andthe mouth. The answers of the two stages of thesurvey, being the first with images and the secondwith videos, had similar results that are demon-strated in Graph a and Graph b, respectively, inFigure 5. In the images survey were obtained 854answers adding all the characters answers), beingapproximately 35.25% to the eyes and 29.98% tothe mouth, completing a total of approximately65.23% of the answers. In the videos survey theresults were the following: 811 answers (addingall the characters answers), being approximately32.18% to the eyes and 37.85% to the mouth,completing a total of approximately 70.03% of theanswers. Noting that the two stages of the surveywere launched on different periods, consequentlywith different participants answering.
When comparing these two graphs (a and b) withthe graph of Figure 4, which represents the dis-comfort, it can be observed an apparently directrelation. This is, the number of people who feltdiscomfort and the number of people that indi-cated the strangest parts of the face where similarto each character. This observation demonstratesthe consistency of the gathered data.
Figure 5: For each character, what parts of theface people choose the most strange. In graph Athe answers on the still images survey and in Bin the videos survey. The question had multiplechoices.
Another question asked in the survey was whetherthe person knew or not the character, whose an-swers are shown by graph of Figure 6. Analysingthe referred chart, we highlight four charactersthat are relatively well known from the selectedset, which are: C.2, C.3, C.6 and C.13. The othercharacters are barely known by the participants,according to the graph.
SBC - Proceedings of SBGames 2012 Computing Track – Full Papers
XI SBGames – Brasilia – DF – Brazil, November 2nd - 4th, 2012 114

Figure 6: How many people know each characterbefore the survey.
From the answers obtained, we can address thefollowing question: ”Does it make any differencein a person’s perception to previously know thecharacter?”. To answer this question, we anal-ysed the graph of Figure 6, which indicates howknown the character is, and the graph of Figure 3,which indicates the level of familiarity generatedby him. Thus, we hypothesize that well-knowncharacters suggests greater levels of familiarity,since they are located in the higher parts of thecurve presented in the graph of familiarity.
5 Final Considerations
Within this update on the uncanny valley subject,it was possible to validate its persistence undera contemporary scenario: CG generated charac-ters and animations are a rich environment to ob-serve the phenomena. Also, during the study wefound an interesting correlation between the ef-fects of the uncanny valley and the familiarity agiven character has between the public, where thecurve tends to be moderate for those characterspreviously known by the subject.
The subjectivity inherent to this type of evalu-ation leads us to deal with certain imprecisionsthat must be addressed by a considerable numberof participants and generated samples. Duringthis study, the total number of obtained samplesallowed us to work with over two-thousand an-
swers in each of the two stages, which showed tobe plain enough to detect correlations and coverthe criteria defined by the scope of this research.
Future work may be able to revisit the uncannyvalley subject under a similar methodology, in or-der to distinguish better the effects of the techno-logical evolution over the population against thehuman instincts considered as underlying cogni-tive mechanisms proposed as explanation of thephenomenon by the early studies. As a sugges-tion, for instance, the feature ”popularity” herestudied may be used to compound a third vari-able in the original uncanny valley graph, andso the other variables, such as empathy and re-gions of the face most significant for the humanperception for the effect. This study didn’t dis-tinguish between gender, age, neither familiar-ity with animated movies nor computer games,which is also an interesting direction to be evalu-ated more deeply.
References
Chaminade, T., Hodgins, J., and Kawato,M. 2007. Anthropomorphism influences per-
ception of computer-animated charactersaAZactions. Social Cognitive and Affective Neuro-science 2, 3, 206–216.
Donovan, J. M. 2002. Facial Attractiveness:Evolutionary, Cognitive, and Social Perspec-tives. Ablex Publishing, Westport.
Green, R. D., MacDorman, K. F., Ho, C.-C.,and Vasudevan, S. 2008. Sensitivity to theproportions of faces that vary in human like-ness. Comput. Hum. Behav. 24 (September),2456–2474.
Hanson, D. 2006. Exploring the aesthetic rangefor humanoid robots. Proceedings of the CogSciWorkshop Towards social Mechanisms of an-droid science, 206–216.
Karl F. MacDorman, S. K. Vasuvedan, H.C. C. 2009. Does japan really have robotmania? comparing attitudes by implicit and
explicit measures. AI & Society 23 , 485U510.
MacDorman, K. F., and Ishiguro, H. 2006.The uncanny advantage of using androids incognitive and social science research. Interac-tion Studies 7, 3, 297–337.
MacDorman, K. F., Green, R. D., Ho, C.-C., and Koch, C. T. 2009. Too real for com-fort? uncanny responses to computer gener-ated faces. Comput. Hum. Behav. 25 (May),695–710.
SBC - Proceedings of SBGames 2012 Computing Track – Full Papers
XI SBGames – Brasilia – DF – Brazil, November 2nd - 4th, 2012 115

MacDorman, K. F. 2006. Subjective ratingsof robot video clips for human likeness, fa-miliarity, and eeriness: An exploration of theuncanny valley. ICCSCogSci2006 Long Sym-posium Toward Social Mechanisms of AndroidScience Vancouver,, 26–29.
Mori, M. 1970. Bukimi no tani (the uncannyvalley). Energy , 33–35.
Seyama, Junichiro, N. R. S. 2007. The un-canny valley: Effect of realism on the impres-sion of artificial human faces. Presence: Tele-operators and Virtual Environments, 337–351.
Wallraven, C., Breidt, M., Cunningham,D. W., and Bulthoff, H. H. 2008. Evalu-ating the perceptual realism of animated facialexpressions. ACM Trans. Appl. Percept. 4, 4(Feb.), 4:1–4:20.
SBC - Proceedings of SBGames 2012 Computing Track – Full Papers
XI SBGames – Brasilia – DF – Brazil, November 2nd - 4th, 2012 116


![Pygmy: A Ring-like Anthropomorphic Device That Animates ... · input methods for robot and computer graphics (CG) characters. Whadget [7] makes it possible for users to control CG](https://static.fdocuments.us/doc/165x107/5ec8431bc26cba56491e614a/pygmy-a-ring-like-anthropomorphic-device-that-animates-input-methods-for-robot.jpg)