Evaluation of the Suffolk County Juvenile Treatment Court
84
Evaluation of the Suffolk County Juvenile Treatment Court Process and Impact Findings Dana Kralstein Submitted to the U.S. Bureau of Justice Assistance October 2008 RESEARCH 520 Eighth Avenue, 18 th Floor New York, New York 10018 212.397.3050 fax 212.397.0985 www.courtinnovation.org
Transcript of Evaluation of the Suffolk County Juvenile Treatment Court

Evaluation of the Suffolk County Juvenile Treatment Court Process and Impact Findings Dana Kralstein Submitted to the U.S. Bureau of Justice Assistance
October 2008
RESEARCH
520 Eighth Avenue, 18th Floor New York, New York 10018 212.397.3050 fax 212.397.0985 www.courtinnovation.org

Acknowledgements Page i
Acknowledgements
This publication was supported by Grant Numbers 2002-DD-BX-0046 and 2005-DD-BX-K128 awarded by the Bureau of Justice Assistance. The Bureau of Justice Assistance is a component of the Office of Justice Programs, which also includes the Bureau of Justice Statistics, the National Institute of Justice, the Office of Juvenile Justice and Delinquency Prevention, and the Office for Victims of Crime. Points of view and opinions in this document are those of the author and do not necessarily represent the official positions or policies of the U.S. Department of Justice. The author would like to thank all of the Suffolk County Juvenile Treatment Court staff for helping to make this evaluation possible. Caroline Sullivan, Ivonne Garay, Harold Bush, Elaine Annese, Tammy Buckman, and other key stakeholders were especially accommodating throughout the evaluation, not to mention a pleasure with whom to work. Many thanks to those individuals who agreed to speak with us on multiple occasions. Names are omitted here to preserve anonymity, but assistance was provided by staff from many Suffolk County agencies and organizations, including the Suffolk County Family Court, Suffolk County Department of Probation, the Legal Aid Society, the Office of the County Attorney, and several local juvenile substance use treatment facilities. The author would also like to express gratitude to the judges of the Treatment Court for allowing us to observe court proceedings and for making themselves available for candid interviews – the Honorable David Freundlich, the Honorable John Kelly, and the Honorable Gregory Blass. We are grateful to the administrative staff at the courthouse, including Phil Pastore, Linda Affourtit, and since-retired Chief Clerk Robert O’Mara. They graciously allowed two college interns to sit in their records room and pull paper files to do manual data entry about participants in the Treatment Court as well as juveniles that were considered for our comparison group. (This process is described in detail in Chapter Ten.) Thanks also to Mike Rempel, Valerie Raine, Greg Berman, and Kelli Henry from the Center for Court Innovation for ongoing support, comments, and edits on earlier drafts and throughout the evaluation period. Appreciation also to Linda Baldwin, Frank Jordan, and the Honorable Judy Harris Kluger, Deputy Chief Administrative Judge for Court Operations and Planning in New York State. The author would also like to express her gratitude to Maninder Jaswal and Christopher Macchia who spent hours reviewing paper case files and doing manual data entry to support the recidivism analyses. Finally, thanks also to Steve Greenstein and David Vanalstyne of the New York State Division of Criminal Justice Services for providing the Criminal Court recidivism data. The author is solely responsible for the final methodology and results obtained with the DCJS data. Please direct all correspondence to Dana Kralstein, Associate Director of Research, Center for Court Innovation, 520 Eighth Avenue, 18th Floor, New York, New York 10018, e-mail: [email protected].

Table of Contents Page ii
Evaluation of the Suffolk County Juvenile Treatment Court
Process and Impact Findings Acknowledgements i Executive Summary v Chapter One. Introduction 1 Adult Drug Courts 1 Juvenile Drug Courts 1 The Suffolk County Juvenile Treatment Court Evaluation 3 A Note on Data Sources 3 Chapter Two. The Suffolk County Juvenile Treatment Court 5 Referral and Eligibility 6 Family Engagement 10 Phases of Participation 10 Monitoring 11 Sanctions and Rewards 11 Treatment Modalities 13 Graduation Requirements and Program Completion 14 Team Members and Their Perspectives 15 The Judges 15 Coordinator 16 Case Managers 16 Probation 16 Law Guardian 17 County Attorney 18 Treatment 18 Chapter Three. Court Operations 19 Staffing 19 Inside the Courtroom 21 Judicial Interaction 21 Court Responses 21 Chapter Four. Profile of Treatment Court Participants 24 All Participants 24 Demographics 24 School / Employment 24 Family Life 24 Alcohol / Drug Use History 24 Prior Family Court Involvement 27 Instant Case Information 27

Table of Contents Page iii
Chapter Five. The Treatment Process 29 All Participants 29 Predictors of Initial Inpatient Modality 30 Length of Treatment Court Participation 30 Chapter Six. Infractions and Sanctions During Program Participation 32 Methodology 32 All Participants 32 Infractions 34 Sanctions 34 Drug Test Results and Warrants 34 Graduates and Failures 35 Chapter Seven. Achievements and Rewards During Program Participation 38 Methodology 38 All Participants 38 Chapter Eight. Drug Court Retention and Graduation 41 Predictors of Retention 41 Summary 42 Chapter Nine. Literature Review: Prior Impact Studies 43
Randomized Trials 43 Studies with a Clearly Defined Comparison Group and Attempts to Control for Selection Bias 48 Studies with Ambiguity about the Comparison Group Design 49 Cost-Benefit Analysis 52 Summary of Prior Impact Findings 52
Chapter Ten. Impact Methodology 54 Comparison Group Identification 54 Comparing the Two Samples 55 Utilization of Propensity Scores 55 Recidivism Periods and Measures 57 Chapter Eleven. Impact Analysis 58 Impact on Post-Petition Recidivism 58 Impact on Post-Program Recidivism 59 Impact of Case Type 61 Impact of Graduation/Failure Status 62 Predictors of New Cases 63 Summary 63

Table of Contents Page iv
Chapter Twelve. In Their Own Words 64 Treatment Court Motivation 64 Advice for Treatment Court Staff 65 Home and School 66 Impact on Future Criminal Behavior and Drug Use 66 Chapter Thirteen. Conclusion 68 References 70
Appendix A. Structured Staffing and Court Observation Form 73 Appendix B 74 Appendix B-1. Intake Characteristics of Participants and Comparison Group Using Three Different Methods To Control for Selection Bias 74 Appendix B-2. Recidivism Outcomes Using Three Different Methods to Control for Selection Bias 75
Executive Summary Page v
Executive Summary
Almost 20 years after the first one opened in Miami, Florida in 1989, drug courts have become an integral part of justice systems across the county. While most drug courts mandate adult criminal defendants to court-supervised treatment in lieu of jail or prison, there are currently more than 450 juvenile drug courts seeking to adapt the adult model to a younger population. Juveniles pose unique challenges for the drug court intervention. They tend to be less seriously addicted to drugs than their adult counterparts. They have different life experiences, brain development, and family relationships. While there is a growing body of research indicating that adult drug courts reduce recidivism, much less is known regarding the effectiveness of the juvenile model. The literature that does exist is decidedly mixed; many studies report that juvenile drug courts have no impact. This study reports the results of an evaluation of the Suffolk County Juvenile Treatment Court, one of the first juvenile drug courts to open in New York State.
Methodology
The study included both a process and impact evaluation. The former was based on a combination of staff and stakeholder interviews, structured courtroom observations, review of policy and procedure documents, and analyses of official data related to participant background characteristics, treatment, compliance, sanctions, and retention. The impact evaluation utilized a “pre-post” quasi-experimental design, comparing 154 participants enrolled from program inception in February 2002 through October 2004 with 191 similar young people whose cases originated in the previous year (2001). All youth were tracked over two periods: (1) a two-year period after filing of the initial family court petition (“post-petition recidivism”) and (2) a two-year period after program exit or final disposition (“post-program recidivism”). Propensity score modeling techniques were used to adjust for differences in the background characteristics between the participant and comparison samples. In addition, two focus groups were conducted with 10 total participants to obtain their perceptions of the drug court.
Participant Characteristics
• Demographics: The 154 drug court participants enrolled from February 2002 through
October 2004 were mostly male (79%), white (83%), and averaged just under 15 years of age.
• Family Court Involvement: Almost three-quarters (71%) were involved in a prior family
court case, and almost half (48%) had another family member involved in a prior case. • Drug Use History: On average, participants reported first using drugs just before
reaching the age of 13. Although marijuana was listed as the primary drug of choice by most (93%), many participants also reported use of cocaine (34%), hallucinogens (25%) and designer drugs (22%, e.g. ecstasy).
Executive Summary Page vi
The Drug Court Participation Process • Treatment: Most (79%) participants were initially assigned to an outpatient treatment
facility, enabling them to continue living at home. • Compliance: Nearly three-quarters (73%) of participants had at least one positive drug
test during their participation, and 25% had at least one bench warrant issued in response to absconding (disappearing from program contact).
• Sanctions: Nearly half (43%) of participants had at least one intermediate sanction
imposed during their participation. The most common sanctions were a remand to a secure or non-secure facility, usually for 1-3 or 1-5 days, as well as community service.
• Rewards: Drug court practitioners and child development specialists often posit that as
compared with adult populations, juveniles may be more motivated by incentives and encouragement (rewards) than by negative responses (sanctions). More than half (61%) of participants in the Suffolk County Juvenile Treatment Court received at least one reward, including verbal praise, a phase advancement certificate, sober coins, or tickets to a recreational event. Rewards were given to acknowledge achievements such as a month without positive drug tests or the completion of a phase of treatment.
• Time to Completion: Overall, it took an average of 17.4 months for participants to
graduate from the Treatment Court. For those who ultimately failed, it took an average of 12.1 months to be terminated.
• Program Retention Rate: A retention rate indicates the ability of a drug court to keep its
participants engaged over time. The Federal Office of Juvenile Justice and Delinquency Prevention released a report (OJJDP 2001) citing retention rates in seven “exemplary” juvenile drug courts as ranging from 56% to 77% (median = 69%). Results at the Suffolk County Juvenile Treatment Court compare favorably to these figures, as the Court achieved a one-year retention rate of 87%.
• Program Graduation Rate: Both the two-year and three-year retention rates are 79%,
which translates into an estimated graduation rate in the range of 73% to 76%. This graduation rate compares favorably to the 48% national average graduation rate for adult drug courts estimated by the Congressional Government Accountability Office (1997).
Staffing and Courtroom Proceedings
Evaluators observed seven full days of staffing meetings and court sessions, involving
110 total cases.
• Length of Each Appearance: On average, each court appearance took just about two minutes (average = 1.94 minutes).
Executive Summary Page vii
• Judicial Interaction: The judge frequently offered supportive comments (61% of appearances) or asked about the juvenile’s family life (51%). The judge offered admonishing comments in 21% of the observed appearances. For participants with a “poor” compliance report, 78% of the decisions made at the staffing meeting involved a recommendation to impose a sanction; but at the court appearance, the judge in fact imposed a sanction significantly less often (in 48% of those cases).
• Family Involvement: A parent was present for just over two-thirds of the appearances
(69%).
Impact of Juvenile Treatment Court
• Overall Impact: The juvenile drug court did not produce a significant reduction in recidivism. At two years post-petition, 42% of participants (both graduates and failures) and 39% of the comparison group were re-arrested; at two years post-program, 29% of participants and 31% of the comparison group were re-arrested (differences were not statistically significant).
• New Charges: At two years post-program, among those who were re-arrested,
participants in the drug court appeared less likely to be re-arrested for a felony (39% vs. 59%) and more likely to be re-arrested for a misdemeanor (73% vs. 64%) than those in the comparison group, although these differences were not statistically significant.
• Predictors of Recidivism: Among both participants and comparison youth, males and
those involved in a prior family court petition were especially likely to be re-arrested.
• Role of Graduation: Graduates were significantly less likely to be re-arrested than those who failed at two years post-program (18% vs. 48%).
• Goals of the Juvenile Treatment Court: Recidivism is one of many goals of juvenile
treatment courts. Other goals that we were unable to measure include improvement in home life and social functioning, increased attendance and performance at school, and reduced use of drugs in the future.
Participant Feedback
Two focus groups were held with active Treatment Court participants in the Spring of 2006, one in an inpatient facility and the other in an outpatient facility, both commonly used by the Treatment Court.
• Intermediate sanctions: Participants expressed that the most effective sanction for motivating future compliance was a short-term remand or the threat of being “locked up.”
• Perceived program impact: Overall, the participants reported that they had become more
responsible at home, fought with siblings and parents less often, and worked more on their relationships. About half of the focus group participants thought that they might use
Executive Summary Page viii
drugs again. They all identified marijuana as the only drug they would consider and believed they would decrease their overall frequency of use due to their involvement in the drug court.
• Referring a friend: All but one participant said that they would advise a friend to
participate in the drug court if the friend was arrested.
Conclusion
The results of the process evaluation indicate that Suffolk County Juvenile Treatment Court is a well-implemented program that has achieved a remarkably high retention rate of 87% after one year. Across two focus group sessions, participant feedback was generally positive. The impact evaluation did not detect any significant differences between the re-arrest rates of participants in the drug court and the comparison group. Of 20 recidivism studies of juvenile drug courts nationwide, seven have elicited positive results, five have elicited negative results, and eight – including this evaluation – have elicited either no difference or mixed results depending on the specific recidivism measure.
It is worth noting that this study did not investigate the impact of the juvenile drug court
on other outcomes, such as drug use, school performance, or measures of social and emotional development. Qualitatively, when the participants were asked in focus groups about the program’s effect, they say that they are “smarter” now, fight with their families less, perform better in school, have their lives in perspective, and do not intend to use drugs again. There is a need for more research in these areas, as well as policy analysis regarding what kinds of goals are realistic for participants in juvenile drug courts.

Chapter One Page 1 of 75
Chapter One: Introduction
Nearly 20 years after the first drug court opened, such courts have become an integral part of justice systems across the country and abroad. Most drug courts handle adult criminal defendants, providing them with an opportunity to receive treatment in lieu of going to jail or prison. Family and juvenile drug courts are proliferating as well. In adapting the adult model, juvenile drug courts face an especially daunting set of challenges. Although their participants are usually less addicted than their adult counterparts, juvenile drug court participants are at greater risk for future drug use and are often coping with a range of other social and emotional problems common to adolescence. This study seeks to contribute to the knowledge in the field by providing a comprehensive evaluation of the Suffolk County Juvenile Treatment Court, one of the first such programs to open in New York State. Following a brief review of the original adult model, this chapter describes how and why juvenile drug courts differ from adult drug courts and introduces the present study.
Adult Drug Courts
The first adult drug court opened in Miami, Dade County, Florida in 1989. Over the following 18 years, almost 1,100 adult drug courts opened across the country (Office of Justice Programs 2006a). There are 99 adult drug courts in New York State alone (New York State Unified Court System 2007). Adult drug courts generally target nonviolent, addicted defendants and mandate them to judicially supervised treatment. The participants appear regularly before the drug court judge, who attempts to motivate compliance through direct, conversational interactions and the use of incentives and rewards. Participants are subject to frequent drug-testing and meet regularly with court-affiliated case managers, who shepherd them through the treatment process. The model fosters a collaborative approach among all key players (judge, attorneys, case managers, probation, and treatment providers). When successful, adult participants usually have their sentences modified, or their charges reduced, or even dismissed; but when unsuccessful, participants usually face a jail or prison sentence. The proliferation of adult drug courts over the past two decades has resulted in dozens of evaluations. Although many of the early evaluations suffered from serious methodological flaws (Roman and DeStefano 2004), recent days have seen the completion of a series of rigorous studies consistently demonstrating that adult drug courts reduce recidivism (Aos et al 2001; Cissner and Rempel 2005; Government Accountability Office 2005; Wilson, Mitchell and MacKenzie 2002). Consequently, adult drug court research has moved towards a new set of research questions concerning how and why drug courts are effective, for whom they are particularly effective, and whether their positive results extend beyond recidivism to other outcomes of interest, such as abstinence from further drug use and cost savings to the justice system.
Juvenile Drug Courts
The first juvenile drug court also opened in Florida, in the city of Pensacola, in 1995. Although it followed the first adult drug court by only six years, juvenile programs have spread far less quickly than adult drug courts. At year-end 2006, there were 450 juvenile drug courts
Chapter One Page 2 of 75
nationwide compared to nearly 1,100 adult drug courts (Office of Justice Programs 2006b). Correspondingly, far fewer studies have examined the effects of juvenile drug courts (see Chapter Nine) than adult drug courts. Furthermore, since the juvenile population is so different from the adult population, results from one model cannot just be generalized to the other. One of the differences between juveniles and adults is that a juvenile, by definition, is a minor and must live with an adult. This simple fact has important consequences for the juvenile: Are any of the adult family members using drugs or alcohol? Are any of them involved in the criminal justice or family court systems? What is the influence of siblings or other children living in the home? For juveniles, their families may be a source of support or a significant challenge. There are other differences. Juveniles may use drugs for different reasons than adults, and are usually not addicted, even if drugs have become a problem in their lives. Teenagers, regardless of whether or not they use drugs, often do not trust adults, think they know what is best for themselves, and are frequently attracted to deviant peer groups – all tendencies that pose challenges to any social intervention. Finally, juveniles are subject to certain laws because of their age and court mandates must reflect this; for example, juveniles must attend school. Given all this, juvenile drug courts must adapt the adult model in several ways. The participant in the juvenile drug court model is the juvenile, but the target of the intervention often includes the entire family. The court sets the rules, but is constrained by the household dynamics confronting each individual youth. Besides a greater focus on family engagement, juvenile drug courts often seek to address educational challenges and may, in so doing, decide to monitor school attendance and grades, an activity that is largely foreign to adult drug courts. While most adult drug courts focus on interim sanctions as a major strategy for motivation and behavior modification, juveniles are known to respond better to strength-based programming and reinforcement, instead of the threat of negative sanctions. For example, if a youth likes to read, one way a drug court can attempt to engage the youth would be to assign certain books and ask him/her to give a book report to the court. From a clinical perspective, juveniles are frequently not addicted, and mostly use only marijuana or alcohol on a regular basis, as opposed to “harder” drugs. Accordingly, they need treatment programs and modalities that are tailored to their particular drug use patterns and risk factors.
Finally, an important goal for juvenile drug court participants may be personal growth and maturity; this goes beyond the adult goals of sobriety and compliance. Staff and judges in juvenile drug courts hope to change lives and provide brighter futures for their young participants. A recent book by Jeffrey Butts and John Roman (2004) is critical of the growing expansion of juvenile drug courts. First and foremost, the authors contend that it is irresponsible to open so many of these programs until strong evaluations have emerged that prove their effectiveness. Butts and Roman stress that although adult drug courts have been demonstrated to work, one cannot assume that the juvenile model is similarly successful. Butts and Roman propose that juvenile drug courts deal with a young population that, merely by virtue of its age, is more prone to deviant behavior – sometimes criminal, but mostly nonviolent and not serious – than adults. Do juvenile drug courts overreact to deviant adolescent behavior that might subsequently desist without the need for an elaborate intervention? Prior to the advent of juvenile drug courts, the underlying behavior would often be punished with probation or perhaps even community service, and most kids would just “grow out” of this stage.
Chapter One Page 3 of 75
For these and other reasons, Butts and Roman strongly advocate for slowing down the replication of juvenile drug courts. They support allowing more time for evaluations to determine whether juvenile drug courts work, which models are most effective for which types of juveniles, and which juveniles, if any, are most responsive to the model.
The Suffolk County Juvenile Treatment Court Evaluation The present study evaluates the Suffolk County Juvenile Treatment Court, located in Suffolk County (Long Island), New York. According to the 2000 Census, Suffolk has almost 1.5 million residents and is predominantly white (86%), with smaller numbers of Hispanic (11%) and black (7%) residents. The county is wealthy with an average median household income of over $65,000. Only 4% of families live in poverty, and 86% of adults have at least a high school degree or GED. Of course, these statistics describe the county as a whole, not the individual participants who enroll in the drug court. The study is divided into four parts. The first three parts provide a process evaluation of the Court’s policies, procedures, and participants. The fourth part provides an impact evaluation to determine whether the Court reduced the incidence of new criminal cases by comparing the outcomes of drug court participant to similar juveniles who did not participate. Part One (Chapters Two, Three, and Four) offers a general description of the Court and its participants. Chapter Two documents the Court’s policies and operations. Chapter Three presents the results of structured observations of staffing meetings and courtroom operations. Chapter Four examines the Court’s participants, exploring their baseline demographic, socioeconomic, and court involvement characteristics. Part Two (Chapters Five, Six, and Seven) takes a more in-depth look at the treatment and recovery process. Chapter Five focuses on the treatment process, describing the use of different modalities and the duration of drug court exposure. Chapters Six and Seven look at the Court’s compliance mechanisms. (Chapter Six is concerned with infractions and sanctions, whereas Chapter Seven focuses on achievements and incentives.) Part Three (Chapter Eight) documents participant retention rates in the program and analyzes the predictors of drug court success — both retention and graduation. Part Four (Chapters Nine, Ten, Eleven, and Twelve) is the impact evaluation. Chapter Nine provides a literature review of other juvenile drug court evaluations. Chapter Ten describes the methodology that was used in the present study, and Chapter Eleven presents the quantitative impact results. Chapter Twelve presents the results of two focus groups conducted with active juvenile drug court participants and attempts to report their impression of the impact of the program on their lives. The report concludes by summarizing and describing the implications of this evaluation in Chapter Thirteen.
A Note on Data Sources
This evaluation uses five main sources of data. The first consists of paper files from the Suffolk County Family Court. The second is the New York State Family Court DBMaster application. This database was used in a number of counties across New York State to store electronic family court records. This system was discontinued in Suffolk County several years ago, and the data was then moved to the New York State Family Court Unified Case Management System (UCMS). UCMS was the third source of data. Almost all of the

Chapter One Page 4 of 75
comparison youths’ cases occurred during the use of DBMaster, while most of the drug court participants’ data is in UCMS. All youths’ new cases were found in UCMS. The fourth source was the database at the New York State Division of Criminal Justice Services (DCJS). The DCJS database is the repository of all adult arrests in New York State. Information about all adult criminal arrests in the Suffolk County District Court was obtained from DCJS for all juveniles considered in this study, both participant and comparison youth. The last source of data was the New York State Family Treatment Court Universal Treatment Application. This database is used in all Family Treatment Courts in New York State, as well as a handful of juvenile drug courts, including Suffolk’s. All information about participant characteristics and performance while in the program comes from this database, including baseline characteristics, drug test results, court appearances, warrants, sanctions, rewards, and final program status (graduated, failed or incomplete).

Chapter Two Page 5 of 75
Chapter Two: The Suffolk County Juvenile Treatment Court
It is the mission of the Suffolk County Juvenile Drug Court to address the issues of youth delinquency, substance abuse, family
conflict and school performance. It is our mission to teach adolescents to cope drug-free with the complex problems facing
them and develop a positive network to mitigate pressures of returning to a negative lifestyle. In addition, the Juvenile Drug
Court encourages family participation to ensure success.1
The Suffolk County Juvenile Treatment Court opened in February of 2002. The original model was implemented in two court parts within the Central Islip, Suffolk County Family Court building. Today’s Court has three parts, two in Central Islip and a third in the Riverhead Family Court building to accommodate participants who live on the east end of Long Island. The Honorable David Freundlich, Supervising Judge for Family Court in Suffolk County, initiated the Court’s planning process and later became the presiding judge in one of the Central Islip court parts. Judge Freundlich, a former criminal narcotics prosecutor, had heard about the juvenile drug court in Monroe County, New York and thought it might be a model that would work in Suffolk. The Judge assembled a team of local professionals and applied for, and received, a federal Drug Courts Program Office (DCPO) planning grant. During the year of the planning grant, 1999-2000, the team attended several trainings. At that time, in addition to the Judge, the team included:
• A substance abuse treatment representative; • A professional from a community-based mental health center; • A Law Guardian (representing juvenile litigants); • A County Attorney (the prosecutor); and • The Honorable Ettore Simeone, another judge assigned to the Suffolk County Family
Court in Central Islip.
Throughout these trainings, Judges Freundlich and Simeone realized that in many ways they had been operating their courtrooms like juvenile drug courts, so they worked to formalize their efforts. Caroline Sullivan, the treatment representative, began designing the program and eventually became the Coordinator, a position she has held for more than six years. After the trainings, one additional representative from Outreach House, a local treatment agency, joined the team, as well as a representative from probation. None of the team members resisted the drug court concept, but there were concerns. The Law Guardian was concerned about the role of sanctions and the possibility of her clients facing excessive punishment for noncompliance. The treatment representatives felt that treating juveniles with mental illness the same as those with substance abuse problems was a mistake. Both the judges and the Suffolk County Court personnel felt that a juvenile drug court would fit the county culture well, and agreed that it would be in the best interest of the juveniles who went through their court system.
1 This mission statement is quoted from a presentation prepared by Caroline Sullivan, Coordinator of the Suffolk County Juvenile Treatment Court and given on October 29, 2003.
Chapter Two Page 6 of 75
This chapter describes the juvenile drug court model that emerged from the Court’s planning process, including referral and eligibility procedures; family engagement; phases of participation; monitoring; sanctions and incentives; treatment modalities; and graduation requirements. The final section concerns the drug court team, describing each team member’s role and perceptions of the model’s strengths and challenges.
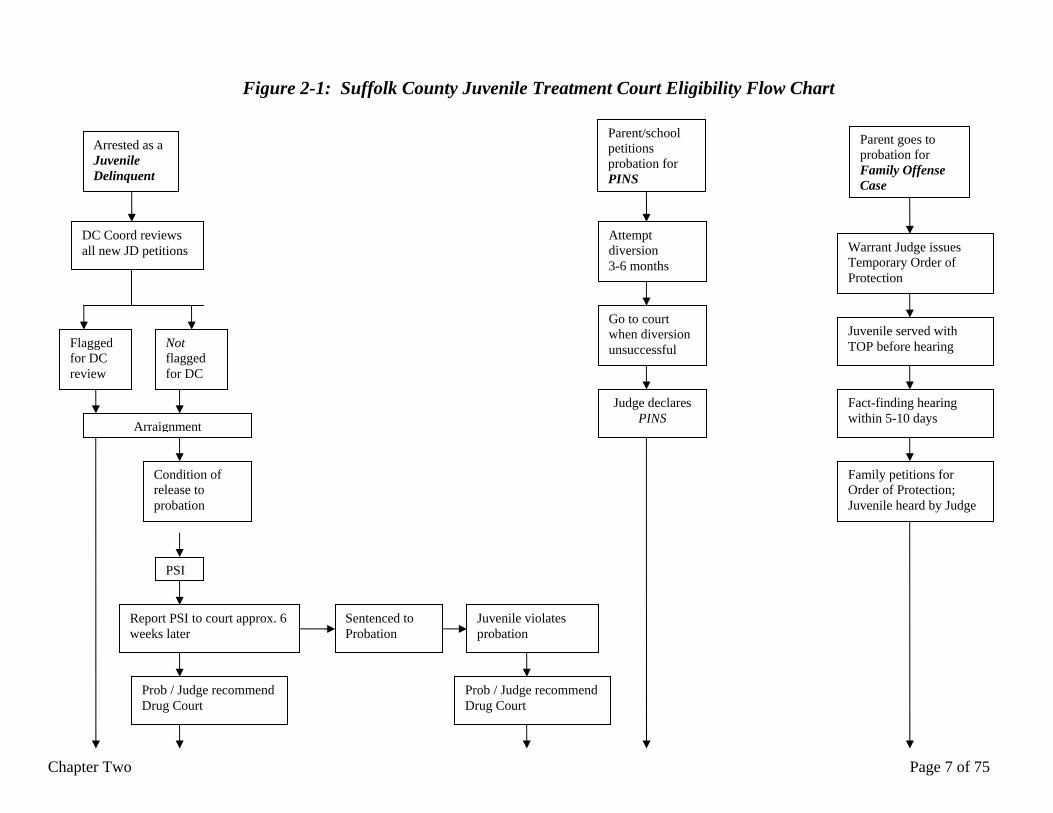
Referral and Eligibility Three groups of juveniles may be referred to the Suffolk County Juvenile Treatment Court (JTC) – those with juvenile delinquency, PINS, or Family Offense petitions in the Suffolk County Family Court. Figure 2-1 includes a flow chart that outlines the process.
The first group, juvenile delinquency petitions, involve youth who were younger than the age of 16 when arrested on charges that, had they been 16, would have been criminal offenses. The JTC Coordinator, Caroline Sullivan, conducts daily reviews of the paper files of all Suffolk County JD petitions for eligibility.2 If the youth is younger than 18 years old3 and the charge does not include extreme violence, the youth is flagged for JTC eligibility. Gang or sex offense cases are only eligible for the Riverhead JTC court part, not in the two court parts operating out of the main Central Islip Family Court building. Youth who are flagged for JTC paper eligibility are arraigned and receive a drug court intake, which is described below. Even those youth involved in juvenile delinquency petitions that are not initially flagged by the Coordinator may end up in the drug court through a second route. At first, such cases continue with traditional case processing. If a young person is arraigned and conditionally released, probation generates a Pre-Sentence Investigation report (PSI), which explores and documents all aspects of the juvenile’s life and family history, including prior criminal or family court involvement of anyone in the juvenile’s family, orders of protection, domestic violence history, and child protection orders. The results of the PSI are reported to the Court approximately six weeks after the arraignment. If the case is deemed appropriate, the judge or probation may recommend drug court. At this point, the youth submits to the drug court intake process. (It is also possible, though not common, for a youth to enter the drug court on a conditional admission before the results of the PSI are reported to the Court). A third referral route for those with juvenile delinquency petitions takes place after the juvenile proceeds through the traditional court process and is placed on probation. While on probation, if the youth continues to use drugs and engage in poor behavior, probation can file a violation and recommend to the Court that the disposition of probation be amended to include a requirement to participate in the drug court. The youth then submits to the drug court intake process to verify clinical eligibility for the program.
2 All juvenile delinquency arrests do not result in a petition being filed in Family Court. Only those cases where a petition is filed are considered for eligibility in the Treatment Court. Reasons for not filing a petition can include bad evidence or missing witnesses. 3 Sometimes juveniles younger than 16 years old are arrested but their case does not reach the Family Court process until after their 16th birthday; the Treatment Court will consider for admission all JD youth who are younger than 18 years old by the time their case reaches court.
Chapter Two Page 7 of 75
DC Coord reviews all new JD petitions
Flagged for DC review
Not flagged for DC
Arraignment
Condition of release to probation
PSI
Report PSI to court approx. 6 weeks later
Prob / Judge recommend Drug Court
Attempt diversion 3-6 months
Go to court when diversion unsuccessful
Judge declares PINS
Warrant Judge issues Temporary Order of Protection
Juvenile served with TOP before hearing
Fact-finding hearing within 5-10 days
Family petitions for Order of Protection; Juvenile heard by Judge
Sentenced to Probation
Juvenile violates probation
Prob / Judge recommend Drug Court
Arrested as a Juvenile Delinquent
Parent/school petitions probation for PINS
Parent goes to probation for Family Offense Case
Figure 2-1: Suffolk County Juvenile Treatment Court Eligibility Flow Chart

Chapter Two Page 8 of 75
Drug Court Intake
Found eligible; parents & youth want DC
Transferred to DC
Admission through pleading or fact-finding
Both parent & youth sign DC contracts
Sentenced to probation, with condition of DC
Suffolk County Juvenile Treatment Court Participant
Figure 2-1: Suffolk County Juvenile Treatment Court Eligibility Flow Chart (Cont)
Chapter Two Page 9 of 75
Another source of drug court participants are juveniles who enter the family court not with a juvenile delinquency petition but as a Person in Need of Supervision (PINS). When a juvenile is out of the control of the adults in his or her life, a parent or a school administrator can petition the Court to identify the youth as a PINS. The youth must then submit to supervision by probation. During the probation supervision period, the youth will receive services, submit to drug tests, and be subject to other compliance monitoring practices. After three to six months, probation will decide whether or not the case may be closed as successfully “diverted.” If not, the case is referred to the Court for further adjudication. Technically, the probation supervision process is voluntary, so a youth may choose not to participate, although that will certainly hasten the decision to refer the case to the Court. Once the youth is adjudicated as a PINS case – i.e., once the case reaches the Court – the youth is eligible for the drug court and will be assessed at intake. A final referral source is juveniles who are respondents on a Family Offense petition indicating a parent-child conflict. This group includes those who are at least 16 ½ years old and have threatened physical violence or actually committed physical violence against a family member, usually a parent. In these cases, the parent goes to probation to ask for a Temporary Order of Protection (TOP) against the child. A warrant judge has the discretion to file the TOP. The young person is served with the TOP before the fact-finding hearing which occurs 5-10 days later. Prior to the fact-finding, the young person will have a drug court intake interview to determine eligibility. However they are referred to the drug court, young people must undergo a clinical intake interview with one of four case managers, the Coordinator, or a social work intern. Also, the parents are asked to complete a form and participate in an interview with a case manager. These two interviews enable the drug court to collect a substantial amount of information about the youth and his or her family, including substance abuse history, treatment history, mental health history, and education, legal, demographic, and family information. Based on this information, the Coordinator and case managers make a collaborative decision about whether the youth is clinically eligible for the JTC. Treatment Court staff report looking for a youth with a substance abuse pattern, but who does not require a DSM IV diagnosis of abuse or dependence. They also report looking to enroll young people who are “ready to change,” and who “need to change”. Staff report that most young people are willing to admit to alcohol and marijuana use at intake, but will later concede oxycontin, prescription pills and other drug experimentation. Most youths are found eligible at this stage. If intake reveals an appropriate youth, the case will be transferred to the drug court calendar. Participation in the Treatment Court is entirely voluntary, as it usually is in adult drug courts. If the youth and/or their parents choose not to participate in the Treatment Court, the family court petition will continue through the typical family court process. For JTC participation, all youths must make an admission to the alleged charge either through a pleading or a fact-finding hearing. (For JDs and Family Offense youths, this amounts to a “guilty” plea in criminal court language; for PINS youths, this is conceding to the PINS designation and court supervision.) Most youths will plead to an admission; fact-finding hearings are uncommon. Both the youth and a parent are required to sign a contract at the time of admission. All youths are sentenced to probation for varying terms with a condition requiring JTC participation. The standard length of probation for JDs is two years; one year is typical for PINS youths; one or two years are common for Family Offense respondents. The length of probation and of the Order of Protection in Family Offense cases is the same. Sometimes the Court will make the probation

Chapter Two Page 10 of 75
sentence for Family Offense youths shorter if a young person agrees to enter the drug court than if they refuse; reduced sentences might be used as leverage to encourage participation.
Family Engagement
Parents are required to sign a contract in order for their child to enter the JTC. In the contract, parents consent to home visits by probation, family therapy (either at a treatment facility or in the home), and agree to enforce the rules of treatment and the Court. Parents are not required to attend court hearings but are strongly encouraged to do so. Parents are required by law to be in court if their child is going to be remanded. One of the JTC judges, Judge Kelly, said he tries to use the family as a source of strength and support for the youth and will try to hold the parent to a high standard of accountability. “Sometimes the kid doesn’t need placement, he just needs a parent.” Although it might be helpful for the youth to see the parent held accountable, just as the youth is held accountable, Judge Kelly does not want to degrade the parent in front of the participant. The juvenile must not lose respect for the adult charged with their care. On occasion, Judge Kelly will ask the juvenile to leave Court so he can speak directly and candidly with the parent or guardian.
Phases of Participation
Participants progress through three phases of participation. Phase One focuses on program “orientation” and usually takes 30-90 days to complete. During this phase, participating young people are required to attend all appointments—which might include meetings with a case manager, a probation officer, or a treatment professional—and go to school. They must come to Court once per week, submit to drug tests at least three times per week, and be drug-free for one month before promotion to the next phase. If there is a positive drug test, the “clean time” will reset to zero, which is why this phase can take up to several months to complete. Phase Two focuses on “implementation.” Participants must come to Court two times per month, submit to drug tests at least three times per week, and obtain part-time employment if they are old enough. This phase deals with historical issues surrounding drug use and success in treatment. Participants must accumulate an additional eight months of consecutive clean time to move up to the next phase. If there is a positive drug test, the clean time clock will reset to zero, but the participant may not be required to revert to Phase One. Phase Three focuses on “community acclamation,” dealing with issues related to the reentry of the youth back into his or her school, family, and community. The participants come to Court once per month and are drug tested at least once per week. Participants are challenged to be consistent, to prove that they deserve the reduced supervision and monitoring by attending all treatment and other required meetings and by abstaining from drug use. Participants must accumulate a cumulative year of clean time across the three phases to be considered for graduation. Throughout participation, the JTC distinguishes between a “lapse” and a “relapse.” A “lapse” is the less serious of the two and is usually a single incident. Perhaps the youth drank but did not intend to, or had one drink and then admitted the use to his or her case manager or treatment counselor. A “relapse” is a more serious episode of drug use and is characterized by a return to old behaviors. When there is a positive drug test or when the youth admits to using drugs, the clinical team considers whether it was a lapse or relapse when determining the type of

Chapter Two Page 11 of 75
response. A lapse garners a less serious sanction, especially if the use was disclosed by the youth, and may not always result in turning back the clean time clock. Throughout the process, participants have drug tests at nearly every court appearance, and treatment appointment. If there is a positive drug test at treatment, the program is responsible for reporting it to the Court for a formal response.
Monitoring
The Court employs four case managers, three in Central Islip and one in Riverhead. All four have been with the JTC for several years. Participants meet with their case managers every time they are in court, although sometimes it is just a quick check-in to see how things are progressing; participants are welcome to call or visit their case managers more frequently, if necessary. Parents may also be in frequent contact with the case managers, especially if they are unable to come to Court or if there are problems. Additionally, there are two probation officers who are dedicated to the JTC, and all participants are assigned to one of them; the Court is hoping to add a third probation officer as well. Ideally, the case managers and probation provide two layers of supervision, monitoring, support, and services to the juvenile and his or her family.
Participating young people must see their probation officer twice per month. The officers conduct home visits on a quarterly basis and school visits about every one to two months.4 The home visits may be announced or unannounced. These visits allow the probation officers to inspect the conditions within the home, meet all of the family members, and discuss goals in an informal setting. There is interaction with the family on the home visits, but the primary purpose is to observe the juvenile in his or her home environment. The school visits may also be announced or unannounced. There are over seventy public school districts in Suffolk County and only two JTC probation officers, so it is difficult to make frequent school visits. The JTC staff speak with school officials about the youth’s performance and attendance and observe the youth in the school environment. Apart from these visits, the youth’s school is supposed to send the JTC a report prior to each court appearance regarding attendance, punctuality, grades, test scores, and detention. Throughout the program, there is a court-imposed curfew for participants who live at home. The curfew may become more lenient as the participant progresses through the phases of the program.
Sanctions and Rewards
To encourage compliance, the JTC attempts to punish negative behavior with sanctions and to acknowledge positive behavior with rewards. All incentives and sanctions decisions are made by the team at the staffing meeting that occurs before Court three times per week, although the Judge has the discretion to modify the team’s recommendation. The frequency with which the Judge follows the team’s recommendations is explored in Chapter Three. Staff reported that the most common infractions were the following: late or missed sessions for treatment or school; positive drug tests; school suspension; failure to appear in Court; disappearance from treatment; and other violations of the JTC rules, including dress code 4 Home visits were the responsibility of the case managers, sometimes accompanied by a probation officer, but the New York State Office of Court Administration’s policy no longer allows case managers to conduct these visits.

Chapter Two Page 12 of 75
violation; missed curfew; or acting disrespectful to an adult. When a youth fails to appear in Court, the Court does not issue a warrant immediately. Typically, the judge will wait until the last hour of the court session and will then call the youth’s house hoping to get the youth into Court. If by the end of the court session the juvenile has not shown up, the judge will still wait until the next day to see if the juvenile calls in with an excuse. If a full day passes without any word from the youth, the judge will issue a bench warrant. Staff report that warrants are rarely issued. The most common sanctions are a verbal admonishment, an essay assignment, community service, increased court appearances, phase demotion, increased drug tests, and remand—both secure and non-secure. The Court occasionally uses electronic monitoring which involves placing an electronic bracelet on the youth’s ankle to monitor movements and activities. Electronic monitoring is used for curfew violators and serves as a physical reminder of the consequences of breaking rules. When the team decides to give a youth a remand sanction, the team tries to plan it for weekends so that the youth does not miss school. The parent must be in Court in order for a youth to be taken into custody. Staff will call the parents earlier in the day to let them know their child is going to be remanded and ask the parent to come to Court. Sometimes a parent is unable to make it to Court and the case will be re-calendared for later in the same week. There are two types of remand – secure and nonsecure. Secure detention is akin to jail for adults. The youth is placed in a traditional cell and movement is severely restricted.5 Nonsecure remand is more akin to a group home. The juvenile is unable to leave the facility and is required to follow the facility’s rules, but he or she has a bedroom, not a cell, and greater freedom of movement. By law, the Court cannot order a secure remand with a youth whose original case was a PINS petition. The Judge, however, can order nonsecure remand or remove the PINS youth from their home to live in a group home. For a youth with an original JD or PINS petition, every serious violation results in a re-adjudication of the probation conditions. (“Serious” violations are not explicitly defined but are generally anything serious enough to result in a sanction. Staff are conscious that sanctions frequently trigger a probation violation so they may choose to respond informally to minor infractions such as a single late appointment.) The probation term is renewed with each serious violation, so in practice probation never runs out while the youth is a participant in the JTC. For young people with an original Family Offense petition, their JTC violations do not result in re-adjudication. Therefore, when the original probation term expires (one or two years), the parent must request that the probation term be renewed to the end of the youth’s JTC participation. Most parents will request the renewal, but some will refuse, and those youth will be forced to leave the JTC; their final program status will be designated as incomplete, regardless of their progress. According to Judge Freundlich, the specific sanction selected has to provide a “balanced” response to the infraction. Judge Freundlich said he is usually lenient and frequently does not follow the team’s recommended sanction because it is often harsher than he prefers. He believes that the most effective sanction is one night in the adult Suffolk County Jail, but this can only be used for those youth who are 16-18 years old, who have an order of protection that stems from
5 Juvenile delinquents serve their secure detention at the Westbury Juvenile Detention Center in Nassau County on Long Island, Spotford in the Bronx, or a facility in Albany. Family Offense youth serve their secure detention in the juvenile wing of the Suffolk County Jail in Yaphank.

Chapter Two Page 13 of 75
an original Family Offense petition. The most important thing according to Judge Freundlich is to be consistent with sanctions. Judge Kelly’s perspective differs from that of Judge Freundlich. When young people first join the program, Judge Kelly says, “I want fear. I want them to be terrified. Three months from now we can be friends.” He does not like to give concrete sanctions at the beginning of participation. He prefers to wait a few months to see if the youth’s behavior improves as a result of his verbal admonishments. He strongly supports requiring book reports and essays, because they make the youth think. For example, the judge asked a youth who was a sharp dresser to write an essay about a business proposition for a clothing line. Judge Kelly also uses remands, but finds that after two remands, this sanction’s effectiveness diminishes. He is also quick to increase the frequency with which the participant must return for court hearings, and is in favor of mandating the parent to attend Court as well. Commonly recognized achievements include the following: full attendance at school; passing a test in school; completing homework/chores for a week; phase completion; and milestone clean days, such as 30, 60 and 90 days. The most common rewards are courtroom applause, verbal encouragement by the judge, and a certificate to recognize phase advancements. In addition, a T-shirt is usually given as the first reward, frequently to recognize 30 days drug-free. Thanks to charitable donations, the JTC gives out inspirational cards, journals, key chains, gift certificates to local stores, and tickets to sporting events. Staff reported that inspiration cards, journals, and tickets to sporting events can all be used as sanctions, as well, to force introspection and quality family time. Judge Freundlich likes to reward participants with fewer court appearances and reduced restrictions, such as allowing the youth to go on a trip with his or her parents or allowing the youth to go out with friends on a Saturday night. Judge Freundlich and Judge Kelly agree, however, that the best reward is praise from the judge.
Treatment Modalities
Based on the JTC intake interview, the initial treatment modality is determined by the
Case Manager, with the approval of the Coordinator. The decision is based on the number and type of substances used, frequency with which they are used, general behavior and attitude, and school attendance and performance. The first modality is written into the contract that is signed at disposition, and could also be a condition of probation. The initial treatment plan always includes family therapy in addition to substance abuse treatment. Case managers can also recommend modality changes during participation, with the approval of the Coordinator. The JTC uses six major treatment modalities. The first modality, individual therapy, is used with juveniles who are 12-14 years old. It is most appropriate for participants with no significant drug history but where drug-involved behavior has just begun. The second and third modalities are outpatient and intensive outpatient treatment. Participants in outpatient treatment are most commonly required to attend 2 to 3 times per week for a total of 6 to 8 hours. These youth are still functioning at home and in school. Intensive outpatient treatment has two tiers. Tier 1 requires 20 hours per week; the youth remains in school but attends treatment every day after school for 4 hours. Tier 2 requires the participant to attend school at the treatment facility. Youth go to the treatment facility for 40 hours per week, spending six full days per week, which includes on-site school time.
Chapter Two Page 14 of 75
The fourth modality is diagnostic inpatient treatment for 30 days. This modality is used most commonly for youth who continue to use drugs in outpatient treatment or who show signs of mental health issues after becoming drug free. The fifth and sixth modalities are residential. Short-term residential treatment is one to six months in duration. Long-term residential treatment is rare and lasts nine to eighteen months.
The prevailing philosophy is that it is better to keep kids in their homes whenever possible, resulting in a general preference for outpatient modalities. The objective is to teach the youth to function within his or her home and family environment. One case manager said that if the juvenile has never participated in treatment, she will always start with an outpatient modality. The staff report that outpatient treatment accounts for the majority of placements, an impression confirmed below in Chapter Five.
Graduation Requirements and Program Completion
The Treatment Court makes a final individualized decision about when each juvenile is ready to graduate, but there are some standard requirements:
• Completed the treatment program; • Completed all phase criteria, including the one year clean time requirement; • Completed community service (the number of hours required is not specific and is
determined individually for each youth; this requirement can be fulfilled even if done as part of a sanction);
• Doing well in school; • Working and maintaining a budget (if of legal working age); and • Involved in drug-free extracurricular activities.
Upon completion of all requirements, a juvenile will graduate. If the original petition was a juvenile delinquency case, the legal record will be changed to “no finding” instead of a conviction, and the record will be expunged. Expunging a record literally means the destruction of the paper record and permanent deletion from the Family Court databases; it is as if the arrest never happened. If the original petition was for a PINS case, the PINS adjudication is removed from the juvenile’s record. Again, it is as if the case never happened. If the original case was a Family Offense petition, the case will remain on the record but the juvenile will be removed from the statewide Domestic Violence registry. JTC staff rarely give up on a participant. Even if someone is having a hard time completing the graduation requirements or remaining drug-free, the JTC will keep the participant engaged, hoping for the best. If the family and the youth remain noncompliant, and the JTC has exhausted all treatment options, the JTC will reluctantly terminate participation. Judge Kelly embodies this approach when he said, “A success can be three steps forward and one step back, even though that drives the team crazy. These are kids, we can’t expect perfection!” Judge Freundlich believes that termination decisions are best made case-by-case. The number of chances each youth will have before termination will differ based on a number of factors, most importantly the degree of effort and whether the juvenile is a danger to himself or others.
Upon failure, the conviction will remain on the juvenile’s record, and one of three sentences will be imposed: 1) discharged from probation (probation complete but will keep conviction); 2) continued probation with other non-Treatment Court conditions; or 3) placement with the Office of Children and Family Services (OCFS), akin to incarceration for juveniles.

Chapter Two Page 15 of 75
The placement can be secure or nonsecure for juvenile delinquents or Family Offense youth, but must be nonsecure for PINS cases.
Team Members and Their Perspectives The Judges There are three judges associated with the JTC. Judge Freundlich initiated the planning process and has been with the JTC since it opened. Judge Kelly has been with the JTC since early 2004. He was a Law Guardian in Family Court and subsequently worked as a judge in the Suffolk County District Court before moving to Family Court. The Honorable Gregory Blass joined the JTC team in 2004 and works only in Riverhead. Although all three judges are part of one united Treatment Court, there are differences in approaches, perspectives and personalities which are discussed later in this chapter and throughout this report. One of the defining differences between youth respondents in traditional Family Court and the JTC is the ongoing relationship that participants form with the judge. Judge Kelly said that one challenge is to get the youth to trust him, which allows him to figure out what makes the youth “tick” and how best to tailor the program to his or her specific needs. Judge Kelly’s goal is to orient the youth toward the future when he or she can be a productive member of society. He teaches the youth to respect themselves and their communities. He anticipates that the judge is often the first adult to show respect for the youth and is therefore someone for the youth to look up to. Judge Freundlich said that he develops almost a parent-child relationship with the participants; they almost become “his” children. As the judge, he is a combination of authority figure, father, confidant, and friend, aiming to get “buy in” from each youth; but he is careful to keep his distance because he needs to be able to “come down on them” when necessary. Judge Freundlich also used the same language as Judge Kelly to describe his approach to participants, which is to try to “figure out what makes them tick, what are their issues.” He describes a common occurrence of running into former participants outside of Court who are anxious to share their good news and progress. Judge Kelly believes that the personal relationship developed with the youth allows him to motivate him or her without any specific rewards or sanctions; just the promise of judicial praise or the threat of the Judge’s disappointment is often enough to motivate the youth. None of the judges attends the regular staffing meetings with the rest of the team because of time constraints. Both Judges Freundlich and Kelly said they are in constant communication with the Coordinator and case managers, but they are careful to avoid ex parte communication with the attorneys. Judge Kelly said that even if he had the time, he would not attend the staffings; he likes to take a back seat in the discussion about responses. Plus, he feels that there needs to be a place where team members can talk candidly without concern about what the judge might think. When asked about the difficulty of maintaining consistency across three judges in three different court parts in two different courthouses, both Judges Freundlich and Kelly expressed concern. Judge Freundlich noted that the most important thing was to have good judges. Judge Kelly said it is essential for the judge to be comfortable with the decisions made in his own courtroom, even at the expense of consistency across judges. Surprisingly, most of the team members did not feel that working with three different judges was a significant challenge. One case manager, however, noted that the hardest part of working with three judges is the
Chapter Two Page 16 of 75
inconsistency in their use of remands. One judge will lock up a non-compliant youth quickly, another will first give one or two chances, and another will give several chances. There are other differences among the judges, according to the other team members. Judge Kelly is known for issuing threats, but he rarely follows through with a remand after the first infraction. Judge Kelly said he does this intentionally, but some members of the team said it may undermine the threat if the youth learns that he rarely intends to follow through. Chapter Twelve explores the thoughts of some of the juvenile participants on this issue. They recognize that Judge Kelly is more lenient than the other judges and see it as his strength. Coordinator Caroline Sullivan was on the planning team as a treatment representative, and her contribution in that capacity has led to her being hired as the inaugural Coordinator. Having a clinical background — she is a CASAC — enables her to communicate effectively with the treatment representatives and serve as an advisor and supporter for the case mangers. All of the team members recognize Ms. Sullivan as an effective leader and administrator. Case Managers The JTC employs four case managers, three in Central Islip and one in Riverhead. Only one of the four has a clinical background; one case manager is in recovery. The case managers act as liaisons among the team members as well as with the participants and their parents; one case manager described the job as “mini-coordinators.” The case manager is frequently the person with whom the JTC participant has the most contact. The participants are assigned to the case manager with whom the juvenile might have the best relationship. Only one of the case managers is bilingual, speaking English and Spanish, so she is assigned Spanish-speaking participants for whom English is a challenge. The average caseload is approximately 30 participants per case manager. Case managers identified a few challenges of working as clinical professionals within a court context. The most common has to do with confidentiality. Frequently, case managers are uncomfortable with the amount and type of information that is shared in an open courtroom. Another obstacle is working with a variety of parents and family situations. One case manager said that the differences in parents are frequently related to their race/ethnicity. This case manager identified African-American parents, and Latino parents to a lesser extent, as having an inherent distrust of the justice system that makes it difficult for the parents to invest in their child’s JTC experience. Another case manager said that a large obstacle for the participants, and therefore for their case managers, is that many come from difficult and dysfunctional homes and have no “frame of reference” for what is a healthy lifestyle or relationship. Parents can be an asset or a hindrance. The latter is especially true if the parent is using drugs or enabling their child to engage in dysfunctional behavior. A different case manager expressed the same concerns regarding the role of the parents: “We can plant a seed so that in the future they can think back and learn from this experience, move forward and learn from mistakes.” Probation The JTC has two dedicated probation officers; a third will be assigned in the near future. When the JTC first opened, the Probation staff were defensive because of a commonly held perception that the Court was trying to take over Probation’s supervisory role. As the program has grown, the relationship between probation and court staff has become stronger, although
Chapter Two Page 17 of 75
there remains tension when Court and probation responsibilities overlap. One case manager described the successful relationship with one specific probation officer as “not overlap, but working together.” But another case manager said it was frustrating that they were no longer able to do home or school visits because of a change in statewide policy, especially because probation staff are not doing them as frequently as they had agreed to and are not sharing with the team all of the information generated by the visit. This lack of information hinders the case manager’s relationship with the youth, because information from the home and school visits tend to focus on negative behavior.
Another case manager said that some of the probation officers, and even probation as a unit, do not “get” the JTC. Occasionally, probation staff are unwilling to file a violation at the request of the JTC or will tell the juvenile not to tell the Court about certain behaviors if the probation department has already responded. And some probation officers behave more like “friends” to the youth rather than figures of authority and supervision. Finally, frequent turnover of probation officers fosters inconsistency and lack of a shared purpose. Currently, two effective and committed officers work with the Court, which will help resolve many of the concerns with probation. Law Guardian In Family Court, the “defense attorney” is known as the Law Guardian. Two Law Guardians, both from the Legal Aid Society, work on JTC cases. One Law Guardian said that a key factor for determining whether or not to encourage JTC participation is the parent. The Law Guardian agrees with the case managers regarding the importance of parental support for JTC participation. Nevertheless, she feels the JTC is usually a good option for her clients, in particular as an alternative to OCFS placement. The Law Guardian role is a complex one. Although a member of the team, and charged with working towards the best interests of the child, the Law Guardian is the only team member whose first loyalty is to her client’s expressed wishes and preferences. When conflict occurs, the Law Guardian can take on the role of counselor and try to advise the juvenile about better options. Because young people might express preferences that are clearly not in their best interest, having them speak directly to the judge sometimes makes the Law Guardian nervous. Therefore, the Law Guardian attempts to talk with each juvenile before the appearance to filter his or her intended comments. Similarly, Law Guardians do not want the parents to speak in open court without first consulting with the youth’s lawyer. Working in the JTC allows the Law Guardian to build a relationship with her client. The ongoing relationship makes the Law Guardian and the team think more creatively about how to resolve violations and custody issues. The Law Guardian will talk with every juvenile in Court, but if the youth is doing well, the talk will likely be a quick check-in while walking up to the bench for the monitoring appearance. The Law Guardians always talk more with the juvenile and parents, if the latter are in Court, when there is a violation or a problem. Violations of probation (VOP) present an additional challenge for the Law Guardian. The attorney will frequently find out about the VOP in the morning staff meeting and have only a limited amount of time to investigate the allegations and prepare a defense. A related concern involves client admissions of drug use. When a youth reports drug use to the case manager, that admission is an integral part of the recovery process. But that conversation is not confidential; it is shared with the entire team, and will frequently result in a sanction. Although juveniles are
Chapter Two Page 18 of 75
usually given a less severe sanction if they tell the truth about drug use, the Law Guardian understands that sometimes the youth would be better off if they did not disclose it. County Attorney The Office of the County Attorney is the “prosecutor” in the Suffolk County Family Court. The JTC has two dedicated county attorneys. One reported that since he had never used drugs, he initially had difficulty understanding the participant perspective. Even as this attorney learned more about drug use, he continued to yield to the treatment and case manager opinions in setting the goals for each youth. He supports the non-adversarial environment in the JTC courtroom; we “need to share the sandbox.” The county attorneys are not always able to attend staff meetings due to time constraints but receive informal updates before the court appearances. One of the attorneys expressed concern when the program started that none of the juveniles would be able to complete the Court’s substantial graduation requirements. Today, he is happy to have been proven wrong. He believes that youth with “inner strength” will do better and graduate faster. Treatment Representatives from some of the most frequently used treatment agencies attend the staff meetings and are considered regular team members. All outpatient treatment agencies are required to send weekly reports to the Court for each juvenile at their facility; inpatient facilities send reports once per month in advance of their monthly court appearance. In addition, if there is a serious infraction or a positive drug test at treatment, the agency is responsible for calling the Court immediately. Other team members report that some agencies are better than others at keeping the Court updated on progress and behavior at treatment in a timely manner. Similar to other team members, treatment representatives cite parents as the largest barrier to a youth’s progress. When a family is dysfunctional, treatment teaches youth to “cut the umbilical cord” and think independently. One representative said that treatment for juveniles is “habilitation” not rehabilitation since they are learning these skills for the first time. The majority of treatment professionals do not support inpatient treatment for most youth. “We may be powerless to change the [home] environment, but we can help them thrive in that environment.” An advantage to working with the JTC is that a judge can hold a parent accountable for using drugs in the home. Another treatment representative said that they consider the client to be the whole family, not just the juvenile.
Chapter Three Page 19 of 75
Chapter Three: Court Operations
When the JTC opened in early 2002, it operated in two separate courtrooms with two judges in Central Islip, Long Island. Whereas Judge Freundlich has presided in one of these courtrooms since the beginning, a total of three judges have presided in the second courtroom during sequential periods of time. Furthermore, in February of 2004, the JTC expanded to a third part in Riverhead, Long Island. As of this report, there are three judges – Judges Freundlich and Kelly in Central Islip and Judge Blass in Riverhead. Judge Freundlich hears JTC cases two days per week; Judge Kelly and Judge Blass hear JTC cases three days per week each.6 To better document court operations and decision-making in practice, we conducted structured staffing and court observations (see instruments in Appendix A). These observations had multiple purposes: 1) to document what is discussed in the staff meeting; 2) to document what is discussed in Court; and 3) to document the interplay between the recommendations made in the staff meeting and the final decision in Court.
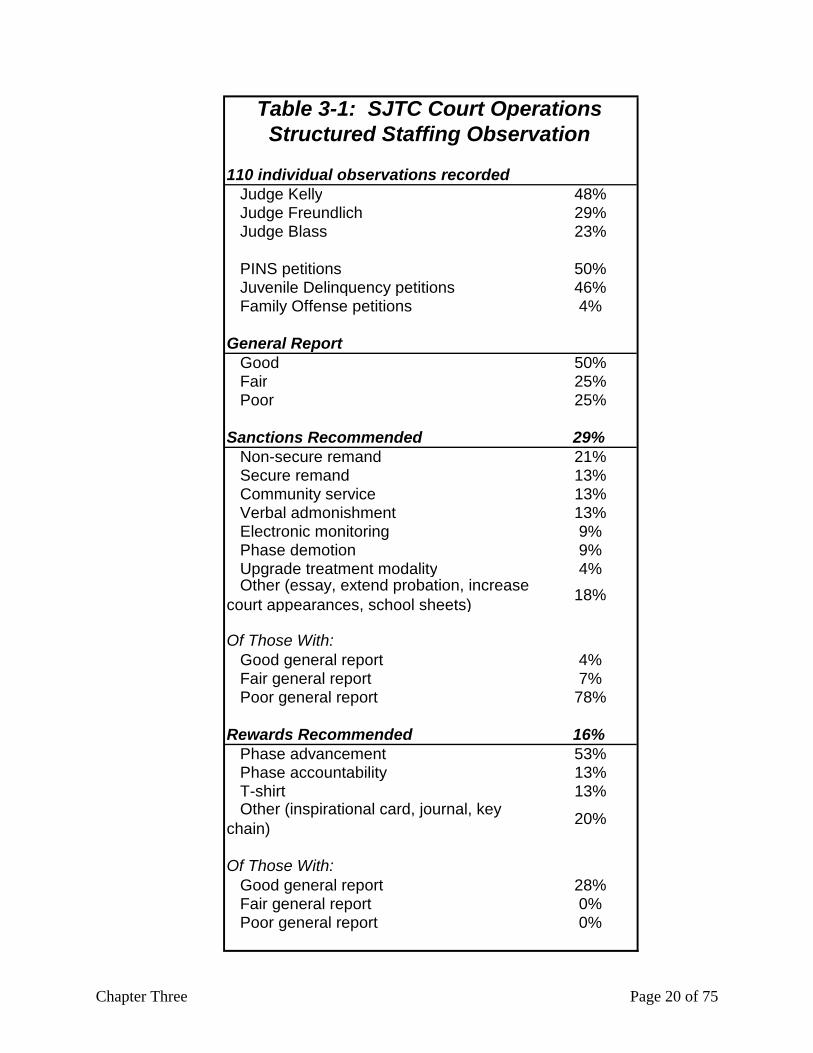
Staffing Each week, the JTC team meets on the three days when court is in session. The judges do not attend these meetings, but the following team members do so regularly: law guardians, court attorneys, probation officers, community service supervisor, representatives from various treatment agencies, case managers, and the Coordinator, who runs the meeting. One team member reported satisfaction that the judges do not attend because it allows an honest conversation and prevents the judge from hearing unrefuted allegations of noncompliance. There were seven full days of observation, including both a staffing and court session on each day, for a total of 110 cases observed. Table 3-1 shows that almost one-half of the individual cases observed (48%) were with Judge Kelly, 29% with Judge Freundlich, and 23% with Judge Blass in Riverhead. Just about all of the cases were PINS (50%) or juvenile delinquency (46%); Family Offense cases were rare (4%). While observing the staffing, we made a subjective assessment concerning the overall report for each youth as good, fair, or poor. A fair assessment involved a problem, but one that did not appear to rise to a level of high concern. A poor report involved a problem that seemed to be more than minor or several problems at once. One-half of the cases discussed involved a “good” general report, with the other one-half split equally between fair and poor reports.
A sanction was recommended for 29% of the cases observed. Of those with a poor report, 78% were recommended for a sanction, whereas only 7% of those with a fair report and 4% of those with a good report were so recommended. The most common sanction recommended was a remand (21% non-secure and 13% secure). Otherwise, the sanctions recommended were community service, verbal admonishment (13% each), electronic monitoring, phase demotion (9% each), and a variety of other sanctions each given out only once. The other sanctions included an essay, an extension of probation, a treatment modality upgrade, an increase in court appearances, and school sheets (these require the juvenile to take a checklist to school every day and have someone attest to their daily punctual attendance and indicate any test scores or general comments). 6 At the time of publication (but subsequent to the completion of all project analyses), Judge Blass was no longer presiding in Riverhead although that part continued its JTC operations under another judge. Additionally, the JTC had added a fourth court part with Judge Simeone presiding in Central Islip.
Chapter Three Page 20 of 75
110 individual observations recorded Judge Kelly 48% Judge Freundlich 29% Judge Blass 23%
PINS petitions 50% Juvenile Delinquency petitions 46% Family Offense petitions 4%
General Report Good 50% Fair 25% Poor 25%
Sanctions Recommended 29% Non-secure remand 21% Secure remand 13% Community service 13% Verbal admonishment 13% Electronic monitoring 9% Phase demotion 9% Upgrade treatment modality 4%
Of Those With: Good general report 4% Fair general report 7% Poor general report 78%
Rewards Recommended 16% Phase advancement 53% Phase accountability 13% T-shirt 13%
Of Those With: Good general report 28% Fair general report 0% Poor general report 0%
Other (inspirational card, journal, key chain) 20%
Table 3-1: SJTC Court OperationsStructured Staffing Observation
18% Other (essay, extend probation, increase court appearances, school sheets)

Chapter Three Page 21 of 75
A reward was recommended in 16% of the cases. Of those with a good report, 28% were recommended for a reward, whereas no one with a fair or poor report was so recommended. Almost two-thirds of the rewards involved a phase promotion (53% involved phase advancement and an additional 13% was phase “accountability,” which means the judge asked the youth to prepare a statement about why he or she should advance to the next phase at the next court date). Thirteen percent of the juveniles received a T-shirt, and 20% received some other reward, such as an inspirational card, a journal, or a key chain.
Inside the Courtroom After having attended the staff meetings, researchers sat in Court and observed how the same 110 cases were handled by the judge (see Table 3-2). On average, each appearance took about two minutes.7 Appearances were more than twice as long for participants with a poor general report from the morning staff meeting (4.29 minutes compared to less than two minutes for both the fair and good general report participants).
A parent was present in Court for about two-thirds of the appearances.8 As expected, a parent was in Court much more frequently for a youth that had a poor general report from the staff (89% of the “poor” juveniles). Sixty percent and 64%, respectively, of the youth who had fair and good reports had a parent in Court. Judicial Interaction For each appearance, the case manager called the case and gave a brief update to the judge. The County Attorney and Law Guardian were present (the Law Guardian stood with her client), but the majority of the conversation was between the youth and the judge. If the parent was in Court, the judge may ask the parent to stand and describe how the youth is doing at home. When the judge talked with the youth, he most frequently offered strongly supportive comments (at 61% of appearances) or asked about the juvenile’s family life (51%). The judge also regularly asked about the participant’s school or job (33%) or progress in treatment (23%). The judge gave strongly supportive comments to almost two-thirds of the participants (61%) and strongly punitive comments to 21%. Those youth with a “good” general report were more likely to receive strongly supportive comments (80%) or be asked about their family life (60%) than other youth. Not surprisingly, those who had a “poor” general report were more likely to receive strongly punitive comments (50%) than supportive ones (14%). The judge also asked the youth with poor reports about their school or job (43%), progress in treatment (36%), and their prior court appearances (21%) more frequently than he asked other youth about these subjects. The youth who had a fair report by the staff fell in between the youth with good or poor reports with respect to supportive and punitive comments, and had a diverse range of judicial interactions. Court Responses As shown in Table 3-3, in staffing meetings the team recommended a sanction for 29% of the youth, but only 19% received a sanction in Court. The judges gave fewer secure remands and more nonsecure remands than were recommended, although the total number of remands ordered was the same. The implication is that the judges and team agreed on the youth who
7 This statistic was only recorded for 33% of the observed appearances (n=36). 8 This statistic was only recorded for 68% of the observed appearances (n=75).
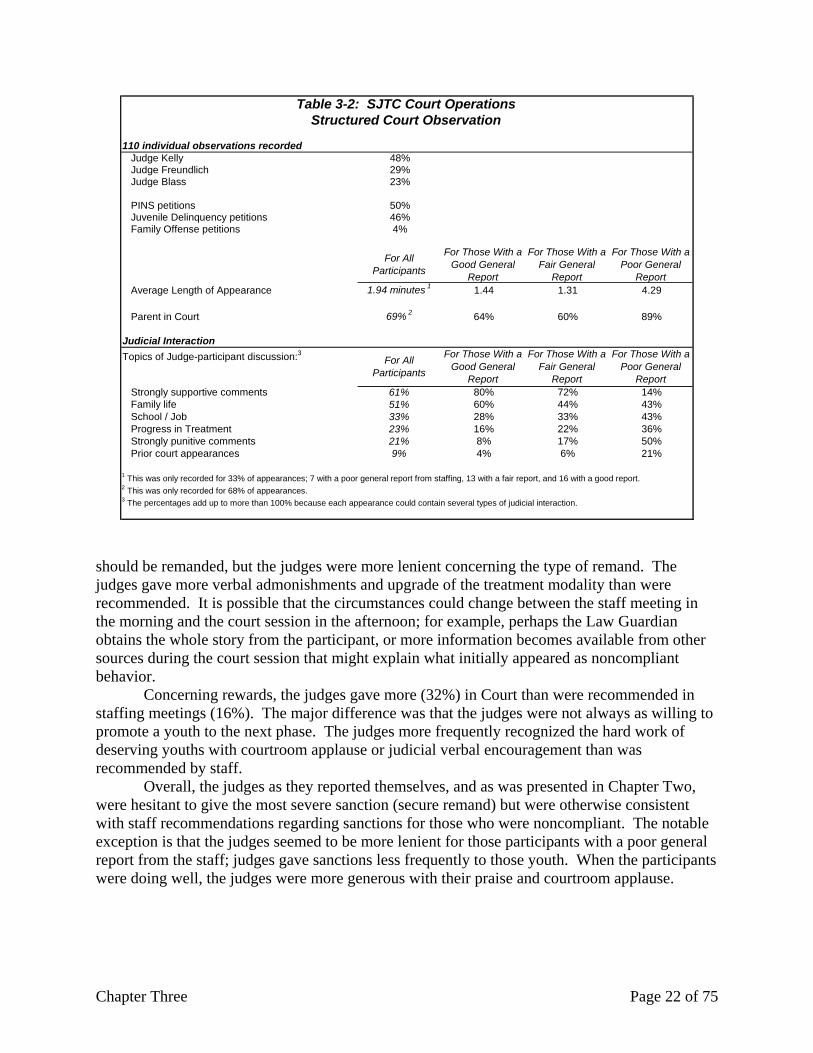
Chapter Three Page 22 of 75
110 individual observations recorded Judge Kelly 48% Judge Freundlich 29% Judge Blass 23%
PINS petitions 50% Juvenile Delinquency petitions 46% Family Offense petitions 4%
Average Length of Appearance 1.94 minutes 1 1.44 1.31 4.29
Parent in Court 69% 2 64% 60% 89%
Judicial InteractionTopics of Judge-participant discussion:3
Strongly supportive comments 61% 80% 72% 14% Family life 51% 60% 44% 43% School / Job 33% 28% 33% 43% Progress in Treatment 23% 16% 22% 36% Strongly punitive comments 21% 8% 17% 50% Prior court appearances 9% 4% 6% 21%
1 This was only recorded for 33% of appearances; 7 with a poor general report from staffing, 13 with a fair report, and 16 with a good report.2 This was only recorded for 68% of appearances.3 The percentages add up to more than 100% because each appearance could contain several types of judicial interaction.
Table 3-2: SJTC Court Operations
For Those With a Poor General
Report
For Those With a Fair General
Report
For Those With a Good General
Report
Structured Court Observation
For All Participants
For Those With a Good General
Report
For Those With a Fair General
Report
For Those With a Poor General
Report
For All Participants
should be remanded, but the judges were more lenient concerning the type of remand. The judges gave more verbal admonishments and upgrade of the treatment modality than were recommended. It is possible that the circumstances could change between the staff meeting in the morning and the court session in the afternoon; for example, perhaps the Law Guardian obtains the whole story from the participant, or more information becomes available from other sources during the court session that might explain what initially appeared as noncompliant behavior. Concerning rewards, the judges gave more (32%) in Court than were recommended in staffing meetings (16%). The major difference was that the judges were not always as willing to promote a youth to the next phase. The judges more frequently recognized the hard work of deserving youths with courtroom applause or judicial verbal encouragement than was recommended by staff.
Overall, the judges as they reported themselves, and as was presented in Chapter Two, were hesitant to give the most severe sanction (secure remand) but were otherwise consistent with staff recommendations regarding sanctions for those who were noncompliant. The notable exception is that the judges seemed to be more lenient for those participants with a poor general report from the staff; judges gave sanctions less frequently to those youth. When the participants were doing well, the judges were more generous with their praise and courtroom applause.
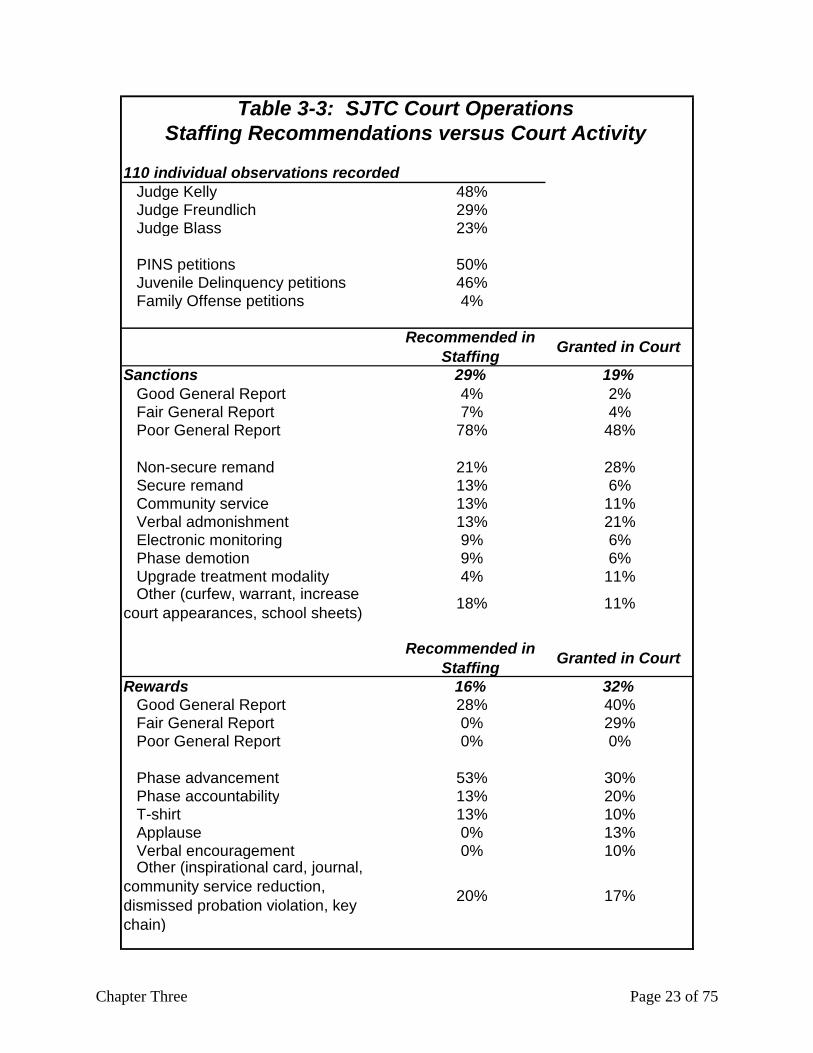
Chapter Three Page 23 of 75
110 individual observations recorded Judge Kelly 48% Judge Freundlich 29% Judge Blass 23%
PINS petitions 50% Juvenile Delinquency petitions 46% Family Offense petitions 4%
Sanctions 29% 19% Good General Report 4% 2% Fair General Report 7% 4% Poor General Report 78% 48% Non-secure remand 21% 28% Secure remand 13% 6% Community service 13% 11% Verbal admonishment 13% 21% Electronic monitoring 9% 6% Phase demotion 9% 6% Upgrade treatment modality 4% 11%
Rewards 16% 32% Good General Report 28% 40% Fair General Report 0% 29% Poor General Report 0% 0%
Phase advancement 53% 30% Phase accountability 13% 20% T-shirt 13% 10% Applause 0% 13% Verbal encouragement 0% 10% Other (inspirational card, journal, community service reduction, dismissed probation violation, key chain)
17%20%
Recommended in Staffing Granted in Court
Other (curfew, warrant, increase court appearances, school sheets) 11%18%
Granted in CourtRecommended in Staffing
Table 3-3: SJTC Court OperationsStaffing Recommendations versus Court Activity
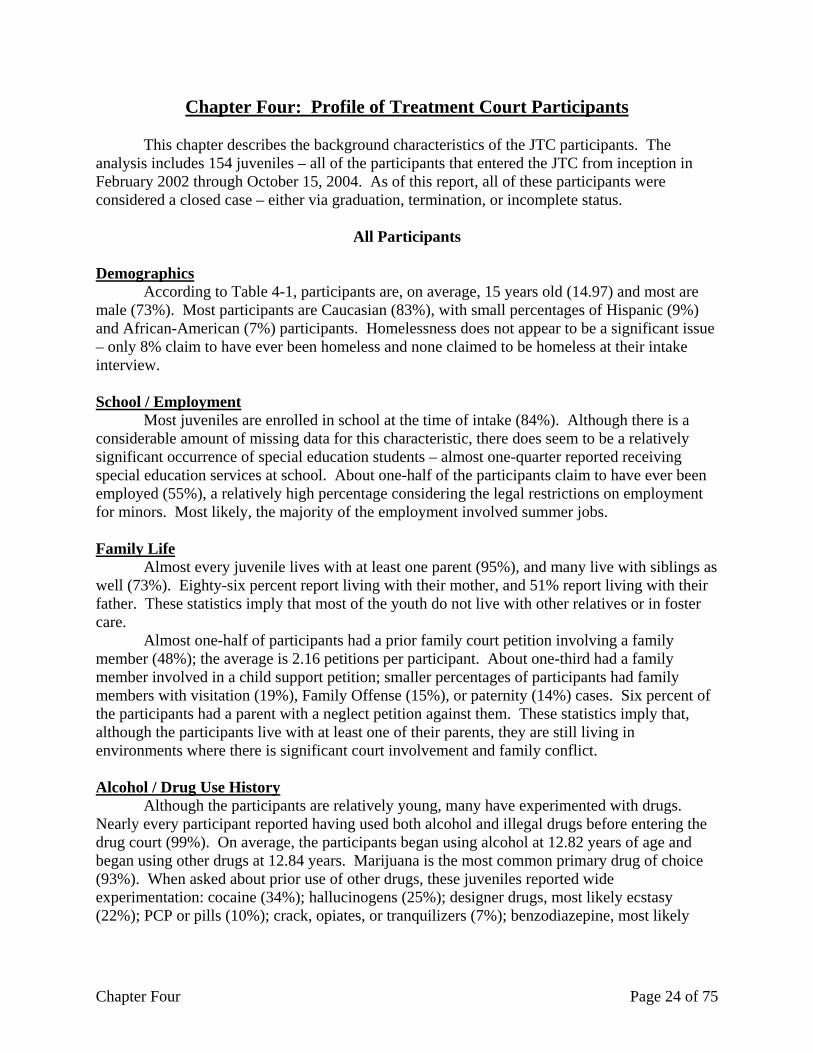
Chapter Four Page 24 of 75
Chapter Four: Profile of Treatment Court Participants
This chapter describes the background characteristics of the JTC participants. The analysis includes 154 juveniles – all of the participants that entered the JTC from inception in February 2002 through October 15, 2004. As of this report, all of these participants were considered a closed case – either via graduation, termination, or incomplete status.
All Participants
Demographics
According to Table 4-1, participants are, on average, 15 years old (14.97) and most are male (73%). Most participants are Caucasian (83%), with small percentages of Hispanic (9%) and African-American (7%) participants. Homelessness does not appear to be a significant issue – only 8% claim to have ever been homeless and none claimed to be homeless at their intake interview. School / Employment
Most juveniles are enrolled in school at the time of intake (84%). Although there is a considerable amount of missing data for this characteristic, there does seem to be a relatively significant occurrence of special education students – almost one-quarter reported receiving special education services at school. About one-half of the participants claim to have ever been employed (55%), a relatively high percentage considering the legal restrictions on employment for minors. Most likely, the majority of the employment involved summer jobs.
Family Life
Almost every juvenile lives with at least one parent (95%), and many live with siblings as well (73%). Eighty-six percent report living with their mother, and 51% report living with their father. These statistics imply that most of the youth do not live with other relatives or in foster care.
Almost one-half of participants had a prior family court petition involving a family member (48%); the average is 2.16 petitions per participant. About one-third had a family member involved in a child support petition; smaller percentages of participants had family members with visitation (19%), Family Offense (15%), or paternity (14%) cases. Six percent of the participants had a parent with a neglect petition against them. These statistics imply that, although the participants live with at least one of their parents, they are still living in environments where there is significant court involvement and family conflict. Alcohol / Drug Use History
Although the participants are relatively young, many have experimented with drugs. Nearly every participant reported having used both alcohol and illegal drugs before entering the drug court (99%). On average, the participants began using alcohol at 12.82 years of age and began using other drugs at 12.84 years. Marijuana is the most common primary drug of choice (93%). When asked about prior use of other drugs, these juveniles reported wide experimentation: cocaine (34%); hallucinogens (25%); designer drugs, most likely ecstasy (22%); PCP or pills (10%); crack, opiates, or tranquilizers (7%); benzodiazepine, most likely

Chapter Four Page 25 of 75
Number of Participants 154
DemographicsAge at Arrest 14.97Male 73%Race / Ethnicity Caucasian 83% African-American 7% Hispanic 9%Ever Homeless 8%Currently Homeless 0%
School / EmploymentCurrently in School 84%Highest Grade Completed Less than 8th grade 3% 8th grade 22% 9th grade 45% 10th grade 22% 11th grade 6% HS diploma/GED 2%Special Education 23%Ever Employed 55%
Family LifeWho Lives With Juvenile Parent(s) (Maybe Siblings) 95% Parent(s), No Siblings 22% Parent(s), Siblings 73% Other Family Members 3% Foster Care/Group Home 1% Other 1%Ever in Foster Care 2%Adopted 2%Mom Lives With Juvenile 86%Dad Lives With Juvenile 51%Any Prior Family Court Family Member Petitions 48%Mean Family Court Family Member Petitions (all types) 2.16 Support (F) 34% Visitation (V) 19% Family Offense (O) 15% Paternity (P) 14% Neglect (NN) 6% Abuse (NA) 1% Permanent Termination of Parental Rights (B) 1% Foster Care Review (K) 1%
All ParticipantsTable 4-1: Participant Profile at Intake
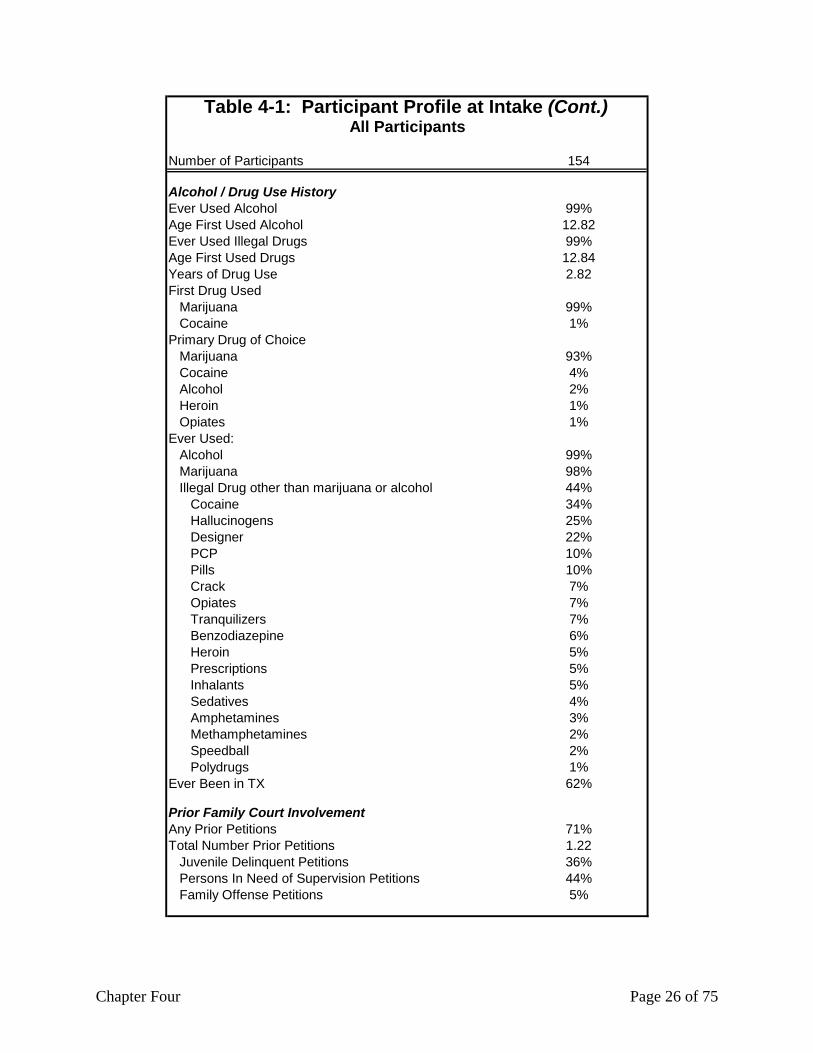
Chapter Four Page 26 of 75
Number of Participants 154
Alcohol / Drug Use HistoryEver Used Alcohol 99%Age First Used Alcohol 12.82Ever Used Illegal Drugs 99%Age First Used Drugs 12.84Years of Drug Use 2.82First Drug Used Marijuana 99% Cocaine 1%Primary Drug of Choice Marijuana 93% Cocaine 4% Alcohol 2% Heroin 1% Opiates 1%Ever Used: Alcohol 99% Marijuana 98% Illegal Drug other than marijuana or alcohol 44% Cocaine 34% Hallucinogens 25% Designer 22% PCP 10% Pills 10% Crack 7% Opiates 7% Tranquilizers 7% Benzodiazepine 6% Heroin 5% Prescriptions 5% Inhalants 5% Sedatives 4% Amphetamines 3% Methamphetamines 2% Speedball 2% Polydrugs 1%Ever Been in TX 62%
Prior Family Court InvolvementAny Prior Petitions 71%Total Number Prior Petitions 1.22 Juvenile Delinquent Petitions 36% Persons In Need of Supervision Petitions 44% Family Offense Petitions 5%
Table 4-1: Participant Profile at Intake (Cont.)All Participants

Chapter Four Page 27 of 75
valium (6%); and heroin, inhalants, or prescription drugs (5%). Overall, 44% of the participants reported having tried at least one other drug besides marijuana or alcohol. Therefore, while these juveniles are primarily using alcohol and/or marijuana, many are also experimenting with other serious drugs. In fact, well over one-half (62%) of these juveniles reported that they had already attended a drug treatment program prior to entering the drug court. Prior Family Court Involvement
Almost three-quarters of the participants (71%) have been a respondent themselves on a prior family court petition. Most frequently, the prior petition was for Persons in Need of Supervision (PINS; 44%) or a Juvenile Delinquency arrest (JD; 36%). On average, participants have had 1.22 prior family court petitions. Instant Case Information
Most participants entered the JTC on a JD or PINS petition (46% each). The remainder are mostly Family Offense cases (8%). One case is a “designated felony”. Two-thirds of the participants entered on a supplemental docket to the original petition – in other words, some type of subsequent violation on an older case. Most of the supplemental dockets were for violations of probation or of a dispositional order. (A dispositional order is akin to a “sentence” in criminal court, such as probation or mandated services.)
Charges for the JDs were varied, with more misdemeanors (56%) than felonies (44%). The most common charge was property offense (66%), followed by drug-related (9%) and assault (6%) charges.
As discussed in Chapter Two, all participants are sentenced to probation with the condition of completing Treatment Court. The length of probation is most commonly either one (48%) or two years (45%).
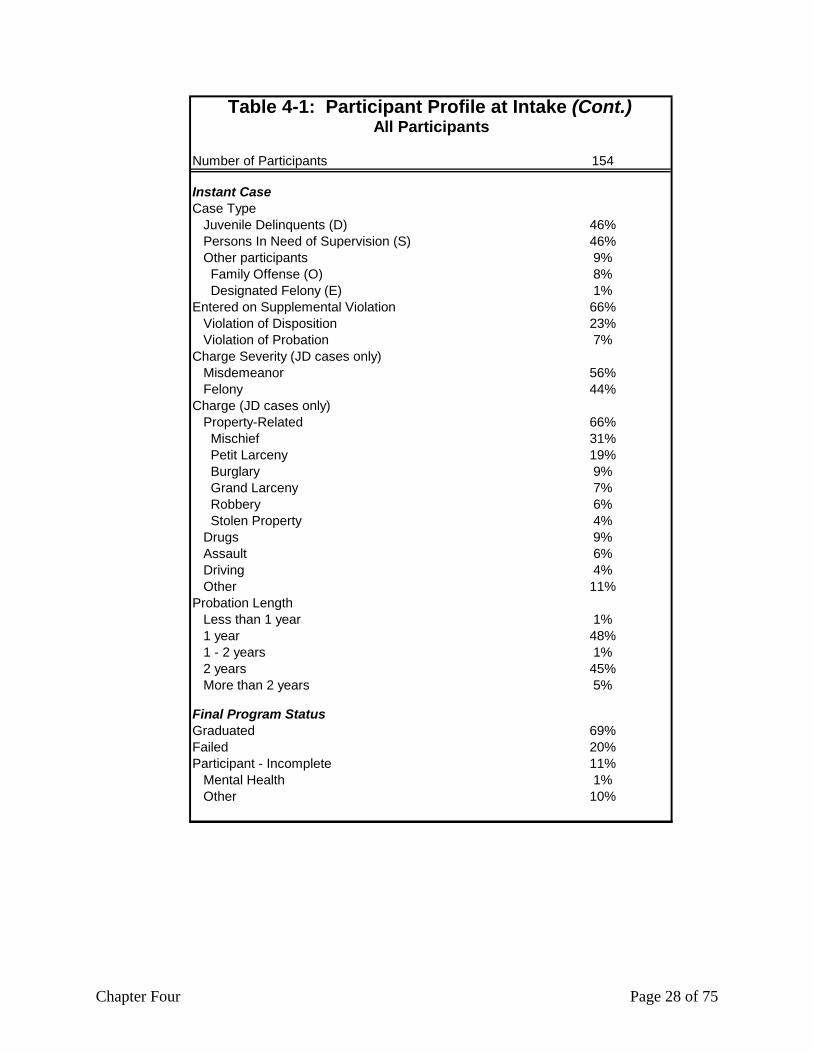
Chapter Four Page 28 of 75
Number of Participants 154
Instant CaseCase Type Juvenile Delinquents (D) 46% Persons In Need of Supervision (S) 46% Other participants 9% Family Offense (O) 8% Designated Felony (E) 1%Entered on Supplemental Violation 66% Violation of Disposition 23% Violation of Probation 7%Charge Severity (JD cases only) Misdemeanor 56% Felony 44%Charge (JD cases only) Property-Related 66% Mischief 31% Petit Larceny 19% Burglary 9% Grand Larceny 7% Robbery 6% Stolen Property 4% Drugs 9% Assault 6% Driving 4% Other 11%Probation Length Less than 1 year 1% 1 year 48% 1 - 2 years 1% 2 years 45% More than 2 years 5%
Final Program StatusGraduated 69%Failed 20%Participant - Incomplete 11% Mental Health 1% Other 10%
Table 4-1: Participant Profile at Intake (Cont.)All Participants
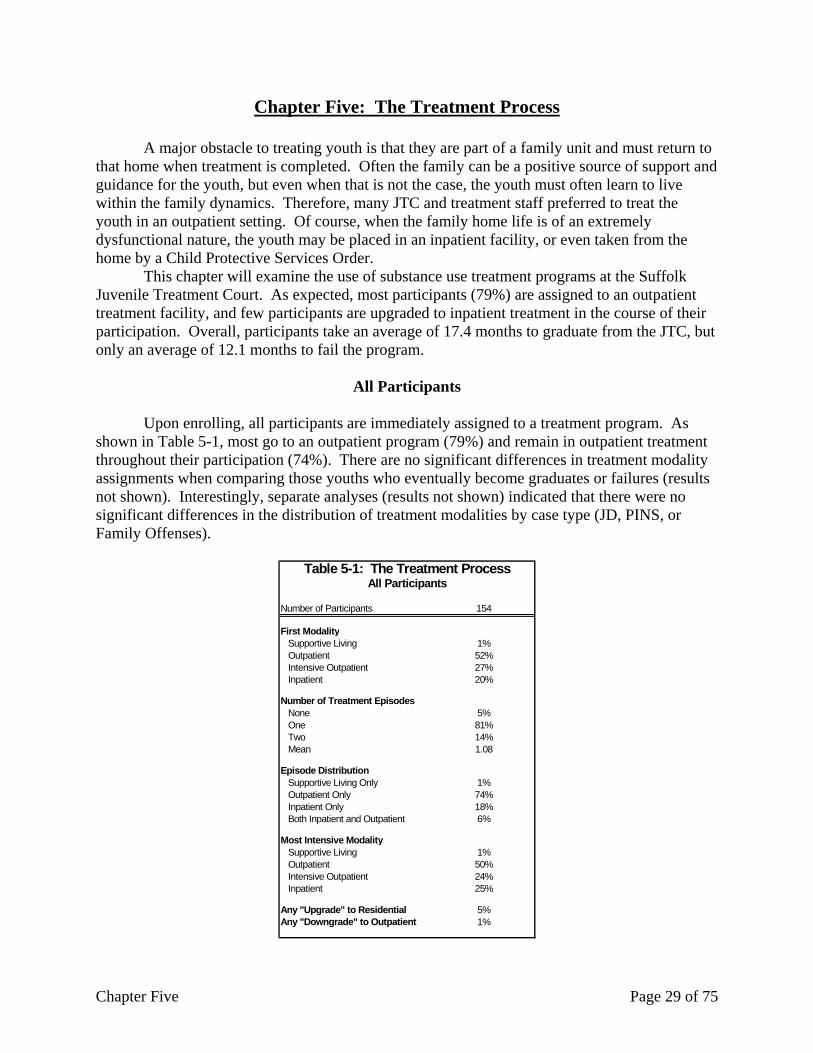
Chapter Five Page 29 of 75
Chapter Five: The Treatment Process
A major obstacle to treating youth is that they are part of a family unit and must return to that home when treatment is completed. Often the family can be a positive source of support and guidance for the youth, but even when that is not the case, the youth must often learn to live within the family dynamics. Therefore, many JTC and treatment staff preferred to treat the youth in an outpatient setting. Of course, when the family home life is of an extremely dysfunctional nature, the youth may be placed in an inpatient facility, or even taken from the home by a Child Protective Services Order.
This chapter will examine the use of substance use treatment programs at the Suffolk Juvenile Treatment Court. As expected, most participants (79%) are assigned to an outpatient treatment facility, and few participants are upgraded to inpatient treatment in the course of their participation. Overall, participants take an average of 17.4 months to graduate from the JTC, but only an average of 12.1 months to fail the program.
All Participants
Upon enrolling, all participants are immediately assigned to a treatment program. As shown in Table 5-1, most go to an outpatient program (79%) and remain in outpatient treatment throughout their participation (74%). There are no significant differences in treatment modality assignments when comparing those youths who eventually become graduates or failures (results not shown). Interestingly, separate analyses (results not shown) indicated that there were no significant differences in the distribution of treatment modalities by case type (JD, PINS, or Family Offenses).
Number of Participants 154
First Modality Supportive Living 1% Outpatient 52% Intensive Outpatient 27% Inpatient 20%
Number of Treatment Episodes None 5% One 81% Two 14% Mean 1.08
Episode Distribution Supportive Living Only 1% Outpatient Only 74% Inpatient Only 18% Both Inpatient and Outpatient 6%
Most Intensive Modality Supportive Living 1% Outpatient 50% Intensive Outpatient 24% Inpatient 25%
Any "Upgrade" to Residential 5%Any "Downgrade" to Outpatient 1%
Table 5-1: The Treatment ProcessAll Participants
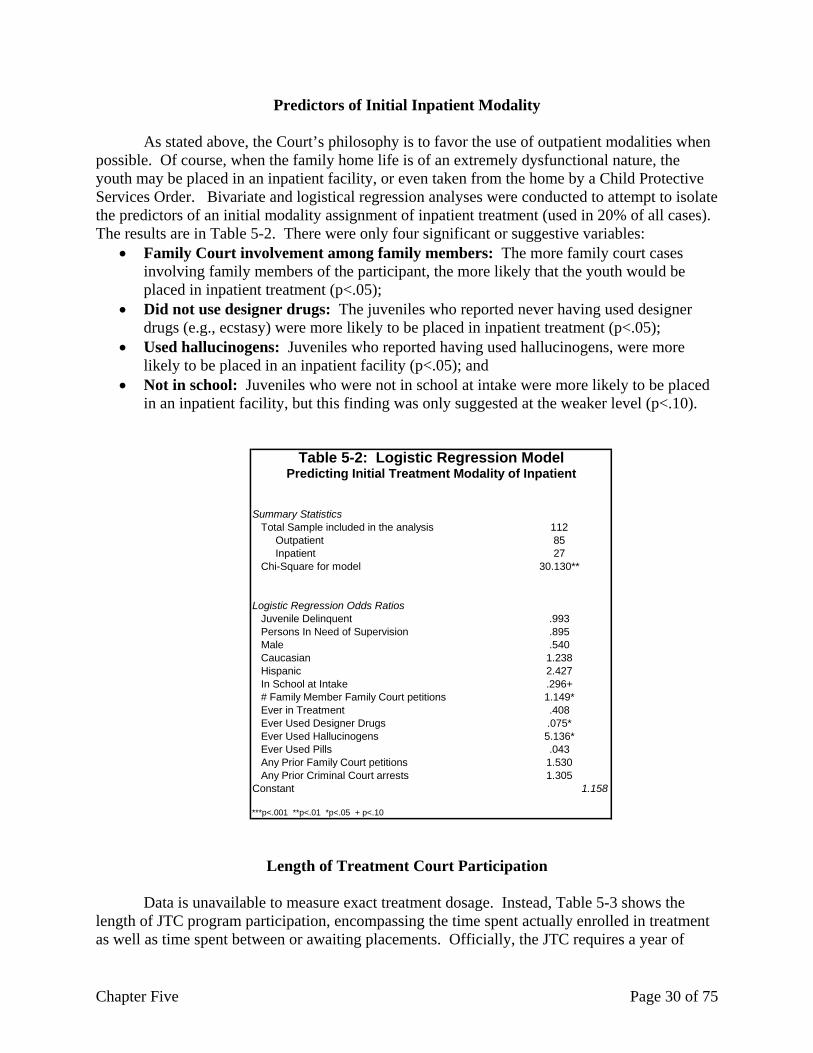
Chapter Five Page 30 of 75
Predictors of Initial Inpatient Modality
As stated above, the Court’s philosophy is to favor the use of outpatient modalities when possible. Of course, when the family home life is of an extremely dysfunctional nature, the youth may be placed in an inpatient facility, or even taken from the home by a Child Protective Services Order. Bivariate and logistical regression analyses were conducted to attempt to isolate the predictors of an initial modality assignment of inpatient treatment (used in 20% of all cases). The results are in Table 5-2. There were only four significant or suggestive variables:
• Family Court involvement among family members: The more family court cases involving family members of the participant, the more likely that the youth would be placed in inpatient treatment (p<.05);
• Did not use designer drugs: The juveniles who reported never having used designer drugs (e.g., ecstasy) were more likely to be placed in inpatient treatment (p<.05);
• Used hallucinogens: Juveniles who reported having used hallucinogens, were more likely to be placed in an inpatient facility (p<.05); and
• Not in school: Juveniles who were not in school at intake were more likely to be placed in an inpatient facility, but this finding was only suggested at the weaker level (p<.10).
Summary Statistics Total Sample included in the analysis 112 Outpatient 85 Inpatient 27 Chi-Square for model 30.130**
Logistic Regression Odds Ratios Juvenile Delinquent .993 Persons In Need of Supervision .895 Male .540 Caucasian 1.238 Hispanic 2.427 In School at Intake .296+ # Family Member Family Court petitions 1.149* Ever in Treatment .408 Ever Used Designer Drugs .075* Ever Used Hallucinogens 5.136* Ever Used Pills .043 Any Prior Family Court petitions 1.530 Any Prior Criminal Court arrests 1.305Constant 1.158
***p<.001 **p<.01 *p<.05 + p<.10
Table 5-2: Logistic Regression ModelPredicting Initial Treatment Modality of Inpatient
Length of Treatment Court Participation
Data is unavailable to measure exact treatment dosage. Instead, Table 5-3 shows the length of JTC program participation, encompassing the time spent actually enrolled in treatment as well as time spent between or awaiting placements. Officially, the JTC requires a year of

Chapter Five Page 31 of 75
consecutive drug-free and sober time for graduation, but due to relapse, it often takes much longer to accumulate that amount of time. At the JTC, it takes an average of 17.4 months to graduate, while those who fail do so after less time (on average, 12.1 months). The 17+ month average time to graduation is slightly longer than the 15-month average in several studies of adult drug courts (Rempel et al 2003, Zweig and Schaeffer 2004). There was no difference between average length of participation for JD and PINS cases.
Average MonthsAll Participants (154) 16.18
Final Program Status Graduates (106) 17.39** Failures (31) 12.12 Incompletes (17) 15.59
Case Type Juvenile Delinquents (70) 15.93 Graduates (45) 17.42 Failures (17) 12.44
Persons In Need of Supervision (71) 16.01 Graduates (49) 17.03 Failures (13) 11.71
Other Types (13) 18.44 Graduates (12) 18.78 Failures (0)
All Participants, By Final Program Status, Case TypeTable 5-3: Exposure to Drug Court
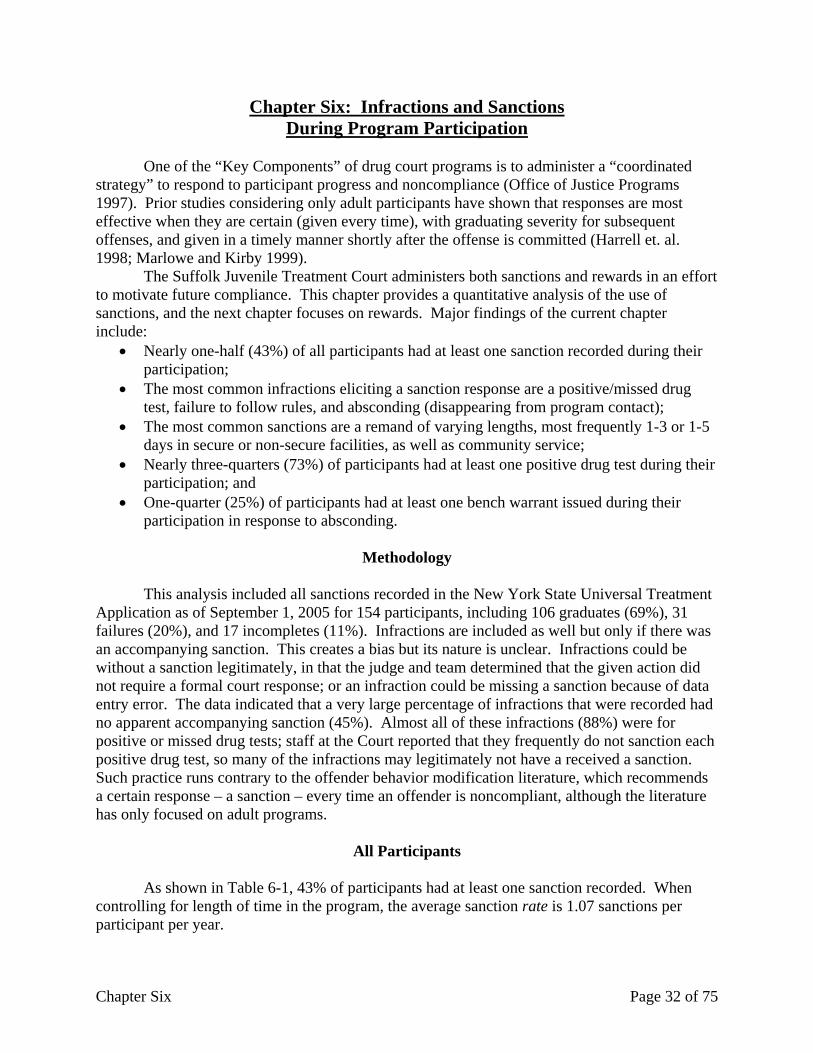
Chapter Six Page 32 of 75
Chapter Six: Infractions and Sanctions During Program Participation
One of the “Key Components” of drug court programs is to administer a “coordinated strategy” to respond to participant progress and noncompliance (Office of Justice Programs 1997). Prior studies considering only adult participants have shown that responses are most effective when they are certain (given every time), with graduating severity for subsequent offenses, and given in a timely manner shortly after the offense is committed (Harrell et. al. 1998; Marlowe and Kirby 1999).
The Suffolk Juvenile Treatment Court administers both sanctions and rewards in an effort to motivate future compliance. This chapter provides a quantitative analysis of the use of sanctions, and the next chapter focuses on rewards. Major findings of the current chapter include:
• Nearly one-half (43%) of all participants had at least one sanction recorded during their participation;
• The most common infractions eliciting a sanction response are a positive/missed drug test, failure to follow rules, and absconding (disappearing from program contact);
• The most common sanctions are a remand of varying lengths, most frequently 1-3 or 1-5 days in secure or non-secure facilities, as well as community service;
• Nearly three-quarters (73%) of participants had at least one positive drug test during their participation; and
• One-quarter (25%) of participants had at least one bench warrant issued during their participation in response to absconding.
Methodology
This analysis included all sanctions recorded in the New York State Universal Treatment
Application as of September 1, 2005 for 154 participants, including 106 graduates (69%), 31 failures (20%), and 17 incompletes (11%). Infractions are included as well but only if there was an accompanying sanction. This creates a bias but its nature is unclear. Infractions could be without a sanction legitimately, in that the judge and team determined that the given action did not require a formal court response; or an infraction could be missing a sanction because of data entry error. The data indicated that a very large percentage of infractions that were recorded had no apparent accompanying sanction (45%). Almost all of these infractions (88%) were for positive or missed drug tests; staff at the Court reported that they frequently do not sanction each positive drug test, so many of the infractions may legitimately not have a received a sanction. Such practice runs contrary to the offender behavior modification literature, which recommends a certain response – a sanction – every time an offender is noncompliant, although the literature has only focused on adult programs.
All Participants
As shown in Table 6-1, 43% of participants had at least one sanction recorded. When controlling for length of time in the program, the average sanction rate is 1.07 sanctions per participant per year.

Chapter Six Page 33 of 75
Number of Participants 154(Pairs of Events) (181)
% With At Least One Sanction 43%% With At Least One Remand Sanction 27%Sanction Rate 1.07
(For Those With At Least 1 Sanction) (N = 66) Sanction Rate 2.50
Infractions Recognized Positive / Missed Drug Test 41% Failure to Follow Rules 23% Absconding 16% Poor Attitude 6% Missed Appointment - court or treatment 6% Failure to Follow Judge's Directions 4% New arrest 1% Other 6%
Sanctions Remand 35% Remand - judge's discretion 2% Remand - 1-3 days 18% Remand - 1-5 days 10% Remand - 6-10 days 3% Community Service 19% CS - 1-25 hrs 9% CS - 26-50 hrs 9% CS - 51-75 hrs 1% Verbal admonishment 12% Increase in treatment / court level 8% Sanctions deferred 5% Electronic monitoring 4% Other 9%
Remand Sanctions(For Those With At Least 1 Sanction) (N = 66)% With At Least One Remand Sanction 62%First sanction = Remand? 39%% All Sanctions = Remand 35%
(For Those With At Least 1 Remand Sanction) (N = 39)Total Days in Remand Sanctions 4.82First Remand Sanction % Remand on 1st Sanction 62% When is First Remand Sanction 1.62
Note: 45% of infractions did not have a recorded sanction and are not included in this analysis. 88% of these infractions were for dirty/missed urines which the court does not always sanction.
Table 6-1: Infractions & SanctionsAll Participants

Chapter Six Page 34 of 75
Infractions The most common infraction eliciting a sanction response was a positive or missed drug
test (41% of all infractions), with failure to follow rules (23%) and absconding (16%) also common. Other infractions include poor attitude (6%), missed treatment or court appointment (6%), and failure to follow the judge’s directions (4%). New arrests/petitions comprise only 1% and absconding only 16% of all underlying infractions. Sanctions
In response to the above infractions, the most common sanction is remand, comprising over one-third (35%) of all sanctions; the remand is most frequently short, at 1-3 days (18%) or 1-5 days (10%). Remand for 6-10 days (3%) or for an undisclosed amount of time (2%) are ordered less frequently. The next most common sanction is community service (19%) for either 1-25 hours or 26-50 hours (each 9%). Although the judges interact with each participant at each appearance, when the interaction becomes punitive, the action is recorded as a verbal admonishment (12%). Other sanctions were an increase in the treatment level/frequency of court appearances (8%) or electronic monitoring (9%).
Twenty-seven percent of all participants received at least one remand. For those with at least one sanction, 62% received a remand. Of those same participants with at least one sanction, 39% received a remand as the first sanction. Overall, those participants who had at least one remand spent approximately 4.82 days total in remand throughout their participation. Drug Test Results and Warrants
The New York State Universal Treatment Application provides detailed compliance information on drug test results and warrants (issued when a participant disappears from contact), independent of whether or not a sanction was involved. Results in Table 6-2 indicate a particularly high percentage of participants (73%) with at least one positive drug test at some point during their participation. Warranting, choosing to leave the program unexcused for an unspecified period of time, is one of the most serious acts of noncompliance. One-quarter (25%) of juveniles had at least one bench warrant issued.
Chapter Six Page 35 of 75
Number of Participants 154
DRUG TESTS% With At Least One Positive Test 73%# Drug Tests 15.09# Positive Drug Tests 1.97% Positive Drug Tests 15% % Positive Drug Tests - for serious drug 2% % Positive Drug Tests - for marijuana only 11%
Days to First Test 3.59First Drug Test Results Negative 65% Marijuana only 30% Serious Drug 5%
(For Those With At Least One Positive Drug Test) (N = 108)# Positive Drug Tests 2.70% Positive Drug Tests 21% % Positive Drug Tests - for serious drug 2% % Positive Drug Tests - for marijuana only 15%
WARRANTSAny warrants 25%Warranted within 30 days 3%Warrant Rate (# warrants / partic. / year) 0.31Total Days Out On Warrant 3.87
(For Those With At Least One Warrant) (N = 34)Warranted within 30 days 12%Warrant Rate (# warrants / partic. / year) 0.94Total Days Out On Warrant 9.7
Table 6-2: Drug Tests & WarrantsAll Participants
Graduates and Failures
Termination from drug court is most commonly associated with continued noncompliance – failure to follow rules, to appear at scheduled appointments or court appearances, and to remain drug-free. Therefore, it is not surprising that sanction rates are higher for youths who failed the program than for those who graduated. However, even those who succeed generally have positive drug tests, and missed appointments (see Tables 6-3 and 6-4), a finding consistent with research on adult drug courts. As noted above, the data quality for infractions and sanctions was inconsistently recorded in the Universal Treatment Application.9
9 It is important to note that only 43% of youths who graduate and, more telling, only 27% of those who fail the program have a sanction recorded. It is extremely unlikely that the incidence of sanctions is this low, in particular for those who fail the program. Clearly, the electronic record keeping of sanctions is not consistent and serves as a caveat for the entire chapter, as well as the next chapter -- where the same pattern can be seen –with respect to rewards. Staff of the program report that the statewide database offered only a limited number of possible sanctions and rewards that could be recorded and the options available were often not specific to juveniles.
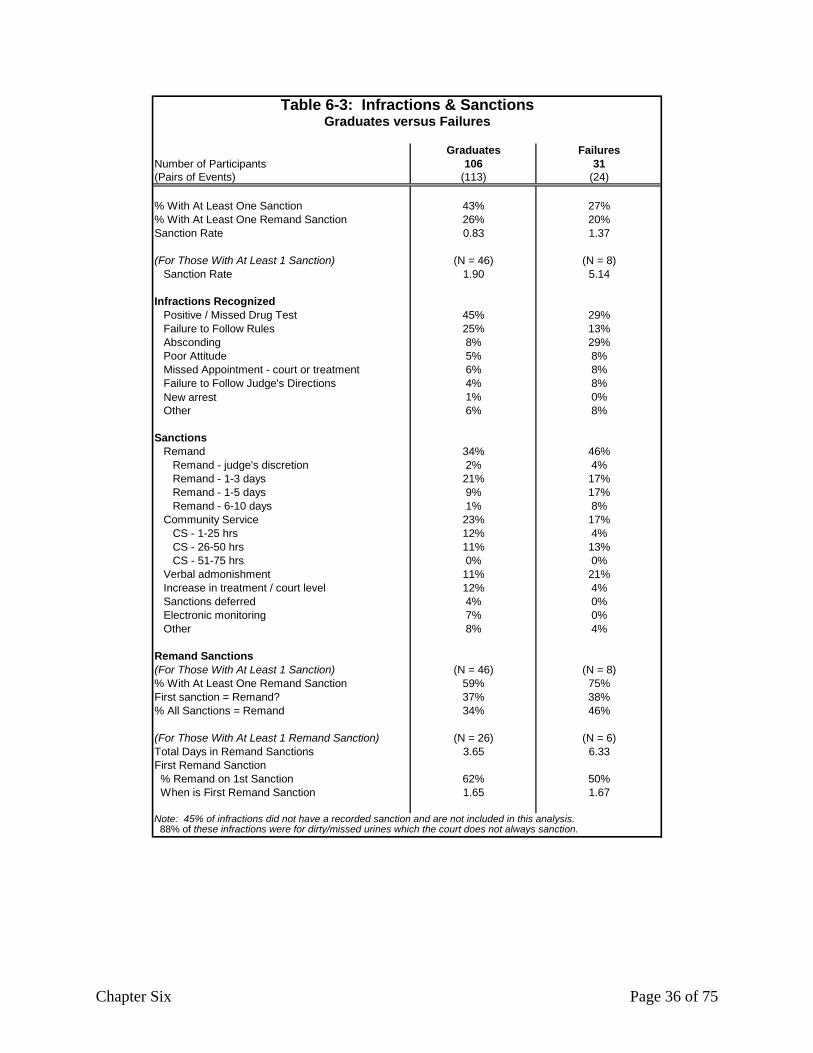
Chapter Six Page 36 of 75
Graduates FailuresNumber of Participants 106 31(Pairs of Events) (113) (24)
% With At Least One Sanction 43% 27%% With At Least One Remand Sanction 26% 20%Sanction Rate 0.83 1.37
(For Those With At Least 1 Sanction) (N = 46) (N = 8) Sanction Rate 1.90 5.14
Infractions Recognized Positive / Missed Drug Test 45% 29% Failure to Follow Rules 25% 13% Absconding 8% 29% Poor Attitude 5% 8% Missed Appointment - court or treatment 6% 8% Failure to Follow Judge's Directions 4% 8% New arrest 1% 0% Other 6% 8%
Sanctions Remand 34% 46% Remand - judge's discretion 2% 4% Remand - 1-3 days 21% 17% Remand - 1-5 days 9% 17% Remand - 6-10 days 1% 8% Community Service 23% 17% CS - 1-25 hrs 12% 4% CS - 26-50 hrs 11% 13% CS - 51-75 hrs 0% 0% Verbal admonishment 11% 21% Increase in treatment / court level 12% 4% Sanctions deferred 4% 0% Electronic monitoring 7% 0% Other 8% 4%
Remand Sanctions(For Those With At Least 1 Sanction) (N = 46) (N = 8)% With At Least One Remand Sanction 59% 75%First sanction = Remand? 37% 38%% All Sanctions = Remand 34% 46%
(For Those With At Least 1 Remand Sanction) (N = 26) (N = 6)Total Days in Remand Sanctions 3.65 6.33First Remand Sanction % Remand on 1st Sanction 62% 50% When is First Remand Sanction 1.65 1.67
Note: 45% of infractions did not have a recorded sanction and are not included in this analysis. 88% of these infractions were for dirty/missed urines which the court does not always sanction.
Table 6-3: Infractions & SanctionsGraduates versus Failures

Chapter Six Page 37 of 75
Graduates FailuresNumber of Participants 106 31
DRUG TESTS% With At Least One Positive Test 69% 77%# Drug Tests 16.34 9.31***# Positive Drug Tests 1.88 1.73% Positive Drug Tests 13% 22%* % Positive Drug Tests - for serious drug 1% 3% % Positive Drug Tests - for marijuana only 9% 16%
Days to First Test 3.64 3.32First Drug Test Results Negative 66% 62% Marijuana only 29% 31% Serious Drug 6% 8%
(For Those With At Least One Positive Drug Test) (N = 73) (N = 20)# Positive Drug Tests 2.73 2.25% Positive Drug Tests 19% 28%* % Positive Drug Tests - for serious drug 2% 4% % Positive Drug Tests - for marijuana only 14% 21%+
WARRANTSAny warrants 17% 50%**Warranted within 30 days 2% 10%Warrant Rate (# warrants / partic. / year) 0.05 1.02**Total Days Out On Warrant 0.71 9.73*
(For Those With At Least One Warrant) (N = 16) (N = 13)Warranted within 30 days 13% 15%Warrant Rate (# warrants / partic. / year) 0.35 1.74*Total Days Out On Warrant 4.56 16.54
***p<.001 **p<.01 *p<.05 + p<.10
Table 6-4: Drug Tests & WarrantsGraduates versus Failures

Chapter Seven Page 38 of 75
Chapter Seven: Achievements and Rewards During Program Participation
Drug court practitioners and child development specialists generally believe that juvenile
offenders are more motivated than adults by incentives and encouragement (rewards) than by negative responses (sanctions). This chapter focuses on the use of rewards at the Suffolk Juvenile Treatment Court. Major findings include:
• More than one-half (61%) of all participants received at least one reward; • The most common achievements recognized were drug-free months and completion of
phases of treatment; and • The most common rewards included certificates for phase advancement, judge’s praise,
sober coins, recreational events, or other kinds of certificates.
Methodology
This analysis reflects all rewards recorded in the New York State Universal Treatment Application as of September 1, 2005 for the same 154 participants included in Chapter Six. Achievements are only included in this analysis if there is an accompanying reward. Since all but 4% of achievements had rewards identified, few achievements are excluded.
All Participants
As shown in Table 7-1, 61% of all participants received at least one reward. The reward rate was 0.96 rewards per participant per year. The achievements commonly recognized by the Court include each month of drug-free time (40%), phase completion to Phase 2 or Phase 3 (25%), and miscellaneous other achievements (such as observing all court requirements in a week). The Court also recognized employment, good grades in school, or other vocational achievement, but these were not common (2%).
In response to positive behavior, the most common rewards included a certificate for phase advancement (47%), judge’s praise (22%), sober coins (12%), recreational event (8%), or a certificate (8%). The Court is fortunate to be the recipient of several donations of sports tickets to both the New York Islanders hockey team and the Long Island Ducks (an independent professional baseball team). When a donation is made, the Court will give out several tickets to deserving juveniles to attend with their family. Anecdotally, one of the judges mentioned that he has occasionally given these tickets to a juvenile as a sanction when the judge felt that the youth needed to spend quality time with his or her family. The Court also frequently gives out T-shirts as a first reward, usually after the first 30 days clean.
Looking at Table 7-2, the most common response to phase completion was a phase advancement certificate. When looking at the month by month clean time achievements, the responses were more varied, including sober coins, praise from the judge, recreational event, and certificates were used throughout.
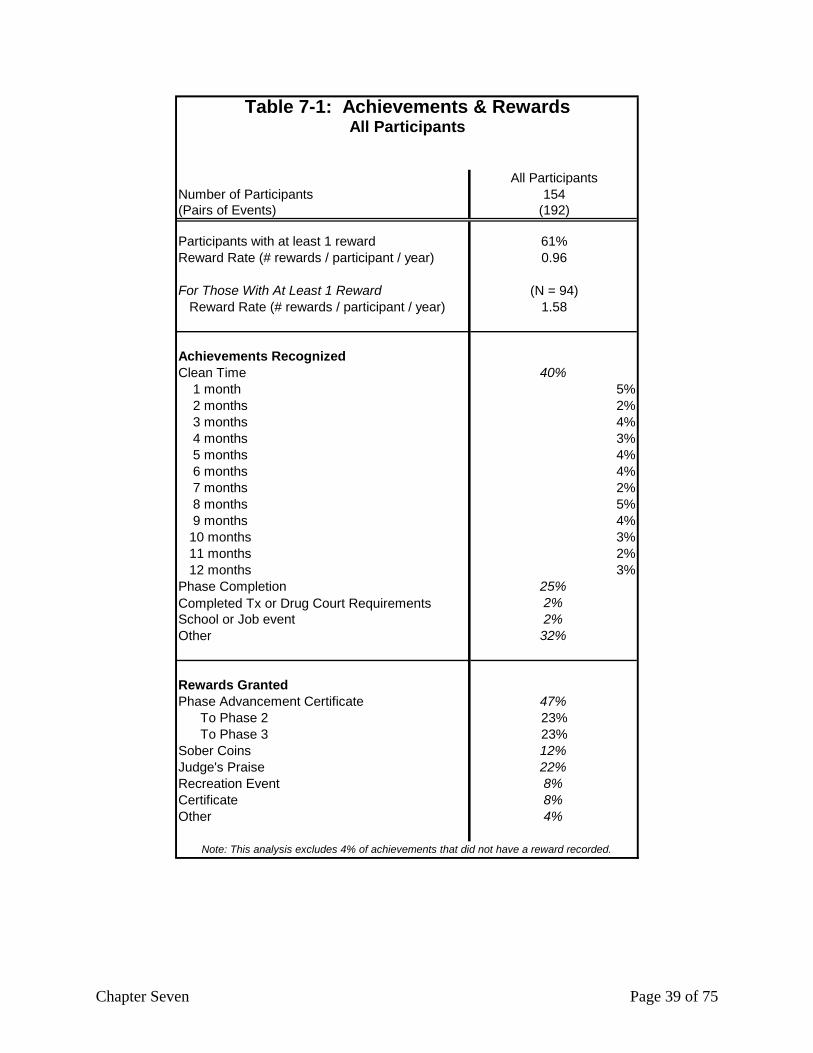
Chapter Seven Page 39 of 75
All ParticipantsNumber of Participants 154(Pairs of Events) (192)
Participants with at least 1 reward 61%Reward Rate (# rewards / participant / year) 0.96
For Those With At Least 1 Reward (N = 94) Reward Rate (# rewards / participant / year) 1.58
Achievements RecognizedClean Time 40% 1 month 5% 2 months 2% 3 months 4% 4 months 3% 5 months 4% 6 months 4% 7 months 2% 8 months 5% 9 months 4% 10 months 3% 11 months 2% 12 months 3%Phase Completion 25%Completed Tx or Drug Court Requirements 2%School or Job event 2%Other 32%
Rewards GrantedPhase Advancement Certificate 47% To Phase 2 23% To Phase 3 23%Sober Coins 12%Judge's Praise 22%Recreation Event 8%Certificate 8%Other 4%
Table 7-1: Achievements & RewardsAll Participants
Note: This analysis excludes 4% of achievements that did not have a reward recorded.

Chapter Seven Page 40 of 75
Praise from Judge Sober Coin Recreational Event Certificate Advance to Ph 2 Advance to Ph 3Clean 1 mth 0% 33% 0% 0% 56% 0%Clean 2 mth 50% 0% 0% 0% 50% 0%Clean 3 mth 0% 0% 13% 13% 50% 0%Clean 4 mth 40% 20% 0% 20% 20% 0%Clean 5 mth 38% 13% 0% 13% 38% 0%Clean 6 mth 13% 0% 13% 13% 25% 38%Clean 7 mth 0% 25% 0% 0% 25% 25%Clean 8 mth 0% 0% 0% 22% 11% 56%Clean 9 mth 0% 13% 13% 13% 0% 63%Clean 10 mth 0% 20% 0% 0% 0% 80%Clean 11 mth 33% 33% 33% 0% 0% 0%Clean 12 mth 33% 0% 17% 0% 0% 50%Phase Completion 2% 0% 6% 2% 47% 40%OVERALL 22% 12% 8% 8% 23% 23%
*Note: Percentages may not add up to 100% because of missing "other" rewards that are not reported here.
Ach
ieve
men
tsRewards
Table 7-2: Achievements & RewardsAll Participants

Chapter Eight Page 41 of 75
Chapter Eight: Drug Court Retention and Graduation
A retention rate indicates the ability of a drug court to keep its participants engaged over time. A one-year retention rate, for example, is based on the status of each participant exactly one year after entering the drug court; participants are considered retained if, after one year, they either have graduated or remain open and active in the program.
The Federal Office of Juvenile Justice and Delinquency Prevention released a report citing retention rates in seven “exemplary” juvenile drug courts (OJJDP 2001). The report did not cite a timeframe but the range of retention rates was between 56% and 77% for the seven programs; the median rate was 69%. The national average for adult drug courts has been estimated at 60% for a one-year retention rate (Belenko 1998). The Suffolk Juvenile Treatment Court achieved a one-year retention rate of 87% (see Table 8-1). Since some participants who are open as of the one-year mark can be expected subsequently to fail drug court, 18-month, two-year, and three-year retention rates drop somewhat lower. Both the two-year and three-year rates in Suffolk are 79%.
Assuming that some of the cases that are still open/retained at three years will not ultimately graduate, it is reasonable to assume a graduation rate in the range of 73% to 76%. This graduation rate compares favorably to the 48% national average graduation rate for adult drug courts estimated by the Congressional Government Accountability Office (1997).
Retention Rate Graduated Open Warranted Failed* # ParticipantsSix Months 91% 28% 63% 2% 7% 154One Year 87% 28% 59% 4% 9% 153Eighteen Months 83% 45% 38% 4% 13% 153Two Years 79% 52% 27% 2% 19% 153Three Years 79% 71% 7% 1% 21% 107
* There was 1 participant who had been closed as an incomplete at 18 months; there were 2 participants closed as incomplete at 2 years. These participants were added to the failed category.
Table 8-1: Participant Retention RatesAll Participants
Predictors of Retention Table 8-2 presents the results of a logistic regression predicting retention after one year.
Due to the very small sample size of the not retained group, characteristics were selected for the analysis if it appeared that there was a sizeable difference between the two populations (retained and not retained) regardless of statistical significance in the bivariate comparisons. Other notable factors found not to be significant in bivariate comparisons, and therefore not included in this regression analysis, were case type, age, gender, race, and primary drug of choice.
Only the number of prior family court cases of family members was statistically significant in this model (p<.05), with more such cases associated with a lower probability of retention. The results also imply that being in school at intake, having been in drug or alcohol treatment in the past, and not warranting in the first thirty days of participation may predict increased retention, but those relationships are not significant.
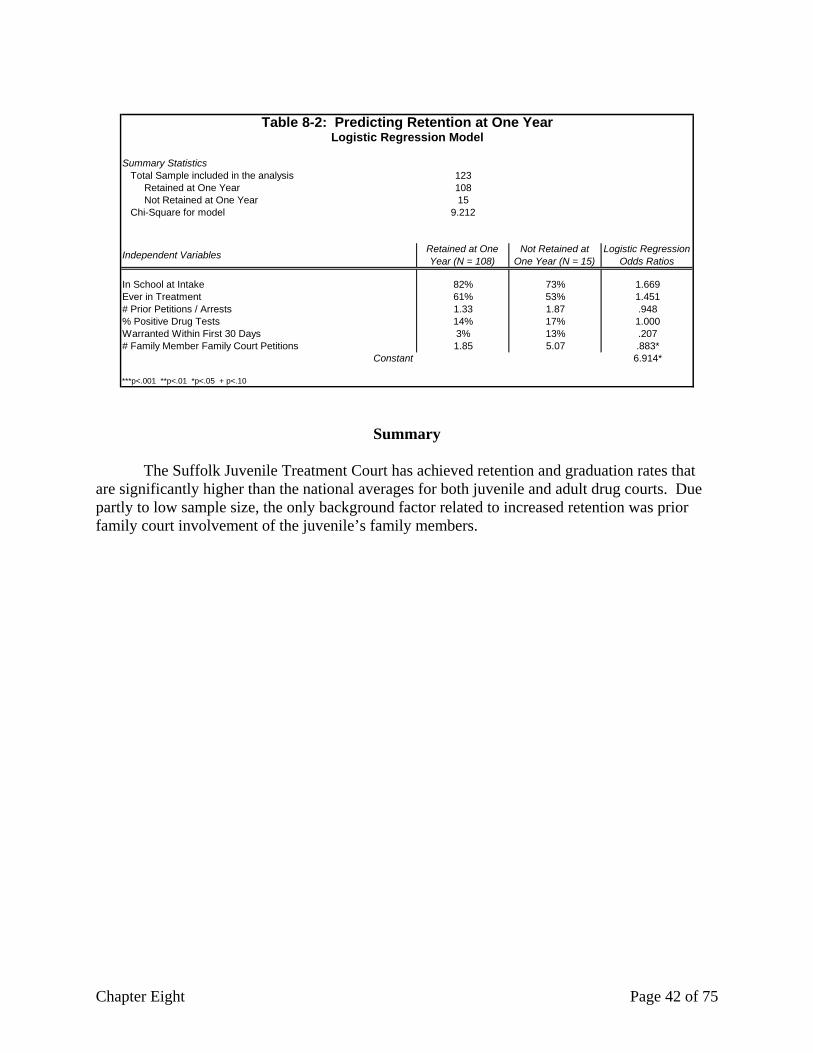
Chapter Eight Page 42 of 75
Summary Statistics Total Sample included in the analysis 123 Retained at One Year 108 Not Retained at One Year 15 Chi-Square for model 9.212
In School at Intake 82% 73% 1.669Ever in Treatment 61% 53% 1.451# Prior Petitions / Arrests 1.33 1.87 .948% Positive Drug Tests 14% 17% 1.000Warranted Within First 30 Days 3% 13% .207# Family Member Family Court Petitions 1.85 5.07 .883*
Constant 6.914*
***p<.001 **p<.01 *p<.05 + p<.10
Table 8-2: Predicting Retention at One YearLogistic Regression Model
Logistic Regression Odds Ratios
Not Retained at One Year (N = 15)
Retained at One Year (N = 108)Independent Variables
Summary
The Suffolk Juvenile Treatment Court has achieved retention and graduation rates that
are significantly higher than the national averages for both juvenile and adult drug courts. Due partly to low sample size, the only background factor related to increased retention was prior family court involvement of the juvenile’s family members.
Chapter Nine Page 43 of 75
Chapter Nine: Literature Review: Prior Impact Studies
There have been 16 prior impact evaluations examining 19 juvenile drug courts; two of the studies looked at multiple sites. These 16 studies all reported recidivism outcomes for drug court participants and included a comparison group composed of juveniles who did not participate in the drug court. Overall, the results are mixed:
• Seven sites elicited positive results (four were statistically significant); • Five sites elicited negative results (two were statistically significant); and • Seven sites elicited either no difference or mixed results depending on the specific
recidivism measure. This chapter begins with a brief discussion of each of the 16 evaluations which are
divided into three general categories: randomized trials (two studies), evaluations with clearly defined comparison groups with some attempt to account for differences between the drug court and comparison samples (three studies), and evaluations with one or more fundamental limitations in methodology (11 studies). Table 9-1 presents a description of the comparison samples and select recidivism findings for each study. The chapter then synthesizes the main findings across all of the studies to give an overall sense of the impact of juvenile drug courts. The chapter concludes with a brief discussion of a recent cost-benefit analysis.
Randomized Trials The gold standard in social science research is a random assignment experiment. In the case of juvenile drug courts, a randomized trial would mean that a group of juveniles found eligible for drug court would be randomly assigned -- some to the drug court and some to at least one other program, often probation or another form of standard monitoring. To date, there have been two such trials. Summit County, Ohio – Dickie (2001): This study involved the random assignment of juveniles to either the drug court or traditional probation monitoring. Due to extremely small sample size and data collection problems (89 juveniles were in the drug court and 34 in the comparison group), the author was only able to report the results at six months post-program for both groups – 36% of drug court participants were re-arrested as compared to 69% of the comparison juveniles. Significance test results were not reported.
Charleston County, South Carolina – Henggeler et. al. (2006): In this study, all juveniles in the jurisdiction with a new “referral” were assessed for substance abuse dependence or abuse; if dependence or abuse was found, the juvenile was randomly assigned into one of four groups, all involving probation or parole at a minimum. The first group was placed in a traditional family court track involving either probation or parole supervision, saw a judge once or twice a year, and spent 12 weeks in outpatient alcohol or drug treatment. The second group participated in a drug court involving frequent judicial status hearings, graduated sanctions and rewards, intensive supervision, and alcohol or drug treatment. The third group participated in the drug court per above and also received multisystemic therapy (MST), which involved intensive family therapy. The last group participated in the drug court, received MST, and participated in a contingency management (CM) component: “…three components of CM were specifically added to MST in

Chapter Nine Page 44 of 75
this study: a voucher system that rewarded clean substance screens, a detailed functional analysis of drug-use behavior that served as the basis for self-management plannings, and protocols for self-management” (Henggeler et al, 2006). The study measured differences among the four groups in both criminal and substance use behavior, looking at both official records and self-reports of the juveniles in the year following study recruitment (closely coinciding with the period of program participation). There were no significant differences among the groups when looking only at the official re-arrest records, but the juveniles in the three drug court groups self-reported lower re-arrest rates than the family court control group. The study also found that participation in the drug court decreased subsequent substance use, with Group 4 (drug court + MST + CM) demonstrating the lowest rates of substance use, followed by Group 3 (drug court + MST) and then Group 2 (drug court only).
Table 9-1: Results of Select Juvenile Drug Court Impact Studies
Juvenile Drug Court Site
Study Citation
Comparison Group
Comparison Selection Bias
Measurement Period
Key Outcome Findings
Overall Findings Summary
Wilming-ton, DE
Miller, Scocas, and O’Connell (1998); O’Connell, Nestlerode, and Miller (1999)
Arrested on similar charges in the six months before the drug court opened
Clearly defined comparison group; attempted to control for selection bias
In-program and 18 months post-program
In-program re-arrest: 26% drug court vs. 36% comparison group (p<.05); Post-program re-arrest: 55% drug court vs. 61% comparison group (NS; p<.10)
Miller, et. al. 1998: Mixed, significant (p<.05); O’Connell, et. al. 1999: Positive, significant (p<.05)
Hudson Vicinage, Jersey City, NJ
Andes (2000)
Two contempor-aneous comparison groups: (1) refused to participate; and (2) randomly selected from those on probation for drug-related offenses
Comparison group not clearly defined
Unspec-ified (different for each juvenile)
53% drug court vs. 70% (Group I, refusers) vs. 90% (Group II, probation) (Significance not reported)
Positive, significance not reported
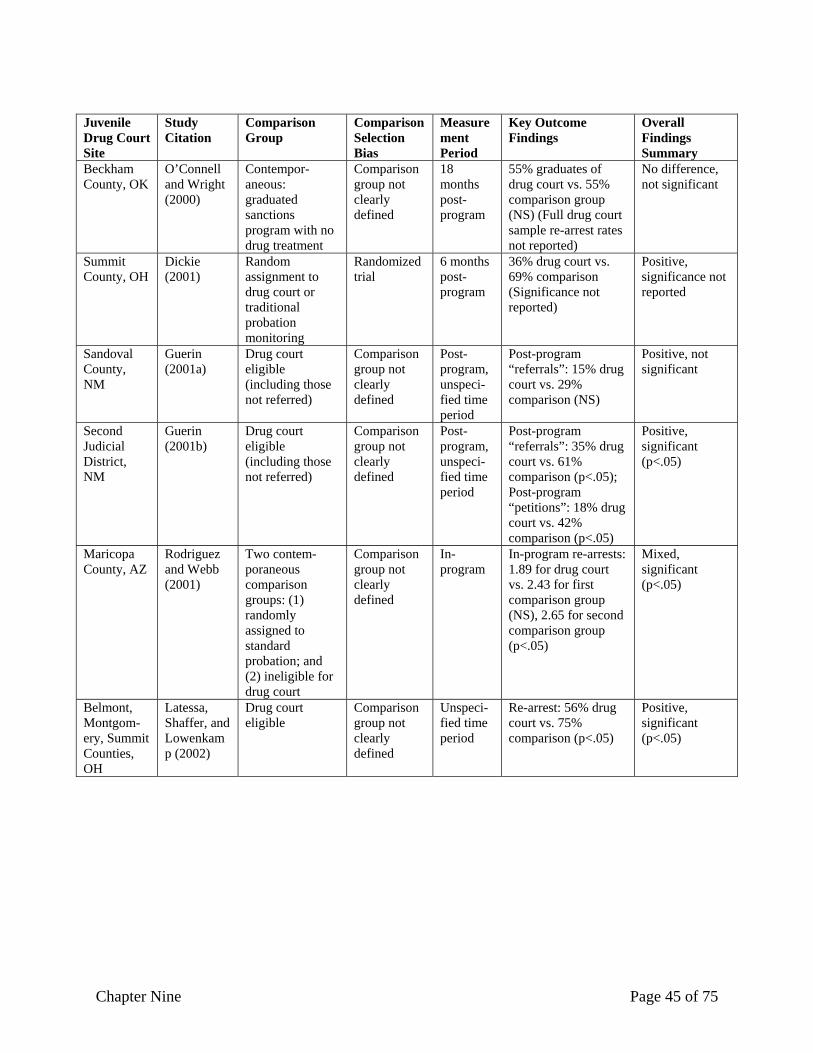
Chapter Nine Page 45 of 75
Juvenile Drug Court Site
Study Citation
Comparison Group
Comparison Selection Bias
Measurement Period
Key Outcome Findings
Overall Findings Summary
Beckham County, OK
O’Connell and Wright (2000)
Contempor- aneous: graduated sanctions program with no drug treatment
Comparison group not clearly defined
18 months post-program
55% graduates of drug court vs. 55% comparison group (NS) (Full drug court sample re-arrest rates not reported)
No difference, not significant
Summit County, OH
Dickie (2001)
Random assignment to drug court or traditional probation monitoring
Randomized trial
6 months post- program
36% drug court vs. 69% comparison (Significance not reported)
Positive, significance not reported
Sandoval County, NM
Guerin (2001a)
Drug court eligible (including those not referred)
Comparison group not clearly defined
Post-program, unspeci-fied time period
Post-program “referrals”: 15% drug court vs. 29% comparison (NS)
Positive, not significant
Second Judicial District, NM
Guerin (2001b)
Drug court eligible (including those not referred)
Comparison group not clearly defined
Post-program, unspeci-fied time period
Post-program “referrals”: 35% drug court vs. 61% comparison (p<.05); Post-program “petitions”: 18% drug court vs. 42% comparison (p<.05)
Positive, significant (p<.05)
Maricopa County, AZ
Rodriguez and Webb (2001)
Two contem-poraneous comparison groups: (1) randomly assigned to standard probation; and (2) ineligible for drug court
Comparison group not clearly defined
In-program
In-program re-arrests: 1.89 for drug court vs. 2.43 for first comparison group (NS), 2.65 for second comparison group (p<.05)
Mixed, significant (p<.05)
Belmont, Montgom-ery, Summit Counties, OH
Latessa, Shaffer, and Lowenkamp (2002)
Drug court eligible
Comparison group not clearly defined
Unspeci-fied time period
Re-arrest: 56% drug court vs. 75% comparison (p<.05)
Positive, significant (p<.05)

Chapter Nine Page 46 of 75
Juvenile Drug Court Site
Study Citation
Comparison Group
Comparison Selection Bias
Measurement Period
Key Outcome Findings
Overall Findings Summary
Missoula, MT
Roche (2002)
No description of the comparison group
Comparison group not clearly defined
Post-program, unspeci- fied time period
Post-program “encounters with law enforcement”: 2.15 drug court vs. 2.09 comparison; Post-program citations: 2.88 drug court vs. 2.60 comparison; Post-program felony citations: 12% drug court vs. 27% comparison10
No difference, significance not reported
Kalamazoo, MI
Hartmann and Rhineberger (2003)
Contemporan-eous: referred to drug court, but selected to be on probation
Comparison group not clearly defined
In-program and 12-months post-program
In-program re-arrests: 29% drug court vs. 26% comparison; 12-months post-program re-arrests: 36% drug court vs. 23% comparison (Significance not reported)
No difference, significance not reported
Douglas, Lancaster, Sarpy Counties, NE
Herz, Phelps, and DeBuse (2003)
Contempor-aneous: screened eli-gible for drug court but not admitted due to overcapacity, “traditional disposition outcomes”
Comparison group not clearly defined
In-program and post-disposi-tion, unspeci-fied (differ-ent for each juvenile)
In-program re-arrest: 31% Douglas drug court vs. 28% comparison (NS); 38% Lancaster drug court vs. 15% comparison (p<.05); 13% Sarpy drug court vs. 2% comparison (p<.05); Post-disposition re-arrest: 41% Douglas drug court vs. 36% comparison (NS); 53% Lancaster drug court vs. 32% comparison (NS); 26% Sarpy drug court vs. 14% comparison (NS)
Douglas: Mixed, not significant; Lancaster: Negative, significant (p<.05); Sarpy: Negative, significant (p<.05)
10 The author of this prior study reported these statistics for only graduates, failures and the comparison group. For the purposes of the present literature review, this author deduced the relevant statistics for the entire participant sample, but significance testing was not feasible.

Chapter Nine Page 47 of 75
Juvenile Drug Court Site
Study Citation
Comparison Group
Comparison Selection Bias
Measurement Period
Key Outcome Findings
Overall Findings Summary
Maricopa, AZ
Rodriguez and Webb (2004)
Two contem- poraneous comparison samples: (1) random assignment; and (2) screened and found drug court eligible but received standard probation
Comparison group not clearly defined
In-program
Drug court statistically less likely to commit subsequent delinquent acts while in the program, but specific statistics not reported
Positive, significant
East Central and Northeast Central Judicial Districts, ND
Thompson (2004)
Two contem-poraneous comparison samples com-bined into one group: (1) another judicial district, selected by court officers and the eval-uator to be comparable and eligible for drug court; (2) refused to participate during early years when East Central drug court was voluntary
Comparison group not clearly defined
Adult re-arrests only, unspeci-fied time period (different for each juvenile)
Adult re-arrests: 56% East Central drug court (p<.10), 36% Northeast Central drug court (p<.10) vs. 44% comparison; Adult re-convictions: 38% East Central drug court (p<.10), 24% Northeast Central (p<.10) vs. 18% comparison
East Central: Negative, not significant; Northeast Central: Negative, not significant
Charleston County, SC
Henggeler, Halliday-Boykins, Cunningham, Randall, Shapiro, and Chapman (2006)
Random assign-ment to 4 groups: (1) family court; (2) drug court only; (3) drug court + multi-sys-temic therapy; (4) drug court + MST + contingency management
Randomized trial
Re-arrests, Baseline, four months later, and 12 months later
No significant difference between the groups for any tracking period (specific statistics not discernible)
No difference, not significant
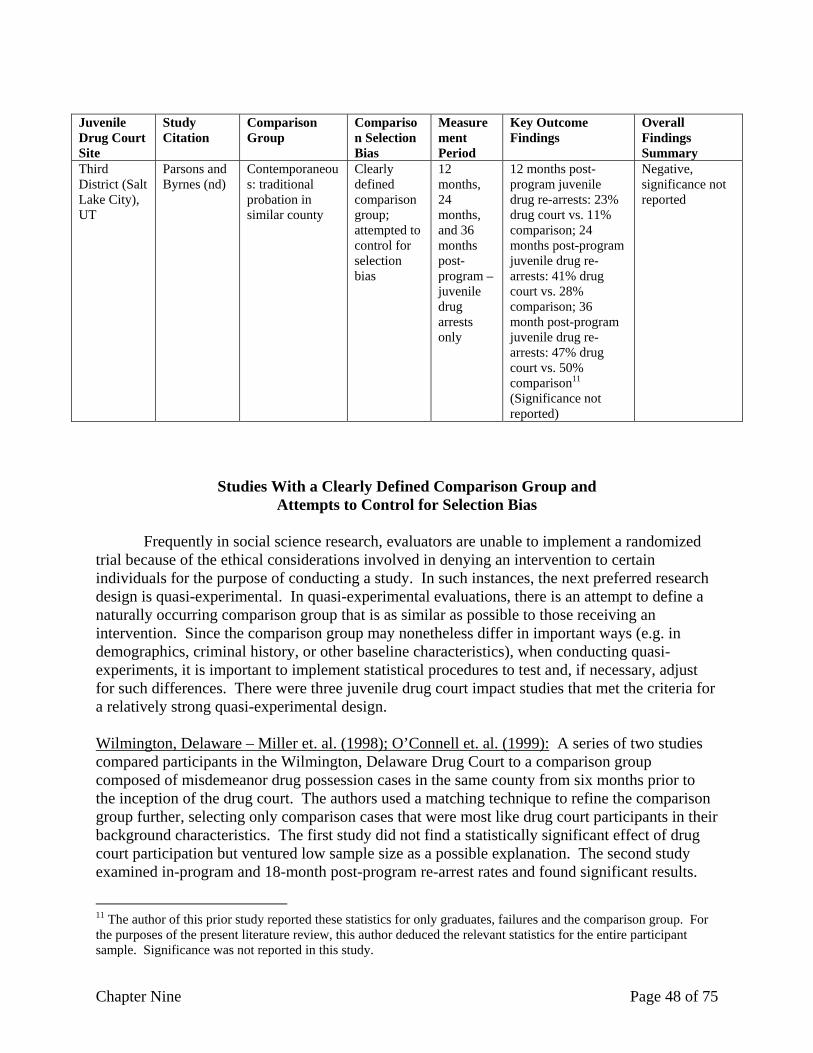
Chapter Nine Page 48 of 75
Juvenile Drug Court Site
Study Citation
Comparison Group
Comparison Selection Bias
Measurement Period
Key Outcome Findings
Overall Findings Summary
Third District (Salt Lake City), UT
Parsons and Byrnes (nd)
Contemporaneous: traditional probation in similar county
Clearly defined comparison group; attempted to control for selection bias
12 months, 24 months, and 36 months post-program – juvenile drug arrests only
12 months post-program juvenile drug re-arrests: 23% drug court vs. 11% comparison; 24 months post-program juvenile drug re-arrests: 41% drug court vs. 28% comparison; 36 month post-program juvenile drug re-arrests: 47% drug court vs. 50% comparison11 (Significance not reported)
Negative, significance not reported
Studies With a Clearly Defined Comparison Group and Attempts to Control for Selection Bias
Frequently in social science research, evaluators are unable to implement a randomized trial because of the ethical considerations involved in denying an intervention to certain individuals for the purpose of conducting a study. In such instances, the next preferred research design is quasi-experimental. In quasi-experimental evaluations, there is an attempt to define a naturally occurring comparison group that is as similar as possible to those receiving an intervention. Since the comparison group may nonetheless differ in important ways (e.g. in demographics, criminal history, or other baseline characteristics), when conducting quasi-experiments, it is important to implement statistical procedures to test and, if necessary, adjust for such differences. There were three juvenile drug court impact studies that met the criteria for a relatively strong quasi-experimental design. Wilmington, Delaware – Miller et. al. (1998); O’Connell et. al. (1999): A series of two studies compared participants in the Wilmington, Delaware Drug Court to a comparison group composed of misdemeanor drug possession cases in the same county from six months prior to the inception of the drug court. The authors used a matching technique to refine the comparison group further, selecting only comparison cases that were most like drug court participants in their background characteristics. The first study did not find a statistically significant effect of drug court participation but ventured low sample size as a possible explanation. The second study examined in-program and 18-month post-program re-arrest rates and found significant results.
11 The author of this prior study reported these statistics for only graduates, failures and the comparison group. For the purposes of the present literature review, this author deduced the relevant statistics for the entire participant sample. Significance was not reported in this study.

Chapter Nine Page 49 of 75
During participation, 26% of participants versus 36% of comparison youth were re-arrested (p<.05). The 18-month post-program re-arrest numbers were suggestive but not significant (.097), as 55% of participants were re-arrested compared to 61% of the comparison group. Third District (Salt Lake City), Utah – Parsons and Byrnes (nd): The authors of this study looked at post-program alcohol or drug re-arrests for juveniles in the drug court compared to young people receiving traditional probation services in a similar, proximate county in Utah. The comparison juveniles were matched to participants based on their age, gender and criminal history. Two limitations of this study are that, despite selecting a fairly strong comparison group, they tracked only juvenile re-arrests up to the age of 18, and they only considered those re-arrests that involved alcohol or drug charges. In addition, this study did not explicitly report outcomes for all drug court participants, instead distinguishing in all results between graduates and failures. The current author deduced the total participant statistics. Up to three years following program completion, the drug court participants had more re-arrests for alcohol or drug charges than the comparison group. At twelve months post-program, 23% of drug court participants were re-arrested for alcohol or drug charges compared to 11% of the comparison group. At twenty-four months post-program, 41% of participants were re-arrested for alcohol or drug charges compared to 28% of the comparison group. At thirty-six months post-program, 47% of participants were re-arrested for an alcohol or drug charge compared to 50% of the comparison group. Significance was not reported.
Studies With Ambiguity About the Comparison Group Design
Eleven of the prior impact studies included a comparison group made up of youth who had not participated in the drug court, but other details about who was included in the comparison group were either unclear or raised other problems. In particular, several studies appeared to include in the comparison group those who were found eligible for the drug court but who refused to participate (“refusers”) or those who were referred to drug court but were found ineligible (“ineligibles”). The members of these types of comparison groups are, by definition, different from drug court participants, either because they lack motivation, a discernible drug addiction, or some other qualification necessary for participation. Often, however, these youth are the only ones available for a comparison group, and certainly some comparison is better than none. Hudson Vicinage, Jersey City, New Jersey – Andes (2000): There were two comparison groups used for this study. The first group was composed of those youth who met the admissions criteria for the drug court and were offered participation, but who refused. The second group was composed of youth randomly selected out of the pool of youth on probation for drug-related offenses who were not considered for the drug court. It is not clear, however, why these juveniles were not considered for the drug court. The tracking period for each juvenile was different, beginning at the time of the initial arrest and running until the end of the evaluation, raising further questions of comparability. It is unclear whether participant and comparison youths’ tracking periods were of significantly different length. The findings are positive, as 53% of participants were re-arrested compared to 70% of the “refusers” and 90% of the probation comparison group. Significance test results were not reported.

Chapter Nine Page 50 of 75
Beckham County, Oklahoma – O’Connell and Wright (2000): The comparison group for this study was composed of young people who were enrolled in a graduated sanctions program in the same county at the same time, but who were not offered drug court. The study described the graduated sanctions program as a supervisory program that did not entail any treatment. It did not, however, describe how youths were designated for the drug court versus the graduated sanction program, so the comparability of the two groups is unclear. The authors measured post-program re-arrests at six-, 12- and 18-month periods for graduates of the drug court and the comparison youth; the full drug court sample re-arrest rates were not reported. At six months post-program, 33% of both groups were re-arrested. At 12 months, 44% of drug court graduates were re-arrested compared with only 33% of comparison youth, but this finding was not statistically significant. At 18 months post-program, the groups had evened-out again, as 55% from both groups were re-arrested. Sandoval County, New Mexico – Guerin (2001a): The comparison group in this study was composed of those who would be eligible for the drug court, but who did not participate. The author explicitly stated that some of the comparison group were never referred to drug court, but did not make clear why that is the case. It also appears likely based on what is written in the project report that some comparison youths were referred but refused to participate in the drug court. This study measured new “referrals” post-program, with no specific time period set. Fewer participants had a new referral (15%) compared to the comparison group (29%); this finding was not statistically significant. Second Judicial District, New Mexico – Guerin (2001b): Similar to the other New Mexico study just discussed, the comparison group for this study included those youth who would have been eligible for the drug court but did not enter. Some of the comparison youth were never referred to the drug court, but it is likely that many others were “refusers.” This study measured both “referrals” and “petitions” in the post-program period. On both measures, fewer participants had subsequent criminal justice involvement. Thirty-five percent of participants had a new referral compared to 61% of the comparison group (p<.05). Also, 18% of participants had a new petition filed versus 42% of the comparison group (p<.05). Maricopa County, Arizona – Rodriguez and Webb (2001): The authors of this study employed two contemporaneous comparison samples. The first comparison group consisted of those juveniles who were screened for drug court and found eligible, but who instead received standard probation monitoring. It is unclear whether these juveniles refused the program or were unable to join for some other reason. The second comparison group consisted of those juveniles who were screened for drug court but found ineligible. Tracking in-program re-arrests, the authors reported that drug court participants had fewer re-arrests (1.89) than either comparison group (2.43 for the first comparison group and 2.65 for the second; p<.05). Belmont, Montgomery, Summit Counties, Ohio – Latessa, Shaffer, and Lowenkamp (2002): This study combined three drug courts into a single participant sample and compared it to those who were eligible for drug court but did not become participants. Although the authors indicate that the comparison group all reported a substance abuse problem and were matched to participants, it does not say why they did not enter the drug court. This study measured re-arrests but did not indicate the length of the tracking period, nor whether it was post-arrest, post-
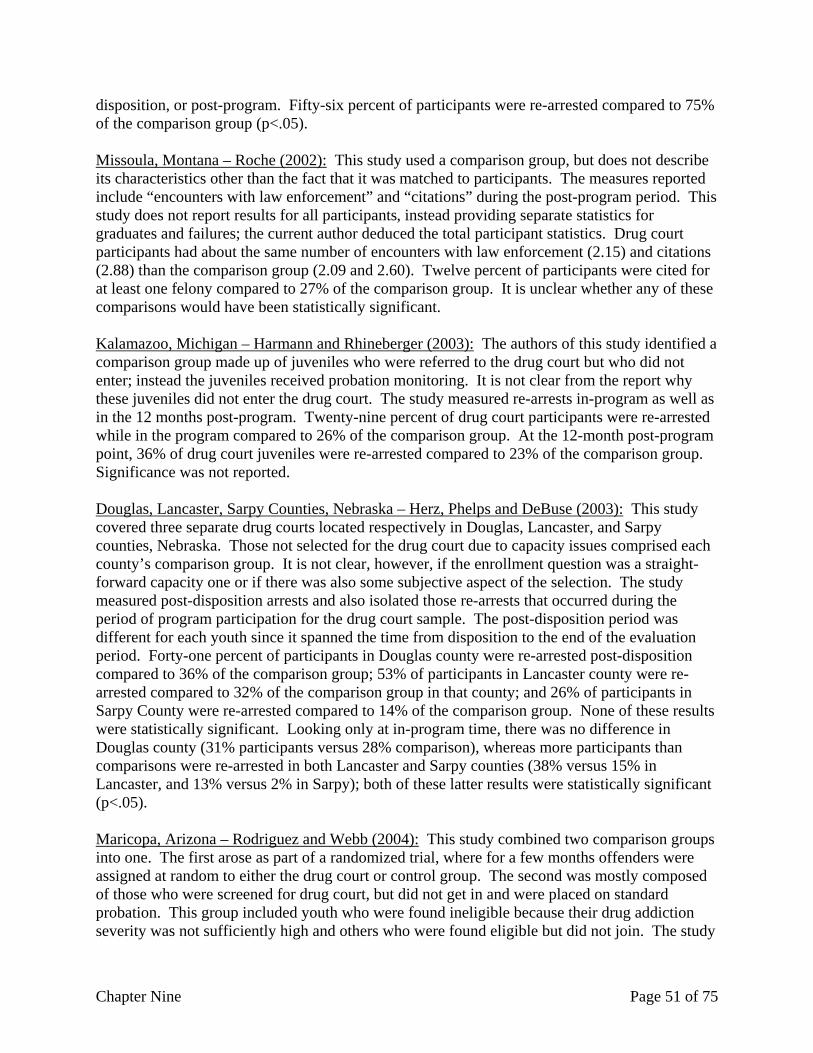
Chapter Nine Page 51 of 75
disposition, or post-program. Fifty-six percent of participants were re-arrested compared to 75% of the comparison group (p<.05). Missoula, Montana – Roche (2002): This study used a comparison group, but does not describe its characteristics other than the fact that it was matched to participants. The measures reported include “encounters with law enforcement” and “citations” during the post-program period. This study does not report results for all participants, instead providing separate statistics for graduates and failures; the current author deduced the total participant statistics. Drug court participants had about the same number of encounters with law enforcement (2.15) and citations (2.88) than the comparison group (2.09 and 2.60). Twelve percent of participants were cited for at least one felony compared to 27% of the comparison group. It is unclear whether any of these comparisons would have been statistically significant. Kalamazoo, Michigan – Harmann and Rhineberger (2003): The authors of this study identified a comparison group made up of juveniles who were referred to the drug court but who did not enter; instead the juveniles received probation monitoring. It is not clear from the report why these juveniles did not enter the drug court. The study measured re-arrests in-program as well as in the 12 months post-program. Twenty-nine percent of drug court participants were re-arrested while in the program compared to 26% of the comparison group. At the 12-month post-program point, 36% of drug court juveniles were re-arrested compared to 23% of the comparison group. Significance was not reported. Douglas, Lancaster, Sarpy Counties, Nebraska – Herz, Phelps and DeBuse (2003): This study covered three separate drug courts located respectively in Douglas, Lancaster, and Sarpy counties, Nebraska. Those not selected for the drug court due to capacity issues comprised each county’s comparison group. It is not clear, however, if the enrollment question was a straight-forward capacity one or if there was also some subjective aspect of the selection. The study measured post-disposition arrests and also isolated those re-arrests that occurred during the period of program participation for the drug court sample. The post-disposition period was different for each youth since it spanned the time from disposition to the end of the evaluation period. Forty-one percent of participants in Douglas county were re-arrested post-disposition compared to 36% of the comparison group; 53% of participants in Lancaster county were re-arrested compared to 32% of the comparison group in that county; and 26% of participants in Sarpy County were re-arrested compared to 14% of the comparison group. None of these results were statistically significant. Looking only at in-program time, there was no difference in Douglas county (31% participants versus 28% comparison), whereas more participants than comparisons were re-arrested in both Lancaster and Sarpy counties (38% versus 15% in Lancaster, and 13% versus 2% in Sarpy); both of these latter results were statistically significant (p<.05). Maricopa, Arizona – Rodriguez and Webb (2004): This study combined two comparison groups into one. The first arose as part of a randomized trial, where for a few months offenders were assigned at random to either the drug court or control group. The second was mostly composed of those who were screened for drug court, but did not get in and were placed on standard probation. This group included youth who were found ineligible because their drug addiction severity was not sufficiently high and others who were found eligible but did not join. The study
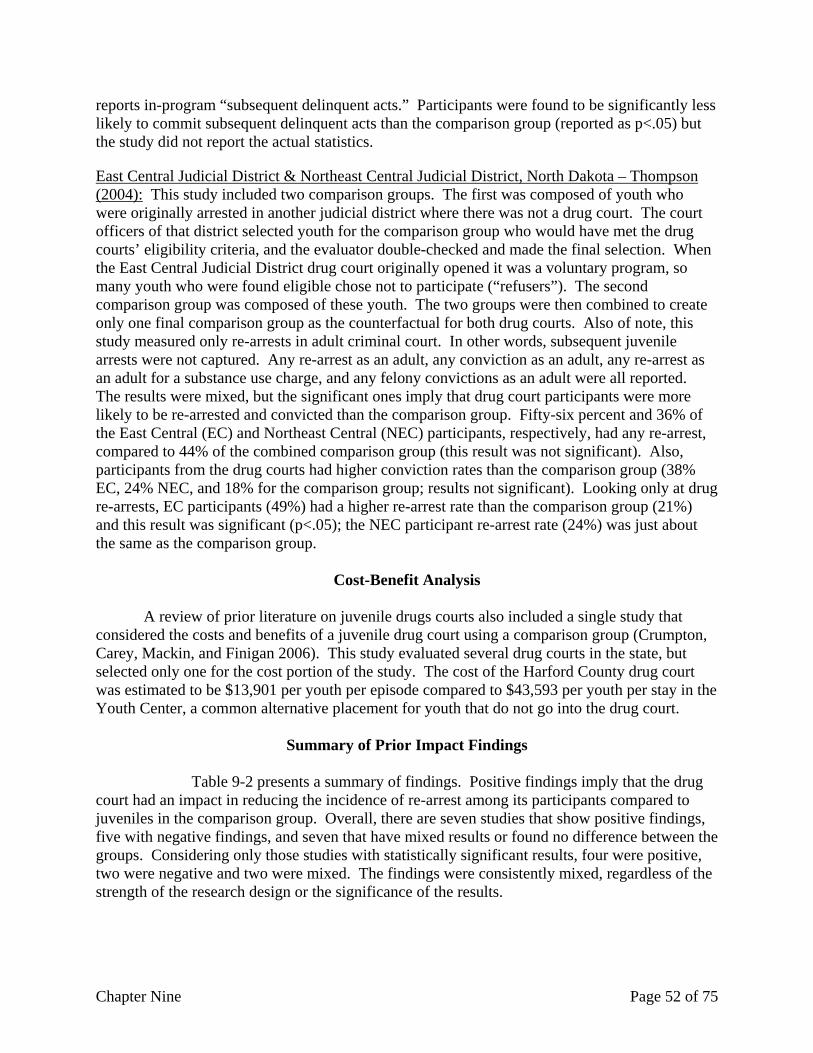
Chapter Nine Page 52 of 75
reports in-program “subsequent delinquent acts.” Participants were found to be significantly less likely to commit subsequent delinquent acts than the comparison group (reported as p<.05) but the study did not report the actual statistics.
East Central Judicial District & Northeast Central Judicial District, North Dakota – Thompson (2004): This study included two comparison groups. The first was composed of youth who were originally arrested in another judicial district where there was not a drug court. The court officers of that district selected youth for the comparison group who would have met the drug courts’ eligibility criteria, and the evaluator double-checked and made the final selection. When the East Central Judicial District drug court originally opened it was a voluntary program, so many youth who were found eligible chose not to participate (“refusers”). The second comparison group was composed of these youth. The two groups were then combined to create only one final comparison group as the counterfactual for both drug courts. Also of note, this study measured only re-arrests in adult criminal court. In other words, subsequent juvenile arrests were not captured. Any re-arrest as an adult, any conviction as an adult, any re-arrest as an adult for a substance use charge, and any felony convictions as an adult were all reported. The results were mixed, but the significant ones imply that drug court participants were more likely to be re-arrested and convicted than the comparison group. Fifty-six percent and 36% of the East Central (EC) and Northeast Central (NEC) participants, respectively, had any re-arrest, compared to 44% of the combined comparison group (this result was not significant). Also, participants from the drug courts had higher conviction rates than the comparison group (38% EC, 24% NEC, and 18% for the comparison group; results not significant). Looking only at drug re-arrests, EC participants (49%) had a higher re-arrest rate than the comparison group (21%) and this result was significant (p<.05); the NEC participant re-arrest rate (24%) was just about the same as the comparison group.
Cost-Benefit Analysis A review of prior literature on juvenile drugs courts also included a single study that considered the costs and benefits of a juvenile drug court using a comparison group (Crumpton, Carey, Mackin, and Finigan 2006). This study evaluated several drug courts in the state, but selected only one for the cost portion of the study. The cost of the Harford County drug court was estimated to be $13,901 per youth per episode compared to $43,593 per youth per stay in the Youth Center, a common alternative placement for youth that do not go into the drug court.
Summary of Prior Impact Findings
Table 9-2 presents a summary of findings. Positive findings imply that the drug court had an impact in reducing the incidence of re-arrest among its participants compared to juveniles in the comparison group. Overall, there are seven studies that show positive findings, five with negative findings, and seven that have mixed results or found no difference between the groups. Considering only those studies with statistically significant results, four were positive, two were negative and two were mixed. The findings were consistently mixed, regardless of the strength of the research design or the significance of the results.
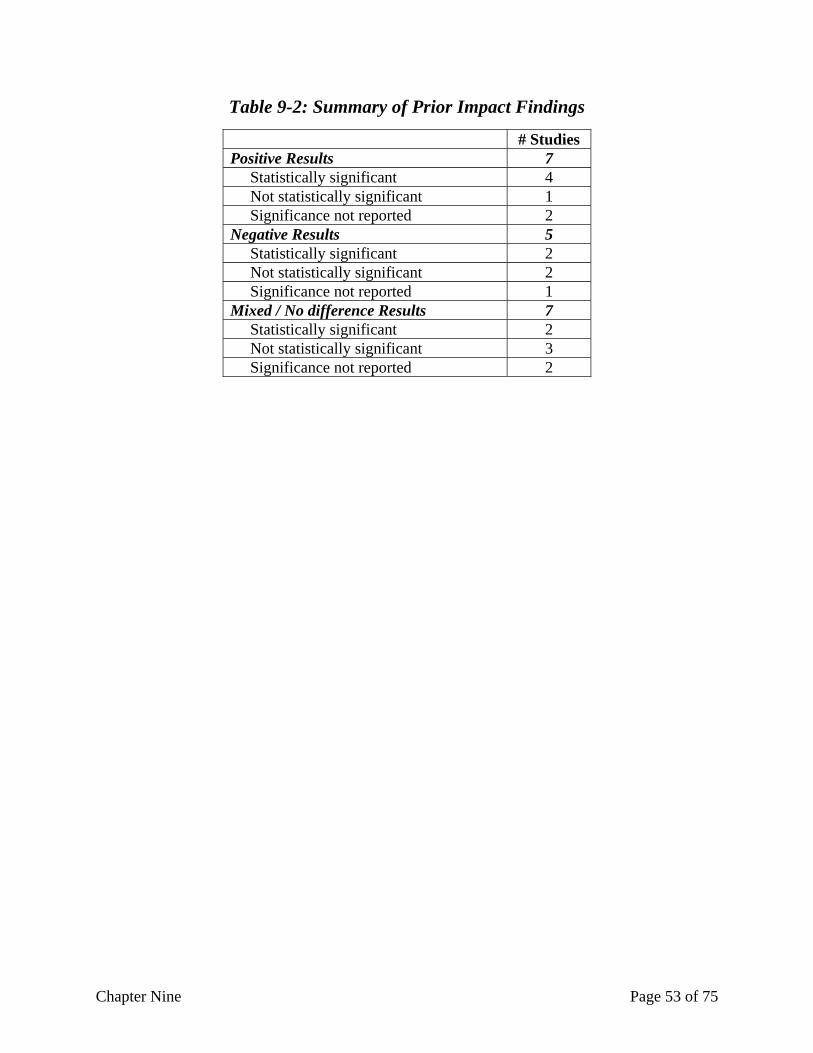
Chapter Nine Page 53 of 75
Table 9-2: Summary of Prior Impact Findings
# Studies Positive Results 7 Statistically significant 4 Not statistically significant 1 Significance not reported 2 Negative Results 5 Statistically significant 2 Not statistically significant 2 Significance not reported 1 Mixed / No difference Results 7 Statistically significant 2 Not statistically significant 3 Significance not reported 2

Chapter Ten Page 54 of 75
Chapter Ten: Impact Methodology This chapter reports a quasi-experimental comparison between participants in the Suffolk drug court and otherwise similar juveniles processed just before the time when the drug court opened. This chapter lays out the design and methodology.
Comparison Group Identification
Staff at the Suffolk County Juvenile Treatment Court assured the evaluator that they were
able to review all of the juveniles who went through the courthouse with either a JD or PINS petition. Therefore, believing that there were few, if any, potentially eligible youth in Suffolk County who were not screened for participation, the comparison group for the impact evaluation was constructed from cases initiated in the year before the treatment court opened.
A list was generated of all juveniles with a JD or PINS petition in 2001 who were aged 14 through 17 at the time the petition was filed (born 1987 through 1990).12 Research staff then reviewed the paper file for each of the juveniles who met the age and case type criteria. If the paper review revealed some indication of drug use, the juvenile was placed in the comparison group. To gain an indication of drug use, researchers looked first at the probation intake questions involving alcohol and drug use. If the youth reported any use there, he/she made the cut. Second, from the police arrest youth report researchers looked at the specific question “Youth uses drugs / intoxicants.” Youth who answered in the affirmative were also added to the comparison group. Lastly, researchers reviewed the witness descriptions for any remaining youth to determine if the witness described drug or alcohol use at the time of the incident.
At this point, any juveniles who eventually joined the treatment court (as the result of a future court petition) were removed from the comparison sample. The resulting comparison group contained 228 petitions – 124 PINS and 104 JDs. Many of these petitions were for the same juveniles, so for each juvenile, we only included the first qualifying petition. This resulted in a comparison group of 191 unique juveniles – 100 with PINS petitions and 91 with JD petitions, as shown in Table 10-1.
Table 10-1: Evolution of the Comparison Group
Number of Youth PINS / JD petition in 2001 in Suffolk County (aged 14-17)
999 petitions
PINS 451 (45%) JDs 548 (55%) Eligible for Comparison Group (aged 14-17; indication of drug/alcohol use in paper file)
228 petitions
PINS 124 (54%) JDs 104 (46%) Preliminary Comparison Group 191 youth PINS 100 (52%) JDs 91 (48%)
12 This original sample was approximately 1000 juveniles but frequently included several petitions for each juvenile.
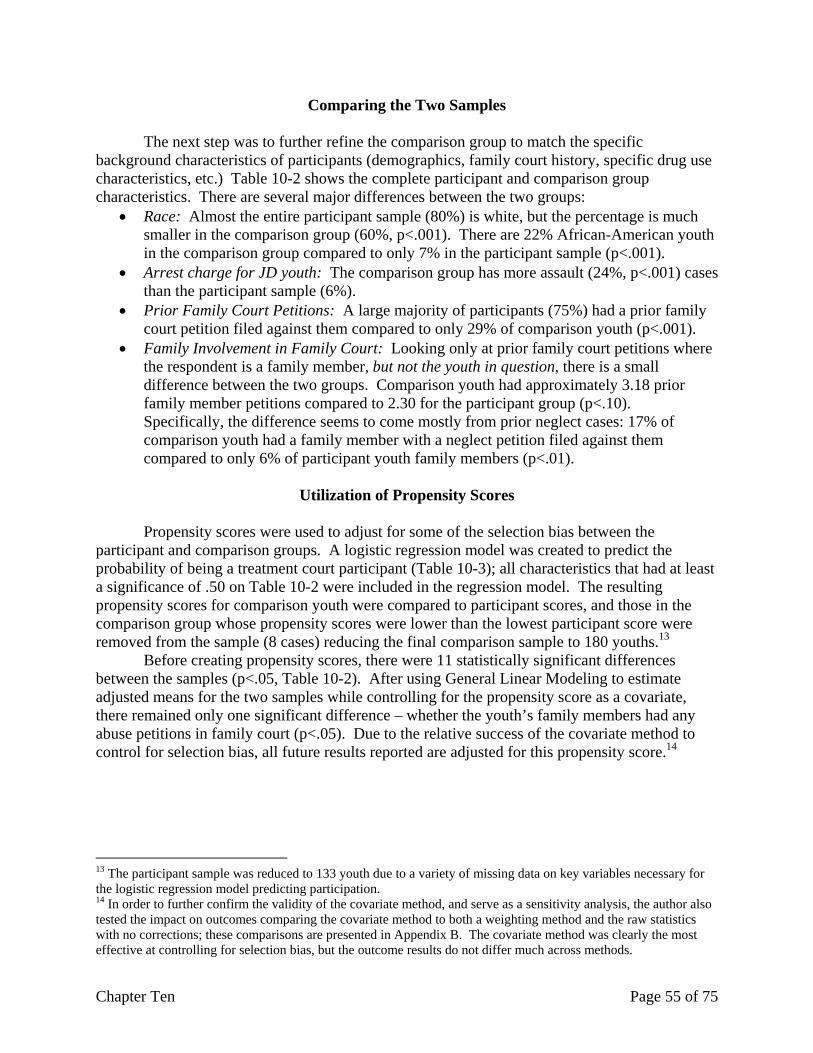
Chapter Ten Page 55 of 75
Comparing the Two Samples
The next step was to further refine the comparison group to match the specific background characteristics of participants (demographics, family court history, specific drug use characteristics, etc.) Table 10-2 shows the complete participant and comparison group characteristics. There are several major differences between the two groups:
• Race: Almost the entire participant sample (80%) is white, but the percentage is much smaller in the comparison group (60%, p<.001). There are 22% African-American youth in the comparison group compared to only 7% in the participant sample (p<.001).
• Arrest charge for JD youth: The comparison group has more assault (24%, p<.001) cases than the participant sample (6%).
• Prior Family Court Petitions: A large majority of participants (75%) had a prior family court petition filed against them compared to only 29% of comparison youth (p<.001).
• Family Involvement in Family Court: Looking only at prior family court petitions where the respondent is a family member, but not the youth in question, there is a small difference between the two groups. Comparison youth had approximately 3.18 prior family member petitions compared to 2.30 for the participant group (p<.10). Specifically, the difference seems to come mostly from prior neglect cases: 17% of comparison youth had a family member with a neglect petition filed against them compared to only 6% of participant youth family members (p<.01).
Utilization of Propensity Scores
Propensity scores were used to adjust for some of the selection bias between the
participant and comparison groups. A logistic regression model was created to predict the probability of being a treatment court participant (Table 10-3); all characteristics that had at least a significance of .50 on Table 10-2 were included in the regression model. The resulting propensity scores for comparison youth were compared to participant scores, and those in the comparison group whose propensity scores were lower than the lowest participant score were removed from the sample (8 cases) reducing the final comparison sample to 180 youths.13
Before creating propensity scores, there were 11 statistically significant differences between the samples (p<.05, Table 10-2). After using General Linear Modeling to estimate adjusted means for the two samples while controlling for the propensity score as a covariate, there remained only one significant difference – whether the youth’s family members had any abuse petitions in family court (p<.05). Due to the relative success of the covariate method to control for selection bias, all future results reported are adjusted for this propensity score.14
13 The participant sample was reduced to 133 youth due to a variety of missing data on key variables necessary for the logistic regression model predicting participation. 14 In order to further confirm the validity of the covariate method, and serve as a sensitivity analysis, the author also tested the impact on outcomes comparing the covariate method to both a weighting method and the raw statistics with no corrections; these comparisons are presented in Appendix B. The covariate method was clearly the most effective at controlling for selection bias, but the outcome results do not differ much across methods.
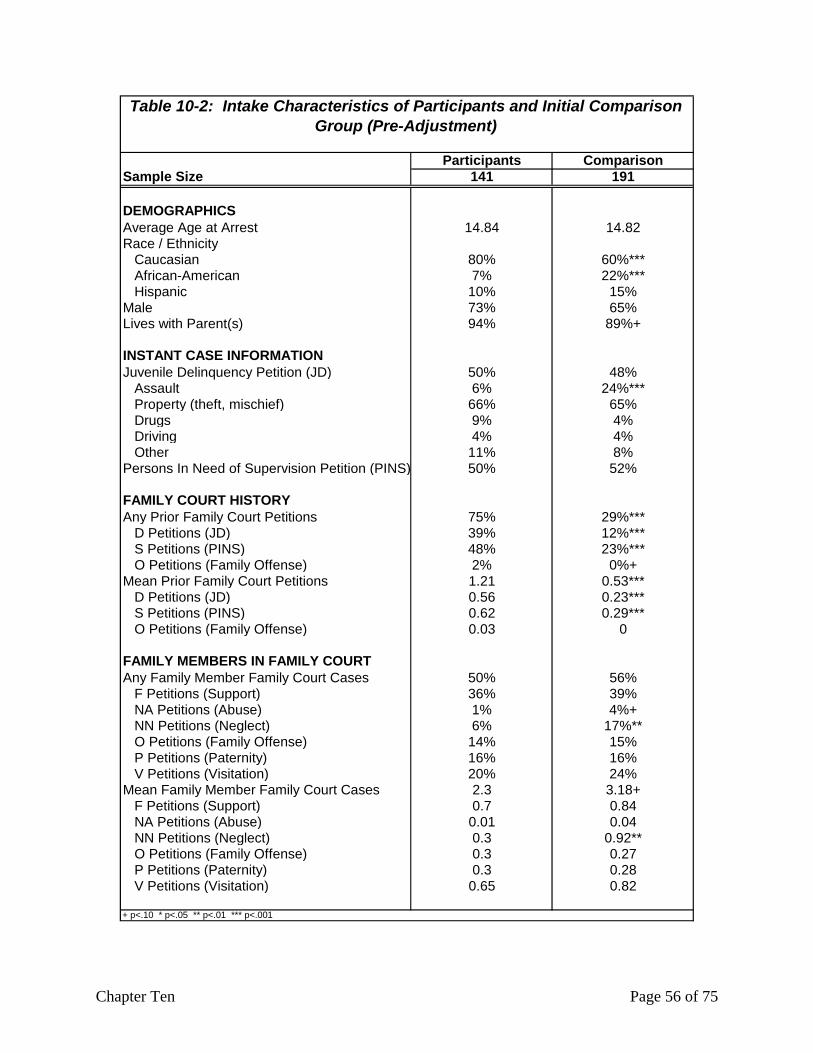
Chapter Ten Page 56 of 75
Participants ComparisonSample Size 141 191
DEMOGRAPHICSAverage Age at Arrest 14.84 14.82Race / Ethnicity Caucasian 80% 60%*** African-American 7% 22%*** Hispanic 10% 15%Male 73% 65%Lives with Parent(s) 94% 89%+
INSTANT CASE INFORMATIONJuvenile Delinquency Petition (JD) 50% 48% Assault 6% 24%*** Property (theft, mischief) 66% 65% Drugs 9% 4% Driving 4% 4% Other 11% 8%Persons In Need of Supervision Petition (PINS) 50% 52%
FAMILY COURT HISTORYAny Prior Family Court Petitions 75% 29%*** D Petitions (JD) 39% 12%*** S Petitions (PINS) 48% 23%*** O Petitions (Family Offense) 2% 0%+Mean Prior Family Court Petitions 1.21 0.53*** D Petitions (JD) 0.56 0.23*** S Petitions (PINS) 0.62 0.29*** O Petitions (Family Offense) 0.03 0
FAMILY MEMBERS IN FAMILY COURTAny Family Member Family Court Cases 50% 56% F Petitions (Support) 36% 39% NA Petitions (Abuse) 1% 4%+ NN Petitions (Neglect) 6% 17%** O Petitions (Family Offense) 14% 15% P Petitions (Paternity) 16% 16% V Petitions (Visitation) 20% 24%Mean Family Member Family Court Cases 2.3 3.18+ F Petitions (Support) 0.7 0.84 NA Petitions (Abuse) 0.01 0.04 NN Petitions (Neglect) 0.3 0.92** O Petitions (Family Offense) 0.3 0.27 P Petitions (Paternity) 0.3 0.28 V Petitions (Visitation) 0.65 0.82
+ p<.10 * p<.05 ** p<.01 *** p<.001
Table 10-2: Intake Characteristics of Participants and Initial Comparison Group (Pre-Adjustment)
Chapter Ten Page 57 of 75
Variable Coefficient
Summary Statistics Total Sample included in the analysis 321 Participants 133 Comparison Group Candidates 188 Chi-Square for model 93.245***
Logistic Regression Odds Ratios Caucasian 2.233* African-American .454 Male .567+ Live with Parents, Maybe Siblings 1.480 Charge = Assault .172** Charge = Drugs 1.579 Any prior JD petitions 5.475*** Any prior PINS petitions 4.339*** # Prior Family Member Neglect Cases .912
Constant .309+ p<.10 *p<.05 **p<.01 ***p<.001
Table 10-3: Logistic Regression Predicting Treatment Court Participation
Recidivism Periods and Measures This study followed the juveniles for two years following the initial petition (post-petition) and for two years following the disposition (completion of the case for comparison youth and closure of the drug court episode for participants). In New York State, when a juvenile is arrested and is under the age of 16 he will be adjudicated in the Family Court of that county as a juvenile delinquent. After the age of 16, a Suffolk County young person will be a defendant in District Court (the local adult criminal court). Therefore, in order to fully capture a youth’s future court activity, it was necessary to gather Family Court and District Court records. There are two measures of criminal activity captured in this study:
• New criminal arrests – adult arrests from District Court; and • New criminal arrests – juvenile arrests (JD petitions) in Family Court.
Due to incomplete data, we were not able to isolate final dispositions for the family court petitions, therefore initial arrests and petitions filed are the measures used to define recidivism.

Chapter Eleven Page 58 of 75
Chapter Eleven: Impact Analysis
This study examines the impact of the Suffolk County Juvenile Treatment Court on criminal recidivism, encompassing criminal arrests in adult criminal court and juvenile delinquency petitions in family court.15
Impact on Post-Petition Recidivism Figure 11-1 shows the impact of the Treatment Court on new arrests and petitions up to two years after the initial petition. Throughout, there is no difference in offending between the two groups of youth. Two years after the initial petition, 42% of participants had a new criminal case compared to 39% of the comparison group (difference not significant). For drug court participants, this two-year period is mostly spent in the program. (On average, program participation lasts slightly more than sixteen months.)
Figure 11-1: Impact of SJTC on Post-Petition New Arrests/Petitions
29%26%
39%42%
30%28%
0%
10%
20%
30%
40%
50%
60%
70%
1 Year 18 Months 2 Years
Treatment Court (N = 133)Comparison Group (N = 180)
+ p<.10 * p<.05 ** p<.01 *** p<.001 (2-tailed t-tests)Note: The participant sample size was reduced to 108 in the 2 years analysis to allow at least 2 years to pass since the original petition was filed.
Figure 11-2 focuses only on the 18 months following the initial petition and displays the
charges for the subsequent adult criminal arrests. Among those with at least one adult re-arrest, the comparison youth appeared more likely (p<.10) to have a subsequent felony arrest than the participants, but the distribution of other charges look comparable. Table 11-1 further breaks out the types of new cases at both 18 months and two years after the initial petition, revealing virtually no difference among the two groups of youth on any of the measures examined (e.g., distinguishing felony, misdemeanor, drug-related and several other types of charges).
15 Evaluation staff also collected data on the incidence of PINS petitions in Family Court. It should be noted that staff at the Treatment Court maintain that it is not likely for a youth to receive subsequent PINS petitions. In the instance of bad behavior, a youth would receive a probation violation or their probation might be extended as part of the initial PINS petition, but a new petition would not be opened. The data gathered for this study did not find that to be true, raising questions about the reliability of the subsequent PINS petitions data. This report, therefore, focuses only on criminal arrests, and PINS data are not reported here.
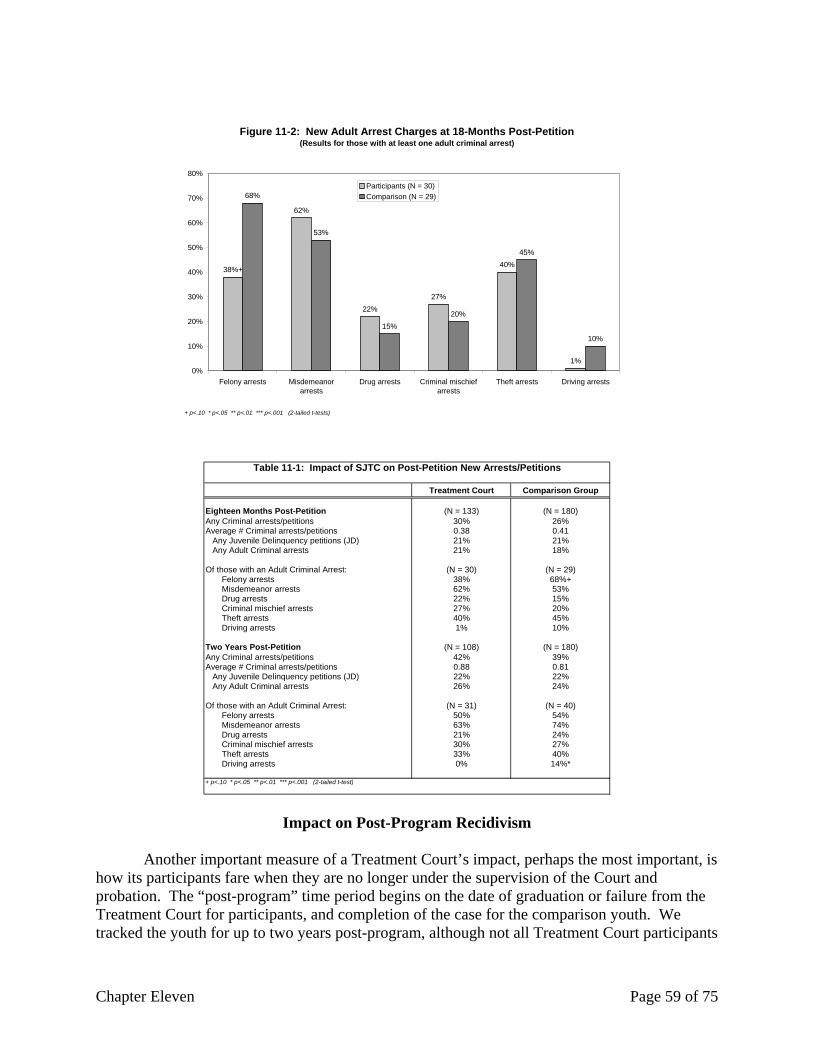
Chapter Eleven Page 59 of 75
Figure 11-2: New Adult Arrest Charges at 18-Months Post-Petition
(Results for those with at least one adult criminal arrest)
62%
22%27%
40%
1%
68%
53%
15%20%
45%
10%
38%+
0%
10%
20%
30%
40%
50%
60%
70%
80%
Felony arrests Misdemeanorarrests
Drug arrests Criminal mischiefarrests
Theft arrests Driving arrests
Participants (N = 30)Comparison (N = 29)
+ p<.10 * p<.05 ** p<.01 *** p<.001 (2-tailed t-tests)
Treatment Court Comparison Group
Eighteen Months Post-Petition (N = 133) (N = 180)Any Criminal arrests/petitions 30% 26%Average # Criminal arrests/petitions 0.38 0.41 Any Juvenile Delinquency petitions (JD) 21% 21% Any Adult Criminal arrests 21% 18%
Of those with an Adult Criminal Arrest: (N = 30) (N = 29) Felony arrests 38% 68%+ Misdemeanor arrests 62% 53% Drug arrests 22% 15% Criminal mischief arrests 27% 20% Theft arrests 40% 45% Driving arrests 1% 10%
Two Years Post-Petition (N = 108) (N = 180)Any Criminal arrests/petitions 42% 39%Average # Criminal arrests/petitions 0.88 0.81 Any Juvenile Delinquency petitions (JD) 22% 22% Any Adult Criminal arrests 26% 24%
Of those with an Adult Criminal Arrest: (N = 31) (N = 40) Felony arrests 50% 54% Misdemeanor arrests 63% 74% Drug arrests 21% 24% Criminal mischief arrests 30% 27% Theft arrests 33% 40% Driving arrests 0% 14%*
+ p<.10 * p<.05 ** p<.01 *** p<.001 (2-tailed t-test)
Table 11-1: Impact of SJTC on Post-Petition New Arrests/Petitions
Impact on Post-Program Recidivism Another important measure of a Treatment Court’s impact, perhaps the most important, is how its participants fare when they are no longer under the supervision of the Court and probation. The “post-program” time period begins on the date of graduation or failure from the Treatment Court for participants, and completion of the case for the comparison youth. We tracked the youth for up to two years post-program, although not all Treatment Court participants
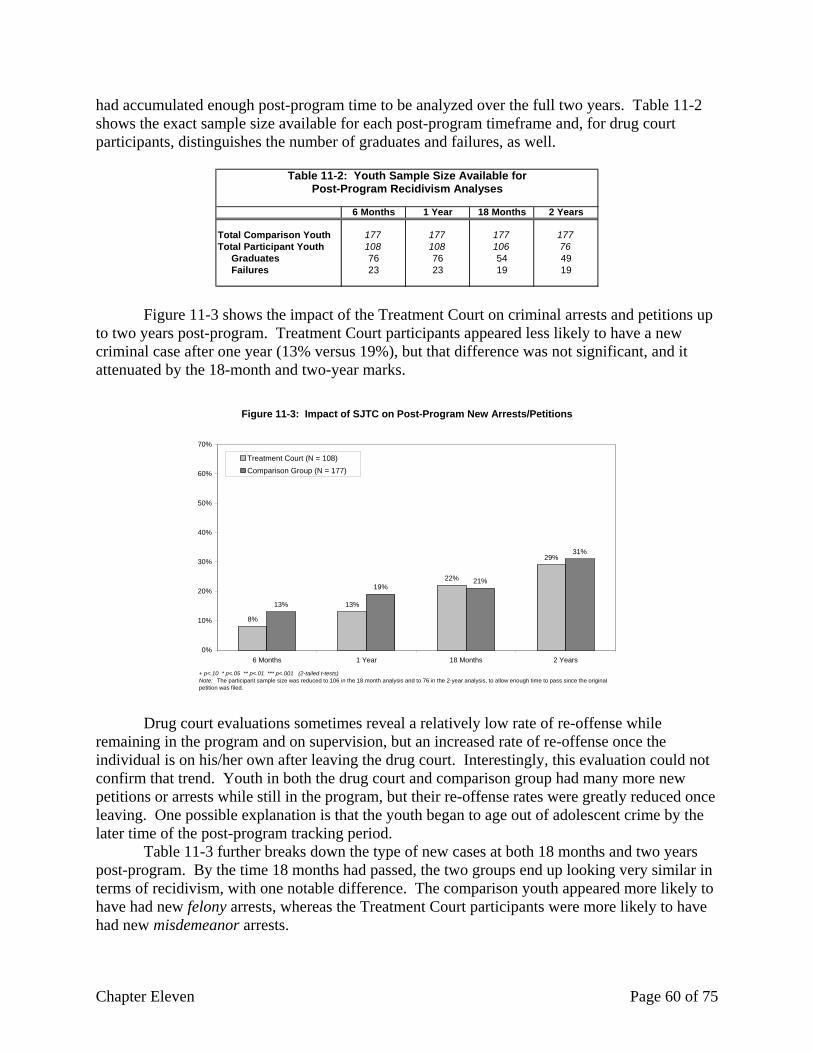
Chapter Eleven Page 60 of 75
had accumulated enough post-program time to be analyzed over the full two years. Table 11-2 shows the exact sample size available for each post-program timeframe and, for drug court participants, distinguishes the number of graduates and failures, as well.
6 Months 1 Year 18 Months 2 Years
Total Comparison Youth 177 177 177 177Total Participant Youth 108 108 106 76 Graduates 76 76 54 49 Failures 23 23 19 19
Post-Program Recidivism AnalysesTable 11-2: Youth Sample Size Available for
Figure 11-3 shows the impact of the Treatment Court on criminal arrests and petitions up to two years post-program. Treatment Court participants appeared less likely to have a new criminal case after one year (13% versus 19%), but that difference was not significant, and it attenuated by the 18-month and two-year marks.
Figure 11-3: Impact of SJTC on Post-Program New Arrests/Petitions
13%
22%
29%
13%
19%21%
31%
8%
0%
10%
20%
30%
40%
50%
60%
70%
6 Months 1 Year 18 Months 2 Years
Treatment Court (N = 108)Comparison Group (N = 177)
+ p<.10 * p<.05 ** p<.01 *** p<.001 (2-tailed t-tests)Note: The participant sample size was reduced to 106 in the 18 month analysis and to 76 in the 2-year analysis, to allow enough time to pass since the original petition was filed.
Drug court evaluations sometimes reveal a relatively low rate of re-offense while remaining in the program and on supervision, but an increased rate of re-offense once the individual is on his/her own after leaving the drug court. Interestingly, this evaluation could not confirm that trend. Youth in both the drug court and comparison group had many more new petitions or arrests while still in the program, but their re-offense rates were greatly reduced once leaving. One possible explanation is that the youth began to age out of adolescent crime by the later time of the post-program tracking period.
Table 11-3 further breaks down the type of new cases at both 18 months and two years post-program. By the time 18 months had passed, the two groups end up looking very similar in terms of recidivism, with one notable difference. The comparison youth appeared more likely to have had new felony arrests, whereas the Treatment Court participants were more likely to have had new misdemeanor arrests.
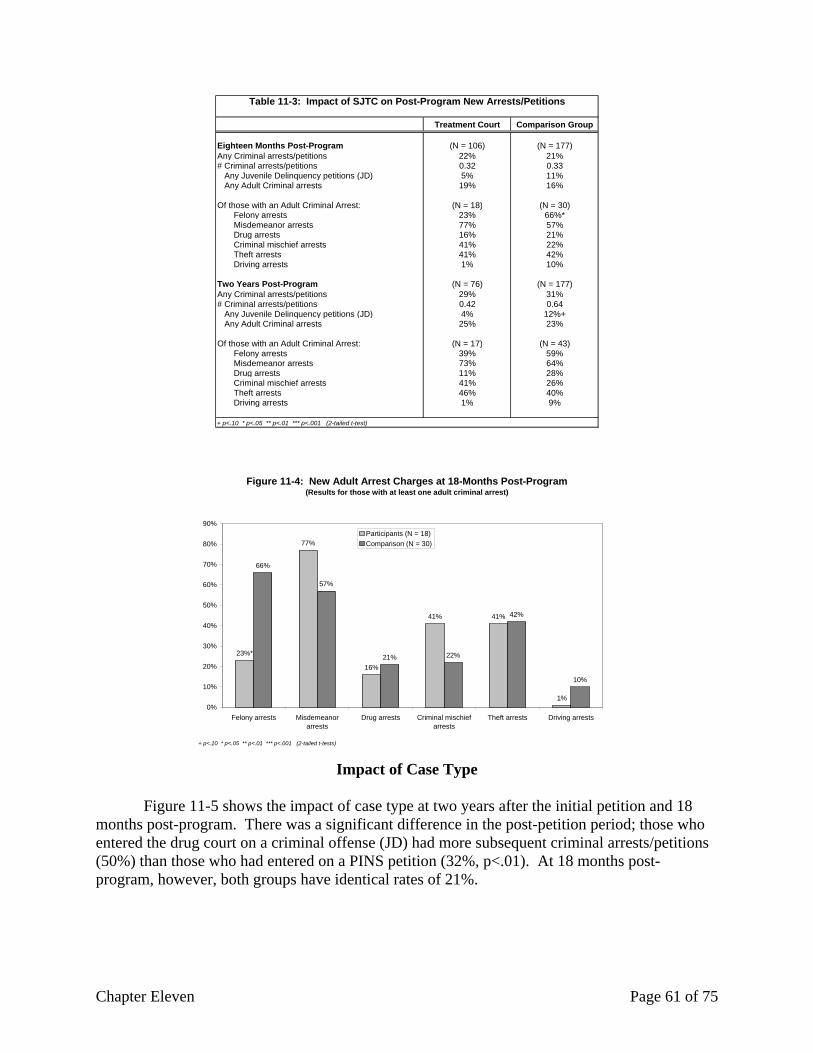
Chapter Eleven Page 61 of 75
Treatment Court Comparison Group
Eighteen Months Post-Program (N = 106) (N = 177)Any Criminal arrests/petitions 22% 21%# Criminal arrests/petitions 0.32 0.33 Any Juvenile Delinquency petitions (JD) 5% 11% Any Adult Criminal arrests 19% 16%
Of those with an Adult Criminal Arrest: (N = 18) (N = 30) Felony arrests 23% 66%* Misdemeanor arrests 77% 57% Drug arrests 16% 21% Criminal mischief arrests 41% 22% Theft arrests 41% 42% Driving arrests 1% 10%
Two Years Post-Program (N = 76) (N = 177)Any Criminal arrests/petitions 29% 31%# Criminal arrests/petitions 0.42 0.64 Any Juvenile Delinquency petitions (JD) 4% 12%+ Any Adult Criminal arrests 25% 23%
Of those with an Adult Criminal Arrest: (N = 17) (N = 43) Felony arrests 39% 59% Misdemeanor arrests 73% 64% Drug arrests 11% 28% Criminal mischief arrests 41% 26% Theft arrests 46% 40% Driving arrests 1% 9%
+ p<.10 * p<.05 ** p<.01 *** p<.001 (2-tailed t-test)
Table 11-3: Impact of SJTC on Post-Program New Arrests/Petitions
Figure 11-4: New Adult Arrest Charges at 18-Months Post-Program
(Results for those with at least one adult criminal arrest)
77%
16%
41% 41%
1%
66%
57%
21% 22%
42%
10%
23%*
0%
10%
20%
30%
40%
50%
60%
70%
80%
90%
Felony arrests Misdemeanorarrests
Drug arrests Criminal mischiefarrests
Theft arrests Driving arrests
Participants (N = 18)Comparison (N = 30)
+ p<.10 * p<.05 ** p<.01 *** p<.001 (2-tailed t-tests)
Impact of Case Type
Figure 11-5 shows the impact of case type at two years after the initial petition and 18 months post-program. There was a significant difference in the post-petition period; those who entered the drug court on a criminal offense (JD) had more subsequent criminal arrests/petitions (50%) than those who had entered on a PINS petition (32%, p<.01). At 18 months post-program, however, both groups have identical rates of 21%.

Chapter Eleven Page 62 of 75
Figure 11-5: Impact of Case Type on New Arrests/Petitions
50%
21%
32%**
21%
0%
10%
20%
30%
40%
50%
60%
70%
2Y Post-Petition 18M Post-Program
PINS (N = 155)JDs (N = 133)
The number of PINS youth dropped to 147 at 18 months post-program.
+ p<.10 * p<.05 ** p<.01 *** p<.0001 (2-tailed t-tests)
Impact of Graduation/Failure Status Focusing only on Treatment Court participants, Figure 11-4 looks at the impact of graduation/failure status on recidivism at 18 months and 2 years post-program. One would expect those who eventually became graduates to have less subsequent court activity. This hypothesis was strongly confirmed by this evaluation. Graduates were significantly less likely to re-offend during both time periods.
Figure 11-6: Impact of Treatment Court Graduation/Failure Status on Post-Program New Arrests/Petitions
42%
18%*
6%***
48%
0%
10%
20%
30%
40%
50%
60%
Eighteen Months Two Years
Graduates (N = 67)Failures (N = 23)
The number of graduates dropped to 49 and the number of failures to 19 at 2 years post-program.+ p<.10 * p<.05 ** p<.01 *** p<.001 (2-tailed t-tests)

Chapter Eleven Page 63 of 75
Predictors of New Cases A logistic regression analysis was conducted to determine the predictors of recidivism in both the post-petition and post-program time periods. Table 11-4 shows the results from the two-year post-petition model. The only significant result is that male youth are more likely to re-offend (p<.001). There was no significant impact of being in the Treatment Court. Table 11-4 also shows the results for the model predicting recidivism at 18 months post-program. Again, male youth were more likely to re-offend (p<.05), as were those who had a prior family court petition (p<.05). Similar to the post-petition model in Table 11-3, the impact of the Treatment Court on re-offending was not significant.
Summary Statistics Total Sample included in the analysis 288 283 No New Arrests/Petitions 173 223 At Least 1 New Arrest/Petition 115 60 Chi-Square for model 42.855*** 22.207**
Logistic Regression Odds Ratios Treatment Court Participant .999 .960 Juvenile Delinquent instant case .712 .920 Male 3.323*** 2.443* Caucasian .707 .847 Instant Charge = assault 2.722 .320 Instant Charge = property 1.209 .710 Any prior Family Court petitions 2.594 6.234* Propensity Score .210 .026*
Constant .471 .362++ p<.10 *p<.05 **p<.01 ***p<.001
Table 11-4: Logistic Regression Predicting Any New Arrest/Petition Within 2 Years Post-Petition and
18 Months Post-Program
18 Months Post-Program
2 Years Post-Petition
Summary
Considering the positive findings in the process evaluation regarding the implementation of the drug court model, we anticipated that the impact analysis would show a reduction in future criminal involvement. However, there were virtually no differences in new criminal cases for participants in the Treatment Court compared to the comparison youth. Notably, across both samples, those who originally had a juvenile delinquency petition were more likely to become involved in future criminal cases than those who originally had a PINS petition. There were also indications of greater recidivism among male youth and among those whose family members had previous family court involvement.
Chapter Twelve Page 64 of 75
Chapter Twelve: In Their Own Words This chapter reports the results of two focus groups held with Treatment Court participants in the Spring of 2006. The groups were facilitated by two researchers from the Center for Court Innovation; no treatment program or drug court staff were present. The main goal was to assess the impact of the drug court in the opinion of its participants. We talked with the youth about their impressions of four main topics:
• What motivated their participation and progress in the drug court, including a focus on sanctions and rewards;
• Advice for the drug court staff; • Change in their family and school lives; and • Long-term impact of participating in the drug court on their future drug use and criminal
involvement. One of the focus groups was conducted in an inpatient treatment facility where some of the Treatment Court youth were residing at the time. There were six male participants who participated in this conversation. The other focus group was conducted at an outpatient treatment facility where some of the youth received their drug treatment. There were four male participants who were involved in this discussion. All youth who participated in these focus groups were active participants in the Treatment Court at the time of the conversations. The identities of the participants, as well as the facilities, will not be revealed in this report, to protect their privacy.
Treatment Court Motivation We asked the focus group participants what motivated them to succeed in treatment and in the Court. We specifically asked about which sanctions they feared most, rewards they anticipated most eagerly, and which staff members provided integral support. Unless specifically prodded, the only sanction mentioned was being “locked up,” a short-term placement in a detention center. There was a genuine fear about being locked up, as well as anger.
When I was locked up for a week, the first two nights I was there, I was just thinking before I fell asleep there, I was like, I could be sleeping in my own bed right now. I just want to complete the program and I want to do everything I need to do in here [treatment]. I just don’t want to get locked up. I just don’t want to get locked up.
None of the participants expressed fear of any of the other sanctions, even when prodded. We then asked the youth to think about the rewards offered through the Treatment Court and to tell us the ones that they most wanted to obtain. They had seen t-shirts awarded in Court, but none of the youth in either focus group had ever received one. The only other reward that came up in conversation was a certificate for clean days. One of the youth dismissed the certificate, calling it “only a piece of paper.” In response, however, another youth said,
I felt like a million bucks when they gave me that certificate. It means more to me than just a piece of paper.

Chapter Twelve Page 65 of 75
Youth were anxious to give praise to their treatment program, especially the youth in the inpatient facility. As they explained to us, youth in inpatient treatment only come to Court once a month, so the impact of the treatment staff feels more concentrated and substantial. The youth in the inpatient facility expressed some frustration with having been assigned to a facility that required them to live away from home, but some of the youth were beginning to understand the reasoning. Most said they wished they had been given more chances before being sent to an inpatient facility, but several of them agreed that they would not have succeeded in Treatment Court if they remained at home. One said he thought other chances would have been a “waste” because both he and the Judge knew he wasn’t going to change any other way. Another youth said it was better than being placed in detention upstate, but that he was still disappointed. In considering what motivated success, one youth explained:
[The] Judge gave me so many chances, I really…I like him. I think he understands that I want to be good…even like now, I’ve got to tell people I won’t fight them. But if I looked at them I would just jump and start hitting people and stuff, I was wild. And he…you know he actually sees that I’m doing so much improving…because in five months, from when I first went there to now, he’s seen all the improving. I mean he sees it. And he was really quick. Like when I went to ‘Juvie’…before I went to ‘Juvie’ I was just cursing at the cops and stuff in front of the judges, and now I’m like, ‘Yes, Sir, yes, Sir’ I’m like an angel. I’m improving. And he sees that. But some judges don’t care – they’re like ‘Go away’. But he actually sits down and thinks about it. He’ll take into consideration what you did and if it’s something really stupid, you’re going to sit and wait [till the end of the court session]. If it’s something that he knows you could improve on and he sees that you are ready to step up and do what you’ve got to do he’ll let you stay. He makes us relearn our lessons. That’s why. He doesn’t send us up to send us up [detention].
Advice for Treatment Court Staff
We asked the youth to give one piece of advice to the Treatment Court staff. Not surprisingly, the first comment in both groups was to stop “locking up” kids.
They treat us like we’re criminals and we’re not. One youth advised staff to “look more into the person” considering where they come from when making decisions. However, another youth responded to that comment that he thought staff were already doing a good job of individualizing treatment plans reminding the original youth of the extensive assessment interview completed at the beginning of participation. One youth assigned to an inpatient facility said he thought it took too long for the Treatment Court to respond to noncompliance. He told us that he had done something wrong about a month ago and was just now coming into Court to receive his sanction. This youth conceded that he did something wrong and should be punished for it, but that he felt it was wrong to punish him a month later when he had excellent compliance during the intervening month.
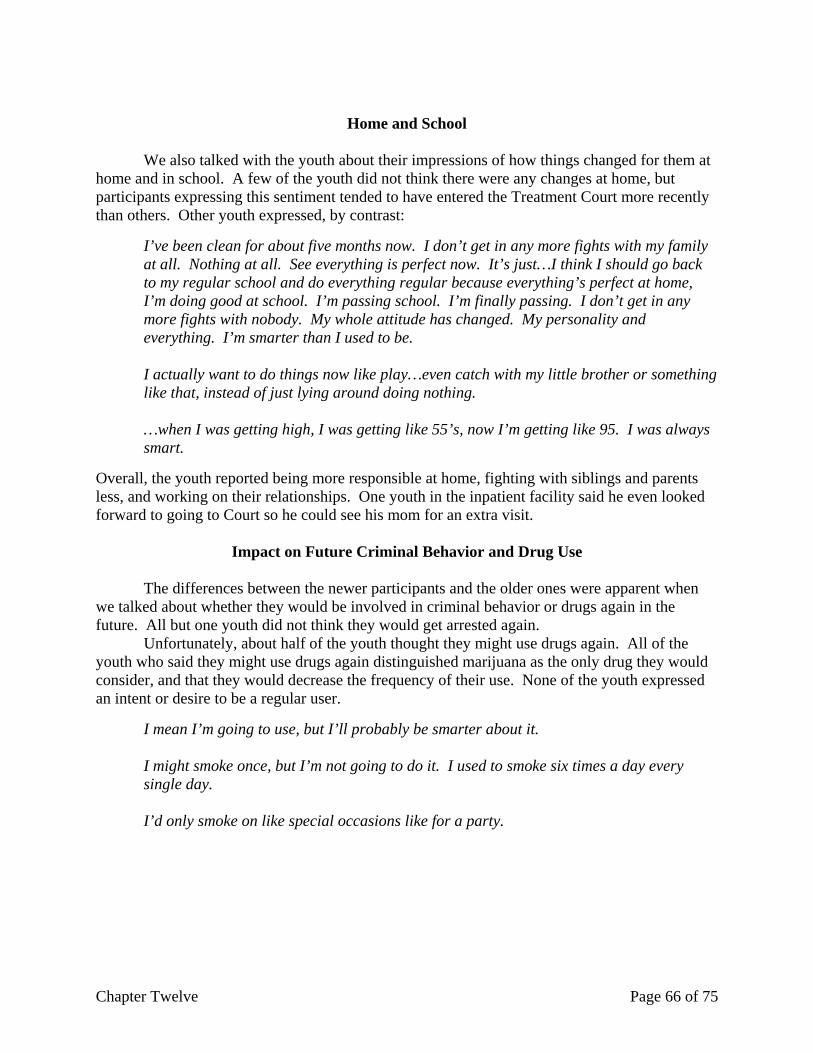
Chapter Twelve Page 66 of 75
Home and School
We also talked with the youth about their impressions of how things changed for them at home and in school. A few of the youth did not think there were any changes at home, but participants expressing this sentiment tended to have entered the Treatment Court more recently than others. Other youth expressed, by contrast:
I’ve been clean for about five months now. I don’t get in any more fights with my family at all. Nothing at all. See everything is perfect now. It’s just…I think I should go back to my regular school and do everything regular because everything’s perfect at home, I’m doing good at school. I’m passing school. I’m finally passing. I don’t get in any more fights with nobody. My whole attitude has changed. My personality and everything. I’m smarter than I used to be. I actually want to do things now like play…even catch with my little brother or something like that, instead of just lying around doing nothing. …when I was getting high, I was getting like 55’s, now I’m getting like 95. I was always smart.
Overall, the youth reported being more responsible at home, fighting with siblings and parents less, and working on their relationships. One youth in the inpatient facility said he even looked forward to going to Court so he could see his mom for an extra visit.
Impact on Future Criminal Behavior and Drug Use The differences between the newer participants and the older ones were apparent when we talked about whether they would be involved in criminal behavior or drugs again in the future. All but one youth did not think they would get arrested again. Unfortunately, about half of the youth thought they might use drugs again. All of the youth who said they might use drugs again distinguished marijuana as the only drug they would consider, and that they would decrease the frequency of their use. None of the youth expressed an intent or desire to be a regular user.
I mean I’m going to use, but I’ll probably be smarter about it. I might smoke once, but I’m not going to do it. I used to smoke six times a day every single day. I’d only smoke on like special occasions like for a party.

Chapter Twelve Page 67 of 75
The last question at both focus groups was if a friend of theirs was arrested, would they recommend that the friend enter the Treatment Court. All but one youth said they would advise their friend to go to the Treatment Court.
I would tell them to just stay clean, comply with all the rules. It’s easy when you’re 16 years old. You’re going to live till you’re 80 probably, so just live your life, just do what you’ve got to do, and hopefully you’ll graduate and maybe the years of your life will be good.

Chapter Thirteen Page 68 of 75
Chapter Thirteen – Conclusion The Suffolk County Juvenile Treatment Court is a well-implemented program that is successfully engaging the juvenile participants and their families. Staff members appear genuinely committed to the success of the program. The judges are thoughtful about their role in the lives of these young people, careful to balance punishment with positive reinforcement. The Coordinator and case managers hold the treatment programs to high standards and will not send their youth to a program that is not considered adequate. There is extensive communication across the different agencies involved in the program’s operations. Drug court team members identified several areas for improvement and strengthening. Many said that the case managers need more time to talk with participants in Court and more opportunities to see the juveniles outside of Court. Related, the case managers would like more contact with the schools, believing that the best way to change a youth’s life is to touch all aspects of it. Several team members called for increased accountability from probation, and others wanted more accountability from family members. It was suggested that the Court could make better use of Children’s Protective Services to entice parents to participate in their child’s progress. The program has a two-year retention rate of 79%, and the program graduation rate is in the range of 73% to 76%; both statistics far surpass the national averages for both adult and juvenile drug courts. The high retention rates demonstrate that participants are highly motivated, whether through positive incentives or the threat of consequences for noncompliance, to fulfill their court mandate; also, the high retention rates signal that most participants receive the maximum possible dosage of the intervention.
The impact analysis showed significant reductions in recidivism between program graduates and program failures. The impact analysis did not show significant differences in the recidivism of all drug court participants and the comparison group. Two years after program exit (or after final disposition for those in the comparison group), 29% of participants and 31% of comparison youth had a new criminal case (difference not significant). This study did not examine other potentially important impacts, such as substance use and family functioning. There is now a growing collection of juvenile drug court evaluations. Seven out of 20 evaluations found a positive impact of the juvenile drug court on the incidence of recidivism (and only four of those were statistically significant findings). In their analysis of why criminal justice innovations may fall short of expectations, Berman, Bowen, and Mansky (2006) identify four general types of failure: failure of design; failure of implementation; failure to manage power dynamics; and failure to engage in self-reflection. As discussed above, the Suffolk Juvenile Treatment Court was implemented well. Lack of funding or political support did not raise problems for the program; and self-reflection was conducted regularly. Yet, this study could not find an impact on recidivism. Perhaps the “design” of the juvenile drug court intervention – its theory of change and key operational elements – is the problem. In this regard, consider the work of Butts and Roman (2004), reviewed in the introduction to this report. Those authors critique the design of juvenile drug courts, contending that they deal with a young population that, merely by virtue of its age, is more prone to deviant behavior than adults. Do juvenile drug courts, therefore, force parents and the court system to overreact to deviant adolescent behavior that might subsequently desist without the need for elaborate intervention? The findings in this study provide further evidence for this position. For both
Chapter Thirteen Page 69 of 75
groups of juveniles, the recidivism rate dropped in the post-program period, perhaps implying a maturing of the youth, regardless of participation in the drug court.
It is worth underlining that this and other previous studies were unable to explore the impact of the drug court program on other measures besides recidivism. In the current evaluation, when the participants were asked in focus groups about the program’s effects, they say they are “smarter” now, they fight with their families less, they perform better in school, and they have their lives in perspective, all outcomes that are not directly tapped by measures of future criminal behavior. Similarly, drug court staff and even one parent reported to the evaluator that home and school life improved after participating in the program, and most juveniles in the focus groups expressed that they did not intend to use drugs again. One father approached the author outside the courtroom and said, “If it wasn’t for Treatment Court, I would have lost my son.” Thus, another possible explanation is that there is a mismatch between the nature of the program impacts and measures of recidivism.
A third consideration is simply that the research literature has yet to mature (note the pervasive methodological shortcomings in many of the earlier studies). As Butts and Roman would agree, we need more high quality studies before drawing general conclusions. A further lesson for evaluators and funders alike is that juvenile drug courts are not the same as adult drug courts – the participants, goals, and operations are different and can vary greatly across programs. Future evaluations, therefore, would benefit greatly from considering goals other than recidivism.
In conclusion, the strongest sentiment expressed by the Suffolk County Juvenile Treatment Court team was appreciation of the opportunity to make a difference in a juvenile’s life and future. Practically, the opportunity to have their records expunged means that these teenagers can apply for jobs and to colleges and not have to report that they were in the system. The Treatment Court offers a clean slate, to “live a different life than they would have.”
References Page 70 of 75
References
Andes, Fred. 2000. “Program Evaluation Report: Juvenile Drug Court.” Department of Sociology, New Jersey City University, NJ. Aos, Steve, Polly Phipps, Robert Barnoski, and Roxanne Lieb. 2001. “The Comparative Costs and Benefits of Programs to Reduce Crime Version 4.0.” Washington State Institute for Public Policy, Olympia, WA. Belenko, Steven. 1998. “Research on Drug Courts: A Critical Review.” National Drug Court Institute Review I. Berman, Greg, Philip Bowen, and Adam Mansky. 2006. “Trial and Error: Failure and Innovation in Criminal Justice Reform.” Center for Court Innovation, New York, NY. Butts, Jeffrey and John Roman, ed. 2004. Juvenile Drug Courts and Teen Substance Abuse. Washington, D.C.: The Urban Institute Press. Cissner, Amanda B. and Michael Rempel. 2005. “The State of Drug Court Research: Moving Beyond ‘Do They Work?” Center for Court Innovation, New York, NY. Cooper, Caroline S. 2001. “Juvenile Drug Court Programs.” Office of Justice Programs, Washington, D.C. Crumpton, Dave, Shannon M. Carey, Juliette R. Mackin, Michael W. Finigan. 2006. “Maryland Drug Treatment Courts: Interim Report of the Effectiveness of Juvenile Drug Courts.” NPC Research, Portland, OR. Dickie, Jill L. 2001. “Summit County Juvenile Court Drug Court: Evaluation Report, July 1, 2000 – June 30, 2001.” The Institute for Health and Social Policy, The University of Akron, Akron, OH. Government Accountability Office. 1997. Drug Courts: Overview of Growth, Characteristics, and Results. Washington, D.C.: United Status Government Accountability Office, Report to Congress. Government Accountability Office. 2005. Adult Drug Courts: Evidence Indicates Recidivism Reductions and Mixed Results for Other Outcomes. Washington D.C.: United States Government Accountability Office, Report to Congressional Committees. Guerin, Paul. 2001a. “Evaluation of the Thirteenth Judicial District Court Sandoval County Juvenile Drug Court: Quasi-Experimental Outcome Study Using Historical Information.” The Institute for Social Research, University of New Mexico, NM.

References Page 71 of 75
Guerin, Paul. 2001b. “Evaluation of the Second Judicial District Court County Juvenile Drug Court: Quasi-Experimental Outcome Study Using Historical Information.” The Institution for Social Research, University of New Mexico, NM. Harrell, Adele, Shannon Cavanagh, and John Roman. 1998. “Findings from the Evaluation of the D.C. Superior Court Drug Intervention Program.” The Urban Institute, Washington, D.C.. Hartmann, David J., Gayle M. Rhineberger. 2003. “Evaluation of the Kalamazoo County Juvenile Drug Treatment Court Program: October 1, 2001 – September 30, 2002: Year 5.” Kercher Center for Social Research, Western Michigan University, MI. Henggeler, S.W., C.A. Halliday-Boykins, P.B. Cunningham, J. Randall, S.B. Shapiro, J.E. Chapman. 2006. “Juvenile Drug Court: Enhancing Outcomes by Integrating Evidence-Based Treatments.” Journal of Consulting and Clinical Psychology, 74(1): 42-54. Herz, Denise C., Judy Phelps, and Abby DeBuse. 2003. “The Tri-County Juvenile Drug Court Evaluation Study: A Final Report.” Nebraska Commission on Law Enforcement and Criminal Justice, NE. Latessa, Edward J., Deborah K. Shaffer, and Christopher Lowenkamp. 2002. “Outcome Evaluation of Ohio’s Drug Court Efforts.” Center for Criminal Justice Research, Division of Criminal Justice, University of Cincinnati, Cincinnati, OH. Marlowe, Douglas. 2004. “Cutting Edge Drug Court Research,” Presentation at the Annual Meetings of the New England Association of Drug Court Treatment Professionals, Boston, MA. Miller, Marsha L., Evelyn A. Scocas, and John P. O’Connell. 1998. “Evaluation of the Juvenile Drug Court Diversion Program.” Delaware Statistical Analysis Center, DE. New York State Unified Court System. 2007. “Office of Court Drug Treatment Programs Project Manager’s Status Report: April 2007.” New York: New York State Unified Court System, Retrieved April 5, 2007. O’Connell, John P., Evelyn Nestlerode, and Marsha L. Miller. 1999. “Evaluation of the Delaware Juvenile Drug Court Diversion Program.” Criminal Justice Council’s Statistical Analysis Center, DE. O’Connell, Paul and David Wright. 2000. “Beckham County Juvenile Drug Court: Phase II Analysis and Evaluation.” Oklahoma Criminal Justice Resource Center, OK. Office of Justice Programs. 1997. Defining Drug Courts: The Key Components. Washington, D.C.: Office of Justice Programs. Office of Justice Programs. 2006a. “BJA Drug Court Clearinghouse and Technical Assistance Project.” Washington, D.C.: American University, Retrieved November 20, 2006.

References Page 72 of 75
Office of Justice Programs. 2006b. “BJA Drug Court Clearinghouse and Technical Assistance Project.” Washington, D.C.: American University, Retrieved November 22, 2006. Parsons, BruceV. and Edward C. Byrnes. Nd. “Byrne Evaluation Partnership Program Final Report.” University of Utah Social Research Institute, UT. Rempel, Michael, Dana Fox-Kralstein, Amanda Cissner, Robyn Cohen, Melissa Labriola, Donald Farole, Jr., Ann Bader, and Michael Magnani. 2003. “The New York State Adult Drug Court Evaluation: Policies, Participants, and Impact.” Report submitted to the New York State Unified Court System and the Bureau of Justice Assistance, Center for Court Innovation, New York, NY. Rempel, Michael and Christine D. DeStefano. 2001a. “Predictors of Engagement in Court-Mandated Treatment: Findings at the Brooklyn Treatment Court, 1996-2000.” 33 Journal of Offender Rehabilitation, 87: 124. Roche, Brenda K. 2002. “Missoula Youth Drug Court: Program Evaluation.” Missoula Youth Drug Court, Missoula, MT. Rodriguez, Nancy and Vince Webb. 2001. “An Assessment of the Maricopa County Juvenile Drug Courts: Phase I.” Department of Administration of Justice, Arizona State University West, AZ. Rodriguez, Nancy and Vince Webb. 2004. “Multiple Measures of Juvenile Drug Court Effectiveness: Results of a Quasi-Experimental Design.” Crime and Delinquency, 50(2): 292-314. Roman, John and Christine DeStefano. 2004. “Drug Court Effects and the Quality of Existing Evidence.” in Juvenile Drug Courts and Teen Substance Abuse, eds. J. Butts and J. Roman, Washington, D.C.: Urban Institute Press. Thompson, Kevin M. 2004. “An Adult Recidivism Outcome Evaluation of North Dakota’s Juvenile Drug Court.” Department of Criminal Justice and Political Science, North Dakota State University, ND. Wilson, David B., Ojmarrh Mitchell, and Doris L. MacKenzie. 2002. “Systematic Review of Drug Court Effects on Recidivism.” Paper presented at the Annual Meetings of the American Society of Criminology, Chicago, IL. Zweig, Janine M. and Courteney Schaeffer. 2004. “National Portrait of Adult Drug Courts: Findings from the 2004 Drug Court Survey.” Paper presented at the Annual Meetings of the American Society of Criminology, Nashville, TN.
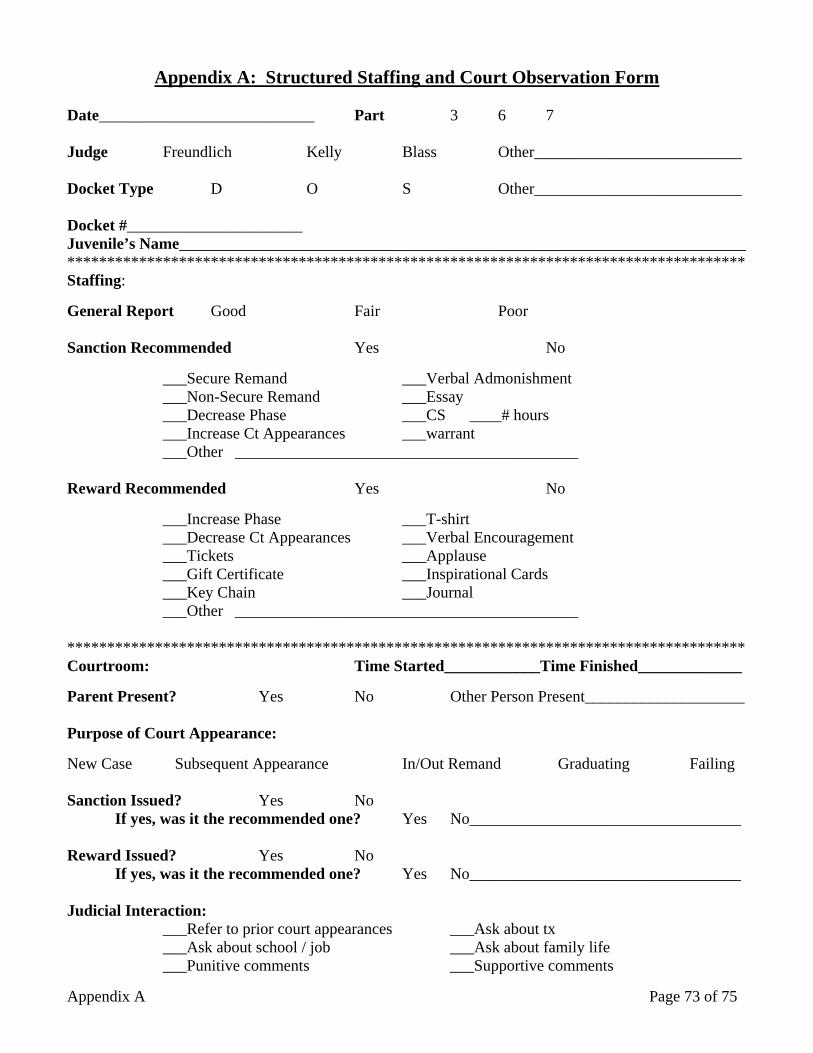
Appendix A Page 73 of 75
Appendix A: Structured Staffing and Court Observation Form Date___________________________ Part 3 6 7 Judge Freundlich Kelly Blass Other__________________________ Docket Type D O S Other__________________________ Docket #______________________ Juvenile’s Name_______________________________________________________________________ ************************************************************************************* Staffing: General Report Good Fair Poor Sanction Recommended Yes No ___Secure Remand ___Verbal Admonishment ___Non-Secure Remand ___Essay ___Decrease Phase ___CS ____# hours ___Increase Ct Appearances ___warrant ___Other ___________________________________________ Reward Recommended Yes No ___Increase Phase ___T-shirt ___Decrease Ct Appearances ___Verbal Encouragement ___Tickets ___Applause ___Gift Certificate ___Inspirational Cards ___Key Chain ___Journal ___Other ___________________________________________ ************************************************************************************* Courtroom: Time Started____________Time Finished_____________ Parent Present? Yes No Other Person Present____________________ Purpose of Court Appearance: New Case Subsequent Appearance In/Out Remand Graduating Failing Sanction Issued? Yes No If yes, was it the recommended one? Yes No__________________________________ Reward Issued? Yes No If yes, was it the recommended one? Yes No__________________________________ Judicial Interaction: ___Refer to prior court appearances ___Ask about tx
___Ask about school / job ___Ask about family life ___Punitive comments ___Supportive comments
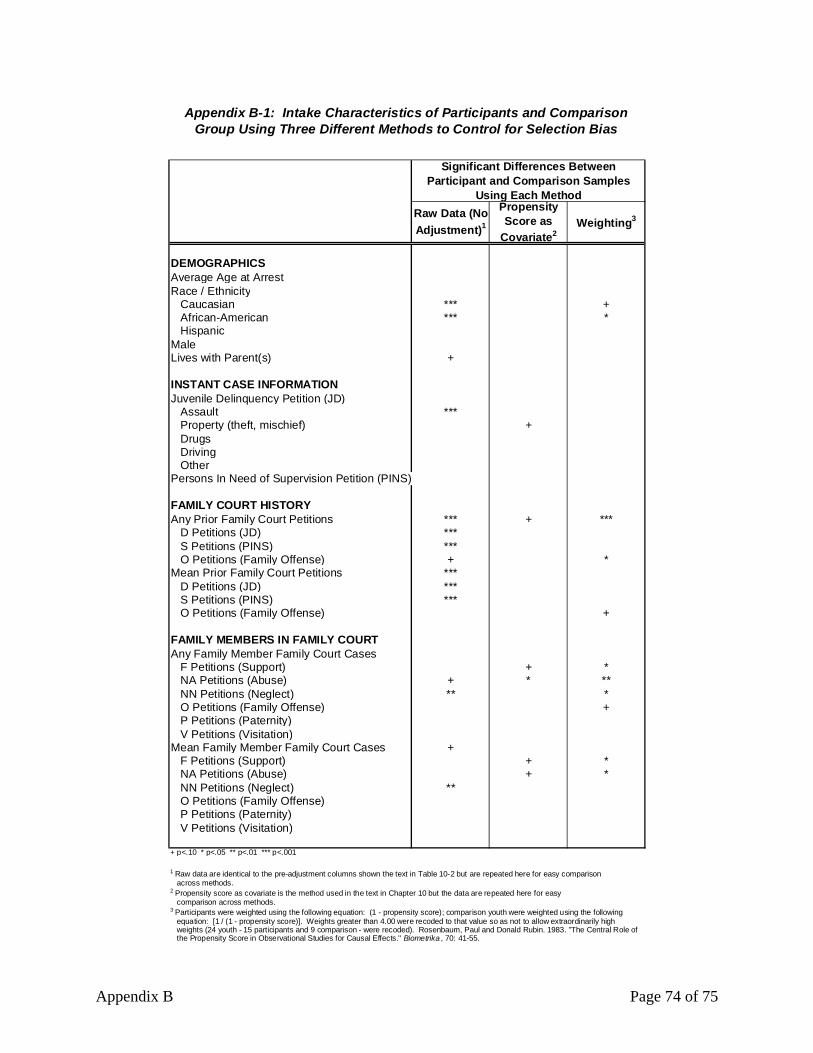
Appendix B Page 74 of 75
DEMOGRAPHICSAverage Age at ArrestRace / Ethnicity Caucasian *** + African-American *** * HispanicMaleLives with Parent(s) +
INSTANT CASE INFORMATIONJuvenile Delinquency Petition (JD) Assault *** Property (theft, mischief) + Drugs Driving OtherPersons In Need of Supervision Petition (PINS)
FAMILY COURT HISTORYAny Prior Family Court Petitions *** + *** D Petitions (JD) *** S Petitions (PINS) *** O Petitions (Family Offense) + *Mean Prior Family Court Petitions *** D Petitions (JD) *** S Petitions (PINS) *** O Petitions (Family Offense) +
FAMILY MEMBERS IN FAMILY COURTAny Family Member Family Court Cases F Petitions (Support) + * NA Petitions (Abuse) + * ** NN Petitions (Neglect) ** * O Petitions (Family Offense) + P Petitions (Paternity) V Petitions (Visitation)Mean Family Member Family Court Cases + F Petitions (Support) + * NA Petitions (Abuse) + * NN Petitions (Neglect) ** O Petitions (Family Offense) P Petitions (Paternity) V Petitions (Visitation)
+ p<.10 * p<.05 ** p<.01 *** p<.001
1 Raw data are identical to the pre-adjustment columns shown the text in Table 10-2 but are repeated here for easy comparison across methods.2 Propensity score as covariate is the method used in the text in Chapter 10 but the data are repeated here for easy comparison across methods.3 Participants were weighted using the following equation: (1 - propensity score); comparison youth were weighted using the following equation: [1 / (1 - propensity score)]. Weights greater than 4.00 were recoded to that value so as not to allow extraordinarily high weights (24 youth - 15 participants and 9 comparison - were recoded). Rosenbaum, Paul and Donald Rubin. 1983. "The Central Role of the Propensity Score in Observational Studies for Causal Effects." Biometrika , 70: 41-55.
Appendix B-1: Intake Characteristics of Participants and Comparison Group Using Three Different Methods to Control for Selection Bias
Weighting3Propensity Score as
Covariate2
Raw Data (No Adjustment)1
Significant Differences Between Participant and Comparison Samples
Using Each Method
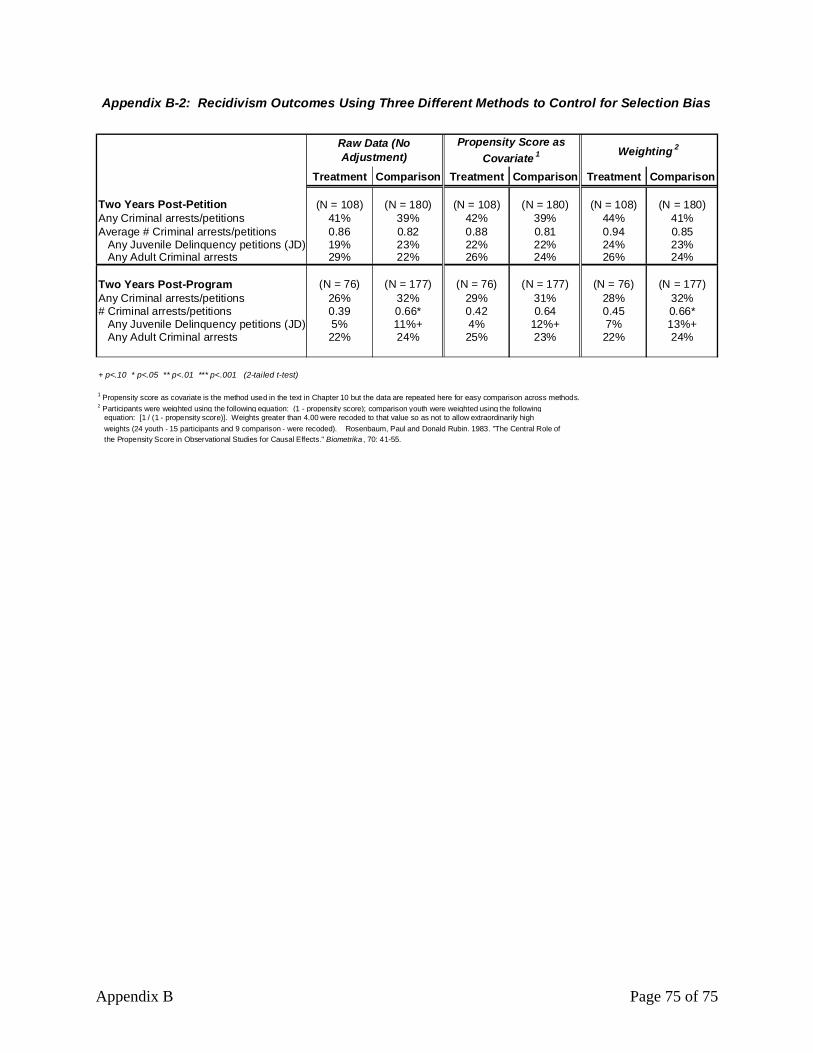
Appendix B Page 75 of 75
Treatment Comparison Treatment Comparison Treatment Comparison
Two Years Post-Petition (N = 108) (N = 180) (N = 108) (N = 180) (N = 108) (N = 180)Any Criminal arrests/petitions 41% 39% 42% 39% 44% 41%Average # Criminal arrests/petitions 0.86 0.82 0.88 0.81 0.94 0.85 Any Juvenile Delinquency petitions (JD) 19% 23% 22% 22% 24% 23% Any Adult Criminal arrests 29% 22% 26% 24% 26% 24%
Two Years Post-Program (N = 76) (N = 177) (N = 76) (N = 177) (N = 76) (N = 177)Any Criminal arrests/petitions 26% 32% 29% 31% 28% 32%# Criminal arrests/petitions 0.39 0.66* 0.42 0.64 0.45 0.66* Any Juvenile Delinquency petitions (JD) 5% 11%+ 4% 12%+ 7% 13%+ Any Adult Criminal arrests 22% 24% 25% 23% 22% 24%
+ p<.10 * p<.05 ** p<.01 *** p<.001 (2-tailed t-test)
1 Propensity score as covariate is the method used in the text in Chapter 10 but the data are repeated here for easy comparison across methods.2 Participants were weighted using the following equation: (1 - propensity score); comparison youth were weighted using the following equation: [1 / (1 - propensity score)]. Weights greater than 4.00 were recoded to that value so as not to allow extraordinarily high weights (24 youth - 15 participants and 9 comparison - were recoded). Rosenbaum, Paul and Donald Rubin. 1983. "The Central Role of the Propensity Score in Observational Studies for Causal Effects." Biometrika , 70: 41-55.
Propensity Score as Covariate 1
Raw Data (No Adjustment) Weighting 2
Appendix B-2: Recidivism Outcomes Using Three Different Methods to Control for Selection Bias


![New Treatment Strategies in the Treatment of Juvenile ... filearthritis and juvenile chronic arthritis, is an umbrella term for clinical patterns of arthritis in children.[6] By definition](https://static.fdocuments.us/doc/165x107/5d55f3a188c99353208b9b9f/new-treatment-strategies-in-the-treatment-of-juvenile-and-juvenile-chronic-arthritis.jpg)


![WYOMING STATE ADVISORY COUNCIL ON JUVENILE JUSTICE · treatment of juvenile delinquency and administration of juvenile justice [W.S. 14-10-101(a)]. The Advisory Council shall be made](https://static.fdocuments.us/doc/165x107/5fd0c47bb392414c1d378587/wyoming-state-advisory-council-on-juvenile-treatment-of-juvenile-delinquency-and.jpg)