Orange County Substance Abuse Crime Prevention Act of 2000 Outcome and Recidivism Study
Evaluation of the Substance Abuse and Crime Prevention Act
2002 Report
Implementation: July 1, 2001 to June 30, 2002
Prepared for the Department of Alcohol and Drug Programs California Health and Human Services Agency
By Douglas Longshore, Ph.D., Elizabeth Evans, M.A., Darren Urada, Ph.D., Cheryl Teruya, Ph.D., Mary Hardy, M.A.,
Yih-Ing Hser, Ph.D., Michael Prendergast, Ph.D., and Susan Ettner, Ph.D.
July 7, 2003
IIInnnttteeegggrrraaattteeeddd SSSuuubbbssstttaaannnccceee AAAbbbuuussseee PPPrrrooogggrrraaammmsss


Evaluation of the Substance Abuse and Crime Prevention Act
2002 Report
Implementation: July 1, 2001 to June 30, 2002
Prepared for the Department of Alcohol and Drug Programs California Health and Human Services Agency
By Douglas Longshore, Ph.D., Elizabeth Evans, M.A., Darren Urada, Ph.D., Cheryl Teruya, Ph.D., Mary Hardy, M.A., Yih-Ing
Hser, Ph.D., Michael Prendergast, Ph.D., and Susan Ettner, Ph.D.
July 7, 2003


Table of Contents
Preface....................................................................................................................................... 3 Executive Summary................................................................................................................. 5 Chapter 1: Introduction .......................................................................................................... 7
Evaluation overview.............................................................................................................. 7 Organization of the report ................................................................................................... 8
Chapter 2: Offenders in SACPA ............................................................................................ 9
SACPA pipeline..................................................................................................................... 9 Characteristics of treatment clients .................................................................................... 14 Treatment duration .............................................................................................................. 39 SACPA client characteristics and treatment duration...................................................... 42
Chapter 3: Assessment and Supervision Procedures ........................................................... 51
Assessment of problem severity........................................................................................... 51 Treatment placement procedures........................................................................................ 52 Assessment of risk................................................................................................................. 52 Supervision procedures ........................................................................................................ 53
Chapter 4: Criminal Justice and Treatment......................................................................... 55
SACPA-eligible offenses ....................................................................................................... 56 Arrest and charging practices ............................................................................................. 58 Offender management strategies......................................................................................... 66 Treatment modalities............................................................................................................ 67 Treatment capacity ............................................................................................................... 72
Chapter 5: County Implementation....................................................................................... 77
Interagency communication................................................................................................. 77 Quality of implementation ................................................................................................... 78 Implementation issues .......................................................................................................... 78
Chapter 6: Offender Management and “Show” Rates......................................................... 87
County variability ................................................................................................................. 87 “Show” rates at assessment.................................................................................................. 88 “Show” rates at treatment ................................................................................................... 88
Chapter 7: Evaluation Progress and Planning...................................................................... 97
Research questions................................................................................................................ 97 Stakeholder survey ............................................................................................................... 101 Focus counties ....................................................................................................................... 102 Data access............................................................................................................................. 107 Comparison groups for cost and outcome analyses........................................................... 107
Page of 168 1

Glossary .................................................................................................................................... 119 Appendices................................................................................................................................ 121
A. Alternative pipeline analyses B. County plan analysis C. SACPA-eligible offenses D. Arrest practices: Data sources and method E. Focus group report: Executive summary F. Data elements by source G. Administrative databases
References................................................................................................................................. 167
Page of 168 2

Preface Proposition 36 was passed by the California electorate in November 2000 and enacted into law as the Substance Abuse and Crime Prevention Act (SACPA). SACPA represents a major shift in criminal justice policy. Adults convicted of nonviolent drug-related offenses and otherwise eligible for SACPA can now be sentenced to probation with drug treatment instead of either probation without treatment or incarceration. Offenders on probation or parole who commit nonviolent drug-related offenses or who violate drug-related conditions of their release may also receive treatment. An independent evaluation of SACPA’s implementation, fiscal impact, and effectiveness was mandated in the initiative. The Department of Alcohol and Drug Programs (ADP) was designated by the Governor’s Office to serve as the lead agency in implementing and evaluating SACPA. In turn, ADP chose UCLA Integrated Substance Abuse Programs to conduct the independent evaluation of SACPA over a five and one-half year period beginning January 1, 2001 and ending June 30, 2006. The evaluation will include analyses of cost-offset, client outcomes, implementation, and lessons learned. This report presents findings on implementation of SACPA across all 58 California counties during its first year (July 1, 2001 to June 30, 2002). Included are a description of the flow of offenders through the SACPA “pipeline” starting with the initial decision to participate in SACPA and continuing through assessment and treatment entry, procedures employed in the counties for assessment and supervision of SACPA offenders, adaptations made by county criminal-justice and treatment systems in response to SACPA, implementation issues identified by county representatives, and offender management strategies employed by the counties. Also included is a review of evaluation progress and planning. Later reports will update findings on implementation and expand to cover SACPA’s fiscal impact and effectiveness. For more information about the evaluation, see http://www.uclaisap.org/Prop36/Prop36.htm or contact: Douglas Longshore, Ph.D. Larry J. Carr, Ph.D. UCLA Integrated Substance Abuse Programs1640 S. Sepulveda Blvd., Suite 200 Los Angeles, CA 90025 Tel: (310) 445-0874 ext. 231 Email: [email protected]
California Department of Alcohol and Drug Programs 1700 K Street Sacramento, CA 95814 Tel: (916) 327-8965 Email: [email protected]
Page of 168 3

Page of 168 4
Executive Summary This is the first report of findings from the evaluation of the Substance Abuse and Crime Prevention Act (SACPA). Prepared by UCLA for the California Department of Alcohol and Drug Programs, the report focuses on implementation of SACPA in the state’s 58 counties during the year beginning July 1, 2001 and ending June 30, 2002. SACPA implementation required substantial collaboration among local agencies handling drug offenders and introduced thousands of new clients into drug treatment. In 2001-02, SACPA placed over 30,000 California offenders in treatment. Offender participation in SACPA A total of 53,697 offenders were found in court to be eligible for SACPA (convicted of a non-violent drug-related offense or of being under the influence of a controlled substance) in its first year. This total included offenders currently on probation or parole for prior offenses as well as new offenders. Of that total, 82% (44,043) chose SACPA and, unless held for additional charges or administrative reasons, were referred for an assessment of their service needs and appropriate level of community supervision. It is important to note that SACPA participation is voluntary; it reflects an affirmative decision by eligible offenders. The 18% who did not choose SACPA may have participated in drug court or opted for routine criminal justice processing. Among offenders who chose SACPA, 85% (37,495) completed assessment, and 81% (30,469) of assessed offenders entered treatment. Overall, 69% of offenders who opted for SACPA in court entered treatment. This “show” rate compares favorably with “show” rates in other studies of drug users referred to treatment by criminal justice or other sources. Treatment About 50% of SACPA offenders in treatment reported methamphetamine as their primary drug problem, with cocaine/crack a distant second (15%). Marijuana and heroin were the primary drug problem for 12% and 11%, respectively. On average, SACPA clients had longer drug use histories than non-SACPA clients referred to treatment by criminal justice. Most SACPA clients (72%) were men, and the percentage of men was higher among SACPA clients than among clients entering treatment on their own initiative or referred by a source other than criminal justice (e.g., a health care provider or employee assistance program). About half of SACPA clients were non-Hispanic Whites, while 31% were Hispanics and 14% were African Americans. Most SACPA clients (86%) were placed in outpatient drug-free programs, and 10% were placed in long-term residential programs. This was the first drug treatment opportunity for over half of all SACPA clients. Methadone maintenance is the treatment recommended for heroin dependence by the National Academy of Sciences and the National Institute on Drug Abuse. However, few
Page of 168 5

heroin users in SACPA (10%) were treated with methadone (detoxification or maintenance). Most were placed in outpatient drug-free programs, which can be effective with heroin users but do not provide medication to alleviate the symptoms of heroin abstinence. Almost all (85%) of the SACPA clients who entered outpatient drug-free programs received at least 30 days of treatment. Among long-term residential clients, 76% received at least 30 days of treatment. 60-day rates were 73% in outpatient drug-free and 58% in long-term residential programs. Findings on 90-day duration were of particular interest because 90 days are widely regarded as a minimum threshold for effective treatment. Most outpatient drug-free clients (65%) were in treatment for at least 90 days, as were 43% of long-term residential clients. These rates of treatment duration were similar to the rates seen among non-SACPA clients. Implementation SACPA required substantial collaboration among criminal justice, treatment, and county administrators and reportedly added to their workloads. County representatives expressed concern regarding the sufficiency of SACPA funding across years. This concern applied especially to the cost of services required by “high need” offenders, who entered SACPA in greater numbers than expected. Nevertheless, counties were able to bring local agencies together for planning and administration; coordination of assessment, treatment, and supervision of offenders; staff training; and problem solving. At the end of SACPA’s first year, most county representatives reported favorable views of SACPA implementation. There was no evidence that SACPA prompted any systematic change in arrest or charging practices. However, there was variability across counties in the scope of offenses regarded as SACPA-eligible. All counties reported that drug possession and being under the influence of drugs were SACPA-eligible. Possession of drug paraphernalia and transportation of drugs were cited as SACPA-eligible in most counties but not all. Some counties, but not most, treated vehicle offenses such as driving under the influence of drugs as SACPA-eligible. Successful strategies There was considerable innovation in strategies used to manage SACPA offenders. Three strategies were associated with higher “show” rates at assessment: placing probation and assessment staff at the same location, allowing “walk in” assessment, and requiring only one visit to complete an assessment. Handling SACPA offenders in a drug court approach was strongly related to higher “show” rates at treatment. Continuing evaluation Future evaluation reports will cover the possible cost-saving associated with SACPA, outcomes for SACPA clients, and overall lessons learned. The evaluation will continue to report on implementation, especially emerging innovations in offender processing and supervision, treatment, and other service delivery.
Page of 168 6
Chapter 1: Introduction
In November 2000, California voters passed Proposition 36, which was enacted into lawas the Substance Abuse and Crime Prevention Act (SACPA). UCLA’s Integrated Substance Abuse Programs was chosen by the CaliforniaDepartment of Alcohol and Drug Programs (ADP) to conduct an independent evaluationof SACPA. This report describes findings on the implementation of SACPA and evaluation progressand planning during SACPA’s first year (July 1, 2001 to June 30, 2002).
In November 2000, California voters passed Proposition 36, which was enacted into law as the Substance Abuse and Crime Prevention Act (SACPA). (The term “Proposition 36” is employed here in reference to events occurring before enactment of SACPA, to documents that include the term in their titles, and in direct quotes taken from other sources.) SACPA represents a major shift in criminal justice policy, inasmuch as adults convicted of nonviolent drug-related offenses in California and otherwise eligible for SACPA can now be sentenced to probation with drug treatment instead of either probation without treatment or incarceration. Offenders on probation or parole who commit nonviolent drug-related offenses or who violate drug-related conditions of their release may also receive treatment. Drug treatment programs serving SACPA offenders must be licensed or certified by ADP. Modalities include drug education, regular and intensive outpatient drug-free treatment, short- and long-term residential treatment, and pharmacotherapy (typically methadone for clients dependent on heroin). Offenders who commit non-drug violations of probation/parole may face termination from SACPA. Consequences of drug violations depend on the severity and number of such violations. The offender may be assigned to more intensive treatment, or probation/parole may be revoked. UCLA’s Integrated Substance Abuse Programs was chosen by the California Department of Alcohol and Drug Programs (ADP) to conduct an independent evaluation of SACPA over a five and one-half year period beginning January 1, 2001 and ending June 30, 2006. This report describes findings on the implementation of SACPA and evaluation progress and planning during SACPA’s first year (July 1, 2001 to June 30, 2002). Evaluation overview Along with evaluations of drug courts and drug policy initiatives in other states (e.g., Arizona’s Drug Medicalization, Prevention, and Control Act of 1996), the SACPA evaluation will provide state and national policymakers with information needed to make decisions about the future of SACPA in California and similar programs elsewhere. The evaluation covers four domains: cost-offset, client outcomes, implementation, and lessons learned. Data are being collected in surveys of county representatives and offenders; focus
Page of 168 7

groups (semi-structured in-depth discussion with county representatives); observation (e.g., recording of issues raised, perceptions noted, decisions and agreements reached) at meetings, conferences, and other events; county records; and statewide datasets maintained by human services and criminal justice agencies. Douglas Longshore, Ph.D., is principal investigator. Other UCLA researchers leading the SACPA evaluation are Yih-Ing Hser, Ph.D., and Michael Prendergast, Ph.D. Susan Ettner, Ph.D., an economist at UCLA, will conduct the cost-offset analysis. Also involved are M. Douglas Anglin, Ph.D., serving as science advisor; and A. Mark Kleiman, Ph.D., as policy advisor. Organization of the report This report addresses research questions that comprise the implementation domain of the evaluation (a full list of research questions appears in Chapter 7). Those questions are: • How many SACPA-eligible offenders enter and complete treatment? • What procedures are used for assessment, placement, and supervision of SACPA
offenders? • How do sectors of the criminal justice and treatment systems respond to SACPA? • What problems occur in implementing SACPA, and how are those problems addressed? Chapter 2 describes the SACPA “pipeline,” i.e., the percent of offenders who chose SACPA when sentenced in court, the percent who completed an assessment, and the percent who entered treatment. Chapter 2 also reports characteristics of SACPA offenders entering treatment and compares them to other clients entering treatment in California during the same timeframe. Offender assessment and supervision procedures are summarized in Chapter 3. Implementation strategies adopted by county criminal-justice and treatment systems are discussed in Chapter 4. Chapter 5 covers county implementation issues and features findings from in-depth group discussions with stakeholders in the evaluation’s ten focus counties. The relationship between offender management strategies and “show” rates is the subject of Chapter 6. Finally, evaluation progress and planning are reviewed in Chapter 7. Key findings are highlighted at the outset of each chapter.
Page of 168 8

Chapter 2: Offenders in SACPA
A total of 53,697 offenders were found in court to be eligible for SACPA in its firstyear, and 82% (44,043) chose to participate in SACPA. Among offenders who chose SACPA, 85% (37,495) completed assessment, and 81%(30,469) of assessed offenders entered treatment. Overall, 69% of offenders who optedfor SACPA in court entered treatment. About 50% of SACPA offenders in treatment reported methamphetamine as theirprimary drug problem, with cocaine/crack a distant second (15%). SACPA clients hadlonger drug use histories than non-SACPA clients referred to treatment by criminaljustice. Most SACPA clients (72%) were men. About half were non-Hispanic Whites, while31% were Hispanics, and 14% were African Americans. Treatment duration was similar among SACPA clients and non-SACPA clients.
This chapter describes the “pipeline” of offenders entering SACPA during its first year. Three steps in the pipeline are covered: the eligible offender’s decision to participate in SACPA, completion of the assessment process, and entry into the treatment program to which the offender is assigned. For a look at treatment retention, this chapter also reports the percent of SACPA offenders who remained in treatment for at least 30, 60, and 90 days. The 90-day threshold is of particular interest because that period of time is widely considered to be the minimum threshold for effective treatment. Finally, this chapter describes characteristics of offenders entering treatment and offenders remaining in treatment for at least 30, 60, and 90 days. (Later reports will include a fourth step in the pipeline, namely treatment completion, as the necessary data become available.) SACPA pipeline People convicted of a non-violent drug-related offense or of being under the influence of a controlled substance are eligible for SACPA.1 As shown in Table 2.1, there are differences in eligibility criteria for probationers and parolees. 1 There are some eligibility exceptions. SACPA does not apply to any offender previously convicted of one or more serious or violent felonies, unless the current drug possession offense occurred after a period of five years in which the offender remained free of both prison custody and the commission of an offense which resulted in (1) a felony conviction other than a non-violent drug possession offense or (2) a misdemeanor conviction involving physical injury or the threat of physical injury to another person. Also ineligible is any non-violent drug possession offender who has been convicted in the same proceeding of a misdemeanor not related to the use of drugs or any felony. SACPA does not apply to any offender who, while using a firearm, unlawfully possesses (1) a substance containing cocaine base, cocaine, heroin, or methamphetamine or (2) a liquid, non-liquid, plant substance, or hand-rolled cigarette, containing phencyclidine. SACPA does not apply to any
Page of 168 9

Table 2.1 Terms of SACPA Participation for Parolees and Probationers2
Factor Parolees Probationers Controlling law Penal Code 1210, 3063.1,
3063.2 Penal Code 1210, 1210.1, 1210.5
Adjudication authority Board of Prison Terms Superior Court Supervision authority Parole and Community
Services Division, California Department of Corrections
County probation department
Serious or violent background
Parolees who have ever been convicted of a serious of violent felony are ineligible.
Offenders with prior serious or violent felony convictions are eligible if the conviction is more than five years old and they have been free of both prison custody and non-drug possession felony or violent misdemeanor convictions during that five-year period.
Disposition of charges Placement in SACPA is the final disposition. Failure to complete treatment must be charged as a new violation.
Original charges remain open for dismissal upon successful completion or re-sentencing upon failure to complete treatment.
Term of supervision Placement on parole occurs before placement in SACPA and will terminate independently of parolees’ progress in treatment.
If not already on probation, offenders are placed on probation as part of SACPA disposition, and probation will not terminate prior to completion of treatment.
Disposition of subsequent violations
Parolees become ineligible upon the second violation subsequent to placement (first violation for those on parole before July 2001).
Probationers become ineligible upon the third violation subsequent to placement (second violation for those on probation before July 2001).
offender who, while using a firearm, is unlawfully under the influence of cocaine base, cocaine, heroin, methamphetamine, or phencyclidine. SACPA does not apply to any offender who refuses drug treatment as a condition of probation or parole. Finally, SACPA does not apply to any offender who (1) has two separate convictions for non-violent drug possession offenses, (2) has participated in two separate courses of SACPA treatment, and (3) is found by the court to be unavailable for treatment. 2 Based on a table created by Joseph Ossmann, Parole and Community Services Division, California Department of Corrections.
Page of 168 10

Some offenders who are eligible for SACPA may decide not to participate. Those also eligible for a “deferred entry of judgment” program3 such as PC 1000 may choose that option because they can participate without entering a guilty plea; participation in SACPA is contingent on having been found guilty of a SACPA-eligible offense. Moreover, depending on local policy and practice, offenders may be eligible for both SACPA and drug court, and some offenders may choose the latter. Finally, routine criminal justice processing may seem preferable to offenders who face only a short jail sentence or other disposition that they view as less onerous than the requirements of SACPA participation. For these reasons, it is important to assess the acceptance of SACPA by eligible offenders, i.e., how many chose to participate in SACPA when offered that option? This is the first step in the SACPA pipeline. Offenders who chose SACPA were ordered by the court to complete an assessment and enter treatment. Assessment (described in detail in Chapter 3) entails a systematic review of the severity of the offender’s drug use and other problems, a decision regarding appropriate placement in a drug treatment program, identification of other service needs, and a determination of the appropriate level of community supervision. Upon completion of the assessment, offenders must report promptly to the assigned treatment program. Completion of assessment is the second step in the SACPA pipeline, and treatment entry is the third. Information to describe the pipeline was compiled from three sources: the SACPA Reporting Information System (SRIS) maintained by ADP, the county stakeholder survey conducted by UCLA, and the California Alcohol and Drug Data System (CADDS). The first two of these sources were created specifically for SACPA monitoring and evaluation. The third, CADDS, predates SACPA, having been maintained by ADP since July 1991. Each data source had unique value in this analysis but was also subject to limitations. In particular, possible inaccuracies in SRIS data are not yet fully understood, and, while most counties answered the stakeholder survey, some did not. To overcome such limitations, the analysis employed a mix of data taken directly from these sources and estimates based on assumptions indicated below. Estimates were validated across multiple sources when possible, and the influence of alternative assumptions was tested. An evaluation of SRIS data validity is being conducted by the Applied Research Center at California State University, Bakersfield. Chapter 7 of this report describes the content, procedures, and response rate in the stakeholder survey. Appendix A enumerates the known limitations of data sources and explains how estimates were validated and alternative assumptions tested. Eligible offenders The stakeholder survey asked counties to specify the number of offenders found in court to be eligible for SACPA in its first year. Thirty counties responded to that question, and the total number of eligible offenders in those counties was 33,722. To arrive at a statewide estimate, UCLA assumed that the 30-county proportion of the statewide total is equal to the 30-county proportion of the statewide population of SACPA offenders in treatment.
3 Many first-time California drug offenders can avoid criminal convictions by opting for deferred entry of judgment (DEJ) under Penal Code sections 1000-1000.4. Diversion may include education, treatment, or rehabilitation. Entry of judgment may be deferred for a minimum of 18 months to a maximum of three years. Although there are limitations, diversion, if successfully completed, leads to a dismissal of the charges.
Page of 168 11
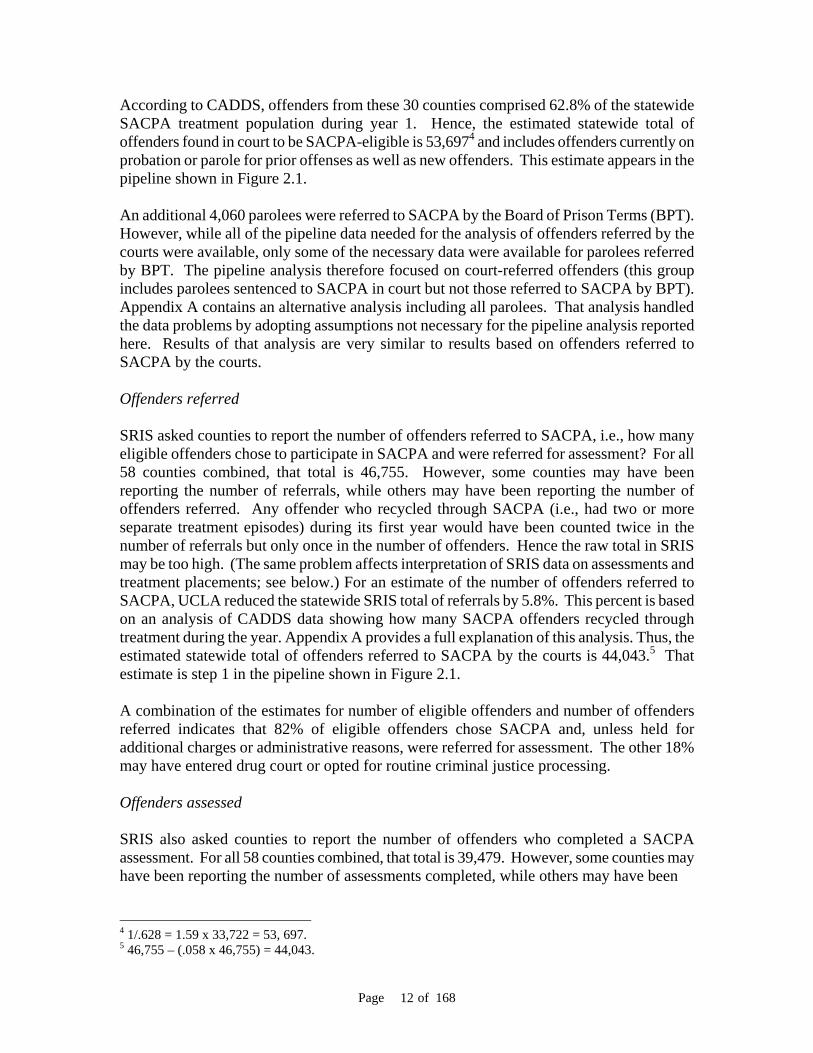
According to CADDS, offenders from these 30 counties comprised 62.8% of the statewide SACPA treatment population during year 1. Hence, the estimated statewide total of offenders found in court to be SACPA-eligible is 53,6974 and includes offenders currently on probation or parole for prior offenses as well as new offenders. This estimate appears in the pipeline shown in Figure 2.1. An additional 4,060 parolees were referred to SACPA by the Board of Prison Terms (BPT). However, while all of the pipeline data needed for the analysis of offenders referred by the courts were available, only some of the necessary data were available for parolees referred by BPT. The pipeline analysis therefore focused on court-referred offenders (this group includes parolees sentenced to SACPA in court but not those referred to SACPA by BPT). Appendix A contains an alternative analysis including all parolees. That analysis handled the data problems by adopting assumptions not necessary for the pipeline analysis reported here. Results of that analysis are very similar to results based on offenders referred to SACPA by the courts. Offenders referred SRIS asked counties to report the number of offenders referred to SACPA, i.e., how many eligible offenders chose to participate in SACPA and were referred for assessment? For all 58 counties combined, that total is 46,755. However, some counties may have been reporting the number of referrals, while others may have been reporting the number of offenders referred. Any offender who recycled through SACPA (i.e., had two or more separate treatment episodes) during its first year would have been counted twice in the number of referrals but only once in the number of offenders. Hence the raw total in SRIS may be too high. (The same problem affects interpretation of SRIS data on assessments and treatment placements; see below.) For an estimate of the number of offenders referred to SACPA, UCLA reduced the statewide SRIS total of referrals by 5.8%. This percent is based on an analysis of CADDS data showing how many SACPA offenders recycled through treatment during the year. Appendix A provides a full explanation of this analysis. Thus, the estimated statewide total of offenders referred to SACPA by the courts is 44,043.5 That estimate is step 1 in the pipeline shown in Figure 2.1. A combination of the estimates for number of eligible offenders and number of offenders referred indicates that 82% of eligible offenders chose SACPA and, unless held for additional charges or administrative reasons, were referred for assessment. The other 18% may have entered drug court or opted for routine criminal justice processing. Offenders assessed SRIS also asked counties to report the number of offenders who completed a SACPA assessment. For all 58 counties combined, that total is 39,479. However, some counties may have been reporting the number of assessments completed, while others may have been 4 1/.628 = 1.59 x 33,722 = 53, 697. 5 46,755 – (.058 x 46,755) = 44,043.
Page of 168 12

Figure 2.1 SACPA Offender Pipeline Processed in Court, July 2001 to June 2002
Eligible Referred Assessed Placed in treatment
in court (Step 1) (Step 2) (Step 3) Yes 30,469 Yes 37,495 Yes 44,043 No 7,026 53,697 No 6,548 No 9,654 Source Stakeholder SRIS SRIS SRIS survey referral assessment placement Percent n/a 82.0% were 85.1% 81.3% entered referred were assessed treatment The overall percent of court referrals reaching treatment was .851 x .813 = 69.2%.
reporting the number of offenders assessed. Any offender who recycled through SACPA during its first year would have been counted twice in the number of assessments. The raw total in SRIS may therefore be too high. On the other hand, offenders who were referred to SACPA very late in the year may actually have been assessed, but not in time to be counted in the yearly assessment totals reported to SRIS. To estimate the number of offenders assessed, UCLA reduced the statewide SRIS total of referrals by 5.8% to account for recycling. This percent is based on an analysis of CADDS data showing how many SACPA offenders recycled through treatment during the year. The adjusted total was then increased by 0.82% to account for lagged assessments late in the year. Appendix A provides a full explanation of this analysis. The estimated statewide total of court-referred offenders who completed a SACPA assessment is 37,495.6 That estimate is step 2 in the pipeline shown in Figure 2.1. The “show” rate at step 2 was 85.1%. Offenders placed in treatment Finally, SRIS asked counties to report the number of SACPA offenders placed in treatment. For all 58 counties combined, that total is 33,804. Some counties may have been reporting the number of offenders placed, but others may have been reporting the number of placements. Any offender who recycled through SACPA during its first year would have 6 39,479 – (.058 x 39,479) = 37,189. 37,189 + (0.0082 x 37,189) = 37,495.
Page of 168 13

been counted twice in the number of placements. In addition, any offender who received treatment at two or more programs during the same SACPA episode may have been counted two or more times in the number of placements. The raw total in SRIS may be too high for these reasons. However, offenders assessed very late in the year may actually have been placed in treatment, but not in time to be counted in the yearly placement totals reported to SRIS. To estimate the number of offenders placed, UCLA reduced the statewide SRIS total of referrals by 5.8% to account for recycling and by 4.8% to account for multiple treatment placements. These percents are based on CADDS data showing how many SACPA offenders recycled through treatment during the year and how many program transfers occurred for SACPA offenders already in treatment. The adjusted total was then increased by 0.82% to account for lagged placements late in the year. Appendix A provides a full explanation of this analysis. The estimated statewide total of court-referred offenders placed in treatment is 30,469.7 That estimate is step 3 in the pipeline shown in Figure 2.1. The “show” rate at step 3 was 81.3%, and the overall “show” rate (i.e., percent of offenders who opted for SACPA in court and went on to enter treatment) was 69.2%. Prior research has shown that one-third to one-half of drug users who schedule a treatment intake appointment actually keep their appointment (Donovan et al., 2001; Marlowe, 2002). In a sample of drug users in Los Angeles, Hser et al. (1998) found that 62% of those who asked for a treatment referral followed up on the referral they were given. Thus, the “show” rate in SACPA’s first year compares favorably with “show” rates seen in other studies of drug users referred to treatment by criminal justice and other sources. “No show” rates State and county stakeholders have expressed interest in the “no show” problem, i.e., offenders who chose SACPA but who did not complete an assessment or enter treatment. For a direct look at that problem, pipeline results can be converted to a “no show” rate at assessment (step 2), a “no show” rate at treatment (step 3), and an overall “no show” rate. Findings reported above were that 85.1% of offenders referred to SACPA went on to complete an assessment. Thus the “no show” rate at assessment was 14.9%. Similarly, 81.3% of assessed offenders went on to enter treatment. Thus the “no show” rate at treatment was 18.7%. Combining these two steps led to the conclusion that 69.2% of offenders referred to SACPA went on to enter treatment. The remaining 30.8% is the estimated overall “no show” rate in SACPA’s first year. Characteristics of treatment clients This section describes characteristics of SACPA offenders who entered treatment during SACPA’s first year. Characteristics covered in the analysis include race/ethnicity, sex, age, primary drug, drug problem severity, and co-occurring mental disorder (COD). In addition, SACPA treatment clients are compared to two other groups of clients in treatment during the same year: clients referred by the criminal justice system but not by SACPA, and clients entering treatment by self-referral or other non-criminal justice referral such as a health care 733,804 – (.058 x 33,804) – (.048 x 33,804) = 30,221. 30,221 + (0.0082 x 30,221) = 30,469.
Page of 168 14

provider, school, or employee assistance program. The purpose of these comparisons was to determine the ways in which SACPA clients are similar to, or different from, other clients receiving treatment. SACPA probation and parole referrals are shown separately so any differences within the SACPA client population will also be apparent. The analysis used CADDS data on race/ethnicity, sex, age, and primary drug. Most but not all SACPA clients received treatment at programs required to report into the CADDS database. Of the estimated 30,469 SACPA treatment clients in figure 2.1, 24,286 appear in CADDS. Hence, characteristics of SACPA clients receiving treatment from CADDS providers are likely to be a close approximation of the characteristics of all SACPA clients in treatment. Information on drug problem severity and COD was available in both CADDS and the California Treatment Outcome Project (CalTOP) database. CalTOP was part of a multi-site project sponsored in 1998 by the U.S. Center for Substance Abuse Treatment. CalTOP’s main goal was to create and test a system for monitoring statewide treatment outcomes. The system includes standardized assessments of client needs, services received, outcomes, and cost-offsets. At 44 treatment programs in 13 California counties, data on clients’ substance use and related problems were collected at treatment intake, treatment discharge, a three-month follow-up, and a nine-month follow-up. In addition, one-year outcomes were assessed via links to statewide criminal justice and social service databases. The Department of Alcohol and Drug Programs led implementation of CalTOP with assistance from UCLA. CalTOP’s information on psychiatric problem severity is a broad indicator including, for example, depression, anxiety, other emotional distress, and serious mental illness. CalTOP does not provide statewide data but can be used to compare SACPA clients to other groups of clients seen by treatment providers participating in CalTOP. Figure 2.2 shows the breakdown of clients entering treatment by referral source. SACPA probation accounted for 13.6% of clients entering treatment, and SACPA parole accounted for an additional 1.2%. In other words, about 8.1% of SACPA treatment clients on record in CADDS were parolees entering SACPA on the basis of a new offense or a drug-related parole violation. About one-fourth of the CADDS client population (26.8%) were referred by criminal justice (e.g., judge, prosecutor, or probation officer) but were not participating in SACPA, and the remaining 58.1% were non-criminal justice referrals, i.e., they entered treatment on their own initiative or by referral from a health care provider, school, employee assistance program, or other non-criminal justice source. Race/ethnicity The race/ethnic composition of SACPA treatment clients is presented in Figure 2.3. About half were non-Hispanic Whites (48.4%). Hispanics (30.7%), African Americans (14.4%), Asian/Pacific Islanders (2.5%), Native Americans (1.7%), and other groups (2%) comprised the other half of the SACPA client population. Figure 2.4 presents race/ethnicity for SACPA probationers and parolees separately and for the other two client groups. The race/ethnic composition of all four groups was very similar.
Page of 168 15

Sex SACPA treatment clients were 72.1% men and 27.9% women (see Figure 2.5). Figure 2.6 shows the sex breakdown for SACPA probationers and parolees and the other client groups. The majority of treatment clients in all groups were men, but this pattern is more pronounced among clients referred to treatment by SACPA or other criminal justice entities. The pattern is, moreover, most pronounced among offenders referred to SACPA by parole. These results are partly a reflection of the enduring difference between men and women in the seriousness of their criminal involvement (Blumstein et al., 1986; Gottfredson and Hirschi, 1990). Age The average (mean) age among SACPA treatment clients was 35. The average age among SACPA probation referrals was 34 and among SACPA parole referrals was 36. Clients referred from criminal justice entities other than SACPA were 29 years old on average; non-criminal justice clients, 35. These averages represent typical clients but do not fully represent the data available on age. The distribution of client age is shown in Figures 2.7 and 2.8. Most SACPA clients (65.2%) were between 26 and 45 years old. SACPA clients referred from parole were older than SACPA clients referred from probation. While the youngest age bracket is equally represented among SACPA clients and non-criminal justice clients, the latter group includes more clients in the oldest age bracket. Because crime is less prevalent in older age-cohorts (Gottfredson and Hirschi, 1990; Hirschi and Gottfredson, 1983), it is to be expected that non-criminal justice referrals would comprise a greater percent of older clients. Primary drug According to client self-report, methamphetamine was the most common drug type among SACPA clients (50.2%) followed by cocaine/crack (14.5%), marijuana (11.7%), heroin (11%), and alcohol (10.6%) (see Figure 2.9). Primary drug by referral source is presented in Figure 2.10. Methamphetamine was a more common problem in SACPA clients than in the other two client groups. Moreover, within the SACPA treatment population, heroin use was more common among parolees than among probation referrals. Heroin use was more prevalent among non-criminal justice clients than among criminal justice clients, possibly because heroin users may, on their own initiative (self-referral), seek methadone treatment to avoid the daily symptoms of heroin dependence. Reporting requirements may also help to explain the higher prevalence of heroin use on the non-criminal justice side. Private as well as publicly funded providers are required to report methadone treatment admissions to CADDS, whereas only publicly funded providers are required to report admissions to other types of treatment. Figure 2.10 also shows that alcohol was the primary problem for 10.6% of the SACPA group even though SACPA targets offenders with drug problems. Heavy drinking is quite common among people also engaged in illegal drug use. Figure 2.11 shows the secondary drug problem recorded in CADDS for SACPA clients whose primary problem was alcohol. The
Page of 168 16

Figure 2.2Treatment Clients by Referral Source
(CADDS), 7/1/01 - 6/30/02(N = 162,435)
1.2
26.8
58.1
13.6
0
10
20
30
40
50
60
SACPA probation SACPA paroleCriminal justice non-SACPA Non-criminal justice
Perc
ent o
f tre
atm
ent c
lient
s
Page of 168 17

Figure 2.3Race/Ethnicity of SACPA Treatment Clients
(CADDS), 7/1/01 - 6/30/02 (N = 24,286)
30.7
14.4
2.5 2.0 1.7
48.4
0
10
20
30
40
50
White
Hispanic
Africa
n Ameri
can
Asian/P
acific
Island
er
Other
Native A
merica
nPe
rcen
t of S
AC
PA tr
eatm
ent c
lient
s
Page of 168 18

Figure 2.4 Race/Ethnicity of Treatment Clients by Referral Source
(CADDS), 7/1/01 - 6/30/02 (N = 162,435)
48.151.6
42.9
48.0
31.027.3
33.6
28.5
14.4 15.3 16.0 17.2
2.5 2.1 3.51.91.4 2.1 2.51.7 2.1 1.6 1.72.1
0
10
20
30
40
50
60
SACPA probation SACPA parole Criminal justicenon-SACPA
Non-criminal justice
White Hispanic African American Asian Other Native American
Perc
ent o
f tre
atm
ent c
lient
s
Page of 168 19

Figure 2.5 Sex of SACPA Treatment Clients
(CADDS), 7/1/01 - 6/30/02 (N = 24,286)
72.1
27.9
0
10
20
30
40
50
60
70
80
Men Women
Perc
ent o
f SA
CP A
trea
t men
t clie
nts
Page of 168 20
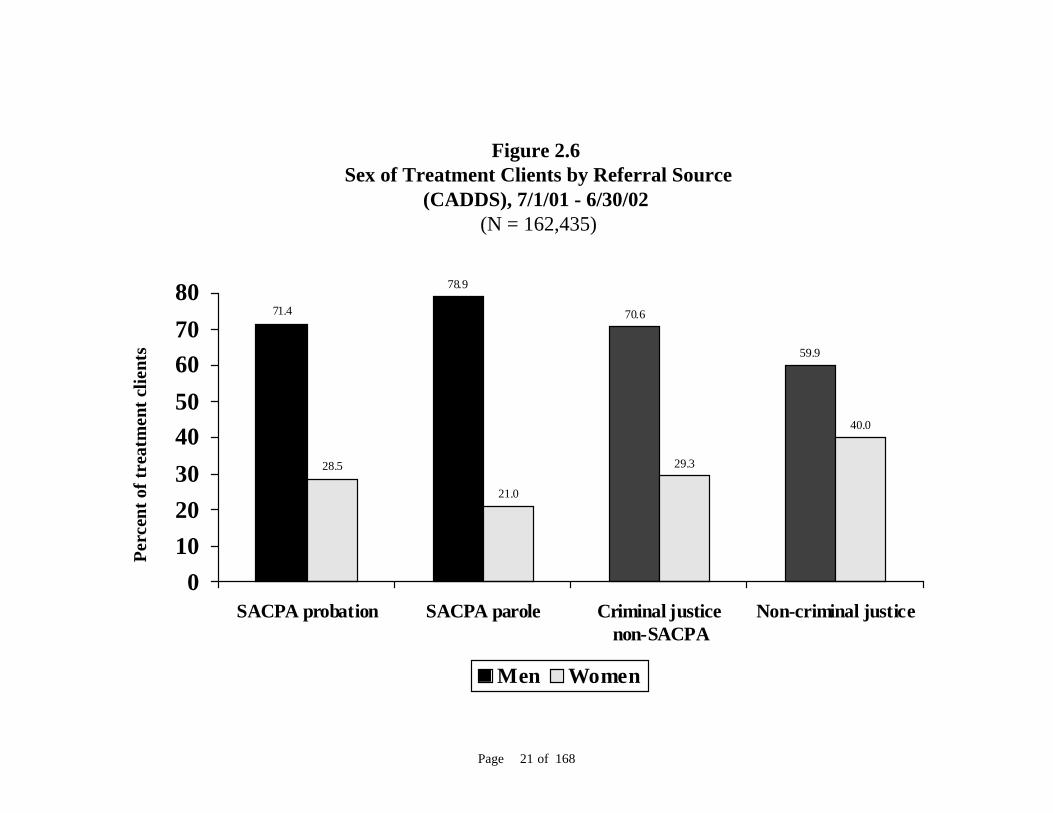
Figure 2.6 Sex of Treatment Clients by Referral Source
(CADDS), 7/1/01 - 6/30/02 (N = 162,435)
71.4
78.9
70.6
59.9
28.5
21.0
29.3
40.0
01020304050607080
SACPA probation SACPA parole Criminal justicenon-SACPA
Non-criminal justice
Men Women
Perc
ent o
f tre
atm
ent c
lient
s
Page of 168 21

Figure 2.7 Age of SACPA Treatment Clients
(CADDS), 7/1/01 - 6/30/02 (N = 24,286)
22.0
30.2
35.0
12.6
0
10
20
30
40
18-25 26-35 36-45 46+
Perc
ent o
f SA
CPA
trea
tmen
t clie
nts
Page of 168 22

Figure 2.8 Age of Treatment Clients by Referral Source
(CADDS), 7/1/01 - 6/30/02 (N = 162,435)
22.8
13.4
42.2
22.4
30.032.9
24.225.5
34.5
40.5
23.7
32.0
12.5 13.09.6
19.8
0
10
20
30
40
50
SACPA probation SACPA parole Criminal justicenon-SACPA
Non-criminal justice
18-25 26-35 36-45 46+
Perc
ent o
f tre
atm
ent c
lient
s
Page of 168 23

distribution of secondary drug mirrors the distribution for primary drug. Methamphetamine was the most common secondary drug problem. Cocaine and marijuana were also prevalent. No secondary drug problem was shown for 18.5% of SACPA clients whose primary problem was alcohol. Those clients may have reported a secondary drug problem that was not entered into CADDS, or they may have failed to report a secondary drug problem despite having one. In any case, they comprise only 2% of the SACPA client population. Patterns observed here would not change significantly if data on problem drug were more detailed. Finally, although non-SACPA clients were more likely than SACPA clients to report alcohol as their primary problem, the patterns for primary problem drug (summarized in the preceding paragraph) were not significantly affected when clients reporting alcohol as their primary problem were excluded from the analysis. Drug problem severity UCLA analyzed several indicators of drug problem severity. Indicators in CADDS include years of drug use, frequency of recent drug use, and prior treatment experience. The CalTOP database includes a more direct indicator, the client’s drug problem severity score at intake. This indicator is from the Addiction Severity Index (ASI), a client assessment tool widely used by drug treatment programs (McLellan, Luborsky, Woody, & O'Brien, 1980). Figure 2.12 shows a split distribution of drug use histories among SACPA treatment clients. About one-fifth were reportedly involved in drug use for no more than five years, whereas another one-fifth reported drug use histories extending longer than 20 years. Figure 2.13 shows years of drug use by referral source. Non-SACPA criminal justice referrals reported shorter drug use histories. About one-third reported drug involvement for no more than five years. Although SACPA clients were somewhat older (see Figure 2.8), the age difference does not entirely account for the shorter drug use histories of non-SACPA criminal justice referrals. In the youngest age group (18-25 years old), the average drug use history was 4.8 years among non-SACPA criminal justice referrals and 5.7 years among SACPA referrals (data not shown). Moreover, Figure 2.13 elucidates the split distribution seen among SACPA clients in Figure 2.12. Almost half of those referred from probation reported drug involvement for no more than ten years. Only about one-fifth of parole referrals reported drug use histories in that range, but almost one-third had been using drugs for over 20 years. Frequency of drug use by SACPA clients in the month prior to treatment admission is presented in Figure 2.14. About one-third of SACPA clients reported no drug use in the past month, possibly because they were coming to treatment directly from lock-up. Both SACPA and non-SACPA criminal justice referrals were less likely to report daily use than non-criminal justice referrals, possibly, again, because some criminal justice referrals may have been incarcerated just before entering treatment. (Alcohol was the primary problem for a greater proportion of non-criminal justice referrals, but this does not account for the difference in daily use rates; data not shown). Drug use on a daily basis was reported by 27% of SACPA clients. Figure 2.15 shows an equal prevalence of daily drug use among non-SACPA criminal justice clients. It also shows that daily use was more prevalent among SACPA parole referrals than among SACPA probation referrals.
Page of 168 24

50.2
14.5
11.7 11.0 10.6
1.7
0
10
20
30
40
50
60
Meth
amphe
tamine
Cocain
e/cra
ck
Mar
ijuan
a
Heroin
Alcohol
Other
Figure 2.9 Primary Drug Among SACPA Treatment Clients
(CADDS), 7/1/01 - 6/30/02 (N = 24,286)
Perc
ent o
f SA
CPA
trea
tmen
t clie
nts
Page of 168 25
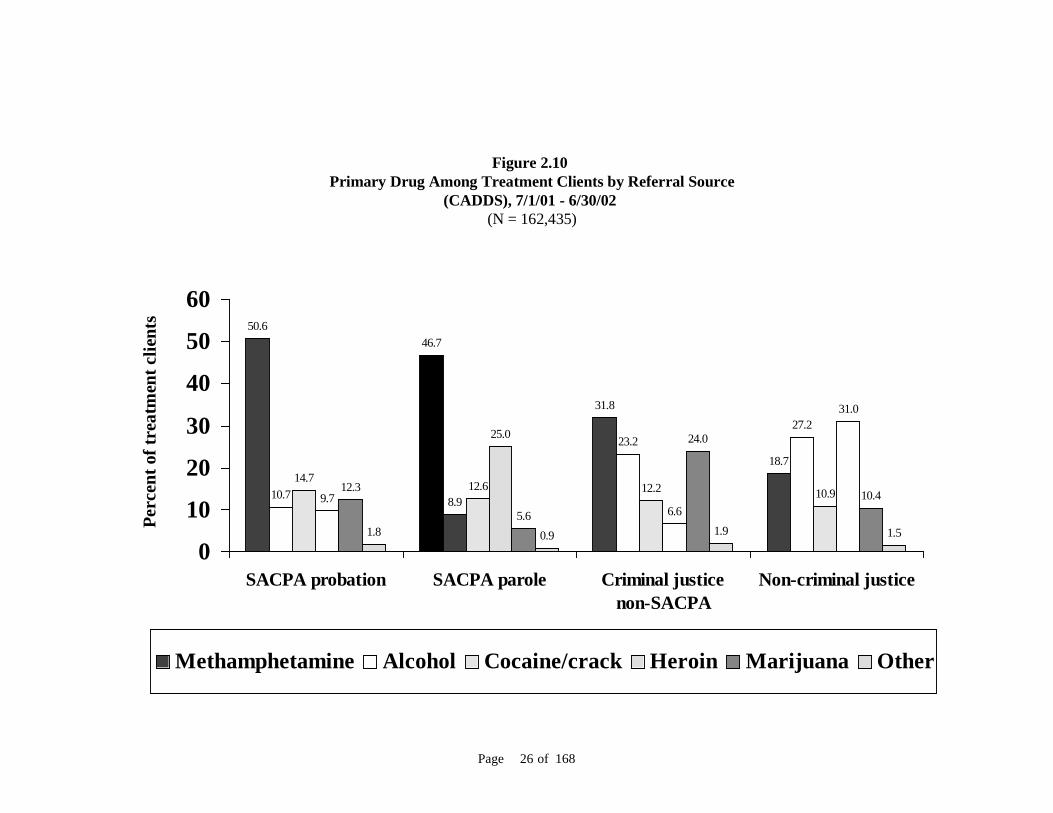
Figure 2.10 Primary Drug Among Treatment Clients by Referral Source
(CADDS), 7/1/01 - 6/30/02 (N = 162,435)
50.646.7
31.8
18.7
10.7 8.9
23.227.2
14.712.6 12.2 10.99.7
25.0
6.6
31.0
12.3
5.6
24.0
10.4
1.8 0.9 1.9 1.5
0
10
20
30
40
50
60
SACPA probation SACPA parole Criminal justicenon-SACPA
Non-criminal justice
Methamphetamine Alcohol Cocaine/crack Heroin Marijuana Other
Perc
ent o
f tre
atm
ent c
lient
s
Page of 168 26

32.4
23.0
19.518.5
3.92.3
0
10
20
30
40
Meth
amphe
tamine
Mar
ijuana
Cocaine/c
rack
None
Heroin
Other
Figure 2.11 Secondary Drug when Alcohol is Primary Drug Among SACPA Treatment Clients (CADDS),
7/1/01 - 6/30/02(N = 2,579)
Perc
ent o
f SA
CPA
trea
tmen
t clie
nts
Page of 168 27

Figure 2.12 Years of Drug Use Among SACPA Treatment Clients
(CADDS), 7/1/01 - 6/30/02 (N = 24,286)
20.721.5
17.716.1
23.7
0
10
20
30
0 - 5 6 - 10 11 - 15 16 - 20 21+
Perc
ent o
f SA
CPA
trea
tmen
t clie
nts
Page of 168 28

Figure 2.13 Years of Drug Use Among Treatment Clients by Referral Source
(CADDS), 7/1/01 - 6/30/02 (N = 162,435)
21.6
0.5
34.4
21.721.8
18.6 19.6
14.917.6
19.0
13.8 13.215.7
20.7
12.414.1
23.0
30.1
19.6
35.7
0
10
20
30
40
SACPA probation SACPA parole Criminal justicenon-SACPA
Non-criminal justice
0 - 5 6 - 10 11 - 15 16 - 20 21+
Perc
ent o
f tr e
a tm
e nt c
lien t
s
Page of 168 29

The number of prior treatment episodes among SACPA clients is shown in Figure 2.16. More than half of SACPA clients (55.2%) reported no prior treatment. Figure 2.17 compares all groups. Non-criminal justice referrals appear to have had somewhat more experience in treatment. Among criminal justice referrals, regardless of source, fewer clients had prior experience in treatment. Drug problem severity scores among CalTOP clients provide an additional and more direct comparison of drug use severity among the four groups (see Figure 2.18). Severity scores can range from zero (little or no problem) to one (very severe problem). Treatment clients in publicly funded outpatient treatment average about .10 on the ASI drug composite score (McLellan et. al., 1992). SACPA clients (most of whom were placed in outpatient treatment; see below) scored slightly higher than that. For a closer look at drug severity, scores were split at the median. Drug problem severity was similar across client groups referred by criminal justice and highest among non-criminal justice referrals (Figure 2.19). Co-occurring disorder UCLA used CADDS and CalTOP data to compare co-occurring mental disorder (COD) among SACPA clients and other clients. These datasets cover different aspects of COD, and their metrics are not directly comparable. Accordingly this analysis focused on each separate COD indicator across client groups. About 7% of SACPA clients had chronic mental illness (diagnosed at any point in the client’s lifetime) recorded in CADDS, and 4% of SACPA clients had a current mental disability (reflecting mental illness or other impairment such as learning disability) recorded in CADDS. These data are shown in Figure 2.20 on a quarterly basis because, for reasons discussed below, it was important to see whether any trend toward higher or lower COD prevalence was apparent across the year. Figure 2.21 shows CADDS indicators of chronic mental illness and mental disability by group. More non-criminal justice clients had chronic mental illness and/or mental disability than the other groups. Among SACPA clients, parolees were somewhat more likely than probationers to have an indication of chronic mental illness but were slightly less likely to have an indication of mental disability. CalTOP data on clients’ current level of psychiatric severity are shown in Figure 2.22. Clients in publicly funded outpatient treatment average about .12 on the ASI psychiatric composite score, and both SACPA and non-SACPA criminal justice clients scored very near that level. For a closer look at this COD indicator, scores were split at the median (see Figure 2.23). Non-criminal justice clients were more likely than other clients to have a score above the median, and SACPA clients from probation were more likely than SACPA parolees to have a score above the median. The greater prevalence of COD among probation referrals is more apparent here than in the comparison of mean scores in Figure 2.22. It may be important to reiterate that the psychiatric severity measure picks up a wide range of current disorders including depression, anxiety, and other emotional distress, as well as ongoing symptoms of chronic mental illness. It is therefore not instructive to compare scores on this measure to the COD indicators in CADDS.
Page of 168 30
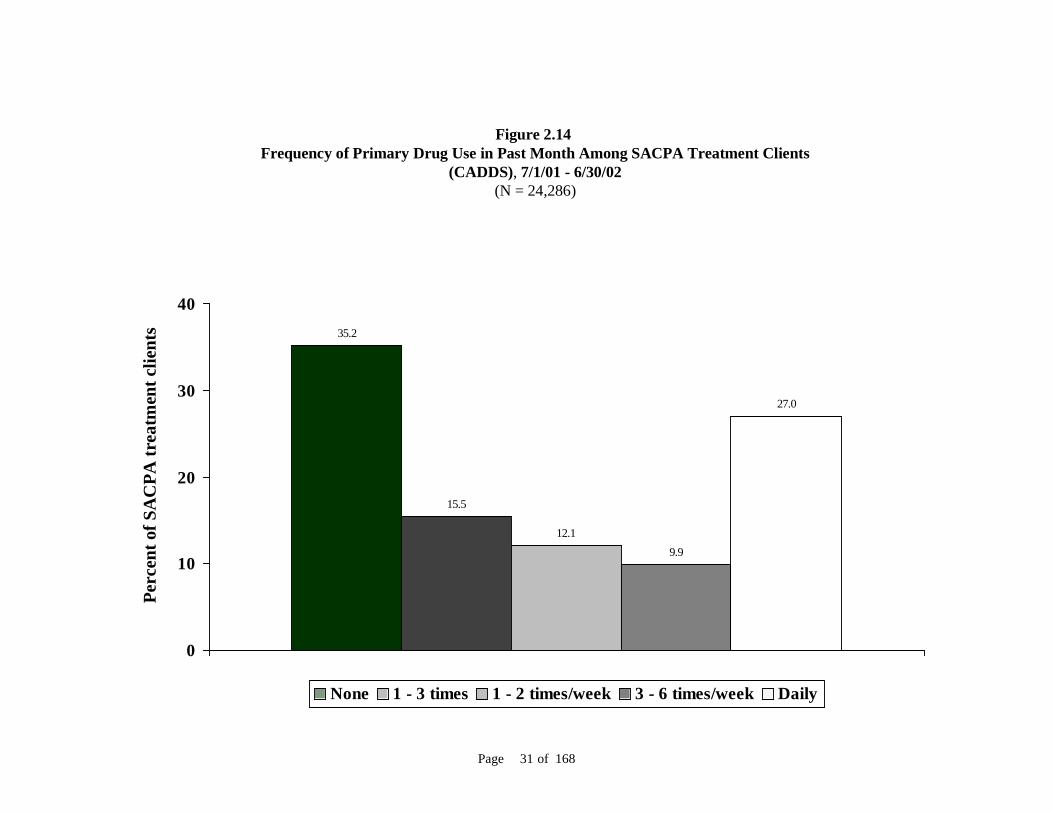
Figure 2.14 Frequency of Primary Drug Use in Past Month Among SACPA Treatment Clients
(CADDS), 7/1/01 - 6/30/02 (N = 24,286)
35.2
15.5
12.19.9
27.0
0
10
20
30
40
None 1 - 3 times 1 - 2 times/week 3 - 6 times/week Daily
Perc
ent o
f SA
CPA
trea
tmen
t clie
nts
Page of 168 31

Figure 2.15 Frequency of Primary Drug Use in Past Month Among Treatment Clients
by Referral Source (CADDS), 7/1/01 - 6/30/02 (N = 162,435)
35.136.7
39.7
16.515.9
12.014.4
8.612.4
8.410.5
7.210.1
8.2 8.6 10.0
26.3
34.5
26.6
57.4
0
10
20
30
40
50
60
SACPA probation SACPA parole Criminal justicenon-SACPA
Non-criminal justice
None 1 - 3 times 1 - 2 times/week 3 - 6 times/week Daily
Perc
ent o
f tre
atm
ent c
lient
s
Page of 168 32

Figure 2.16Number of Prior Treatment Episodes Among SACPA Treatment Clients
(CADDS), 7/1/01 - 6/30/02 (N = 24,286)
55.2
26.5
9.9
3.91.7 0.9 0.4 0.2 0.1 0.7
0
10
20
30
40
50
60
0 1 2 3 4 5 6 7 8 9+
Perc
ent o
f SA
CPA
trea
tmen
t clie
nts
Page of 168 33

Figure 2.17Number of Prior Treatment Episodes Among Treatment Clients by Referral Source
(CADDS), 7/1/01 - 6/30/02 (N = 162,435)
55.7
49.8
62.9
45.7
1.6 2.9 1.3
3.6
0.8 1.4 0.8
2.7
0.4 0.9 0.4 1.70.2 0.4 0.1 10.1 0.3 0.1 0.8
25.026
.7
21.822
.3
13.3
9.57.8 10.4
3.23.84.6 6.3
0.7 0.9 0.6 0.5
0
10
20
30
40
50
60
70
SACPA probation SACPA parole Criminal justicenon-SACPA
Non-criminal justice
0 1 2 3 4 5 6 7 8 9+
Perc
ent o
f tre
atm
ent c
lient
s
Page of 168 34
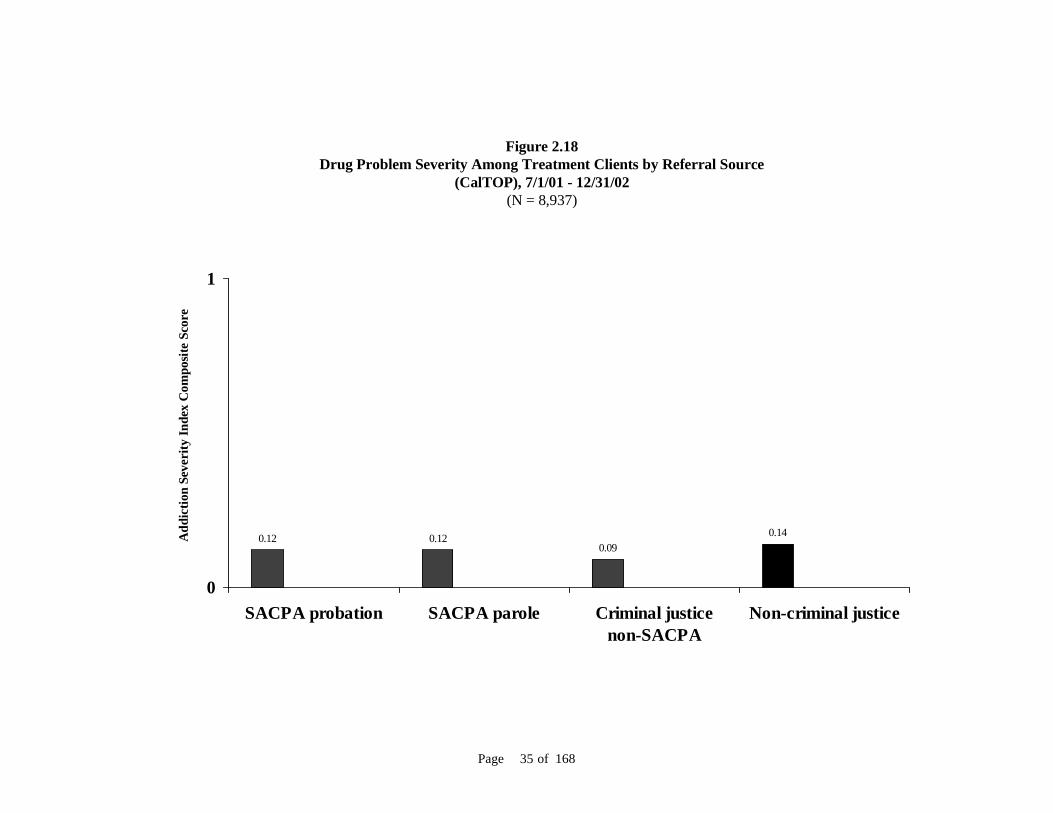
Figure 2.18Drug Problem Severity Among Treatment Clients by Referral Source
(CalTOP), 7/1/01 - 12/31/02(N = 8,937)
0.12 0.120.09
0.14
0
1
SACPA probation SACPA parole Criminal justicenon-SACPA
Non-criminal justice
Add
ictio
n Se
veri
ty In
dex
Com
posi
te S
core
Page of 168 35

Figure 2.19Percent of Clients with Severe Drug Problem* Among Treatment Clients by Referral Source
(CalTOP), 7/1/01 - 12/31/02(N = 8,937)
50.9 51.1
41.5
55.5
0
10
20
30
40
50
60
SACPA probation SACPA parole Criminal justicenon-SACPA
Non-criminal justice
Perc
ent o
f tre
atm
ent c
lient
s
* Addiction Severity Index drug composite score above the median.
Page of 168 36

Figure 2.20Co-occurring Disorder Among SACPA Treatment Clients by Quarter
(CADDS), 7/1/01 - 6/30/02 (N = 24,286)
7.3
8.2
6.3
7.4
3.6
3.9
3.2
3.8
0 5 10
Quarter 4: 04/01/02 - 06/30/02
Quarter 3: 01/01/02 - 03/31/02
Quarter 2: 10/01/01 - 12/31/01
Quarter 1: 07/01/01 - 09/30/01
Mental disabilityChronic mental illness
Percent of SACPA treatment clients
Page of 168 37

Figure 2.21Co-occurring Disorder Among Treatment Clients by Referral Source
(CADDS), 7/1/01 - 6/30/02 (N = 162,435)
3.73.2 3.4
6.27.1
9.8
6.3
12.1
0
5
10
15
SACPA probation SACPA parole Criminal justicenon-SACPA
Non-criminal justice
Mental disability Chronic mental illness
Perc
ent o
f tre
atm
ent c
lient
s
Page of 168 38

Overall, these findings indicate that neither drug problem severity nor co-occurring mental disorder was more prevalent among SACPA clients than among non-SACPA clients. County representatives reported that the offender population in SACPA’s first year included a greater number of “high need” offenders, defined largely in terms of drug problem severity and COD, than they had expected (see Chapter 5). The county reports are not necessarily at odds with the findings here. First, the latter were based only on SACPA offenders who entered treatment. No comparable information was available for SACPA offenders referred or assessed but not entering treatment. Mental problems may well be more severe among offenders who do not make it to treatment (Hser et. al., 1998; Kessler et. al., 1996). Second, anticipated levels of drug problem severity and mental disorder were, for at least some county representatives, based on the expectation that the SACPA population might be composed largely of younger or first-time drug possession offenders, whose service needs might accordingly be less critical than is characteristic among treatment clients overall. That expectation has not been confirmed, as reported by counties (see Chapter 5) and as indicated in the data on SACPA clients’ age and drug use history. While drug and mental health problems do not appear to be more prevalent among SACPA clients than among others, most indicators show those problems to be no less prevalent either. Third, COD indicators in CADDS were examined on a quarterly basis (see Figure 2.20) to see whether prevalence was higher in the early part of the year before settling down to a lower level. Such a trend might have suggested that reports from county representatives were influenced in part by initial patterns not sustained throughout the year. No such trend was apparent, however. In summary, SACPA treatment clients were similar to other treatment clients in California and the United States on most indicators of drug problem severity and co-occurring mental disorder, although mental illness may be less common among SACPA clients than other clients. SACPA parole referrals were higher than SACPA probation referrals on some indicators of drug problem severity. There were no consistent differences between parolees and probationers on indicators of co-occurring mental disorder. SACPA clients, especially parolees, were disproportionately male and older, compared to non-criminal justice clients. The most common drug problem among SACPA clients was methamphetamine. Treatment duration UCLA computed the percent of SACPA offenders in treatment for at least 30 days, 60 days, and 90 days. The 90-day period is of particular interest because prior studies suggest that 90 days may be a minimum threshold for effective treatment (Hubbard et al., 1997; Simpson et al., 1997, 1999, 2002). To compare SACPA clients to others, UCLA also computed treatment duration for non-SACPA criminal justice clients and non-criminal justice clients. CADDS data were used to examine treatment duration among SACPA clients who entered outpatient drug-free and long-term residential treatment and who did not transfer to another treatment during SACPA’s first year. The rationale for this analysis is as follows. First, short-term residential treatment and methadone detoxification are not intended to last as long as 90 days, and it is difficult to specify a minimum effective duration for methadone maintenance.
Page of 168 39

Figure 2.22Psychiatric Problem Severity Among Treatment Clients by Referral Source
(CalTOP), 7/1/01 - 12/31/02(N = 8,937)
0.130.09
0.14
0.26
0
1
SACPA probation SACPA parole Criminal justicenon-SACPA
Non-criminal justice
Add
ictio
n Se
veri
ty In
dex
Com
posi
te S
core
Page of 168 40

Figure 2.23Clients with High Mental Illness Scores* Among Treatment Clients by Referral Source
(CalTOP), 7/1/01 - 12/31/02(N = 8,937)
39.9
26.4
40.9
59.5
0
10
20
30
40
50
60
SACPA probation SACPA parole Criminal justicenon-SACPA
Non-criminal justice
Perc
ent o
f tr e
a tm
e nt c
li en t
s
* Addiction Severity Index psychiatric composite score above the median. Page of 168 41

Second, over 90% of SACPA treatment clients were placed in outpatient drug-free and long-term residential treatment. Thus, excluding other modalities from the analysis cannot affect overall conclusions. Third, treatment plans for many clients may have called for an initial placement in one treatment and transfer to another treatment within the first 90 days. An analysis including such clients would have underestimated the overall rate of 90-day retention, and it would be very difficult to distinguish planned transfers from unplanned transfers and interruptions in treatment. Clients whose records show a possible transfer or interruption comprise 9.4% of the CADDS population in outpatient drug-free and long-term residential treatment. Finally, while it will also be important to examine treatment completion among SACPA clients, an analysis of treatment completion at this time would have to be restricted to those entering treatment very early in SACPA’s first year. SACPA allows up to 12 months of treatment, not necessarily consecutive. Roughly 18 months after SACPA began, most clients who entered SACPA treatment during the first two or three months would presumably have completed treatment or failed to do so. An analysis of records on those clients would produce a reliable estimate of treatment completion in SACPA’s early months, but that estimate might be a very inaccurate indicator of treatment completion during the entire first year. An analysis of treatment duration through the first 90 days, on the other hand, can be based on most treatment clients in SACPA’s first year. Almost all (84.7%) of the SACPA clients who entered outpatient drug-free programs were there for at least 30 days. Among long-term residential clients, 76.1% received at least 30 days of treatment. 60-day rates were 73.3% in outpatient drug-free and 57.9% in long-term residential programs. Most outpatient drug-free clients (65.1%) received at least 90 days of treatment, as did 42.8% of long-term residential clients (see Figure 2.24). Shorter duration for residential treatment may reflect the difficulty of maintaining commitment to a treatment regimen that requires a long absence from home and suspension of one’s normal activities. Although SACPA parolees have a lower 90-day rate in outpatient treatment than SACPA probation referrals, treatment duration for SACPA clients overall was similar to treatment duration for other clients in both modalities (Figure 2.25). These findings show how much treatment was delivered to SACPA clients within an initial 90-day window, and they show that treatment duration was much the same for SACPA and non-SACPA clients. They also show that about one-third of outpatient SACPA clients and over one-half of residential SACPA clients were not in treatment for a period as long as 90 days—a possible minimum threshold for treatment effectiveness. No information was available on the planned duration of treatment for SACPA clients. Hence these findings do not indicate the extent to which clients complied with SACPA treatment requirements. That topic will be taken up in later reports, as the necessary data become available. SACPA client characteristics and treatment duration The final step in this analysis of treatment duration was to determine whether 30-day, 60-day, and 90-day rates varied in relation to race/ethnicity, sex, age, primary drug, or co-occurring mental disorder among SACPA clients.
Page of 168 42

Figure 2.24Treatment Duration for SACPA Clients by Modality
(CADDS), 7/1/01 - 6/30/02 (N = 20,519)
84.7
73.3
65.1
76.1
57.9
42.8
0
10
20
30
40
50
60
70
80
90
30 days 60 days 90 days
Outpatient Long-term residential
Perc
ent o
f SA
CP A
clie
nts
Page of 168 43

Figure 2.25Treatment Duration for All Clients by Modality and Referral Source
(CADDS), 7/1/01 - 6/30/02 (N = 106,882)
85.5
74.3
66.3
75.9
60.6
49.7
84.2
71.1
60.6
77.8
62.7
52.2
75.8
37.2
48.7
65.8
46.5
62.6
76.7
42.5
61.8
42.9
57.1
76.1
0
10
20
30
40
50
60
70
80
90
30 days 60 days 90 days 30 days 60 days 90 days 30 days 60 days 90 days 30 days 60 days 90 days
Outpatient Long-term residential
SACPA probation SACPA parole Criminal justicenon-SACPA
Non-criminal justice
Perc
e nt o
f c l
ient
s
Page of 168 44

Figure 2.26 shows that treatment duration was quite similar for all race/ethnic groups in the SACPA population. The 90-day rates ranged from 59.2% to 64.8%. Similarly, the sex breakdown showed almost equal treatment duration for men and women. At 90 days, just under two-thirds of each group were still in treatment. See Figure 2.27. Figure 2.28 shows sizable age differences. About 59% of the youngest age bracket (18-25) were in treatment for at least 90 days. Duration rates were successively higher for older clients. At 90 days, 68.6% of clients at least 46 years old were still in treatment. Treatment duration was quite similar by primary drug. Heroin users (56.2%) were slightly less likely than others to be in treatment at 30 days and 60 days as well as 90 days. The highest 90-day rate was 65.3% for both cocaine users and marijuana users. See Figure 2.29. Finally, Figure 2.30 shows treatment duration for two indicators of co-occurring mental disorder (COD). Clients with COD were less likely to be in treatment at 30 days, 60 days, and 90 days, but the difference at each step and for each COD indicator was quite small.
Page of 168 45
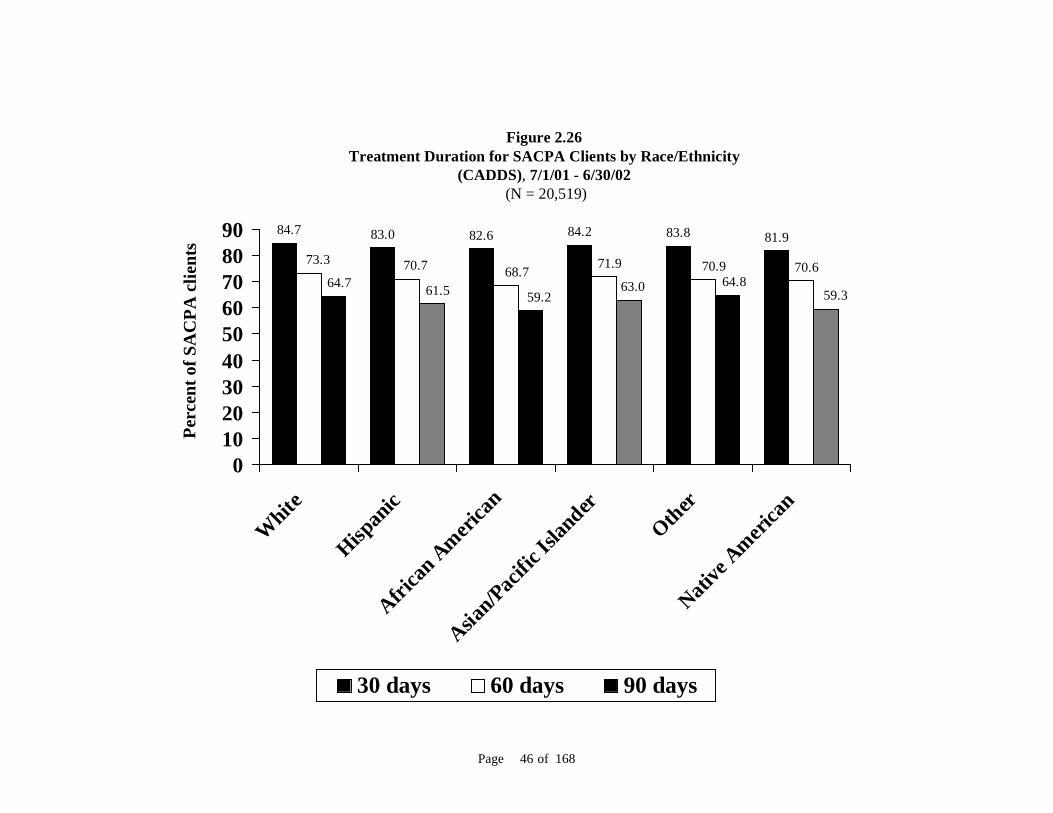
Figure 2.26Treatment Duration for SACPA Clients by Race/Ethnicity
(CADDS), 7/1/01 - 6/30/02 (N = 20,519)
83.0 82.6 84.2 83.8 81.984.7
73.3 70.7 68.7 71.9 70.9 70.663.0 59.3
64.859.261.564.7
0102030405060708090
White
Hispan
icAfri
can A
merica
n
Asian/Pac
ific Is
lander
OtherNati
ve A
merica
n
30 days 60 days 90 days
Perc
ent o
f SA
CPA
clie
n ts
Page of 168 46

Figure 2.27 Treatment Duration for SACPA Clients by Sex
(CADDS), 7/1/01 - 6/30/02 (N = 20,519)
84.0 83.3
71.9 71.0
62.9 62.3
01020304050607080
Men Women
30 days 60 days 90 days
Perc
ent o
f SA
CPA
cl ie
n ts
Page of 168 47

Page of 168 48
Figure 2.28 Treatment Duration for SACPA Clients by Age
(CADDS), 7/1/01 - 6/30/02 (N = 20,519)
87.484.9
82.981.5
68.7
77.172.9
70.3 68.664.3
59.2 61.3
0
10
20
30
40
50
60
70
80
90
18-25 26-35 36-45 46+
30 days 60 days 90 days
Perc
ent o
f SA
CP A
clie
nts

83.9 85.5 84.6
77.9
84.586.3
71.4 73.2 73.8
66.2
72.574.8
62.365.3 65.3
56.2
63.3 64.5
0
10
20
30
40
50
60
70
80
90
Meth
ampheta
mineCoc
aine/c
rack
Mar
ijuan
a
Heroin
Alcohol
Other
30 days 60 days 90 days
Figure 2.29 Treatment Duration for SACPA Clients by Primary Drug
(CADDS), 7/1/01 - 6/30/02 (N = 20,519)
P erc
ent o
f SA
CPA
clie
nts
Page of 168 49

Figure 2.30 Treatment Duration for SACPA Clients by Mental Health Status
(CADDS), 7/1/01 - 6/30/02 (N = 20,519)
85.3 84.0
74.771.8
66.562.9
81.778.8
68.965.7
62.558.3
0102030405060708090
30 daysChronic mental
illness
30 daysMental disability
60 daysChronic mental
illness
60 daysMental disability
90 daysChronic mental
illness
90 daysMental disability
Yes No
Perc
ent o
f SA
CP A
clie
nts
Page of 168 50

Chapter 3: Assessment and Supervision Procedures
The Addiction Severity Index was used to assess problem severity by almost all of thecounties (93%). Most counties (83%) conducted assessment after sentencing and prior to treatmententry. More than half of counties (66%) reported using the American Society of AddictionMedicine Patient Placement Criteria to guide treatment placement. In many counties, probation and treatment professionals engage in a joint assessment ofoffender risk. Jurisdiction over the disposition of violations by SACPA parolees passed from theBoard of Prison Terms to the Parole and Community Services Division of theDepartment of Corrections.
Before receiving their annual SACPA funding allocation from the state, each county must submit implementation plans to the California Department of Alcohol and Drug Programs for review and approval. UCLA conducted an analysis of second-year plans submitted by all 58 counties. Appendix B contains complete findings from that analysis, covering tools used to assess severity of offender’s drug problem and other service needs, procedures for placing clients in treatment, SACPA implementation procedures, planned treatment duration and intensity, and other services offered. A summary of the key findings is provided here. Assessment of problem severity The Addiction Severity Index (ASI) was used by almost all of the counties (93%). The ASI is a semi-structured interview that assesses problem severity, over the past 30 days and during the person’s lifetime, in seven domains: drug use, alcohol use, employment, family and social relationships, legal status, psychiatric status, and medical status. This instrument allows for calculation of clinical scores, composite scores, and problem severity in each of the seven domains. Clinical scores are standardized to permit comparisons of problem severity across all domains at a single point in time. Composite scores collected at more than one point in time are designed to measure change in each domain. Composite scores are not comparable across domains. Severity ratings are the intake worker’s subjective ratings of the client’s need for treatment. The ASI has been used extensively for treatment planning and outcome evaluation (McLellan, et. al., 1980; McLellan et. al., 1992). Many counties (45%) used additional tools for client assessment. These included, for example, the Substance Abuse Subtle Screening Inventory (SASSI) and the Beck Depression Inventory.
Page of 168 51

Most counties (83%) conducted assessment after sentencing and prior to treatment entry. About 78% of counties routed offenders to centrally located assessment centers for this purpose. In other counties, assessment occurred at the treatment program. About half of the counties reported the time between case disposition and assessment to be seven days or fewer (52%). The time between assessment and treatment entry ranged from one to 30 days. The lags most commonly reported (by 40% of counties) were no more than seven days. Treatment placement procedures More than half of counties (66%) reported using the American Society of Addiction Medicine Patient Placement Criteria (ASAM PPC) to guide treatment placement. The ASAM PPC is a clinical tool used to guide the selection of the most appropriate form of treatment. Clients are typically assessed on the following six dimensions: acute intoxication/withdrawal potential; biomedical conditions and complications; emotional, behavioral, or cognitive conditions and complications; readiness to change; risk of relapse, continued use, or continued problem use; and recovery environment. The clinician first assigns a rating of high, moderate, or low on each dimension. The clinician then makes a placement decision, based on the client’s level of functioning across the six dimensions. About two-thirds of counties (64%) indicated use of case management with SACPA offenders. Although aspects of planned treatment intensity and duration varied by county, most counties offered several tiers of treatment including: drug education, outpatient, intensive outpatient or day treatment, and residential. Almost one-third of counties (29%) specified availability of methadone maintenance for SACPA offenders whose problem drug was heroin (or other opiate). However, very few SACPA offenders whose primary drug was heroin were placed in methadone maintenance (see Chapter 4). Assessment of risk In many counties, probation and treatment professionals engage in a joint assessment process. Probation officers complete a risk evaluation for each offender that may include: prior arrest history, prior probation performance, extent of drug and alcohol use, circumstance of the current offense, special needs, assessment of potential harm to the community, assessment of amenability to treatment and probation supervision, recommendation for formal probation or conditional release, and recommended terms and conditions of probation. The probation assessment is used primarily to determine the level of supervision needed, although it may also influence the recommended level of treatment and referral to additional services.
Page of 168 52

Supervision procedures Probation In most counties the probation department was responsible for a number of offender supervision tasks. For example, probation officers conducted face-to-face contacts, administered urine testing, participated in evaluation and orientation of offenders, supported the treatment process through residence verifications and home visits, made referrals to community resources, participated in decisions regarding changes in level of care, monitored attendance issues, monitored any criminal involvement, and provided reports to the court including revocation petitions and modifications and changes in treatment. Parole There was a change in procedure for parolee supervision after the end of SACPA’s first year. Although the change occurred outside the timeframe covered in this report, an explanation of the current procedure is provided here. The Board of Prison Terms (BPT) developed the initial procedure for referring and monitoring parolees during SACPA’s first year. In October 2002, after negotiations between BPT, the California Department of Corrections, and the California Correctional Peace Officers Association, jurisdiction over the disposition of violations by SACPA parolees passed from BPT to the Parole and Community Services Division (P&CSD) of the Department of Corrections. This change enabled the P&CSD to designate parole agents with SACPA caseloads in selected parole districts. In those districts, the agent of record transfers the parolee to the SACPA parole agent, who assumes supervision of the case. When the SACPA parolee either successfully completes treatment or violates parole and is placed on return-to-custody status, the SACPA parole agent transfers the case back to the original parole unit. In counties without parole agents who handle special SACPA caseloads, the agent of record performs the necessary supervision and monitoring functions for parolees referred to SACPA. Parolees eligible for SACPA are referred to county assessment centers by their parole agents, upon approval by the parole unit supervisor, rather than by BPT. A key feature of the current procedure is that parole unit supervisors have “discretion over whether or not to submit qualified cases for Prop 36 treatment and seek concurrence from the BPT. In submitting Prop 36 reports, parole staff shall be expected to continue to use their discretionary decision making abilities in determining whether a parolee should be placed in custody or remain in the community” (California Department of Corrections, 2002). However, BPT retains the authority to affirm or deny referrals. When reporting to the assessment center, the parolee is expected to have two documents in hand: an Activity Report and a Proposition 36 Waiver Form. The Activity Report indicates that the parolee has agreed to participate in and complete treatment, identifies the county assessment center to which the parolee was ordered to report, and indicates the parole unit supervisor’s recommendation regarding action taken on the parole violation and referral to
Page of 168 53

BPT for approval. The Proposition 36 Waiver Form specifies terms of the referral and provides the parolee with the option to waive his or her right to a parole revocation hearing, to refuse to waive a parole revocation hearing, or to refuse participation in SACPA. If the parolee refuses to participate in SACPA, BPT may order the parolee to be returned to custody on the violation. Once a parolee completes the assessment process and enters treatment, the treatment provider has 30 days within which to prepare and submit a treatment plan to both BPT and the P&CSD. In addition, the treatment provider is expected to submit progress reports on a quarterly basis to both agencies.
Page of 168 54

Chapter 4: Criminal Justice and Treatment
All counties reported that drug possession and being under the influence of drugs wereSACPA-eligible. Possession of drug paraphernalia and transportation of drugs were citedas SACPA-eligible in most counties but not all. Some counties, but not most, treatedvehicle offenses such as driving under the influence of drugs as SACPA-eligible. There was no evidence that SACPA prompted any systematic change in arrest or chargingpractices. Half of the counties reported holding at least some offenders awaiting case disposition,while 24% held at least some offenders awaiting placement in SACPA treatment. Walk-in assessment was allowed in 48% of counties. Assessment centers were located in or near the court in 56%. Most counties reported co-location of probation and assessment staff (70%). Most counties allowed offenders morethan one day to report for assessment (70%). Two-thirds of the counties establishedassessment protocol requiring only one visit (66%). About 19% of counties used a drug court approach to handle all SACPA offenders. About 44% of counties reported requiring SACPA offenders to attend a self-help supportgroup while they awaited treatment placement. Most SACPA clients (86%) were placed in outpatient drug-free programs, and 10% wereplaced in long-term residential programs. This was the first drug treatment opportunityfor over half of all SACPA clients. Few heroin users in SACPA (10%) were treated with methadone (detoxification ormaintenance). Counties added capacity in existing treatment programs in all modalities. Outpatientdrug-free treatment, intensive outpatient/day treatment, and residential treatment were themodalities in which most counties reported adding new programs.
This chapter begins with findings on the nature and extent of variability across counties in the identification of offenses as SACPA-eligible. Also presented are analyses of aggregate statistics and “case studies” of selected counties regarding the possibility of SACPA-related change in arrest practices of law enforcement and charging practices of prosecutors.
Page of 168 55

The chapter next identifies strategies employed by counties to manage the flow of offenders into SACPA. These strategies include, for example, locating assessment centers at or near the court, co-location of probation and assessment staff, allowing assessment by walk-in as well as appointment, and use of a “drug court approach” (processing SACPA offenders through a court having all or some features of a drug court). The final portion of this chapter shows a breakdown of treatment modalities in which SACPA offenders were placed. SACPA-eligible offenses There is no single, complete, and authoritative list of drug-related offenses governing SACPA eligibility throughout the state. While persons convicted of simple drug possession are clearly eligible, the status of other types of offenses has not always been clear and, in some cases, has been or may be litigated. UCLA consulted a variety of knowledgeable sources to compile an inclusive list of offenses for which a person might be deemed eligible for SACPA (see Appendix C). Sources included specifications in the SACPA legislation, analyses by the California Public Defenders Association (2001) and the California District Attorneys Association (2001), criminal justice experts on ADP’s Statewide Advisory Group and Evaluation Advisory Group, and the Parole and Community Services Division of the California Department of Corrections. The list of offenses was included in the stakeholder survey sent to court administrators in each county. They were asked to identify offenses regarded as SACPA-eligible in their county during SACPA’s first year. The primary purpose of this inquiry was to gauge the nature and extent of variability in local discretion regarding the offenses for which a person might be deemed eligible for SACPA. (To serve that purpose, it was not necessary to ask respondents how many offenders entered SACPA upon conviction for each eligible offense, and such a request would have added unduly to respondent burden.) A secondary purpose was to inform the procedure for selecting the matched pre-SACPA comparison group needed for analyses of SACPA costs and outcomes (see Chapter 7). A total of 23 county administrators responded to the question on SACPA-eligible offenses. Thus, findings do not cover all 58 counties, but they do serve to demonstrate the existence of variability in offenses regarded as SACPA-eligible across counties. As shown in Figure 4.l, three offenses were universally cited by reporting counties as SACPA-eligible: possession of a controlled substance (H&S 11377), being under the influence of a controlled substance (H&S 11550), and possession of a narcotic or other controlled substance (H&S 11350). Two additional possession offenses were cited by almost all reporting counties: possession of marijuana/hashish (H&S 11357) and controlled substance (H&S 11053). Paraphernalia offenses were cited by a large majority of reporting counties but not all; see Figure 4.2. In particular, possession of a syringe (B&P 4140) was regarded as SACPA-eligible in three-fourths of the reporting counties, leaving roughly one-fourth of California’s counties where that offense was not deemed eligible.
Page of 168 56

Figure 4.1SACPA-eligible Possession Offenses
(Stakeholder Survey)(Number of counties reporting varied; see below)
100.0 100.0 100.095.8 95.7
0
50
100
Possession ofcontrolledsubstance
(H&S 11377)(N = 22)
Under theinfluence ofcontrolledsubstance
(H&S 11550)(N = 24)
Possession ofnarcotic or other
controlledsubstance
(H&S 11350)(N = 24)
Possession ofmarijuana or
hashish(H&S 11357)
(N =24)
Controlledsubstance
(H&S 11053)(N = 23)
Perc
ent o
f co u
n tie
s whe
r e o
f fe n
se is
eli g
ible
Page of 168 57

There was considerable variability with respect to vehicle offenses; see Figure 4.3. Almost half of the reporting counties indicated that an open container offense (VC 23222 (b)) was SACPA-eligible. Over half did not. A few counties reported that persons convicted of driving under the influence (VC 23152 and 23153) were SACPA-eligible. Finally, Figures 4.4 and 4.5 show findings for drug transportation and miscellaneous drug offenses. A majority of counties reported that offenses in these categories were eligible. However, that determination was not universal. The percent of counties reporting an offense in these categories to be eligible ranged from 48% (PC 674 (f) to 91% (H&S 11379). Arrest and charging practices In the public debate over Proposition 36, concerns were expressed regarding the possible response of law enforcement and prosecutors if the initiative were to pass. Among these concerns were that law enforcement officials might be disinclined to make arrests for SACPA-eligible offenses and that prosecutors might adjust charging practices for the purpose of rendering some offenders ineligible for SACPA. Although it is too early to discern stable long-term patterns in arrest and charging practices in the SACPA era, UCLA conducted a study of trends in drug-related arrests during the years 1991 to 2001. Two offense types were studied: drug possession (H&S 11350, 11357, and 11377 (a)) and being under the influence of a controlled substance (H&S 11550 (a) to (d)). These two offense types do not encompass all of those potentially SACPA-eligible but do represent a sizable portion of potentially eligible offenses and are, as shown by the analysis above (see Figure 4.1), among the offenses counted as SACPA-eligible by all or almost all counties. The purpose of this study was to determine whether aggregate arrest data can be employed specifically for the purpose of tracking SACPA arrest practices at statewide and county levels.8 In addition, UCLA conducted qualitative interviews with criminal justice representatives in selected counties to obtain their perceptions regarding any intended or actual change in arrest or charging practices in response to SACPA. These counties were meant to serve as “case studies” indicative of the possible need to study arrest or charging practices in a more systematic and labor-intensive way. These studies are not representative of the state overall. Counties are identified by name in the study of arrest trends because the arrest data are publicly available. Findings from qualitative interviews are not identified by county or respondent. Details on methods used to collect and analyze the aggregate and qualitative data appear in Appendix D. 8 Data collection and analysis were conducted by Andrew Klein and Douglas Wilson at BOTEC under subcontract to UCLA and in collaboration with UCLA researchers. Linda Nance at the Criminal Justice Statistics Center, California Department of Justice, provided data and analytic assistance.
Page of 168 58
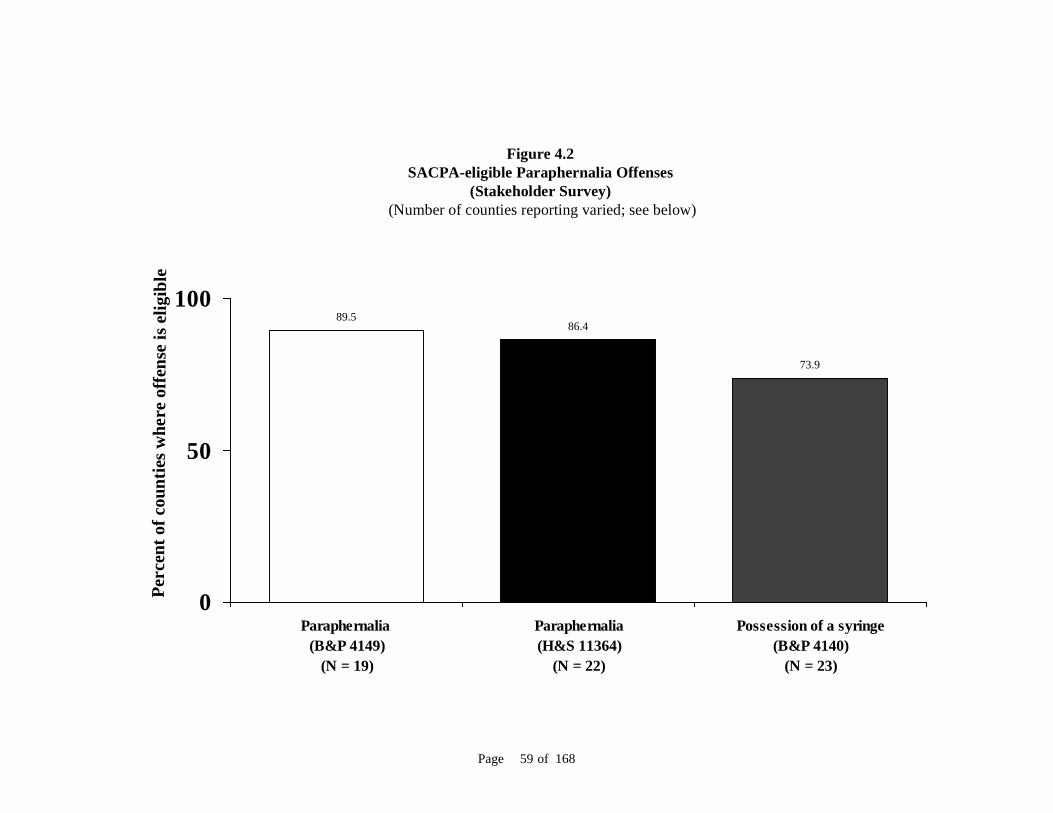
Figure 4.2SACPA-eligible Paraphernalia Offenses
(Stakeholder Survey) (Number of counties reporting varied; see below)
89.586.4
73.9
0
50
100
Paraphernalia (B&P 4149)
(N = 19)
Paraphernalia(H&S 11364)
(N = 22)
Possession of a syringe(B&P 4140)
(N = 23)
Perc
ent o
f cou
nti e
s whe
r e o
ffen
s e is
el ig
ibl e
Page of 168 59

Figure 4.3SACPA-eligible Vehicle Offenses
(Stakeholder Survey) (Number of counties reporting varied; see below)
45.8
13.6 13.6
0
10
20
30
40
50
Open container(VC 23222 (b))
(N = 23)
DUI(VC 23152)
(N = 22)
DUI(VC 23153)
(N = 22)
Perc
ent o
f cou
nti e
s whe
r e o
ffe n
s e i s
el ig
i ble
Page of 168 60

Figure 4.4SACPA-eligible Drug Transportation Offenses
(Stakeholder Survey) (Number of counties reporting varied; see below)
90.987.5 86.4
0
50
100
Transportation of controlledsubstance
(H&S 11379)(N = 22)
Transportation of controlledsubstance
(H&S 11352)(N = 24)
Transportation of marijuana(H&S 11360)
(N = 22)
Perc
ent o
f cou
ntie
s whe
re o
f fe n
s e is
eli g
ible
Page of 168 61

Figure 4.5SACPA-eligible Miscellaneous Drug Offenses
(Stakeholder Survey)(Number of counties reporting varied; see below)
81.8 81.877.3
68.2
47.8
0102030405060708090
100
In a room wherecontrolled
substances are used(H&S 11365)
(N = 22)
Planting,cultivating,
harvesting, drying,or processingmarijuana forpersonal use(H&S 11358)
(N = 22)
Securing drug byfictitious
prescription forpersonal use(H&S 11368)
(N = 22)
Planting,cultivating,
harvesting, drying orprocessing peyote
(H&S 11363)(N = 22)
Public intoxication(PC 647 (f))
(N = 23)
Perc
ent o
f cou
ntie
s whe
re o
f fe n
se is
eli g
i ble
Page of 168 62

Arrest practices The analysis first examined statewide trends in arrests for drug possession and being under the influence of a controlled substance. The next step was to examine these trends in particular counties in order to detect any departure from the statewide finding. The counties were: Kern, Los Angeles, Santa Clara, and Ventura. The number of drug possession arrests in the state remained consistent throughout most of the 1990’s but declined slightly in the last few years of the decade. Such arrests ranged between a low of 33,580 in 1995 and a high of 41,784 in 1992. In 2000, the statewide total was only 3.1% higher than the lowest yearly total (in 1995) for the decade and was 17.2% lower than the highest yearly total (in 1992). Arrests for being under the influence of a controlled substance fluctuated across the decade. The total of such arrests was as low as 42,342 in 1999 and as high as 55,120 in 1994. In 2000, the statewide total was only 4.5% higher than the lowest yearly total (in 1999) and was 19.7% lower than the peak (in 1994). The statewide pre-SACPA trend in arrests for these two offense types combined is shown in Figure 4.6. A slight but steady decline in the number of arrests, beginning in 1997 and continuing annually through 2000, is apparent.
Figure 4.6Statewide Arrests Eligible for SACPA, 1991 - 2000
(California Department of Justice)
0
50000
100000
1991 1992 1993 1994 1995 1996 1997 1998 1999 2000
Number of SACPA-eligible arrests
Page of 168 63

Figure 4.7County Arrests Eligible for SACPA, 1991 - 2000
(California Department of Justice)
0
1000
2000
3000
4000
5000
6000
7000
1991 1992 1993 1994 1995 1996 1997 1998 1999 2000
Santa Clara Ventura Los Angeles Kern
When the trend line was plotted in four individual counties (see Figure 4.7), Los Angeles and Santa Clara closely tracked the statewide decline. (For ease of comparison, the actual number of arrests in Los Angeles was reduced by a factor of ten.) In Kern and Ventura, the number of arrests either remained flat or fluctuated in no consistent pattern. The second half of 2001 was the first six months of SACPA. If SACPA had an immediate impact on arrest practices, that impact may be discernible in the data for 2001, although it would have to have been fairly dramatic. Statewide arrests for possession and being under the influence declined in 2001 by about 8% compared to the year 2000. See Table 4.1. Some observers expected that law enforcement might respond to SACPA by reducing the number of arrests for SACPA-eligible offenses, and a reduction in such arrests is indeed what occurred. However, it is entirely consistent with the declining trend that predated SACPA by four years. Arrests diminished in each of the four individual counties, most significantly in Ventura, where arrests had been increasing in the two years before 2001. Ventura’s relatively large decline in 2001 may represent a return to a more typical baseline level of arrests. It may also represent an example of actual change in a county’s arrest practices. The possibility of such change is also suggested by data on arrests for drug sales (not SACPA-eligible) in Ventura. Those arrests increased from 2000 to 2001 after steadily declining since 1996. This trend
Page of 168 64

Table 4.1
Statewide Arrests Eligible for SACPA, 2000-2001 (California Department of Justice)
2000 2001 Possession 34,613 30,928 Under the influence 44,250 41,718
stands in contrast to the statewide pattern of declining drug sales arrests from 2000 to 2001. However, the possibility of actual change in arrest practices in Ventura or other counties cannot be gauged until additional years are available.
Table 4.2 County Arrests Eligible for SACPA, 2000-2001
(California Department of Justice) 2000 2001 Percent decrease Kern 2,909 2,854 1.9% Los Angeles 21,285 20,149 5.4% Santa Clara 3,845 3,676 4.4% Ventura 3,296 2,759 16.3%
In qualitative interviews, county respondents generally expressed the view that law enforcement practices did not change in response to SACPA. While the behavior of some individual officers may have been influenced by the law, no systematic change in the administration and organization of law enforcement agencies was apparent. In particular, officers assigned to special narcotics units reportedly continued to make arrests as they had before. On the other hand, as noted by respondents in one county, local law enforcement may believe that SACPA has made it more difficult to “twist” low-level (misdemeanor) offenders in order to obtain intelligence on drug networks at higher levels. Charging practices The evaluation did not collect aggregate statistics on possible change in prosecutors’ charging practices but did seek comment on the issue. On the whole, county respondents did not report any systematic change in charging practices because of SACPA. Some local prosecutors stated publicly in advance of SACPA implementation that their charging practices would not change. There was considerable variability reported across counties in the strictness employed by prosecutors when they charged drug offenses, but this variability did not appear to reflect differences in county reactions to SACPA. Moreover, judges in the selected counties reportedly interpreted SACPA eligibility criteria widely enough to allow participation by offenders who might have been deemed ineligible and encouraged prosecutors to collaborate with public defenders in making sure that offenders were aware of the SACPA option. (Some of the variability in SACPA-eligible
Page of 168 65

offenses, reported above, may reflect judges’ efforts to offer SACPA to a wider range of offenders.) Many of the judges handling SACPA cases in these counties had prior experience in drug courts and were therefore knowledgeable regarding the issues faced by drug offenders and the benefits of treatment. Some respondents reported signs of a shift from prosecutors’ traditionally adversarial role toward a more collaborative role. Those signs may be modest, but they echo a finding much more apparent in focus-group discussions regarding supervision practices of probation officers (see Chapter 5). Moreover, the role of public defenders seems to have expanded to include an advisory function. In fact, as indicated in the focus group findings (see Chapter 5), some public defenders have experienced a degree of tension between their traditional role as legal advocates for their clients and an emergent SACPA role as advisors urging compliance and treatment participation. Future steps UCLA’s analysis of arrest trends and qualitative data found no evidence of systematic change in arrest or charging practices thus far. However, further examination of trends in SACPA-relevant arrests is clearly feasible at both the state and county levels. In addition, findings suggest that SACPA may lead to detectable change in arrest or charging practices in some counties even if no such change occurs statewide. Offender management strategies UCLA reviewed county and state documents and observed hearings, advisory group meetings, and county implementation meetings to identify particular strategies employed by counties to manage SACPA offenders. The focus was initially on strategies including holding offenders in detention while they await case disposition or treatment, locating assessment centers in or near the court, co-location of probation and assessment staff, allowing assessment by walk-in as well as appointment, allowing offenders more latitude (number of days) in reporting for assessment, completing assessment in one visit, use of a “drug court approach” (processing at least some SACPA offenders through a court having all or some features of a drug court), case management, transportation of offenders to assessment or treatment, requiring offenders to attend a pre-treatment self-help support group, and minimizing the lag (number of days) between assessment and treatment placement. The assumption regarding each strategy was that it might help to maximize the county’s “show” rate at assessment, treatment, or both. Questions about use of these offender management strategies were included in the stakeholder survey. Findings reported here cover: holding some offenders in detention while they await disposition or treatment, locating assessment in or near the court, co-located assessment staff, allowing assessment by walk-in or appointment, allowing offenders the more days to report for assessment, completing assessment in one visit, use of a “drug court approach,” and requiring pre-treatment attendance at a self-help support group. Strategies for which the stakeholder survey response rate was very low were not analyzed.
Page of 168 66

As shown in Figure 4.8, half of the counties reported holding at least some offenders awaiting case disposition, while 24% held at least some offenders awaiting placement in SACPA treatment. Many counties reported use of strategies intended to raise “show” rates at assessment (see Figure 4.9). Walk-in assessment was allowed in 48% of counties. Assessment centers were located in or near the court in 56%. Most counties reported co-location of probation and assessment staff (70%), and most allowed offenders more than one day to report for assessment (70%). Two-thirds of the counties established assessment protocol requiring only one visit (66%). Three variations on a “drug court approach” are shown in Figure 4.10. The term “drug court approach” is used here because data were not detailed enough to indicate whether SACPA offenders were being handled in courts that met the defining characteristics of drug court, e.g., court calendars dedicated to drug offenders; direct contact between judge and offender; treatment and close supervision; and collaboration between judge, prosecutor, defense attorney, and treatment provider. The first variation was a drug court approach that was created specifically for SACPA and handled all of the county’s SACPA offenders (55% of reporting counties). The two other variations reported by counties were use of an existing drug court to handle all SACPA offenders (19%) or some (30%). Counties could report more than one of these approaches. Overall, use of a drug court approach in any of these variations was reported by 74% of counties. Finally, as shown in Figure 4.11, 44% of counties reported requiring SACPA offenders to attend a self-help support group while they awaited treatment placement. Treatment modalities UCLA used CADDS data to show the number of SACPA offenders entering each treatment modality as a percent of all SACPA offenders entering treatment. As shown in Figure 4.12, outpatient drug-free was the treatment modality most commonly experienced (86.0%). Long-term residential treatment (planned duration exceeding 30 days) was the second most common modality (9.9%). Figure 4.13 shows treatment modality by primary drug. Outpatient drug-free was the predominant modality for offenders in each primary-drug category. The next most common modality, again for each primary drug, was long-term residential. Methadone maintenance is the treatment recommended for heroin dependence by the National Academy of Sciences and the National Institute on Drug Abuse. However, few heroin users in SACPA (10%) were treated with methadone (either detoxification or maintenance). Most were placed in outpatient drug-free programs, which can be effective with heroin users but do not provide medication to alleviate the symptoms of heroin abstinence. As reported above, 29% of county plans specified availability of methadone for SACPA offenders. Nevertheless, most heroin users receiving SACPA treatment in those counties were placed in modalities other than methadone detoxification or methadone maintenance (data not shown).
Page of 168 67

Figure 4.8Counties Reporting Detention of Some SACPA Offenders Awaiting Case Disposition and
Treatment Placement(Stakeholder Survey)
(Number of counties reporting varied; see below)
23.0
50.0
0
10
20
30
40
50
60
Held for disposition(N= 26)
Held for treatment(N= 35)
Perc
ent o
f cou
nti e
s re p
ort in
g de
t ent
ion
Page of 168 68

Figure 4.9Counties Reporting Use of Selected Offender Management Strategies
(Stakeholder Survey) (Number of counties reporting varied; see below)
57.0
70.0
50.0
68.064.0
01020304050607080
Proximity tocourt
(N= 42)
Co-located staff(N= 47)
Walk-insallowed(N= 30)
Days allowed(more than 1)
(N= 31)
One visitprocess(N= 42)
Perc
ent o
f cou
ntie
s rep
orti n
g s t
r ate
gy
Page of 168 69

Figure 4.10Counties Reporting Management of Offenders by Drug Court Approach
(Stakeholder Survey)(Number of counties reporting varied; see below)
53.0
19.0
29.0
0
10
20
30
40
50
60
NewAll
(N = 32)
ExistingAll
(N = 32)
ExistingSome
(N = 31)
CourtOffendersPe
rcen
t of c
ount
ies r
epor
ti ng
drug
cou
r t a
ppro
ach
Page of 168 70

Figure 4.11Counties Reporting Required Attendance at Self-help Support Group By Offenders Awaiting Treatment
Placement(Stakeholder Survey)
(40 Counties Reporting)
43.0
0
10
20
30
40
50
Required support group
Perc
ent o
f cou
ntie
s re p
o rt in
g r e
qui r
ed su
ppor
t gr o
up
Page of 168 71

Treatment capacity The stakeholder survey included questions regarding strategies that counties may have used to add treatment capacity during the first year of SACPA. Strategies fell into two categories: augmenting the number of county-paid slots in existing treatment programs, and adding new programs (which had to complete ADP’s licensing/certification process before coming “on line”). Modalities covered were: outpatient drug-free treatment, outpatient treatment with methadone or other medication, intensive outpatient or day treatment, short- or long-term residential treatment, and drug education or early intervention. As shown in Figure 4.14, capacity expansion was greatest for outpatient drug-free treatment (82.1% of counties added new programs and 86.7% added slots in existing programs), intensive outpatient or day treatment (40.6% and 73.7% respectively), and residential treatment (29.4% and 69.2% respectively). Drug education or early intervention programs were expanded as well (23.5% added new programs and 58.3% added new slots). Capacity expansion was lowest for outpatient treatment with methadone or other medication (5.9% added new programs and 30.6% added new slots). Moreover, counties appeared to use augmentation of available capacity as an “across the board” strategy (in all modalities). But the effort to add new programs may have been more specific, as outpatient drug-free treatment, intensive outpatient/day treatment, and residential treatment were the modalities in which most counties reported new programs.
Page of 168 72

Figure 4.12SACPA Treatment Clients by Modality
(CADDS), 7/1/01 - 6/30/02 (N = 24,286)
86.0
9.91.8 1.1 0.2 0.8
0
102030405060708090
Outpatient Residential > 30 days
Detox Residential < 30 days
Methadonedetox
Methadonemaintenance
Perc
ent o
f SA
CPA
trea
tmen
t clie
nts
Page of 168 73

Figure 4.13Primary Drug by Modality Among SACPA Treatment Clients
(CADDS), 7/1/01 - 6/30/02(N = 24,284)
0.9 2.6 1.86.9
0.2 00 0 0 2.2 0 00 0 0
7.5
0 0
88.683.3 85.3
67.2
94.591.8
1.1 1.2 1 2 0.5 1.4
9.212.7 11.7 14
4.6 6.7
0
10
20
30
40
50
60
70
80
90
100
Methamphetamine(N = 12,209)
Alcohol(N = 2,579)
Cocaine/Crack(N = 3,538)
Heroin/Other Opiates(N = 2,671)
Marijuana(N = 2,859)
Other(N = 428)
Detoxification Methadone detoxification Methadone maintenance
Outpatient Residential < 30 days Residential > 30 days
Perc
ent o
f SA
CPA
tre a
tme n
t clie
nts
Page of 168 74

Page of 168 75
Figure 4.14Counties Reporting that Treatment Capacity Increased in New Programs or Existing Programs
(Stakeholder Survey) (Number of counties reporting varied; see below)
55.0
5.7
39.4
28.622.9
87.0
32.4
74.470.0
56.8
0102030405060708090
100
Outpatient treatment(no medication
prescribed)(N = 46)
Outpatient treatment(wi th methadone or
other medicationprescribed)
(N = 37)
Intensive outpatient orday treatment
(N = 39)
Resi dent ial treatment(N = 40)
Drug education or earlyintervention
(N = 37)
New Existing
Perc
ent o
f cou
ntie
s

Page of 168 76

Chapter 5: County Implementation
SACPA required substantial collaboration among criminal justice, treatment, and countyadministrators. County representatives expressed concern regarding the sufficiency of SACPA fundingacross years. Most county representatives reported favorable views of overall SACPAimplementation locally.
This chapter focuses on implementation issues and efforts to address those issues at the county level in SACPA’s first year. Stakeholder survey results on interagency communication and overall quality of implementation are reported first. The chapter then presents findings from the in-depth discussion groups convened by UCLA in the evaluation’s ten focus counties. During those discussions, county representatives participated in an interactive assessment of implementation issues faced in their counties. It is important to provide a context for the findings on SACPA implementation. Criminal justice innovations can be quite difficult to implement because they typically require new definitions of the relationships among stakeholders. Moreover, the boundaries separating public agencies are “fuzzy” (Sutton, 1994). Their interests often overlap, and the scope and limits of their authority are often indefinite and guided by arrangements and decision-rules that are informal and subject to change (Wolf, 2002). Finally, system resources are often fragmented and stretched thin. Clients referred to drug treatment by criminal justice need an appropriate level of community supervision and may also need vocational, educational, mental health, and other services. Public agencies serving these functions may find it very difficult to handle a new influx of clients and may have little pre-existing capability for regular communication and information-sharing. Criminal justice innovations have often foundered as a result (Musheno et al., 1989; Nolan, 2002). Problems encountered and solutions adopted during the first year of SACPA implementation must be evaluated in that context. Interagency communication The stakeholder survey asked respondents to rate the frequency and value of interagency communication during the first year of SACPA implementation. UCLA created a summary score for each county on the basis of ratings by the lead agency, alcohol and drug program administration, court administration, district attorney’s office, public defender’s office, and probation department. Scores ranged from 1 (low communication) to 4 (high).
Page of 168 77

The statewide average was 2.92. Figure 5.1 shows the variation in county scores. About one-third of the counties reported a high degree of interagency communication. Few counties reported a low degree of interagency communication. Quality of implementation Each section of the stakeholder survey asked respondents to provide their overall judgment of SACPA implementation during its first year. Scores ranged from 1 (poor) to 5 (very good). UCLA created two types of summary scores. The first was an average of the judgments reported by sectors for the county. Sectors were the lead agency, alcohol and drug program administration, court administration, district attorney’s office, public defender’s office, and probation department. The second type of summary score was an average of the judgments reported across the state by respondents for each sector. These two scores provided, first, a look at the variation in perceived implementation across counties; and, second, a look at variation in perceived implementation across sectors. The statewide average (combining all sectors from all counties) was 4.08, indicating that respondents overall were reporting “good” overall implementation. Figure 5.2 shows the variation in county scores. About half of the counties reporting “very good” implementation, and about one-third reported “good” implementation. Figure 5.3 shows implementation scores by sector. Court administrators expressed the most favorable views of SACPA implementation (mean = 4.4). The views of lead agency representatives (mean = 4.3), alcohol and drug program administrators (mean = 4.1), and probation representatives (mean = 4.0) were also favorable. Scores above 4.0 corresponded to a rating of “very good.” Public defenders (mean = 3.8) and district attorneys (mean = 3.8) were somewhat less favorable. Implementation issues Focus groups were conducted to gain an in-depth understanding of county experiences with SACPA thus far. Ten in-depth discussion groups were conducted, involving a total of 136 participants from the evaluation’s ten focus counties. (See Chapter 7 for a full explanation of the role of focus counties in the evaluation and how they were selected.) Participants represented the lead agencies responsible for SACPA implementation, the courts, probation, district attorney’s office, public defender’s office, local parole office, treatment providers, Native American tribes, and law enforcement as well as other groups involved in SACPA implementation. Appendix E provides a review of focus group procedures and findings. Focus group findings served two important purposes. First, they indicated a range of implementation problems and solutions that emerged in SACPA’s first year in a diverse subset of California counties (large and small; urban and rural; and northern, southern, and central). Solutions reported in the focus groups serve, in particular, to highlight options that counties throughout the state may wish to consider as they continue to implement SACPA. Second, focus group findings provide depth and specificity beyond the quantitative data reported earlier.
Page of 168 78

Figure 5.1County Scores for Interagency Communication
(Stakeholder Survey)(42 Counties Reporting)
9.5
57.2
33.3
0
10
20
30
40
50
60
Low Moderate High2.1-3.01.0-2.0 3.1-4.0
Perc
ent o
f cou
ntie
s
Page of 168 79

Figure 5.2County Scores for SACPA Implementation
(Stakeholder Survey)(51 Counties Reporting)
0.0
11.8
37.3
51.0
0
10
20
30
40
50
60
70
Poor Adequate Good Very good4.1-5.02.1-3.0<2.0
Perc
ent o
f cou
ntie
s
3.1-4.0
Page of 168 80

Figure 5.3Sector Score for SACPA Implementation
(Stakeholder Survey)
4.44.3
4.14.0
3.8 3.8
1
2
3
4
5
Courtadministrator
Lead agency AODadministrator
Probation Public defender Districtattorney
Very good
Very poor
Scor
e
Adequate
Good
Poor
Page of 168 81

Numerical findings, such as the percent of focus counties in which a problem occurred, cannot be generalized to the state as a whole. But descriptive information—the nature of a problem and how it can be addressed—is nevertheless valuable for the reason cited above. That information also served to cross-validate the findings based on stakeholder survey data, which covered most counties in the state. Findings are listed separately here, but in fact they overlapped considerably. Underlying several findings is the perception that counties have been very actively engaged in problem-solving throughout SACPA planning and implementation. While a solution devised in one county may not be appropriate for another, this section catalogues the strategies that some participants reported to be effective. Planning SACPA implementation committees, composed of diverse stakeholder groups in each county, typically began by anticipating possible problems in the law or in local implementation. Then they strategized to avoid or ameliorate these effects. Drug courts handle drug-using offenders in an approach emphasizing treatment and close supervision; direct contact between judge and offender; and collaboration between judge, prosecutor, defense attorney, and treatment provider. Drug courts have been successful in reducing re-offending, especially among clients who complete treatment and other requirements (Belenko, 2001). But they are labor-intensive and depart from traditional jurisprudence in some important ways. Because many counties had drug courts in place before SACPA began, planners could draw upon their experience with drug court as they implemented SACPA. Participants from seven of the ten counties reported building on interagency relationships and lessons learned in drug court. For example, one county drew on its drug court evaluation to create a comprehensive SACPA plan that included a completely revamped system of care. In addition, participants in half of the focus counties believed that their success was directly related to the degree to which resources sufficed to allow them to adhere to a drug court model. However, participants in three counties said that some members of their SACPA implementation committees had been or continue to be opposed to adopting a drug court model for SACPA in their counties. Training and orientation Participants reported providing trainings and information on the nature of addiction and treatment to local criminal justice personnel. For example, the assistant district attorney in one county developed an in-house library of materials on addiction. Prosecutors working on SACPA cases were assigned materials to read. Probation officers in another county were able to attend special trainings and conferences, while training for SACPA judges and commissioners with no prior knowledge of treatment was reportedly critical in two other counties. The SACPA implementation committee in one of these counties adopted a “therapeutic justice” approach (i.e., use of the law as a tool to help offenders as well as to
Page of 168 82

enforce compliance); another committee adopted a combined “accountability-treatment” approach (i.e., an effort to arrive at the optimal combination of treatment and supervision). Expedited case processing District attorneys and public defenders collaborated in some counties to allow offenders to plead into SACPA at the earliest possible stage of case processing. According to participants from these counties, the strategy required that SACPA cases be handled by assistant-level prosecutors and public defenders, i.e., those with decision-making power. Coordination of assessment and treatment Interagency teams involving treatment and probation (sometimes mental health, parole, and case managers as well) have co-located at central or regional centers as close as possible to the court. Participants reported that this arrangement was crucial in maximizing the “show” rate at assessment and promoting timely referrals. (Chapter 6 provides quantitative support for the importance of co-located assessment.) These teams also fostered understanding and trust among stakeholders. In one county, a team combining treatment, probation, and mental health, screened offenders regularly for mental health problems and assessed their motivation for treatment. Participants from a few focus counties said that they continue to generate new ideas to improve assessment. For example, in one county, participants believed that they would be able to move offenders into treatment more quickly if funds were available to hire more assessors and thereby accommodate all walk-ins. In another county, staff wanted to pare down the assessment instruments and experiment with group assessment to reduce the lag time between referral, assessment, and placement. Allowing “every opportunity” to succeed Offenders with three SACPA violations were often allowed to return to treatment or were sent to a halfway house rather than facing incarceration. In short, the courts tried to exhaust as many options as possible before determining that an offender was not amenable to treatment. Participants in one county reported developing a special drug court for the small number of offenders violated out of SACPA. Monitoring and reporting challenges In response to dramatic increases in probation caseloads, counties developed procedures to distribute the tasks associated with monitoring and reporting. For example, in most focus counties, lines of communication between probation and treatment were opened, and probation officers came to depend on client information provided by treatment staff. Also, probation staff in one county secured additional funding from a nonprofit association to experiment with using interns to check on high-risk offenders weekly. The recovery community in another county began to develop a volunteer mentor program that matches a person in recovery with a SACPA treatment client to “bridge the gap” in oversight and support. In a third county, the court decided to give the treatment-probation team “great discretion” in handling violations. The underlying twofold goal was to give treatment time
Page of 168 83

to work while also holding clients accountable. Participants in another county established a dedicated SACPA court and found that it was instrumental in monitoring offenders more effectively and in applying the law consistently. In addition, some participants mentioned that SACPA created an opportunity to develop or improve their management information systems, which have been vital to monitoring offenders. Finally, some stakeholders have been using sophisticated computerized tracking systems to assess the effectiveness of their programs and to inform local decision-making. Co-occurring disorder Participants identified the need to serve offenders with co-occurring mental disorder more effectively. Many participants favored collaborating more closely and extensively with county mental health agencies. A participant from one county noted that administrators from mental health, who had recently joined the SACPA implementation committee, volunteered funds to serve SACPA offenders. The lead agency staff in another county helped to develop a co-occurring disorder certification program for counselors at a local community college. Other focus counties utilized or are planning to develop mental health courts. Service delivery problems Participants in all focus counties reported that they continued to grapple with service delivery problems. Several strategies were employed to address common needs. First, implementation team members in one county diverted funds from the lower levels of treatment to the higher levels in order to create a new intensive outpatient treatment program to compensate for a lack of residential beds. (This finding helps to explain how treatment capacity was added statewide; see Chapter 4.) In addition, case managers engaged clients early in treatment through orientation and “pre-treatment classes” in an effort to counteract the negative effects of waiting lists. Second, with the exception of one county, which had a highly developed network of sober living environments, participants raised the need for more such environments. SACPA stipulates that treatment must be from “a licensed and/or certified” program. As a result, SACPA offenders can be placed in a sober living environment only if it is affiliated with a licensed and/or certified treatment program. Because this is not a common arrangement, very few sober living options were available in many focus counties.
Third, the need for additional services (e.g., transportation, child care, family counseling, literacy classes, and job training) led to new partnerships and staff positions in some focus counties. The lead agency in one county forged a partnership with the local community college to provide General Equivalency Diploma (GED) and literacy classes. In another focus county, lead agency staff brought a family intervention specialist on board to take a family-based, rather than an individual-based, approach to SACPA offenders. This specialist facilitated contact between the offenders and their families and linked families to needed services (e.g., perinatal services, supplies and services for newborns, and recreational programs for children). In
Page of 168 84

another county, case managers helped offenders obtain vocational, psychological/psychiatric, and other services. Fourth, in one county, participants reported that no certified treatment providers employ counselors able to speak the languages of some non-English speaking SACPA clients. The lead agency in another county released a Request for Proposals to attract additional Spanish-language treatment providers. In a third focus county, the assessment team supervisor was called in when language barriers arose. Fifth, staff in one lead agency planned to meet the challenge of serving large numbers of unmotivated clients by assessing motivation for treatment and developing pre-treatment care for them. Providers in this county were experimenting with treatment approaches such as motivational interviewing. (As shown in Chapter 4, 44% of counties statewide required pre-treatment participation in a self-help support group.) Sixth, stakeholders in a few focus counties raised concerns that unlicensed and uncertified but well-established treatment approaches have become somewhat marginalized in SACPA. However, stakeholders in one county described their success in integrating a recovery-community representative into their SACPA implementation committee. Focus counties with significant Native American populations and/or counties adjacent to tribal lands had representatives from these communities on their SACPA implementation committees. On the other hand, stakeholders from two counties mentioned that including Native American treatment providers in SACPA was difficult because of the licensing/certification requirement and differences between some Native American treatment approaches and the “medical model” of addiction treatment. Finally, because many SACPA offenders have multiple needs and the law mandates a variety of services, participants identified the need for case managers who act as liaison between the court and treatment. In two counties, public defenders reported playing an advisory or (as they put it) a “social worker” role, e.g., correcting their clients’ misconception that there are no adverse consequences for noncompliance, seeking services for clients, communicating with assessment staff, and following up to ensure that clients are assessed and enter treatment. In four counties, the treatment-probation and/or treatment-parole teams appeared to perform this role, while in a fifth county a newly hired SACPA court monitor had recently been named “court monitor/case manager.” As described earlier, in one county case managers were included in SACPA implementation from the outset. In summary, SACPA reportedly added to workloads of agency staff and administrators. County representatives expressed particular concern regarding the sufficiency of SACPA funding across years, especially with respect to the cost of services required by “high need” offenders. Nevertheless, counties were able to bring agencies together for planning and administration; coordination of assessment, treatment, and supervision of offenders; staff training; and problem solving. At the end of SACPA’s first year, counties generally reported a favorable view of implementation thus far. This is a significant accomplishment, given the inherent difficulties in fielding an innovation of this magnitude.
Page of 168 85

Page of 168 86

Chapter 6: Offender Management and “Show” Rates
Assessment “show” rates were higher in counties placing probation and assessment staffat the same location, counties allowing walk-in assessment, and counties requiring onlyone visit to complete an assessment. Treatment “show” rates were higher in counties handling SACPA offenders in a drugcourt approach.
A major concern during SACPA’s first year was to maximize the proportion of offenders who completed the assessment and entered treatment, i.e., the “show” rates. Statewide “show” rates at assessment and treatment were reported in Chapter 2. Strategies adopted by counties to maximize “show” rates were reported in Chapter 4. The analysis now turns to possible impact of these strategies on county “show” rates at assessment and treatment. The analysis first examined the relationship between county “show” rates at assessment and these offender management strategies: holding offenders in detention while they await disposition, locating assessment in or near the court, co-located assessment staff, allowing assessment by walk-in or appointment, allowing offenders more days to report for assessment, completing assessment in one visit, and use of a “drug court approach” (all offenders sent to an existing court). Next to be examined was the relationship between county “show” rates at treatment and these offender management strategies: holding offenders in detention while they await treatment, use of a “drug court approach” with all offenders sent to an existing court, and requiring pre-treatment attendance at a self-help support group. The question is each case is simple: Were “show” rates higher in counties using each strategy than in counties not using it? The term “drug court approach” is used here because data were not detailed enough to indicate whether SACPA offenders were being handled in courts that met the defining characteristics of drug court, e.g., court calendar dedicated to drug offenders; direct contact between judge and offender; treatment and close supervision; and collaboration between judge, prosecutor, defense attorney, and treatment provider. County variability Statewide “show” rates were 85.1% at assessment and 81.3% at treatment (see Chapter 2). Figure 6.1 shows county variability around those rates. About two-thirds of the counties (67%) reported assessment “show” rates at least 81%. However, assessment “show” rates were 70% or lower in about one-fourth of the counties. The variability in treatment “show” rates was quite similar.
Page of 168 87

These “show” rates are based on data in the SACPA Reporting Information System (SRIS), created in 2001. Because SRIS is new, there are uncertainties regarding the completeness and consistency of data across counties. An evaluation of SRIS data validity is being conducted by the Applied Research Center at California State University, Bakersfield. It is possible that variability in “show” rates apparent in SRIS is affected by data problems, and this could account for very low “show” rates seen in a few counties. “Show” rates at assessment Figure 6.2 shows the relationship between assessment “show” rates and the strategy of holding some offenders in detention while they await assessment in counties responding to this question on the stakeholder survey. Average “show” rates were slightly higher in counties using this strategy. Figure 6.3 shows the relationship between assessment “show” rates and strategies specifically intended to facilitate the step from sentencing/referral to assessment. All of the differences were in the same direction, indicating higher “show” rates when assessment was conducted in or near the court, probation and assessment staff were co-located, assessment by walk-in was allowed, offenders had more days to report for assessment, and assessment was completed in a single visit. The difference in average “show” rates was greatest in counties where staff were co-located, where assessment by walk-in was allowed, and where only one visit was required in order to complete an assessment. Figure 6.4 shows the relationship between assessment “show” rates and use of a drug court approach. Rates were the same, regardless of whether counties did or did not report using that approach. However, see the findings on treatment “show” rates. “Show” rates at treatment Figure 6.5 shows the relationship between treatment “show” rates and the strategy of holding some offenders in detention while they await placement in treatment. The average “show” rate was slightly lower in counties using that strategy. Figure 6.6 shows the relationship between treatment “show” rates and use of a drug court approach. Counties using that approach had higher treatment “show” rates on average, about 95%, compared to 79% in counties not using that approach (specifically, all offenders sent to an existing court). Figure 6.7 shows treatment “show” rates in counties that did and did not require offenders to attend a pre-treatment self-help support group. Average rates in each set of counties were essentially the same. In summary, the offender management strategies most clearly related to higher “show” rates were co-locating assessment staff, allowing walk-in assessments, and requiring only one visit to complete an assessment (favorably related to the assessment “show” rate) and use of a drug court approach (favorably related to the treatment “show” rate).
Page of 168 88

Figure 6.1County Variability Around Statewide “Show” Rates for SACPA Offenders at Assessment and Treatment
(SRIS), 7/1/01 - 6/30/02(Number of counties reporting varied; see below)
0.0
12.0
0.0 0.00.0 0.00.02.02.0
0.0
8.2
0.0
14.3
8.28.2
14.012.2
20.0
55.1
44.0
0102030405060
Offenders assessed as a percent ofoffenders referred (N = 50)
Offenders placed as a percent ofoffenders assessed (N = 49)
0 - 10 11 - 20 21 - 30 31 - 40 41 - 50 51 - 6061 - 70 71 - 80 81 - 90 91 - 100
Perc
ent o
f cou
ntie
s
Page of 168 89

Figure 6.2Average Assessment “Show” Rates by Use of Detention Awaiting Case Disposition
(SRIS and Stakeholder Survey)(16 Counties Reporting)
75.0
81.0
0102030405060708090
Did not use detention Used detention
Perc
ent o
f cou
ntie
s
Page of 168 90

Figure 6.3Average Assessment “Show” Rates by Use of Selected Offender Management Strategies
(SRIS and Stakeholder Survey)(Number of counties reporting varied; see below)
76.0 74.0 74.070.0 72.0
78.0
88.080.0
75.080.0
0102030405060708090
Proximity to court(N = 26)
Co-located staff(N = 27)
Walk-ins allowed(N = 26)
Days allowed(more than 1)
(N = 21)
One visit process(N = 26)
No Yes
Perc
ent o
f cou
ntie
s
Page of 168 91

Figure 6.4Average Assessment “Show” Rates by Use of Drug Court Approach
(All Offenders Sent to Existing Court)(SRIS and Stakeholder Survey)
(20 Counties Reporting)
80.0 81.0
0102030405060708090
Did not use drug court approach Used drug court approach
Perc
ent o
f cou
ntie
s
Page of 168 92

Figure 6.5Average Treatment “Show” Rates by Use of Detention Awaiting Treatment Placement
(SRIS and Stakeholder Survey)(25 Counties Reporting)
86.081.0
0102030405060708090
Did not use detention Used detention
Perc
ent o
f cou
ntie
s
Page of 168 93
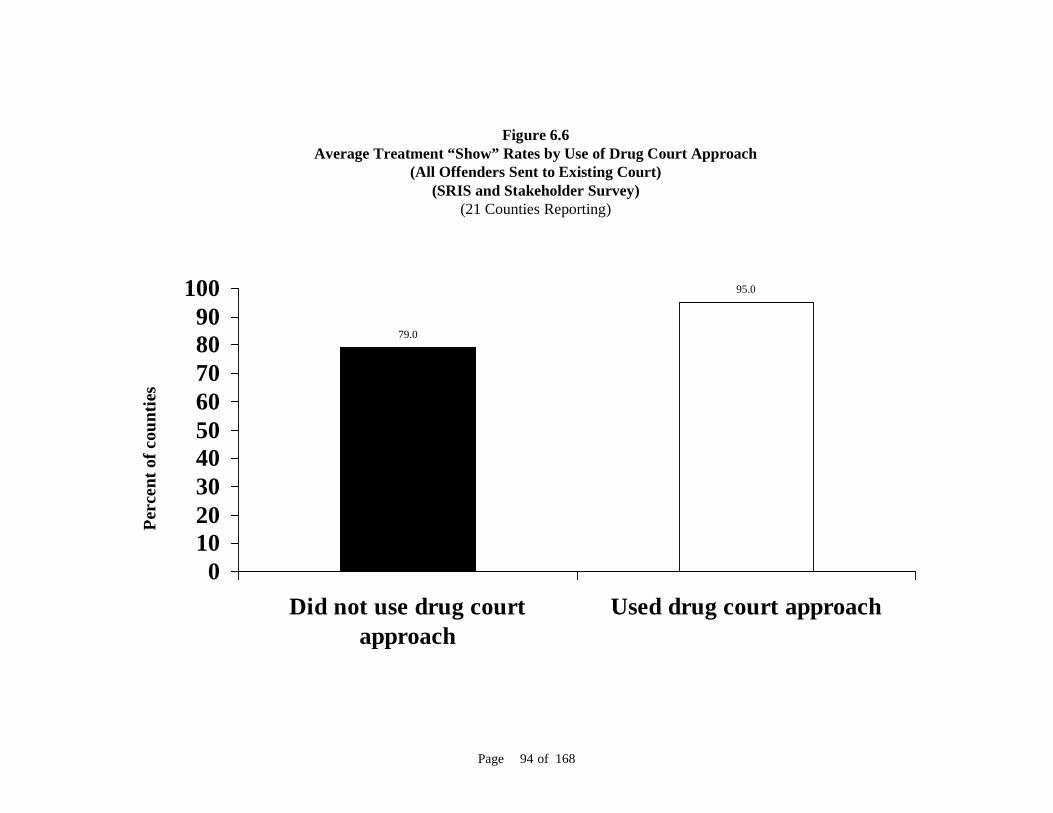
Figure 6.6Average Treatment “Show” Rates by Use of Drug Court Approach
(All Offenders Sent to Existing Court)(SRIS and Stakeholder Survey)
(21 Counties Reporting)
79.0
95.0
0102030405060708090
100
Did not use drug courtapproach
Used drug court approach
Perc
ent o
f cou
ntie
s
Page of 168 94

Figure 6.7Average Treatment “Show” Rates by Use of Pre-Treatment Self-help Support Group
(SRIS and Stakeholder Survey)(28 Counties Reporting)
85.0 84.0
0102030405060708090
Did not use pre-treatmentsupport groups
Used pre-treatment supportgroups
Perc
ent o
f cou
ntie
s
Page of 168 95

Page of 168 96

Chapter 7: Evaluation Progress and Planning
The evaluation is guided by 11 research questions. All counties are asked to complete an annual stakeholder survey. Ten “focus counties” are participating in additional evaluation activities. Future evaluation reports will cover the possible cost-saving associated with SACPA,outcomes for SACPA clients, and overall lessons learned. The evaluation will continue to report on implementation, especially emerginginnovations in offender processing and supervision, treatment, and other servicedelivery.
This final chapter covers procedural matters in the evaluation. Potential topics for the evaluation were prioritized, resulting in the set of research questions specified here. Also described are progress made by UCLA in collaboration with the evaluation’s ten focus counties and the status of UCLA’s acquisition of state administrative databases needed for future analysis. Finally, the chapter specifies the four pairs of comparison groups that will serve as the basis for estimating SACPA costs and outcomes. Research questions The evaluation’s research questions were developed by UCLA in collaboration with the Department of Alcohol and Drug Programs (ADP), the Statewide Advisory Group and Evaluation Advisory Group (both convened by ADP), and other stakeholder groups. Questions cover four domains: cost-offset, client outcomes, implementation, and lessons learned. UCLA subdivided each research question into subquestions that represent more specifically the scope of the evaluation and serve as an organizing framework for detailed planning (e.g., identification of data sources and analytic techniques). UCLA also estimated the percent of evaluation resources required for completion of work on the research questions in each domain. The purpose of these estimates is to convey the approximate “level of effort” to be expended. They are shown in parentheses in the heading for each domain.
Page of 168 97

Cost-offset (40% level of effort) UCLA will use administrative data maintained by state agencies and will collect unit-cost information from treatment, criminal justice, and other sources in order to measure costs and cost savings and to evaluate the adequacy of funds appropriated. Research question 1: Does SACPA lead to cost savings? Subquestions 1.1 to 1.7 cover components of costs and cost savings. The difference in cost for SACPA offenders and comparison offenders will be calculated for each component and combined across all components to determine whether SACPA leads to net cost savings. Subquestion 1.8 pertains to possible averted costs of prison and jail construction, and those costs will be calculated separately.
Subquestion 1.1: Drug treatment costs and cost savings. What are the drug treatment costs for SACPA offenders versus comparison offenders? Subquestion 1.2: Services costs and cost savings. What are the health and social service costs for SACPA offenders versus comparison offenders? Subquestion 1.3: Case processing costs and cost savings. What are the law enforcement, prosecution, defense, and court costs for SACPA offenders versus comparison offenders? Subquestion 1.4: Probation costs and cost savings. What are the probation supervision costs for SACPA offenders versus comparison offenders? Subquestion 1.5: Parole costs and cost savings. What are the parole supervision costs for SACPA offenders versus comparison offenders? Subquestion 1.6: New crimes costs and cost savings. What are the costs of new crimes (recidivism) by SACPA offenders versus comparison offenders? Subquestion 1.7. Incarceration costs and cost savings. What are the costs of jail and prison incarceration for SACPA offenders versus comparison offenders? Subquestion 1.8. Construction. Does SACPA lead to a cost saving from prison and jail construction delayed or averted?
Research question 2: Does the enacted SACPA allocation cover the cost of treatment, other services, case processing, and supervision of SACPA offenders?
Subquestion 2.1: SACPA allocation. What percent of the cost of treatment, other services, case processing, probation supervision, and parole supervision (measured in subquestions 1.1 to 1.5) is covered by the SACPA allocation?
Page of 168 98

Outcomes (35% level of effort) UCLA will estimate SACPA’s effects on crime, drug use by offenders, and the well-being of offenders and their families during the offenders’ participation in SACPA and for one to two and one-half years after. Our sources will include state administrative databases, covering all 58 counties, and a survey of approximately 2,000 offenders who participate in SACPA in some counties. Outcomes will be compared between these offender groups: (1) SACPA-eligible offenders versus matched offenders from a pre-SACPA period; (2) SACPA-eligible offenders who complete an assessment versus those who do not complete an assessment; (3) SACPA-assessed offenders who enter treatment versus those who do not enter treatment; and (4) offenders who enter and complete SACPA treatment versus those who enter but do not complete it. These comparison groups are described in detail below. Research question 3: What is SACPA’s effect on crime?
Subquestion 3.1: Officially recorded crime. How many arrests for property crimes, violent crimes, and drug crimes (SACPA-eligible or ineligible) are on record for SACPA offenders versus comparison offenders? Subquestion 3.2: Revocations. How many probation and parole revocations are on record for SACPA offenders versus comparison offenders? Subquestion 3.3: Self-reported crime. How many property crimes, violent crimes, and SACPA-ineligible drug crimes are reported by SACPA offenders versus comparison offenders? Subquestion 3.4: Crime trends. How did crime rates change after commencement of SACPA?
Research question 4: What is SACPA’s effect on offender drug use?
Subquestion 4.1: No drug use. What is the rate of drug abstinence for SACPA offenders versus comparison offenders? Subquestion 4.2: Reduced drug use. What change in drug problem severity occurs for SACPA offenders versus comparison offenders?
Research question 5: What is SACPA’s effect on offender employment?
Subquestion 5.1: Employment. What is the employment rate for SACPA offenders versus comparison offenders?
Research question 6: What is SACPA’s effect on offender health and family well-being?
Subquestion 6.1: Reduced medical problems. What change in medical problem severity occurs for SACPA offenders versus comparison offenders?
Page of 168 99
Subquestion 6.2: Reduced mental health problems. What change in mental health problem severity occurs for SACPA offenders versus comparison offenders? Subquestion 6.3: Family. What changes in family well-being occur for SACPA offenders versus comparison offenders?
Implementation (15% level of effort) To describe how offenders move through SACPA and to document innovation in criminal justice and treatment procedures, UCLA is using “pipeline” models; an annual survey of county representatives in all 58 counties; in-depth discussion with representatives in ten focus counties; and observation at meetings, conferences, and other events. Research question 7: How many SACPA-eligible offenders enter and complete treatment?
Subquestion 7.1: Treatment entry. What percent of SACPA-eligible offenders enter treatment, and what are their characteristics? Subquestion 7.2: Treatment completion. What percent of SACPA-eligible offenders complete treatment, and what are their characteristics?
Research question 8: What procedures are used for assessment, placement, and supervision of SACPA offenders?
Subquestion 8.1: Assessment. What assessment instruments and procedures are used to identify service needs and risk levels of SACPA offenders? Subquestion 8.2: Placement. What treatment placement instruments and procedures are used to determine the types of treatment to which SACPA offenders are referred?
Research question 9: How do sectors of the criminal justice and treatment systems respond to SACPA?
Subquestion 9.1: Law enforcement. Do arrest or charging practices change during SACPA? Subquestion 9.2: Offender management. What procedures (such as dedicated court calendars, mental health courts, case management, SACPA-specific urine test protocols, or placement in services for co-occurring disorder or other characteristics) are used in managing SACPA offenders? Subquestion 9.3: Treatment provision. What procedures are used (such as expanding treatment capacity and treatment matching) in the provision of drug abuse treatment to SACPA offenders?
Page of 168 100

Research question 10: What problems occur in implementing SACPA, and how are those problems addressed?
Subquestion 10.1: Counties. What implementation problems occur at the county level, and how are they addressed? Subquestion 10.2: State. What implementation problems occur at the state level, and how are they addressed?
Lessons learned (10% level of effort) To arrive at implications for policy and practice, UCLA will use its annual survey of county representatives in all 58 counties; in-depth discussion groups in ten focus counties; and observation at meetings, conferences, and other events. In particular, Chapter 6 showed that “show” rates varied across counties and were related to offender management strategies employed in the counties. It will be important to track the evolution of these strategies over SACPA’s five-year period and their possible effects on “show” rates. Moreover, because the proportion of offenders entering treatment may affect outcomes significantly, it will be essential to account for “show” rates in the analysis of county-level variability in outcomes. Research question 11: What implementation strategies are associated with SACPA outcomes?
Subquestion 11.1: Counties. What implementation strategies are associated with SACPA outcomes at the county level? Subquestion 11.2: Offenders. What implementation strategies are associated with SACPA outcomes for particular types of offenders?
Stakeholder survey Approximately 400 respondents in all 58 counties were asked to complete the stakeholder survey by mail. The survey along with a cover letter was mailed to the designated primary SACPA contact for each county on August 1, 2002. The survey was re-mailed to nonrespondents on September 20, 2002. Follow-up phone calls were made after each mail-out to ensure that the survey was received and to answer any questions about it. To improve the response rate, UCLA prioritized questions so that counties with limited time and resources could focus on completing portions of the survey regarded as most crucial to the evaluation at this point. Priorities were based on a mix of substantive and methodological considerations. Because the evaluation is currently focusing on offender management strategies and initial perceptions of implementation, questions on those topics were tagged as high-priority. On the other hand, early survey returns indicated that some questions were difficult for counties to answer (e.g., the question was generating a miscellany of write-in answers or was left blank). Those questions were downgraded.
Page of 168 101
The survey recipient was asked to bring in knowledgeable stakeholders in the county to help complete the survey. To facilitate this procedure, UCLA divided the survey into seven detachable sections corresponding to agencies involved in SACPA: the lead agency, county alcohol and drug administration, court administration, district attorney, public defender, probation, and parole. Questions focused on SACPA planning and implementation, operations, and needs of each county; perceived strengths and weaknesses of SACPA in each county; offender management strategies and other responses by the criminal justice and treatment systems; and suggestions for improving SACPA implementation. By February 2003 UCLA had received a completed or partially completed survey from 51 counties, which represent 88% of California’s 58 counties. Reporting counties covered approximately 95.6% of the offender population entering SACPA between July 2001 and June 2002. Individual item response rates were lower in part because stakeholders lacked time or did not have the information readily available. Focus counties UCLA worked with ten “focus counties” to create mechanisms for tracking offenders as they move from SACPA eligibility through assessment, treatment, supervision, and completion. Tracking involves accessing raw data sources on offenders and recruiting samples of offenders for the outcome survey. Selection of focus counties All California counties that expressed interest were considered for inclusion. UCLA joined with ADP in conducting site visits, collating information on possible focus counties, and reviewing that information. From the pool of interested counties, UCLA identified ten (Alameda, Kern, Los Angeles, Mendocino, San Joaquin, San Mateo, Santa Barbara, Santa Clara, Shasta, and Ventura) that, in combination, best met these criteria:
(1) mix of urban and rural counties; (2) broad geographic coverage of the state; (3) capabilities for collecting SACPA-relevant data; and (4) diversity of implementation strategies.
The scope and terms of collaboration with focus counties were tailored to each county and designed to serve both the evaluation’s needs and county-specific purposes. County collaboration is needed in procedural matters, such as facilitating contact with SACPA offenders and accessing automated data. Collaboration is also needed in conducting and interpreting data analysis and arranging focus groups. These topics were covered in discussions with potential focus counties:
(1) informing SACPA offenders about the evaluation and possible later contact; (2) analyzing automated records; (3) accessing, abstracting, and analyzing paper records;
Page of 168 102

(4) participation of agency representatives and other stakeholders in focus groups; (5) factors limiting the county’s ability to collaborate (it might be possible to overcome
some of those factors); (6) county monitoring and evaluation needs and how the collaboration can assist in
meeting those needs; (7) resources or other incentives needed to make collaboration possible; and (8) how to ensure that the evaluation team is in place to conduct as much of the work as
possible (to minimize extra burden on county staff). UCLA developed a set of data elements to be used in tracking. These data elements represent information regarded as most crucial for evaluation purposes and are needed at the offender level. Only with offender-level data will it be possible to link and analyze offender information from multiple sources and distinguish events and outcomes for different types of offenders. Data elements fall into five categories: case processing, conviction, probation/parole supervision, treatment, and outcomes (see Table 7.1). The same list of data elements, sorted by data source, is presented in Appendix F. Elements expected to be available in automated statewide databases are marked with an asterisk in Table 7.1. Elements available only through primary data collection (offender surveys) are marked with a double asterisk. The elements in bold italics are those likely to be found only in raw data sources (court records, probation/parole files, treatment program records, or other county sources). Focus counties have agreed to compile the data and make them accessible to UCLA. Precise definitions of the data elements appear in Table 7.2.
Table 7.1 Data Elements Required for Tracking Eligible Offenders CASE PROCESSING CII number arraignment date name: first, middle, last address phone DOB gender social security number (entire or last four digits only) race/ethnicity primary drug charge(s) by code number charge(s): misdemeanor or felony new case was on probation was on parole has no, one, or two “strikes” if case went to trial, number of trial days completed SACPA completion date case dismissed dismissal date
Page of 168 103

Table 7.1 Data Elements Required for Tracking Eligible Offenders, Cont’d. date of conviction found SACPA-eligible
if no, why (prior record or additional current charges) found eligible only after additional charge(s) dismissed/deferred
if yes, specify charges accepted SACPA appeared for treatment assessment/placement treatment placement (level, tier) PROBATION/PAROLE SUPERVISION for each violation (by code)
violation was counted as first, second, or third SACPA violation reinstated or disqualified if reinstated, whether placement was changed (no or specify new treatment) if disqualified, was offender danger to others, unavailable, refused treatment days supervised
TREATMENT entered treatment*
treatment type* treatment duration* completed treatment* OUTCOMES (FOLLOW-UP PERIODS VARY) completed probation/parole* arrested on new charge (drug, property, violent)* convicted on new charge (drug, property, violent)* incarcerated in state prison* prison days sentenced* prison days served* incarcerated in city/county jail jail days sentenced jail days served committed new offenses (drug, property, violent; arrested or not)** number of crimes or crime days (drug, property, violent; arrested or not)** employment* days worked*,**
welfare received* days on welfare*,** any drug use (self-reported or based on urine test records) by drug type*,** frequency of use by drug type*,**
* Available in existing databases ** To be obtained by primary data collection Available only if counties provide access (bold italics)
Page of 168 104

Table 7.2 Detailed Definition of Data Elements to be Provided by Focus Counties Variable Definition
CII number Criminal Identification and Information number used by the Department of Justice Arraignment date Date offender was arraigned Name First, middle, last name Address Current mailing or residence address (the more addresses, the better) Phone Current phone number DOB Date of birth Gender Male/female Social security number Entire or last four digits only Race/ethnicity Race/ethnicity in most detailed form available (may be split into race as well as Hispanic/non-Hispanic
ethnicity if available) Primary drug Primary drug at treatment admission Charge code Charges by code (e.g., penal code, health & safety code), e.g., possession of a controlled substance might
be indicated as H&S 11053. If charges are not available by code, a text description (e.g. “possession of a controlled substance”) would be next best
Charge level For each charge, misdemeanor, felony, or probation/parole violation Probation/parole/neither At the time of arrest, offender was already on probation, on parole, or neither Has no, one, or two strikes How many strikes the offender had at the time of arrest as defined in P.C. 667.5(c) or 1192.7(c) Date of conviction Date the offender was convicted of the SACPA offense If not eligible, why Ineligible for SACPA due to prior record or additional current charges Charges dismissed for eligibility Yes/no Charges dismissed specified If charges were dismissed/deferred for the sake of eligibility, specify charges dismissed/deferred Accepted SACPA Offender chose to enter SACPA at the time of conviction Appeared for assessment Offender appeared for assessment Appeared for treatment Offender appeared for treatment Treatment placement Level / tier of treatment Case dismissed Court set aside the drug charge as a result of SACPA participation
Page of 168 105

Table 7.2 Detailed Definition of Data Elements to be Provided by Focus Counties, Cont’d. Dismissal date Date of above Completed Court determined that the offender completed SACPA requirements as defined by PC 1210(c) Completion date Date of above Variables below are for each SACPA violation as described in P.C. 1210.1(e). There could be more than one occurrence of each of these variables per offender. Type of violation If violation is a new offense, please indicate code (e.g., penal code #) of the offense that constituted the
violation. If the violation is not a new offense, please indicate what it was (e.g., a violation of a drug-related condition of probation (as defined in PC 1210.1(f) or parole (PC 3063.1(d))
Violation count Violation was counted as first, second, or third violation Reinstated or revoked Offender was reinstated following the violation, or eligibility was revoked as a result of it If reinstated, was the treatment placement changed
No change, moved to level 1, moved to level 2, etc.
If revoked why Offender was (1) a danger to others, (2) unavailable, or (3) refused treatment Incarcerated in city/county jail After being placed on probation for the SACPA offense, offender was sentenced to a jail term upon
conviction for any subsequent offense or for a probation violation Jail days sentenced Number of days the offender was sentenced as a result of a SACPA violation Jail days served Number of days the offender actually served in jail as a result of the subsequent conviction or probation
violation
Page of 168 106

Data access Obtaining access to existing databases can be a lengthy and involved negotiation with agencies that maintain the databases. UCLA has proceeded as rapidly as possible to reach agreements for data sharing. Steps in the procedure were as follows. First it must be ascertained what databases are owned by which agencies and what information will prove useful. Data dictionaries (list of variables and definitions) must be obtained and reviewed. The second step is to develop agreements on data access. Agreements may require review by several parties including the agency’s director, legal team, and data security officer. This step can be complicated by staff turnover, concerns about the confidentiality of data and use of the data, the possible cost involved, and questions on which party is to be responsible for data linkage. Once an agreement has been formalized, the third step is to determine the mechanics of sharing data. Both parties decide the format of the linked data output, how to transmit linked data securely, and the timeline for completing data linkage. It is also necessary to learn about system changes in data collection over time to insure that patterns in the data are not just an artifact of data system changes. It is prudent to start the process of data access as early as possible, as it often requires six months to more than a year to complete negotiations. UCLA has identified the administrative databases required to answer each of the evaluation’s research questions. A crosswalk of databases and research questions appears in Appendix G. UCLA has formalized access to SRIS, CADDS and DATAR databases through ADP. The Department of Justice has granted permission to access its databases and has forwarded an initial extraction of data. The Board of Prison Terms also granted access to its databases and forwarded an initial extraction of data. CalTOP and the Los Angeles County Evaluation System (LACES) data will be accessible with permission of project leaders at ADP and UCLA. (Los Angeles County has granted access to the LACES database.) ADP has supplied county-level data in the SACPA Reporting Information System. In previous projects, UCLA has obtained linked data from the Department of Motor Vehicles and completed interagency agreements for sharing data with the Department of Mental Health. The evaluation team is therefore confident that these arrangements can be re-created for the SACPA evaluation. UCLA is currently engaged in data-sharing discussions with the Office of Statewide Health Planning and Development, the Department of Health Services, the Employment Development Department, and the Department of Social Services. Access to these databases for the SACPA evaluation will depend on cooperation from those agencies. Comparison groups for cost and outcome analyses To answer research questions 1 to 6 regarding cost and outcomes (see above), the evaluation will measure results of SACPA in a “quasi-experimental” approach. This section provides a brief rationale for this approach and describes the comparison groups to be employed. Also described are sampling, data collection, and analysis plans for each comparison.
Page 107 of 159

Quasi-experimental comparison The “gold standard” for program evaluation is experimental comparison, in which potential participants are randomly assigned to a program group (offered an opportunity to participate) or a control group (not offered that opportunity). The unique value of random assignment is that any outcome difference between the program group and the control group can more confidently be attributed to the program and not to unknown dissimilarities in the composition of the groups (e.g., a greater percentage of younger or more motivated people in one group than in the other). If experimental comparison is not feasible, quasi-experimental comparison can be a strong alternative if carefully designed. In quasi-experimental comparison, the program group is drawn from the pool of people who participate or who are eligible to participate. A comparison (control) group is drawn from some other pool, such as persons ineligible for the program for procedural reasons. An example is a comparison group recruited from a geographic area not served by the program. The goal is to assemble a comparison group equivalent to the program group, i.e., to approximate the control group that would have resulted from random assignment. To raise the likelihood of equivalence, the evaluator may be able to match the two groups on sex, age, prior experience, and other background characteristics that may affect program outcomes. An experimental design is not feasible in the SACPA evaluation because it is impossible to randomize offenders to SACPA or a non-SACPA control group. Randomization would entail denying or delaying participation to offenders who are legally entitled to participate and who wish to do so. The SACPA evaluation will instead employ a set of four quasi-experimental comparisons. Such comparisons have been shown to estimate program outcomes similar in magnitude to those estimated in experimental evaluations if the program and comparison groups are carefully matched and if it is possible to adjust for self-selection of individuals into the groups and other sources of bias (Shadish and Ragsdale, 1996; Weisburd et al., 2001). Sampling, data collection, and analysis plans for the SACPA evaluation have been designed to meet these needs. Comparison groups The evaluation will employ four pairs of comparison groups:
(1) SACPA-eligible offenders versus matched offenders from a pre-SACPA period; (2) SACPA-eligible offenders who complete an assessment versus those who do not
complete an assessment; (3) SACPA-assessed offenders who enter treatment versus those who do not enter
treatment; and (4) offenders who enter and complete SACPA treatment versus those who enter but do not
complete it. The first comparison—SACPA-eligible offenders versus matched pre-SACPA offenders—is the most crucial. The SACPA group in this comparison is defined as offenders who are
Page 108 of 159

SACPA-eligible, rather than those who actually participate in SACPA, because costs and outcomes for offenders who choose to participate may not accurately represent costs and outcomes in the overall group of offenders who commit SACPA-eligible crimes. Moreover, the decision to participate in SACPA may be influenced by the availability of alternative dispositions such as drug court and diversion. Pre-SACPA offenders had no such decision to make, of course, and alternative dispositions for drug offenders now may not have been equally available in the pre-SACPA era. Thus an analysis based on SACPA-era offenders who are eligible for SACPA and pre-SACPA offenders who would have been eligible will provide the strongest possible evidence regarding SACPA’s costs and outcomes. In effect the analysis will ask: what costs and outcomes would have occurred among SACPA-era drug offenders if SACPA had not existed? The follow-up period in this comparison will be 30 months. One problem is that some pre-SACPA offenders were sentenced to prison, whereas others were sentenced to short jail terms or probation. The period “at risk” (i.e., time during which they might commit additional crimes in the community) will therefore vary widely and on average will be shorter for pre-SACPA offenders than for SACPA offenders, who are sentenced to probation and treatment in the community. An additional problem is that “secular trends” (changes in the contextual factors affecting crime or changes in criminal justice policy) could affect the findings. The analysis plan addresses these problems (see below). Additional comparisons will add depth to the analysis. A comparison of SACPA-eligible offenders who complete an assessment versus those who do not will answer this analytic question: what costs and outcomes occurred among drug offenders who opted for SACPA and those who could have opted for SACPA but did not? The follow-up period for this comparison will be 12 months. SACPA-eligible offenders who complete their assessment will include those who do and those who do not go on to participate in SACPA. Offenders who are SACPA-eligible but do not complete an assessment will include those who opted for dispositions such as drug court or routine processing, i.e., they will represent a non-SACPA group of drug offenders coming through the criminal justice system during the SACPA era. The comparison is useful because it eliminates the possibility that “secular trends” might impact the findings. However, it is subject to bias arising from offender self-selection into the SACPA and non-SACPA groups. The remaining two comparisons—SACPA offenders who enter treatment versus those who do not, and offenders who complete treatment versus those who do not—will show results of SACPA among offenders who actually participated in it. The analytic question here is: what costs and outcomes occurred among drug offenders who received the full planned “dose” of SACPA (i.e., those who completed treatment) and among those who had at least some treatment exposure (i.e., those who entered)? The follow-up period for each of these comparisons will be 12 months. Results for offenders who complete treatment may indicate a possible upper limit of SACPA effectiveness—how well does SACPA work when offenders step through the program as intended. The disadvantage of these comparisons is that they could be biased arising from
Page 109 of 159

self-selection. Drug offenders do not enter treatment at random and do not complete treatment at random. They enter and complete treatment because they are well motivated and/or because their life circumstances and experience in treatment are conducive to success. Steps to be taken to address self-selection bias are explained below. If resources permit, the evaluation will include a fifth comparison, namely, a statewide (rather than ten-county) comparison of SACPA offenders who complete treatment versus those who do not. CADDS can be used to identify both groups of offenders. Outcome measures would be limited to those available in administrative databases. Figure 7.1 shows each SACPA comparison group and timeline. SACPA versus pre-SACPA comparison Sampling The first comparison—SACPA-eligible offenders versus matched pre-SACPA offenders—requires retrospective sampling of a pre-SACPA group from the population convicted of SACPA-eligible crimes before SACPA began in July 2001. One approach is to sample offenders from the population convicted in a time-window between July 1999 and December 2000. This pre-SACPA period is far enough removed from the SACPA era (by a period of six months) to rule out the possible influence of criminal justice policy changes occurring in anticipation of SACPA. On the other hand, a pre-SACPA period ending in December 2000 is still reasonably close to the SACPA era, thus reducing the possibility that secular trends might affect findings. The disadvantage of this approach is that the follow-up period overlaps with the SACPA era. An alternative approach is to set the time-window for sampling between January 1997 and June 1998. The 30-month follow-up period would end in December 2000, i.e., just in time to avoid any criminal justice policy changes occurring in anticipation of SACPA. The disadvantage of this alternative is that it places the pre-SACPA and SACPA groups at greater remove and thus raises the likelihood that secular trends might affect the findings. On balance, a pre-SACPA group from the period between January 1997 and June 1998 is preferable. This is primarily because the follow-up period for these offenders will end six months before SACPA began. Because the average time served by drug possession offenders sentenced to prison in California is 16-18 months, pre-SACPA offenders who were imprisoned will have a post-prison “at risk” period of about 12-14 months on average, given a total post-conviction follow-up period ending at 30 months (see next paragraph). Pre-SACPA offenders sentenced to probation, on the other hand, will have been “at risk” for the full 30 months unless they later spend time in custody. Pre-SACPA offenders sentenced to short jail terms (with or without probation after release) will have been “at risk” for a period shorter than 30 months but generally longer than 12. This sampling plan means that there will be some “at risk” time in which any pre-SACPA offender might recidivate, even those sentenced to prison upon conviction.
Page 110 of 159

Page 111 of 159
Figure 7.1 Tim line for Outcome and Cost Analyses
Jul 01
Jul 02
Jul 03
Jul 04
Jul 05
Jul 06
1 2 3 4 5 SACPA
Year
Jul 01
Jul 02
Dec 03
Sep Dec Jul 04 04 05
Eligible offenders enter SACPA
5 year low-up
Data acquisition and
analysis
First draft
Reporting
SACPA Cohort 1 (administrative data)
Jul 01
Jul 02
Dec 03
Dec 04
Sep 05
Dec Jul 05 06
Eligible offenders enter SACPA 2.5 year follow-up Data acquisition and
analysis First draft
Reporting
SACPA Cohort 1 (administrative data)
Jul 02
Jul 03
Dec 04
Sep05
Dec Jul 05 06
SACPA Cohort 2 (administrative data)
Eligible offe rs
enter SA 1.5 year follow-up Data acquisition andanalysis First draft Reporting
Dec04
ll
Sep Dec Jul 05 05 06
Jan 03
Dec 03
SACPA Sample 1 (self-report data)
Eligible offenders enter SACPA 1 year follow-up Data analysis First draft Reporting
ndeCPA
1.fol
e

Why cap the follow-up period at 30 months? The draft analysis of SACPA cost and outcomes will be due in December 2005. If the SACPA group is defined as offenders entering SACPA in its first year, i.e., in or before June 2002, a post-conviction follow-up period of 30 months “runs the clock” to December 2004. A few additional months will have to be allowed for administrative datasets to be brought current by the state agencies maintaining those datasets. Then UCLA will need time to assemble, analyze, and report the relevant data by December 2005. The first year of SACPA offenders is herein called “cohort 1.” Offenders entering SACPA during its second year (“cohort 2”) will also be included. The post-conviction follow-up period for those offenders will be only 18 months, given the deadline for final analysis. (This period can be extended for a three to four additional months if the analysis indicates that a longer period is worthwhile and if resources are available.) Cohort 2 has limited value for the comparison to pre-SACPA offenders because the follow-up period for cohort 2 is one year shorter. However, cohort 2 will enable the evaluators to see if program outcomes (measured as pre-post change) in cohort 2 are similar to those seen across a 18-month follow-up period in cohort 1.
Pre-SACPA offenders who would have been eligible for SACPA can be sampled in more than one way. The simplest approach is to take offenders whose conviction was for any crime that is now SACPA-eligible and who had no concurrent conviction or prior record that would make them ineligible for SACPA. However, as shown in Chapter 4, counties vary somewhat in the types of crime regarded as SACPA-eligible. Accordingly, the pre-SACPA and SACPA groups may not be comparable unless pre-SACPA offenders are first classified according to the crime for which they were convicted and then sampled to ensure an equal proportion of each crime in both groups. It will also be necessary to account for appellate court decisions affecting eligibility of particular offenses, e.g., driving under the influence. Finally, in addition to matching on crime type, the sampling plan also calls for matching pre-SACPA and SACPA offenders on race/ethnicity, sex, age, and criminal history. This will improve comparability between the groups and enable us to adjust for offender characteristics that might influence their behavior in or after SACPA. In summary, the sampling considerations for the SACPA group (cohort 1) and pre-SACPA group are designed to allow the longest follow-up period possible within the overall evaluation timeline, to eliminate any chance that criminal justice processing for offenders in the pre-SACPA group might have been affected by policy changes occurring in anticipation of SACPA, and to address the possibility that the comparison might be confounded by secular change. Most important, it is essential to be able to measure post-prison recidivism (out to roughly one year) for pre-SACPA offenders sentenced to prison upon conviction. Alternative sampling plans could have resulted in shorter follow-up periods in which pre-SACPA offenders sentenced to prison would have had little or no “at risk” time, i.e., recidivism among them would artificially have been zero. Similar designs have been employed successfully in criminal justice evaluations; see, for example, a RAND study comparing outcomes among California offenders sentenced to prison versus those placed on probation (Petersilia et al., 1986).
Page 112 of 168

It is important to emphasize that this plan matches SACPA and pre-SACPA offenders on crimes for which they were convicted, not the crimes for which they were arrested or charged. Offenders in both the pre-SACPA and SACPA groups may have been arrested or charged with crimes that are not SACPA-eligible, such as drug sales or trafficking. Those offenders, if allowed to plead guilty to a lesser crime such as drug possession or transporting drugs for personal use, are accordingly SACPA-eligible. However, in the years before SACPA, district attorneys may have been more willing to accept a guilty plea to a lesser crime because the drug-dealing offender convicted of possession would still face a period of incarceration. In the SACPA era, offenders arrested for drug dealing but convicted of possession (or another SACPA-eligible crime) do not face incarceration. District attorneys may therefore be less willing to accept guilty pleas from such offenders. Matching on conviction ignores these pre-conviction events and judgments. On the other hand, matching the two groups on arrest or charge would not ensure a closer comparison inasmuch as arrest and/or charging practices may also have changed; see Chapter 4. More important, a group of SACPA offenders sampled on the basis of arrest or charge, rather than on the basis of SACPA-eligible conviction, might include many offenders who decided not to participate in SACPA or who were never offered that option. The pre-SACPA group will include some offenders who were sentenced to prison and who, upon release, became parolees. The SACPA group will include offenders entering SACPA while on parole, even though this makes data acquisition and analysis more complicated. Data collection The SACPA versus pre-SACPA comparison will be based on administrative data obtained from the Department of Justice, Department of Social Services, and other state agencies. The Department of Justice has supplied data by which UCLA will draw the pre-SACPA comparison group. Data elements include current conviction, criminal history, age, sex, and race/ethnicity. UCLA will obtain the same data elements for the first-year population of SACPA offenders. A group of pre-SACPA offenders, matched to SACPA offenders on the basis of these data elements, will then be drawn. After the end of each group’s follow-up period, UCLA will obtain administrative data by which to measure pre- and post-conviction crime, employment, use of health services, other events, and their associated costs. Analysis The evaluation will use multivariate regression techniques by which program outcomes are estimated before and after adjustment for between-group background differences that might persist despite the matching of SACPA and pre-SACPA offenders. Variables used to capture such differences are called covariates. An additional advantage of covariates is that they enable the evaluator to determine whether program outcomes are related to offender characteristics such as age, criminal history, and prior use of health care. In other words, was the program more (or less) effective with particular types of offenders? The analysis
Page 113 of 168

will first be run with no adjustment for in offenders’ “at risk” period during follow-up. It will be repeated with that adjustment. SACPA-eligible comparison Sampling The evaluation will seek to identify all offenders eligible for SACPA between July 2001 and June 2004 in ten focus counties (described elsewhere in this chapter). Each county has agreed to provide records by which to identify offenders deemed SACPA-eligible. The evaluation team will consult the county’s SACPA assessment rosters to identify eligible offenders who did and did not complete an assessment. Based on the first year’s pipeline analysis (see Chapter 2), the team expects 80-85% of the ten-county pool of eligible offenders to have completed an assessment. Offenders in the ten focus counties will not be representative of the state’s entire SACPA population in any formal sense. However, the ten counties were chosen to provide diversity by region and population density, and roughly half of all SACPA offenders in California reside in these ten counties. Accordingly, although a sample drawn from ten counties does not provide statewide data, it can be used for a persuasive comparison of SACPA offenders who did and did not complete the assessment. Data collection Administrative data will be obtained from the focus counties as well as the Department of Justice, Department of Social Services, and other state agencies. To maintain a comparable follow-up period for each year’s offenders, administrative data will be used to cover a 12-month period before and after conviction for each offender. Analysis The evaluation will use multivariate regression techniques by which program outcomes are estimated before and after adjustment for possible background differences between SACPA-eligible offenders who completed an assessment and those who did not. As explained above, variables used to capture such differences are called covariates. The analysis will determine whether outcomes are related to offender characteristics such as age, criminal history, and prior use of health care. The analysis will first make no adjustment for offenders’ “at risk” period during follow-up and will then be repeated with that adjustment. SACPA-assessed comparisons Sampling The final two comparisons will be based on a sample of offenders entering SACPA during 2003 in the ten focus counties. Each county has agreed to provide records by which to
Page 114 of 168

identify offenders who completed a SACPA assessment in 2003 and to provide a copy of offender data collected at assessment. Provision of some records and data is contingent on the voluntary consent of offenders. The evaluation team will consult administrative data to identify offenders who subsequently did or did not enter treatment and those who did or did not complete it. Based on the first year’s pipeline analysis (see Chapter 2), the team expects about 80% of the ten-county pool of assessed offenders to have entered treatment. No estimate is available at this time for the percent of SACPA offenders likely to complete treatment, and completion rates have varied widely in prior studies of drug-using offenders in treatment (Marlowe, 2002). Completion rates found in evaluations of drug court—about 50% on average (Belenko, 2001)—may represent a likely upper bound. In 2004, UCLA will contact a random sample of 2,000 offenders from the pool of those who completed an assessment during 2003 and who agreed to be contacted by UCLA for this purpose. The goal will be 200 offenders per county and will be raised to 250-400 offenders in larger counties if resources permit. If 20% of offenders will not be reachable or decline to participate when reached, the offender pool from each county must be at least 250. In fact, the pool will far exceed that number in each county except one, for which a county-specific offender rostering procedure has been set up. Any sampled offender who decides not to participate will be replaced. UCLA will scan the pool of offenders within the same county and randomly select a replacement matched as closely as possible to the original offender. Offenders incarcerated at follow-up may be difficult to contact and interview, but they will not be replaced until the evaluation has explored all feasible ways of completing their follow-up (e.g., a brief in-person interview covering the most essential questions). Because parolees referred to SACPA by their parole agents will be among the pool of offenders assessed, these comparisons will include parolees. Sampling will not be stratified to ensure any pre-set proportion of parolees in the sample, however. Doing so would compromise statistical power (see below). For the same reason, sampling will not be stratified by any other offender background characteristic or by treatment program or modality. Finally, as noted above, the focus counties are not representative of the entire state in any formal sense. A sample drawn from offenders in only one SACPA year may, moreover, be atypical of offenders seen in those ten counties throughout SACPA’s five-year period. On the other hand, it bears repeating that focus counties were chosen for diversity and that roughly half of the state’s SACPA offenders reside in these counties. It should also be noted that sampling offenders in 2003 (i.e., SACPA’s third year) allows SACPA to have “matured” as a program and is nonetheless early enough to allow completion of follow-ups (in 2004) and analysis in time to meet the evaluation’s reporting deadline. On balance, then, a sample drawn from ten counties does not provide statewide data but can be used to compare SACPA clients who had varying exposure to treatment. Data collection Survey data will be collected on offenders’ drug use, criminal activity, family functioning, use of health services, and other events during the 12 months since their SACPA conviction. Administrative data will be used to supplement information on health care. Administrative
Page 115 of 168

data will also be used to measure recent criminal activity (new conviction or incarceration), but such data may seriously underestimate the extent of criminal activity and will entirely miss the commission of new crimes for which an offender is not actually arrested or convicted during the first 12 months; hence the need for self-report survey data on criminal activity. The exact content of follow-up data collection will closely parallel the data collected by counties at assessment, so that those data can serve as each offender’s baseline in the analysis. Data collection will occur by telephone interview in nine counties and by personal interview in one county. Evaluation resources cannot cover the expense of conducting personal interviews in all ten counties. However, it is important to obtain urine specimens, which can be analyzed to detect recent use of particular drug types (e.g., opiates, cocaine, marijuana, and methamphetamine). Obtaining urine specimens will of course require face-to-face contact with offenders. By cross-checking urine test results with offender self-reports of recent drug use, the evaluation will be able to gauge the extent to which findings might be affected by offender misreporting. Analysis The evaluation will use multivariate regression techniques by which program outcomes are estimated before and after adjustment for possible background differences between SACPA-assessed offenders who do and do not enter treatment and those who do and do not complete it. As explained above, variables used to capture such differences are called covariates. The analysis will also determine whether outcomes are related to offender characteristics such as age, criminal history, and prior use of health care. Because SACPA assessment data will be employed as baseline measures and primary data will be collected from offenders at follow-up, the range of background covariates available for analysis will be far more extensive for these comparisons than for the other two. For example, characteristics of the offender’s drug use history, family history, and current drug problem severity can be included. Also, covariates measuring SACPA “dose” (e.g., treatment modality, duration, services received, aftercare received, and intensity of probation/parole supervision) will be tested. Predictors representing SACPA will include “entered treatment” and “completed treatment” (“did not enter treatment” will be the reference category) so that analysis can be based on the entire sample. The analysis will be run with and without adjustment for offenders’ “at risk” period during follow-up. Data supplied by counties will be analyzed to identify differences, if any, between (1) offenders who agree to be contacted by UCLA and those who do not, and (2) offenders who agree to participate in the study when contacted and those who do not. It will be important to adjust for any such differences in the analysis. Statistical power Because these two comparisons will be based on offender samples, statistical power is a consideration. Statistical power in this context is the probability of seeing a difference in program outcome, given the magnitude of the difference and the size of the sample. Power can range from 0% (no chance of detecting the difference, even though it exists) to 100%
Page 116 of 168

(guaranteed to see it). For example, if a study has 80% power and if the hypothesized program outcome does occur, the study will have a high probability (80%) of correctly confirming the hypothesis. Statistical power is related to factors including the magnitude of the outcome to be detected (the “effect size”), the type of analysis employed, data characteristics (e.g., clustering), and the sample size. Sample size is typically the factor most easily controlled by the researcher, and it has a major impact on study costs. Therefore, calculation of an appropriate sample size is often the primary focus of power analysis. The evaluation team has completed an analysis of statistical power for the two comparisons based on a sample of 2,000 SACPA offenders. (Power is not a limiting factor in the two other comparisons, which will be based on several thousand offenders.) Assumed effect sizes for two program outcomes—abstinence from drug use and no criminal recidivism—were drawn from a review of drug abuse treatment evaluations by Prendergast et al. (2002). These assumptions are that 58% of offenders completing treatment and 42% of offenders entering but not completing treatment will be drug-abstinent at the one-year follow-up, whereas 54% of the former group and 46% of the latter will report no criminal involvement in that same timeframe. These assumed effect sizes are not large, but neither are they trivial. The 16-point difference in assumed drug use outcomes represents a 38% improvement for treatment completers in relation to noncompleters.9 The analysis will employ multivariate regression techniques appropriate for clustered data. As indicated above, the analysis will include covariates to adjust for offender background and SACPA “dose” characteristics that may be related to the offender’s progress through SACPA. The inclusion of such covariates into regression analyses often improves power to detect program effects. Two data characteristics need to be considered: clustering and nonresponse. Offenders in this sample will be clustered both by county and by program. Analysis results can be highly misleading if clustering of sample members is not taken into account. In this estimate of statistical power, a conservative (relatively high) degree of clustering was assumed: .07 at the program level and .02 at the county level. Finally, it is prudent to allow for some degree of missing data, i.e., questions that some offenders are unable or unwilling to answer. Here a 10% missing-data rate was assumed. The sample of 2,000 offenders will afford 80% power to detect the assumed effect size for drug use. However, the assumed effect size for crime was smaller, and power is only 29%. Power may be substantially better if the effect size for crime turns out to be greater than assumed here.
9 16/42 = .38.
Page 117 of 168

Page 118 of 168

Glossary Accountability-treatment approach – Collaboration to ensure that the appropriate levels of treatment and supervision are provided to create a synergistic impact on recovery. Activity report – A report that indicates that the parolee has agreed to participate in and complete treatment, identifies the county assessment center to which the parolee was ordered to report, and indicates the parole unit supervisor’s recommendation regarding action taken on the parole violation and referral to the Board of Prison Terms for approval. Addiction Severity Index (ASI) – A standardized assessment designed to gather data on treatment client status in seven domains: drug use, alcohol use, employment, family and social relationships, legal status, psychiatric status, and medical status. American Society of Addiction Medicine Patient Placement Criteria (ASAM PPC) – A standardized assessment designed to guide treatment providers in determining the level of care needed for each client. At-risk period –Time period when criminal recidivism may occur. Beck Depression Inventory – A scale used to measure indicators of depression. Board of Prison Terms (BPT) – The agency that protects and preserves public safety through the exercise of its statutory authorities and policies, while ensuring due process to all criminal offenders who come under the Board's jurisdiction. The Board is responsible for the adjudication of parole violations referred by the Parole and Community Services Division of the California Department of Corrections. This agency developed the initial procedure for referring and monitoring parolees during SACPA’s first year. Case study – In-depth analysis of a single entity, such as a person or county, not intended to be representative of any overall group. Covariate – A characteristic used to control statistically for differences among groups being compared. Drug court – Courts that handle drug-using offenders in an approach emphasizing treatment and close supervision; direct contact between judge and offender; and collaboration between judge, prosecutor, defense attorney, and treatment provider. Drug court approach – Processing SACPA offenders through a court having all or some features of a drug court. Effect size - The magnitude of the outcome to be detected. Experimental comparison – Comparison of outcomes for offenders randomly assigned to program or control group.
Page 119 of 168

Focus groups – A semi-structured in-depth discussion held to collect information on a particular topic. Medical model – A recovery approach emphasizing addiction as a disease best treated by medical and psychological professionals. Multivariate regression techniques – Analyses predicting a continuous or dichotomous outcome from the information provided from two or more predictors. Parole and Community Services Division (P&CSD) of the California Department of Corrections – The agency providing field supervision of California parolees. Proposition 36 Waiver Form - Specifies terms of the referral from parole to treatment and provides the parolee with the option to waive his or her right to a parole revocation hearing, to refuse to waive a parole revocation hearing, or to refuse participation in SACPA. Quasi-experimental comparison - Comparison of outcomes for offender groups when no random assignment was conducted. Statistical power - The probability of seeing a difference in outcome, given the magnitude of the difference and the size of the sample. Substance Abuse Subtle Screening Inventory (SASSI) - A psychological screening measure that helps to identify individuals who have a high probability of a substance use disorder. Therapeutic justice approach – Emphasis on use of the law as a tool for helping offenders overcome legal and other problems as well as enforcing compliance (e.g., alcohol and drug abstinence, participation in 12-step and job training).
Page 120 of 168

Appendices
A. Alternative pipeline analyses B. County plan analysis C. SACPA-eligible offenses D. Arrest practices: Data sources and method E. Focus group report: Executive summary F. Data elements by source G. Administrative databases
Page 121 of 168

Page 122 of 168

Appendix A. Alternative Pipeline Analyses The pipeline analysis in Chapter 2 was based on data submitted to the SACPA Reporting Information System (SRIS) by all 58 counties. Although SRIS data for some counties were not internally consistent and/or not in accord with stakeholder survey data, it was not possible to resolve those discrepancies. UCLA therefore chose to maximize the number of counties covered in the pipeline analysis; no county was excluded. This appendix reports an alternative analysis based only on those counties for which SRIS data were both internally consistent and in accord with stakeholder survey data. For the pipeline analysis in Chapter 2, it was assumed that SRIS includes parolees referred to SACPA by the courts upon conviction for a new offense but may not include all parolees referred to SACPA by the Board of Prison Terms (BPT). UCLA obtained data on the latter group of parolees from automated records maintained by BPT and the Parole and Community Services Division of the California Department of Corrections.10 To account for these parolees in the SACPA pipeline, UCLA ran an alternative analysis for which it was assumed that none of them was also counted in SRIS data and that adjustments for offenders recycling through SACPA, offenders transferring between programs, and offenders entering SACPA late in the year applied both to offenders entering SACPA through the courts and those entering SACPA through BPT. Those assumptions were not necessary for the pipeline analysis reported in Chapter 2. The purpose of each alternative analysis was to determine whether Chapter 2’s conclusions regarding the first-year SACPA pipeline would be different if the analysis had been (1) based only on counties with “clean data” or (2) had included parolees referred to SACPA by BPT. This appendix reports conclusions from these two alternative analyses. Data adjustments employed for the primary analysis in Chapter 2 and for the two alternative analyses are also explained. Pipeline using “clean data” There were 13 counties with SRIS data that were both internally consistent and in accord with stakeholder survey data. Criteria for identifying those counties are explained below. (1) If SRIS data for a county indicated that 100% of offenders referred to SACPA were
assessed but the county’s stakeholder survey data indicated that the assessment “show” rate was a problem, that county was excluded unless the county plan indicated that assessments were conducted prior to referral rather than after.
(2) If SRIS data for a county indicated that 100% of assessed offenders were placed in treatment but the county’s stakeholder survey data indicated that the treatment “show” rate was a problem, that county was excluded unless the county plan indicated that treatment placement occurred prior to assessment rather than after.
10 Laverne Low-Nakashima of the Board of Prison Terms provided analyses of data drawn from those records.
Page 123 of 168

(3) If SRIS data for a county showed that 0% of offenders referred to SACPA were assessed or that 0% of assessed offenders were placed in treatment, that county was excluded.
(4) If a county did not provide an estimate of the number of offenders eligible for SACPA on the stakeholder survey, that county was excluded.
(5) If the county plan did not indicate the order in which referral, assessment, and placement occurred, the county was excluded.
Eligible offenders The stakeholder survey asked counties to specify the number of offenders eligible for SACPA in its first year. The total number of eligible offenders in the 13 “clean data” counties was 24,543. That number appears in the pipeline shown in Figure A.1.
Figure A.1 SACPA Offender Pipeline, 13 Counties with “Clean” Data, July 2001 to June 2002
Eligible Referred Assessed Placed in treatment in court (Step 1) (Step 2) (Step 3) Yes 14,125 Yes 18,050 Yes 21,215 No 3,925 24,543 No 3,165 No 3,328 Source Stakeholder SRIS SRIS SRIS survey referral assessment placement Percent n/a 86.4% were 85.1% 78.3% entered referred were assessed treatment The overall percent of referrals reaching treatment was 66.6% in the 13 counties.
Offenders referred SRIS asked counties to report the number of offenders referred to SACPA, i.e., how many eligible offenders chose SACPA and were referred for assessment? The number of referrals in the 13 “clean data” counties was 22,521. However, some counties may have been reporting the number of referrals, while others may have been reporting the number of offenders referred. Any offender who recycled through SACPA during its first year would
Page 124 of 168

have been counted twice in the number of referrals but only once in the number of offenders. Hence the raw total in SRIS may be too high. (The same problem affects interpretation of SRIS data on assessments and treatment placements; see below.) For an estimate of the number of offenders referred to SACPA, UCLA reduced the 13-county SRIS number of referrals by 5.8%. This percent is based on an analysis of CADDS data showing how many SACPA offenders recycled through treatment during the year. Thus, the estimated 13-county total of offenders referred to SACPA is 21,215.11 That estimate is step 1 in the pipeline shown in Figure A.1. A combination of the estimates for number of eligible offenders and number of offenders referred indicates that 86.4% of eligible offenders in the 13 counties chose SACPA and, unless held for additional charges or administrative reasons, were referred for assessment. The other 13.6% may have entered drug court or may have opted for routine criminal justice processing. Offenders assessed SRIS also asked counties to report the number of offenders who completed a SACPA assessment. For the 13 “clean data” counties combined, that number is 19,005. However, some counties may have been reporting the number of assessments completed, while others may have been reporting the number of offenders assessed. Any offender who recycled through SACPA during its first year would have been counted twice in the number of assessments. The raw total in SRIS may therefore be too high. On the other hand, offenders who were referred to SACPA very late in the year may actually have been assessed, but not in time to be counted in the yearly assessment totals reported to SRIS. To estimate the number of offenders assessed, UCLA reduced the number of referrals by 5.8% to account for recycling. This percent is based on an analysis of CADDS data showing how many SACPA offenders recycled through treatment during the year. The adjusted total was then increased by 0.82% to account for lagged assessments late in the year. The estimated total of offenders who completed a SACPA assessment is 18,050.12 That estimate is step 2 in the pipeline shown in Figure A.1. Offenders placed in treatment Finally, SRIS asked counties to report the number of SACPA offenders placed in treatment. For all 13 “clean data” counties combined, that number is 15,671. Some counties may have been reporting the number of offenders placed, but others may have been reporting the number of placements. Any offender who recycled through SACPA during its first year would have been counted twice in the number of placements. In addition, any offender who received treatment at two or more programs during the same SACPA episode may have been counted two or more times in the number of placements. The raw total in SRIS may be too high for these reasons. However, offenders assessed very late in the year may actually have been placed in treatment, but not in time to be counted in the yearly placement totals reported to SRIS. To estimate the number of offenders assessed, UCLA reduced the number of 11 22,521 – (.058 x 22,521) = 21,215. 12 19,005 – (.058 x 19,005) = 17,903. 17,903 + (0.0082 x 17,903) = 18,050.
Page 125 of 168

referrals by 5.8% to account for recycling and by 4.8% to account for multiple treatment placements. These percents are based on CADDS data showing how many SACPA offenders recycled through treatment during the year and how many program transfers occurred for SACPA offenders already in treatment. The adjusted total was then increased by 0.82% to account for lagged placements late in the year. The estimated 13-county total of SACPA offenders placed in treatment is 14,125.13 That estimate is step 3 in the pipeline shown in Figure A.1.
Pipeline including all parolees Eligible offenders The estimated statewide total of offenders found eligible for SACPA in court was 53,697. This total included offenders currently on probation or parole for prior offenses as well as new offenders. UCLA’s analysis of parolee data indicated that 4,060 parolees were deemed eligible by BPT and referred to SACPA. The statewide number of eligible offenders, including those parolees, is 57,757, as shown in Figure A.2.
Figure A.2 SACPA Offender Pipeline Including Board of Prison Terms Referrals, July 2001 to June 2002
Eligible Referred Assessed Placed in treatment
(Step 1) (Step 2) (Step 3) Yes 30,469 Yes 37,495 Yes 48,103 No 7,026 57,757 No 10,608 No 9,654 Source Stakeholder SRIS SRIS SRIS survey “referral” “assessment” “placement” Percent n/a 83.3% were 77.9% 81.3% entered referred were assessed treatment The overall percent of referrals reaching treatment was 63.3%.
1315,671 – (.058 x 15,671) – (.048 x 15,671) = 14,010. 14,010 + (0.0082 x 14,010) = 14,125.
Page 126 of 168

Offenders referred The estimated statewide number of offenders referred to SACPA by the courts was 44,043, as indicated in Chapter 2. To arrive at a statewide number augmented by BPT referrals, it was assumed that all 4,060 parolees deemed eligible by BPT were in fact referred. The augmented statewide number of offenders referred is 48,103, as shown in Figure A.2. Offenders assessed The estimated statewide number of offenders assessed was 37,495, as indicated in Chapter 2. Parolees referred to SACPA by BPT were instructed to report to the county’s SACPA assessment center. UCLA assumed that those parolees were included in each county’s assessment total submitted to SRIS. UCLA also assumed that adjustments for offenders recycling through SACPA and offenders entering SACPA late in the year applied equally to offenders entering SACPA through the courts and those entering SACPA through parole-agent referrals. Thus, the statewide estimate from Chapter 2 was carried into Figure A.2 at step 2. Offenders placed in treatment The estimated statewide number of offenders assessed was 30,469, as indicated in Chapter 2. Because BPT-referred parolees were to report to the county’s SACPA assessment center, not directly to treatment, UCLA assumed that those parolees were included in each county’s treatment placement total submitted to SRIS. UCLA also assumed that adjustments for offenders recycling through SACPA, offenders transferring between programs, and offenders entering SACPA late in the year applied equally to offenders entering SACPA through the courts and those entering SACPA through parole-agent referrals. Thus, the statewide estimate from Chapter 2 was carried into Figure A.2 at step 3. Chapter 2’s conclusions revisited The purpose of these alternative analyses was to determine whether the conclusions in Chapter 2 would be different if the analysis had been based only on counties with “clean data” or had included parolees referred to SACPA by the Board of Prison Terms. Findings from all analyses led to very similar conclusions. Chapter 2 reported that 69.2% of offenders referred to SACPA went on to enter treatment. Alternative analyses indicated that 63.3% to 66.7% of offenders referred to SACPA went on to enter treatment. Because BPT referrals comprised only 8.4% of all offenders referred to SACPA in the first year, it was to be expected that the alternative analysis including BPT referrals would have no substantial impact on Chapter 2’s conclusions. The analysis based on 13 counties with “clean data” might well have led to conclusions different from the analysis of all 58 counties, but it did not. Conclusions in Chapter 2 therefore appear to be quite robust.
Page 127 of 168

Adjustments The analysis in Chapter 2 and the two alternative analyses included adjustments to SRIS data. These adjustments covered offenders recycling through SACPA, offenders transferring between programs, and offenders entering SACPA late in the year. The basis for each adjustment is explained below. Recycling of offenders In data submitted to SRIS, some counties may have counted the number of events, i.e, the number of referrals, assessments, and treatment placements. Other counties may have reported the number of offenders who completed each of these steps. Any offender who recycled through SACPA during its first year would have been counted more than once in the number of events but only once in the number of offenders. UCLA adjusted the SRIS data accordingly. The adjustment was based on an analysis of CADDS data showing that 11.6% of SACPA treatment admissions were attributable to offenders recycling through SACPA, i.e., entering a new episode of treatment subsequent to the first. If recycling offenders were included in SRIS data submitted by all counties, then the number of offenders completing each step would be 11.6% lower than the raw total in SRIS. However, while some county representatives have said that they did not include recycling offenders in their SRIS data, no information is available to indicate which of the 58 counties did and did not do so. UCLA therefore adopted a midrange estimate of 5.8% (i.e., 11.6 / 2) to adjust for offenders who recycled through SACPA. Transferring offenders Any offender who transferred (e.g., moved from outpatient to residential treatment) within the same episode might have been counted more than once in the number of placements but only once in the number of offenders placed. UCLA adjusted the SRIS data on treatment placements by calculating the percent of SACPA offenders who transferred within the same episode during SACPA’s first year. That percent was 9.6%. If transferring offenders were included in SRIS data submitted by all counties, then the number of offenders entering treatment would be 9.6% lower than the raw total in SRIS. However, while some county representatives have said that they did not include transferring offenders in their SRIS data, no information is available to indicate which of the 58 counties did and did not do so. UCLA therefore adopted a midrange estimate of 4.8% (i.e., 9.6 / 2) to adjust for offenders who transferred within the same episode. Offenders entering SACPA late in the year Offenders referred to SACPA late in the first year may not have had time to complete their assessment or enter treatment during the year. The estimated number of offenders assessed and placed during the year may therefore slightly undercount the actual number of that year’s offenders who were assessed and placed. UCLA assumed that seven days is the applicable
Page 128 of 168

period. This assumption was based on Penal Code 1210.1, which specifies: “Within seven days of an order imposing probation under subdivision (a), the probation department shall notify the drug treatment provider designated to provide drug treatment….” It was also assumed that assessments occurred at a constant rate across the seven days and that placements occurred at a constant rate across the seven days. Accordingly, estimates for assessments and placements in all analyses were increased by 0.82%.
Page 129 of 168

Page 130 of 168
Appendix B. County Plan Analysis**
County Assessment Tools Assessment Process Model Planned Duration and Intensity of Treatment Other Care Offered Locale Timing of
Assessment Lag Time
ASI ASAMPPC
Oth Prepost sentence
Pre post tx entry
One Assmt Site
Time from Court to Assmt
Time from Assmt to Tx Entry
Drug Court
Case Mgmt
Level 1 Education Level 2 Outpatient Level 3 Intensive Outpatient / Day Treatment
Level 4 Residential Aftercare
Addl. Care
MM
Alameda Yes Yes No Court Post Pre Yes Sameday
** ** Yes 8 wks 8 wkly education sessions, 12 wkly grp counseling sessions; 4 ind. sessions every 1 to 6 weeks, 20 wkly supplementary activities.
Grp sessions and 12-Step mtgs.
Assmts done every 90 days. Results determine change in level of service.
Yes Yes Yes
Alpine Yes No Yes ** Post Pre Yes 10days
Up to 5 days
** ** 3 mth min. 5 sessions ind. and grp. Drug tested at admission, upon suspicion, wkly, discharge.
6 mth min. 1 ind. counseling session per wk, at least 2 recovery support grps per wk, possible additional sessions. Drug tested at admission, upon suspicion, randomly, wkly, discharge.
Provided out of county.
Provided out of county.
Yes Yes **
Amador Yes No Yes ** Pre Pre Yes Up to2 wks
Up to 7 days
** Yes 15 wks of ind. counseling once per mth & grp education 2 hours wkly.
6-9 mths of grps 2 hours a day 3 days a wk, ind. counseling 2 to 4 times per mth.
1-3 mths of grps 2 hours per day 2 days wkly, ind. counseling once a mth.
1-6 mths of detox, grp process.
Yes 1-6mths
Yes
Butte Yes Yes Yes ** Post Pre Yes Up to30 days
** Yes Yes 12 wk min. 1 grp mtg per wk for 2 hours.
24 wks. Grp mtgs 2 days per wk for 1.5 hrs. Access to ind./family counseling & Addl. services.
12 wks. 30 - 90 days. Case mgmt.
** Yes **
** Notes information that was unspecified in the county plan.

Page 131 of 168
Appendix B. County Plan Analysis**
County Assessment Tools Assessment Process Model Planned Duration and Intensity of Treatment Other Care Offered Locale Timing of
Assessment Lag Time
ASI ASAMPPC
Oth Prepost sentence
Pre post tx entry
One Assmt Site
Time from Courtto Assmt
Time from Assmt to Tx Entry
Drug Court
Case Mgmt
Level 1 Education Level 2 Outpatient Level 3 Intensive Outpatient / Day Treatment
Level 4 Residential Aftercare
Addl. Care
MM
Calaveras Yes Yes No ** Post Pre Yes Up to 7 days
** ** Yes 2 mth education & case mgmt.
2 mth relapse prevention, life skills & case mgmt.
2 mth transition & support services.
** Yes Yes **
Colusa Yes Yes No ** Post Pre Yes ** Up to30 days
** ** 3 mths. Intervention, recovery grp, ind. counseling every other wk.
6 mth min. Tx grps, peer grps, & 1 ind. counseling session per wk.
9 mth min. Tx & support grps. 1 ind. counseling session per wk.
90 days. Yes Yes **
Contra Costa
Yes No Yes +++ Post Pre Yes Up to 24 hrs
Up to 7 days
Yes Yes 12 wks of 6 two hr education sessions, 6 1.5 hr grp sessions, 3 one hr ind. sessions.
21 wks of six 2 hr education sessions, 15 1.5 hr grp sessions, four 1 hr ind. sessions.
One to three 1.5 hr grp per wk, 1 one hr ind. session per wk.
20 hrs of direct tx, 1 inidividual session wkly, 24 hr supervision
Yes Yes **
Del Norte Yes Yes No ** Post Pre ** ** ** Yes Yes Education & casemgmt
Outpatient-education/tx/case mgmt, up to 12 mths.
90 days including education/tx/case mgmt up to 12 mths.
60 days including education/tx/case mgmt up to 12 mths
Yes Yes **
El Dorado Yes Yes Yes ** Post Pre No 7 days 7 days ** Yes Drug test once a mth up to 8 times during tx.
Drug test once a mth up to 12 times during tx.
Drug test twice a mth up to 4 times per mth
No Yes Yes **
Fresno Yes No Yes ** Post Pre Yes Up to7 days
2 days ** ** 3 mths 3 mths primary tx. 3 mths primary tx 30 or 90 days residential
Yes Yes Yes
** Notes information that was unspecified in the county plan. +++ Notes co-location of probation and clinical assessment process.

Page 132 of 168
Appendix B. County Plan Analysis**
County Assessment Tools Assessment Process Model Planned Duration and Intensity of Treatment Other Care Offered Locale Timing of
Assessment Lag Time
ASI ASAMPPC
Oth Prepost sentence
Pre post tx entry
One Assmt Site
Time from Courtto Assmt
Time from Assmt to Tx Entry
Drug Court
Case Mgmt
Level 1 Education Level 2 Outpatient Level 3 Intensive Outpatient / Day Treatment
Level 4 Residential Aftercare
Addl. Care
MM
Glenn Yes Yes No ** Post Pre Yes(2)
** Up to 7 days
** Yes 3 mths min of wkly grp education & case mgmt, 1 ind. counseling mtg bi-wkly, wkly NA or AA mtgs, addl. services, 1 court appearance.
6 mths min of wkly education, tx & support grps, ind. counseling, 2 AA/NA mtgs, addl. services, case mgmt, re-assmt, 2 court appearances.
9 mths min of education, wekly grps, ind. sessions, 2 NA/AA mtgs. addl. services, mthly court appearances.
Min of 1 mth plus 1 mth of aftercare. Detox & other services associated with a 24-hr program. Upon completion, moves to Level 3.
Yes Yes **
Humboldt Yes Yes Yes +++ Post Pre Yes ** ** ** Yes ** Varies Varies Varies Yes Yes **
Imperial Yes Yes Yes ** Pre Pre Yes Up to48 hrs
** ** Yes 90 - 365 days. 1 grp counseling & 1 grp education/wk.
120 - 365 days. 2 grp counseling & 2 AA/NA or other support/wk. Case mgmt.
180 - 365 days. 3-5 grp sessions & 3 AA/NA or other support/wk. Case mgmt. Perinatal tx available.
14-90 days. Yes ** Yes
** Notes information that was unspecified in the county plan. +++ Notes co-location of probation and clinical assessment process.

Page 133 of 168
Appendix B. County Plan Analysis**
County Assessment Tools Assessment Process Model Planned Duration and Intensity of Treatment Other Care Offered Locale Timing of
Assessment Lag Time
ASI ASAMPPC
Oth Prepost sentence
Pre post tx entry
One Assmt Site
Time from Court to Assmt
Time from Assmt to Tx Entry
Drug Court
Case Mgmt
Level 1 Education Level 2 Outpatient Level 3 Intensive Outpatient / Day Treatment
Level 4 Residential Aftercare
Addl. Care
MM
Inyo Yes No No ** Post Pre No Up to7 days
Up to 7 days
** Yes ** 7 mths. 1st 4 mths: 2 days/wk grp @ 2 hrs each, 2/mo family counseling, rdm drug testing. Last 3 mths: 1 day/wk aftercare, 2/mo family counseling, drug testing on rdm Mondays. Vocational & literacy training, if needed, 2-4 wks daily, ind. face-to-face at intervals as needed, AA/NA for 7 mths.
12 mths: 1st 6 mths: 3 /wk grp 3 hrs each, 2 /mth family counseling. 2nd 6 mths: aftercare grp, vocational & literacy training, if needed, for 2-4 wks daily. Rdm drug testing, ind. face-to-face at intervals as needed, AA/NA participation for 12 mths.
18 mths: 3-12 mths residential or dual diagnosis tx. Post-residential tx assmt for relapse prevention & further tx needs. Vocational & literacy training, if needed, 2-4 wks daily. Aftercare grp, 1/ wk for the remainder of the 18 mths, drug testing on rdm Mondays, ind. face-to-face as needed, Mental Health tx as needed, AA/NA 18 mo
Yes Yes **
Kern Yes Yes Yes +++ Post Pre Yes Usually same day
Up to 30 days
** Yes 6 mths. Ind. counseling session at 3 mths & at discharge, 12 hrs of grp education.
3 or 8 mths, 2 levels. 10 mths. Detox; 3 mths of grp & ind., no less than 4/wk, to include no less than 7 grp sessions, & 1 indiv session /wk; SLE placement; min. of 24 self-help mtgs; drug testing at client expense; 4 mths of after-care grp.
3 to 5 days of social model detox services. Tx averages 45 days. Orientation, grp & ind. counseling services.
Yes Yes Yes
** Notes information that was unspecified in the county plan.
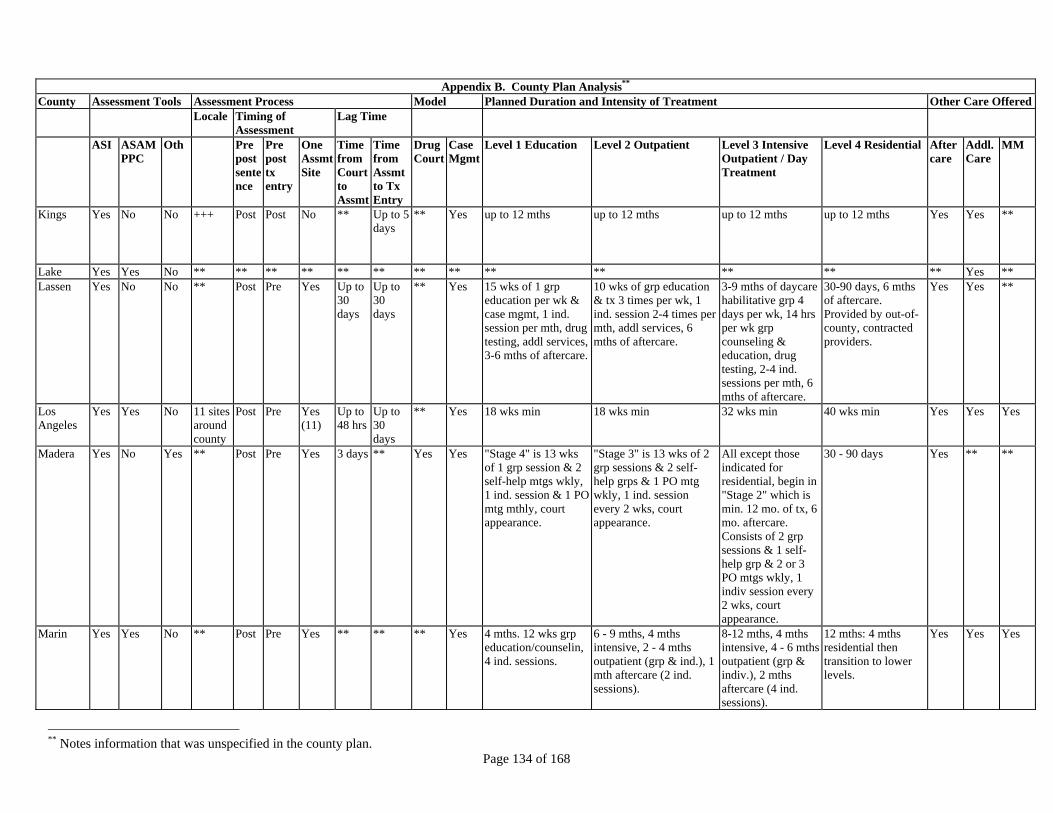
Page 134 of 168
Appendix B. County Plan Analysis**
County Assessment Tools Assessment Process Model Planned Duration and Intensity of Treatment Other Care Offered Locale Timing of
Assessment Lag Time
ASI ASAMPPC
Oth Prepost sentence
Pre post tx entry
One Assmt Site
Time from Court to Assmt
Time from Assmt to Tx Entry
Drug Court
Case Mgmt
Level 1 Education Level 2 Outpatient Level 3 Intensive Outpatient / Day Treatment
Level 4 Residential Aftercare
Addl. Care
MM
Kings Yes No No +++ Post Post No ** Up to 5days
** Yes up to 12 mths up to 12 mths up to 12 mths up to 12 mths Yes Yes **
Lake Yes Yes No ** ** ** ** ** ** ** ** ** ** ** ** ** Yes **Lassen Yes No No ** Post Pre Yes Up to
30 days
Up to 30 days
** Yes 15 wks of 1 grp education per wk & case mgmt, 1 ind. session per mth, drug testing, addl services, 3-6 mths of aftercare.
10 wks of grp education & tx 3 times per wk, 1 ind. session 2-4 times per mth, addl services, 6 mths of aftercare.
3-9 mths of daycare habilitative grp 4 days per wk, 14 hrs per wk grp counseling & education, drug testing, 2-4 ind. sessions per mth, 6 mths of aftercare.
30-90 days, 6 mths of aftercare. Provided by out-of-county, contracted providers.
Yes Yes **
Los Angeles
Yes Yes No 11 sites around county
Post Pre Yes (11)
Up to 48 hrs
Up to 30 days
** Yes 18 wks min 18 wks min 32 wks min 40 wks min Yes Yes Yes
Madera Yes No Yes ** Post Pre Yes 3 days ** Yes Yes "Stage 4" is 13 wks of 1 grp session & 2 self-help mtgs wkly, 1 ind. session & 1 PO mtg mthly, court appearance.
"Stage 3" is 13 wks of 2 grp sessions & 2 self-help grps & 1 PO mtg wkly, 1 ind. session every 2 wks, court appearance.
All except those indicated for residential, begin in "Stage 2" which is min. 12 mo. of tx, 6 mo. aftercare. Consists of 2 grp sessions & 1 self-help grp & 2 or 3 PO mtgs wkly, 1 indiv session every 2 wks, court appearance.
30 - 90 days Yes ** **
Marin Yes Yes No ** Post Pre Yes ** ** ** Yes 4 mths. 12 wks grp education/counselin, 4 ind. sessions.
6 - 9 mths, 4 mths intensive, 2 - 4 mths outpatient (grp & ind.), 1 mth aftercare (2 ind. sessions).
8-12 mths, 4 mths intensive, 4 - 6 mths outpatient (grp & indiv.), 2 mths aftercare (4 ind. sessions).
12 mths: 4 mths residential then transition to lower levels.
Yes Yes Yes
** Notes information that was unspecified in the county plan.
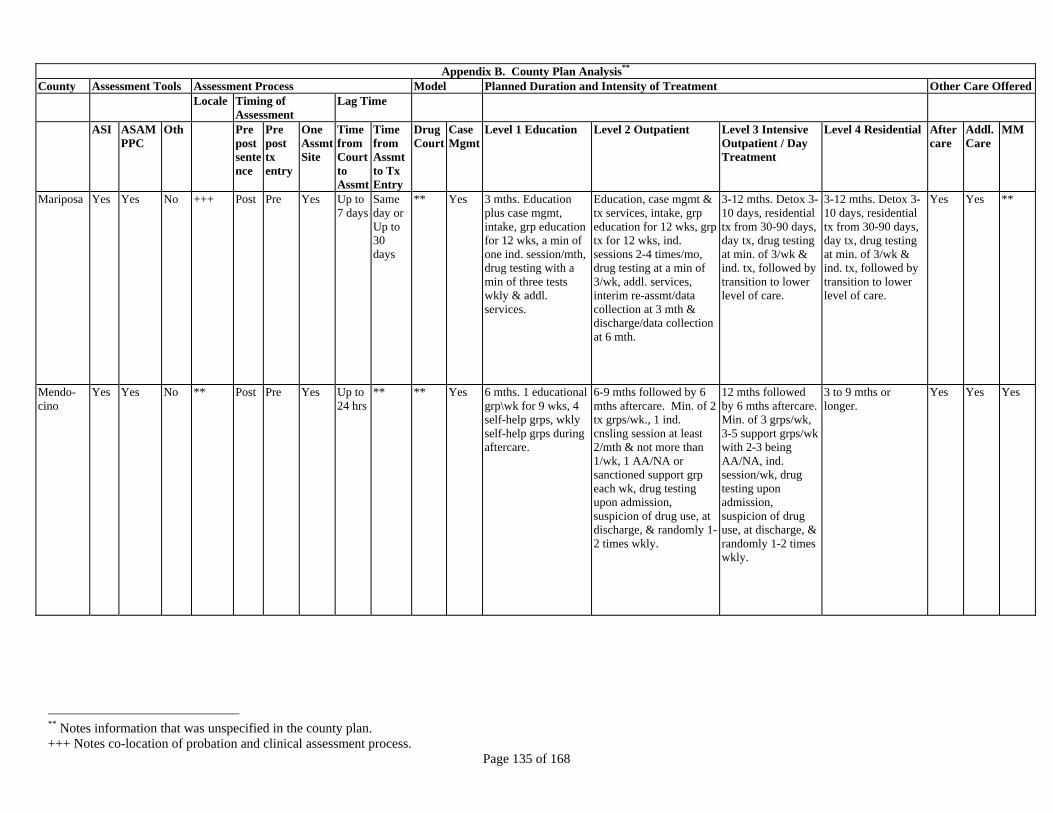
Page 135 of 168
Appendix B. County Plan Analysis**
County Assessment Tools Assessment Process Model Planned Duration and Intensity of Treatment Other Care Offered Locale Timing of
Assessment Lag Time
ASI ASAMPPC
Oth Prepost sentence
Pre post tx entry
One Assmt Site
Time from Court to Assmt
Time from Assmt to Tx Entry
Drug Court
Case Mgmt
Level 1 Education Level 2 Outpatient Level 3 Intensive Outpatient / Day Treatment
Level 4 Residential Aftercare
Addl. Care
MM
Mariposa Yes Yes No +++ Post Pre Yes Up to7 days
Same day or Up to 30 days
** Yes 3 mths. Education plus case mgmt, intake, grp education for 12 wks, a min of one ind. session/mth, drug testing with a min of three tests wkly & addl. services.
Education, case mgmt & tx services, intake, grp education for 12 wks, grp tx for 12 wks, ind. sessions 2-4 times/mo, drug testing at a min of 3/wk, addl. services, interim re-assmt/data collection at 3 mth & discharge/data collection at 6 mth.
3-12 mths. Detox 3-10 days, residential tx from 30-90 days, day tx, drug testing at min. of 3/wk & ind. tx, followed by transition to lower level of care.
3-12 mths. Detox 3-10 days, residential tx from 30-90 days, day tx, drug testing at min. of 3/wk & ind. tx, followed by transition to lower level of care.
Yes Yes **
Mendo-cino
Yes Yes No ** Post Pre Yes Up to 24 hrs
** ** Yes 6 mths. 1 educational grp\wk for 9 wks, 4 self-help grps, wkly self-help grps during aftercare.
6-9 mths followed by 6 mths aftercare. Min. of 2 tx grps/wk., 1 ind. cnsling session at least 2/mth & not more than 1/wk, 1 AA/NA or sanctioned support grp each wk, drug testing upon admission, suspicion of drug use, at discharge, & randomly 1-2 times wkly.
12 mths followed by 6 mths aftercare. Min. of 3 grps/wk, 3-5 support grps/wk with 2-3 being AA/NA, ind. session/wk, drug testing upon admission, suspicion of drug use, at discharge, & randomly 1-2 times wkly.
3 to 9 mths or longer.
Yes Yes Yes
** Notes information that was unspecified in the county plan. +++ Notes co-location of probation and clinical assessment process.

Page 136 of 168
Appendix B. County Plan Analysis**
County Assessment Tools Assessment Process Model Planned Duration and Intensity of Treatment Other Care Offered Locale Timing of
Assessment Lag Time
ASI ASAMPPC
Oth Prepost sentence
Pre post tx entry
One Assmt Site
Time from Court to Assmt
Time from Assmt to Tx Entry
Drug Court
Case Mgmt
Level 1 Education Level 2 Outpatient Level 3 Intensive Outpatient / Day Treatment
Level 4 Residential Aftercare
Addl. Care
MM
Merced Yes Yes No ** Post Pre Yes Up to7 or 30 days
Up to 30 days
** Yes Min 3 mths. 2 two hr grps/wk for 12 wks, 4 AA/NA mtgs, 1 one-hr ind. session bi-wkly, drug tested upon admission, suspicion of drug use, wkly, & prior to discharge.
Min 6 mths plus 2 mths aftercare services as needed. 2 one-hr tx grps per wk, 1 one-hr support grp per wk, 1 onehr ind. counseling session bi-wkly, 2 AA/NA mtgs or on site 12-step mtgs per wk, drug tested upon admission, suspicion of drug use, wkly, & prior to discharge.
Min 6 mths plus 3 mths aftercare. 2 one-hr tx grps/wk., 2 one-hr support grps/wk, 1 one-hr ind. cnslng/wk, 4 AA/NA mtgs or on site 12-step mtgs/wk, drug tested upon admission, suspicion of drug use, wkly, & prior to discharge.
Activities & drug testing requirements as required by the residential drug tx program.
Yes Yes **
Modoc Yes Yes Yes ** Pre Pre Yes N/A ** ** Yes ** Grps &/or ind. counseling, without medication
Intensive outpatient: ind. counseling (min. 1/wk), grp counseling (min. 2/wk) & min. 1 day/wk day tx. Day tx: min. 3 dys/wk, 4 hrs/day, grp counseling, & oth services.
Provided by neighboring counties
** Yes **
Mono Yes Yes ** ** Post Pre Yes 7 days ** ** ** 3 mths of 2 hr education grps wkly, 1 hr ind. counseling/case mgmt mthly, 8 drug tests.
6-12 wks of 2 hr education grps wkly, grp counseling, 1 hr ind./case mgmt wkly, drug testing wkly.
12 mths plus 6 mths of aftercare. 90 days of residential. Grp counseling, 1 hr ind. counseling/case mgmt wkly, drug testing wkly.
Unspecified but see Level 3 details.
Yes Yes **
** Notes information that was unspecified in the county plan.

Page 137 of 168
Appendix B. County Plan Analysis**
County Assessment Tools Assessment Process Model Planned Duration and Intensity of Treatment Other Services Offered
Locale Timing ofAssessment
Lag Time
ASI ASAMPPC
Oth Prepost sentence
Pre post tx entry
One Assmt Site
Time from Court to Assmt
Time from Assmt to Tx Entry
Drug Court
Case Mgmt
Level 1 Education Level 2 Outpatient Level 3 Intensive Outpatient / Day Treatment
Level 4 Residential Aftercare
Addl. Care
MM
Monterey Yes No No Initial screen at court. Second screen +++.
Pre Pre Yes Up to1 day
Up to 2 days
Yes ** 12 hrs of education sessions (8 sessions of 1.5 hrs).
10 hrs of education sessions (six sessions of 1.5 hrs each), 10 hrs grp sessions (6 grp sessions of 1.5 hrs each), 3 ind. sessions, 4 1-hr family or couple counseling sessions, 4 random monitored drug screens.
20 hrs of grp sessions, 8 ind. sessions, 4 random drug screenings, & up to 4 family/couple sessions.
Offered. Frequency & intensity unspecified.
** Yes Yes
Napa Yes Yes Yes Nearcourt
Post Pre Yes ** 7 days ** Yes Offered. Frequency & intensity unspecified.
Offered. Frequency & intensity unspecified.
Offered. Frequency & intensity unspecified.
Offered. Frequency & intensity unspecified.
Yes Yes **
Nevada Yes No Yes Nearcourt
Post Pre Yes ** ** ** ** Offered. Frequency & intensity unspecified.
Offered. Frequency & intensity unspecified.
Offered. Frequency & intensity unspecified.
** ** Yes **
** Notes information that was unspecified in the county plan. +++ Notes co-location of probation and clinical assessment process.

Page 138 of 168
Appendix B. County Plan Analysis**
County Assessment Tools Assessment Process Model Planned Duration and Intensity of Treatment Other Care Offered Locale Timing of
Assessment Lag Time
ASI ASAMPPC
Oth Prepost sentence
Pre post tx entry
One Assmt Site
Time from Court to Assmt
Time from Assmt to Tx Entry
Drug Court
Case Mgmt
Level 1 Education Level 2 Outpatient Level 3 Intensive Outpatient / Day Treatment
Level 4 Residential Aftercare
Addl.Care
MM
Orange Yes Yes Yes ** Post Pre Yes Up to24 hrs
** ** ** 6 mths (6 ind. & 22 grp sessions) 2 Mo - Wkly grp sessions with one ind. session per mth. 4 Mo - Wkly grp sessions (3 per mth) & one ind. session per mth (no grp the wk of ind.). 3-6 Mo Aftercare - Wkly grps offered, with a min of two grps required per mth. Final mth - substitute one grp with an exit planning session. 3 12-Step mtgs per wk.
9 Mths (11 ind. & 32 grp sessions) 2 Mths - Grps every other wk alternating with ind. sessions every other wk. 7 Mths - Wkly grp sessions & one case mgmt session per mth. 3 to 6 Mths of Aftercare -Wkly grps offered with a min of two grps required per mth. During final mth substitute one grp with an exit planning session. 4 12-Step mtgs per wk.
12 Mo (24 indiv, 40 grp) 4 Mo - Wkly grp & ind. sessions, min of 4 each per mth. 4 Mo - Grps wkly, with one ind. session per mth. 4 Mo - Wkly grp sessions & one case mgmt session per mth. 3-6 Mo of Aftercare - Wly grps offered with a min. 2 grps / mo. During final mth substitute one grp with an exit planning session. 4 12-Step mtgs / wk.
Up to 1 year. 4 types of residential possible.
Yes Yes Yes
Placer No No Yes Court Post Pre Yes ** 1-2wks
** Yes 12 mths. 4 tx/self-help contacts per wk.
12 mths. 4 tx/self-help contacts per wk
12 mths. 4 tx/self-help contacts per wk.
Offered. Frequency & intensity unspecified.
Yes Yes **
Plumas Yes Yes No ** Post Pre Yes ** ** ** Yes Up to 12 mths Up to 12 mths Up to 12 mths Provided out-of-county. Frequency & intensity unspecified.
** Yes **
** Notes information that was unspecified in the county plan.

Page 139 of 168
Appendix B. County Plan Analysis**
County Assessment Tools Assessment Process Model Planned Duration and Intensity of Treatment Other Care Offered Locale Timing of
Assessment Lag Time
ASI ASAMPPC
Oth Prepost sentence
Pre post tx entry
One Assmt Site
Time from Court to Assmt
Time from Assmt to Tx Entry
Drug Court
Case Mgmt
Level 1 Education Level 2 Outpatient Level 3 Intensive Outpatient / Day Treatment
Level 4 Residential Aftercare
Addl. Care
MM
Riverside Yes Yes ** ** Post Post No ** 24 hrs ** ** 16 wks 16 wks Up to 6 mths. Detox 3-7 days. Residential 30-90 days. Day tx 16 wks.
** Yes Yes Yes
Sacramento
Yes Yes Yes ** Post Post No Up to 24 hrs
Up to 5 days
Yes ** 3 mths of grps, ind. counseling 1-3 times mthly.
6 mths of grps, ind. counseling 2-4 times mthly.
7-14 days. 30-90 days w/min 6 mths of aftercare. Provided by out-of-county, contracted providers.
Yes Yes **
San Benito
Yes Yes No ** Post Pre Yes Up to 7 days
** ** Yes 10 wks. 6 mths of 10 grps, 2-4 ind. session per mth.
12 mths of wkly 1 hr grps, 1 ind. session mthly.
28-180 days. Yes Yes **
San Bernardino
Yes No No ** Post Post No ** ** ** Yes Offered. Frequency & intensity unspecified.
2-3 contacts per wk. Intensive outpatient with more than 3 contacts per wk.
Offered. Frequency & intensity unspecified.
Yes Yes Yes
San Diego
Yes No Yes +++. Post Post No Up to 3 days
** ** ** 3 mths of tx, 18 hrs of interactive education plus 3 hrs of ind., min 2 drug tests per mth.
6 mths plus 3 mths of aftercare, 3-5 hrs/wk of process & education grps & bi-wkly education, min 3 drug tests per mth.
9 mths plus 3 mths aftercare, 9-12 hrs/wk of process & educaltion grps & bi-wkly ind., min 3 drug tests per mth.
Up to 12 mths plus 6 mths aftercare, 20 hrs/wk of process & educational grps & bi-wkly ind., min 2 drug tests per mth.
** ** Yes
San Francisco
Yes Yes Yes ** Pre Pre Yes ** ** ** Yes ** ** ** ** ** ** **
San Joaquin
Yes Yes No +++ Post Pre Yes 2 days 7 days ** ** Offered. Frequency & intensity unspecified.
Offered. 3-5 days a wk. Offered. 5-7 days a wk.
Offered. Frequency & intensity unspecified.
Yes Yes **
** Notes information that was unspecified in the county plan.

Page 140 of 168
Appendix B. County Plan Analysis**
County Assessment Tools Assessment Process Model Planned Duration and Intensity of Treatment Other Care Offered Locale Timing of
Assessment Lag Time
ASI ASAMPPC
Oth Prepost sentence
Pre post tx entry
One Assmt Site
Time from Court to Assmt
Time from Assmt to Tx Entry
Drug Court
Case Mgmt
Level 1 Education Level 2 Outpatient Level 3 Intensive Outpatient / Day Treatment
Level 4 Residential Aftercare
Addl. Care
MM
San Luis Obispo
Yes Yes Yes +++ Post Pre Yes Up to7 days
Up to 7 days
** Yes 20 wks to 5 mths. 10 education sessions, 8 grp sessions, 5 ind. sessions.
6 mths. 10 education sessions, 23 grp sessions, 12 ind. sessions
9-12 mths. 23+ education sessions, 23 grp sessions, 6 ind. sesions, 36 daycare sessions
1-6 mths. Wkly grps, 3 thirty-minute ind. sessions
Yes Yes No
San Mateo
Yes Yes Yes ** Post Pre Yes ** ** ** ** Offered. Frequency & intensity unspecified.
3-10 hrs of wkly participation in tx program activities.
9-12 hrs of wkly participation in tx program activities.
1-4 mths for low intensity. 6-12 mths for high intensity.
Yes Yes Yes
Santa Barbara
Yes No Yes +++ ** ** ** ** ** ** Yes Offered. Frequency& intensity unspecified.
Offered. Frequency & intensity unspecified.
Offered. Frequency & intensity unspecified.
Offered. Frequency & intensity unspecified.
** Yes **
Santa Clara
No Yes No ** Post Post Yes ** ** ** Yes 24 hrs ofpsychoeducation.
3-4 mths of outpatient. 2-3 mths outpatient/intensive outpatient plus transitional housing.
4-6 mths of intensive outpatient. 2-3 mths outpatient/intensive outpatient plus transitional housing.
30-60 days. Yes Yes Yes
Santa Cruz
Yes Yes No ** Post Pre Yes Up to 10 days
** Yes ** 3 mths of wkly education & counseling
Up to 6 mths of services. Up to 1 year of services.
** ** Yes **
Shasta Yes No No ** Post Pre Yes Up to30 days
** ** Yes 3 mths of grp education & 1 ind. session per mth.
6 mths, min of 2 days per wk, education, grp counseling, 1 ind. session per mth.
6 mths, 3 hrs a day three days per wk.
9 mths, 45-90 days of residential care followed by Level II or III.
** Yes **
Sierra Yes No No ** Post Pre Yes Up to7 days
Up to 21 days
** ** 3 mths of bi-wkly ind. sessions, mthly grp sessions.
6 mths of bi-wkly ind. sessions, mthly grp sessions.
3 - 12 mths. 30-90 days. Yes Yes **
** Notes information that was unspecified in the county plan. +++ Notes co-location of probation and clinical assessment process.

Page 141 of 168
Appendix B. County Plan Analysis**
County Assessment Tools Assessment Process Model Planned Duration and Intensity of Treatment Other Care Offered Locale Timing of
Assessment Lag Time
ASI ASAMPPC
Oth Prepost sentence
Pre post tx entry
One Assmt Site
Time from Court to Assmt
Time from Assmt to Tx Entry
Drug Court
Case Mgmt
Level 1 Education Level 2 Outpatient Level 3 Intensive Outpatient / Day Treatment
Level 4 Residential Aftercare
Addl. Care
MM
Siskiyou Yes No No ** Post Post No Up to30 days
** ** Yes 2.5 hrs/wk for 20 wks. Education, case mgmt as needed, ind. counseling at least once per mth.
10.5 hrs per wk for 20 wks. Education, case mgmt, grp processes. Ind. counseling at least once a wk.
30-90 days of detox &/or residential tx.
See Level 3 Yes ** **
Solano Yes No No ** Post Post No Up to7 days
** ** ** Offered. Frequency & intensity unspecified.
Offered. Frequency & intensity unspecified.
Offered. Frequency & intensity unspecified.
Offered. Frequency & intensity unspecified.
** ** **
Sonoma No Yes Yes ** Post Pre Yes Up to8 days
** Yes ** 3 mths of grp mtgs held 1-2 times wkly.
6-9 mths of wkly grps & bi-wkly ind. sessions.
3-9 mths of grps 3 times wkly & ind. sessions 1-2 times mthly.
Up to 100 days of 24-hr therapeutic environment.
Yes Yes Yes
Stanislaus Yes Yes Yes Near court. +++
Post Pre Yes Up to 7 days
Up to 10 days
** Yes Offered. Frequency & intensity unspecified.
2 mths of outpatient services for 2 hrs 2 times a wk, 2-4 ind. sessions per mth, case mgmt.
3-6 mths of intensive outpatient services for 3 hrs 3 times a wk, day tx ranges from 3-5 days to 12 wks.
14-90 days. Yes Yes **
Sutter Yes Yes Yes ** Post Pre Yes Up to7 days
Up to 30 days
** Yes ** ** ** ** ** Yes **
Tehama Yes Yes No ** Post Pre Yes Up to 7 days
** ** ** ** ** ** ** Yes Yes **
Trinity Yes Yes No ** Post Pre Yes Sameday
Up to 7 days
** Yes 12 wks. 6-12 mths. 1-6 mths. Provided by out-of-county providers.
Yes Yes **
Tulare No No Yes ** Pre Pre Yes ** 7 days ** ** 24 wks of 24 hrs of education. Random wkly drug test. Mthly testing for following 12 mths.
13-26 wks of grps, ind. sessions & AA/NA.
6 wks of 3 hrs a day 4 days a wk.
60-90 days with opportunity to transiton to lower level of care.
Yes Yes **
** Notes information that was unspecified in the county plan.

Page 142 of 168
Appendix B. County Plan Analysis**
County Assessment Tools Assessment Process Model Planned Duration and Intensity of Treatment Other Care Offered Locale Timing of
Assessment Lag Time
ASI ASAMPPC
Oth Prepost sentence
Pre post tx entry
One Assmt Site
Time from Court to Assmt
Time from Assmt to Tx Entry
Drug Court
Case Mgmt
Level 1 Education Level 2 Outpatient Level 3 Intensive Outpatient / Day Treatment
Level 4 Residential Aftercare
Addl. Care
MM
Tuolumne Yes No No +++ Post Pre Yes Up to 7 days
Up to 30 days
** ** 12 wks of 1.5 hr mtgs twice a wk for total of 24 sessions.
16 wks of 1.5 hr grps three times a wk for a total of 48 sessions.
Offered. Frequency & intensity unspecified.
** Yes Yes **
Ventura Yes Yes No ** Post Pre Yes Up to5 days
Up to 7 days
** Yes 3 mths plus 3 mths of aftercare.
6 mths plus 6 mths of aftercare.
12 mths plus 6 mths of aftercare.
** Yes Yes **
Yolo Yes Yes No ** Pre Pre No ** 24 hrs ** ** 6 mths of grps & 12 step mtgs, drug testing.
Offered. Frequency & intensity varies.
Offered. Frequency & intensity varies.
Offered. Frequency & intensity varies.
Yes Yes Yes
Yuba Yes Yes Yes ** Pre Pre Yes Up to5 days
Up to 7 days
** Yes ** ** ** ** Yes Yes **
** Notes information that was unspecified in the county plan. +++ Notes co-location of probation and clinical assessment process.
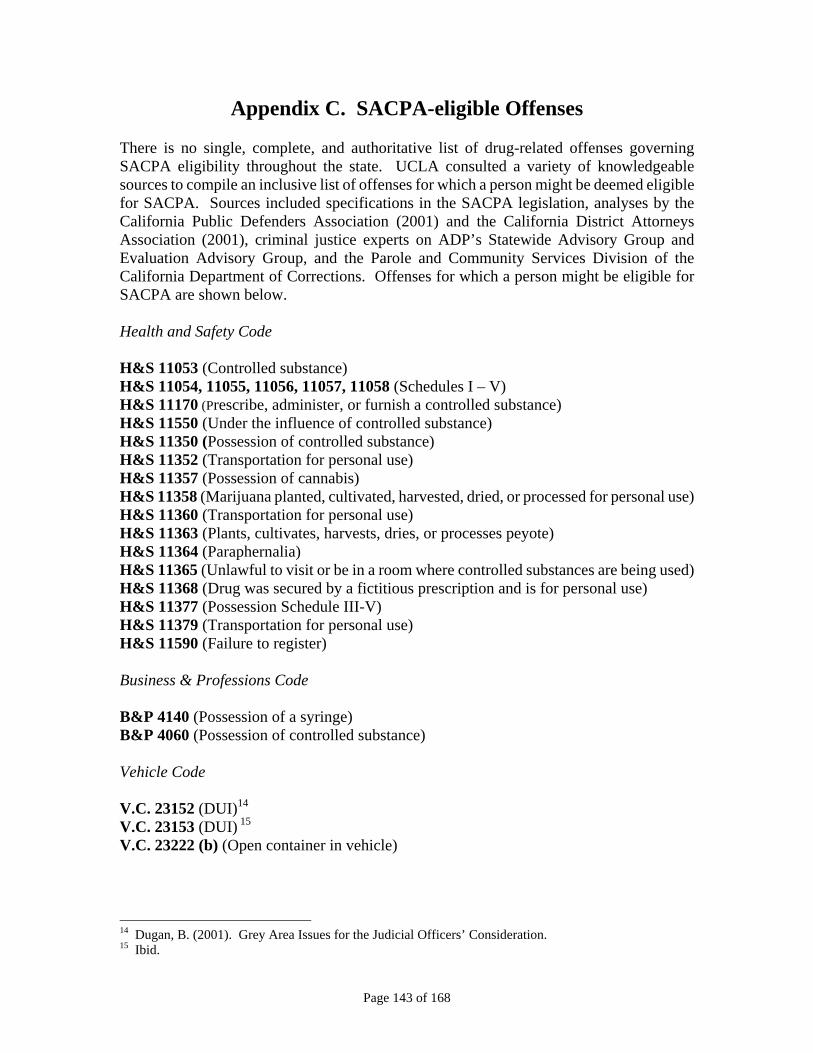
Appendix C. SACPA-eligible Offenses There is no single, complete, and authoritative list of drug-related offenses governing SACPA eligibility throughout the state. UCLA consulted a variety of knowledgeable sources to compile an inclusive list of offenses for which a person might be deemed eligible for SACPA. Sources included specifications in the SACPA legislation, analyses by the California Public Defenders Association (2001) and the California District Attorneys Association (2001), criminal justice experts on ADP’s Statewide Advisory Group and Evaluation Advisory Group, and the Parole and Community Services Division of the California Department of Corrections. Offenses for which a person might be eligible for SACPA are shown below. Health and Safety Code H&S 11053 (Controlled substance) H&S 11054, 11055, 11056, 11057, 11058 (Schedules I – V) H&S 11170 (Prescribe, administer, or furnish a controlled substance) H&S 11550 (Under the influence of controlled substance) H&S 11350 (Possession of controlled substance) H&S 11352 (Transportation for personal use) H&S 11357 (Possession of cannabis) H&S 11358 (Marijuana planted, cultivated, harvested, dried, or processed for personal use) H&S 11360 (Transportation for personal use) H&S 11363 (Plants, cultivates, harvests, dries, or processes peyote) H&S 11364 (Paraphernalia) H&S 11365 (Unlawful to visit or be in a room where controlled substances are being used) H&S 11368 (Drug was secured by a fictitious prescription and is for personal use) H&S 11377 (Possession Schedule III-V) H&S 11379 (Transportation for personal use) H&S 11590 (Failure to register) Business & Professions Code B&P 4140 (Possession of a syringe) B&P 4060 (Possession of controlled substance) Vehicle Code V.C. 23152 (DUI)14
V.C. 23153 (DUI) 15
V.C. 23222 (b) (Open container in vehicle)
14 Dugan, B. (2001). Grey Area Issues for the Judicial Officers’ Consideration. 15 Ibid.
Page 143 of 168

Penal Code P.C. 647 (f) (Public intoxication [drug]) Conditions of Parole 012 (Failure to participate in anti-narcotic testing) 019 (Violation of special conditions of parole if they are related to drugs) 024 (Failure to follow instructions from P&CSD where instructions are related to drug use) 025 (Failure to inform P&CSD of arrest if for a SACPA eligible violation only) 707 (Possession of heroin) 709 (Use of heroin) 717 (Possession of cocaine) 719 (Use of cocaine) 727 (Possession of marijuana) 729 (Use of marijuana) 737 (Possession of PCP) 739 (Use of PCP) 747 (Possession of any other illicit controlled substance) 749 (Use of any other illicit controlled substance) 750 (Possession of drug paraphernalia [related to drug use]) 776 (Illicit possession of amphetamine/methamphetamine) 778 (Illicit use of amphetamine/methamphetamine) 779 (Loitering in an area of drug-related activity) 780 (Under the influence of a controlled substance) 793 (Other violations of law relating to drug use) 947 (Failure to register per H&S 11590) Addendum: Offenses Regarded as SACPA-ineligible by California District Attorneys Association (2001) P.C. 191.5 (Gross vehicular manslaughter) P.C. 191.5 (c) (3) (Vehicular manslaughter without gross negligence) P.C. 4573-4573.9 (Bringing, sending, possessing drugs or drug paraphernalia in jail/prison)
Page 144 of 168

Appendix D. Arrest Practices: Data Sources and Methods Much of the state’s data on arrests are available on the California Department of Justice website. Analysts at the Department of Justice’s Criminal Justice Statistics Center provided additional data for the analysis of arrest practices reported in Chapter 4. The primary data source was Offender-Based Transaction Statistics (OBTS), which describes the processing of adult felony arrests through the California criminal justice system. OBTS data are grouped by the year of final disposition regardless of the year in which the arrest occurred. If a person was arrested for multiple offenses, only the most serious offense (based on the severity of possible punishment) is entered into OBTS. The extent of any error in data reported by the 1,200 criminal justice agencies in California is unknown. In particular, data specific to each county may not be exactly correct and were used in this analysis for an approximate comparison with other counties. The count of drug possession offenses was based on H&S 11350 (narcotics, peyote, depressants), H&S 11357 (cannabis), and H&S 11377(a) (non-narcotic drug). UCLA excluded drug possession offenses committed while using a firearm because those offenses were not SACPA-eligible. The count of “under the influence” offenses was based on H&S 11550. OBTS data reflect the most serious charge filed. While the most serious charge may be a drug offense, there may have been accompanying charges not SACPA-eligible. UCLA had no information on accompanying charges.
Page 145 of 168

Page 146 of 168

Appendix E. Focus Group Findings (Executive Summary) In November 2000, 61% of California’s voters approved Proposition 36, subsequently enacted into law as the Substance Abuse and Crime Prevention Act (SACPA). This legislation represents a major shift in the state’s criminal justice policy. Under SACPA, nonviolent drug possession offenders, if they choose, receive drug treatment in the community instead of being sentenced to a term of incarceration or being placed on community supervision without treatment. An independent evaluation of effectiveness and fiscal impact was called for in SACPA. Staff at UCLA’s Integrated Substance Abuse Programs (ISAP) is currently conducting that evaluation, which covers four domains: cost-offset, outcomes, implementation, and lessons learned. Information is being collected via surveys, focus groups, participant observation, data extraction from automated or paper records, and analyses of existing datasets maintained by state human services and criminal justice agencies.16 While much of this information is being collected from all 58 counties, ten focus counties (Alameda, Kern, Los Angeles, Mendocino, San Joaquin, San Mateo, Santa Barbara, Santa Clara, Shasta, and Ventura) have agreed to participate in more intensive data collection activities, such as a survey of offenders and focus group discussions with stakeholders. In combination, these ten counties encompass roughly half of the state’s SACPA offenders. This report provides findings from the first set of focus groups conducted with stakeholders on SACPA implementation. Focus groups were conducted from October 7 through December 2, 2002 to gain an in-depth understanding of stakeholders’ perspectives on and experiences with implementing SACPA thus far. Ten focus groups (one per county) were conducted involving 136 representatives from the county lead agency responsible for SACPA implementation, the courts, probation, district attorney’s office, public defender’s office, local parole division, treatment providers, Native American tribes, and law enforcement as well as other groups involved in implementation. Sessions lasted between one-and-a-half to two-and-a-half hours and were held at various county sites. Participants were asked to select and use aliases during the sessions in an effort to maintain confidentiality and anonymity. Discussion topics covered the most important changes experienced and the effect of those changes on the county agencies involved, policies and practices adopted in specific discretionary areas under SACPA (e.g., the filing and prosecution of cases, treatment, monitoring of offenders, and interpretation of “drug,” “nondrug,” “danger to others,” and “not available for treatment”), barriers and successes encountered, and lessons learned. During the discussions, the assistant took written notes and the moderator charted the participants’ responses for the group, highlighting the key topics and themes discussed. Following each focus group, the moderator and the assistant produced a summary of key points based on these written materials. The group discussions were audiotaped and transcribed verbatim.
16 For more detailed information about the ongoing SACPA evaluation, see Longshore et al. (2002) and Longshore (2002).
Page 147 of 168

Limitations and value of focus group data As with any research data, the focus group findings are limited in several ways. First, because the participants were not randomly selected, the sample may not be fully representative of all SACPA stakeholders. Thus, it is inappropriate to generalize from these group discussions to all stakeholders within any given focus county or across the state. Individuals from the various stakeholder groups were invited to participate, but representatives from each of the groups were not always present and in some sessions more representatives from a particular stakeholder group (e.g., the lead agency) participated. Hence, certain stakeholders are under-represented, while others are over-represented in the findings. Second, since most of the participants knew one another and worked together on a regular basis within and across agencies, some participants may not have felt free to answer questions candidly. Third, the ideal number of participants for a focus group is generally between 8 and 10 (Greenbaum 1988; also cited in Frey & Fontana 1993), as this range allows for an in-depth discussion with ample opportunity for all to participate. UCLA researchers sought to limit the focus groups to 12 participants, but in many cases the groups were substantially larger. Furthermore, in some sessions, the time allotted for the discussion was limited in order to accommodate the schedules of participants. Under these circumstances, participants may not have had the time or have felt completely free to discuss fully the topics raised by the moderator. In particular, truncated sessions of large numbers of participants may have limited the breadth and depth of the information gathered. Finally, the focus groups were conducted at certain points in time with particular groups of individuals. Therefore, the findings must be considered within the context of what was happening at the time. Local and statewide changes made since the focus groups were conducted, such as alterations in implementation procedures, staffing, and reporting requirements, and the state budget crisis, may be altering stakeholders’ perceptions and experiences in significant ways as SACPA implementation proceeds. Despite these limitations, the focus group findings can deepen our understanding of how counties have been implementing SACPA, identify some of the barriers and successes, and highlight stakeholders’ strategies and recommendations for improvement. An analysis of the factors affecting implementation from the points of view of diverse groups of stakeholders may facilitate positive changes within individual counties and within state advisory and governing bodies as SACPA policies and procedures continue to be fine-tuned. Major themes Nine themes emerging from an analysis of the focus group data are presented in the focus group report. Although they are listed here as discrete topics, they overlap with one another. In the complete focus group report, each theme is described and illustrated in more detail, drawing on verbatim quotes from focus group participants.
Page 148 of 168

♦ SACPA led to changes in criminal justice philosophy, policy, and practice. ♦ Interagency assessment teams fostered communication and collaboration across
agencies and facilitated client movement from court referral to assessment.
♦ The unanticipated volume of high-need offenders strained county monitoring, reporting, and service delivery systems.
♦ Counties devised new strategies to meet SACPA monitoring and reporting problems.
♦ Stakeholders grappled with service delivery problems (e.g., serving offenders with
co-occurring disorder; contending with waiting lists, especially for residential treatment; placing clients in the few available licensed and/or certified sober living environments; providing services in addition to drug treatment; addressing language barriers; serving unmotivated clients; including recovery community and Native American approaches; and meeting the need for case managers and/or court liaisons).
♦ Implementation concerns included greater workload, staff burnout, and insufficiency
of long-term funding.
♦ Drug court influenced the SACPA implementation process at various stages in nearly all focus counties.
♦ Local control was essential to success, but some stakeholders wished to receive more guidance from the California Department of Alcohol and Drug Programs (ADP).
♦ Successes and innovations were key to sustaining the momentum of SACPA.
Effective implementation strategies Stakeholders in all focus counties were engaged in developing and employing problem solving strategies throughout the SACPA implementation process. While a solution devised in one county may not be appropriate for another, this section catalogues the main strategies that some focus county participants reported finding effective.
♦ Planning: SACPA implementation committees, composed of diverse stakeholder groups
in each county, typically began by anticipating possible problems in the law or in local implementation. Then they strategized to avoid or ameliorate these effects. Participants from seven of the ten focus counties reported building on interagency relationships and lessons learned in drug court. For example, participants in one county drew on their drug court evaluation to create a comprehensive county plan that included a completely revamped system of care. In addition, participants in half of the focus counties believed that their success was directly related to the degree to which resources sufficed to allow them to adhere to a drug court model. However, participants in three counties said that
Page 149 of 168

some members of their SACPA implementation committees had been or continued to be opposed to adopting a drug court model for SACPA in their counties.
♦ Philosophy: As part of the effort to promote a shift from punishment to treatment,
participants reported providing training and information on the nature of addiction and treatment to criminal justice staff. For example, the assistant district attorney in one county developed an in-house library of materials on addiction from which prosecutors working on SACPA cases are assigned materials to read. Probation officers in another county were able to attend special training sessions and conferences, while training for SACPA judges and commissioners with no prior knowledge of treatment was reportedly critical in two other counties. The SACPA implementation committee in one of these counties adopted a “therapeutic justice” approach (i.e., use of the law as a tool to help offenders as well as to enforce compliance); another committee adopted a combined “accountability-treatment” approach (i.e., an effort to arrive at the optimal combination of treatment and supervision).
♦ Expedited SACPA cases in the courts: District attorneys and public defenders collaborated in some focus counties to allow defendants to plead into SACPA at the earliest possible point in case processing. According to participants in the counties, this strategy required that SACPA cases be handled by assistant-level prosecutors and public defenders, that is, those with decision-making power.
♦ Coordination of assessment and treatment: Interagency teams involving treatment and probation staff (sometimes mental health, parole, and case managers as well), co-located at central or regional centers as close as possible to the courts. Participants reported that this arrangement was crucial to maximizing the “show” rate at assessment and promoting timely referrals. These teams also fostered understanding and trust among stakeholders. In one county, a team combining treatment, probation, and mental health, screened offenders regularly for mental health problems and assessed offenders’ motivation for treatment. Participants from a few focus counties said that they continued to generate new ideas to improve assessment. For example, in one county, participants believed that they would be able to move offenders into treatment more quickly if funds were available to hire more assessors and thereby accommodate all walk-in offenders. In another county, staff wanted to pare down the assessment instruments and experiment with group assessment to reduce the lag time between referral, assessment, and placement.
♦ Allowing “every opportunity” to succeed: Most court representatives suggested that
offenders with three SACPA violations were returned to treatment or sent to a halfway house rather than facing incarceration. In short, the courts tried to exhaust as many options as possible before determining that the offender was not amenable to treatment. Participants in one focus county reported developing a special drug court for the small number of offenders who violated out of SACPA.
♦ Monitoring and reporting challenges: In response to dramatic increases in probation caseloads, counties developed procedures to distribute the tasks associated with
Page 150 of 168
monitoring and reporting. For example, in most focus counties, lines of communication between probation and treatment were opened, and probation officers were depending on client information provided by treatment. Also, probation staff in one focus county recently secured additional funding from a non-profit association to experiment with using interns to check in on high-risk clients weekly. The recovery community in another focus county began to develop a volunteer mentor program that will match a person in recovery with a SACPA client to “bridge the gap” in oversight and support. In a third county, the court decided to give the treatment-probation team “great discretion” in handling violations. The underlying twofold goal was to give treatment time to work while also holding clients accountable. Participants in another county, who established a dedicated SACPA court, found that it was instrumental in monitoring offenders more effectively and in applying the law consistently. In addition, some participants mentioned that SACPA created an opportunity to develop or improve their management information systems, which were vital to monitoring offenders. Finally, some stakeholders were using their sophisticated computerized tracking systems to assess the effectiveness of their programs and to inform decision-making.
♦ Co-occurring disorder: Participants identified the need to serve offenders with co-occurring mental disorder more effectively. Many participants favored collaborating more closely and extensively with county mental health agencies. A participant from one county noted that administrators from mental health, who had recently joined the SACPA implementation committee, had volunteered funds to serve SACPA offenders. In another county, lead agency staff developed a memorandum of understanding with mental health, and was seeking, as part of a Request for Proposals, “specific integrated services for chronic co-occurring disorders.” Lead agency staff in a fourth county was helping to develop a co-occurring disorder certification program for counselors at a local community college. Other focus counties were utilizing or planning to develop mental health courts.
♦ Service delivery problems: Participants in all of the focus counties reported that they were grappling with service delivery problems. They described strategies that were being employed to address common needs.
(1) Waiting lists, especially for residential treatment
Implementation team members in one county diverted funds from the lower levels of treatment to the higher levels in order to create a new intensive outpatient treatment program to compensate for a lack of residential beds. In addition, case managers engaged clients early in treatment through orientation and “pre-treatment classes” in an effort to counteract the negative effects of waiting lists.
(2) Sober living housing
With the exception of one focus county, which has a highly developed network of sober living environments, participants raised the need for more such environments. Although SACPA allows for six months of aftercare, the statute stipulates that any drug treatment
Page 151 of 168

provided to SACPA clients must be from “a licensed and/or certified community drug treatment program” (California State Department, 2000). As a result, SACPA offenders can be placed only in sober living houses affiliated with licensed and/or certified treatment facilities. Because this is not a common arrangement, very few options were available in many focus counties.
(3) Additional services
The need for additional services (e.g., transportation, child care, family counseling, literacy classes, and job training) led to new partnerships and staff positions in some focus counties. The lead agency in one county forged a partnership with the local community college in order to provide General Equivalency Diploma (GED) and literacy classes. In another focus county, lead agency staff brought a family intervention specialist on board to take a family-based, rather than an individual-based, approach with SACPA clients. This specialist was facilitating contact between the clients and their families and linking families to needed services (e.g., perinatal services, supplies and services for newborns, recreational programs for children). In another county, case managers were helping clients obtain vocational, psychological/psychiatric, and other services.
(4) Language barriers
In one county, participants reported that no certified treatment providers employ counselors able to speak the languages of some non-English speaking SACPA clients. The lead agency in another county had recently released a Request for Proposals to attract additional Spanish-language treatment providers. In a third focus county, the assessment team supervisor was called in when language problems arose. (5) Unmotivated clients
Early in the SACPA implementation process, lead agency staff in one focus county planned to meet the challenge of serving large numbers of unmotivated clients by assessing motivation for treatment and developing pre-treatment care for unmotivated clients. Treatment providers in this county were experimenting with treatment approaches such as motivational interviewing. (6) Recovery community and Native American approaches
Participants in a few focus counties raised concerns that unlicensed and uncertified but well-established treatment approaches were becoming somewhat marginalized in SACPA. However, participants in one focus county described among their successes integrating a recovery-community representative into their SACPA implementation committee. Focus counties with significant Native American populations and/or those adjacent to tribal lands had representatives from these communities on their SACPA implementation committees. However, participants from two counties mentioned that including Native American providers in SACPA is difficult because of the
Page 152 of 168

licensing/certification requirement and differences between some Native American treatment approaches and the “medical model” of addiction treatment.
(7) Need for case managers and/or liaisons
Because many SACPA clients have multiple needs and the statute mandates that a variety of distinct agencies provide services, many participants identified the need for case managers who can also act as liaisons between the court and treatment. In two focus counties, public defenders reported playing an advisory or “social worker” role, e.g., correcting clients’ misconception that there are no consequences to noncompliance, seeking services for clients, communicating with assessment staff, and following up to ensure that clients are assessed and enter treatment. In four focus counties, the treatment-probation and/or treatment-parole teams appeared to perform this role, while in a fifth county a newly hired SACPA court monitor had recently been named “court monitor/case manager.” Finally, as described earlier, in one county case managers were included in the SACPA implementation process from the outset.
♦ Insufficient funds: Some participants in nearly all of the focus counties said that
although they were pleased that more money for treatment flowed into the system as a result of SACPA, they were nevertheless very concerned about the adequacy of funding needed to implement SACPA across years. Some counties had begun to seek out new funding sources (e.g., grants from federal and non-profit agencies) and were pursuing other strategies to help alleviate their financial situations (e.g., partnering with other agencies) in an effort to implement SACPA more effectively.
Lessons learned and recommendations As part of the focus groups, participants were asked to discuss some of the lessons they had learned while implementing SACPA thus far and to provide recommendations for those considering implementing a similar initiative. Their responses are summarized below.
♦ Provide sufficient long-term funding to implement the statute. For example, focus group participants suggested eliminating the five-year sunset clause and providing funds for SACPA-related pilot projects and innovations.
♦ Involve all stakeholder groups throughout the SACPA implementation and program
operation processes. Ongoing collaboration is critical to success. Given stakeholders’ differing organizational cultures, philosophies, and priorities, their willingness to take the time and make the effort to collaborate across agencies and build trusting relationships is key. Demonstrating respect for all stakeholders’ expertise and roles is important, as is educating the criminal justice personnel involved on the nature of addiction and the role of treatment.
♦ Schedule regular meetings with representatives from all of the stakeholder groups to
build and maintain collaboration and trust. Be sure that the appropriate stakeholders
Page 153 of 168

are present to increase efficiency and streamline problem-solving and decision-making.
♦ Begin planning as soon as possible to avoid “knee jerk” responses to crises. If time
allows, pilot and evaluate the program prior to full-scale implementation.
♦ Anticipate that large numbers of high-need offenders will enter the criminal justice and treatment systems. In particular, develop strategies to meet the needs of clients with multiple interacting problems, e.g., unemployment, mental illness, homelessness, and low literacy.
♦ Maintain local control and flexibility in implementing the statute, especially in
defining policies, procedures, and terms (e.g., “not available for treatment” and “successful completion”).
♦ Provide more leadership and guidance via the California Department of Alcohol and
Drug Programs (ADP), particularly concerning the interpretation of the statute’s terminology and statewide reporting requirements, to reduce confusion among stakeholders and to coordinate implementation statewide.
♦ Reduce the “bureaucracy” (e.g., paperwork; redundant and parallel reporting
requirements), which some participants believe burdens county agency staff unnecessarily.
♦ Develop and maintain a system for regularly disseminating clear and consistent
information about the statute and its effectiveness to the public, especially powerful political lobbies and the legislature.
♦ Consider revising the current statute and involve actual stakeholders in the revision
process, as well as in the initial development of similar legislative initiatives. Summary and next steps As with any change in statewide policy, especially one that involves numerous and diverse stakeholder groups and agencies, implementation can be difficult. Participants in the ten SACPA focus counties reported working to overcome a number of hurdles (e.g., establishing collaborative relationships among the various stakeholder groups, interpreting the statute’s terminology), with many conveying that they are still in the midst of resolving some of these issues (e.g., workload increases, insufficient funds for the services SACPA clients require). However, overall and to different degrees, focus county participants believed they had developed workable systems, which they continue to adjust and fine-tune. These focus group findings, as emphasized earlier, are based primarily on the first year of implementation and are limited in a number of ways. However, because they stem from the perceptions and experiences of a particular group of stakeholders who were engaged in the
Page 154 of 168
day-to-day implementation process, the findings can help to inform state and county policy within California and the design of initiatives like SACPA elsewhere. UCLA invited participants to comment on prior drafts of the focus group report. In addition, preliminary findings were presented, and comments received, at a special session for focus counties at the “Making It Work” conference held in San Diego on February 3-6, 2003. These findings also informed other data analyses conducted for this report. The second round of stakeholder focus groups is planned for Year 4 of SACPA. References California State Department. (2000). Substance Abuse and Crime Prevention Act of 2000
(Prop. 36). Proposition 36 ballot initiative. Original text from the California Secretary of State. Sacramento: California State Department. See http:// www.adp.ca.gov/SACPA/Proposition_36_text.shtml
Frey, J. H., and A. Fontana. (1993). The group interview in social research, pp. 20-34. In
Morgan. D.L., ed. Successful Focus Groups. Newbury Park, CA: Sage. Greenbaum, T. L. (1988). The Practical Handbook and Guide to Focus Group Research.
Lexington, MA: Lexington. Longshore, D. (2002). Evaluation of California’s Substance Abuse and Crime Preven-
tion Act of 2000. Testimony before the Commission on California State Govern- ment Organization and Economy (the Little Hoover Commission), May 23, 2002, Sacramento, CA.
Longshore, D., Prendergast, M., Hser, Y., and Evans, E. (2002). Treatment in lieu of incarceration. Evaluation of California’s Substance Abuse and Crime Prevention Act of 2000: What We Need to Know; What We’ve Learned So Far. Offender Substance Abuse Report, 2(2), March/April. Also available at www.uclaisap.org.
Page 155 of 168

Page 156 of 168

Appendix F. Data Elements by Source AVAILABLE IN ADMINISTRATIVE DATA SOURCES entered treatment treatment type treatment duration completed treatment completed probation/parole arrested on new charge (drug, property, violent) convicted on new charge (drug, property, violent) incarcerated in state prison prison days sentenced prison days served employment days worked welfare received days on welfare any drug use (self-reported or based on urine test records) by drug type frequency of use by drug type AVAILABLE VIA PRIMARY DATA COLLECTION BY UCLA committed new offenses (drug, property, violent; arrested or not) number of crimes or crime days (drug, property, violent; arrested or not) days worked days on welfare any drug use (self-reported or based on urine test records) by drug type frequency of use by drug type ACQUIRED FROM COUNTIES CII number arraignment date name: first, middle, last address phone DOB gender social security number (entire or last four digits only) race/ethnicity primary drug charge(s) by code number charge(s): misdemeanor or felony new case was on probation was on parole
Page 157 of 168

has no, one, or two “strikes” date of conviction found SACPA-eligible if no, why (prior record or additional current charges) found eligible only after additional charge(s) dismissed/deferred if yes, specify charges accepted SACPA appeared for treatment assessment/placement treatment placement (level, tier) for each violation (by code) (a) violation was counted as first, second, or third SACPA violation, (b) reinstated or revoked if reinstated, whether placement was changed (no or specify new treatment) if revoked, was offender danger to others, unavailable, or refused treatment completed SACPA completion date case dismissed dismissal date incarcerated in city/county jail jail days sentenced jail days served
Page 158 of 168

Appendix G. Administrative Databases Owner Domain Research
Question Database Name Content Variables Needed Years
Needed17
Office of Statewide Health Planning Development
Costs Outcomes
1.2 6.1 6.2
Nonpublic patient level data
Non-Federal acute care in-patient demographics, diagnoses, treatment, cause of injury, charges and source of payment. Excludes emergency room visits.
Specific variables of interest are to be determined. From the variable list we have identified variables that may be useful: SSN, 5-digit zip code, Admission Date, Admit Date, Date, Hospital ID Number, Hospital 5-digit Zip Code, Type (level) of Care, Race (Ethnicity for 1995 forward), Sex, Source of Admission, Type of Admission, Expected Principal Source of Payment, Disposition of Patient, Total Charges, Principal Diagnosis, Other Diagnosis, Principal Procedure Code, Other Procedure Code, Principal External Cause of Injury, Other External Causes of Injury, Diagnosis Related Group (DRG), Major Diagnostic Category (MDC), APR-DRG Severity of Illness.
7/1/96-7/1/06
17 Dates may change after negotiations with agencies.
Page 159 of 168

Department of Health Services
Costs Outcomes
1.2 6.1 6.3
Medi-Cal Paid Claims file, Death Index, there may be other databases of interest
Medical status and associated costs for patients receiving Medi-Cal covered health services. Vital Statistics information (aka Death Index?)
Specific variables of interest are to be determined. Vital Statistics variables are to be determined.
7/1/96-7/1/06
Department of Social Services
Costs Outcomes
1.2 6.3
Medi-Cal Eligibility Determination System
Medical status and associated costs for patients receiving Medi-Cal covered health services.
Specific variables of interest in the MEDS data are to be determined. We need a complete data dictionary.
7/1/96-7/1/06
Employment Development Department
Costs Outcomes
1.2 5.1
Unemployment Insurance Base Wage database Unemployment Insurance Single Client database
Base wage for everyone including unemployment and disability insurance.
We need an EDD data dictionary. We believe we would like to request: DE507 (wage & claim abstract) also known as Unemployment Insurance Base Wage file (?), Disability Insurance history, Unemployment Insurance Single Client File.
7/1/96-7/1/06
Francise Tax Board
Costs? Outcomes?
1.2? 5.1?
Unknown Unknown We need an FTB data dictionary.
7/1/96-7/1/06
Department of Motor Vehicles
Costs Outcomes
1.2 3.1
Driver License Master Record: CORE (SS29 Process) and DUI module programs
Five types of traffic violations: accidents minor convictions, major convictions, DUI suspension, other
Record 001:driver license no., birthdate, SSN, gender, zipcode, name. Record 002 mailing address, city. Record 005 (created by UCLA on
7/1/96-7/1/06
Page 160 of 168

suspensions. linkage subjects): lastname, firstname, birthdate, SSN, id, gender. Record ARR: arrest date, BAC test type, BAC level. Record DAC: accident date, injuries, fatalities, sobriety.
Department of Justice
Costs Outcomes Implementation
1.2 1.6 1.7 3.1 3.2 3.4 9.1
Automated Criminal History System, Criminal Offender Record Information (CORI) Monthly Arrest and Citation Register (MACR) Offender Based Transaction Statistics (OBTS) Jails and Camps Population Electronic Disposition information (i.e., Y code)
Arrests, incarcerations, criminal histories, census of jails and camps.
CORI variables: Sections PDR (personal data record), SOC (Social Security Number), AKA (alias), CDL (CA Driver’s License #), IDN (CA Identification #), HIS (criminal history/arrest/detained/cited), PRB (probation summary), PAR (parolee summary), SMT (scars/marks/tattoos), OCC (occupation), INN (institution #), OLN (operator license #), MDS (misc. descriptors), MON (monikers), MP (Royal Canadian Mounted Police #). MACR variables: Adult Felony Arrests, Adult Misdemeanor Arrests, Law Enforcement Dispositions of Adult and Juvenile Arrests By Level of Offense, Final Law
7/1/96-7/1/06
Page 161 of 168
Enforcement, Prosecution and Court Disposition of Adult Felony Arrests by Type of Disposition, Adult Probation Caseload and Action. OBTS variables: Specific variables of interest are to be determined. Jails and Camps Population variables: Specific variables of interest are to be determined. Electronic Disposition variables: Specific variables of interest are to be determined.
Department of Corrections
Costs 1.7
Offender Based Information System (OBIS) Interim Parolee Tracking System (IPTS) “Front end database” (unnamed)
State prisoners and parolees: demographics, CDC and CII number, commitment offense, parole status
Specific variables of interest are to be determined.
7/1/96-7/1/06
Board of Prison Terms
Costs
1.5 1.7
Revocation Scheduling and
Quarterly report on progress (drug testing
Specific variables of interest are to be determined.
7/1/96-7/1/06
Page 162 of 168

Outcomes 3.2 Tracking System(RSTS)
results, attendance, discharge status)
Department of Mental Health
Costs Outcomes
1.2 6.2
Client & Service Information (CSI) System
Diagnostic Statistical Manual mental diagnosis codes, services, and costs related to publicly funded outpatient services.
Header fields: H-01.0 county/city/mental health plan submitting record, H-02.0 county client number (CCN), H-03.0 record type. All variables contained in the Client Fields, Service Fields, Service Fields – 24 Hour Mode of Service, Service Fields – Hospital, PHF, and SNF, Service Fields – Non-24 Hour Mode of Service, Periodic Fields, Key Change Fields.
7/1/96-7/1/06
Department of Mental Health
Costs Outcomes
1.2 6.2
State hospitalizations
Diagnostic Statistical Manual mental diagnosis codes, services, and costs related to publicly funded inpatient hospital services for severe patients.
Specific variables of interest are to be determined.
7/1/96-7/1/06
Department of Alcohol and Drug Programs
Costs Outcomes Implementation
1.1 7.1 7.2 9.3
California Alcohol and Drug Data System (CADDS)
Descriptive data on patients entering and exiting substance abuse treatment centers.
Admdate (admission date), Disdate (discharge date), TITD (time in tx, days), County, Provid (provider ID), UPI (Participant ID), Codepend (Codependent), Race, Ethnic, LFS (Labor Force Status), Educ, Refer
7/1/96-7/1/06
Page 163 of 168

(Referral Source), Prgadm (Pregnant at admission), Legalst (Legal Status), Disabil1, Disabil2, Disabil3 (disabilities), Status (discharge status), DLFS (disch. labor force status), Transact (transaction type), Service (modality), Medica (medication), NPA (number of prior admissions), pridtu, secdtu, terdtu (primary, secondary, tertiary drug problems), route, route2 (route of administration), freq, freq2 (frequency of use), agefu, agefu2 (age of first use), yrsused, yrsused2, yrsused3 (years used), IVDU (needle use), CMI (multi-diagnosis), Homeless, Zipcode, MediCAL, SSI, CalWORKS, CWPlan (welfare to work).
Department of Alcohol and Drug Programs
Implementation
9.3 Drug and Alcohol Treatment Access Report (DATAR)
Data on treatment capacity and waiting lists.
Questions 1-7 (all). 7/1/96-7/1/06
Department of Alcohol
Costs 1.11.2
SACPA Reporting Information System
Quarterly and annual financial status reports by
Reports: Expenditures (entity/services), Financial
7/1/96-7/1/06
Page 164 of 168

and Drug Programs
1.3 (SRIS) county, countyexpenditures, client counts and characteristics
Status, Entity Plan, Service/Activity Report, SATTA expenditure and information report, Client Counts.
UCLA Integrated Substance Abuse Programs
Outcomes 3.34.1 4.2 5.1 6.1 6.2 6.3
California Treatment Outcome Project (CalTOP)
Treatment data (assessment at admission and exit, service utilization, follow-up outcomes) for about 15,000 clients in 44 providers across 13 counties.
Specific variables of interest are to be determined.
7/1/96-7/1/06
UCLA Integrated Substance Abuse Programs
Outcomes 3.34.1 4.2 5.1 6.1 6.2 6.3
Los Angeles County Evaluation System (LACES)
Treatment data (assessment at admission and exit, follow-up outcomes) for Los Angeles county.
Specific variables of interest are to be determined.
7/1/96-7/1/06
Page 165 of 168

Page 166 of 168

References Belenko, S. (2001). Research on drug courts: a critical review. New York: The National
Center on Addiction and Substance Abuse at Columbia University. Blumstein, A., Cohen, J., Roth, J., & Visher, C. 1986. Criminal Careers and “Career
Criminals.” Washington, D.C.: National Academy Press. California Department of Corrections (2002). Policy No. 02-11, p. 7. California District Attorneys Association (2001). Implementing Proposition 36. California Public Defenders Association. (2001). Analysis of Proposition 36. California
Public Defenders Association. Donovan, D. M., Rosengren, D.B., Downey, L., Cox, G.B., & Sloan, K.L. (2001). Attrition
prevention with individuals awaiting publicly funded drug treatment. Addiction, 96, 1149-1160.
Dugan, B. (2001) Grey area issues for the judicial officers’ consideration. Gottfredson, M.R. & Hirschi, T. 1990. A General Theory of Crime. Stanford, CA: Stanford
University Press. Hirschi, T. & Gottfredson, M. (1983). Age and the explanation of crime. American Journal
of Sociology, 89, 552-84. Hser, Y., Maglione, M., Polinsky, M.L., & Anglin, M.D. (1998). Predicting drug treatment
entry among treatment-seeking individuals. Journal of Substance Abuse Treatment, 15, 213-220.
Hubbard, R.L., Craddock, S.G., Flynn, P.M., Anderson, J., Etheridge, R.M. (1997).
Overview of 1-year follow-up outcomes in the Drug Abuse Treatment Outcome Study (DATOS). Psychology of Addictive Behaviors, 11, 261-278.
Kessler, R.C., Nelson, C. B., McGonagle, K. A., Edlund, M. J., Frank, R. G., & Leaf, P. J.
(1996). The epidemiology of co-occurring addictive and mental disorders: Implications for prevention and service utilization. American Journal of Orthopsychiatry, 66, 17-31.
Marlowe, D. B. (2002). Effective strategies for intervening with drug abusing offenders.
Villanova Law Review, 47 (4). McLellan, A. T., Kushner, H., Metzger, D., Peters, R., Smith, I., Grissom, G., Pettinati, H.,
& Argeriou, M. (1992). The fifth edition of the Addiction Severity Index. Journal of Substance Abuse Treatment, 9, 199-213.
Page 167 of 168
McLellan, A. T., Luborsky, L., Woody, G. E., & O'Brien, C. P. (1980). An improved
diagnostic evaluation instrument for substance abuse patients: The Addiction Severity Index. Journal of Nervous and Mental Disease, 168, 26-33.
Musheno, M.C., Palumbo, D.J., Maynard-Moody, S., & Levine, J.P. (1989). Community
corrections as an organizational innovation: What works and why. Journal of Research in Crime and Delinquency, 26, 136-167.
Nolan, J.L. (2002). Drug Courts in Theory and in Practice. Hawthorne, New York: Walter
de Gruyter, Inc. Petersilia, J. & Turner, J. (1986). Prison versus Probation in California: Implications for
Crime and Offender Recidivism. Santa Monica, CA: The RAND Corporation. Prendergast, M.L., Podus, D., Chang, E., & Urada, D. (2002). The effectiveness of drug
abuse treatment: A meta-analysis of comparison group studies. Drug and Alcohol Dependence, 67, 53-72.
Shadish, W.R. & Ragsdale, K. (1996). Random versus nonrandom assignment in controlled
experiments: Do you get the same answer? Journal of Consulting and Clinical Psychology, 64, 1290-1305.
Simpson, D., Joe, G.W., & Brown, B.S. (1997). Treatment retention and follow-up
outcomes in the Drug Abuse Treatment Outcome Study (DATOS). Psychology of Addictive Behaviors, 11, 300-301.
Simpson, D., Joe, G.W., & Broome, K.M. (2002). A national 5-year follow-up of treatment
outcomes for cocaine dependence. Archives of General Psychiatry, 59, 538-544. Simpson, D., Joe, G.W., Fletcher, B.W., Hubbard, R.L., & Anglin, M.D. (1999). A national
evaluation of treatment outcomes for cocaine dependence. Archives of General Psychiatry, 57, 507-514.
Weisburd, D., Lum, C.M., & Pertosino, A. (2001). Does research design affect study
outcomes in criminal justice? The Annals of the American Academy of Political and Social Science, 578, 50-70.
Wolf, E.M. (2002). “Systematic constraints on the implementation of a northeastern drug
court.” Drug Courts in Theory and in Practice. Edited by James L. Nolan, Jr. Hawthorne, New York: Walter de Gruyter, Inc.
Page 168 of 168