Evaluation of the Role of Driver’s Knowledge of Who Has ...
63
University of Dayton eCommons Civil and Environmental Engineering and Engineering Mechanics Faculty Publications Department of Civil and Environmental Engineering and Engineering Mechanics 12-2007 Evaluation of the Role of Driver’s Knowledge of Who Has the Right-of-Way Contributes to Interstate On-Ramp Crashes Deogratias Eustace University of Dayton, [email protected] Vamsi Krishna Indupuru University of Dayton Follow this and additional works at: hp://ecommons.udayton.edu/cee_fac_pub Part of the Civil Engineering Commons , Construction Engineering and Management Commons , Environmental Engineering Commons , Other Civil and Environmental Engineering Commons , and the Transportation Engineering Commons is Article is brought to you for free and open access by the Department of Civil and Environmental Engineering and Engineering Mechanics at eCommons. It has been accepted for inclusion in Civil and Environmental Engineering and Engineering Mechanics Faculty Publications by an authorized administrator of eCommons. For more information, please contact [email protected], [email protected]. eCommons Citation Eustace, Deogratias and Indupuru, Vamsi Krishna, "Evaluation of the Role of Driver’s Knowledge of Who Has the Right-of-Way Contributes to Interstate On-Ramp Crashes" (2007). Civil and Environmental Engineering and Engineering Mechanics Faculty Publications. 63. hp://ecommons.udayton.edu/cee_fac_pub/63
Transcript of Evaluation of the Role of Driver’s Knowledge of Who Has ...

University of DaytoneCommonsCivil and Environmental Engineering andEngineering Mechanics Faculty Publications
Department of Civil and EnvironmentalEngineering and Engineering Mechanics
12-2007
Evaluation of the Role of Driver’s Knowledge ofWho Has the Right-of-Way Contributes toInterstate On-Ramp CrashesDeogratias EustaceUniversity of Dayton, [email protected]
Vamsi Krishna IndupuruUniversity of Dayton
Follow this and additional works at: http://ecommons.udayton.edu/cee_fac_pub
Part of the Civil Engineering Commons, Construction Engineering and Management Commons,Environmental Engineering Commons, Other Civil and Environmental Engineering Commons, andthe Transportation Engineering Commons
This Article is brought to you for free and open access by the Department of Civil and Environmental Engineering and Engineering Mechanics ateCommons. It has been accepted for inclusion in Civil and Environmental Engineering and Engineering Mechanics Faculty Publications by anauthorized administrator of eCommons. For more information, please contact [email protected], [email protected].
eCommons CitationEustace, Deogratias and Indupuru, Vamsi Krishna, "Evaluation of the Role of Driver’s Knowledge of Who Has the Right-of-WayContributes to Interstate On-Ramp Crashes" (2007). Civil and Environmental Engineering and Engineering Mechanics FacultyPublications. 63.http://ecommons.udayton.edu/cee_fac_pub/63

EVALUATION OF THE ROLE OF DRIVER’S KNOWLEDGE OF WHO HAS THE RIGHT-OF-WAY CONTRIBUTES TO INTERSTATE ON-
RAMP CRASHES
Prepared for
MACK BLACKWELL RURAL TRANSPORTATION CENTER Project No. MBTC - 2100
Contract No. Award No. DTRS99-G-0025
By
Deogratias Eustace, Ph.D., P.E., PTOE Assistant Professor
and
Vamsi Krishina Indupuru
Graduate Student
Department of Civil and Environmental Engineering and Engineering Mechanics University of Dayton
300 College Park Dayton, OH 45469-0243
NOVEMBER 2007

Acknowledgements
This project was funded jointly by Mack Blackwell Transportation Center (MBTC) with
matching funds from the University of Dayton.
Disclaimer
The contents of this report reflect the views of the authors who are responsible for the
facts and accuracy of the data presented herein. The contents do not necessarily reflect the views
or the policies of Mack Blackwell Transportation Center or the University of Dayton.

Abstract
The knowledge of drivers on who has the right-of-way between the one on mainline lanes
of a freeway and the one entering the freeway through on-ramp junction lane was evaluated. In
addition, drivers’ opinions on how to make the on-ramp junctions safer were collected. A survey
instrument with 21 items requesting drivers’ information in regard with demographics, freeway
driving experience, knowledge of right-of-way and merging practices was used for data
collection. The results show that crashes are relatively rare events and for some reasons, most of
them never happen but result into near misses, which can not be reported and documented. Most
drivers act correctly when driving on freeway mainlines when they see a vehicle trying to merge
from an entrance ramp but act improperly when merging into freeways from on-ramp lanes.
Some drivers cannot identify which driver has the right-of-way at the merge area between the
mainline and the on-ramp drivers. Yielding problems due to bad drivers’ attitudes have been
identified by drivers as the leading cause of freeway-ramp merge area crashes, followed by lack
of attention and drivers entering the freeway at low speeds. Most of the drivers believe that they
need longer acceleration lanes, better ramp signing and better driver’s education especially in
terms of sign meaning and entrance ramp safety in order to make freeway-ramp merge areas
safer. Due to sampling problems encountered in this study, one has to be careful when
interpreting these results because the sample completely missed teenage drivers and over-
sampled older drivers.

iv
Table of Contents
Acknowledgements............................................................................................................. 2
Disclaimer ........................................................................................................................... 2
List of Figures .................................................................................................................... vi
List of Tables .................................................................................................................... vii
CHAPTER 1 - INTRODUCTION...................................................................................... 1
Background..................................................................................................................... 1
Research Objectives........................................................................................................ 2
Organization of Report ................................................................................................... 2
CHAPTER 2 - LITERATURE REVIEW........................................................................... 3
Introduction..................................................................................................................... 3
Knowledge Testing and Licensing for New Drivers ...................................................... 5
CHAPTER 3 - SURVEY DESIGN AND DATA COLLECTION .................................... 7
Survey Instrument Development .................................................................................... 7
Data Source..................................................................................................................... 8
CHAPTER 4 - ANALYSIS AND DISCUSSION OF RESULTS.................................... 10
Data Summaries............................................................................................................ 10
Demographic Items................................................................................................... 10
Personal Experience of Being Involved or Seeing Crashes and Near Misses .......... 13
Driving Behavior at Merging Area and Meaning of a Merge Sign Items ................ 16
Knowledge and Right-of-Way Items ........................................................................ 21
v
Drivers’ Opinions on Reasons that Cause Freeway-Ramp Merge Area Crashes ..... 25
Drivers’ Suggestions to Make the Freeway-Ramp Merge Areas Safer .................... 26
Analysis of Drivers’ Knowledge .................................................................................. 28
Limitations of the Study Method .................................................................................. 30
CHAPTER 5 - Conclusions .............................................................................................. 32
References......................................................................................................................... 34
Appendix A - Approval Letters to Use Human Subjects.................................................. 38
Application letter Requesting Approval to Use Human Subjects................................. 39
Approval Letter to Use Human Subjects ...................................................................... 42
Appendix B - Cover Letter and the Survey Instrument .................................................... 43
Cover Letter .................................................................................................................. 44
Survey Instrument......................................................................................................... 45
Appendix C - Letters Requesting Data Sent to Ohio BMV and Indiana BMV................ 49
Appendix D - Communication with ATRI ....................................................................... 53

vi
List of Figures
Figure 4.1 Merge Warning Sign Symbol (Sign W4-1) asked in Item 15 ..................................... 19
Figure 4.2 Identify Which Vehicle is Entering the Freeway Correctly ........................................ 21
Figure 4.3 Identify Which Vehicle has to Yield the Right-of-Way in Item 18 ............................ 23
Figure 4.4 Identify Which Vehicle has to Yield the Right-of-Way in Item 19 ............................ 24

vii
List of Tables
Table 4.1 Comparison of Driver’s Age Groups Distribution ....................................................... 11
Table 4.2 Comparison of Driver’s Gender Splits ......................................................................... 11
Table 4.3 How Often the Respondent Drives on Freeways.......................................................... 12
Table 4.4 How Far the Respondent Drives on Freeways.............................................................. 12
Table 4.5 For the Past One Year, the Number of On-ramp Related Crashes Seen ...................... 13
Table 4.6 For the Past One Year, the Number of On-ramp Related Near Misses Seen ............... 14
Table 4.7 For the Past One Year, the Number of On-ramp Related Crashes Involved You ........ 15
Table 4.8 For the Past One Year, the Number of On-ramp Related Near Missed Involved You 16
Table 4.9 What Do You Normally Do Before Entering the Freeway .......................................... 17
Table 4.10 What Do You Normally Do When You See a Vehicle Entering the Freeway........... 18
Table 4.11 Response Results for the Meaning of a Merge Warning Sign.................................... 19
Table 4.12 What Do You Normally Do When Entering the Freeway Via a Yield-Signed Ramp 20
Table 4.13 Responses to Item 17 on Which Vehicle is Entering Freeway Correctly................... 22
Table 4.14 Responses to Item 18 on Which Vehicle Has to Yield the Right-of-Way ................. 23
Table 4.15 Responses to Item 19 on Which Vehicle Has to Yield the Right-of-Way ................. 24
Table 4.16 Reasons that Cause Crashes at the Freeway-Ramp Merge Area ................................ 25
Table 4.17 Suggestions to Make the Freeway-Ramp Merge Areas Safer .................................... 27
Table 4.18 Drivers’ Knowledge χ2 Significance Testing Results................................................. 30

1
CHAPTER 1 - INTRODUCTION
Background
The characteristics and circumstances of interstate ramp crashes have been sparingly
studied although entrance and exit ramps are one of the locations of highest crashes per mile
driven of any segment of the interstate system. For ramp related crashes, studies have shown that
about 50 percent of all crashes occur on exit ramps and about 36 percent occur on entrance
ramps. For exit ramps, the most common type of crash is run-off-road whereby speeding was
found to be often a major factor. However, for entrance ramp the most common crash type is
rear-end and sideswipe or cutoff. These frequently involve at-fault drivers merging from
entrance ramps into the sides of other vehicles and mostly trucks already on the freeway
mainline lanes.
While speeding and ramp geometric design related factors have been studied extensively,
however, very little has been researched on the factors that contribute to on-ramp merging
drivers not yielding the right-of-way to freeway mainline-through traffic. Some states’ driver’s
testing license booklets inform new drivers of accelerating at on-ramp to attain the freeway
mainline speed. This is also in accordance with AASHTO Policy on Geometric Design of
Highways and Streets whereby auxiliary (acceleration) lanes are provided in order to minimally
affect the through traffic operations. Normally no yield sign is needed for ramps having standard
acceleration lanes. The foregoing reasons may lead some on-ramp merging drivers to think that
they share equally the right-of-way with the mainline-through traffic and hence become one of
the major causes of on-ramp area collisions.

2
Research Objectives
The aim of this study is to quantify the knowledge of drivers on who has the right-of-way
between the one on mainline lanes of a freeway or the one entering the freeway through on-ramp
junction lane. Furthermore, investigate other factors that may lead merging drivers not yielding
the right-of-way and collect any opinions drivers may have to make the on-ramp junctions safer.
Specifically, this study hypothesizes that:
1. Some drivers think that since they are supposed to accelerate on entering the freeway via
on-ramp junctions, they have the right-of-way similar to that of traffic already traveling
on freeway mainlines.
2. Since freeway on-ramp junctions with standard acceleration lanes don’t have yield signs
installed, some drivers think that they don’t have to yield the right-of-way and wait for
acceptable gaps in the mainline traffic stream to merge.
Organization of Report
Chapter 2 summarizes the literature review on various past studies and discusses a
procedure used by most states in testing the knowledge and licensing of new drivers. Chapter 3
discusses the study methodology, survey instrument, data sources, and data collection. Chapter 4
presents and discusses the study results. Chapter 5 presents the study conclusions.

3
CHAPTER 2 - LITERATURE REVIEW
Introduction
The characteristics and circumstances that cause freeway ramp crashes have not been
adequately studied although freeway-ramp areas have been identified as locations highly prone
to crashes as compared to other segments of freeways. Most previous research efforts that
studied the interchange ramp traffic crashes have concentrated in developing and calibrating
relationships between traffic crashes and highway geometry, traffic volumes, types of crashes,
frequency, and location (1, 2, 3, 4, 5). Ahammed et al. (6) studied the effect of geometry of
entrance terminals on freeway merging behavior during off-peak periods. Their study aimed at
developing an understanding of appropriate geometry of entrance ramps for safe and efficient
operation of freeways at the merge areas.
A study by McCartt et al. (7) highlighted types and characteristics of ramp-related traffic
crashes on urban interstate roadways in Northern Virginia by examining a sample of 1,150
crashes that occurred on heavily trafficked urban interstate ramps. Their results showed that
about fifty percent of all crashes occurred when at-fault drivers were in the process of exiting the
interstates, thirty six percent of at-fault drivers were entering the interstates, and sixteen percent
occurred when at-fault drivers were at the midpoints of access roads or on ramps connecting two
interstate mainlines. They concluded that run-off-road crashes were the most frequent type of
crashes associated with exiting traffic (off-ramp) and speeding was a major factor; for merging
(on-ramp) traffic, the sideswipe/cut-off type of crashes were the most frequent ones and lack of
yielding of right-of-way involving passenger car drivers merging from entrance ramps. Rear-end
4
crashes were most frequent on access roads where traffic congestion was concluded to be a
factor. They even proposed possible countermeasures to remedy the problems identified in their
study. Some suggestions were given: geometric design changes to increase ramp design speed
such as increasing curve radii to counteract run-off-road crashes for off-ramps; extending the
length of acceleration lanes for on-ramp merging crashes; and using surveillance systems that
detect congestion and variable message signs to alert drivers about congestion ahead and hence
deter rear-end type of crashes on access roads (7).
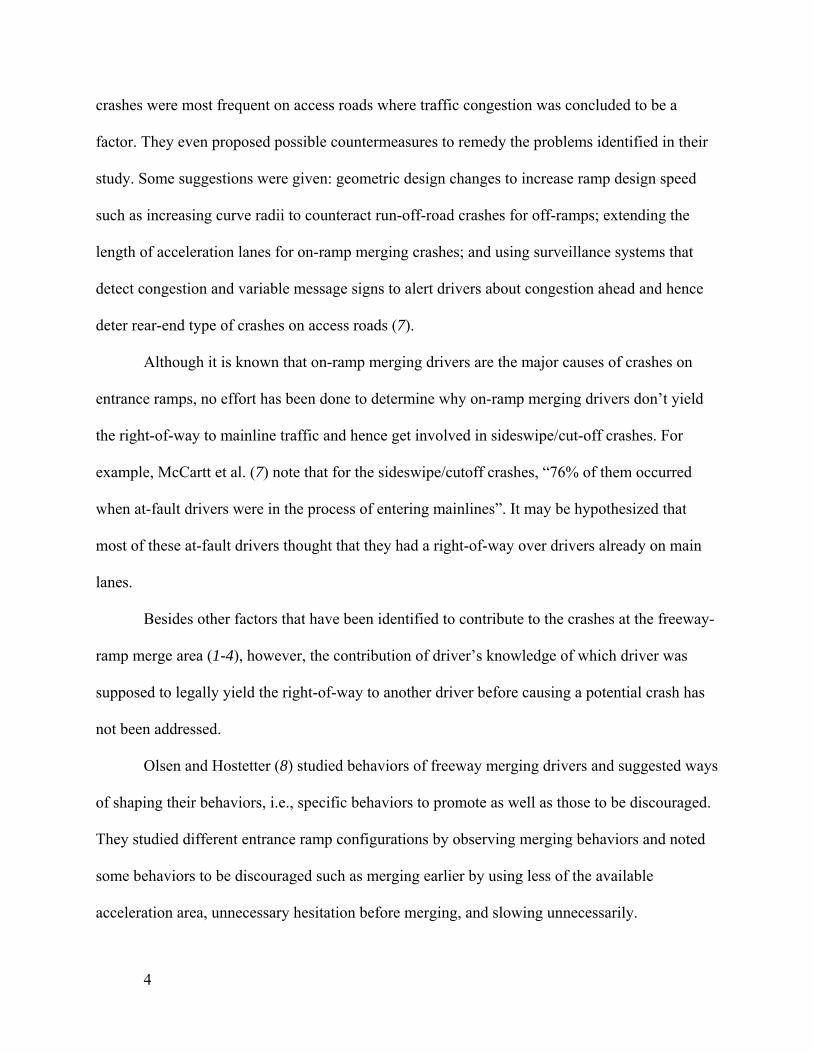
Although it is known that on-ramp merging drivers are the major causes of crashes on
entrance ramps, no effort has been done to determine why on-ramp merging drivers don’t yield
the right-of-way to mainline traffic and hence get involved in sideswipe/cut-off crashes. For
example, McCartt et al. (7) note that for the sideswipe/cutoff crashes, “76% of them occurred
when at-fault drivers were in the process of entering mainlines”. It may be hypothesized that
most of these at-fault drivers thought that they had a right-of-way over drivers already on main
lanes.
Besides other factors that have been identified to contribute to the crashes at the freeway-
ramp merge area (1-4), however, the contribution of driver’s knowledge of which driver was
supposed to legally yield the right-of-way to another driver before causing a potential crash has
not been addressed.
Olsen and Hostetter (8) studied behaviors of freeway merging drivers and suggested ways
of shaping their behaviors, i.e., specific behaviors to promote as well as those to be discouraged.
They studied different entrance ramp configurations by observing merging behaviors and noted
some behaviors to be discouraged such as merging earlier by using less of the available
acceleration area, unnecessary hesitation before merging, and slowing unnecessarily.

5
While speeding and ramp geometric design related factors have been studied extensively,
however, very little has been researched on the factors that contribute to on-ramp merging
drivers not yielding the right-of-way to freeway mainline-through traffic. Some states’ driver’s
testing license handbooks inform new drivers of accelerating at on-ramp to attain the freeway
mainline speed. This is also in accordance with AASHTO Policy on Geometric Design of
Highways and Streets whereby auxiliary (acceleration) lanes are provided in order to minimally
affect the through traffic operations (9). Normally no yield sign is needed for ramps having
standard acceleration lanes. The foregoing reasons may lead some on-ramp merging drivers to
think that they share equally the right-of-way with the mainline-through traffic and hence
become one of the major causes of on-ramp area collisions.
The purpose of this study is to quantify the knowledge of drivers on who has the right-of-
way between the one on mainline lanes of a freeway or the one entering the freeway through on-
ramp junction lane. In addition, investigate other factors that may lead merging drivers not
yielding the right-of-way and collect any opinions drivers may have to make the on-ramp
junctions safer.
Knowledge Testing and Licensing for New Drivers
In the U.S., individual states are responsible in issuing driver’s licenses in their
jurisdictions. Each state requires a driver’s license applicant to take and pass a written test as one
of the requirements before the license is issued. For most states the Department of Motor
Vehicles (DMV) or Bureau of Motor Vehicle (BMV) is the state agency authorized by law to
oversee the process of driver testing and license issuance. The driver’s test normally examines
the applicant’s knowledge and understanding of issues such as road signs, rules of the road,
vehicle operation (safe driving), etc. The state agency develops a driver’s license testing

6
handbook, which becomes the main source of driving-related knowledge for most drivers. The
license applicant is expected to review the handbook before taking the written test.
The state driver’s licensing handbooks for Ohio, Florida, Kentucky, West Virginia,
Michigan, and Indiana were reviewed. Each handbook has a section that advises drivers how to
enter a freeway (10-14). Although the detail and clarity differs somewhat, however, most of
them advise the drivers to do the following for entering the freeway safely:
• On the entrance ramp, begin checking for an opening in traffic and signal for your turn.
• Use the acceleration lane to speed up to the freeway speed. Try to adjust your speed so
that you can move into the traffic when you reach the end of the acceleration lane.
• Merge into traffic when you can do so safely. You must yield the right-of-way to traffic
on the expressway. You can’t always count on other drivers moving over to give you
room, but do not stop on an acceleration lane unless traffic is too heavy and there is no
space for you to enter safely.
Some of the handbooks include figures that show the proper way of merging into the
freeway (11-14). Only the state of Michigan includes the merge sign information in the freeway
driving section. In the road signs section, most states don’t include sufficient information and
guidance about their use and meaning. For example, the states of Kentucky and Indiana, in the
warning signs section, simply list sign symbols and short messages only, e.g., “merging traffic”
(12, 14).

7
CHAPTER 3 - SURVEY DESIGN AND DATA COLLECTION
Survey Instrument Development
The researchers developed a questionnaire with survey items that cover needed
information such as driver’s demographics, driving experience on freeways, experience with on-
ramp crashes, merging behaviors, and knowledge. The survey instrument consisted of 21 items,
which constituted of multiple choice and open-ended questions where appropriate. The first 2
items were demographic questions to categorize respondents by age group and gender. Items 3
and 4 asked the respondents to estimate on average how often they drive on freeways (in this
report, freeways include Interstate highways) and the average trip lengths for their freeway trips.
The next 8 items asked respondents to recall for the past one year if they witnessed or were
involved in either traffic crashes or in “near misses”, i.e., situations that nearly developed into
crashes in the vicinity of on-ramp merge areas. Items 13 through 16 consisted of three open-
ended questions that asked respondents to give their driving behaviors when they are on the
freeway main lanes and see a vehicle trying to merge from the entrance ramp and when they are
driving on the entrance ramp ready to merge into the freeway; and one multiple-choice item that
asked the meaning of a merge sign (W4-1) (16). Items 17 through 19 asked respondents about
the right-of-way and proper freeway merging via on-ramp junctions. The last two ( 20 and 21)
items were open-ended questions; the first one asked the respondents to give any reason(s) they
think may be the cause of freeway-ramp merge area crashes and the other requested them to give
suggestion(s) that may make freeway-ramp merge area safer.

8
The number of items was kept to 21 and fitted on two pages to encourage the respondents
to respond. A cover letter was included stating the intent of the survey and respondents were
assured that the responses will be kept anonymous as no names or any individual identifying
information was required to be included on the questionnaire. The open-ended questions were
intended for the respondents to give their understanding or what they normally do, not to guess
the correct responses from possible choices.
Since this study was designed to use human subjects as a source of data collection,
therefore, the human subjects’ approval was sought and received from the University of Dayton
Institutional Review Board (IRB) prior conducting preliminary data collection. The IRB request
and approval letters are shown in Appendix A. The cover later and the survey questionnaire used
to collect the research data are included in Appendix B.
Data Source
The original plan was to survey a representative sample of licensed drivers in western
Ohio and eastern Indiana. The research team expected to work with the Ohio Bureau of Motor
Vehicles and Indiana Bureau of Motor Vehicles in obtaining names and addresses of registered
drivers in the states of Ohio and Indiana. In addition, the research team was expecting to work
with the American Transportation Research Institute (ATRI), which is part of the American
Trucking Association (ATA) in obtaining data from professional truck drivers. The sample of
drivers to be mailed the questionnaire was to be randomly selected, stratified by age and gender,
from the lists in order to reduce biases in the survey data.
Unfortunately, both Bureaus of Motor Vehicles refused to honor the requests citing their
driver privacy protection laws that prohibit giving information of their drivers and then they be
contacted by using that information. The letters requesting drivers’ data sent to both state

9
agencies are included in Appendix C. Also, the refusal letter from Indiana Bureau of Motor
Vehicles signed by the Public Records Request Coordinator, Mr. Brad Folck is included in
Appendix C. The refusal note from Ohio Department of Public Safety was delivered via a phone
call by Mr. John. R. Guldin, the Associate Legal Counsel.
Also, ATRI’s response was not positive. Through email communication with Mr. Jeffrey
Short, the Senior Research Associate said that they normally don’t release such information but
requested the research team leader to give him a call. Through the telephone conversation, Mr.
Short said that they can only give data if they get incorporated into the research project as
research partners and be paid as a result. Due to lack of funding, the research team could not
honor the ATRI’s request. The email communication with ATRI is included in Appendix D.
The research team then decided to use local published telephone books from Greater
Dayton area and the Greater Metropolitan Cincinnati, including the City of Mason for names and
addresses. A sample of 1500 names, that included 750 males and 750 female names were
randomly selected from alphabetical listings in the phone books. Unfortunately, this procedure
could not determine the age group of the respondent when the sampling was being undertaken.
Prior to mailing the surveys, the questionnaire was internally tested by distributing it to
randomly selected University of Dayton community drivers. The results from this pilot data
collection was instrumental in helping the research team in determining whether the
questionnaire required refinement and whether the questions were well understood by the
targeted respondents. After successful implementation of the pilot data collection, the surveys
were mailed out. The mailed envelopes included the two-page questionnaire, a cover letter, and a
stamped-self addressed envelop for mailing back the surveys.

10
CHAPTER 4 - ANALYSIS AND DISCUSSION OF RESULTS
Data were analyzed by using SPSS computer statistical software. A total of 376
completed surveys were received representing a response rate of 25 percent. This is a typical
response rate as compared to other mail-out surveys (17, 18). Although the most current
telephone books were used to extract names and addresses, however, 79 surveys (about 5.3%)
could not be delivered because the addressees had already moved and could not be forwarded to
their new addresses.
Data Summaries
Demographic Items
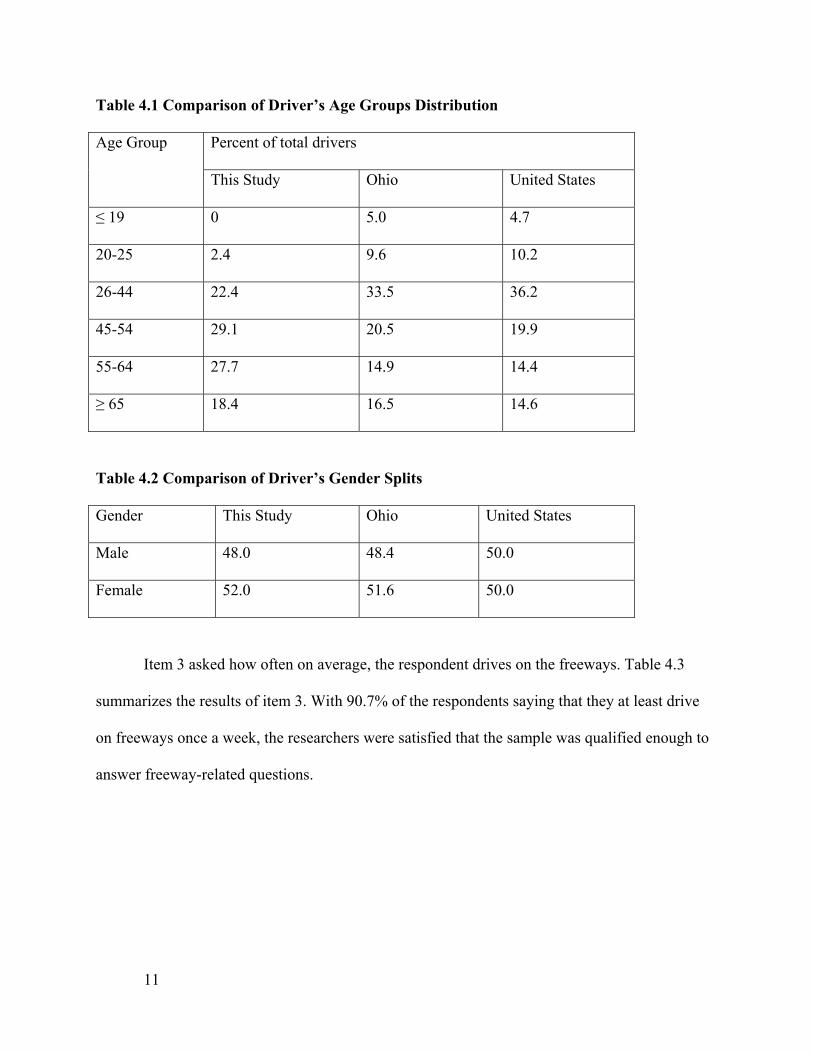
Item 1 asked the age group of respondents. The distribution of age groups is shown in
Table 4.1 and is compared with those of licensed drivers in the state of Ohio and the U.S. in 2005
(19). The results show that this study over sampled mid-age and older drivers and completely
missed the teenage drivers. The reason for under presentation of ages under 25 may be due to the
fact that most of them do not live independently or don’t head a household and hence not listed
in the telephone books.
Item 2 asked the gender of respondents. Females constituted 52.0 percent of the
respondents and 48.0 percent were males. Table 4.2 compares the gender splits for the sample
with those of the U.S. and Ohio licensed drivers (19). The gender split for this study is very close
to that of the state of Ohio. Although females are normally over sampled in studies where
participation is voluntary (20), but it does not seem to be the case in this study.
11
Table 4.1 Comparison of Driver’s Age Groups Distribution
Percent of total drivers Age Group
This Study Ohio United States
≤ 19 0 5.0 4.7
20-25 2.4 9.6 10.2
26-44 22.4 33.5 36.2
45-54 29.1 20.5 19.9
55-64 27.7 14.9 14.4
≥ 65 18.4 16.5 14.6
Table 4.2 Comparison of Driver’s Gender Splits
Gender This Study Ohio United States
Male 48.0 48.4 50.0
Female 52.0 51.6 50.0
Item 3 asked how often on average, the respondent drives on the freeways. Table 4.3
summarizes the results of item 3. With 90.7% of the respondents saying that they at least drive
on freeways once a week, the researchers were satisfied that the sample was qualified enough to
answer freeway-related questions.

12
Table 4.3 How Often the Respondent Drives on Freeways
Average Driving Frequency Number of Responses Percent
Never 5 1.3
Rarely (two time a month or less) 30 8.0
Sometimes (once a week or less) 74 19.7
Regularly (two to five times a week) 144 38.3
Almost daily (six to seven days a week) 123 32.7
Total 376 100.0
Item 4 asked on average, how far the respondent drives on freeways. Table 4.4
summarizes the results of item 4. More than 89% of respondents reported that they drive at least
six miles on the freeways.
Table 4.4 How Far the Respondent Drives on Freeways
Average Driving Distance Number of Responses Percent
Never 5 1.3
One to two miles 4 1.1
Three to five miles 31 8.2
Six to ten miles 108 28.7
Over ten miles 228 60.6
Total 376 100.0
13
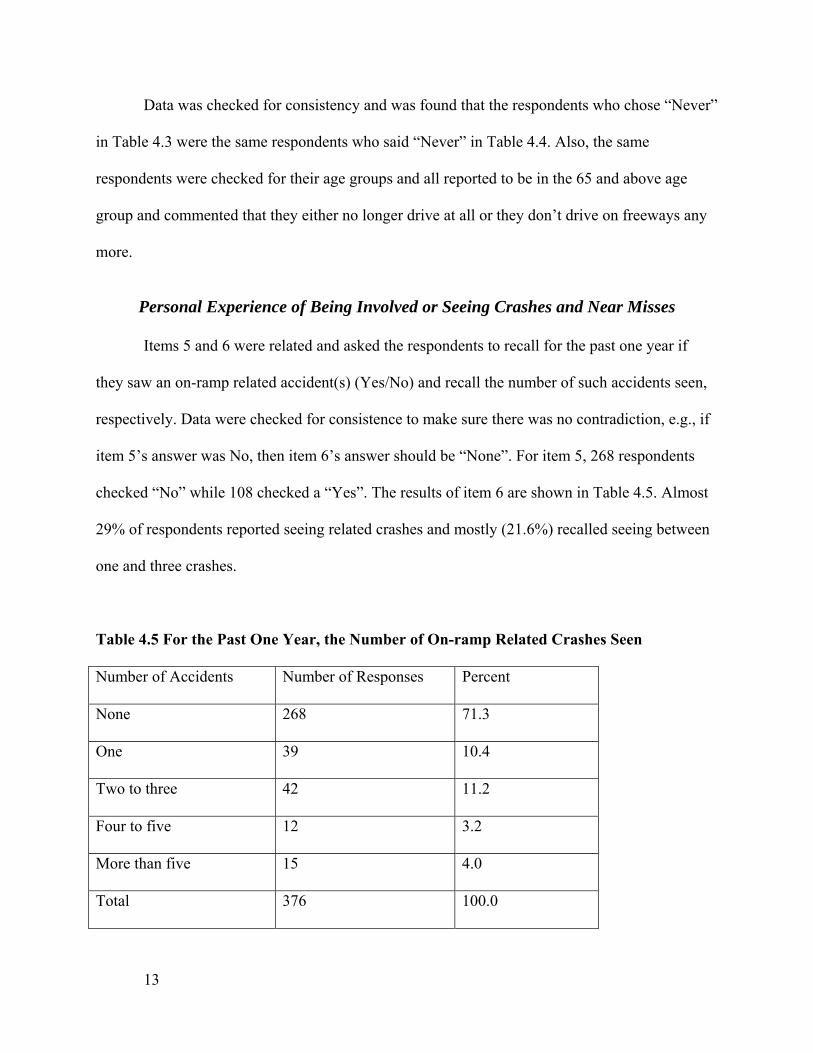
Data was checked for consistency and was found that the respondents who chose “Never”
in Table 4.3 were the same respondents who said “Never” in Table 4.4. Also, the same
respondents were checked for their age groups and all reported to be in the 65 and above age
group and commented that they either no longer drive at all or they don’t drive on freeways any
more.
Personal Experience of Being Involved or Seeing Crashes and Near Misses
Items 5 and 6 were related and asked the respondents to recall for the past one year if
they saw an on-ramp related accident(s) (Yes/No) and recall the number of such accidents seen,
respectively. Data were checked for consistence to make sure there was no contradiction, e.g., if
item 5’s answer was No, then item 6’s answer should be “None”. For item 5, 268 respondents
checked “No” while 108 checked a “Yes”. The results of item 6 are shown in Table 4.5. Almost
29% of respondents reported seeing related crashes and mostly (21.6%) recalled seeing between
one and three crashes.
Table 4.5 For the Past One Year, the Number of On-ramp Related Crashes Seen
Number of Accidents Number of Responses Percent
None 268 71.3
One 39 10.4
Two to three 42 11.2
Four to five 12 3.2
More than five 15 4.0
Total 376 100.0

14
Items 7 and 8 were related and asked the respondents to recall for the past one year if
they saw on-ramp near misses i.e., situations that nearly resulted into crashes (Yes/No) and recall
the number of such incidents seen, respectively. For item 7, 93 respondents checked “No” and
283 checked “Yes”. Again, data were checked for consistence. The results of item 8 are shown in
Table 4.6. While 29% saw actual crashes on the freeway-entrance ramp merge areas, more than
75% saw near misses on the freeway-entrance ramp merge areas (with over 63% seeing more
than 2 near misses in the past twelve months), which means that for some reasons, many
potential crashes are more likely to end up into near misses.
Table 4.6 For the Past One Year, the Number of On-ramp Related Near Misses Seen
Number of Near Misses Number of Responses Percent
None 93 24.7
One 43 11.4
Two to three 130 34.6
Four to five 43 11.4
More than five 67 17.8
Total 376 100.0
Items 9 and 10 were related and asked the respondents to recall for the past one year if
they were involved in on-ramp related crashes (Yes/No) and recall the number of such crashes
they were involved, respectively. Data were checked for consistence. A total of 363 respondents
reported not involved in such crashes and only 13 recalled being involved in crashes. The results
of item 10 are shown in Table 4.7. This means that about 3.5% (about 1 out of 29 sampled

15
drivers) reported being involved in on-ramp-related crashes. This is a little higher than the 2005
national average of reported driver’s crash involvement of about 3.1% (about 1 crash for every
33 licensed drivers in the U.S. in 2005) (21) Although some studies have found self-reporting
bias where respondents are more likely to underreport their socially inappropriate behaviors (17,
22, 23, 24), however, it does not seem to be a problem in this case.
Table 4.7 For the Past One Year, the Number of On-ramp Related Crashes Involved You
Number of Accidents Number of Responses Percent
None 363 96.5
One 9 2.4
Two to three 0 0.0
Four to five 2 0.5
More than five 2 0.5
Total 376 100.0
Items 11 and 12 were related and they asked the respondents to recall for the past one
year if they were involved in on-ramp near misses (Yes/No) and recall the number of such
incidents they were involved, respectively. Data were checked for consistence. A total of 188
respondents (50.1 %) survived situation(s) where accidents almost happened while 187
respondents did not recall being involved in such situations. Similarly, while about 3.5%
reported being involved in on-ramp related crashes, more than 50% of them survived situation(s)
were crashes almost happened. Again, we can see that crashes are relatively rare events as

16
compared to the prevalence of potential near misses, which can not be reported or documented in
the police reports. The results of item 12 are shown in Table 4.8.
Table 4.8 For the Past One Year, the Number of On-ramp Related Near Missed Involved
You
Number of Near Misses Number of Responses Percent
None 187 49.9
One 68 18.1
Two to three 89 23.7
Four to five 16 4.3
More than five 15 4.0
Total 375* 100.0
*One person did not respond to this question.
Driving Behavior at Merging Area and Meaning of a Merge Sign Items
Item 13 was an open-ended question that asked respondents to explain what they
normally do before entering a freeway at an on-ramp. The research team did not want to
influence drivers by providing them with multiple choice answers when responding to their
driving behaviors. Since this was an open-ended question, responses were read carefully and
coded into major categories. Table 4.9 shows the coded response categories. It seems 29% of the
respondents were likely to enter the freeway without extra caution by thinking that speeding to
the freeway speed is the only requirement for proper entrance. About 4% did not respond to this
question.

17
Table 4.9 What Do You Normally Do Before Entering the Freeway
Response Category No. of Responses Percent
Speed up 109 29.0
Caution for safe or smooth merge by adjusting speed 183 48.7
Look in side mirror/behind to check for on-coming
traffic in near lane
55
14.6
Get to speed of traffic and look in side mirror/behind
for on-coming traffic in near lane
4
1.1
Caution for safe speed or smooth merge, look in side
mirror/behind to check for on-coming traffic in near
lane, and put on turn signal
8
2.1
Pray and watch out 1 0.3
No response 16 4.3
Total 376 100.0
Item 14 was similar to item 13 except that the respondents were asked when driving on
the freeway main lanes and see a vehicle entering via an on-ramp what do they normally do. The
responses are given in Table 4.10. While most of the respondents showed some courtesy (93.7%)
to entering drivers, 4.5% did not respond to the question and only 1.6% of them don’t care about
entering drivers. It is interesting to note that while 93.7% report to act properly when
approaching the merge area when driving on freeway main lanes; only 66% (refer to Table 4.9)
seem to act correctly when entering the freeway from entrance ramps. This can partly explain
why some studies had found out that entering drivers are most of the time at fault for crashes that
18
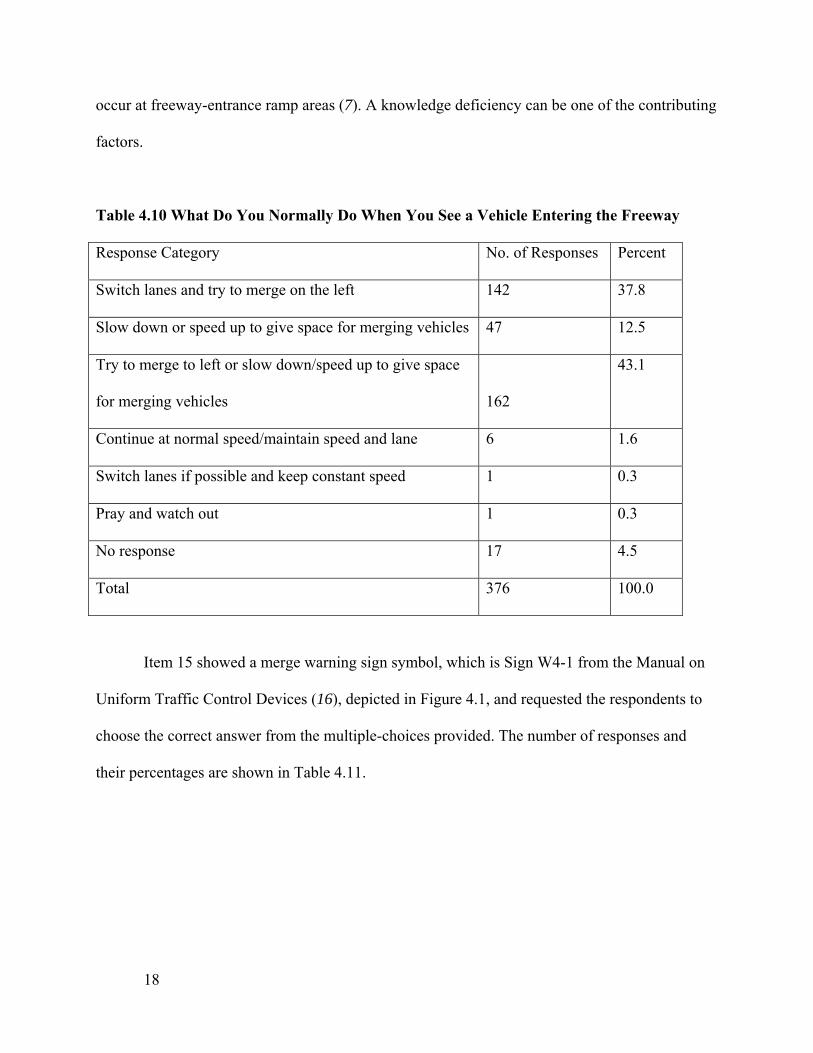
occur at freeway-entrance ramp areas (7). A knowledge deficiency can be one of the contributing
factors.
Table 4.10 What Do You Normally Do When You See a Vehicle Entering the Freeway
Response Category No. of Responses Percent
Switch lanes and try to merge on the left 142 37.8
Slow down or speed up to give space for merging vehicles 47 12.5
Try to merge to left or slow down/speed up to give space
for merging vehicles
162
43.1
Continue at normal speed/maintain speed and lane 6 1.6
Switch lanes if possible and keep constant speed 1 0.3
Pray and watch out 1 0.3
No response 17 4.5
Total 376 100.0
Item 15 showed a merge warning sign symbol, which is Sign W4-1 from the Manual on
Uniform Traffic Control Devices (16), depicted in Figure 4.1, and requested the respondents to
choose the correct answer from the multiple-choices provided. The number of responses and
their percentages are shown in Table 4.11.

19
Figure 4.1 Merge Warning Sign Symbol (Sign W4-1) asked in Item 15
Table 4.11 Response Results for the Meaning of a Merge Warning Sign
Response Category No. of Responses Percent
A highway point where entering vehicles have no dedicated
acceleration lane and you should exercise caution
1
0.3
A highway point where entering vehicles have a dedicated
acceleration lane and no need for you to do anything
196
52.1
A highway point where entering vehicles have a dedicated
acceleration lane and no need for you to do anything
3
0.8
A highway point where entering vehicles have a dedicated
acceleration lane and you should pay close attention to
entering traffic
163
43.4
I am not sure 13 3.5
Total 376 100.0
According to the definition of merge sign given in the Manual on Uniform Traffic
Control Devices (16), choices B and D are correct answers because the MUTCD does not

20
mention whether the acceleration lane is provided or not. Therefore, only about 4.6% of the
respondents did not understand the meaning of the symbol.
Item 16 almost has the same meaning as item 13 except that respondents were asked what
action they normally take before entering a freeway when driving on a single-lane ramp with a
yield sign. The responses were coded and are summarized in Table 4.12. When comparing with
item 13, the drivers who reported that they “just speed up” drops from 29.0% to 7.4% when the
yield sign is posted on the entrance ramp.
Table 4.12 What Do You Normally Do When Entering the Freeway Via a Yield-Signed
Ramp
Response Category No. of Responses Percent
Slow down and watch traffic to enter safely and be able
to stop if necessary
262
69.7
Yield to vehicles on the highway/check over my
shoulder
57
15.2
Speed up 28 7.4
Slow down and watch traffic on main lanes, yield to
vehicles on the highway, and put on turn signal
4
1.1
Look for gap in traffic and try to enter at freeway speed 2 0.5
Pray and watch out 1 0.3
No response 22 5.9
Total 376 100.0

21
The results of Table 4.9 and Table 4.12 indicate that there is a higher chance that most
drivers act correctly when entering a freeway via a yield-signed entrance ramp as compared to
the normal entrance ramp with a standard length of acceleration lane (where normally no yield
sign is posted).
Knowledge and Right-of-Way Items
Item 17 was a freeway entrance knowledge question that included a picture depicted in
Figure 4.2 showing two vehicles A and B entering the freeway from an on-ramp and requested
the respondents to tell which vehicle is entering the freeway correctly. Five choices were given
and the respondents were supposed to select only one correct choice. The responses to this item
are summarized in Table 4.13.
Figure 4.2 Identify Which Vehicle is Entering the Freeway Correctly
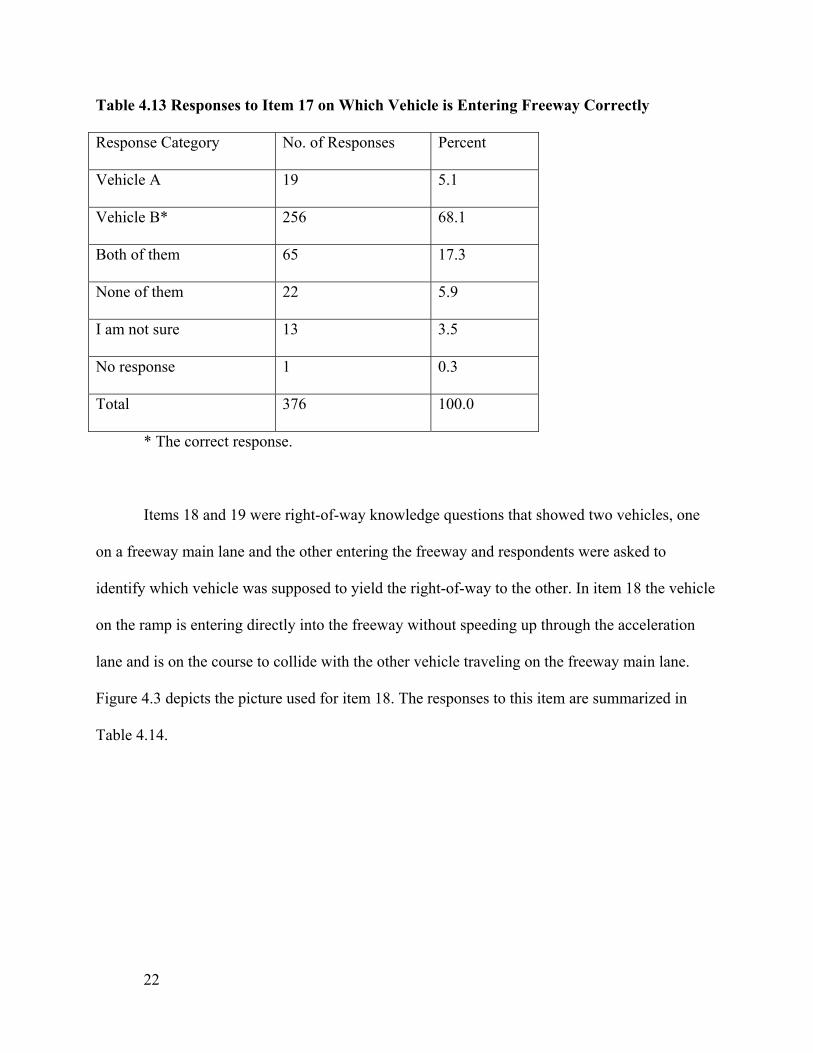
Although most states’ driving handbooks include a figure almost similar to Figure 4.2
advising proper freeway entrance (11-14), only 68.1% of respondents chose a correct answer.
The reason for lower than expected understanding of proper on-ramp merge driving behaviors
may be due to Ohio’s handbook not including the figure which shows the proper location on the
merging area (10).
22
Table 4.13 Responses to Item 17 on Which Vehicle is Entering Freeway Correctly
Response Category No. of Responses Percent
Vehicle A 19 5.1
Vehicle B* 256 68.1
Both of them 65 17.3
None of them 22 5.9
I am not sure 13 3.5
No response 1 0.3
Total 376 100.0
* The correct response.
Items 18 and 19 were right-of-way knowledge questions that showed two vehicles, one
on a freeway main lane and the other entering the freeway and respondents were asked to
identify which vehicle was supposed to yield the right-of-way to the other. In item 18 the vehicle
on the ramp is entering directly into the freeway without speeding up through the acceleration
lane and is on the course to collide with the other vehicle traveling on the freeway main lane.
Figure 4.3 depicts the picture used for item 18. The responses to this item are summarized in
Table 4.14.

23
Figure 4.3 Identify Which Vehicle has to Yield the Right-of-Way in Item 18
Table 4.14 Responses to Item 18 on Which Vehicle Has to Yield the Right-of-Way
Response Category No. of Respondents Percent
Vehicle A* 327 87.0
Vehicle B 30 8.0
The first vehicle to reach there has the right of way 3 0.8
None of them 5 1.3
I am not sure 11 2.9
Total 376 100.0
* The correct response.
The difference between items 18 and 19 was the location of the entering vehicles on the
acceleration lane. In item 19 the vehicle on the ramp is entering correctly after speeding up on
acceleration lane but it is on the collision course with another vehicle traveling on the freeway
main lane. Figure 4.4 depicts the graphic that was used for item 19 and the responses for this
item are summarized in Table 4.15.

24
Figure 4.4 Identify Which Vehicle has to Yield the Right-of-Way in Item 19
Table 4.15 Responses to Item 19 on Which Vehicle Has to Yield the Right-of-Way
Response Category No. of Respondents Percent
Vehicle A* 264 70.2
Vehicle B 87 23.1
The first vehicle to reach there has the right of way 4 1.1
None of them 8 2.1
I am not sure 13 3.5
Total 376 100.0
* The correct response.
The results of items 18 and 19 are very interesting. When vehicle A is entering
improperly (Figure 4.3), most respondents, over 87% chose a correct answer, but when the same
vehicle is entering properly (Figure 4.4), correct responses drop to about 70%. This may be a
serious issue of right of way knowledge when drivers are entering and merging into a freeway.
The results of items 18 and 19 (Tables 4.14 and 4.15) just complement the results of item 13
(Table 4.9) in confirming that there is a knowledge problem among drivers in regard with proper
driving in the vicinity of freeway-entrance ramp areas.

25
Drivers’ Opinions on Reasons that Cause Freeway-Ramp Merge Area Crashes
Item 20 consisted of an open-ended question inquiring the respondents to provide any
reason(s) they think may be the cause of vehicle crashes at the freeway-ramp merge area. Some
respondents mentioned several reasons and that is why the sum of the number of responses in
Table 4.16 is higher than the number of respondents. The reasons given by drivers were coded
and categorized as shown in Table 4.16.
Table 4.16 Reasons that Cause Crashes at the Freeway-Ramp Merge Area
Reason Category No. of Responses Percent*
Speed – drivers don’t adjust speed to another driver’s speed
(too slow when entering)
82
19.8
Lack of attention/talking on cell phone 94 22.7
Yielding problem/drivers’ bad attitudes (not courteous) 156 37.6
Some drivers don’t know who has the right of way on the
freeway
43
10.4
Lack of knowledgeable drivers 27 6.5
Heavy traffic 12 2.9
Acceleration lanes too short, difficult to speed up so quickly 1 0.2
No response 58
* Values shown are percentages of total valid reasons only (excluding no responses).
Although a no response category to this question was relatively high (15.4% of
respondents), however, for those who responded gave very important reasons, which are not
26
surprises to traffic engineers, but it was pleasing to note that even drivers know the root causes of
some specific types of highway crashes. Interestingly, most of the respondents did not mention
heavy traffic/congestion as a major problem, with only 2.9% of them mentioning it as one of the
causes of freeway-entrance merge area crashes, while ranking highest the lack of yielding/bad
attitudes as the main cause followed by lack of attention/talking on cell phone. The major
reasons given can be grouped into two main categories: lack of knowledge and bad behavior.
About 60% of the drivers who responded to the question believe that the freeway-entrance ramp
crashes are due to bad driver behaviors (attention and yielding problems) while almost 37% of
them point out the lack of knowledge (speed choice, about the right of way, and general
knowledge problems). Hence, driver’s behavior and lack of knowledge together have been
blamed as the main causes of the freeway-entrance ramp merge area crashes by a total of about
97% of the drivers who responded to the question. The drivers’ beliefs are in agreement with a
study by GMAC Insurance (25), which suggests that many U.S. drivers find basic practices, such
as merging and interpreting road signs difficult. In addition, the GMAC study reports that drivers
not only lack basic road knowledge, but exhibit dangerous driving as well. Drivers in the
Northwest and Mid-Atlantic states did worst in the GMAC study.
Drivers’ Suggestions to Make the Freeway-Ramp Merge Areas Safer
Item 21 was the last question, which asked the respondents to give suggestion(s) that may
make the freeway-ramp merge areas safer. Some respondents mentioned several reasons as well.
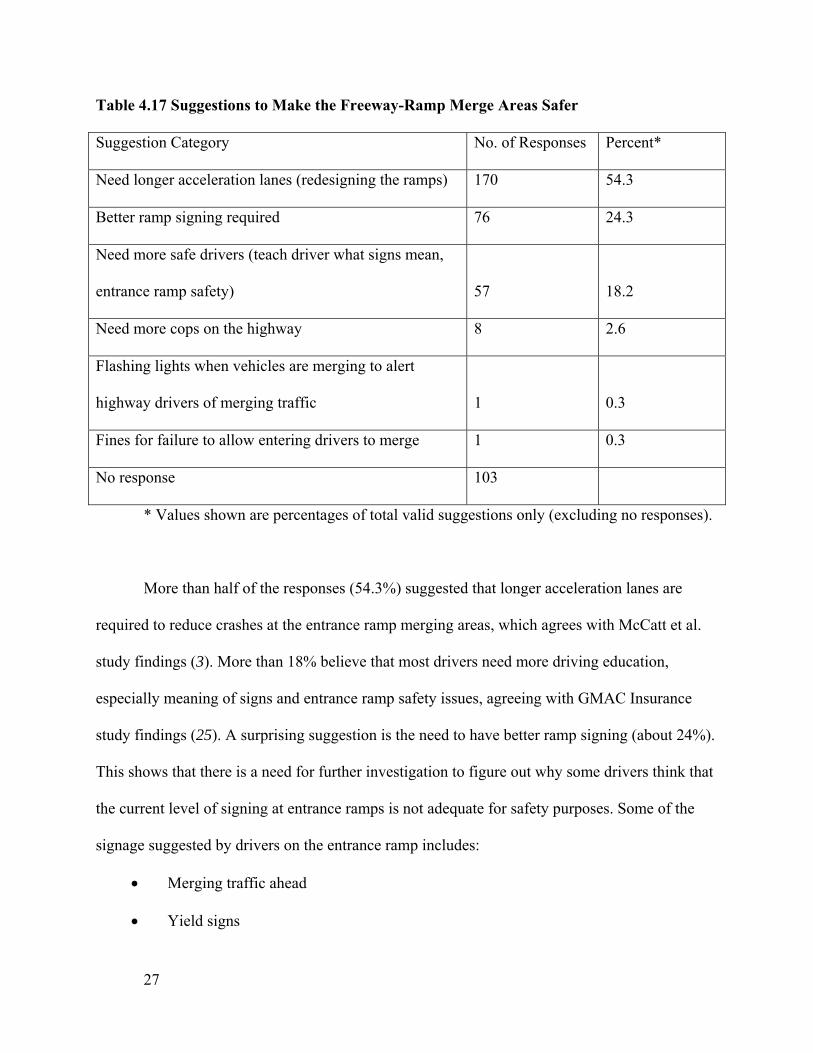
The suggestions given by drivers were coded and categorized as shown in Table 4.17.
27
Table 4.17 Suggestions to Make the Freeway-Ramp Merge Areas Safer
Suggestion Category No. of Responses Percent*
Need longer acceleration lanes (redesigning the ramps) 170 54.3
Better ramp signing required 76 24.3
Need more safe drivers (teach driver what signs mean,
entrance ramp safety)
57
18.2
Need more cops on the highway 8 2.6
Flashing lights when vehicles are merging to alert
highway drivers of merging traffic
1
0.3
Fines for failure to allow entering drivers to merge 1 0.3
No response 103
* Values shown are percentages of total valid suggestions only (excluding no responses).
More than half of the responses (54.3%) suggested that longer acceleration lanes are
required to reduce crashes at the entrance ramp merging areas, which agrees with McCatt et al.
study findings (3). More than 18% believe that most drivers need more driving education,
especially meaning of signs and entrance ramp safety issues, agreeing with GMAC Insurance
study findings (25). A surprising suggestion is the need to have better ramp signing (about 24%).
This shows that there is a need for further investigation to figure out why some drivers think that
the current level of signing at entrance ramps is not adequate for safety purposes. Some of the
signage suggested by drivers on the entrance ramp includes:
• Merging traffic ahead
• Yield signs

28
• Yield to freeway traffic
• Get up to highway speed quickly
Analysis of Drivers’ Knowledge
Further analysis was performed to found out about the respondents who knew correct
merging behaviors versus those who did not. The responses of the knowledge questions (items
13, 14, 17, 18, and 19) were decoded into “correct” and “wrong” responses and the responses
were statistically tested by using χ2 (chi-square test of independence) at α = 0.05 based on each
of the following groups:
• Age (age groups: 20-25, 26-44, 45-54, 55-64, and 65+): knowledge questions’ results
were statistically tested to determine whether there were significant differences in
responses given by different age groups.
• Gender (male/female): knowledge questions’ results were statistically tested to determine
whether there was a significant difference between male’s and female’s responses.
• Driving frequency (frequent driver/infrequent driver): knowledge responses’ results were
statistically tested to determine whether there was a significant difference between the
responses given by frequent freeway drivers and infrequent freeway drivers. Frequent
drivers were defined as those who were categorized as “regularly” and “almost daily”
drivers and infrequent drivers constituted the “never”, “rarely”, and “sometimes”
categorized drivers (refer to Table 4.3).
• Seen crashes (Yes/No): knowledge responses’ results were statistically tested to
determine whether there was a significant difference between the responses given by
drivers who recalled seeing on-ramp related crashes the past one year and those drivers
who could not recall seeing any such crashes.

29
• Seen near misses (Yes/No): knowledge responses’ results were statistically tested to
determine whether there was a significant difference between the responses given by
drivers who recalled seeing on-ramp related near misses the past one year and those
drivers who could not recall seeing any such near misses.
• Involved in crashes (Yes/No): knowledge responses’ results were statistically tested to
determine whether there was a significant difference between the responses given by
drivers who recalled being involved in on-ramp related crashes the past one year and
those drivers who could not recall being involved in such crashes.
• Involved in near misses (Yes/No): knowledge responses’ results were statistically tested
to determine whether there was a significant difference between the responses given by
drivers who recalled being involved in on-ramp related near misses the past one year and
those drivers who could not recall being involved in such near misses.
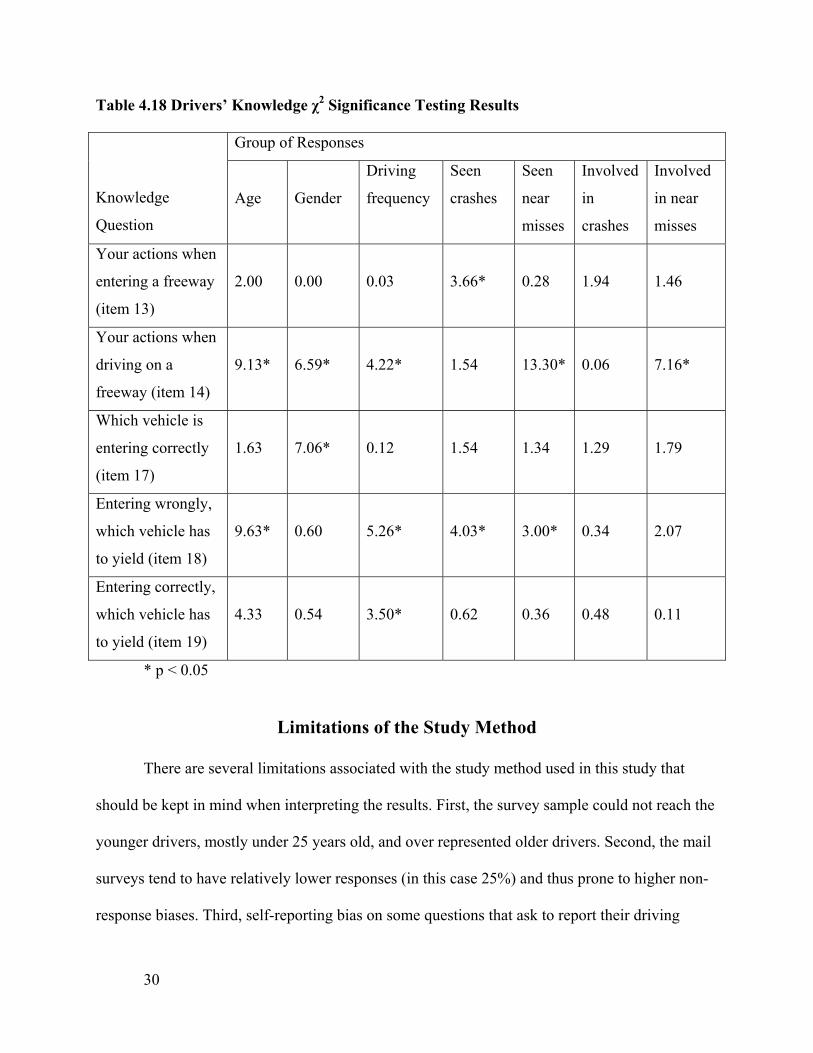
Table 4.18 summarizes the χ2 significance testing results of the driver groups’ on
knowledge questions. From Table 4.18, it is only being “involved in crashes” group that the
responses to all knowledge questions were not significantly different between those who said
“Yes” and “No” to the item question. For age, where the differences were significant, it is the 20-
25 and 65+ age groups whose knowledge was significantly lower than the other age groups.
Interestingly, for gender, females showed significantly higher knowledge on item 14 while males
were higher for item 17. Also, for driving frequency group, frequent freeway drivers exhibited
significantly higher knowledge than their infrequent counterparts on items 14, 18, and 19).
Besides these, no clear picture of other group attributes that can help to identify the differences
in knowledge as far as the freeway-merge area safety is concerned (based on data collected in
this study).
30
Table 4.18 Drivers’ Knowledge χ2 Significance Testing Results
Group of Responses
Knowledge
Question
Age
Gender
Driving
frequency
Seen
crashes
Seen
near
misses
Involved
in
crashes
Involved
in near
misses
Your actions when
entering a freeway
(item 13)
2.00
0.00
0.03
3.66*
0.28
1.94
1.46
Your actions when
driving on a
freeway (item 14)
9.13*
6.59*
4.22*
1.54
13.30*
0.06
7.16*
Which vehicle is
entering correctly
(item 17)
1.63
7.06*
0.12
1.54
1.34
1.29
1.79
Entering wrongly,
which vehicle has
to yield (item 18)
9.63*
0.60
5.26*
4.03*
3.00*
0.34
2.07
Entering correctly,
which vehicle has
to yield (item 19)
4.33
0.54
3.50*
0.62
0.36
0.48
0.11
* p < 0.05
Limitations of the Study Method
There are several limitations associated with the study method used in this study that
should be kept in mind when interpreting the results. First, the survey sample could not reach the
younger drivers, mostly under 25 years old, and over represented older drivers. Second, the mail
surveys tend to have relatively lower responses (in this case 25%) and thus prone to higher non-
response biases. Third, self-reporting bias on some questions that ask to report their driving

31
behaviors are more likely to report better behaviors than otherwise. Fourth, some people may
have difficulty to recall correctly the number of incidences encountered on highways for the past
12 months.
32
CHAPTER 5 - Conclusions
Besides the study limitations given, the authors believe that the responses given by
sampled drivers in this study provide important insights to regard with drivers’ knowledge of
right-of-way issues at the freeway on-ramp merge area. This study has shown that even though
crashes have been rare events, however, there is a higher chance most potential crashes never
happen, for some reasons, result into near misses, which can not be reported and documented.
Although most drivers indicated that they act correctly when driving on freeway
mainlines when they see a vehicle trying to merge from an entrance ramp, the same drivers seem
to act improperly when merging into freeway from on-ramp lanes. This may be a reason why
some research efforts have found that the on-ramp merging vehicles have been at-fault when
such collisions happen. This problem is amplified when noting that some drivers could not
identify which driver has the right-of-way at the merge area between the mainline and the on-
ramp drivers. The main causes of crashes occurring at freeway-entrance merging areas may be
grouped into two categories: (1) knowledge problems: drivers’ lack of knowledge of right-of-
way and proper emerging, and (2) behavioral problems: lack of attention when driving and bad
attitudes (lack of courtesy) to others.
It is equally surprising that almost 32% of the sampled drivers could not identify the
proper way of merging into the freeway. Younger (20-25) and older (65+) drivers showed
significantly lower knowledge for most of the items asked compared to other age groups. Also,
the infrequent freeway drivers showed the same problems when compared to frequent drivers.
33
Drivers identified that lack of yielding/bad attitudes is a leading cause of freeway-ramp
merge areas followed by lack of attention/talking on cell phone and drivers entering the freeway
at low speeds thus affecting the rest of the traffic.
Most of the drivers believe that they need longer acceleration lanes, better ramp signing
and better driver’s education especially in terms of sign meaning and entrance ramp safety in
order to make freeway-ramp merge areas safer. There is a serious need for the driver licensing
agencies to improve freeway related information in their driver’s licensing manuals.
34
References
1. Bauer, K. M. and D. W. Harwood. Statistical Models of Accidents on Interchange
Ramps and Speed-Change Lanes. Publication FHWA-RD-97-106, FHWA, U.S.
Department of Transportation, 1997.
2. Janson, B. N., W. Awad, and J. Robles. Truck Accidents at Freeway Ramps: Data
Analysis and High-Risk Site Identification. In Journal of Transportation and
Statistics, Vol. 1, Issue 1, BTS, 1998, pp. 75-92.
3. Lord, D. and J. A. Bonneson. Calibration of Predictive Models for Estimating the
Safety of Ramp Design Configurations. In Transportation Research Record: Journal
of the Transportation Research Board, No. 1908, TRB, National Research Council,
Washington, D.C., 2005, pp. 88-95.
4. Liapis, E. D., B. Psarianos, and E. Kasapi. Speed Behavior Analysis at Curved Ramp
Sections of Minor Interchanges. In Transportation Research Record: Journal of the
Transportation Research Board, No. 1751, TRB, National Research Council,
Washington, D.C., 2001, pp. 35-43.
5. Hunter, M., R. Machemehl, and A. Tsyganov. Operational Evaluation of Freeway
Ramp Design. In Transportation Research Record: Journal of the Transportation
Research Board, No. 1751, TRB, National Research Council, Washington, D.C.,
2001, pp. 90-100.

35
6. Ahammed, A. M., Y. Hassan, and T. A. Sayed. Effect of Geometry of Entrance
Terminals on Freeway Merging Behavior. In TRB 2006 Annual Meeting. CD-ROM.
Transportation Research Board of the National Academies, Washington, D.C., 2006.
7. McCartt, A. T., V. S. Northrup, and R. A. Retting. Types and Characteristics of
Ramp-Related Motor Vehicle Crashes on Urban Interstate Roadways in North
Virginia. In Journal of Safety Research, Vol. 35, Elsevier Science Ltd., New York,
NY 2004, pp. 107-114.
8. Olsen, R. A. and R. S. Hostetter. Describing and Shaping Merging Behavior of
Freeway Drivers. In Transportation Research Record: Journal of the Transportation
Research Board, No. 605, TRB, National Research Council, Washington, D.C., 1976,
pp. 7-13.
9. American Association of State Highway and Transportation Officials. A Policy on
Geometric Design of Highways and Streets. AASHTO, Washington, D.C., 2004.
10. Digest of Ohio Motor Vehicle Laws. Ohio Department of Public Safety, Columbus,
OH (undated).
11. Florida Driver’s Handbook. Department of Highway Safety and Motor Vehicles,
Tallahassee, FL, August 2006.
12. Kentucky Drivers Manual. Kentucky Transportation Cabinet, Frankfort, KY
(undated).
13. Driver Licensing Handbook. Division of Motor Vehicles, West Virginia Department
of Transportation, Charleston, WV, June 2006
14. Indiana Driver Licensing Manual. Joel Silverman, Commissioner, Indiana Bureau of
Motor Vehicles, Indianapolis, IN, 2005.

36
15. State of Michigan: What Every Driver Must Know. Terry Lynn Land, Secretary of
State, Department of State, Lasing, MI, February 2006.
16. Manual on Uniform Traffic Control Devices. FHWA, U.S. Department of
Transportation, 2003.
17. Mutabazi, M. and K. Nanan. Trinidad Motorists Understanding Zebra Pedestrian
Crossing. In TRB 2006 Annual Meeting. CD-ROM. Transportation Research Board of
the National Academies, Washington, D.C., 2006.
18. Van Hemel, S. B. and W. C. Rogers. Survey of Truck Drivers’ Knowledge and
Beliefs Regarding Driver Fatigue. In Transportation Research Record: Journal of the
Transportation Research Board, No. 1640, TRB, National Research Council,
Washington, D.C., 1998, pp. 65-73.
19. FHWA Office of Highway Policy Information. Highway Statistics 2005; Section III:
Driver Licensing. www.fhwa.dot.gov/policy/ohpi/qfdrivers.htm. Accessed July 5,
2007.
20. Chatterjee, A., G. Evans, S. H. Richards, and H. Hafford. Safety Belt Use in
Tennessee. In ITE Journal, Vol. 61, No. 1, Institute of Transportation Engineers,
Washington, D.C., 1991, pp 23-27.
21. National Highway Traffic Safety Administration (NHTSA). Traffic Safety Facts
2005. www-nrd.nhtsa.dot.gov/Pubs/TSF2005.PDF. Accessed November 5, 2007.
22. Parada, M. A., L. D. Cohn, E. Gonzalez, T. Byrd, and M. Cortes. The Validity of
Self-reported Seatbelt Use: Hispanic and non-Hispanic Drivers in El Paso. In
Accident Analysis and Prevention, Vol. 33, No. 1, Elsevier Science Ltd., New York,
NY, 2001, pp 139-143.

37
23. McKenna, F. P. It Won’t Happen to Me: Unrealistic Optimism or Illusion of Control?
In British Journal of Psychology, Vol. 84, British Psychological Society, London,
England, 1993, pp. 39-50.
24. Williams, A. F. Views of U.S. Drivers About Driving Safety. In Journal of Safety
Research, Vol. 34, Issue 5, Elsevier Science Ltd., New York, NY, 2003, pp 491-494.
25. CNN/Money. Survey Ranks States with Dumbest Drivers.
www.cnn.com/2005/AUTOS/05/26/drivers_study/index.html. May 27, 2005, Posted
3:15 p.m. EDT. Accessed April 10, 2007.

38
Appendix A - Approval Letters to Use Human Subjects
This appendix includes a letter submitted to the Institutional Review Board (IRB) seeking
permission to collect data from human subjects and the corresponding permission letter from
IRB.

39
Application letter Requesting Approval to Use Human Subjects
INSTITUTIONAL REVIEW BOARD FOR THE PROTECTION OF HUMAN SUBJECTS IN RESEARCH
Application for IRB Review The federal government and University policy require that the involvement of human participants in research be monitored by an Institutional Review Board (IRB). The University of Dayton’s IRB works to ensure that appropriate ethical standards and statutory requirements governing the protection of human participants are followed by all researchers affiliated with the University of
Dayton and/or those researchers who wish to conduct research on the University of Dayton campus or among University of Dayton students. The information requested must be provided when humans are to be involved in research studies, whether these studies are internally funded, externally funded, or unfunded (e.g., student research projects, dissertations, theses, scholarly papers). Research involving animals should be submitted to the Animal Use Committee (IACUC). One hard copy with original signatures and one electronic copy (CD, disk, or email attachment) of the complete application must be submitted to: Jon Nieberding Chair, University of Dayton IRB 300 College Park Dayton, OH 45469-0104 A complete application includes the following:
1. Copies of all instruments and consent/assent forms to be used, and 2. Answers to all of the questions on pages 2-4 of this application form.
This cover sheet need not be included in the application. It is for informational purposes only. For those of you on the UD campus, the IRB office is located in Room 542, Kettering Laboratories. Email submissions should be directed to [email protected]. Research projects on which data collection has already begun cannot be reviewed or approved by the IRB. The maximum time period between the date of receipt of your application and the approval/denial/request for revision or clarification letter is three (3) weeks. Please consider this timeline when planning your application. All student submissions (papers, dissertations, theses) must have faculty sponsorship.

40
Researcher(s):_Deogratias Eustace_____________________________________________ Date of Submission: __March 29, 2007_________________________________________ Project Title: _Evaluation of the Role of Driver’s Knowledge of Who Has the Right-of-Way Contributes to Interstate On-Ramp Crashes_____________________________________ Position in the University (faculty, student, etc.). If student, please indicate faculty sponsor: ___Faculty_______________________________________________________________ Department: __Civil and Environmental Engineering and Engineering Mechanics__ _____ Telephone: ________9-2984_________________________________________________ Email address: [email protected]_____________________________________________ Mailing address: ___+0243__________________________________________________ ________________________________________________________________________ Project is for (please check all that apply): scholarly research_____ dissertation ____ Thesis ____ class project _____ funded project ___X__ other (specify): _______________ Project is: ________ unfunded ___X_____ funded (if funded, please complete the following) Funding agency (actual/potential): __U.S. Department of Transportation_________ Contract/Grant No. (if applicable): ________SA0710213_____________________ For evaluation of your project, please check any of the following that apply. __ Mentally or physically challenged participants __ Participants studied at UD __ Children or minor participants (under 18) X_ Subjects at non-UD locations __ Prisoners, parolees, or incarcerated subjects X Students as subjects __ Filming, video or audio recording of subjects X Employees as subjects X Questionnaires or surveys to be administered __ Pregnant subjects __ Use of data banks, archives or other records __ Involves blood samples __ Subjects major language is not English __ Subjects to be paid __ Exclusion of women or children subjects __ Oral history project __ Involves deception __ Sexual content
41
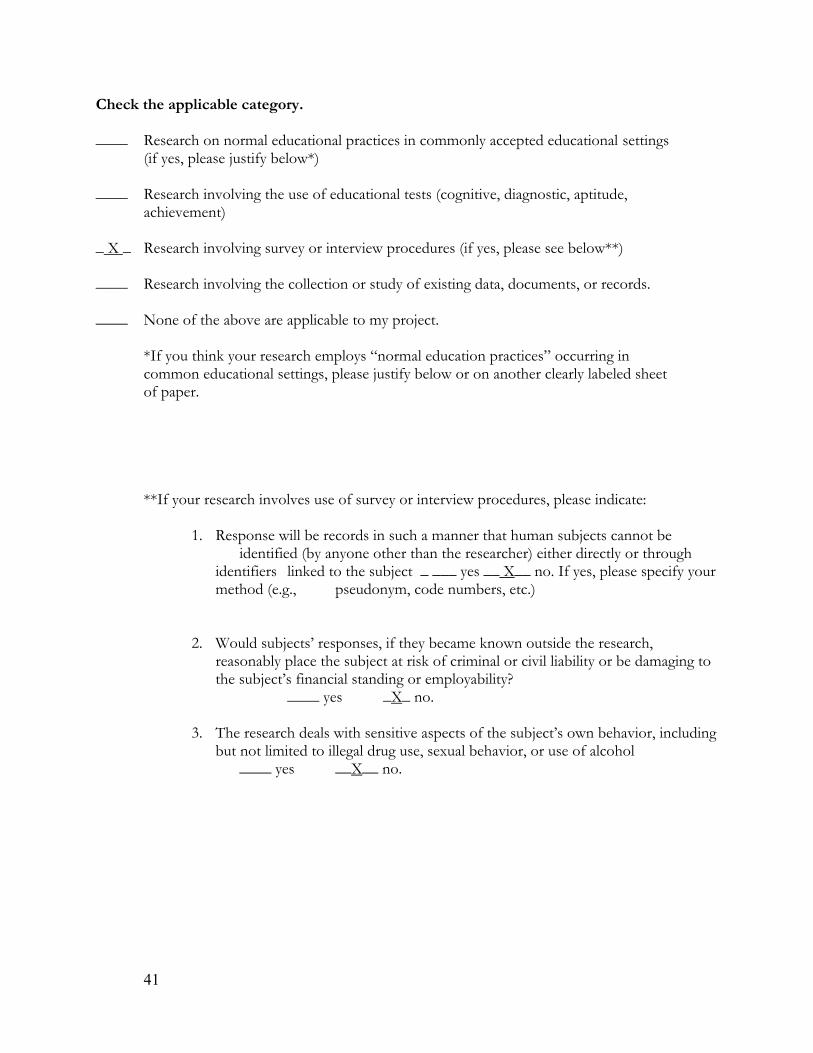
Check the applicable category. ____ Research on normal educational practices in commonly accepted educational settings (if yes, please justify below*) ____ Research involving the use of educational tests (cognitive, diagnostic, aptitude, achievement) _ X _ Research involving survey or interview procedures (if yes, please see below**) ____ Research involving the collection or study of existing data, documents, or records. ____ None of the above are applicable to my project. *If you think your research employs “normal education practices” occurring in common educational settings, please justify below or on another clearly labeled sheet of paper. **If your research involves use of survey or interview procedures, please indicate:
1. Response will be records in such a manner that human subjects cannot be identified (by anyone other than the researcher) either directly or through identifiers linked to the subject _ ___ yes __ X__ no. If yes, please specify your method (e.g., pseudonym, code numbers, etc.)
2. Would subjects’ responses, if they became known outside the research,
reasonably place the subject at risk of criminal or civil liability or be damaging to the subject’s financial standing or employability?
____ yes _X_ no. 3. The research deals with sensitive aspects of the subject’s own behavior, including
but not limited to illegal drug use, sexual behavior, or use of alcohol ____ yes __X__ no.

42
Approval Letter to Use Human Subjects
UNIVERSITY OF DAYTON RESEARCH INSTITUTE
Contracts and Grants Administration 300 College Park Dayton, OH 45469-0104 (937) 229-2919 FAX (937) 229-2291
27 April 2007
Dr. Deogratias Eustace University of Dayton Civil Engineering Dayton, OH 45469
SUBJECT: “ Evaluation of the Role of Driver’s Knowledge of Who has Right-of-Way Contributes to Interstate On-Ramp Crashes”
Dear Dr. Eustace:
The Institutional Review Board for the Protection of Human Subjects in Research has reviewed the subject proposal. The proposed research protocol is exempt from human subject regulations as described in 45 CFR 46.101(b) (2). The procedures you have designed to protect participant confidentiality and to secure informed consent are adequate and conform to accepted ethical standards for this type of research.
Therefore, you have approval to proceed with the study. The Committee expects that the appropriate subject protection measures will be followed, as outlined in your proposal.
Please note that in Appendix A, Letter to the Parents, the phone number for IRB issues should read, (937) 229-4053.
Please inform the Committee of any ethical issues that may arise in your study. Please feel free to contact me should you encounter other issues relevant to the protection of human subjects. Good luck with your research.
Jon Nieberding Chair
jn:lky
43
Appendix B - Cover Letter and the Survey Instrument
This appendix consists of the cover letter and the survey instrument (questionnaire) that
were sent to selected drivers.

44
Cover Letter
May 9, 2007
SURVEY OF DRIVER’S KNOWLEDGE AND EXPERIENCE WITH INTERSTATE
ON-RAMP ACCIDENTS
The Department of Civil and Environmental Engineering at University of Dayton is conducting a
study for the United States Department of Transportation (USDOT) through the Mack-Blackwell
Transportation Center to assess how well the public understands various safety issues relevant to
freeway’s entrance ramps. The survey has been developed so that you can tell us your experience
and knowledge related with freeway entrance ramp safety. The information you give us will be
used to develop a better understanding of freeway accident-related issues and how the driver’s
knowledge contributes towards these types of accidents.
Do not write your name on this survey questionnaire. All answers will be kept in strictest
confidence. Answer the questions based on the best of your knowledge. Completing the survey
is voluntary.
When you are finished, please return the questionnaire in the enclosed, addressed, stamped
envelope.
Thank you very much for your help

45
Survey Instrument 1. What is your age? Under 20 20-25 26-44 45-54 55-64 Over 64
2. What is your gender? Male Female 3. How often do you drive on freeways (including Interstate highways)?
A) Never B) Rarely (two times a month or less) C) Sometimes (once a week or less) D) Regularly (two to five times a week) E) Almost daily (six or seven days a week, generally)
4. On an average, how far do you drive on the freeway highways?
A) Never B) One to two miles C) Three to four miles D) Five to ten miles E) Over ten miles
5. In the past one year, can you recall seeing an accident at a freeway entrance ramp that involved at least
two vehicles, between a vehicle in the main lanes crashing with one that was entering through the on-ramp? Yes No
6. How many such accidents do you think you saw in the past one year?
A) None B) One C) Two to three D) Four to five E) More than five
7. In the past one year, can you recall seeing near misses at a freeway entrance ramp that involved at least two vehicles, between a vehicle in the main lanes that almost crashed with one that was entering through the on-ramp? Yes No
8. How many such incidents mentioned in item 7 above do you think you saw in the past one year?
A) None B) One C) Two to three D) Four to five E) More than five
9. In the past one year, can you recall yourself being involved in an accident at the entrance ramp that involved at least two vehicles, between you or the other vehicle being in the main lanes crashing with the other vehicle or you entering through the on-ramp? Yes No
46
10. How many such incidents mentioned in item 9 above do you recall you were involved in the past one year?
A) None B) One C) Two to three D) Four to five E) More than five
11. In the past one year, can you recall being involved in a situation that can be termed as a “near miss”
(nearly developed into an accident) in the vicinity of entrance ramps (either you or the other vehicle was in the main lanes and the other vehicle or you was entering through the on-ramp)? Yes No
12. How many such incidents mentioned in item 11 above do you recall you were involved in the past one
year? A) None B) One C) Two to three D) Four to five E) More than five
13. When approaching a freeway from an on-ramp, what do you normally do before entering the highway? …………………………………………………………………………………………………………………………………………………………………………………………………………………………………………………………………………………………………………………………………………………………………………………………………………………………………………
14. When driving on a freeway and you see a vehicle entering from a ramp, what do you normally do?
…………………………………………………………………………………………………………………………………………………………………………………………………………………………………………………………………………………………………………………………………………………………………………………………………………………………………………
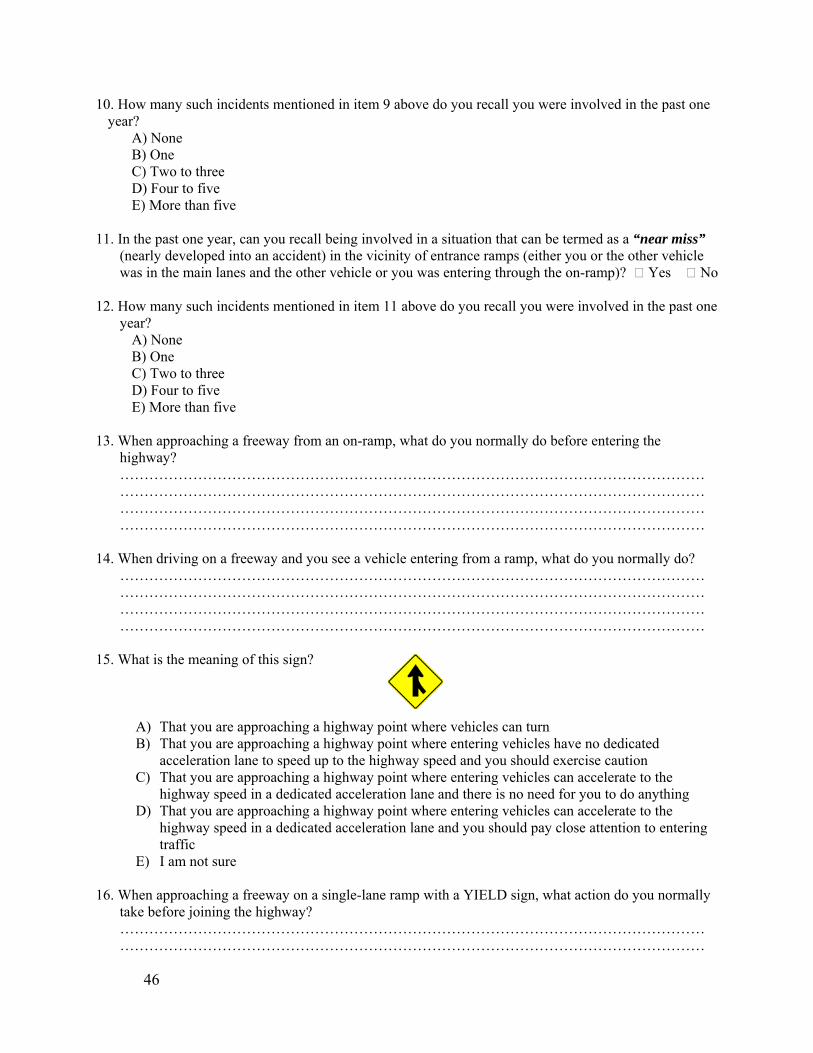
15. What is the meaning of this sign?
A) That you are approaching a highway point where vehicles can turn B) That you are approaching a highway point where entering vehicles have no dedicated
acceleration lane to speed up to the highway speed and you should exercise caution C) That you are approaching a highway point where entering vehicles can accelerate to the
highway speed in a dedicated acceleration lane and there is no need for you to do anything D) That you are approaching a highway point where entering vehicles can accelerate to the
highway speed in a dedicated acceleration lane and you should pay close attention to entering traffic
E) I am not sure 16. When approaching a freeway on a single-lane ramp with a YIELD sign, what action do you normally
take before joining the highway? ……………………………………………………………………………………………………………………………………………………………………………………………………………………

47
……………………………………………………………………………………………………………………………………………………………………………………………………………………
17. Which vehicle in the figure below is entering the freeway correctly? A) Vehicle A B) Vehicle B C) Both of them D) None of them E) I am not sure
18. Which vehicle in the figure below has to yield the right-of-way to the other?
A) Vehicle A B) Vehicle B C) The first vehicle to reach there has the right of way D) None of them has more right than the other E) I am not sure
19. Which vehicle in the figure below has to yield the right-of-way to the other?
A) Vehicle A B) Vehicle B C) The first vehicle to reach there has the right of way D) None of them has more right than the other E) I am not sure
20. Any reason(s) do you think may be the cause of the accidents at the freeway-ramp merge area?
………………………………………………………………………………………………………………………………………………………………………………………………………………………………………………………………………………………………………………………………
B A
RAMP
A
B
RAMP
A
B
RAMP
48
………………………………………………………………………………………………………………………………………………………………………………………………………………………………………………………………………………………………………………………………
21. Do you have any suggestion(s) that may make the freeway-ramp merge areas safer?
……………………………………………………………………………………………………………………………………………………………………………………………………………………………………………………………………………………………………………………………………………………………………………………………………………………………………………………………………………………………………………………………………………………

49
Appendix C - Letters Requesting Data Sent to Ohio BMV and
Indiana BMV
This appendix consists of letters sent to the Ohio and Indiana Bureaus of Motor Vehicles
requesting drivers’ data. Also, included is an official denial letter from Indiana BMV office.

50
April 5, 2007 The Registrar Ohio Bureau of Motor Vehicles P. O. Box 16520 Columbus, OH 43216-6520 SUBJECT: Request for information from Ohio BMV relating to a U.S. Department of Transportation-funded research study Dear Sir/Madam: I am an Assistant Professor at the University of Dayton, Ohio. I am currently conducting research sponsored by the U.S. Department of Transportation via the Mack Blackwell Transportation Center at the University of Arkansas. The topic is “Evaluation of how drivers’ understanding of who has the right-of-way contributes to interstate on-ramp crashes.” As part of this research, I have developed and hope to disseminate a questionnaire targeting registered drivers in western Ohio and eastern Indiana. This questionnaire is designed to assess their level of understanding of various safety issues relevant to my research. I write to you with a request for help in creating a representative, randomly-based list of drivers in Ohio. This would, I assume, include names and addresses. I would like a list of about 1500 from which to create my participant pool. The proposed research protocol has been reviewed by my institution’s Institutional Review Board for the Protection of Human Subjects in Research (UD IRB). Regarding assurance of confidentiality to project participants, I will be employing a three-tiered system for protecting confidentiality:
(1) Once the randomly-generated list is provided by your office, I will assign each person a code number. This master list with names will only be seen by myself, and will be stored in a locked filing cabinet when not in use.
(2) Once the dissemination and any follow-up are complete, the master list will be destroyed via shredding. From that point on, only the list with the code number will be used. (3) When reporting the results, only summary data will be made public. Any identifiers will be removed.
We will include a statement to this effect in the mailing and will include contact information for participants who may have questions about their rights as a research participant.
Thank you very much for your consideration of my request. Please feel free to contact me at [email protected] or 937-229-2984 should you have any questions. Sincerely, Deogratias Eustace, Ph.D., P.E., PTOE
51
April 5, 2007 Mr. Brad Folck Senior Information Specialist Indiana BMV Indiana Government Center North 100 N. Senate Avenue, Room N440 Indianapolis, IN 46204 SUBJECT: Formal request for information from Indiana BMV relating to a U.S. Department of Transportation-funded research study Dear Mr. Folck: I am an Assistant Professor at the University of Dayton, Ohio. I am currently conducting research sponsored by the U.S. Department of Transportation via the Mack Blackwell Transportation Center at the University of Arkansas. The topic is “Evaluation of how drivers’ understanding of who has the right-of-way contributes to interstate on-ramp crashes.” As part of this research, I have developed and hope to disseminate a questionnaire targeting registered drivers in western Ohio and eastern Indiana. This questionnaire is designed to assess their level of understanding of various safety issues relevant to my research. I write to you with a request for help in creating a representative, randomly-based list of drivers in Indiana. This would, I assume, include names and addresses. Per Section 5-14-3 of the Indiana Code, I am making this formal request in writing. I would like a list of about 1500 from which to create my participant pool. The proposed research protocol has been reviewed by my institution’s Institutional Review Board for the Protection of Human Subjects in Research (UD IRB). Regarding assurance of confidentiality to project participants, I will be employing a three-tiered system for protecting confidentiality:
(1) Once the randomly-generated list is provided by your office, I will assign each person a code number. This master list with names will only be seen by myself, and will be stored in a locked filing cabinet when not in use. (2) Once the dissemination and any follow-up are complete, the master list will be destroyed via shredding. From that point on, only the list with the code number will be used.
(3) When reporting the results, only summary data will be made public. Any identifiers will be removed. We will include a statement to this effect in the mailing and will include contact information for participants who may have questions about their rights as a research participant.
Thank you very much for your consideration of my request. Please feel free to contact me at [email protected] should you have any questions. Sincerely, Deogratias Eustace, Ph.D., P.E., PTOE

52

53
Appendix D - Communication with ATRI
This appendix consists of email communication with the American Transportation
Research Institute (ATRI) official.
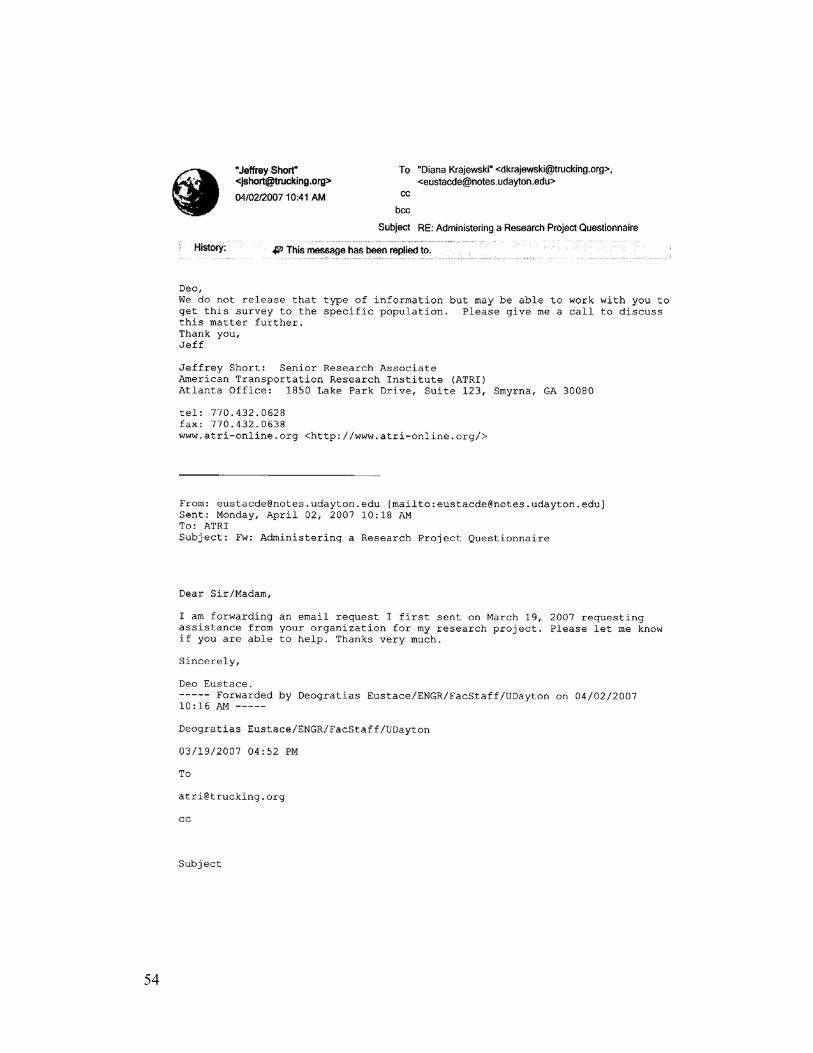
54
55
View publication statsView publication stats