EVALUATION OF THE IMPACT OF SUB-METERING ON MULTI ...
23
© 2016 Navigant Consulting Ltd. EVALUATION OF THE IMPACT OF SUB-METERING ON MULTI-RESIDENTIAL ELECTRICITY CONSUMPTION AND THE POTENTIAL ECONOMIC AND ENVIRONMENTAL IMPACT ON ONTARIO Prepared for: Enercare Connections Inc. Navigant Consulting Ltd. Bay Adelaide Centre 333 Bay St., Suite 1250 Toronto, ON, M5H 2R2 416-777-2440 www.navigant.com January 8, 2016
Transcript of EVALUATION OF THE IMPACT OF SUB-METERING ON MULTI ...
© 2016 Navigant Consulting Ltd.
EVALUATION OF THE IMPACT OF
SUB-METERING ON MULTI-RESIDENTIAL
ELECTRICITY CONSUMPTION AND THE
POTENTIAL ECONOMIC AND
ENVIRONMENTAL IMPACT ON ONTARIO
Prepared for:
Enercare Connections Inc.
Navigant Consulting Ltd.
Bay Adelaide Centre
333 Bay St., Suite 1250
Toronto, ON, M5H 2R2
416-777-2440
www.navigant.com
January 8, 2016

Evaluation of the Impact of Sub-Metering on Multi-Residential Electricity Consumption Page 1 and the Potential Economic and Environment Impact on Ontario
TABLE OF CONTENTS
1 EXECUTIVE SUMMARY ...................................................................................................................... 2
1.1 Conservation Impact and Savings Persistence .................................................................. 4
1.2 Technical Potential ................................................................................................................ 6
1.3 Societal Benefits: Avoided Generation, Transmission, and Distribution Costs ........... 8
1.4 Societal Benefits: GHG Reduction ....................................................................................... 8
2 INTRODUCTION ............................................................................................................................... 10
2.1 Background .......................................................................................................................... 10
2.2 Organization of This Report .............................................................................................. 10
3 SUB-METERING CONSERVATION IMPACT ...................................................................................... 11
3.1 Data Used for the Conservation Impact Analysis .......................................................... 11
3.2 Evaluation Methods ............................................................................................................ 13
3.3 Conservation Impacts ......................................................................................................... 13
4 PROVINCIAL TECHNICAL CONSERVATION POTENTIAL ............................................................... 15
4.1 Estimate of Energy Savings ................................................................................................ 15
4.2 Estimate of Peak Demand Reduction ............................................................................... 17
4.3 Provincial Avoided Cost and GHG Reduction Benefits ................................................ 18
4.4 Generation, Transmission and Distribution Avoided Costs ......................................... 18
4.5 Estimate of Greenhouse Gas Emission Reduction .......................................................... 19
5 APPENDIX ........................................................................................................................................ 21
5.1 Conservation Impact Analysis ........................................................................................... 21

Evaluation of the Impact of Sub-Metering on Multi-Residential Electricity Consumption Page 2 and the Potential Economic and Environment Impact on Ontario
DISCLAIMER This report was prepared by Navigant Consulting, Inc. (Navigant) for Enercare Connections Inc. The work presented in this report represents Navigant’s professional judgment based on the information available at the time this report was prepared. Navigant is not responsible for the reader’s use of, or reliance upon, the report, nor any decisions based on the report. NAVIGANT MAKES NO REPRESENTATIONS OR WARRANTIES, EXPRESSED OR IMPLIED. Readers of the report are advised that they assume all liabilities incurred by them, or third parties, as a result of their reliance on the report, or the data, information, findings and opinions contained in the report.
Evaluation of the Impact of Sub-Metering on Multi-Residential Electricity Consumption Page 3 and the Potential Economic and Environment Impact on Ontario
1 EXECUTIVE SUMMARY
Enercare Connections Inc. (“Enercare”) is a supplier of sub-metering services to multi-residential
buildings in Ontario. Sub-metering1 allows a landlord, property management firm, condominium
corporation, or multi-tenant property2 to bill tenants for individually measured electricity use. A
multi-residential unit that is not sub-metered is billed on a “bulk” metering system. In residential
apartment settings, under bulk metering, electricity is built into the tenant’s monthly rent, and does
not change with electricity usage. However, with sub-metering, the resident is billed individually
for the electricity consumed and thus receives a monthly price signal linking their electricity costs
with their electricity consumption. The application of prevailing economic theory suggests that in
the face of such a price signal, aggregate multi-residential electricity consumption should fall.
Enercare retained Navigant Consulting Ltd. (“Navigant”) to estimate the conservation impact of
electricity sub-metering on multi-residential buildings and, based on this and information provided
by Enercare, estimate the “technical conservation potential” of a provincial deployment of sub-
metering for multi-residential buildings.
The study’s findings are significant: a unit (apartment or condominium) converted from bulk to sub-
metering yields annual electricity savings of approximately 40%, savings that Navigant’s testing
indicates persist largely unchanged over time. Navigant is not aware of any conservation program
being offered in Ontario or elsewhere that can achieve such high and persistent savings. To put this
level of savings into perspective, report-based behavioural programs, such as those offered by
OPower and other service providers, typically achieve savings in the range of 2 – 3%.
Navigant estimates, based on the per unit savings given above, that if sub-metering were deployed
in all currently bulk-metered multi-residential buildings in the province, the annual potential
electricity savings following complete deployment after five years could be over 1 TWh per year.
Annual summer peak reduction potential could be 158 MW following complete deployment.
Ontario has established conservation targets for Ontario’s local distribution companies (“LDCs”) to
be achieved by 2020 under the new Conservation First Framework. Conservation programs to
achieve these targets are funded by Ontario ratepayers and administered by the Independent
Electricity System Operator (“IESO”), with a goal of reducing electricity consumption by 8.7 TWh
by December, 2020.3
To date, energy conservation from sub-metering has not been counted by the IESO or LDCs toward
conservation targets. Integrating the conservation results achieved by sub-metering would
significantly contribute to Ontario’s conservation targets and would deliver considerable benefits to
the province in the form of costs savings associated with the reduced need for infrastructure
investments due to energy conservation and environmental benefits.
1 In this report, unless the context indicates otherwise, “sub-metering” refers to both “unit smart metering” and “unit
sub-metering” as defined in the Energy Consumer Protection Act, 2010 (Ontario).
2 For simplicity, these buildings will be collectively referred to as “multi-residential” buildings.
3 http://www.ieso.ca/Pages/Conservation/Conservation-First-Framework/default.aspx
Evaluation of the Impact of Sub-Metering on Multi-Residential Electricity Consumption Page 4 and the Potential Economic and Environment Impact on Ontario
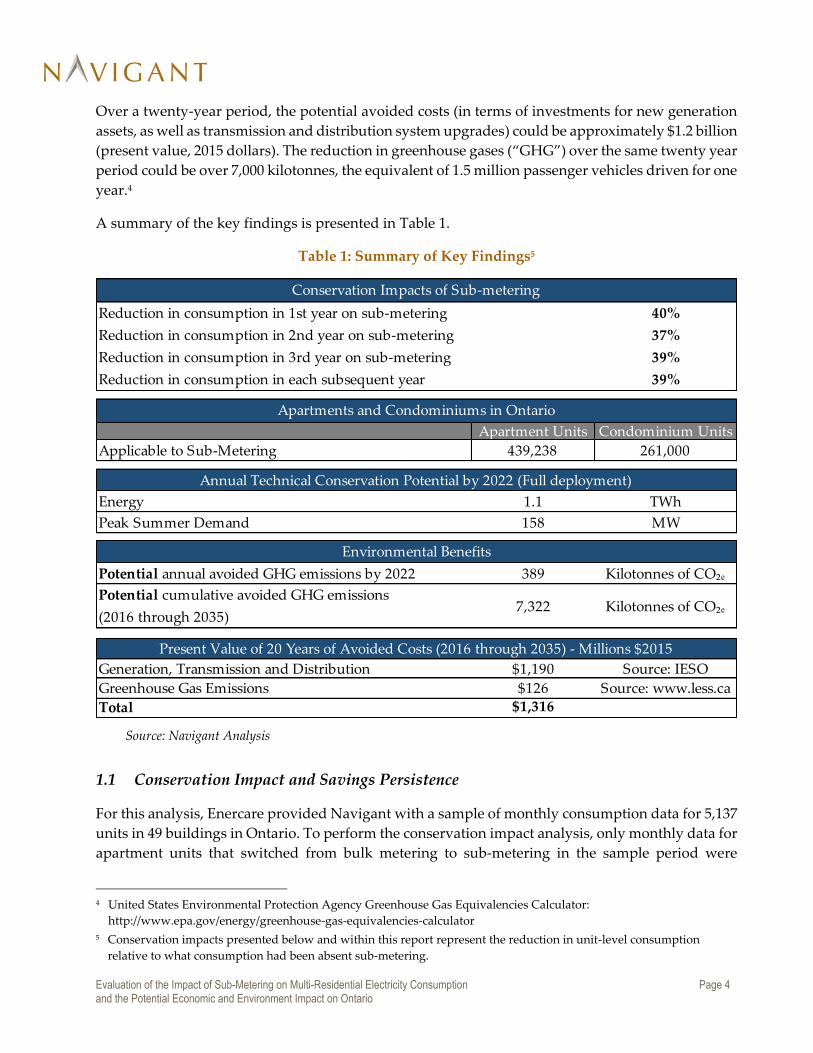
Over a twenty-year period, the potential avoided costs (in terms of investments for new generation
assets, as well as transmission and distribution system upgrades) could be approximately $1.2 billion
(present value, 2015 dollars). The reduction in greenhouse gases (“GHG”) over the same twenty year
period could be over 7,000 kilotonnes, the equivalent of 1.5 million passenger vehicles driven for one
year.4
A summary of the key findings is presented in Table 1.
Table 1: Summary of Key Findings5
Source: Navigant Analysis
1.1 Conservation Impact and Savings Persistence
For this analysis, Enercare provided Navigant with a sample of monthly consumption data for 5,137
units in 49 buildings in Ontario. To perform the conservation impact analysis, only monthly data for
apartment units that switched from bulk metering to sub-metering in the sample period were
4 United States Environmental Protection Agency Greenhouse Gas Equivalencies Calculator:
http://www.epa.gov/energy/greenhouse-gas-equivalencies-calculator
5 Conservation impacts presented below and within this report represent the reduction in unit-level consumption
relative to what consumption had been absent sub-metering.
40%
37%
39%
39%
Apartment Units Condominium Units
Applicable to Sub-Metering 439,238 261,000
1.1 TWh
158 MW
389 Kilotonnes of CO₂ₑ
7,322 Kilotonnes of CO₂ₑ
$1,190 Source: IESO
$126 Source: www.less.ca$1,316
Generation, Transmission and Distribution
Greenhouse Gas Emissions
Total
Potential cumulative avoided GHG emissions
(2016 through 2035)
Reduction in consumption in 3rd year on sub-metering
Potential annual avoided GHG emissions by 2022
Annual Technical Conservation Potential by 2022 (Full deployment)
Energy
Peak Summer Demand
Present Value of 20 Years of Avoided Costs (2016 through 2035) - Millions $2015
Conservation Impacts of Sub-metering
Apartments and Condominiums in Ontario
Environmental Benefits
Reduction in consumption in 1st year on sub-metering
Reduction in consumption in 2nd year on sub-metering
Reduction in consumption in each subsequent year

Evaluation of the Impact of Sub-Metering on Multi-Residential Electricity Consumption Page 5 and the Potential Economic and Environment Impact on Ontario
included. The resulting sample size was 1,500 units across 47 buildings that do not use electricity as
the primary fuel for space-heating.
Navigant estimates that, on average, a switch from bulk to sub-metering will lead to a 139 kWh per
unit (per month) decrease in electricity consumption in the first year of sub-metering. Savings decay
slightly in the second year of deployment, falling to 125 kWh/month, but then increase again to 128
kWh in the third year of deployment and persist at this level going forward. These impacts represent
a 40%, 37%, and 39% reduction in electricity consumption, respectively. Figure 1 below summarizes
the conservation impact from sub-metering. These results represent the average monthly kWh and
percentage reduction that is realized when a unit switches from bulk to sub-metering in the first,
second, and third years for which that unit is subjected to sub-metering. Changes in the savings
values after the third year of deployment were not found to be statistically significant, indicating
that savings in all subsequent years observed in the sample are equivalent to those estimated for the
third year of deployment.
Figure 1: Conservation Impact
Source: Navigant analysis
The annual reductions that are realized from a switch to sub-metering are shown in Table 2. The
initial reduction in consumption (Year 1) from a switch to sub-metering results in an annual
reduction of 1,664 kWh. A unit subjected to sub-metering for two and three years reduces
consumption by 1,501 and 1,542 kWh compared to what would have been consumed under bulk
metering, respectively. As noted above, changes in savings after the third year were not found to be
statistically significant, indicating that savings in all subsequent years are equivalent to those
estimated for the third year of deployment.

Evaluation of the Impact of Sub-Metering on Multi-Residential Electricity Consumption Page 6 and the Potential Economic and Environment Impact on Ontario
Table 2: Annual Average Savings per Unit (kWh)
1st Year 2nd Year 3rd Year Each Subsequent Year
1,664 1,501 1,542 1,542
1.2 Technical Potential
Navigant used the “per unit” conservation impact and savings persistence estimates from its
econometric analysis as well as the following to estimate the technical conservation potential (see
definition below) of sub-metering in Ontario:
Internal Enercare research (number of potential units applicable to sub-metering in Ontario).
End-use load shapes developed by the IESO and included in its CDM Energy Efficiency Cost
Effectiveness Tool.6 This tool was developed by the IESO to help LDCs plan their conservation
programs
Natural Resources Canada’s (“NRCan”) Comprehensive Energy Use Database (total provincial
consumption by dwelling type, end-use, etc.)7
The technical conservation potential estimated in this report is defined in the following way: the
potential energy conservation that would accrue should the conservation technology8 be adopted
in every case in which it is feasible and has not already been implemented, as soon as is possible.
This conservation potential does not include any conservation impact from space-heating
consumption for units where the primary heating fuel is electricity. This exclusion is driven by issues
of data availability covered in greater detail below. A summary of the total number of condominium
and apartment units available for sub-metering in Ontario is shown in Table 3 below. These figures
include total provincial values provided by Enercare in addition to those units that were included
in the sample data provided by Enercare that did not switch to sub-metering during the study
period. It does not include units that have already switched to sub-metering.
Table 3: Condominiums and Apartments Applicable to Sub-Metering in Ontario
Apartment Units Condominium Units
Applicable to Sub-Metering 439,238 261,000
In calculating the technical potential of sub-metering in Ontario, Navigant has assumed that as of
January 1st, 2016, sub-metering will be implemented in every building in which it is feasible but not
yet present. This does not, however, mean that all units in all buildings will immediately become
individually billed. Although condominium buildings tend to switch over all units at once, rental
units tend to switch from bulk billing to sub-meter billing only with a change of tenancy. Thus, the
implicit assumption is that all condominiums are sub-metered for the whole of 2016 as are a fifth of
6 http://www.powerauthority.on.ca/opa-conservation/conservation-first-framework-tool-kit/guidelines-and-tools
7 http://oee.nrcan.gc.ca/corporate/statistics/neud/dpa/menus/trends/comprehensive/trends_res_on.cfm
8 In this case, sub-metering.
Evaluation of the Impact of Sub-Metering on Multi-Residential Electricity Consumption Page 7 and the Potential Economic and Environment Impact on Ontario
apartments (on a tenancy change), and that all applicable apartments are expected to be sub-metered
by the end of 2020 since the tenancy of rental units is expected to fully “turn-over” in five years.
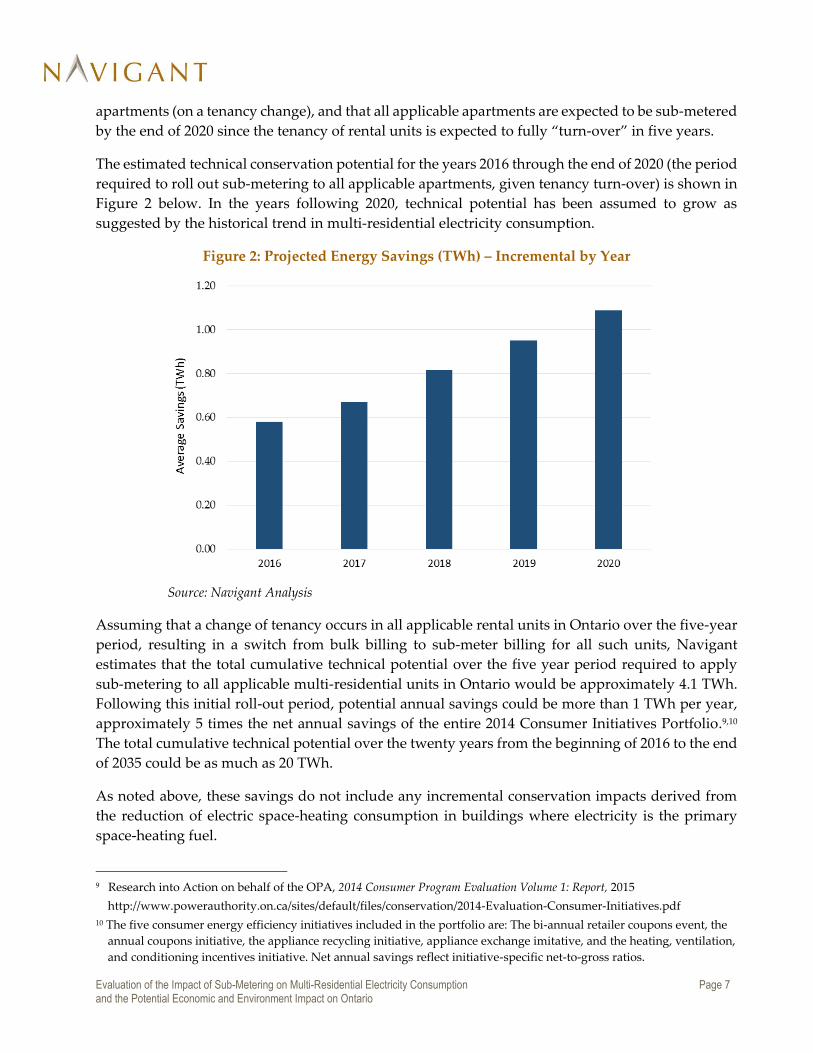
The estimated technical conservation potential for the years 2016 through the end of 2020 (the period
required to roll out sub-metering to all applicable apartments, given tenancy turn-over) is shown in
Figure 2 below. In the years following 2020, technical potential has been assumed to grow as
suggested by the historical trend in multi-residential electricity consumption.
Figure 2: Projected Energy Savings (TWh) – Incremental by Year
Source: Navigant Analysis
Assuming that a change of tenancy occurs in all applicable rental units in Ontario over the five-year
period, resulting in a switch from bulk billing to sub-meter billing for all such units, Navigant
estimates that the total cumulative technical potential over the five year period required to apply
sub-metering to all applicable multi-residential units in Ontario would be approximately 4.1 TWh.
Following this initial roll-out period, potential annual savings could be more than 1 TWh per year,
approximately 5 times the net annual savings of the entire 2014 Consumer Initiatives Portfolio.9,10
The total cumulative technical potential over the twenty years from the beginning of 2016 to the end
of 2035 could be as much as 20 TWh.
As noted above, these savings do not include any incremental conservation impacts derived from
the reduction of electric space-heating consumption in buildings where electricity is the primary
space-heating fuel.
9 Research into Action on behalf of the OPA, 2014 Consumer Program Evaluation Volume 1: Report, 2015
http://www.powerauthority.on.ca/sites/default/files/conservation/2014-Evaluation-Consumer-Initiatives.pdf
10 The five consumer energy efficiency initiatives included in the portfolio are: The bi-annual retailer coupons event, the
annual coupons initiative, the appliance recycling initiative, appliance exchange imitative, and the heating, ventilation,
and conditioning incentives initiative. Net annual savings reflect initiative-specific net-to-gross ratios.
Evaluation of the Impact of Sub-Metering on Multi-Residential Electricity Consumption Page 8 and the Potential Economic and Environment Impact on Ontario
Using the NRCan data, Navigant has also estimated that the technical summer peak demand
reduction, by 2022 (full deployment), of sub-metering in Ontario would be approximately 158 MW.
1.3 Societal Benefits: Avoided Generation, Transmission, and Distribution Costs
The societal benefits of energy conservation programs are typically quantified through the
calculation of “avoided costs” benefits. “Avoided costs” are, in essence, the marginal costs to society
of generating, transmitting and delivering incremental amounts of electricity and typically represent
the costs of building and running generation assets and the transmission and distribution
infrastructure.
For calculating the net present value of sub-metering over the five-year time window of the roll-out
(2016 through the end of 2020) as well as over the first twenty years of deployment (2016 through
the end of 2035), Navigant has used the avoided costs developed by the IESO and included in its
CDM Energy Efficiency Cost Effectiveness Tool.11 This tool is developed by the IESO to help LDCs
plan their conservation programs.
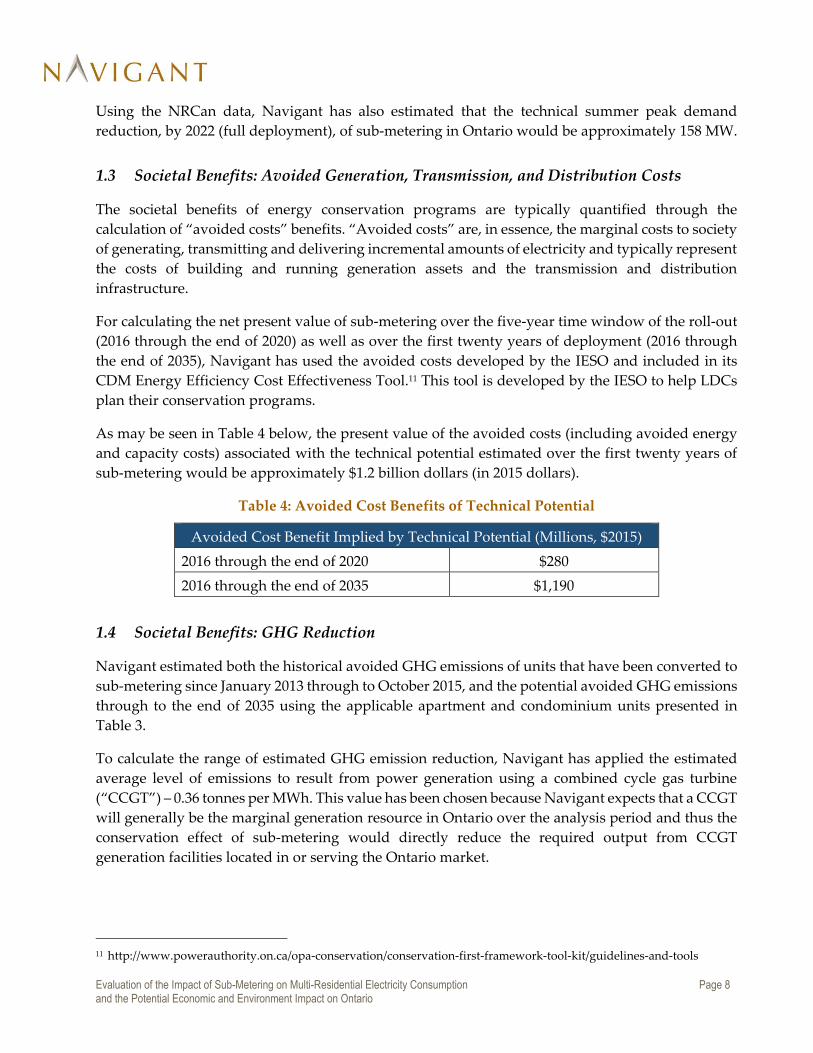
As may be seen in Table 4 below, the present value of the avoided costs (including avoided energy
and capacity costs) associated with the technical potential estimated over the first twenty years of
sub-metering would be approximately $1.2 billion dollars (in 2015 dollars).
Table 4: Avoided Cost Benefits of Technical Potential
Avoided Cost Benefit Implied by Technical Potential (Millions, $2015)
2016 through the end of 2020 $280
2016 through the end of 2035 $1,190
1.4 Societal Benefits: GHG Reduction
Navigant estimated both the historical avoided GHG emissions of units that have been converted to
sub-metering since January 2013 through to October 2015, and the potential avoided GHG emissions
through to the end of 2035 using the applicable apartment and condominium units presented in
Table 3.
To calculate the range of estimated GHG emission reduction, Navigant has applied the estimated
average level of emissions to result from power generation using a combined cycle gas turbine
(“CCGT”) – 0.36 tonnes per MWh. This value has been chosen because Navigant expects that a CCGT
will generally be the marginal generation resource in Ontario over the analysis period and thus the
conservation effect of sub-metering would directly reduce the required output from CCGT
generation facilities located in or serving the Ontario market.
11 http://www.powerauthority.on.ca/opa-conservation/conservation-first-framework-tool-kit/guidelines-and-tools

Evaluation of the Impact of Sub-Metering on Multi-Residential Electricity Consumption Page 9 and the Potential Economic and Environment Impact on Ontario
Applying the figure to the units included in the estimation sample that have been converted to sub-
metering from January 2013 through to October 2015, Navigant estimates that the historical avoided
GHG emissions are approximately 2.74 kilotonnes.
The total cumulative reduction in greenhouse gas emissions over the roll-out period (2016 through
2020) could be approximately 1,481 kilotonnes. Over the longer, 20 year horizon (2016 through 2035)
the total cumulative reduction in emissions could be over 7,000 kilotonnes, the equivalent of 1.5
million passenger vehicles driven for one year.12
Potential avoided GHG results are illustrated in Table 5 below.
Table 5: Potential Avoided Green House Gas Emissions
Avoided Green House Gas Emissions (kilotonnes)
2016 through the end of 2020 1,481
2016 through the end of 2035 7,322
The IESO does not assign avoided costs to reduced GHG emissions, however, a reasonable
approximation of the societal benefit of such reduced emissions may be estimated by using the price
charged by a David Suzuki Foundation-endorsed carbon offset vendor: Less (www.less.ca) charges
$25 per tonne for Verified Emission Reduction Plus (“VER+”) standard-certified offsets.
Using this value as the implicit societal benefit of carbon reductions, the present societal value of the
avoided emissions over the first twenty years of the technical potential scenario is approximately
$126 million (in 2015 dollars).
Adding this to the figure shown above in Table 4, the present value of the total societal benefit
implied by the technical conservation potential of sub-metering is approximately $1.3 billion (see
Table 1 above).
12 United States Environmental Protection Agency Greenhouse Gas Equivalencies Calculator:
http://www.epa.gov/energy/greenhouse-gas-equivalencies-calculator

Evaluation of the Impact of Sub-Metering on Multi-Residential Electricity Consumption Page 10 and the Potential Economic and Environment Impact on Ontario
2 INTRODUCTION
2.1 Background
Enercare retained Navigant to estimate the conservation impact of electricity sub-metering in multi-
residential buildings and the technical conservation potential (and attendant economic and
environmental benefits) of sub-metering in Ontario. For many multi-residential residents in Ontario,
electricity is built into their monthly rent, and does not change with electricity usage. However, with
a sub-metering infrastructure in place, the resident is billed individually for the electricity consumed
and thus, receives a monthly price signal linking their electricity costs with their electricity
consumption. The application of prevailing economic theory suggests that in the face of such a price
signal, aggregate multi-residential electricity consumption should fall.
2.2 Organization of This Report
This report is divided into three main parts. The first part discusses the estimated conservation
impact and savings persistence resulting when units switch from bulk metering to sub-metering, the
data used for that analysis, and the methods employed to obtain estimates.
The second part of this report extrapolates these estimates out to a province-wide scale in order to
estimate the “technical” conservation potential of an Ontario-wide deployment of sub-metering.
The third part of the report estimates the potential avoided generation, transmission, distribution
and GHG emissions cost benefits of such a deployment. Historical avoided GHG emissions are also
estimated.
A detailed description of the econometric technique used for the conservation impact is provided in
the appendix.

Evaluation of the Impact of Sub-Metering on Multi-Residential Electricity Consumption Page 11 and the Potential Economic and Environment Impact on Ontario
3 SUB-METERING CONSERVATION IMPACT
Enercare provided Navigant with the monthly consumption data of 5,137 multi-residential units
from September 2009 through to November 2015. Figure 3 illustrates the cumulative number of units
in the sample that switch from bulk to sub-metering over the period of analysis. As can be noted
from the graph, the transition from bulk to sub-metering is gradual. This is due to the fact that units
switch to sub-metering upon a change in tenancy.
Figure 3: Cumulative Number of Units Switching to Sub-Metering
Source: Navigant Analysis
The remainder of this section describes the data set used in the analysis, and the evaluation methods
employed.
3.1 Data Used for the Conservation Impact Analysis
Navigant used the following data in estimating the conservation impact of sub-metering:
1. Altogether Enercare provided monthly data for 5,137 apartments in 49 buildings. The dataset
is from September 2009 through November 2015. Only data for apartment units that switched
from bulk to sub-metering at some point in the sample period were included in the analysis.

Evaluation of the Impact of Sub-Metering on Multi-Residential Electricity Consumption Page 12 and the Potential Economic and Environment Impact on Ontario
Data from units that were already being sub-metered at the beginning of the dataset were
not included, nor were data from units that did not switch from bulk to sub-metering. The
number of units that either began on sub-metering or did not switch to sub-metering
represents approximately 70% of the units in the dataset. The monthly data include:
a. Per unit monthly consumption (kWh); and
b. Indicator for “Bill Payer” (where a Bill Payer indicates a unit subject to sub-metering).
2. Monthly heating and cooling degree days. These were calculated from the monthly average
temperature for various weather stations that were found to be the closest to the postal codes
of the buildings in the sample, and for which there was the most available data.
To prepare the data for regression analysis, the following data cleaning actions were performed:
Removal of units that began on sub-metering
Removal of units that did not switch to sub-metering
Removal of months where consumption was negative
Removal of months where consumption was 10 standard deviations from the median usage
(to control for outliers)
After removal of the units described above, and after any necessary data cleaning steps, the
conservation impact per unit was estimated using 1,500 units from 47 buildings that switched from
bulk to sub-metering. Figure 4 below provides a map of the locations of the buildings included in
the study. Each blue circle represents the forward sortation area (FSA) in which a building is located
(with the size of the circle indicating the density of buildings in that FSA).
Figure 4: Location of Buildings in Study Sample
Source: Navigant Analysis

Evaluation of the Impact of Sub-Metering on Multi-Residential Electricity Consumption Page 13 and the Potential Economic and Environment Impact on Ontario
3.2 Evaluation Methods
The impacts and savings persistence were estimated using fixed effects regression analysis applied
to unit level consumption panel data for 1,500 units in 47 buildings in Ontario.
To estimate the impact of sub-metering, Navigant employed a statistical technique called “fixed
effects.” This technique is a form of linear regression that is often used for the estimation of the
conservation and demand response program impacts and is considered the industry standard for
this type of work. Fixed effects is a way of controlling for a variety of building characteristics that
do not change over time. For example, the number of windows in a unit, the direction it faces or any
other characteristic that does not change in any significant way over the period of analysis, but that
may be correlated with electricity consumption.
In addition to controlling for individual unit characteristics that are time-invariant (through the
inclusion of fixed effects), Navigant also included heating and cooling degree days in the model
specification to control for seasonal variations in electricity consumption not related to the manner
in which a customer is billed for his or her electricity consumption.
Persistence in savings was estimated through the inclusion of variables that track the length of time
each unit had been subject to sub-metering. A detailed description of the model specification used
to estimate impacts may be found in the Appendix.
To obtain the overall percentage of electricity savings, Navigant compared the estimated
conservation impact (in kWh/unit) to the counterfactual predicted value – what consumption is
estimated to have been had sub-metering not been introduced.
3.3 Conservation Impacts
As may be seen in Figure 5 below, on average, a switch from bulk to sub-metering is estimated to
lead to a 139 kWh per unit (per month) decrease in electricity consumption in the first year of sub-
metering. Savings decay slightly in the second year of deployment, falling to 125 kWh/month, but
then increase again to 128 kWh in the third year of deployment and persist at this level going
forward. These impacts represent a 40%, 37%, and 39% reduction in electricity consumption,
respectively. These results represent the average monthly kWh and percentage reduction that is
realized when a unit switches from bulk to sub-metering in the first, second, and third years,
respectively. Changes in the savings values after the third year of deployment were not found to be
statistically significant, indicating that savings in all subsequent years observed in the sample are
equivalent to those estimated for the third year of deployment. Navigant is not aware of any
conservation program being offered in Ontario or elsewhere that can achieve such high and
persistent savings. To put this level of savings into perspective, report-based behavioural programs,
such as those offered by OPower and other service providers, typically achieve savings in the range
of 2 – 3%.

Evaluation of the Impact of Sub-Metering on Multi-Residential Electricity Consumption Page 14 and the Potential Economic and Environment Impact on Ontario
Figure 5: Average Monthly kWh and Percentage Reduction
Source: Navigant Analysis
The annual reductions that are realized from a switch to sub-metering are shown in Table 6 below.
Initial reduction in consumption (Year 1) from a switch to sub-metering results in an annual
reduction of 1,664 kWh. A unit subjected to sub-metering for two and three years reduces
consumption by 1,501 and 1,542 kWh compared to what would have been consumed under bulk
metering, respectively. Estimated savings do not significantly change from the third year value in
subsequent years.13
Table 6: Annual Estimated Impacts
1st Year 2nd Year 3rd Year Each Subsequent Year
1,664 1,501 1,542 1,542
13 Savings in each subsequent year are not statistically different from savings in year three.
Evaluation of the Impact of Sub-Metering on Multi-Residential Electricity Consumption Page 15 and the Potential Economic and Environment Impact on Ontario
4 PROVINCIAL TECHNICAL CONSERVATION POTENTIAL
This section provides an estimate of the aggregate energy and demand savings that could be realized
if sub-metering were to be implemented in all applicable multi-residential buildings in Ontario.
The potential savings estimated in this section is what is known as the “technical” potential for
conservation. Technical potential is defined in the following way: the potential energy conservation
that would accrue should the conservation technology14 be adopted in every case in which it is
feasible and has not already been implemented, as soon as is possible.
In calculating the technical potential of sub-metering in Ontario, Navigant has assumed that as of
January 1st, 2016, sub-metering will be implemented in every building in which it is feasible but not
yet present. This does not, however, mean that all units in all buildings will immediately become
individually billed. Although condominium buildings tend to switch over all units at once, rental
units switch from bulk billing to sub-metered billing only with a change of tenancy. The technical
provincial conservation potential of sub-metering will thus be quite large in 2016 (as all
condominium buildings are assumed to switch) and then grow over a few years as bulk billed
apartment residents are gradually replaced by sub-metered apartment residents.
Enercare provided Navigant with the estimated number apartment and condominium units in
Ontario to which sub-metering might be, but has not yet, been applied.
4.1 Estimate of Energy Savings
Navigant has assumed that as of January 1st, 2016, sub-metering will be implemented in every
building in which it is feasible to implement sub-metering that is not already subject to sub-metering.
This does not, however, mean that all units in all buildings will immediately become individually
billed. Although condominium buildings tend to switch over all units at once, rental units tend to
switch from bulk billing to sub-meter billing only with a change of tenancy. Thus, the implicit
assumption is that all condominiums are sub-metered for the whole of 2016 as are a fifth of
apartments (on a tenancy change), and that all applicable apartments are expected to be sub-metered
by the end of 2020 since the tenancy of rental units is expected to fully “turn-over” in five years. The
assumptions above are specific to the analysis under consideration. The following additional
assumptions are required for the calculation of technical potential:
1. On average, approximately 20% of rental apartments change tenants each year (as per
Enercare internal research).
2. Every time a rental unit changes tenants, beginning in 2016, that unit becomes sub-metered.
3. As of 2016, all condominium buildings are sub-metered.
Applying these assumptions to the projected levels of consumption, we obtain a year-by-year
estimate of energy (TWh) savings. These are set out in Figure 6 below. In this chart the baseline
consumption absent any sub-metering is represented by the solid line, read at the left axis. Aggregate
14 In this case, sub-metering.

Evaluation of the Impact of Sub-Metering on Multi-Residential Electricity Consumption Page 16 and the Potential Economic and Environment Impact on Ontario
consumption assuming a gradual roll-out of sub-metering for apartments and a one-off roll-out to
all condominiums by January 1st, 2016 (as specified above) is represented by the dashed lines, read
at the left axis. The gap between the solid and dashed lines represents energy savings.
The grey bars are read at the right axis and express the percentage of consumption in each year
which is assumed to now be sub-metered. Note the step-change that occurs in the first year of the
period (2016), this is due to all condominium buildings (approximately 40% of the applicable
potential energy consumption) switching to sub-metering immediately in 2016. The more gradual
turn-over of rental units from bulk billing to individual sub-metering may be observed in the
gradual manner in which the dashed lines fall over the course of the next four years.
Figure 6: Projected Aggregate Multi-residential Consumption with Sub-Metering
Source: Navigant Analysis
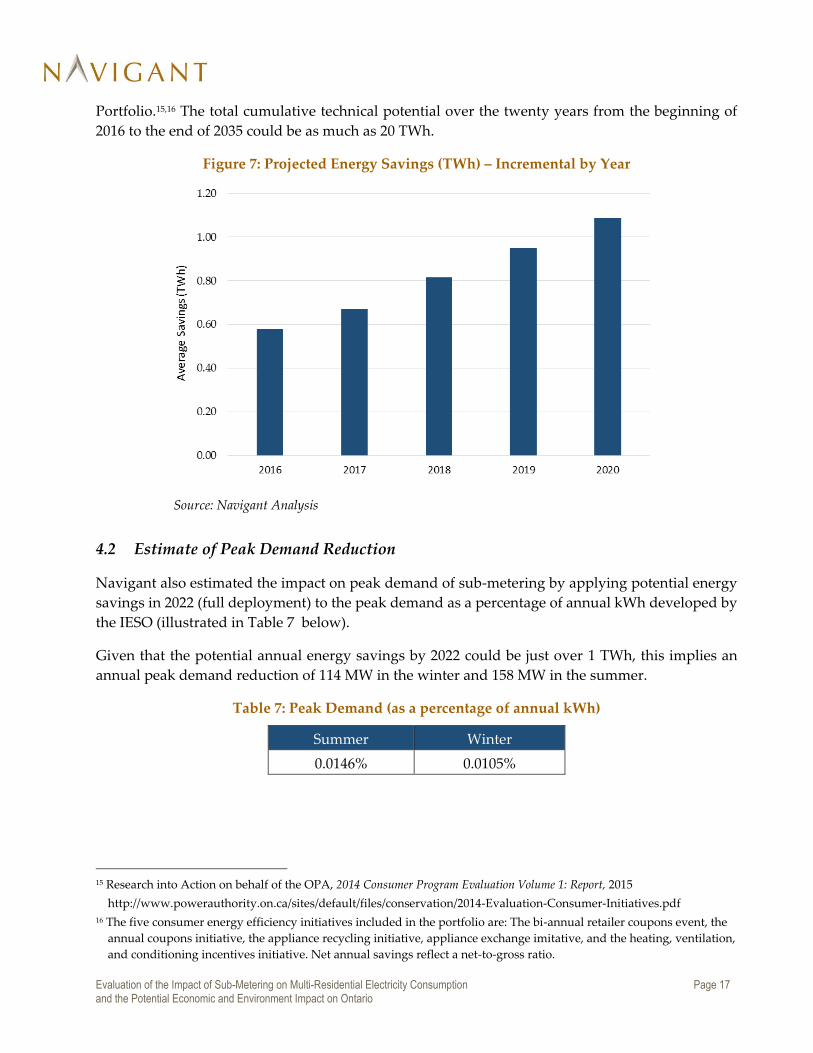
Projected energy savings for each year of the deployment period are shown in Figure 7 below.
Navigant estimates that the total cumulative technical potential over the five year period required
to apply sub-metering to all applicable multi-residential units in Ontario would be approximately
4.1 TWh. Following this initial roll-out period, potential annual savings could be approximately
1 TWh per year, approximately 5 times the net annual savings of the entire 2014 Consumer Initiatives
Evaluation of the Impact of Sub-Metering on Multi-Residential Electricity Consumption Page 17 and the Potential Economic and Environment Impact on Ontario
Portfolio.15,16 The total cumulative technical potential over the twenty years from the beginning of
2016 to the end of 2035 could be as much as 20 TWh.
Figure 7: Projected Energy Savings (TWh) – Incremental by Year
Source: Navigant Analysis
4.2 Estimate of Peak Demand Reduction
Navigant also estimated the impact on peak demand of sub-metering by applying potential energy
savings in 2022 (full deployment) to the peak demand as a percentage of annual kWh developed by
the IESO (illustrated in Table 7 below).
Given that the potential annual energy savings by 2022 could be just over 1 TWh, this implies an
annual peak demand reduction of 114 MW in the winter and 158 MW in the summer.
Table 7: Peak Demand (as a percentage of annual kWh)
Summer Winter
0.0146% 0.0105%
15 Research into Action on behalf of the OPA, 2014 Consumer Program Evaluation Volume 1: Report, 2015
http://www.powerauthority.on.ca/sites/default/files/conservation/2014-Evaluation-Consumer-Initiatives.pdf
16 The five consumer energy efficiency initiatives included in the portfolio are: The bi-annual retailer coupons event, the
annual coupons initiative, the appliance recycling initiative, appliance exchange imitative, and the heating, ventilation,
and conditioning incentives initiative. Net annual savings reflect a net-to-gross ratio.
Evaluation of the Impact of Sub-Metering on Multi-Residential Electricity Consumption Page 18 and the Potential Economic and Environment Impact on Ontario
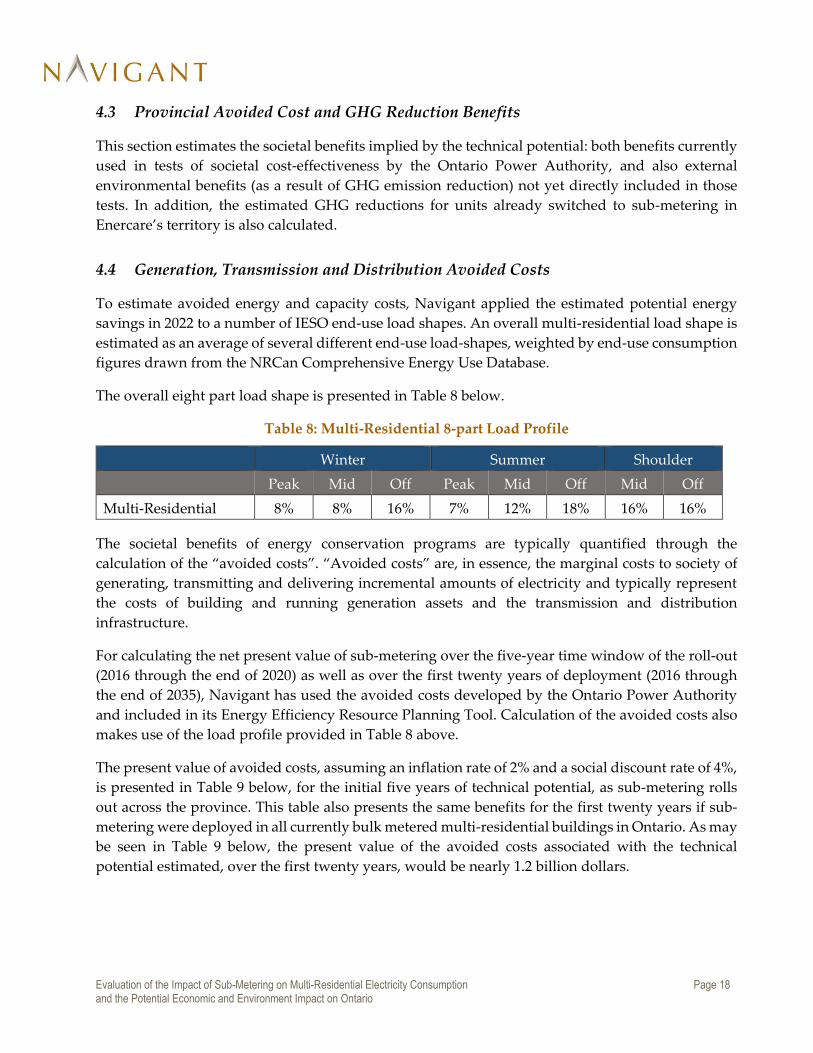
4.3 Provincial Avoided Cost and GHG Reduction Benefits
This section estimates the societal benefits implied by the technical potential: both benefits currently
used in tests of societal cost-effectiveness by the Ontario Power Authority, and also external
environmental benefits (as a result of GHG emission reduction) not yet directly included in those
tests. In addition, the estimated GHG reductions for units already switched to sub-metering in
Enercare’s territory is also calculated.
4.4 Generation, Transmission and Distribution Avoided Costs
To estimate avoided energy and capacity costs, Navigant applied the estimated potential energy
savings in 2022 to a number of IESO end-use load shapes. An overall multi-residential load shape is
estimated as an average of several different end-use load-shapes, weighted by end-use consumption
figures drawn from the NRCan Comprehensive Energy Use Database.
The overall eight part load shape is presented in Table 8 below.
Table 8: Multi-Residential 8-part Load Profile
Winter Summer Shoulder
Peak Mid Off Peak Mid Off Mid Off
Multi-Residential 8% 8% 16% 7% 12% 18% 16% 16%
The societal benefits of energy conservation programs are typically quantified through the
calculation of the “avoided costs”. “Avoided costs” are, in essence, the marginal costs to society of
generating, transmitting and delivering incremental amounts of electricity and typically represent
the costs of building and running generation assets and the transmission and distribution
infrastructure.
For calculating the net present value of sub-metering over the five-year time window of the roll-out
(2016 through the end of 2020) as well as over the first twenty years of deployment (2016 through
the end of 2035), Navigant has used the avoided costs developed by the Ontario Power Authority
and included in its Energy Efficiency Resource Planning Tool. Calculation of the avoided costs also
makes use of the load profile provided in Table 8 above.
The present value of avoided costs, assuming an inflation rate of 2% and a social discount rate of 4%,
is presented in Table 9 below, for the initial five years of technical potential, as sub-metering rolls
out across the province. This table also presents the same benefits for the first twenty years if sub-
metering were deployed in all currently bulk metered multi-residential buildings in Ontario. As may
be seen in Table 9 below, the present value of the avoided costs associated with the technical
potential estimated, over the first twenty years, would be nearly 1.2 billion dollars.

Evaluation of the Impact of Sub-Metering on Multi-Residential Electricity Consumption Page 19 and the Potential Economic and Environment Impact on Ontario
Table 9: Avoided Cost Benefits of Technical Potential
Avoided Cost Benefit Implied by Technical Potential (Millions, $2015)
2016 through the end of 2020 $280
2016 through the end of 2035 $1,190
4.5 Estimate of Greenhouse Gas Emission Reduction
To calculate the estimated GHG emissions reduction, Navigant has applied a factor of 0.36 tonnes
per MWh to estimated historical and potential energy savings. This factor has been obtained by
taking the tonnes per MMBtu of carbon dioxide that is produced when natural gas is burned, and
multiplying by a heat rate of 6.8 MMBtu/MWh.17 This value has been chosen because Navigant
expects that a CCGT will generally be the marginal generation type in Ontario over the potential
period and thus the conservation effect of sub-metering would directly reduce the required energy
output from CCGT generation facilities located in or serving the Ontario market.
Applying this factor to all Enercare units that have been converted to sub-metering between January
2013 and the end of October 2015, Navigant estimates that the historical avoided GHG emissions are
over approximately 2.74 kilotonnes.
The total cumulative reduction in greenhouse gas emissions over the roll-out period (2016 through
2020) would be approximately 1,481 kilotonnes. Over the longer 20 year horizon (2016 through 2035)
the total cumulative reduction in emissions would be over 7,000 kilotonnes, the equivalent of 1.5
million passenger vehicles driven for one year.18 These results are summarized in Table 10 below.
Table 10: Avoided Green House Gas Emissions
Avoided Green House Gas Emissions (kilotonnes)
2016 through the end of 2020 1,481
2016 through the end of 2035 7,322
The IESO does not assign avoided costs to reduced GHG emissions, however, a reasonable
approximation of the societal benefit of such reduced emissions may be estimated by examining the
cost of carbon offsets. In a 2009 study, the David Suzuki Foundation surveyed 20 different offset
vendors19 (both non- and for-profit) to assess the relative quality of these organizations. The highest
scoring vendor – Less20 – offers two types of offset. The Gold Standard-Certified International Offsets
17 Carbon dioxide that is produced when natural gas is emitted obtained from the EIA (note that 1 metric tonne is equal
to 2,205 lbs.): https://www.eia.gov/tools/faqs/faq.cfm?id=73&t=11
18 United States Environmental Protection Agency Greenhouse Gas Equivalencies Calculator:
http://www.epa.gov/energy/greenhouse-gas-equivalencies-calculator
19 David Suzuki Foundation, Purchasing Carbon Offsets: A Guide for Canadian Consumers Businesses and
Organizations, August 2009.
http://www.davidsuzuki.org/publications/downloads/2009/climate_offset_guide_web.pdf
20 www.less.ca

Evaluation of the Impact of Sub-Metering on Multi-Residential Electricity Consumption Page 20 and the Potential Economic and Environment Impact on Ontario
cost $45 per tonne and are derived from projects meeting the Gold Standard Foundation’s
sustainable development criteria. The VER+ Standard-Certified Canadian Offsets cost $25 per tonne
and are sourced from projects that have achieved certification under the VER+ Standard, the current
global standard of emissions offsets.
Using the value of the VER+ Standard, the present societal value (assuming a 4% social discount
rate) of the avoided emissions implied by the estimated technical potential over the first twenty years
if sub-metering were deployed in all currently bulk metered multi-residential buildings, is
approximately $126 million.

Evaluation of the Impact of Sub-Metering on Multi-Residential Electricity Consumption Page 21 and the Potential Economic and Environment Impact on Ontario
5 APPENDIX
5.1 Conservation Impact Analysis
For the analysis presented in this report, Enercare provided Navigant with monthly data for 5,137
multi-residential units from 49 buildings from September 2009 through to November, 2015. To
perform the conservation impact analysis, only monthly data for apartment units that switched from
bulk metering to sub-metering in the sample period were included. The resulting sample size was
1,500 units across 47 buildings that do not use electricity as the primary fuel for space-heating. To
estimate the impact of sub-metering, Navigant employed a statistical technique called “fixed
effects.” This technique is a form of linear regression that is often used for the estimation of the
conservation and demand response program impacts and is considered the industry standard for
this type of work. Fixed effects is a way of controlling for a variety of building characteristics that
do not change over time. For example, the number of windows in a building, the direction it faces
or any other building characteristic that does not change in any significant way over the period of
analysis, but that may be correlated with electricity consumption. Rather than controlling for each
individual characteristic, the analyst applies a fixed effect to each building. This fixed effect controls
all of that building’s characteristics which do not change over the period of analysis. In statistical
jargon, applying fixed effects is functionally the same as including a separate dummy variable for
each building in the equation, to control for that building’s individual, time-invariant,
characteristics.
The cross-sectional unit of analysis for estimating the conservation impact is a dwelling unit. That
is, the panel (or longitudinal) data set used to perform the regression contains an observation of
consumption for each dwelling unit in each month.
In addition to controlling for individual building characteristics that are time-invariant (through the
inclusion of fixed effects), Navigant also included heating and cooling degree days in the model
specification to control for seasonal variations in electricity consumption not related to the manner
in which a customer is billed for his or her electricity consumption.
Persistence in savings was estimated through the inclusion of variables that track the length of time
each unit had been subject to sub-metering.
Algebraically, the model is presented as:
𝒚𝒊𝒕 = 𝜶𝒊 + 𝜸𝟏𝒀𝒆𝒂𝒓𝟏𝒊𝒕+ 𝜸𝟐𝒀𝒆𝒂𝒓𝟐𝒊𝒕 + 𝜸𝟑𝒀𝒆𝒂𝒓𝟑𝒊𝒕 + 𝜷𝒋𝑿𝒊𝒕 + 𝜹𝒋𝒀𝒕 + 𝜺𝒊𝒕
(1)
Where:
𝑦𝑖𝑡 = The kWh consumption of unit i in month t
𝛼𝑖 = The fixed effect corresponding to building i

Evaluation of the Impact of Sub-Metering on Multi-Residential Electricity Consumption Page 22 and the Potential Economic and Environment Impact on Ontario
𝑌𝑒𝑎𝑟1=A dummy variable equal to 1 when a unit is on sub-metering, and zero otherwise
𝑌𝑒𝑎𝑟2=A dummy variable equal to 1 when a unit has been on sub-metering for longer than
12 months, and zero otherwise (to capture persistence)
𝑌𝑒𝑎𝑟3= A dummy variable equal to 1 when a unit has been on sub-metering for longer than
24 months, and zero otherwise (to capture persistence)
𝑋𝑖𝑡 = A set of observable variables applicable to unit i in month t. This set includes heating
and cooling degree days
𝑌𝑡 = A set of dummy variables equal to each year (2009 to 2015) of month t to capture annual
fixed effects
𝛾1, 𝛾2, 𝛾3 =The parameter estimates for the variables of interest: Year1 conservation impacts,
Year2 and Year3 persistence
𝛽𝑗 = The parameter estimates for our set of observable variables, 𝑋𝑖𝑡
𝛿𝑗 =The fixed effect corresponding to the year of month t
The parameter estimates corresponding to the variables of interest (𝛾1, 𝛾2, 𝛾3) for the fixed effect
model are detailed in Table 11 below.
Table 11: Model Results
Year Parameter
Estimate
Standard
Error p-value Significance¹
1st Year -139 1.74 0.00 **
2nd Year 14 2.08 0.00 **
3rd Year -3 1.99 0.08 *
¹ **Indicates significance at 5%, * Indicates significance at 10%
From these parameter estimates, we can conclude that a switch to sub-metering, all else being equal,
will result in a 139 kWh reduction of electricity consumption in the first year of sub-metering, a 14
kWh increase from 139 kWh in the second year of sub-metering (therefore a total 125 kWh
reduction), and a 3 kWh reduction from 125 kWh in the 3rd year (therefore a total 128 kWh reduction).
To obtain the overall percentage electricity savings, Navigant compared the estimated conservation
impact (in kWh/unit) to the counterfactual predicted value - what consumption is estimated to have
been had sub-metering not been introduced.