EVALUATION OF THE GROUND WATER RESPONSES …tjprc.org/publishpapers/2-56-1429360951-1. Env Eco -...
12
www.tjprc.org [email protected] International Journal of Environment, Ecology, Family and Urban Studies (IJEEFUS) ISSN(P): 2250-0065; ISSN(E): 2321-0109 Vol. 5, Issue 3, Jun 2015, 1-12 © TJPRC Pvt. Ltd. EVALUATION OF THE GROUND WATER RESPONSES TO ARTIFICIAL RECHARGE OF RAINWATER IN SELECTED ALLUVIAL AQUIFERS SAKSHI SHARMA 1 & MADHURI, S. RISHI 2 1 Research Scholar, Department of Environment Studies, Panjab University, Chandigarh, India 2 Assistant Professor, Department of Environment Studies, Panjab University, Chandigarh, India ABSTRACT Groundwater is an extremely important water resource and due to over exploitation of groundwater for irrigation and other purposes, especially in dry climates and in areas which are facing water stress, has led to irreversible consequences. Shallow groundwater resources are often of poor quality and above that they are harshly over-exploited. Therefore, it is the problem which is to be taken into prior consideration and Artificial recharge is expected to become necessary in the future as growing populations require more water, and as more storage of good quality water is needed for use in times of water shortage. This study is conducted at the micro level in the Campus of Panjab University, Chandigarh which is also facing problem of water logging and shortage in the region. Around 21 observation sites has been selected and water level is recorded on monthly basis following the Water Level Fluctuation Method to check the groundwater response to artificial recharge. In the study area, installation of artificial recharge structures served the deeper aquifers and helped to maintain the water level fluctuation variations more stable. KEYWORDS: Artificial Recharge, Shallow Groundwater Resources, Water Logging, Water Level Fluctuation INTRODUCTION Groundwater is an extremely important water resource, as it comprises more than 98% of the entire world’s liquid fresh water (Bouwer, 1978). Over exploitation of groundwater for irrigation and other purposes, especially in dry climates and in areas which are facing water stress, has led to irreversible consequences. The ever-growing population, rapid industrialization and increased water demand for agricultural production in numerous countries require much more water of adequate quality to suffice their needs. Overexploitation of groundwater in several parts of the country has resulted in declining groundwater levels, a reduction in supply, saline water encroachment, drying of the spring and shallow aquifers, increased cost of lifting, reduction in free flow and even local subsidence in some places (Singh and Singh, 2002). In many regions there is a lack of surface water resource and the water bearing sub-surface zones are having severe water contamination. Shallow groundwater resources are often of poor quality and above that they are harshly over-exploited. The decreased microbiological quality of the water may cause public health outbreaks of diarrhoeal disease, a significant disease burden in developing countries today (Gadgil 1998). The type and extent of chemical contamination of the groundwater largely depend on the anthropogenic activities mainly by acid rains, fertilizers, industrial waste, garbage and domestic waste (Kaushik and Kaushik, 2006), the geochemistry of the soil through which the water flows prior to reaching the aquifers (Zuane, 1990). Therefore, it is the problem which is to be taken into prior consideration and all the proved water techniques along with managerial strategies shall be adopted that could help to reduce the prevailing disaster. To meet the demand, reliance on ground water has been
Transcript of EVALUATION OF THE GROUND WATER RESPONSES …tjprc.org/publishpapers/2-56-1429360951-1. Env Eco -...
www.tjprc.org [email protected]
International Journal of Environment, Ecology, Family and Urban Studies (IJEEFUS) ISSN(P): 2250-0065; ISSN(E): 2321-0109 Vol. 5, Issue 3, Jun 2015, 1-12 © TJPRC Pvt. Ltd.
EVALUATION OF THE GROUND WATER RESPONSES TO ARTIFIC IAL
RECHARGE OF RAINWATER IN SELECTED ALLUVIAL AQUIFERS
SAKSHI SHARMA 1 & MADHURI, S. RISHI 2
1Research Scholar, Department of Environment Studies, Panjab University, Chandigarh, India 2Assistant Professor, Department of Environment Studies, Panjab University, Chandigarh, India
ABSTRACT
Groundwater is an extremely important water resource and due to over exploitation of groundwater for irrigation
and other purposes, especially in dry climates and in areas which are facing water stress, has led to irreversible
consequences. Shallow groundwater resources are often of poor quality and above that they are harshly over-exploited.
Therefore, it is the problem which is to be taken into prior consideration and Artificial recharge is expected to become
necessary in the future as growing populations require more water, and as more storage of good quality water is needed for
use in times of water shortage. This study is conducted at the micro level in the Campus of Panjab University, Chandigarh
which is also facing problem of water logging and shortage in the region. Around 21 observation sites has been selected
and water level is recorded on monthly basis following the Water Level Fluctuation Method to check the groundwater
response to artificial recharge. In the study area, installation of artificial recharge structures served the deeper aquifers and
helped to maintain the water level fluctuation variations more stable.
KEYWORDS : Artificial Recharge, Shallow Groundwater Resources, Water Logging, Water Level Fluctuation
INTRODUCTION
Groundwater is an extremely important water resource, as it comprises more than 98% of the entire world’s liquid
fresh water (Bouwer, 1978). Over exploitation of groundwater for irrigation and other purposes, especially in dry climates
and in areas which are facing water stress, has led to irreversible consequences. The ever-growing population, rapid
industrialization and increased water demand for agricultural production in numerous countries require much more water
of adequate quality to suffice their needs. Overexploitation of groundwater in several parts of the country has resulted in
declining groundwater levels, a reduction in supply, saline water encroachment, drying of the spring and shallow aquifers,
increased cost of lifting, reduction in free flow and even local subsidence in some places (Singh and Singh, 2002). In many
regions there is a lack of surface water resource and the water bearing sub-surface zones are having severe water
contamination. Shallow groundwater resources are often of poor quality and above that they are harshly over-exploited.
The decreased microbiological quality of the water may cause public health outbreaks of diarrhoeal disease, a significant
disease burden in developing countries today (Gadgil 1998).
The type and extent of chemical contamination of the groundwater largely depend on the anthropogenic activities
mainly by acid rains, fertilizers, industrial waste, garbage and domestic waste (Kaushik and Kaushik, 2006), the
geochemistry of the soil through which the water flows prior to reaching the aquifers (Zuane, 1990). Therefore, it is the
problem which is to be taken into prior consideration and all the proved water techniques along with managerial strategies
shall be adopted that could help to reduce the prevailing disaster. To meet the demand, reliance on ground water has been
2 Sakshi Sharma & Madhuri, S. Rishi
Impact Factor (JCC): 3.0965 NAAS Rating: 3.63
rapidly increasing, especially, in the arid and semi-arid regions like India, where the current ground water potential (43.2
M ha-m) needs to be judiciously utilized (Singh, 1997). Although methods like rain-water harvesting and artificial
groundwater recharge have been extensively implemented in the developed countries from several decades, but their use in
developing countries, like India, on vast scale has occurred only recently. Natural recharge of groundwater occurs through
varied water inputs into the soil in the form of precipitation and infiltration from streams, lakes, or other natural water
bodies and its discharge occurs naturally and artificially by different outputs such as evapotranspiration, runoff and
groundwater extraction.
The groundwater table is declining at a very fast rate in many parts of India. In some places it has gone beyond at
such a depth below ground that it is not economical to pump water forcommercial and non-commercial purposes and even
Government has banned digging of ground water extraction systems in considerable number of states in India. Withdrawal
of groundwater is not only responsible for declining trends, the scanty and low rainfall resulting in meager monsoon is
equally responsible. Majority of the ground water stress areas categorized as overexploited and critical units also lies in
such states.
Artificial recharge, as defined by the Central Ground Water Board (CGWB) of India, is a process of augmenting a
groundwater reservoir at a rate that exceeds natural conditions of replenishment (CGWB, 2003). Artificial recharge
systems are engineered systems where surface water is transferred directly in the ground for infiltration and subsequent
movement to aquifers to augment groundwater resources (Bouwer, 2002). In the present scenario, due to urbanization most
of the land is covered with streets, roads, roofs, and other impermeable surfaces that produce more runoff and have much
less evapotranspiration than the natural surfaces. With urbanization, more runoff is produced, which can be collected for
on-site storage and artificial recharge, or it flows naturally to ephemeral streams where it infiltrates into the soil and moves
down to the groundwater (Lerner, 2002). To reduce the reliance of water supplied by the utility companies and water
authorities, a number of authors have reported rainwater recovery and reuse systems for different buildings (Fewkes, 1999;
Dixon et.al., 1999; Mikkelson et. al.1999; Hills et. al., 1999). Artificial recharge is expected to become necessary in the
future as growing populations require more water, and as more storage of good quality water is needed for use in times of
water shortage. In this paper, we report a study undertaken in an educational institute in Chandigarh, to have better
understanding of thegroundwater dynamics in relation to artificial recharge of rainwateroccurring in different aquifersin
that area.
PURPOSE AND SCOPE
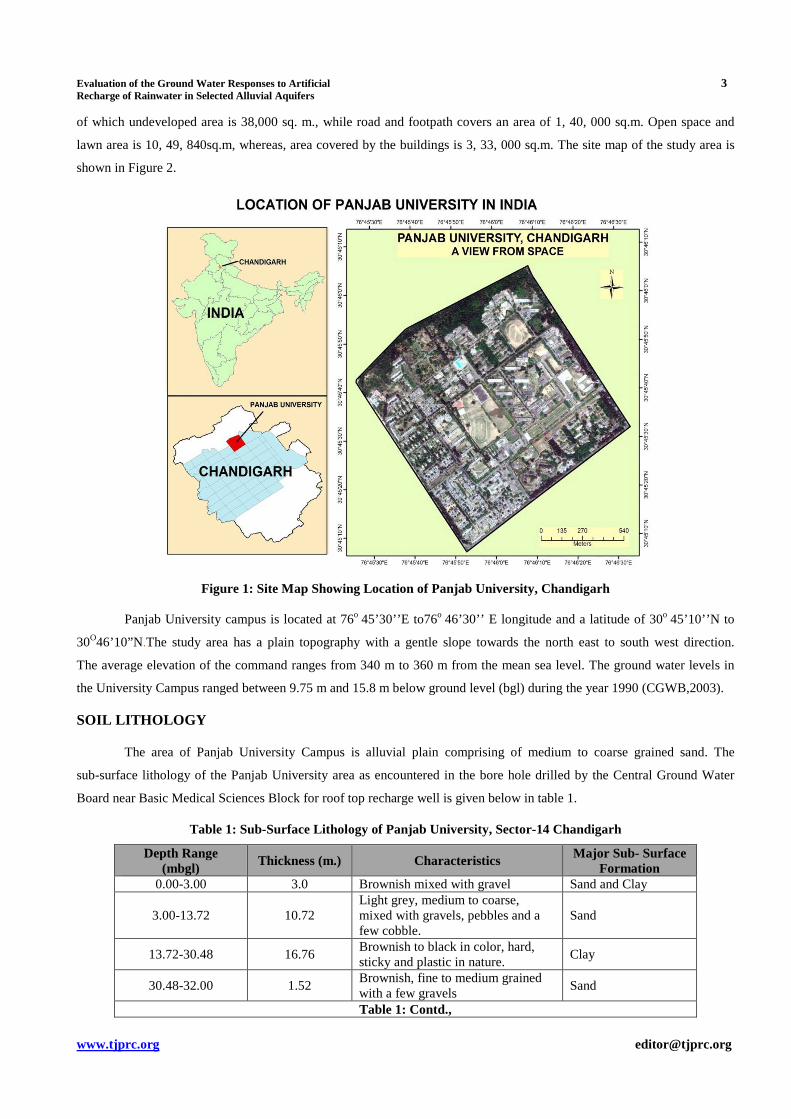
This paper documents a comparative analysis of the effects of local precipitation patterns on existing water-level
records from different sampling sites located in various hydrogeological settings in Panjab University Campus, Chandigarh
(Figure 1). The locations were chosen such that every well in the area is almost at similar depths and altitude also receives
similar precipitation while experiencing notably different levels of ground-water development. The response of ground-
water levels to precipitation patterns for records from 21 sampling sites from different regions in Panjab University
Campus is evaluated.
DESCRIPTION OF STUDY AREA
The study area for this work is the campus of Panjab University, which is located at sector-14 Chandigarh,
Punjab, India. It is located in North Western part of the Chandigarh. The total land area of Sector- 14 is 15, 60,840sq.m.out
Evaluation of the Ground Water Responses to Artificial 3 Recharge of Rainwater in Selected Alluvial Aquifers
www.tjprc.org [email protected]
of which undeveloped area is 38,000 sq. m., while road and footpath covers an area of 1, 40, 000 sq.m. Open space and
lawn area is 10, 49, 840sq.m, whereas, area covered by the buildings is 3, 33, 000 sq.m. The site map of the study area is
shown in Figure 2.
Figure 1: Site Map Showing Location of Panjab University, Chandigarh
Panjab University campus is located at 76o 45’30’’E to76o 46’30’’ E longitude and a latitude of 30o 45’10’’N to
30O46’10”N.The study area has a plain topography with a gentle slope towards the north east to south west direction.
The average elevation of the command ranges from 340 m to 360 m from the mean sea level. The ground water levels in
the University Campus ranged between 9.75 m and 15.8 m below ground level (bgl) during the year 1990 (CGWB,2003).
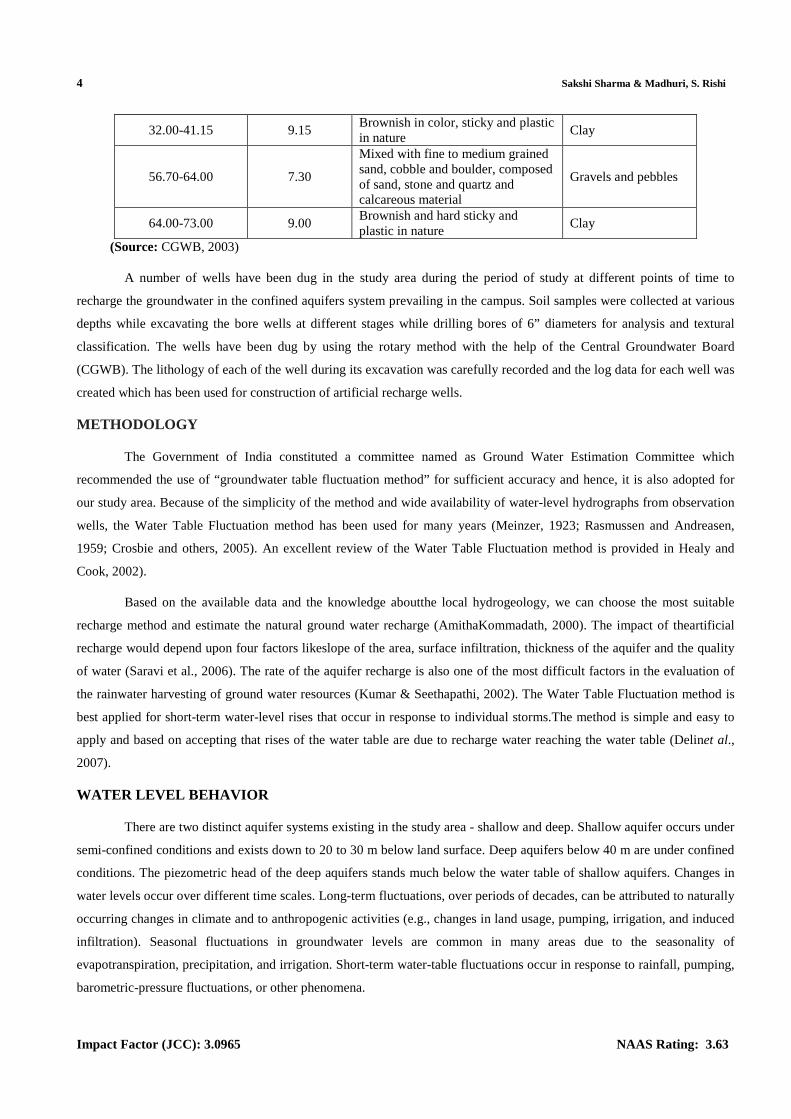
SOIL LITHOLOGY
The area of Panjab University Campus is alluvial plain comprising of medium to coarse grained sand. The
sub-surface lithology of the Panjab University area as encountered in the bore hole drilled by the Central Ground Water
Board near Basic Medical Sciences Block for roof top recharge well is given below in table 1.
Table 1: Sub-Surface Lithology of Panjab University, Sector-14 Chandigarh
Depth Range (mbgl)
Thickness (m.) Characteristics Major Sub- Surface Formation
0.00-3.00 3.0 Brownish mixed with gravel Sand and Clay
3.00-13.72 10.72 Light grey, medium to coarse, mixed with gravels, pebbles and a few cobble.
Sand
13.72-30.48 16.76 Brownish to black in color, hard, sticky and plastic in nature.
Clay
30.48-32.00 1.52 Brownish, fine to medium grained with a few gravels
Sand
Table 1: Contd.,
4 Sakshi Sharma & Madhuri, S. Rishi
Impact Factor (JCC): 3.0965 NAAS Rating: 3.63
32.00-41.15 9.15 Brownish in color, sticky and plastic in nature
Clay
56.70-64.00 7.30
Mixed with fine to medium grained sand, cobble and boulder, composed of sand, stone and quartz and calcareous material
Gravels and pebbles
64.00-73.00 9.00 Brownish and hard sticky and plastic in nature
Clay
(Source: CGWB, 2003)
A number of wells have been dug in the study area during the period of study at different points of time to
recharge the groundwater in the confined aquifers system prevailing in the campus. Soil samples were collected at various
depths while excavating the bore wells at different stages while drilling bores of 6” diameters for analysis and textural
classification. The wells have been dug by using the rotary method with the help of the Central Groundwater Board
(CGWB). The lithology of each of the well during its excavation was carefully recorded and the log data for each well was
created which has been used for construction of artificial recharge wells.
METHODOLOGY
The Government of India constituted a committee named as Ground Water Estimation Committee which
recommended the use of “groundwater table fluctuation method” for sufficient accuracy and hence, it is also adopted for
our study area. Because of the simplicity of the method and wide availability of water-level hydrographs from observation
wells, the Water Table Fluctuation method has been used for many years (Meinzer, 1923; Rasmussen and Andreasen,
1959; Crosbie and others, 2005). An excellent review of the Water Table Fluctuation method is provided in Healy and
Cook, 2002).
Based on the available data and the knowledge aboutthe local hydrogeology, we can choose the most suitable
recharge method and estimate the natural ground water recharge (AmithaKommadath, 2000). The impact of theartificial
recharge would depend upon four factors likeslope of the area, surface infiltration, thickness of the aquifer and the quality
of water (Saravi et al., 2006). The rate of the aquifer recharge is also one of the most difficult factors in the evaluation of
the rainwater harvesting of ground water resources (Kumar & Seethapathi, 2002). The Water Table Fluctuation method is
best applied for short-term water-level rises that occur in response to individual storms.The method is simple and easy to
apply and based on accepting that rises of the water table are due to recharge water reaching the water table (Delinet al.,
2007).
WATER LEVEL BEHAVIOR
There are two distinct aquifer systems existing in the study area - shallow and deep. Shallow aquifer occurs under
semi-confined conditions and exists down to 20 to 30 m below land surface. Deep aquifers below 40 m are under confined
conditions. The piezometric head of the deep aquifers stands much below the water table of shallow aquifers. Changes in
water levels occur over different time scales. Long-term fluctuations, over periods of decades, can be attributed to naturally
occurring changes in climate and to anthropogenic activities (e.g., changes in land usage, pumping, irrigation, and induced
infiltration). Seasonal fluctuations in groundwater levels are common in many areas due to the seasonality of
evapotranspiration, precipitation, and irrigation. Short-term water-table fluctuations occur in response to rainfall, pumping,
barometric-pressure fluctuations, or other phenomena.
Evaluation of the Ground Water Responses to Artificial 5 Recharge of Rainwater in Selected Alluvial Aquifers
www.tjprc.org [email protected]
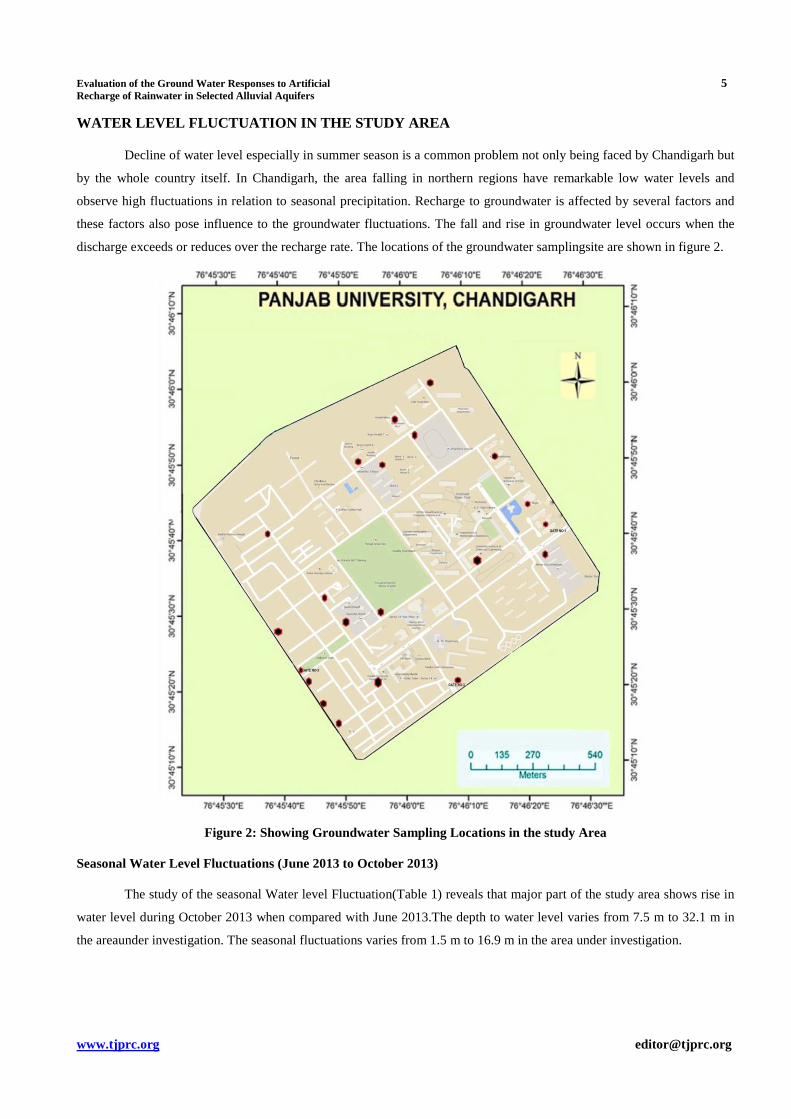
WATER LEVEL FLUCTUATION IN THE STUDY AREA
Decline of water level especially in summer season is a common problem not only being faced by Chandigarh but
by the whole country itself. In Chandigarh, the area falling in northern regions have remarkable low water levels and
observe high fluctuations in relation to seasonal precipitation. Recharge to groundwater is affected by several factors and
these factors also pose influence to the groundwater fluctuations. The fall and rise in groundwater level occurs when the
discharge exceeds or reduces over the recharge rate. The locations of the groundwater samplingsite are shown in figure 2.
Figure 2: Showing Groundwater Sampling Locations in the study Area
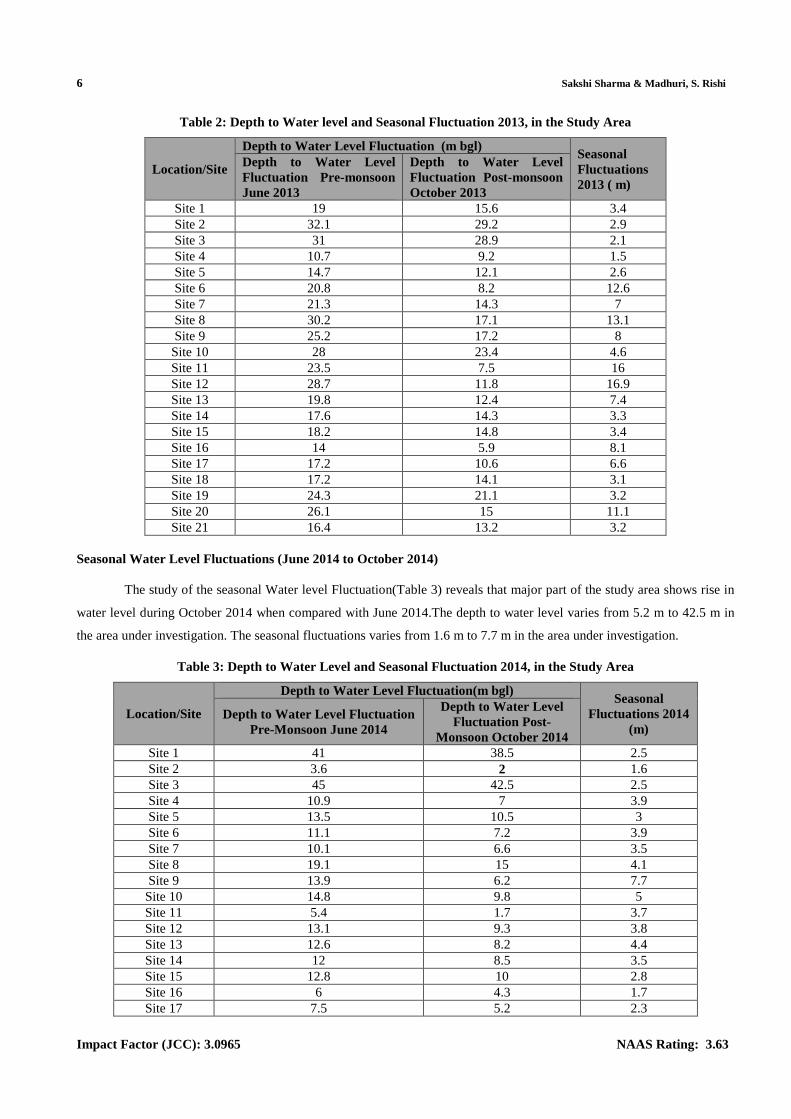
Seasonal Water Level Fluctuations (June 2013 to October 2013)
The study of the seasonal Water level Fluctuation(Table 1) reveals that major part of the study area shows rise in
water level during October 2013 when compared with June 2013.The depth to water level varies from 7.5 m to 32.1 m in
the areaunder investigation. The seasonal fluctuations varies from 1.5 m to 16.9 m in the area under investigation.
6 Sakshi Sharma & Madhuri, S. Rishi
Impact Factor (JCC): 3.0965 NAAS Rating: 3.63
Table 2: Depth to Water level and Seasonal Fluctuation 2013, in the Study Area
Location/Site
Depth to Water Level Fluctuation (m bgl) Seasonal Fluctuations 2013 ( m)
Depth to Water Level Fluctuation Pre-monsoon June 2013
Depth to Water Level Fluctuation Post-monsoon October 2013
Site 1 19 15.6 3.4 Site 2 32.1 29.2 2.9 Site 3 31 28.9 2.1 Site 4 10.7 9.2 1.5 Site 5 14.7 12.1 2.6 Site 6 20.8 8.2 12.6 Site 7 21.3 14.3 7 Site 8 30.2 17.1 13.1 Site 9 25.2 17.2 8 Site 10 28 23.4 4.6 Site 11 23.5 7.5 16 Site 12 28.7 11.8 16.9 Site 13 19.8 12.4 7.4 Site 14 17.6 14.3 3.3 Site 15 18.2 14.8 3.4 Site 16 14 5.9 8.1 Site 17 17.2 10.6 6.6 Site 18 17.2 14.1 3.1 Site 19 24.3 21.1 3.2 Site 20 26.1 15 11.1 Site 21 16.4 13.2 3.2
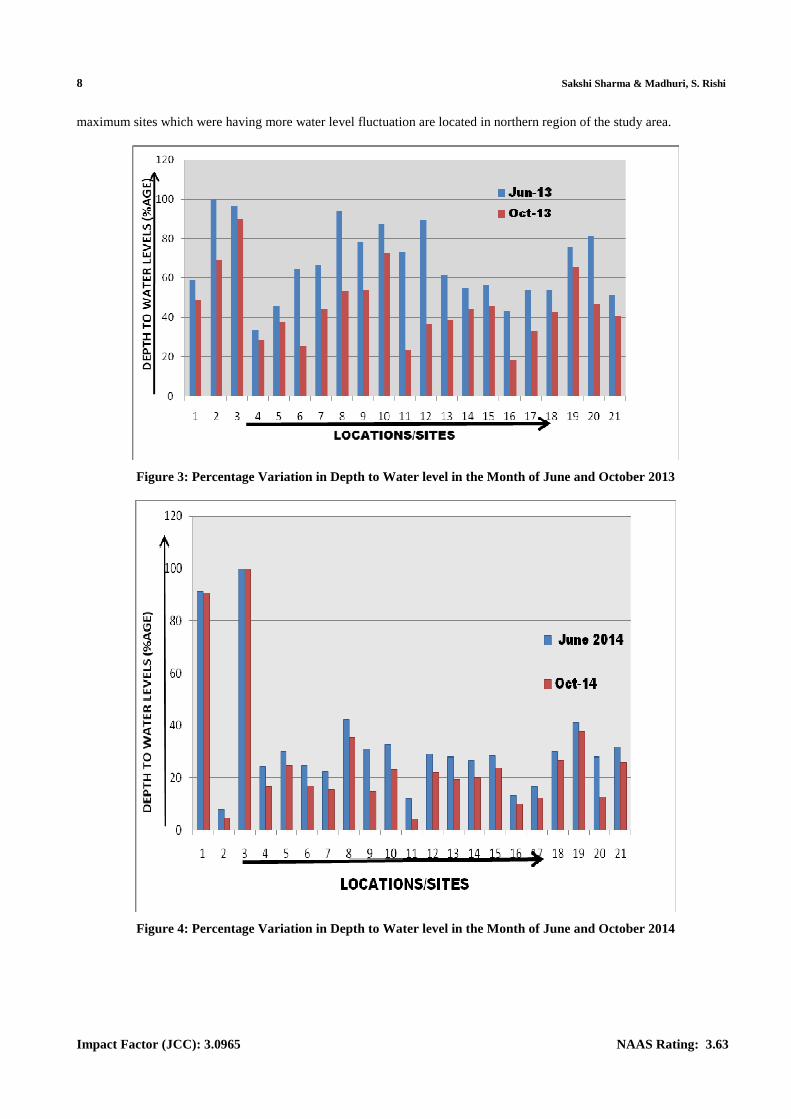
Seasonal Water Level Fluctuations (June 2014 to October 2014)
The study of the seasonal Water level Fluctuation(Table 3) reveals that major part of the study area shows rise in
water level during October 2014 when compared with June 2014.The depth to water level varies from 5.2 m to 42.5 m in
the area under investigation. The seasonal fluctuations varies from 1.6 m to 7.7 m in the area under investigation.
Table 3: Depth to Water Level and Seasonal Fluctuation 2014, in the Study Area
Location/Site
Depth to Water Level Fluctuation(m bgl) Seasonal
Fluctuations 2014 (m)
Depth to Water Level Fluctuation Pre-Monsoon June 2014
Depth to Water Level Fluctuation Post-
Monsoon October 2014 Site 1 41 38.5 2.5 Site 2 3.6 2 1.6 Site 3 45 42.5 2.5 Site 4 10.9 7 3.9 Site 5 13.5 10.5 3 Site 6 11.1 7.2 3.9 Site 7 10.1 6.6 3.5 Site 8 19.1 15 4.1 Site 9 13.9 6.2 7.7 Site 10 14.8 9.8 5 Site 11 5.4 1.7 3.7 Site 12 13.1 9.3 3.8 Site 13 12.6 8.2 4.4 Site 14 12 8.5 3.5 Site 15 12.8 10 2.8 Site 16 6 4.3 1.7 Site 17 7.5 5.2 2.3
Evaluation of the Ground Water Responses to Artificial 7 Recharge of Rainwater in Selected Alluvial Aquifers
www.tjprc.org [email protected]
Table 3: Contd., Site 18 13.1 11.3 1.8 Site 19 18.4 16 2.4 Site 20 12.6 5.4 7.2 Site 21 14.3 11 3.3
Annual Water Level Fluctuations (Pre-monsoon, June 2013 to June 2014)
Annual Water level fluctuation has been worked out by comparing depth to water level, recorded during June
2013 and June 2014 (Table 4). The study shows that (15%) of the stations which are located in northern parts show fall in
water level. Average fall in the area under study is 12 m. Table 3 showing annual fluctuation for pre-monsoon (June 2013
To June 2014) reveals that the out of 21 sites,fall in water level is most prominent in sites falling in northern region.
Table 4: Depth to Water Level and Annual Seasonal Fluctuations 2013-2014, in the Study Area
Location/Sites
Depth to Water Level Fluctuation (m bgl) Seasonal
Fluctuations ( m)
Depth to Water Level Fluctuation (m bgl) June 2013
Depth to Water Level Fluctuation (m bgl) June
2014 Site 1 19 41 -22 Site 2 32.1 3.6 28.5 Site 3 31 45 -14 Site 4 10.7 10.9 -0.2 Site 5 14.7 13.5 1.2 Site 6 20.8 11.1 9.7 Site 7 21.3 10.1 11.2 Site 8 30.2 19.1 11.1 Site 9 25.2 13.9 11.3 Site 10 28 14.8 13.2 Site 11 23.5 5.4 18.1 Site 12 28.7 13.1 15.6 Site 13 19.8 12.6 7.2 Site 14 17.6 12 5.6 Site 15 18.2 12.8 5.4 Site 16 14 6 8 Site 17 17.2 7.5 9.7 Site 18 17.2 13.1 4.1 Site 19 24.3 18.4 5.9 Site 20 26.1 12.6 13.5 Site 21 16.4 14.3 2.1
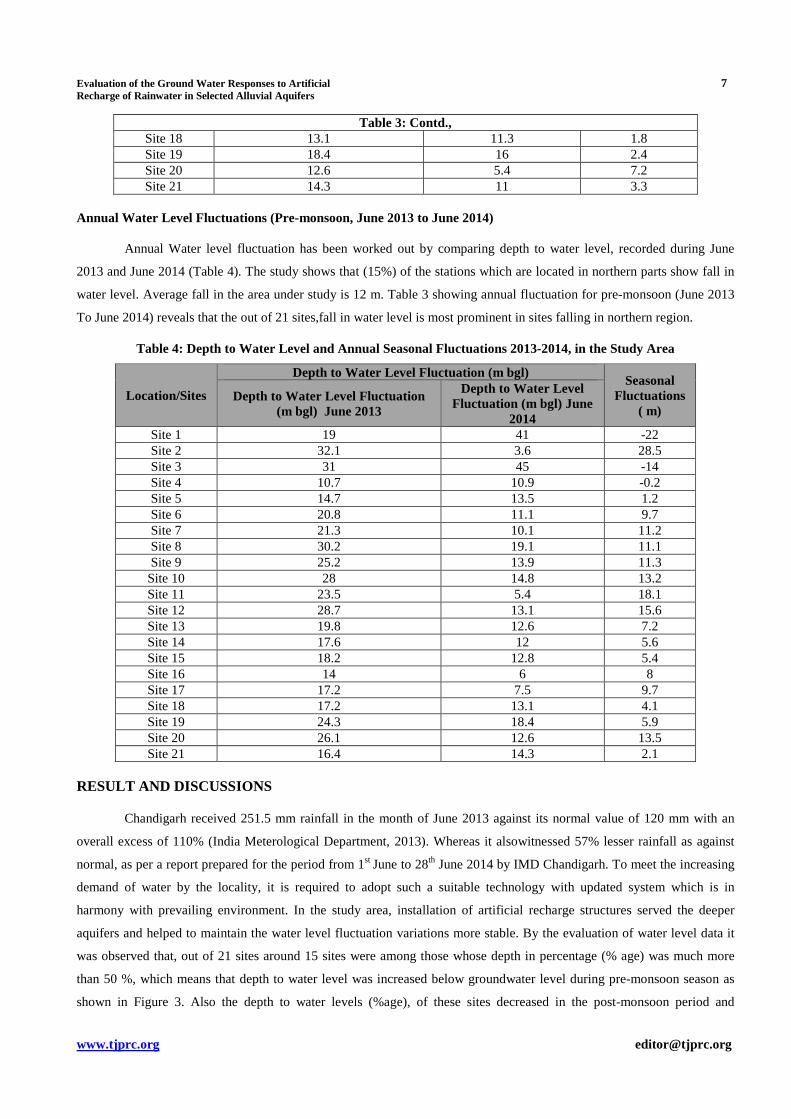
RESULT AND DISCUSSIONS
Chandigarh received 251.5 mm rainfall in the month of June 2013 against its normal value of 120 mm with an
overall excess of 110% (India Meterological Department, 2013). Whereas it alsowitnessed 57% lesser rainfall as against
normal, as per a report prepared for the period from 1st June to 28th June 2014 by IMD Chandigarh. To meet the increasing
demand of water by the locality, it is required to adopt such a suitable technology with updated system which is in
harmony with prevailing environment. In the study area, installation of artificial recharge structures served the deeper
aquifers and helped to maintain the water level fluctuation variations more stable. By the evaluation of water level data it
was observed that, out of 21 sites around 15 sites were among those whose depth in percentage (% age) was much more
than 50 %, which means that depth to water level was increased below groundwater level during pre-monsoon season as
shown in Figure 3. Also the depth to water levels (%age), of these sites decreased in the post-monsoon period and
8 Sakshi Sharma & Madhuri, S. Rishi
Impact Factor (JCC): 3.0965 NAAS Rating: 3.63
maximum sites which were having more water level fluctuation are located in northern region of the study area.
Figure 3: Percentage Variation in Depth to Water level in the Month of June and October 2013
Figure 4: Percentage Variation in Depth to Water level in the Month of June and October 2014
Evaluation of the Ground Water Responses to Artificial 9 Recharge of Rainwater in Selected Alluvial Aquifers
www.tjprc.org [email protected]
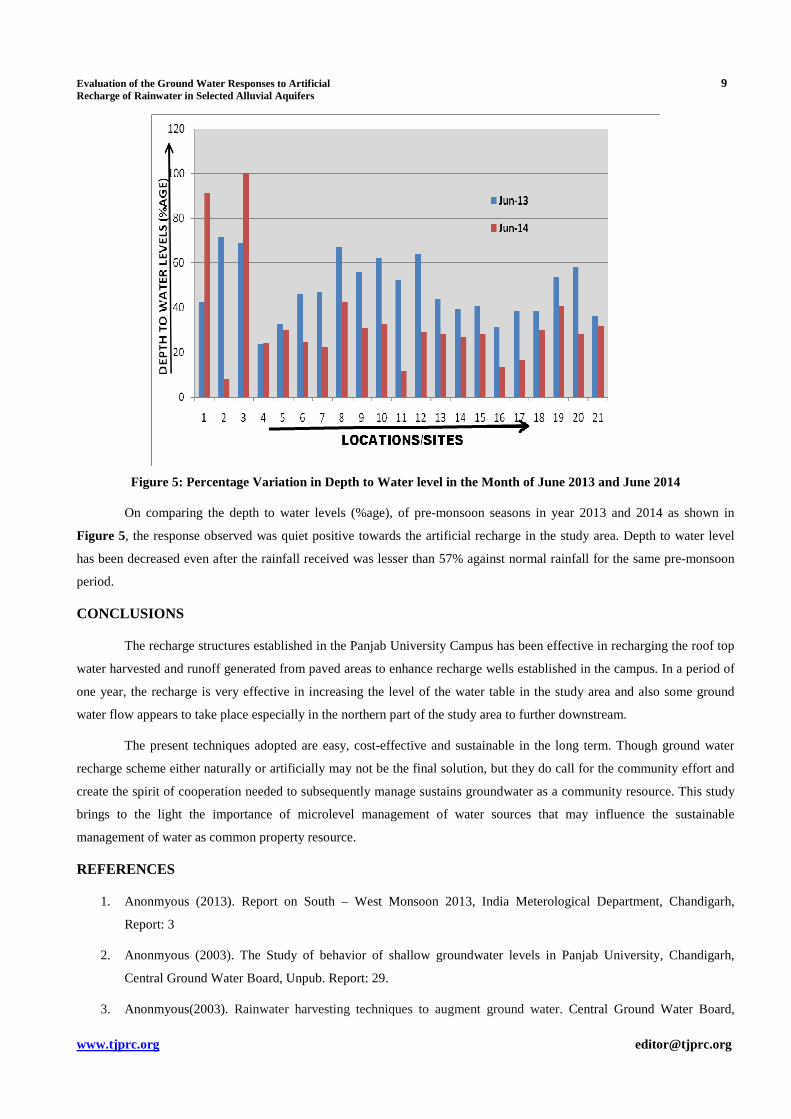
Figure 5: Percentage Variation in Depth to Water level in the Month of June 2013 and June 2014
On comparing the depth to water levels (%age), of pre-monsoon seasons in year 2013 and 2014 as shown in
Figure 5, the response observed was quiet positive towards the artificial recharge in the study area. Depth to water level
has been decreased even after the rainfall received was lesser than 57% against normal rainfall for the same pre-monsoon
period.
CONCLUSIONS
The recharge structures established in the Panjab University Campus has been effective in recharging the roof top
water harvested and runoff generated from paved areas to enhance recharge wells established in the campus. In a period of
one year, the recharge is very effective in increasing the level of the water table in the study area and also some ground
water flow appears to take place especially in the northern part of the study area to further downstream.
The present techniques adopted are easy, cost-effective and sustainable in the long term. Though ground water
recharge scheme either naturally or artificially may not be the final solution, but they do call for the community effort and
create the spirit of cooperation needed to subsequently manage sustains groundwater as a community resource. This study
brings to the light the importance of microlevel management of water sources that may influence the sustainable
management of water as common property resource.
REFERENCES
1. Anonmyous (2013). Report on South – West Monsoon 2013, India Meterological Department, Chandigarh,
Report: 3
2. Anonmyous (2003). The Study of behavior of shallow groundwater levels in Panjab University, Chandigarh,
Central Ground Water Board, Unpub. Report: 29.
3. Anonmyous(2003). Rainwater harvesting techniques to augment ground water. Central Ground Water Board,
10 Sakshi Sharma & Madhuri, S. Rishi
Impact Factor (JCC): 3.0965 NAAS Rating: 3.63
Ministry of Water Resources, Faridabad, India, 29.
4. Bouwer, H. (2002). Artificial recharge of groundwater: hydrogeology and engineering. Hydrogeology
Journal,10:121-142.
5. Bouwer, H.(1978).Ground water hydrology. New York: McGraw-Hill, 480.
6. Crosbie, R., Binning, P. and Kalma, J.(2005). A time series approach to inferring groundwater recharge using the
water table fluctuation method, Water Resources Research, 41(1): 1-9.
7. Delin, G. N.,Healy, R.W., Lorenz, D.L. and Nimmo, J.R. (2007). Comparison of local to regional scale estimates
of ground-water recharge in Minnesota,USA. Journal of Hydrology, 334 (1–2), 231–249.
8. Dixon, A., Butler, D., and Fewkes, A. (1999). Water saving potential of domestic water reuse systems using
greywater and rainwater in combination. Water Science and Technology, 39(5): 25-32.
9. Fewkes, A. (1999). The use of rainwater for WC flushing: the field testing of a collection system. Building and
Environment, 34: 765-772.
10. Gadgil, A. (1998). Drinking water in developing countries. Annual Review of Energy and Environment, 23:
253–286.
11. Healy, R. W. and Cook, P. G.(2002). Using groundwater levels to estimate recharge. Hydrogeology Journal, 10:
91–109.
12. Hills, S., English, P. and Ford, R. (1999). A recycling demonstration showcase at the Millennium Dome. In
CIWEM National Conference. London, 19 May.
13. Kaushik, A. and Kaushik, C.P.(2006). Perspectives in Environmental Studies. New Age International Publishers
21, 4-21
14. Kommadath, A. (2000).Estimation of natural ground water. Journal Mechanical Working Technology, Lake
Section7 Online.
15. Kumar, C. P. and Seethapathi, P. V. (2002). Assessment of natural groundwater recharge in Upper Ganga Canal
command area. Journal of Applied Hydrology,15: 13-20.
16. Lerner, D.N.(2002). Identifying and quantifying urban recharge: a review.Hydrology Journal 10:143-153.
17. Mikkelson, P. S., Adeler, O. F., Albrechtsen, H. J. and Henze, M. (1999). Collected Rainfall as a water source in
Danish households - what is the potential and what are the costs? Water Science and Technology, 35(5), 49-56.
18. Meinzer, O.(1923). The occurrence of groundwater in the United States with a discussion of principles. U.S.
Geological Survey Water-Supply Paper, 489.
19. Rasmussen, W. and Andreasen, G.(1959). Hydrologic budget of the Beaverdam Creek Basin, Maryland. US
Geological Survey Water-Supply Paper, 1472: 106.
20. Saravi, M.M., Malekian, A. and Nouri, B. (2006). Identification of suitable sites for groundwaterrecharge.
International Conference on Water Resources & Arid Environment: 26-29.

Evaluation of the Ground Water Responses to Artificial 11 Recharge of Rainwater in Selected Alluvial Aquifers
www.tjprc.org [email protected]
21. Singh, D. K. and Singh, A. K. (2002):Groundwater Situation in India: Problems and Perspective, International
Journal of Water Resources Development, 18(4): 563-580
22. Singh, B. (1997).Water resources development in India - a perspective. In Proceedings of International
Symposium on Emerging Trends in Hydrology, Department of Hydrology, University of Roorkee, Roorkee, India
1: 1-17.
23. Zuane, J. D. (1990). Drinking water quality: Standards and control. New York, Van Nostrand Reinhold.