Evaluation of the Effects of a Twin Spark Ignition System ...
10
1876-6102 © 2015 Published by Elsevier Ltd. This is an open access article under the CC BY-NC-ND license (http://creativecommons.org/licenses/by-nc-nd/4.0/). Peer-review under responsibility of the Scientific Committee of ATI 2014 doi:10.1016/j.egypro.2015.12.143 Energy Procedia 81 (2015) 897 – 906 ScienceDirect 69th Conference of the Italian Thermal Engineering Association, ATI2014 Evaluation of the effects of a Twin Spark Ignition System on combustion stability of a high performance PFI engine Claudio Forte a,∗ , Gian Marco Bianchi a , Enrico Corti a , Stefano Fantoni b a DIN - Department of Industrial Engineering - University of Bologna, Via del Risorgimento 2, 40136 Bologna, Italy b Ducati Motor Holding SpA, Via Cavalieri Ducati 3,40132 Bologna, Italy Abstract The continuous demand for high performances and low emissions engines leads the engine manufactures to set the operating range of combustion devices near to their stability limit. Combustion stability is closely related to the formation of the first ignition kernel: an effective way of lowering Cycle-by-Cycle Variation (CCV) is to enhance the start of combustion by means of multiple sparks. A Ducati engine was equipped with a Twin Spark ignition system and a consistent improvement in combustion stability arised for both part load and full load conditions. At part load a sensible reduction of cycle-by-cycle variability of indicated mean effective pressure was found, while at full load condition the twin spark configuration showed an increase of power, but with higher knocking tendency. The aim of this work is to better understand the root causes of the increased level of knock and to make a critical evaluation of most used knock indexes, by means of an accurate analysis of the experimental and simulated pressure signals. The numerical methodology based on a perturbation of the initial kernel by a statistical evaluation of mixture condition at ignition location. A lagrangian ignition model developed at University of Bologna was used, here modified to take into account the statistical distribution of mixture around the spark plugs. The RANS simulations proved to be accurate in representing all the main information related to combustion efficiency and knocking events. Keywords: High Performance Engine; Knock; Twin Spark; Cycle by Cycle Variability; ∗ Corresponding author. Tel.: +39-051-2093-314 ; fax: +39-051-2093-313. E-mail address: [email protected] Available online at www.sciencedirect.com © 2015 Published by Elsevier Ltd. This is an open access article under the CC BY-NC-ND license (http://creativecommons.org/licenses/by-nc-nd/4.0/). Peer-review under responsibility of the Scientific Committee of ATI 2014
Transcript of Evaluation of the Effects of a Twin Spark Ignition System ...

1876-6102 © 2015 Published by Elsevier Ltd. This is an open access article under the CC BY-NC-ND license (http://creativecommons.org/licenses/by-nc-nd/4.0/).Peer-review under responsibility of the Scientific Committee of ATI 2014doi: 10.1016/j.egypro.2015.12.143
Energy Procedia 81 ( 2015 ) 897 – 906
ScienceDirect
69th Conference of the Italian Thermal Engineering Association, ATI2014
Evaluation of the effects of a Twin Spark Ignition System on
combustion stability of a high performance PFI engine
Claudio Fortea,∗, Gian Marco Bianchia, Enrico Cortia, Stefano Fantonib
aDIN - Department of Industrial Engineering - University of Bologna, Via del Risorgimento 2, 40136 Bologna, ItalybDucati Motor Holding SpA, Via Cavalieri Ducati 3,40132 Bologna, Italy
Abstract
The continuous demand for high performances and low emissions engines leads the engine manufactures to set the operating range
of combustion devices near to their stability limit. Combustion stability is closely related to the formation of the first ignition
kernel: an effective way of lowering Cycle-by-Cycle Variation (CCV) is to enhance the start of combustion by means of multiple
sparks. A Ducati engine was equipped with a Twin Spark ignition system and a consistent improvement in combustion stability
arised for both part load and full load conditions.
At part load a sensible reduction of cycle-by-cycle variability of indicated mean effective pressure was found, while at full load
condition the twin spark configuration showed an increase of power, but with higher knocking tendency. The aim of this work is to
better understand the root causes of the increased level of knock and to make a critical evaluation of most used knock indexes, by
means of an accurate analysis of the experimental and simulated pressure signals.
The numerical methodology based on a perturbation of the initial kernel by a statistical evaluation of mixture condition at
ignition location. A lagrangian ignition model developed at University of Bologna was used, here modified to take into account
the statistical distribution of mixture around the spark plugs. The RANS simulations proved to be accurate in representing all the
main information related to combustion efficiency and knocking events.c© 2015 The Authors. Published by Elsevier Ltd.
Peer-review under responsibility of the Scientific Committee of ATI 2014.
Keywords: High Performance Engine; Knock; Twin Spark; Cycle by Cycle Variability;
∗ Corresponding author. Tel.: +39-051-2093-314 ; fax: +39-051-2093-313.
E-mail address: [email protected]
Available online at www.sciencedirect.com
© 2015 Published by Elsevier Ltd. This is an open access article under the CC BY-NC-ND license (http://creativecommons.org/licenses/by-nc-nd/4.0/).Peer-review under responsibility of the Scientific Committee of ATI 2014

898 Claudio Forte et al. / Energy Procedia 81 ( 2015 ) 897 – 906
Nomenclature
A/F Air to Fuel Ratio
ADV Spark Advance
CCV Cycle by Cycle Variation
CHRNET Net Cumulative Heat Release
DKI Dimensionless Knock Indicator
DNS Direct Numerical Simulation
IMEP Indicated Mean Effective Pressure
IVO Intake Valve Opening
IVC Inlet Valve Closing
LES Large Eddy Simulation
MAPO Maximum Amplitude of Pressure Oscillation
IMPG Integral Modulus of Pressure Gradient
IMPO Integral Modulus of Pressure Oscillation
MFB10 10% Mass Fraction Burned
MFB50 50% Mass Fraction Burned
MFB90 90% Mass Fraction Burned
MS Mono Spark
PFI Port Fuel Injection
RANS Reynolds Averaged Navier-Stokes equations
SI Spark Ignition
TS Twin Spark
1. Introduction
The quest for high performances and low emissions leads engine manufactures to trim the operating range of
combustion devices near their stability limit. The capability of accurately simulate the engine in such a critical
conditions is indispensable and many steps are made, both in terms of CFD modeling and computational hardware
development.
There are above all two limits that restrict engine operation because of CCV: in the lower part-load range one
should mention the misfiring limit, which comes into play primarily in the course of high degrees of charge dilution
(residual gas, air) and the associated increase in cyclic fluctuations. At full load, on the other hand, the knock limit
restricts optimum-efficiency combustion control.
One effective way to improve combustion stability at low load condition is the use of Twin Spark ignition system:
Bozza et al. [1] developed a quasi dimensional three-zone model for the geometrical evaluation of the double ker-
nel formation, and applied it for the simulation of an High-EGR VVT-Engine, in both mono spark and twin spark
configuration.
Cavina et al. [2] showed how a multiple discharge is an effective way of improving ignitability of lean and diluted
mixtures, shortening ignition delay and combustion duration, and preventing misfire occurrence without any impact
on the intake fluid dynamics, and proposed a methodology for real time control purpose.
Modeling the CCV (Cycle by Cycle Variation) of spark ignition engine is essentially based on a forced perturbation
of the combustion evolution in the chamber: a lot of methodologies today available in literature are based on this
mechanism, but the key issue is the way these perturbations are selected. The imposition of a change in the combustion
evolution must be based on real engine condition to be predictive.
Even a simple model for cyclic variation based on a Monte Carlo approach [3] can correctly represent the engine
behaviour, but no practical information can be used for engine design.

Claudio Forte et al. / Energy Procedia 81 ( 2015 ) 897 – 906 899
Table 1. Engine configuration
Bore 106mm
Stroke 67.9mm
Regime 8500 rpm
Load Full load
Engine ignition system Mono Spark / Twin Spark
Spark Advance Sweep until max IMEP
λ 0.83
The actual feasible way to effectively reproduce CCV is by performing full 3D CFD LES (Larg Eddy Simulation)
of the engine. Tatschl et al. [4] and Vitek et al. [5] investigated the root causes of CCV by means of a combined 1D-
3D simulation: the in-cylinder analysis was based on LES approach. They concluded that the instantaneous flow field
of individual cycles in different cross-sections of the cylinder demonstrated a combined small- and large-scale nature
of the flow field fluctuation, which interacts closely with the spray droplet distribution and fuel vapor concentration.
In the present work the authors propose a RANS (Reynold’s Averaged Navier-Stokes equations) methodology for
the evaluation of combustion instabilities based on mixture composition at the spark plug. In a previous work [6],
the authors investigated the root causes of the cycle-by-cycle variability increase with leaner combustion, by means
of a joint numerical and experimental approach: the authors showed that the combustion sensitivity to the initial
perturbation of the mixture air index at spark location and to the level of in-cylinder air index homogeneity increases,
due to the lower laminar combustion speed of leaner mixtures. The authors concluded that efficient mixing processes
are mandatory any time the engine operates with suboptimal air indexes (far from those giving the maximum laminar
speed).
The aim of this work is the evaluation of combustion behaviour of a Ducati high performance engine, equipped with
a twin spark ignition system. The low stroke to bore ratio makes the combustion very critical in the narrow volume
of the combustion chamber, especially under part load condition. In this configuration the twin spark ignition greatly
improves the stability of the engine, but also in full load condition the fastest initial kernel development reduced the
variability of the engine. The engine was analyzed by the authors in previous works [7] [8]: the actual contribution is
a critical evaluation of the results, by deepening the correlation between knock events and pressure signal.
Due to confidential agreement with Ducati some of the data in the present paper will be referred to a conventional
condition.
2. Experimental analysis of combustion efficiency and knock
The engine under analysis is a Ducati high performance engine, here evaluated in the configurations of Tab. 1
The engine run on the test bench equipped with a pressure sensor located in the chamber. The pressure traces of
300 engine cycles are recorded for each engine point analyzed for both the Twin Spark and Mono Spark configura-
tions. The spark advance swept is accomplished by advancing the combustion until the maximum brake torque. The
indicating parameters are extracted by filtering the pressure signal with a butterworth zero-delay low pass filter at
3kHz for IMEP and CHRnet, with a butterworth band-pass filter at between 5kHz and 20kHz for the high frequency
parameters.
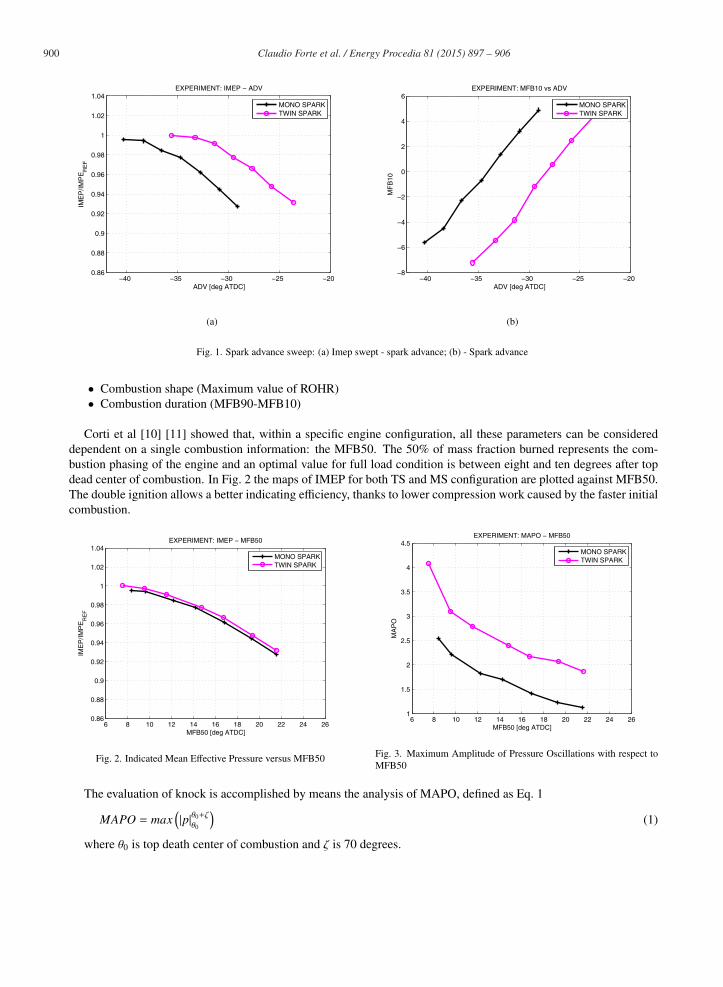
Fig. 1(a) summarizes the results found in previous works [7] [8], showing how the twin spark allows more efficient
combustions, with higher values of maximum IMEP and faster combustions: the ADV of maximum brake torque is
four degrees lower than the single spark configuration.
The increase in combustion rate is focused in the early stages (Fig. 1(b)), with a MFB10 (10% Mass Fraction
Burnes) of twin spark configuration four degrees lower. This is the consequence of the double flame fronts initiated in
the chamber. In order to better understand the relation between the combustion efficiency and combustion phasing an
alternative approach needs to be implemented. In a previous work the authors [9] showed how the main combustion
characteristics can be summarized by means of:
• Combustion initiation (MFB10-ADV)
900 Claudio Forte et al. / Energy Procedia 81 ( 2015 ) 897 – 906
−40 −35 −30 −25 −200.86
0.88
0.9
0.92
0.94
0.96
0.98
1
1.02
1.04EXPERIMENT: IMEP − ADV
ADV [deg ATDC]
IME
P/IM
PE
RE
F
MONO SPARKTWIN SPARK
(a)
−40 −35 −30 −25 −20−8
−6
−4
−2
0
2
4
6EXPERIMENT: MFB10 vs ADV
ADV [deg ATDC]
MF
B10
MONO SPARKTWIN SPARK
(b)
Fig. 1. Spark advance sweep: (a) Imep swept - spark advance; (b) - Spark advance
• Combustion shape (Maximum value of ROHR)
• Combustion duration (MFB90-MFB10)
Corti et al [10] [11] showed that, within a specific engine configuration, all these parameters can be considered
dependent on a single combustion information: the MFB50. The 50% of mass fraction burned represents the com-
bustion phasing of the engine and an optimal value for full load condition is between eight and ten degrees after top
dead center of combustion. In Fig. 2 the maps of IMEP for both TS and MS configuration are plotted against MFB50.
The double ignition allows a better indicating efficiency, thanks to lower compression work caused by the faster initial
combustion.
6 8 10 12 14 16 18 20 22 24 260.86
0.88
0.9
0.92
0.94
0.96
0.98
1
1.02
1.04EXPERIMENT: IMEP − MFB50
MFB50 [deg ATDC]
IME
P/IM
PE
RE
F
MONO SPARKTWIN SPARK
Fig. 2. Indicated Mean Effective Pressure versus MFB50
6 8 10 12 14 16 18 20 22 24 261
1.5
2
2.5
3
3.5
4
4.5EXPERIMENT: MAPO − MFB50
MFB50 [deg ATDC]
MA
PO
MONO SPARKTWIN SPARK
Fig. 3. Maximum Amplitude of Pressure Oscillations with respect to
MFB50
The evaluation of knock is accomplished by means the analysis of MAPO, defined as Eq. 1
MAPO = max(|p|θ0+ζθ0
)(1)
where θ0 is top death center of combustion and ζ is 70 degrees.

Claudio Forte et al. / Energy Procedia 81 ( 2015 ) 897 – 906 901
The knock tendency of the engine is depicted in Fig. 3, in which the mean value of MAPO of 300 cycles is plotted
against combustion pahsing MFB50.
TS configuration reveals higher knock sensitivity on the whole range of spark advance sweept analyzed: an ADV
control set for the same risk of damage would completely cancel the positive effects of better combustion efficiency.
In order to gain a more deep insight in the origin of the higher pressure oscillation of the twin spark ignition a CFD
analysis of combustion process is developed.
3. Description of the CFD RANS Simulation Methodology
The aim of the CFD simulation is the evaluation of combustion of Twin/Mono Spark engine and the understanding
of the origin of the higher knocking behaviour of TS configuration. The flow chart of the methodology is sketched in
Fig. 4. The first step is an accurate reconstruction of the mixture composition in the chamber. To this purpose a multi-
step methodology [12] has been accomplished in FIREv2011 (AVL), and all the physics involved in the injection
process are evaluated and validated.
Fig. 4. Flow chart of the CFD methodology
Fig. 5 shows the equivalence ratio in the chamber at IVC and the location of the two spark plugs. The stars in the
figures illustrate the spark locations: in the engine analyzed one spark is at the center of the chamber (the only one
active in MS configuration), the other between inlet and exhaust valves. The fuel distribution is not homogeneous and
the second plug is inside a leaner zone.
Fig. 5. Distribution of the fuel in the chamber at IVC Fig. 6. Spark plugs and sensor position
The results of injection simulations are then mapped on a modified version of KIVA3D-code, developped at the
university of Bologna. The main models implemented in the code are deeply described in [13] and listed in Tab. 2

902 Claudio Forte et al. / Energy Procedia 81 ( 2015 ) 897 – 906
Table 2. KIVA3D CFD MODELS
Combustion Extended Coherent Flamelet
Knock two step autoignition model based on [14]
Ignition Lagrangian ignition model [15] [16]
4. Simulation of combustion
The flamelet combustion model is tuned to correctly represent the real mean behaviour of the monospark configu-
ration. Because of the cycle by cycle variability of the SI engines all the pressure traces of the experimental data are
widely scattered, representing very different combustion characteristics. As it was shown in [17], the identification of
the representative cycles is a key issue: the standard synchronous pressure average on a crank angle basis can lead to
mean engine cycles which do not really exist. As it was shown in [8], the simulated mean cycle is compared witha
selection of mean representative cycles, with MFB50 equal to the experimental mid-values.
The overall behaviour on the whole spark advance swept is in Fig. 7(a) Fig. 7(b): the simulation is able to represent
both the combustion phasing of various spark advance (MFB50 on x-axis) and the higher efficiency of TS solution.
6 8 10 12 14 16 18 20 22 24 260.86
0.88
0.9
0.92
0.94
0.96
0.98
1
1.02
1.04EXPERIMENT: IMEP − MFB50
MFB50 [deg ATDC]
IME
P/IM
PE
RE
F
MONO SPARKTWIN SPARK
(a)
6 8 10 12 14 16 18 20 22 24 260.86
0.88
0.9
0.92
0.94
0.96
0.98
1
1.02
1.04SIMULATION:IMEP − MFB50
MFB50 [deg ATDC]
IME
P
MONO SPARKTWIN SPARK
(b)
Fig. 7. Indicated mean effective pressure: (a) Experimental; (b) Simulated
The knocking combustion is a highly stochastic phenomenon and the criteria for the identification of thresholds is
often based on statistics. The needs to better identify the behaviour of the to spark installations has taken the authors
to implement a methodology for the evaluation of cycle by cycle variability. An effective way to simulate the cycle by
cycle variation of a spark ignition engine is based on a forced perturbation of the combustion evolution, with particular
emphasis on the early kernel development. The methodology of perturbation used ( [7] [8]) is focused not only on a
simple relationship between the perturbation strength and the amplitude of results, but it is grounded on the spatial
characterization of the mixture and turbulence located at the spark plug.
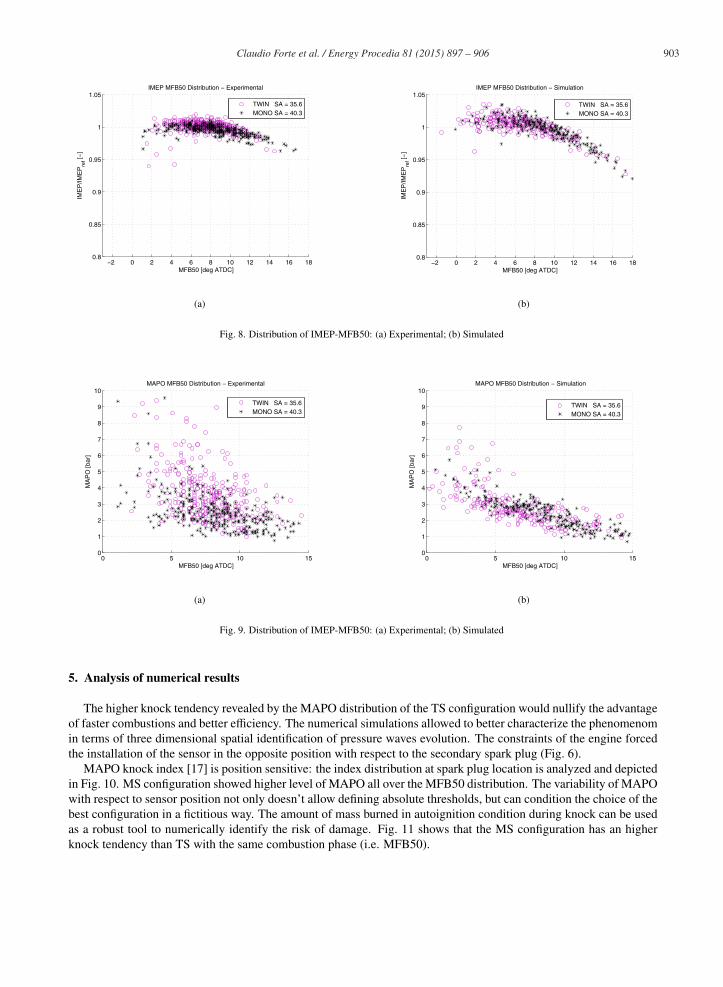
Fig. 8(a) and Fig. 8(b) show the comparison between the TS and MS configuration for both experimental and
simulated results. The typical distribution of parabola-like patterns is well gathered, together with the higher tendency
of TS configuration to have variability of IMEP.
The knock sensitivity can be extracted from Fig. 9(a) and Fig. 9(b): TS configuration has higher value of MAPO,
expecialy in the lower MFB50.
Claudio Forte et al. / Energy Procedia 81 ( 2015 ) 897 – 906 903
−2 0 2 4 6 8 10 12 14 16 180.8
0.85
0.9
0.95
1
1.05IMEP MFB50 Distribution − Experimental
IME
P/IM
EP
ref [−
]
MFB50 [deg ATDC]
TWIN SA = 35.6MONO SA = 40.3
(a)
−2 0 2 4 6 8 10 12 14 16 180.8
0.85
0.9
0.95
1
1.05IMEP MFB50 Distribution − Simulation
IME
P/IM
EP
ref [−
]
MFB50 [deg ATDC]
TWIN SA = 35.6MONO SA = 40.3
(b)
Fig. 8. Distribution of IMEP-MFB50: (a) Experimental; (b) Simulated
0 5 10 150
1
2
3
4
5
6
7
8
9
10MAPO MFB50 Distribution − Experimental
MA
PO
[bar
]
MFB50 [deg ATDC]
TWIN SA = 35.6MONO SA = 40.3
(a)
0 5 10 150
1
2
3
4
5
6
7
8
9
10 MAPO MFB50 Distribution − Simulation
MA
PO
[bar
]
MFB50 [deg ATDC]
TWIN SA = 35.6MONO SA = 40.3
(b)
Fig. 9. Distribution of IMEP-MFB50: (a) Experimental; (b) Simulated
5. Analysis of numerical results
The higher knock tendency revealed by the MAPO distribution of the TS configuration would nullify the advantage
of faster combustions and better efficiency. The numerical simulations allowed to better characterize the phenomenom
in terms of three dimensional spatial identification of pressure waves evolution. The constraints of the engine forced
the installation of the sensor in the opposite position with respect to the secondary spark plug (Fig. 6).
MAPO knock index [17] is position sensitive: the index distribution at spark plug location is analyzed and depicted
in Fig. 10. MS configuration showed higher level of MAPO all over the MFB50 distribution. The variability of MAPO
with respect to sensor position not only doesn’t allow defining absolute thresholds, but can condition the choice of the
best configuration in a fictitious way. The amount of mass burned in autoignition condition during knock can be used
as a robust tool to numerically identify the risk of damage. Fig. 11 shows that the MS configuration has an higher
knock tendency than TS with the same combustion phase (i.e. MFB50).

904 Claudio Forte et al. / Energy Procedia 81 ( 2015 ) 897 – 906
0 5 10 150
1
2
3
4
5
6
7
8
9
10
MFB50
MA
PO
Spa
rk S
enso
r [b
ar]
Distribution of MAPO @ Spark Plug location
TWIN SPARKMONO SPARK
Fig. 10. MAPO at spark plug versus MFB50
0 5 10 150
5
10
15
MFB50
Mas
s kn
ocke
d [%
]
Distribution of MAPO @ Spark Plug location
TWIN SPARKMONO SPARK
Fig. 11. Distribution of Mass Knocked with respect to MFB50
The distribution of pressure wave all over the combustion chamber is summarized in Fig. 12(a) and Fig. 12(b),
where is plotted the distribution of MAPO on piston surface for the most severe cases of both MS and TS configuration.
It is noteworthy the spatial variation of MAPO with a fixed knock event. The TS configuration has higher MAPO
values near the side sensor location, but the most severe locations are in the intake squish for both MS and TS. The
central spark location is characterized by low MAPO level.
TWIN SPARK - MAPO distribution
Spark SensLateral Sens
Lateral Spark
0
5
10
15
20
25
30
MA
PO
[bar]
(a)
MONO SPARK - MAPO distribution
Spark SensLateral Sens
Lateral Spark
0
5
10
15
20
25
30
MA
PO
[bar]
(b)
Fig. 12. Piston map of MAPO values: (a) Twin Spark configuration; (b) Mono Spark configuration
Fig. 13(a) and Fig. 13(b) show the evolution of the flame front and the formation of knocking volume (blue color).
The MS location of knock are in the exhaust side, while in the TS condtion a big part of knocked mass is near the
sensor plug location. The evolution of combustion of the TS configuration is not axis-simmetric, thus leaving the
sensor zone as the late fresh mixture combustion location, here increasing the probability of knock.
It is interesting to analyzed the frequency content of the pressure traces at central and side locations for both MS
and TS. Fig. 15(a) and Fig. 15(b) show the FFT of the pressure signal at central spark plug location, and it is clear
the excitation of the radial resonance frequency of the chamber (i.e. 10500Hz). The MS configuration has an higher
level of amplitude content because of the more simmetrical excitation of knocking events, thus justifying the higher

Claudio Forte et al. / Energy Procedia 81 ( 2015 ) 897 – 906 905
(a) (b)
Fig. 13. Flame front evolution: (a) Twin Spark configuration; (b) Mono Spark configuration
value of MAPO at central spark location. The tangential modes are not here intercepted because the center location is
a nodal point of resonance.
Fig. 14. Resonance frequency of the combustion cham-
ber
0 0.5 1 1.5 2 2.5
x 104
0
0.2
0.4
0.6
0.8
1
1.2Mono Spark − FFT Spark Sensor location
Mean cyclesKnocking cycles
(a)
0 0.5 1 1.5 2 2.5
x 104
0
0.2
0.4
0.6
0.8
1
1.2Twin Spark − FFT Spark Sensor location
Mean cyclesKnocking cycles
(b)
Fig. 15. Fourier Fast Transform of pressure signal at Spark location: (a) Mono Spark ;
(b) Twin Spark
Fig. 17(a) and Fig. 17(b), show the FFT at side sensor location: in this case the tangential resonance frequancy are
excited by knock events. The TS configuration has an higher level of the first resonance frequency because of the not
simmetric evolution of the combustion.
6. Conclusion
A Ducati high performance engine equipped with a Twin Spark ignition system was evaluated at full load condition.
The experimental analysis of pressure traces revealed a combustion efficiency improvement of the TS configuration,
but an higher level of knock MAPO indexes.
A numerical methodology for the analysis of combustion and knock on a cycle by cycle basis is implemented and a
more deep insight in the abnormal combustion is accomplished.The TS configuration showed higher level of MAPO at
side sensor location, but the condition reversed when using the central spark plug sensor. The analysis of the pressure

906 Claudio Forte et al. / Energy Procedia 81 ( 2015 ) 897 – 906
Fig. 16. Resonance frequency of the combustion cham-
ber
0 0.5 1 1.5 2 2.5
x 104
0
0.2
0.4
0.6
0.8
1
1.2
Frequency
Am
plitu
de
Mono Spark − FFT Side Sensor location
Mean cyclesKnocking cycles
(a)
0 0.5 1 1.5 2 2.5
x 104
0
0.2
0.4
0.6
0.8
1
1.2
Frequency
Am
plitu
de
Twin Spark − FFT Side Sensor location
Mean cyclesKnocking cycles
(b)
Fig. 17. Fourier Fast Trasnform of pressure signal at side sensor location: (a) Mono
Spark ; (b) Twin Spark
traces all over the combustion chamber allowed defining the main characteristics of knocking of the engine. The
TS combustion evolution was found not axis-symmetric, thus the autoignition zone activated primarly the tangential
natural frequencies of the chamber then the radial ones. The MS configuration had a similar level of knocking risk if
measured by means of total amount of mass burned in autoignition condition. The numerical methodology proved to
be an usefull tool in the interpretation of engine behavior, and can be considered a start of point for the definition of
knock indexes not sensible to specific installations and based on damage risk.
References
[1] Bozza, F., Gimelli, A., Siano, D., Torella, E., Mastrangelo, G.. A quasi-dimensional three-zone model for performance and combustion
noise evaluation of a twin-spark high-egr engine. SAE International 2004;doi:10.4271/2004-01-0619.
[2] Cavina, N., Corti, E., Poggio, L., Zecchetti, D.. Development of a multi-spark ignition system for reducing fuel consumption and exhaust
emissions of a high performance gdi engine. SAE Paper 2011-01-1419 2011;doi:10.4271/2011-01-1419.
[3] Kim, K.S., Ghandhi, J.. A simple model of cyclic variation. SAE International 2012;doi:10.4271/2012-32-0003.
[4] Tatschl, R., Bogensperger, M., Pavlovic, Z., Priesching, P., Schuemie, H., Vitek, O., et al. Les simulation of flame propagation in a
direct-injection si-engine to identify the causes of cycle-to-cycle combustion variations. SAE International 2013;doi:10.4271/2013-01-1084.
[5] Vitek, O., Macek, J., Tatschl, R., Pavlovic, Z.. Les simulation of direct injection si-engine in-cylinder flow. AE Technical Paper 2012-01-0138
2012;doi::10.4271/2012-01-0138.
[6] Forte, C., Bianchi, G.M., Corti, E., Fantoni, S.. Combined experimental and numerical analysis of the influence of air-to-fuel ratio on cyclic
variation of high performance engines. ASME(ICEF 2008-1668) 2008;.
[7] Forte C.and Bianchi, G., Corti, E., Fantoni, S., Costa, M.. Cfd methodology for the evaluation of knock of a pfi twin spark engine. Energy
Procedia, 45, pp 859-868 2014;.
[8] Forte, C., Bianchi, G., Corti, E., Falfari, S., Fantoni, S.. Rans cfd 3d methodology for the evaluation of the effects of cycle by cycle variation
on knock tendency of a high performance spark ignition engine. SAE PAPER -2014-01-1223 2014;.
[9] Corti, E., Forte, C.. Statistical analysis of indicating parameters for knock detection purposes. SAE International - SAE 2009-01-0237
2009;doi:10.4271/2009-01-0237.
[10] Corti, E., Forte, C.. A statistical approach to spark advance mapping. Journal of Engineering for Gas Turbines and Power 2010;132(8). Cited
By (since 1996):6.
[11] Corti, E., Forte, C.. Spark advance real-time optimization based on combustion analysis. Journal of Engineering for Gas Turbines and Power
2011;133(9). Cited By (since 1996):2.
[12] Forte, C., Bianchi, G.M., Corti, E.. Multicycle simulation of the mixture formation process of a pfi gasoline engine. SAE Paper 2011-01-2463
2012;doi:10.4271/2011-01-2463.
[13] Forte, C., Corti, E., Bianchi, G.M.. Combined experimental and numerical analysis of knock in spark ignition engines. ASME ICEF09-14102
2010;:473–488.
[14] F.-A. Lafossas M. Castagne, J.P.D., Henriot, S.. Development and validation of a knock model in spark ignition engines using a cfd code.
SAE Paper 2002-01-2701 2002;.
[15] Forte, C., Bianchi, G.M., Corti, E.. Validation of a lagrangian ignition model in si engine simulations. ASME ICEF2010-35159 2010;:859–
871.
[16] Falfari, S., Bianchi, G.. Development of an ignition model for s.i. engine simulation. SAE Paper 2007-01-0148 2007;.
[17] Corti, E., Forte, C.. Combination of in-cylinder pressure signal analysis and cfd simulation for knock detection purposes. SAE Int J Engines
2009;2:368–380. doi:10.4271/2009-24-0019.