Evaluation of the Development and Performance of Selected GCC and Non-GCC Stock MarketsProject...
37
PhD and MIF Programmes Project Paper Evaluation of the Development and Performance of Selected GCC and Non-GCC Stock Markets Islamic Capital Markets FN 6603/5603 Professor Dr. Obiyathulla Ismath Bacha September 2013- Semester Group 3 Name Student ID Idwan Hakim 1000428 Mace Abdullah 1000491 Gamal Salih Omer 1200073 Ahmed Elobied 1200074 Zulfiqar Ali Khan 1200085
-
Upload
mace-abdullah -
Category
Business
-
view
248 -
download
1
Transcript of Evaluation of the Development and Performance of Selected GCC and Non-GCC Stock MarketsProject...

Page 1
PhD and MIF Programmes
Project Paper
Evaluation of the Development and Performance of Selected GCC and Non-GCC Stock Markets
Islamic Capital Markets
FN 6603/5603
Professor Dr. Obiyathulla Ismath Bacha
September 2013- Semester
Group 3
Name Student ID
Idwan Hakim 1000428
Mace Abdullah 1000491
Gamal Salih Omer 1200073
Ahmed Elobied 1200074
Zulfiqar Ali Khan 1200085

2
1.0 INTRODUCTION
Stock markets are considered essential to economic growth. This study takes a
comparative view of 10 emerging stock markets. Five (5) are located in Gulf Cooperation
Council (GCC) countries, while the remaining five (5) are in Non-GCC countries. The GCC
stock markets are: Qatar (Qatar Stock Exchange); United Arab Emirates (Dubai Financial
Market or DFM is one of three stock exchanges in the UAE, along with Abu Dhabi Securities
Exchange (ADX) and NASDAQ Dubai-set up to trade international stocks); Kuwait (Kuwait
Stock Exchange); Saudi Arabia (Saudi Arabia Stock Exchange) and Bahrain (Bahrain Stock
Exchange). The five (5) Non-GCC stock markets are: Luxembourg (Luxembourg Stock
Exchange), Norway (Oslo Stock Exchange), Belgium (Euronext Brussels), South Korea
(Korea Exchange) and Singapore (Singapore Exchange).
1.1 Motivation for Research
The GCC countries are predominantly Islamic countries with prevalent Islamic
financial systems. The NGCC countries are predominantly non-Islamic with prevalent
convention financial systems. There are theoretical differences between Islamic and
conventional financial systems. The GCC stock markets are expected to have conventional
aspects. Conversely, the NGCC stock markets are expected to contain equities that can be
deemed Shari’ah-compliant. Much is written about the qualitative and quantitative “screens”
placed on Shari’ah-compliant equities; primarily in the context of indices and mutual funds.
This study seeks to determine whether such “screens” have impacted the selected stock
markets sufficiently enough to cause distinctions that are significant.
1.2 Research Objectives
This study applies empirical methods to look at selected markets through the prism of
a number of stock market development indicators promulgated by the World Bank
(http://data.worldbank.org/indicator) and generally accepted by researchers in the area of
stock market development. The GCC and Non-GCC stock market data and results of
empirical tests are compared, contrasted, analyzed and interpreted to provide answers to the
research questions presented.
1.3 Research Questions
The following empirical questions are asked:
(1) Are there any significant difference between stock market development and performance
among and between GCC and Non-GCC countries? (2) What are the differences, if any?

3
(3) What are the implications of these differences on cost of capital, quality of returns,
competitiveness, attractiveness to foreign investors and the economy as whole? The test
hypotheses are:
H0: There are no significant difference between stock market development and performance
in GCC and Non-GCC countries.
H1: There are significant difference between stock market development and performance in
GCC and Non-GCC countries.
The rest of the paper is organized as follows: Section 2 is a literature review of equity
markets development and it linkages to financial development and macroeconomic
determinants. It is followed by Section 3, an explanation of the research methodology.
Section 4 is a discussion of empirical results including summary statistics of selected
indicators, the test of difference in means results, and the correlations between the stock
markets development indicators. The final part, Section 5, provides conclusions and policy
implications.
2.0 LITERATURE REVIEW
Modern stock markets play an important role in economic development.
Underdeveloped and inefficient stock markets deter investment, particularly foreign and
institutional investments, because they are illiquid, more costly and riskier, i.e. volatile.
Overly restrictive capital controls can further exacerbate foreign investors and inhibit
domestic investor class deepening. Domestic firm access to capital is often stymied causing
stunted growth; forcing them to seek capital in foreign markets. They are, therefore, generally
unattractive for cross-border listings (Bekaert and Harvey, 1997).
2.1 Financial Development Theory
Schumpeter (1934) is credited with hypothesizing that financial intermediation plays a
central role in financial development; thus economic growth. Financial development is
associated with economic growth in two ways (Patrick, 1966): (1) “demand-following” in
which the “real” sector leads financial development as the “real” economy grows; and (2)
“supply-leading” where the “financial” sector is developed (e.g. intermediation) first;
stimulating demand for its supply of funds and services to the “real” sector. Patrick (1966)
proposed the “stage of development hypothesis,” wherein the two growth “paths” to financial
development may intersect with one “path” initially being dominant and later subsiding as the
other becomes more influential.

4
2.2 Financial Development Structure
Financial development can also be viewed from the perspective of financial structure.
Working through the World Bank, Demirguc-Kunt (1999), revived the polemics surrounding
bank and market based financial structures. A financial system is divided between banks (and
“shadow” banks, e.g. insurance companies) and markets (debt and equity).
For our purposes, it is the market-based equities market that is our focus, as it posits
that economic development is advanced through well-functioning markets. Larger, liquid and
well functioning market-based structures foster real economic growth, provide greater profit
incentives to a broader spectrum of the economy’s entrepreneurs and firms, enhance
corporate governance and facilitate risk management (Beck, 2002). The “financial services”
view (Levine, 1997), embraces both divisions and postulates that it is “financial services”
themselves that are more important than the channel of delivery. Thus, the “analytic
spotlight” is on how to provide better intermediation channels in whatever mix or structure.
2.3 Equity Market Development
Market-based structures provide a broader, possibly more fluid, channel for long-term
financial development. Stock markets encourage specialization, as well as acquisition and
dissemination of information (Diamond 1984; Greenwood and Jovanovic 1990). They may
also reduce the cost of mobilizing savings, thus facilitating investment (Greenwood and
Smith 1997). Well-developed stock markets mitigate the principal-agent problem, aligning
the interests of managers and owners, through maximization of firm value (Diamond and
Verrecchia 1982; Jensen and Murphy 1990). Levine (1991) and Bencivenga et al (1996) aver
stock markets ameliorate risk by allowing savers to buy, sell and quickly and cheaply alter
their portfolios. Moreover, firms enjoy easy access to capital through equity issues.
King and Levine (1993) further discuss the importance of stock markets in allowing
firms to be innovative in their capital structures. Hence, as firms mature, stock markets allow
them to transfer ownership interests to an entirely different class of investors through initial
public offerings, mergers and innovative capital structure transactions. This would be
difficult, at best, without stock markets. Risk mitigation and easy access to a broader
spectrum of capital providers improve the allocation of capital, an important function of
economic growth. More savings and investment enhance long-term economic growth. From a
monetary policy prospective, a well-developed stock market provides a channel for the issue
and repurchase of government securities, thus facilitating liquidity in the bank-based financial
structure. This is important to financial liberalization and alters the pattern of demand for
money.

5
2.4 Stock Market Development Indicators
As noted earlier, the World Bank has developed a database of indicators; some of
which are specific to stock markets. Research conducted by the International Monetary Fund
(IMF) mirrors that of the World Bank, identifying direct quantitative stock market
development key indicators: (1) number of listed companies; (2) market capitalization as a
percentage of GDP; (3) value traded as percentage of GDP; and (4) turnover (Yartley, 2008).
That study also identified qualitative indicators: (1) political risk; (2) law and order (quality
of legal system); (3) bureaucratic quality; (4) democratic accountability; and (5) corruption.
Research emphasizing the growing importance of regional and global financial integration
and the need for expanding investor bases and classes, identifies additional indicators: (1)
capital controls, e.g. taxes, information asymmetry and regulatory restrictions; and (2) pricing
models (Levine and Zervos, 1996).
2.5 Financial Integration and Cost of Capital
Co-movements in global stock markets have been shown to be correlated within lead
and lag time frames (e.g., Kasa, 1992; Siklos and Ng, 2001; Masih and Masih, 1999;
Glezakos et al., 2007). The correlation is strongest where capital control barriers are lowered
(Taylor and Tonks, 1989). Financial integration affects the cost of equity capital of firms,
improves competitiveness and often leads to more precise price discovery. Where barriers to
international investment exist, stock markets are segregated from each other and investors in
each country must bear all the risk of the economic activities of that country. A risk premium
is required to bear the risk that is specific to that country. If a specific country’s stock market
is perceived as illiquid and risky, the risk premium raises the cost of capital for its investors.
That premium is termed the beta coefficient under the capital asset pricing model (CAPM).
Changes in a firm’s cost of capital impact its valuation and its earnings forecast, both
of which influence the listing decision. This is the conclusion of Hail and Leuz (2006), who
find that cross listing in the U.S. stock market, reduces the cost of capital by 70 to 110 basis
points. If a country liberalizes its stock market, allowing foreign investors to invest therein
and domestic investors to invest abroad, research suggests that cost of capital is reduced in
some instances where domestic and foreign risks offset the other through diversification. Risk
is reduced because the portfolios pay a lower related risk premium. This generally reduces
cost of capital in a portfolio of risky securities (Shultz, 1999).

6
2.6 Financial Integration and Investor Base
Shultz further posited that financial integration brings benefits to emerging markets,
including: (1) new shareholders in a firm who possess skills and information that enables
them to monitor management differently from existing local investors; (2) transforming the
relationship between a firm and its shareholders by increasing the competition among
“suppliers” of capital, thereby reducing the cost of capital due to improved competition and
lower transaction costs; (3) transforms the market for corporate control because a firm that is
large in its local market and safe from takeovers in a closed local market is not safe in an
open market, thereby improving the monitoring of managers by existing and potential
shareholders; (4) gives firms access to financial technology that can enable them to raise
capital using new securities and to manage risks more effectively and (5) often attracting
large capital providers, e.g. institutional investors. Among Asian nations, for example, the
growth of institutional investors has resulted in a relatively new, large and lucrative investor
base. In well developed markets, this investor base approaches half of the total investors
(Purfield et al, 2006).
Finally, certain firms and industries are more externally finance dependent than
others. This dependence is ameliorated when capital needs are pursued in more developed
markets. Thus, equity markets have been found to serve as incentive for cross-border listings
among those firms (Rajan and Zingales, 1998).
2.7 Financial Integration and Improved Competitiveness
Zingales (2006) identifies several indicators and determinants of an equity market’s
competitiveness: (1) the number of initial public offerings (IPO) and (2) the ability to attract
foreign listings. The latter he explains is linked to the persistent status of an economy’s
current account and the regulatory environment in the economy. Moreover, he identifies
determinants of the above indicators as: (1) liquidity within the market; (2) visibility by the
financial services sector; (3) bonding with firms from similar industries, country, etc.; (4)
better valuation linked to a more developed financial sector; (5) product/labor market
spillovers (which may be related to strategies to manufacture within the economy of the
listing; (6) listing costs; (7) disclosure costs; and (8) exposure to liability (primarily class
action corporate and security law violations).
Research conducted at the Wharton School in the University of Pennsylvania posits
that illiquid markets affect information symmetry. This phenomenon does not exist in a
perfectly competitive market (because it is assumed that all investors are price takers and all
information is symmetric). Perfect competition exists in a market where there is: (1) low

7
entry and exit barriers; (2) homogeneity of securities, i.e. buyers can purchase a given
security from any seller and receive the same security; (3) perfect knowledge about securities
as to quality, price, and cost; and (4) no single buyer or seller large enough to influence the
market price. Hence, it is posited that competition, informational risk and cost of capital are
cointegrated (Lambert et al, 2010).
3.0 RESEARCH METHODOLOGY
3.1 Research Method
In order to investigate the possible existence of a differences between the
development and performance of the GCC and Non-GCC stock markets, pair sampled t-tests
are conducted on pairs of data consisting of market development indicators. The test is the
mean difference t-test using the standard error of the two samples i.e. pairs of countries
matched according to GDP per capita, within each group (GCC and Non-GCC) and between
the two groups. In order to test the first objective, parametric paired sample t-tests are
conducted using market size and market depth indicators. The second objective of comparing
between the GCC and Non-GCC groups, we use Sharpe and Treynor ratios for comparative
purposes. The average 3-month U.S. Treasury Bill rate and average S&P 500 annual returns
are used as benchmarks, in order to measure the performance of each stock market and to
compare it with others. Moreover, we use correlation testing as a proxy for the level of
financial integration within each group, between the groupings and with the international
market (using S&P 500 returns as a proxy for worldwide market returns).
3.2 Data
This paper focuses on the analyses of development and performance in selected stock
markets. Our main interest is to identify differences between the stock markets selected from
the GCC vis-à-vis the Non-GCC stock markets grouping (East Asia and Europe); in order to
draw conclusions as to the level of differences. We conduct panel analyses on pooled data
from the 10 selected stock markets from 2003 to 2012. The stock markets were selected
because of data availability and paired in an inter-group matching according to GDP per
capita. We gathered the data from two sources: the World Bank Database and DataStream.
All data are on annual bases except the data for market index which is on a weekly base.
3.3 Definition of Variables
Market Size. Three measures are used to determine the market size: (1) Total Market
Capitalization, (2) Total Market Capitalization to GDP, and (3) Number of Listed
Companies. Total Market Capitalization is the value of listed shares. Total Market
Capitalization to GDP Ratio is the value of listed shares divided by GDP. This measure

8
assumes that overall market size is positively correlated with the ability to mobilize capital
and diversify risk on an economy-wide basis. Number of Listed Companies proxies the
ability to mobilize capital through attracting cross-border listings.
Market Depth. Market depth is an indicator of liquidity or the ability to buy and sell
shares quickly. Three indicators of market size are used: (1) Total Volume Traded, (2) Total
Volume Traded to GDP and (3) Trading Velocity. Total Volume Traded is the value of shares
traded on the stock market exchange(s). Total Volume Traded to GDP is the total value of
shares traded on the stock market exchange divided by GDP. This ratio measures the
organized trading of firm equity as a share of national output and therefore should proxy
liquidity on an economy-wide basis. It complements the market capitalization ratio, although
as we will show, some markets may be large, but trading may be anemic.
Trading Velocity is the value of total shares traded divided by market capitalization.
Though it is not a direct measure of theoretical definitions of liquidity, high velocity is often
used as an indicator of low transaction costs. See Lambert et al (2010). This ratio
complements the market capitalization ratio and can be used to identify larger, albeit inactive
markets with inordinately low velocity. It also complements the total volume traded ratio.
While the total volume traded ratio captures trading relative to the size of the economy,
velocity measures trading relative to the size of the stock market. A small liquid market may
have a high velocity ratio but a small total volume traded ratio.
Market's Returns and Volatility. We have used the percentage change in indices to
measure the equity market returns and the standard deviation of market returns to measure the
volatility of returns.
4.0 EMPIRICAL RESULTS
In order to facilitate the analysis, this section is divided into four (4) parts: market
size, market depth, market index returns and volatility and portfolio management. In order to
meet constraints placed on this paper, only three (3) Tables are presented in the body of the
paper, namely: Table 1, the test of stock market and grouping means; Table 2, performance
evaluation; and Table 3, the correlation within and between groupings. All other tables and
figures referenced in the body of this paper are included in the Appendices A-D.
4.1 Market Size
Figure 1 shows the development changes in the 3 market size indicators during the
period from 2003 to 2012. Table A1 show the total market capitalization during the period
decreased for GCC and Non-GCC stock markets by 33.39% and 6.33 % respectively. The

9
largest decreases are 61.40% for Kuwait and 94.88% for Singapore. The capitalization ratio
increased for GCC and Non-GCC stock markets by 147.82% and 156.34% respectively. The
large growth of the capitalization ratio for GCC stock markets coincided with an increase of
the number of listed companies. Non-GCC listings, by contrast, both increased and decreased
during the test period. The number of listed companies grew during the test period by 99.25%
and 1.64% for GCC and Non-GCC stock markets respectively.
Notably, GCC equity markets are more thinly capitalized than the Non-GCC markets.
The 2012 total market capitalization for GCC countries was smaller than the Non-GCC a
decade ago. This is not atypical of emerging markets. The number of listed firms is also
significantly larger for the Non-GCC countries; about five times more than the listed firms in
the GCC countries. This can be interpreted to possibly mean that the Non-GCC stock markets
continue to attract foreign investors and cross-border listings. There may be lingering
qualitative issues that better account for the discrepancies, e.g. lack of openness, the strength
of the legal system, etc. Additionally, depending on the underlying real economies, some
stock markets may be reacting to real economy demand; lagging in the development of their
financial sector. Each economy’s stage of development may reveal some indication of the
direction of the needed corrective action. All GCC stock markets are nascent. The same
cannot be said of all of the Non-GCC markets. Among the GCC markets, Saudi Arabia is the
largest; accounting for nearly half of market capitalization. Among the Non-GCC markets, S.
Korea has the largest capitalization; although Singapore has the largest number of listed
companies. These facts may indicate that Saudi Arabia’s huge petrochemical industry sector
is now demand-leading its financial sector; notwithstanding the findings of Masih et al
(2009). S. Korea’s capitalization may also be similarly the result of demand for capital as its
technology and manufacturing sectors have mushroomed on the backs of multi-nationals, e.g.
Samsung and Hyundai.
Tables A2, A3 and A4 provide descriptive statistics for the three indicators of the
market size during the period 2003-2012 for the selected sample. These tables indicated that
there are differences in means, medians and the standard deviations among GCC and Non-
GCC stock markets. The market size as represented by the three indicators shows that the
group of GCC stock markets has lower size compared with the group of Non-GCC markets.
In order to determine the significance of these differences we conducted a difference in mean
tests.
Table A5 shows the results of the test of the difference in mean for market size
indicators between pairs of stock markets, i.e. a GCC and a Non-GCC stock market matched

10
according to GDP per capita. We find that for total market capitalization there is a significant
difference in means for all pairs of countries at 5% level of significance except the pair of
Qatar and Luxembourg for which we fail to reject the null hypothesis at any level of
significance exists. This makes sense, as these two economies have vied for the No. 1 ranking
in the world for the economy with the highest per capita GDP over a portion of the test
period.
Regarding the total market capitalization to GDP ratio, we find that there is a
significant difference in means for all pairs of countries at 5% level of significance, except
the pair of Saudi Arabia and South Korea for which we fail to reject the null hypothesis at
any level of significance. Again, this makes sense, since both economies are, as noted above,
likely on a demand-leading economic development path. Both economies have substantial
“anchor” industries with multi-national clout. Both also have financial sectors “in the
making.” The test for the number of listed companies shows there is a significant difference
in means for the pairs (UAE/ Norway, Saudi Arabia/ South Korea and Bahrain/Singapore) at
5% level of significance while for the pairs (Qatar/Luxembourg and Kuwait, Belgium) we
fail to reject the null hypothesis at any level of significance.
Tables A6 and A7 show the results of the test of the difference in mean for market
size indicators within each group of countries i.e. the GCC group and the Non-GCC group.
We find that for total market capitalization there is a significant difference in means for all
GCC countries at 5% and 10% level of significance except as between Qatar and UAE for
which we fail to reject the null hypothesis at any level of significance. This may be due to the
fact that these economies are not so far removed from being “joined at the hip,” so to speak;
as they had the same currency and monetary authority not so long ago. Within Non-GCC
group there is a significant difference in means for all stock markets at 5% level of
significance except as between Belgium and Singapore for which we fail to reject the null
hypothesis at any level of significance.
With regard to the total market capitalization to GDP ratio, we find that there is only a
significant difference in means between UAE and all other GCC countries at 5% level of
significance. On the other hand within the Non-GCC group we find that there is a significant
difference in means among all stock markets at 5% level of significance except as between
Luxembourg/Singapore and Norway/ Belgium for which we fail to reject the null hypothesis at
any level of significance.
The test for the number of listed companies shows there is a significant difference in
means for all pairs within GCC and Non-GCC groups at 5% and 10% level of significance

11
except for the pair Norway/Belgium we fail to reject the null hypothesis at any level of
significance. The test for the differences in means for market size indicators between the two
groups of countries as shown in Table 1 indicates that there is a significant difference at 5%
market capitalization (USD Billions) and number of listed companies and at 10% for market
capitalization (% of GDP).
Table 1: Test of the difference in mean between GCC and Non-GCC countries
Market Development Indicator Mean
(GCC)
Mean
(Non-GCC)
Difference
in Mean
P value
Market Size
Market Capitalization (USD Billions) 130.00 335.00 -210.00 *0.000
Market Capitalization (% of GDP) 92.35 113.96 -21.61 **0.072
Number of Listed Companies 90 526 -436 *0.000
Market Depth
Trading Velocity 67.74 87.50 -19.76 0.115
Total
Volume Traded (USD Billions) 145.00 397.00 -250.00
*0.000
Total Volume Traded (% of GDP) 58.12 75.43 -17.31 0.187
Market Returns and Volatility Percentage market index returns 4.03 7.78 -3.75 0.704 Volatility of market returns 22.85 45.12 -22.27 **0.063
*Significant at 5% . **Significant at 10% .
4.2 Market Depth
Figure 2 shows, the development in market depth indicators for the selected GCC and
Non-GCC countries during the period 2003-2012. These indicators include total volume
traded in billions of USD, the volume traded to GDP and the trading velocity. We examine
the trading velocity in order to better understand liquidity. This ratio is defined as the ratio of
the value of total shares traded to the market capitalization. It measures the activity of the
stock market relative to its size. Many analysts use this ratio as gauge of expected transaction
costs. High velocity ratio implies low transaction and consequently more efficient pricing.
Table B1 indicates that although the absolute total volume traded increased by
136.68% and 115.8% for GCC and Non-GCC stock markets respectively, the relative volume
traded to GDP decreased by 29.69% and 1.35%. This may be due to a larger growth in GDP
relative to growth in trading volume in both groups. The table also shows that the trading
velocity ratio also decreased among the groups by 18.85% for GCC markets and 25.28% for
the Non-GCC, respectively. This is due to the larger relative increases in market
capitalization as compared with that for volume traded.
Among Non-GCC markets, Korea has the deepest. Total volume traded is USD1.5
trillion; almost 10 times that of Singapore. The volume traded is almost 150% of its GDP.
12
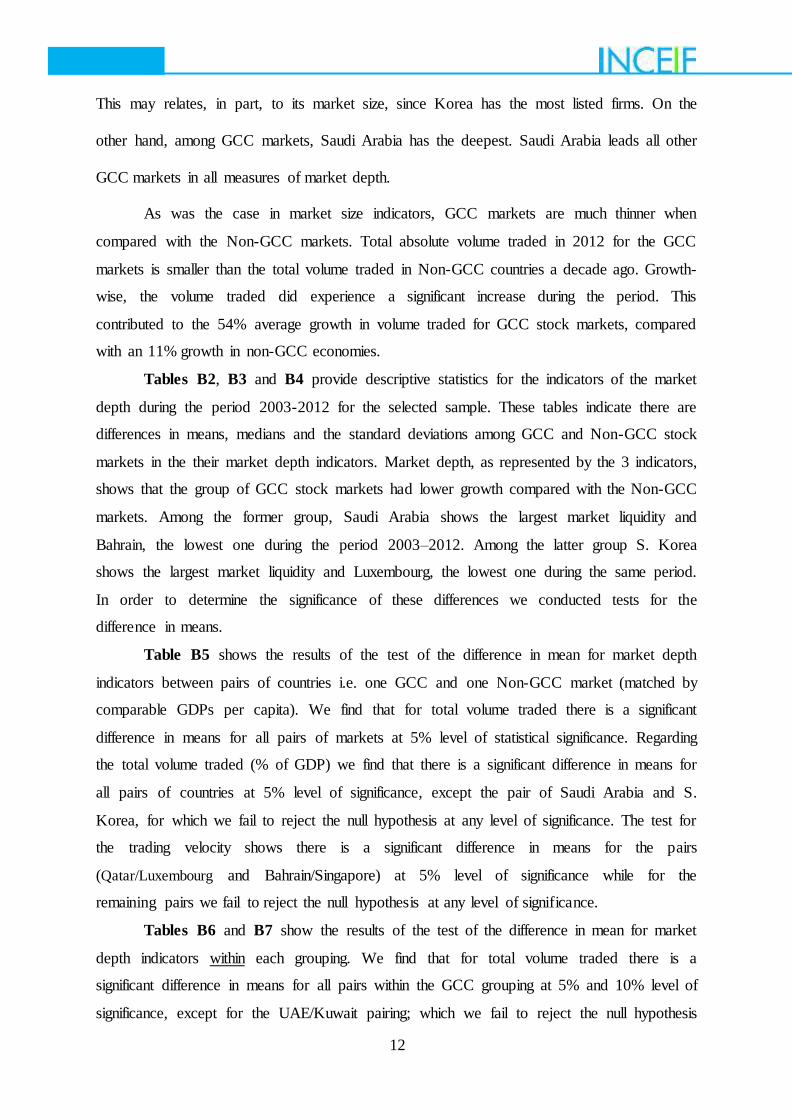
This may relates, in part, to its market size, since Korea has the most listed firms. On the
other hand, among GCC markets, Saudi Arabia has the deepest. Saudi Arabia leads all other
GCC markets in all measures of market depth.
As was the case in market size indicators, GCC markets are much thinner when
compared with the Non-GCC markets. Total absolute volume traded in 2012 for the GCC
markets is smaller than the total volume traded in Non-GCC countries a decade ago. Growth-
wise, the volume traded did experience a significant increase during the period. This
contributed to the 54% average growth in volume traded for GCC stock markets, compared
with an 11% growth in non-GCC economies.
Tables B2, B3 and B4 provide descriptive statistics for the indicators of the market
depth during the period 2003-2012 for the selected sample. These tables indicate there are
differences in means, medians and the standard deviations among GCC and Non-GCC stock
markets in the their market depth indicators. Market depth, as represented by the 3 indicators,
shows that the group of GCC stock markets had lower growth compared with the Non-GCC
markets. Among the former group, Saudi Arabia shows the largest market liquidity and
Bahrain, the lowest one during the period 2003–2012. Among the latter group S. Korea
shows the largest market liquidity and Luxembourg, the lowest one during the same period.
In order to determine the significance of these differences we conducted tests for the
difference in means.
Table B5 shows the results of the test of the difference in mean for market depth
indicators between pairs of countries i.e. one GCC and one Non-GCC market (matched by
comparable GDPs per capita). We find that for total volume traded there is a significant
difference in means for all pairs of markets at 5% level of statistical significance. Regarding
the total volume traded (% of GDP) we find that there is a significant difference in means for
all pairs of countries at 5% level of significance, except the pair of Saudi Arabia and S.
Korea, for which we fail to reject the null hypothesis at any level of significance. The test for
the trading velocity shows there is a significant difference in means for the pairs
(Qatar/Luxembourg and Bahrain/Singapore) at 5% level of significance while for the
remaining pairs we fail to reject the null hypothesis at any level of significance.
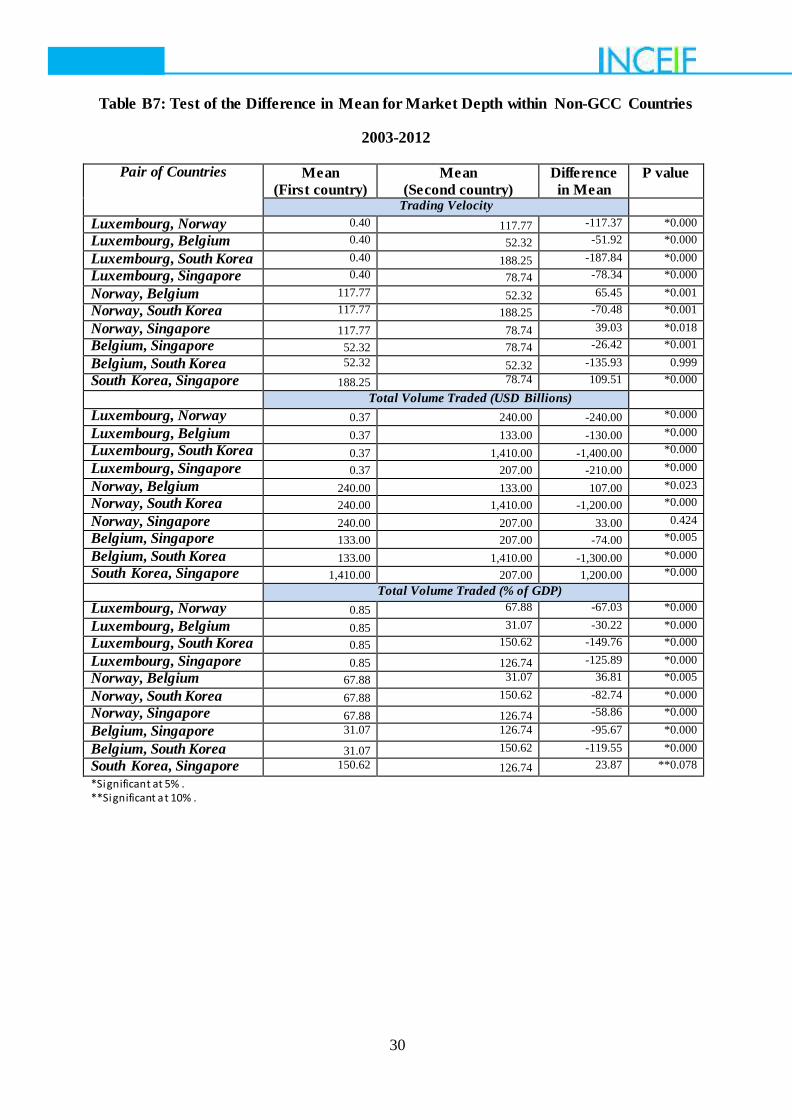
Tables B6 and B7 show the results of the test of the difference in mean for market
depth indicators within each grouping. We find that for total volume traded there is a
significant difference in means for all pairs within the GCC grouping at 5% and 10% level of
significance, except for the UAE/Kuwait pairing; which we fail to reject the null hypothesis

13
at any level of statistical significance. Within Non-GCC grouping there is a significant
difference in means for all pairs at 5% level of significance, except the pair of
Norway/Singapore; which we fail to reject the null hypothesis at any level of significance.
With regard to the total volume traded (% of GDP) we find that there is a significant
difference in means for all pairs within GCC group at 5% and 10% levels of significance,
except the pair Qatar/UAE for which we fail to reject the null hypothesis at any level of
significance.
On the other hand within the Non-GCC group we find that there is a significant
difference in means among all pairs at 5% and 10% level of significance. The test for the
trading velocity shows there is a significant difference in means for all pairs within both GCC
and Non-GCC groupings at 5% level of significance, except for the pairs UAE/Kuwait and
Belgium/S. Korea; which we fail to reject the null hypothesis at any level of significance.
The test for the differences in means for market depth indicators between the two groups, as
shown in Table 1, indicates that there is a significant difference at 5% for the total volume
traded indicator; while for other indicators the differences are insignificant.
4.3 Market Returns and Volatility
During the past decade, many of the emerging countries tried to achieve higher
growth performance through improvements and reforms in their financial sectors. Figure 3
shows the changes in the weekly market indices during the 2007-2012 period. Table C1
shows the market returns and its volatility for the GCC and Non-GCC groups of markets in
panels A and B, respectively.
Table C2 shows the corresponding descriptive statistics. The returns for GCC stock
markets increased by 31.98% during the period, while it decreased by 4.05 % for the Non-
GCC group. Among the GCC group of markets, Bahrain witnessed the smallest returns
(0.65%) and smallest market risk (19.75%); while UAE recorded the largest returns (5.51)
and largest risk (34.73%). Among Non-GCC markets, Belgium experienced the lowest
returns with 0.75%; while the highest returns were observed in the Singapore stock market
with 12.66%. Norway’s stock market shows the highest return volatility at 51.97%; while
Belgium experienced the lowest return volatility at 41.49%.
Table C3 shows the results of the test of the difference in mean for market indexed
returns and their volatility between paired markets, i.e. one GCC and one Non-GCC; matched
according to GDP per capita. We find that the difference in means for all paired markets for
percentage returns there are insignificant. Regarding the volatility of returns (Std. Dev.) we
find that there is a significant difference in means for the pair of Qatar/Luxembourg at 10%

14
level of significance and the pair of Bahrain/Singapore at 5% level of significance while for
the remaining pairs we fail to reject the null. Again, the parity between Qatar/Luxembourg is
understandable, given the similarities in their underlying economic strength; notwithstanding
Qatar’s formidable natural resources. The parity between Bahrain and Singapore may also be
linked to their underlying economies, albeit both economies have developed financial sectors
among their respective groupings.
Tables C4 and C5 show the results of the test of the difference in mean for market
indexed returns and the volatility within each group of countries. We find that for market
index returns there are insignificant differences in means for all pairs within both groups; and
accordingly, we fail to reject the null hypothesis at any level of statistical significance. With
regard to the volatility of returns, we find that there is a significant difference in means for
three pairs within GCC group, i.e.: UAE/Bahrain and Saudi Arabia/Bahrain at 5% and 10%
levels of significance, and except the pair Qatar/U.A.E for which we fail to reject the null
hypothesis at any level of significance. Within the Non-GCC group we find that there are
insignificant differences in means among all pairs, and accordingly, we fail to reject the null
at any level of statistical significance.
The test for the differences in means for market index returns and its volatility between the
two groups of countries as shown in Table 1 indicates that there is a significant difference at
10% for the volatility of returns while for market index returns the differences is
insignificant.
4.4 Portfolio Management
Research postulates that in developed open markets, portfolio investment across
national borders brings benefits of increasing returns and/or reducing risk. See, for example,
Taylor and Tonks, op. cit. The sampled stock markets has been divided into two main groups
GCC and Non-GCC in order to determine the potential role of each group in providing
diversification benefits to international investors. Table 2 provides the performance
evaluation of the selected equity markets by comparing their average returns with the average
returns of S&P500 as an international benchmark during the 2007-2012 test periods.
It indicates that the GCC group has lower incremental returns equaling 1.58%, with a
lower associated risk (22.85%). The Non-GCC group has higher incremental returns equaling
5.33%, with an associated higher risk (45.12%). Moreover, adjusting their returns for risk
using Shape and Treynor ratios indicates that the Non-GCC group has outperformed the GCC
group. The Sharpe ratios (which measure the excess returns factored by the related standard
deviations as volatility metric) were 0.17 and 0.15 for the Non-GCC and GCC stock market

15
groupings, respectively. The Treynor ratios (which measure the excess returns factored by the
beta as a metric of risk premium) also supports these findings. The Treynor ratios were 3.26
and 3.74 for the GCC and Non-GCC stock markets, respectively.
Comparing the performance within the GCC group, we find that UAE achieved the
best average annual returns, while Bahrain, the worst, during the test periods. Within Non-
GCC group, Singapore achieved the best average annual returns, while Belgium, the worst.
We further compared the performance between the paired markets, matched according to
comparable GDP per capita, and find that Qatar, Norway, Kuwait, South Korea and Singapore
had the best performance when compared with Luxembourg, UAE, Belgium, Saudi Arabia and
Bahrain respectively.
Table 2: Performance Evaluation of the Selected Equity Market
2007-2012
Equity Market Incremental
Returns
Sharpe
Ratio*
Treynor
Ratio* Average
Return
Volatility
Std. Dev. Beta
GCC countries:
4.03
22.85 1.05
1.58 0.15 3.26
Bahrain 0.65 19.76 0.91 -1.8 0.03 0.71
Qatar 4.9 26.64 1.23 2.45 0.18 3.98
Saudi Arabia 4.11 29.92 1.38 1.66 0.14 2.98
UAE 5.51 34.73 1.6 3.06 0.16 3.44
Kuwait 4.95 24.04 1.11 2.5 0.21 4.46
Non-GCC countries: 7.78 45.12 2.08 5.33 0.17 3.74
Belgium 0.75 41.5 1.91 -1.7 0.02 0.39
South Korea 12.09 41.51 1.91 9.64 0.29 6.33
Luxembourg 2.85 50.83 2.34 0.4 0.06 1.22
Norway 10.54 51.97 2.4 8.09 0.20 4.39
Singapore 12.66 44.79 2.07 10.21 0.28 6.12
* Sharpe and Treynor ratios use the averages of 3-month U.S. T-Bill rate at 0.6 and S&P 500 average returns of 2.45.
In an effort to measure financial integration between the selected stock markets and the
international stock markets, represented by S&P500, we test to determine which group of our
sample can be considered as a potential avenue for international portfolio diversification.
This, we believe, is a proxy for investor attractiveness. We test this metric by conducting a
correlation test for market returns between our sample markets and the S&P 500. Table 3
shows that there is a positive correlation among countries within each group, possibly due to
the underlying economic relationships. The table also shows that there is negative correlation
between GCC group and US stock markets which on average amounted to 0.53. Accordingly,
the GCC group can be considered as a potential avenue for international portfolio

16
diversification for investors. On the other hand, the table also shows that there is high
positive correlation between the Non-GCC group and the US markets, which equal to 0.90.
This indicates that on the whole, Non-GCC markets should be less attractive for
diversification purposes and portfolio management than their GCC counterpart.
Table 3: Correlation of Market Returns
2007-2012
U.A.E SING. S.A QAT. NOR. LUX. KUW. KOR. BELG. BAHR. GCC NON
GCC
US
UAE 1.00
SING. -0.20 1.00
S.A 0.91 -0.14 1.00
Q AT. 0.72 -0.42 0.87 1.00
NO R. -0.23 0.98 -0.12 -0.42 1.00
LUX. -0.32 0.95 -0.27 -0.57 0.96 1.00
KUW. 0.47 -0.46 0.43 0.66 -0.52 -0.49 1.00
S.KO R -0.33 0.98 -0.21 -0.44 0.98 0.94 -0.50 1.00
BELG. -0.13 0.94 -0.07 -0.36 0.92 0.83 -0.59 0.92 1.00
BAHR.
0.43 -0.70 0.30 0.54 -0.76 -0.68 0.92 -0.74 -0.80 1.00
GCC 0.88 -0.41 0.88 0.91 -0.44 -0.52 0.78 -0.49 -0.40 0.70 1.00
NO N- GCC
-0.25 0.99 -0.17 -0.46 0.99 0.96 -0.52 0.98 0.94 -0.75 -0.47 1.00
US -0.38 0.89 -0.23 -0.39 0.89 0.78 -0.58 0.93 0.94 -0.82 -0.53 0.90 1.00
5.0 Conclusions and Policy Implications
Using the results of our empirical testing, applicable financial development theory and
our intuitive interpretations as researchers, we make the following conclusions and
implications from the study conducted:
1. The GCC group’s market size indicators show that its stock markets could be as much
as a decade behind their Non-GCC counterparts in absolute terms. Even with notable growth
over the past decade, the absolute values of the GCC markets, on average, as of 2012, are less
than the corresponding values of the Non-GCC markets at the beginning of the test periods,
i.e. 2003. The implication, with possibly the notable exception of Saudi Arabia, is that GCC
financial sectors lag behind their real sector development. If this group hopes to develop
respectable equity markets and improve their competitiveness, their economies will need to
put the requisite resources into the development of those markets and possibly implement a
variety of capital flows and regulatory/legal reforms in an effort to attract listings/foreign
investors, mobilize capital and reduce perceived risk.

17
2. The market depth testing indicates that the GCC stock markets are relatively thinly
capitalized when compared to their Non-GCC counterparts. This has several significant
effects on financial development. Market depth facilitates liquidity. Liquidity, from a
developed stock market, not only provides a channel for liquidity to stock market investors,
but it also provides liquidity to the banking system and government. Though conventional
banks may not typically be heavily engaged in stock markets, Islamic banks may be more
inclined to do so if they take their profit/loss sharing obligations more seriously in the decade
to come. Equity-based markets, when deemed less volatile/risky, may serve as another
channel for monetary policy as noted by King and Levine (op cit). Moreover, high velocity is
often used as an indicator of the ability to lower transaction costs, including informational
costs and risk. The tests for the differences in means in market depth indicators between the
GCC and Non-GCC markets, indicates that among the 3 indicators, total volume traded
shows statistical significance. Again, this is an indication of the nascent state of development
of the GCC stock markets; and as noted herein above, efforts should be made to bring the
stock market development there “in line” with the development of their real sectors.
3. We conclude that in the area of returns and risks that the GCC metrics may support
investor anecdotal fears that these markets are riskier than their conventional counterparts.
There is a significant statistical difference at 10% between the 2 market groupings as to
volatility measures. This may well be ameliorated by their regulators implementing the
requisite capital flows and market regulation and legal system reforms. While returns
between the 2 groupings do not show statistically significant differences, holding returns
equal, while confronting investors with higher levels of risk, does not bid well for any capital
market. This directly impacts the quality of returns to existing and potential investors.
4. It is clear from the Sharpe and Treynor ratios that there is an investment advantage in
terms of riskiness and risk premiums that the conventional Non-GCC group holds at present.
However, given that returns themselves are fairly comparable, portfolio managers or
individual investors seeking to hedge their conventional equity positions might give ample
thought to the fact that the GCC grouping has a significant diversification advantage over
their Non-GCC counterparts. That is not to say that currency entanglements might dampen
that attractiveness, but the data does support the conclusion that GCC equity holdings have a
portfolio management, diversification advantage over their Non-GCC counterparts, since
correlation testing for market returns between the GCC group and the S&P 500 shows that
there is negative correlation of 0.53; while their Non-GCC counterparts have a positive
correlation of 0.90 with the international markets, as proxied by the S&P 500.

18
REFERENCES
Bekaert, Greet and Harvey, R. (1997). “Capital Markets: an Engine for Economic Growth,”
Cambridge, MA: National Bureau of Economic Research.
Beck, T. a. (2002). “Stock Markets, Banks and Growth: Panel Evidence,” Cambridge, MA:
National Bureau of Economic Research.
Bencivenga, Valerie R., Bruce D. Smith, and Ross M. Starr, “Equity Markets, Transactions
Costs, and Capital Accumulation: An Illustration,” World Bank Economic Review 10
(May 1996), 241-65.
Demirguc-Kunt, A. a. (1999). “Bank-based and Market-Based Financial Systems,”
Washington, DC: World Bank Policy Research Working Paper 2143.
Diamond, Douglas W. "Financial Intermediation and Delegated Monitoring," Review of
Economic Studies 51 (July 1984), 393-414.
Diamond, Douglas W., and R. E. Verrecchia, "Optimal Managerial Contracts and
Equilibrium Security Prices", Journal of Finance 37 (May 1982), 275-87
Glezakos, M., Merika, A., and Kaligosfiris, H. (2007), “Interdependence of Major World Stock Exchanges: How Is the Athens Stock Exchange Affected?” International
Research Journal of Finance and Economics, 7, 24-39.
Greenwood, Jeremy, and Boyan Jovanovic, "Financial Development, Growth, and the
Distribution of Income", Journal of Political Economy 98 (October 1990), 1076-1107
Greenwood, Jeremy, and Bruce Smith, "Financial Markets in Development and the
Development of Financial Markets", Journal of Economic Dynamics and Control 21
(January 1997), 145-82
Hail, Luzi and Christian Leuz, 2006, “Cost of Capital Effects of U.S. Cross-Listings,”
University of Chicago Working Paper.
Jensen, Michael C., and Kevin J. Murphy, "Performance Pay and Top Management
Incentives," Journal of Political Economy 98 (April 1990), 225-64
Kasa, K. (1992), “Common Stochastic Trends in International Stock Markets,” Journal of
Monetary Economics, 29, 95-124
King, R.G. and Levine R, (1993), “Financial Entrepreneurship and Growth,” Journal of
Monetary Economics, 32, 513-542
Lambert, R., C. Leuz, and R. Verrecchia, 2010, “Information Asymmetry, Information
Precision, and the Cost of Capital,” Working Paper, University of Pennsylvania.

19
Levine, Ross. "Stock Markets, Growth, and Tax Policy," Journal of Finance 46 (September
1991), 1445-65.
Levine, Ross. (1997). “Financial Development and Economic Growth: Views and Agenda,”
Journal of Economic Literature, 688-726.
Levine, Ross and Zervos, Sar (1996), “Stock Market Development and Long-Term Growth.”
The World Bank, Policy Research Paper 1582.
Masih, Mansur, Al-Elg, Ali and Madani, Haider (2009), “Causality between Financial
Development and Economic Growth: an Application of Vector Error Correction and
Variance Decomposition Methods to Saudi Arabia,” Applied Economics, 2009, 41,
1691–1699.
Masih, A.M.M. and Masih, R. (1999), “Are Asian Stock Market Fluctuations Due Mainly to Intra-Regional Contagion Effect? Evidence Based on Asian Emerging Stock
Markets,” Pacific Basin Finance Journal, 7, 251-82. OECD, (1992).”Technology and the Economy: the Key Relationships,” Organization for
Economic Cooperation and Development, Paris, 1992.
Patrick, H. (1966). “Financial Development and Economic Growth in Underdeveloped
Countries,” Economic Development and Cultural Change, Vol. 14, No. 2, 174-189.
Purfield, Catriona; Oura, Hiroko; Kramer, Charles and Jobst, Andreas (2006). “Asian Equity
Markets: Growth, Opportunities, and Challenges,” IMF Working Paper 6266.
Rajan, R.G., and L. Zingales (1998), “Financial Dependence and Growth,” American
Economic Review, 88(3), 559-586.
Schumpeter, J. (1934). “The Theory of Economic Development” (Trans. Redvers Opie).
Cambridge, MA: Harvard University Press.
Shultz, Rene M. (1999). “Globalization of Equity Markets and Cost of Capital.” National
Bureau of Economic Research, Working Paper 7021.
Siklos, P. and Ng, P. (2001), “Integration among Asia-Pacific and International Stock Markets: Common Stochastic Trends and Regime Shifts,” Pacific Economic Review,
6, 89-110.
Taylor, M.P. and Tonks, I. (1989), “The Internationalization of Stock Markets and the Abolition of UK Exchange Control,” The Review of Economics and Statistics, 71, 332-36
Yartley, C.A. (2008). “Determinants of Stock Market Development in Emerging Economies:
Is South Africa Different?” IMF Working Paper, WP/08/32

20
Zingales, Luigi. (2006). “Is the U.S. Equity Market Losing Its Competitive Edge?”
University of Chicago, National Bureau of Economic Research (NBER), & CEPR

21
APPENDICES
Appendix A: Market Size
Table A1: Market Size Indicators
2003–2012
Countries Number of Listed
Companies
Market Capitalization (% of
GDP)
Market Capitalization
(USD Billions)
2003
2012
Change
%
2003
2012
Change
%
2003
2012
Change
%
GCC Countries
53.6
106.8 99.25 86.96 53.57 -33.39 54.894 136.04 147.82
Bahrain 42 43 2.38 99.53
59.05 -40.47 0.97 16.1 1559.79
Qatar 29 42 44.83 113.46
73.14 -40.32 26.7
126 371.91
Saudi Arabia 70 158 125.71 73.31
52.51 -20.80 157
373 137.58
U.A.E. 30
102 240 24.42
20.46 -3.96 30.4 68 123.68
Kuwait 97
189 94.85 124.09
62.69 -61.40 59.4 97.1 63.47
Non-GCC
Countries 512.8 521.2 1.64
104.54 98.21 -6.33 173 443.46 156.34
Belgium 250 154 -38.40 55.68
62.03 6.35 174
300 72.41
S.Korea 1563 1767 13.05 51.20
104.50 53.30 330
1180 257.58
Luxembourg 42 29 -30.95 128.10
123.15 -4.95 37.3
70.3 88.47
Norway 158 184 16.46 42.10
50.62 8.52 94.7
253 167.16
Singapore 551 472 -14.34 245.3
150.75 -94.88 229
414 80.79
Table A2: Market Capitalization in USD Billion during the Period
2003-2012
Countries Mean Median Maximum Minimum
Std. Dev.
GCC Countries: 130 127 199 56.7 41.6
Bahrain 18.2 17.3 28.1 9.70 4.98
Qatar 86.4 87.6 126 26.7 33.3
Saudi Arabia 358 333 646 157 136
U.A.E. 76.9 74.2 121 30.4 26.5
Kuwait 110 104 188 59.4 35.9
Non-GCC Countries: 335 356 477 173 102
Belgium 275 271 396 167 76.0
S.Korea 803 836 1180 330 304
Luxembourg 79.5 69.0 166 37.3 37.2
Norway 214 223 357 94.7 78.8
Singapore 304 310 414 180 68.0

22
Table A3: Market Capitalization as a Percentage of GDP during the Period
2003-2012
Countries
Mean
Median
Maximum Minimum
Std. Dev.
GCC Countries: 92.35 86.96 150.75 53.19 31.33
Bahrain 106.35 99.52 152.29 59.05 29.55
Qatar 114.85 101.76 202.87 66.34 44.24
Saudi Arabia 93.14 74.28 196.70 47.39 47.00
U.A.E. 34.24 29.66 64.19 20.46 14.09
Kuwait 113.15 116.69 163.91 62.68 35.46
Non-GCC Countries: 113.95 117.47 163.03 67.17 27.42
Belgium 64.58 57.48 99.06 33.00 20.72
S.Korea 82.26 87.75 107.32 51.20 22.34
Luxembourg 173.45 147.14 323.65 114.22 66.02
Norway 58.30 59.56 90.83 27.74 19.60
Singapore 191.17 198.76 256.38 100.61 56.29
Table A4: Number of Companies Listed during the Period
2003-2012
Countries
Mean
Median
Maximum Minimum
Std. Dev.
GCC Countries: 90 98 110 48 22
Bahrain 45 44 49 42 3
Qatar 35 41 48 0 14
Saudi Arabia 113 119 158 70 34
U.A.E. 83 93 104 30 25
Kuwait 172 185 215 97 42
Non-GCC Countries: 512.8 527 551 508 12
Belgium 183 165 250 153 37
S.Korea 1712 1767 1792 1563 93
Luxembourg 35 34 42 29 4
Norway 189 192 209 158 16
Singapore 510 467 685 455 82

23
Table A5: Test of the Difference in Mean for Market Size between Pairs of Countries
2002-2012
Pair of Countries
Mean
(GCC)
Mean
(Non-GCC)
Difference
in Mean
P value
Market Capitalization (USD Billions)
Qatar, Luxembourg 86.40 79.50 6.90 0.5313
U.A.E, Norway 76.90 214.00 -140.00 *0.0000
Kuwait, Belgium 110.00 275.00 -170.00 *0.0000
Saudi A, South Korea 358.00 803.00 -450.00 *0.0000
Bahrain, Singapore 18.20 304.00 -290.00 *0.0000
Market Capitalization (% of GDP)
Qatar, Luxembourg 93.15 173.46 -80.31 *0.0041
U.A.E, Norway 34.25 58.30 -24.06 *0.0009
Kuwait, Belgium 113.15 64.59 48.57 *0.0034
Saudi A, South Korea 114.85 82.26 32.59 0.5068
Bahrain, Singapore 106.35 191.18 -84.82 *0.0000
Number of Listed Companies Qatar, Luxembourg 35 35 0 0.9462
U.A.E, Norway 83 189 -106 *0.0000
Kuwait, Belgium 172 183 -11 0.4080
Saudi A, South Korea 113 1712 -1599 *0.0000
Bahrain, Singapore 45 510 -465 *0.0000
*Significant at 5% .

24
Table A6: Test of the Difference in Mean for Market Size within GCC Countries
2003-2012
Pair of Countries Mean (First country)
Mean (Second country)
Difference in Mean
P value
Market Capitalization (USD Billions)
Qatar, U.A.E 86.40 76.90 9.50 0.393
Qatar, Kuwait 86.40 110.00 -24.00 **0.052
Qatar, Saudi A 86.40 358.00 -270.00 *0.000
Qatar, Bahrain 86.40 18.20 68.20 *0.000
U.A.E, Kuwait 76.90 110.00 -33.00 *0.003
U.A.E, Saudi A 76.90 358.00 -280.00 *0.000
U.A.E, Bahrain 76.90 18.20 58.70 *0.000
Saudi A, Kuwait 358.00 110.00 248.00 *0.000
Saudi A, Bahrain 358.00 18.20 340.00 *0.000
Kuwait, Bahrain 110.00 18.20 91.80 *0.000
Market Capitalization (% of GDP)
Qatar, U.A.E 93.15 34.25 58.90 *0.001
Qatar, Kuwait 93.15 113.15 -20.00 0.911
Qatar, Saudi A 93.15 114.85 -21.70 0.999
Qatar, Bahrain 93.15 106.35 -13.20 0.580
U.A.E, Kuwait 34.25 113.15 -78.90 *0.000
U.A.E, Saudi A 34.25 114.85 -80.61 *0.000
U.A.E, Bahrain 34.25 106.35 -72.10 *0.000
Saudi A, Kuwait 114.85 113.15 1.70 0.238
Saudi A, Bahrain 114.85 106.35 8.50 0.424
Kuwait, Bahrain 113.15 106.35 6.80 0.581
Number of Listed Companies
Qatar, U.A.E 35 83 -48 *0.000
Qatar, Kuwait 35 172 -137 *0.000
Qatar, Saudi A 35 113 -78 *0.000
Qatar, Bahrain 35 45 -10 **0.052
U.A.E, Kuwait 83 172 -89 *0.000
U.A.E, Saudi A 83 113 -30 *0.004
U.A.E, Bahrain 83 45 38 *0.001
Saudi A, Kuwait 113 172 -59 *0.000
Saudi A, Bahrain 113 45 68 *0.000
Kuwait, Bahrain 172 45 127 *0.000
*Significant at 5% .
**Significant at 10% .

25
Table A7: Test of the Difference in Mean for Market Size within Non-GCC Countries
2003-2012
Pair of Countries Mean
(First country)
Mean
(Second country)
Difference
in Mean
P value
Market Capitalization (USD Billions)
Luxembourg, Norway 79.50 214.00 -130.00 *0.000
Luxembourg, Belgium 79.50 275.00 -200.00 *0.000
Luxembourg, South Korea 79.50 803.00 -720.00 *0.000
Luxembourg, Singapore 79.50 304.00 -220.00 *0.000
Norway, Belgium 214.00 275.00 -61.00 *0.037
Norway, South Korea 214.00 803.00 -590.00 *0.000
Norway, Singapore 214.00 304.00 -90.00 *0.000
Belgium, Singapore 275.00 304.00 -29.00 0.252
Belgium, South Korea 275.00 803.00 -530.00 *0.000
South Korea, Singapore 803.00 304.00 499.00 *0.001
Market Capitalization (% of GDP)
Luxembourg, Norway 173.46 58.30 115.16 *0.001
Luxembourg, Belgium 173.46 64.59 108.87 *0.001
Luxembourg, South Korea 173.46 82.26 91.20 *0.003
Luxembourg, Singapore 173.46 191.18 -17.72 0.444
Norway, Belgium 58.30 64.59 -6.28 0.364
Norway, South Korea 58.30 82.26 -23.96 *0.006
Norway, Singapore 58.30 191.18 -132.87 *0.000
Belgium, Singapore 64.59 191.18 -126.59 *0.000
Belgium, South Korea 64.59 82.26 -17.68 *0.034
South Korea, Singapore 82.26 191.18 -108.92 *0.000
Number of Listed Companies Luxembourg, Norway 35 189 -154 *0.000
Luxembourg, Belgium 35 183 -148 *0.000
Luxembourg, South Korea 35 1712 -1677 *0.000
Luxembourg, Singapore 35 510 -475 *0.000
Norway, Belgium 189 183 6 0.287
Norway, South Korea 189 1712 -1523 *0.000
Norway, Singapore 189 510 -321 *0.000
Belgium, Singapore 183 510 -327 *0.000
Belgium, South Korea 183 1712 -1529 *0.000
South Korea, Singapore 1712 510 1202 *0.000
*Significant at 5% .

26
Appendix B: Market Depth
Table B1: Market Depth Indicators
2003–2012
Countries Total Volume Traded
(USD Billions)
Total Volume Traded
(% of GDP)
Trading Velocity
2003
2012
Change% 2003
2012
Change% 2003
2012
Change%
GCC
Countries: 48.22 114.14 136.68 50.61 20.93 -29.69 60.26 41.41 -18.85
Bahrain 0.27 0.31 12.80 2.81
0.96 -1.85 3.30 1.86 -1.45
Qatar 28.06 15.32 -45.40 65.19 13.49 -51.70 40.00 12.17 -27.83
Saudi Arabia 159.06 514.42 223.42 74.13 72.35 -1.78 137.03 144.45 7.42
U.A.E. 1.00 17.64 1657.59 0.81 4.54 3.73 3.96 25.34 21.38
Kuwait 52.73 23.00 -56.38 110.14 13.30 -96.84 117.03 23.23 -93.79
Non-GCC
Countries: 176.69 381.31 115.80 49.17 47.82 -1.35 80.87 55.59 -25.28
Belgium 42.67 103.26 142.03 13.69 21.35 7.66 28.34 38.97 10.63
Korea 682.71 1513.84 121.74 106.05 134.02 27.97 235.72 139.22 -96.50
Luxembourg 0.26 0.12 -55.25 0.89 0.20 -0.68 0.83 0.17 -0.66
Norway 69.97 132.88 89.90 31.12 26.59 -4.52 86.40 56.28 -30.12
Singapore 87.86 156.45 78.05 94.11 56.95 -37.16 53.05 43.31 -9.74
Table B2: Total Volume Traded (USD Billions) during the Period
2003-2012
Countries
Mean Median Maximum Minimum Std. Dev.
GCC countries: 145.00 110.00 319.00 42.60 93.20
Bahrain 0.92 0.56 2.96 0.27 0.87
Qatar 20.90 21.80 48.20 - 14.20
Saudi Arabia 569.00 494.00 1,400.00 159.00 400.00
U.A.E. 68.30 46.60 150.00 1.00 63.10
Kuwait 65.10 54.30 123.00 21.40 36.50
Non-GCC countries: 397.00 425.00 617.00 177.00 138.00
Belgium 133.00 119.00 256.00 42.70 62.70
South Korea 1,410.00 1,490.00 2,030.00 639.00 468.00
Luxembourg 0.37 0.24 1.66 0.12 0.46
Norway 240.00 213.00 472.00 70.00 124.00
Singapore 207.00 218.00 384.00 81.30 97.80

27
Table B3: Total Volume Traded (% of GDP) during the Period
2003-2012
Countries Mean Median Maximum Minimum Std. Dev.
GCC countries: 58.12 54.26 120.41 15.21 35.99
Bahrain 5.51 4.44 13.51 0.96 4.17
Qatar 25.89 26.14 65.19 0.00 21.29
Saudi Arabia 154.49 100.95 372.25 38.57 123.51
U.A.E. 30.73 24.31 79.24 0.81 28.70
Kuwait 74.00 81.79 116.35 13.30 35.11
Non-GCC countries: 75.43 73.17 118.38 47.63 21.38
Belgium 31.07 27.00 55.63 13.69 13.16
S.Korea 150.62 157.40 189.61 88.49 35.51
Luxembourg 0.85 0.54 3.03 0.21 0.86
Norway 67.88 64.06 119.93 31.12 28.87
Singapore 126.74 129.90 227.75 74.37 44.85
Table B4: Trading Velocity during the Period
2003-2012
Countries
Mean Median Maximum Minimum Std. Dev.
GCC countries: 67.74 74.32 107.52 29.09 31.08
Bahrain 5.00 4.55 12.00 1.48 3.63
Qatar 30.12 29.35 56.13 12.17 14.46
Saudi Arabia 153.53 141.14 288.40 60.46 74.91
U.A.E. 94.15 101.55 166.97 21.32 60.64
Kuwait 55.88 56.01 94.27 19.41 28.40
Non-GCC countries: 87.50 84.48 108.13 55.59 17.95
Belgium 52.32 46.61 76.48 38.97 13.37
S.Korea 188.25 188.16 237.62 139.22 29.76
Luxembourg 0.40 0.25 1.42 0.15 0.43
Norway 117.77 128.76 152.38 56.28 35.70
Singapore 78.74 78.85 122.01 40.37 29.29

28
Table B5: Test of the Difference in Mean for Market Depth Between Pairs of Countries
2003-2012
Pair of Countries
Mean
(First country)
Mean
(Second country)
Difference
in Mean
P value
Trading Velocity
Qatar, Luxembourg 30.12 0.40 29.72 *0.0007
U.A.E, Norway 94.15 117.77 -23.63 0.3069
Kuwait, Belgium 55.88 52.32 3.56 0.7336
Saudi A, South Korea 153.53 188.25 -34.71 0.2313
Bahrain, Singapore 5.00 78.74 -73.74 *0.0000
Total Volume Traded (USD Billions) Qatar, Luxembourg 20.90 0.37 20.50 *0.0013
U.A.E, Norway 68.30 240.00 -170.00 *0.0000
Kuwait, Belgium 65.10 133.00 -68.00 *0.0002
Saudi A, South Korea 569.00 1,410.00 -840.00 *0.0001
Bahrain, Singapore 0.92 207.00 -210.00 *0.0000
Total Volume Traded (% of GDP) Qatar, Luxembourg 25.89 0.85 25.03 *0.0078
U.A.E, Norway 30.73 67.88 -37.15 *0.0047
Kuwait, Belgium 74.00 31.07 42.92 *0.0063
Saudi A, South Korea 154.49 150.62 3.87 0.9273
Bahrain, Singapore 5.51 126.74 -121.23 *0.0000
*Signi ficant at 5% .

29
Table B6: Test of the Difference in Mean for Market Depth within GCC Countries
2003-2012
Pair of Countries Mean
(First country)
Mean
(Second country)
Difference
in Mean
P value
Trading Velocity
Qatar, U.A.E 30.12 94.15 -64.02 *0.000
Qatar, Kuwait 30.12 55.88 -25.75 *0.002
Qatar, Saudi A 30.12 153.53 -123.41 *0.000
Qatar, Bahrain 30.12 5.00 25.12 *0.002
U.A.E, Kuwait 94.15 55.88 38.27 0.117
U.A.E, Saudi A 94.15 153.53 -59.39 *0.028
U.A.E, Bahrain 94.15 5.00 89.14 *0.004
Saudi A, Kuwait 153.53 55.88 97.65 *0.008
Saudi A, Bahrain 153.53 5.00 148.53 *0.001
Kuwait, Bahrain 55.88 5.00 50.88 *0.002
Total Volume Traded (USD Billions) Qatar, U.A.E 20.90 68.30 -47.00 *0.000
Qatar, Kuwait 20.90 65.10 -44.00 *0.000
Qatar, Saudi A 20.90 569.00 -550.00 *0.000
Qatar, Bahrain 20.90 0.92 20.00 *0.002
U.A.E, Kuwait 68.30 65.10 3.20 0.874
U.A.E, Saudi A 68.30 569.00 -500.00 *0.000
U.A.E, Bahrain 68.30 0.92 67.40 *0.008
Saudi A, Kuwait 569.00 65.10 504.00 *0.003
Saudi A, Bahrain 569.00 0.92 568.00 *0.002
Kuwait, Bahrain 65.10 0.92 64.20 *0.000
Total Volume Traded (% of GDP) Qatar, U.A.E 25.89 30.73 -4.85 0.514
Qatar, Kuwait 25.89 74.00 -48.11 *0.000
Qatar, Saudi A 25.89 154.49 -128.61 *0.000
Qatar, Bahrain 25.89 5.51 20.37 *0.021
U.A.E, Kuwait 30.73 74.00 -43.26 *0.002
U.A.E, Saudi A 30.73 154.49 -123.76 *0.000
U.A.E, Bahrain 30.73 5.51 25.22 *0.030
Saudi A, Kuwait 154.49 74.00 80.49 **0.086
Saudi A, Bahrain 154.49 5.51 148.98 *0.007
Kuwait, Bahrain 74.00 5.51 68.48 *0.000
*Significant at 5% . **Significant at 10% .
30
Table B7: Test of the Difference in Mean for Market Depth within Non-GCC Countries
2003-2012
Pair of Countries Mean
(First country)
Mean
(Second country)
Difference
in Mean
P value
Trading Velocity
Luxembourg, Norway 0.40 117.77 -117.37 *0.000
Luxembourg, Belgium 0.40 52.32 -51.92 *0.000
Luxembourg, South Korea 0.40 188.25 -187.84 *0.000
Luxembourg, Singapore 0.40 78.74 -78.34 *0.000
Norway, Belgium 117.77 52.32 65.45 *0.001
Norway, South Korea 117.77 188.25 -70.48 *0.001
Norway, Singapore 117.77 78.74 39.03 *0.018
Belgium, Singapore 52.32 78.74 -26.42 *0.001
Belgium, South Korea 52.32 52.32 -135.93 0.999
South Korea, Singapore 188.25 78.74 109.51 *0.000
Total Volume Traded (USD Billions) Luxembourg, Norway 0.37 240.00 -240.00 *0.000
Luxembourg, Belgium 0.37 133.00 -130.00 *0.000
Luxembourg, South Korea 0.37 1,410.00 -1,400.00 *0.000
Luxembourg, Singapore 0.37 207.00 -210.00 *0.000
Norway, Belgium 240.00 133.00 107.00 *0.023
Norway, South Korea 240.00 1,410.00 -1,200.00 *0.000
Norway, Singapore 240.00 207.00 33.00 0.424
Belgium, Singapore 133.00 207.00 -74.00 *0.005
Belgium, South Korea 133.00 1,410.00 -1,300.00 *0.000
South Korea, Singapore 1,410.00 207.00 1,200.00 *0.000
Total Volume Traded (% of GDP) Luxembourg, Norway 0.85 67.88 -67.03 *0.000
Luxembourg, Belgium 0.85 31.07 -30.22 *0.000
Luxembourg, South Korea 0.85 150.62 -149.76 *0.000
Luxembourg, Singapore 0.85 126.74 -125.89 *0.000
Norway, Belgium 67.88 31.07 36.81 *0.005
Norway, South Korea 67.88 150.62 -82.74 *0.000
Norway, Singapore 67.88 126.74 -58.86 *0.000
Belgium, Singapore 31.07 126.74 -95.67 *0.000
Belgium, South Korea 31.07 150.62 -119.55 *0.000
South Korea, Singapore 150.62 126.74 23.87 **0.078
*Significant at 5% . **Significant at 10% .

31
Appendix C: Market Returns and Volatility
Table C1: Percentage Index Return and its Volatility during the Period
2003-2012
Countries Panel A: Percentage Index Returns Panel B:
Volatility of returns
(Std. Dev.)
2007
2008
2009 2010
2011
2012 Change
%
GCC Countries: -28.12 39.62 5.54 13.81 -10.55 3.86 31.98 22.85
Bahrain -2.24 34.99 -19.97 9.97 -14.37 -4.47 -2.23 19.75
Qatar -40.33 35.44 5.06 27.74 3.34 -1.86
38.47 26.64
Saudi Arabia -48.86 35.57 28.45 9.02 -3.90 4.39 53.24 29.92
U.A.E. -44.59
52.13 24.57 -6.79 -16.48 24.22 68.80 34.73
Kuwait -4.59
39.94 -10.41
29.12 -21.36
-2.99 1.60 24.04
Non-GCC
Countries: 23.66 -60.89 73.32 10.91 -19.92 19.60
-4.05 45.12
Belgium -3.13 -65.57 54.47 0.50 -15.06 33.32
36.45 41.49
Korea 27.66 -55.62 67.25 25.26 -10.90 18.88
-8.79 41.51
Luxembourg 41.87 -64.26 76.73 -3.34 -34.45 0.55
-41.32 50.83
Norway 25.90 -66.07 91.41 13.69 -18.06 16.37
-9.53 51.97
Singapore 25.97 -52.95 76.75 18.44 -21.15 28.89 2.91 44.78
Table C2: Percentage Index Return Descriptive Statistics during the Period
2003-2012
Countries Mean Median Maximum Minimum
Std. Dev.
GCC countries: 4.03 4.70 39.62 -28.12 22.85
Bahrain 0.65 -3.36 34.99 -19.97 19.76
Qatar 4.90 4.20 35.44 -40.33 26.64
Saudi Arabia 4.11 6.71 35.57 -48.86 29.92
U.A.E. 5.51 8.71 52.13 -44.59 34.73
Kuwait 4.95 -3.79 39.94 -21.36 24.04
Non-GCC countries: 7.78 15.26 73.32 -60.89 45.12
Belgium 0.75 -1.31 54.47 -65.57 41.50
Korea 12.09 22.07 67.25 -55.62 41.51
Luxembourg 2.85 -1.40 76.73 -64.26 50.83
Norway 10.54 15.03 91.41 -66.07 51.97
Singapore 12.66 22.20 76.75 -52.95 44.79

32
Table C3: Test of the Difference in Mean for Market Returns and Volatility between Pairs of Countries
2003-2012
Pair of Countries
Mean
(GCC)
Mean
(Non- GCC)
Difference
in Mean
P value
Percentage index returns
Qatar, Luxembourg 4.90 2.85 2.05 0.86
U.A.E, Norway 5.51 10.54 -5.03 0.74
Kuwait, Belgium 4.96 0.76 4.20 0.69
Saudi A, South Korea 4.11 12.09 -7.98 0.54
Bahrain, Singapore 0.65 12.66 -12.01 0.20
Volatility of returns (Std. Dev.)
Qatar, Luxembourg 26.64 50.83 -24.19 **0.073
U.A.E, Norway 34.73 51.97 -17.24 0.184
Kuwait, Belgium 24.04 41.49 -17.45 0.109
Saudi A, South Korea 29.92 41.51 -11.59 0.238
Bahrain, Singapore 19.75 44.78 -25.03 *0.035
*Significant at 5%.
**Significant at 10%.
Table C4: Test of the Difference in Mean for Market Returns and Volatility within GCC Countries
2003-2012
Pair of Countries Mean
(First country)
Mean
(Second country)
Difference
in Mean
P value
Percentage index returns
Qatar, U.A.E 4.90 5.51 -0.61 0.957
Qatar, Kuwait 4.90 4.95 -0.06 0.996
Qatar, Saudi A 4.90 4.11 0.79 0.945
Qatar, Bahrain 4.90 0.65 4.25 0.712
U.A.E, Kuwait 5.51 4.95 0.56 0.969
U.A.E, Saudi A 5.51 4.11 1.40 0.925
U.A.E, Bahrain 5.51 0.65 4.86 0.746
Saudi A, Kuwait 4.11 4.95 -0.84 0.948
Saudi A, Bahrain 4.11 0.65 3.46 0.788
Kuwait, Bahrain 4.95 0.65 4.30 0.679
Volatility of returns (Std. Dev.)
Qatar, U.A.E 26.64 34.73 -8.09 0.291
Qatar, Kuwait 26.64 24.04 2.6 0.293
Qatar, Saudi A 26.64 29.92 -3.28 0.446
Qatar, Bahrain 26.64 19.75 6.89 0.105
U.A.E, Kuwait 34.73 24.04 10.69 **0.064
U.A.E, Saudi A 34.73 29.92 4.81 0.241
U.A.E, Bahrain 34.73 19.75 14.98 *0.009
Saudi A, Kuwait 29.92 24.04 5.88 0.171
Saudi A, Bahrain 29.92 19.75 10.17 *0.043
Kuwait, Bahrain 24.04 19.75 4.29 0.192
*Significant at 5% . **Significant at 10% .

33
Table C5: Test of the Difference in Mean for Market Returns and Volatility within Non-GCC Countries
2003-2012
Pair of Countries Mean (First country)
Mean (Second country)
Difference in Mean
P value
Percentage index returns
Luxembourg, Norway 2.85 10.54 -7.69 0.726
Luxembourg, Belgium 2.85 0.75 2.10 0.923
Luxembourg, South Korea 2.85 12.09 -9.24 0.675
Luxembourg, Singapore 2.85 12.66 -9.81 0.656
Norway, Belgium 10.54 0.75 9.79 0.664
Norway, South Korea 10.54 12.09 -1.55 0.945
Norway, Singapore 10.54 12.66 -2.12 0.924
Belgium, Singapore 0.75 12.66 -11.90 0.514
Belgium, South Korea 0.75 12.09 -11.33 0.533
South Korea, Singapore 12.09 12.66 -0.57 0.974
Volatility of returns (Std. Dev.) Luxembourg, Norway 50.83 51.97 -1.14 0.443
Luxembourg, Belgium 50.83 41.49 9.34 0.186
Luxembourg, South Korea 50.83 41.51 9.32 0.186
Luxembourg, Singapore 50.83 44.78 6.05 0.266
Norway, Belgium 51.97 41.49 10.48 0.165
Norway, South Korea 51.97 41.51 10.46 0.165
Norway, Singapore 51.97 44.78 7.19 0.241
Belgium, Singapore 41.49 44.78 -3.29 0.492
Belgium, South Korea 41.49 41.51 -0.02 0.416
South Korea, Singapore 41.51 44.78 -3.27 0.493

34
Appendix D-Figures
Figure 1: Market Size Indicators
2003-2012
0 100 200 300 400 500 600 700 800 900
BAHRAIN
BELGIUM
EMIRATES
GCC
KOREA
KUWAIT
LUXEMBOURG
NONGCC
NORWAY
QATAR
SAUDI
SINGAPORE
Total Market Capitalization in Billions of US$, 2003
0 200 400 600 800 1,000 1,200 1,400 1,600 1,800 2,000 2,200 2,400
BAHRAIN
BELGIUM
EMIRATES
GCC
KOREA
KUWAIT
LUXEMBOURG
NONGCC
NORWAY
QATAR
SAUDI
SINGAPORE
Total Market Capitalization in Billions US$, 2012
0
100
200
300
400
500
600
BAHRAIN
BELG
IUM
EMIR
ATES
GCC
KOREA
KUW
AIT
LUXEM
BOURG
NONGCC
NORW
AY
QATA
R
SAUDI
SING
APORE
Total Market Capitalization as Percentage of GDP,2003
0
100
200
300
400
500
BAHRAIN
BELG
IUM
EM
IRATE
SGCC
KOREA
KUW
AIT
LUXEM
BOURG
NONGCC
NORW
AY
QATA
R
SAUDI
SIN
GAPORE
Total Market Capitalization as Percentage of GDO,2012
0
500
1,000
1,500
2,000
2,500
3,000
BAHRAIN
BELGIU
M
EMIR
ATESG
CC
KOREA
KUW
AIT
LUXEM
BOURG
NONGCC
NORW
AY
QATAR
SAUDI
SING
APORE
Number of Companies Listed,2003
0
400
800
1,200
1,600
2,000
GCC
BAHRAIN
BELG
IUM
EM
IRATE
S
KOREA
KUW
AIT
LUXEM
BOURG
NONGCC
NORW
AY
QATA
R
SAUDI
SIN
GAPORE
Number of Companies Listed, 2012

35
Figure 2: Market Depth Indicators
2003-2012
0
100
200
300
400
500
600
700
800
900
BAHRAIN
BELG
IUM
EMIR
ATES
GCC
KOREA
KUW
AIT
LUXEM
BOURG
NONGCC
NORW
AY
QATA
R
SAUDI
SINGAPORE
Total Volume Traded in Billions US$, 2003
0
400
800
1,200
1,600
2,000
BAHRAIN
BELG
IUM
EMIR
ATES
GCC
KOREA
KUW
AIT
LUXEM
BOURG
NONGCC
NORW
AY
QATA
R
SAUDI
SINGAP
ORE
Total Volume Traded in Billions US$, 2012
0
50
100
150
200
250
BAHRAIN
BELG
IUM
EM
IRATES
GCC
KOREA
KUW
AIT
LUXEM
BOURG
NONGCC
NORW
AY
QATA
R
SAUDI
SIN
GAPORE
Total Volume Traded as Percentage of GDP,2003
0
40
80
120
160
200
240
280
320
360
BAHRAIN
BELG
IUM
EM
IRATE
SGCC
KOREA
KUW
AIT
LUXEM
BOURG
NONGCC
NORW
AY
QATA
R
SAUDI
SIN
GAPORE
Total Volume Traded as Percentage of GDP, 2012
0
100
200
300
400
500
600
BAHRAIN
BELG
IUM
EM
IRATE
SGCC
KOREA
KUW
AIT
LUXEM
BOURG
NORW
AY
NONGCC
QATA
R
SAUDI
SIN
GAPORE
Trading Velocity, 2003
0
50
100
150
200
250
300
BAHRAIN
BELG
IUM
EM
IRATE
SGCC
KOREA
KUW
AIT
LUXEM
BOURG
NORW
AY
NONGCC
QATA
R
SAUDI
SIN
GAPORE
Trading Velocity, 2012

36
Figure 3: Weakly S&P Index for The Period 2007- 2012
-200
0
200
400
600
800
1,000
1,200
1,400
2007 2008 2009 2010 2011 2012
BAHRAIN BELGIUMUAE SOUTH KOREA
KUWAIT LUXEMBOURG
NORWAY QATAR
SAUDI ARABIA SINGAPORE

37
Figure 4: Nominal GDP in Billions of US$ for The Selected Countries
0
200
400
600
800
1,000
1,200
1,400
BELG
IUM
KUW
AIT
KOREA
NORW
AY
QATAR
SAUDI
SIN
GAPORE
EMIR
ATES
LUXEMBOURG
GCC
NONGCC
Nominal GDP in Billiions of US$, 2003
0
500
1,000
1,500
2,000
2,500
BELG
IUM
KUW
AIT
KOREA
NORW
AY
QATAR
SAUDI
SIN
GAPORE
EMIR
ATES
LUXEMBOURG
GCC
NONGCC
Nominal GDP in Billions of US$, 2012