Shale lithofacies modeling of the Bakken Formation in the ...

Petroleum Open File Report POF 9-88
Evaluation of the Daly Field Bakken Formation Southwestern Manitoba
By M Arbez
ManUoba Energy and Mines Petroleum
1988
Petroleum Open File Report POF 9-88
Evaluation of the Daly Field Bakken Formation Southwestern Manitoba
By M Arbez
Manitoba ~ Energy and Mines Petroleum ~
1988
Manitoba (R Energy and Mines Petroleum - J
Petroleum Open File Report POF 9-88
Evaluation of the Daly Field Bakken Formation Southwestern Manitoba
By M Arbez
Winnipeg 1988
Energy and Mines
Han Harold J Neufeld Minister
Charles S Kang Deputy Minister
Energy Divi sio n
H CICHe Moster Assistant Deputy Mini ster
Petroleum Branch L R Dubreuil Director
TABLE OF CONTENTS
Abstract Introduction Methodology
a) Bakken Sand Lithology b) Total Porosity c) Water Saturations
Daly Bakken Pool Descriptions a) Lithology b) Total Porosity c) Total Water Saturation d) Original Oil-In-Place per Unit Area e) Production Decline and Recovery Factor
Conclusions
Recommendations a) Pressure Maintenance b) Data Collection
References Appendix A Clay Volume from Gamma Ray Response Appendix B MID Plot Construction Appendix C Formation Evaluation Results Appendix D Economic Production Limit
FIGURES
Figure 1 Bakken Pools and Wells Figure 2 MID Plot
Figure 3 Neutron-Density Porosity Crossplot
Figure 4 F versus ltIgtr Crossplot Figure 5 Bakken Formation - Daly Field Total Porosity Map Figure 6 Bakken Formation - Daly Field Water Saturation Map Figure 7 Bakken Formation - Daly Field Oil-In-Place per Unit Area Map Figure 8 Daly Bakken A Pool History Plot
TABLE
Page
1 3 5
9 9 9
middot 10 middot 10 middot 10
middot 16
middot 16 middot 16 middot 16
middot 18
middot 19
middot 21
23
27
2
4
6
8
middot 11
middot 12
middot 13 14
Table 1 Reservoir Engineering Properties of the Bakken Formation 15
Abstract
This study Is a petrophysical evaluation of the Bakken sand in the study area (Figure 1) The study includes a description of the methods used to evaluate the Bakken formation as well as the results from these methods
Log analysis techniques have been developed to obtain Bakken porosities and water saturashytions Quick-look porosity estimates are obtained directly from porosity logs A modified Archie equashytion gives fairly reliable water saturation estimates
Introduction
The Bakken formation underlies the Mississippian Lodgepole and unconformably overlies the Devonian Lyleton or Three Forks Formation For more detailed information on the geology of the Bakken sand please refer to the Petroleum Open File Report POF 8-88 The Bakken is productive elsewhere in the Williston Basin notably at Rocanville in southeastern Saskatchewan
In 1985 Newscope Resources Limited discovered the Daly Bakken A Pool by completing the well 13-21-10-29 WPM Further development and exploratory drilling has resulted In the discovery of a number of Bakken pools in the Daly Field The location of these pools and the study area are shown on Figure 1
The Bakken Is a clay-bearing sand Because of this conventional log analysis techniques often result in misleading or erroneous porosity and water saturation calculations This study presents a reliable and effective Bakken formation evaluation method using production core and open-hole log data
Methodology
a) Bakken Sand Lithology
I) Mineralogy
The Bakken formation is a very fine-grained quartz sandstone The most abundant intergranular mineral is dolomite in the form of microcrystalline fines andor cement Dolomite cement helps lithify the rock but reduces formation porosity Feldspars (potassium feldspar and plagioclase) and iillte clay are also present in the Bakken sand Illite generally occurs as a low relief clay which binds dolomite fines to larger grains and bridges and infills intergranular pore space
il) Log Lithology Model
The LDT or litho-density tool is a relatively new and expanded version of the compensated density log In addition to measuring the formation bulk density the LDT also records the formation photoelectric absorption cross-section index Pe(6) middot Because Pe primarily reflects mineralogy the LDT is a good lithology indicator
Quantitative Bakken clay volumes were obtained from special core analyses of samples from the well 9-14-10-29 WPM These clay volumes were matched with gamma ray log readings to
reference listed at end of report
o
m o ci ~ ~
co o a ~ ~
-~t I
r-r- 1-- I iii I 0 1 60E
Rge 29w 1
-r--Y-l
-6 - ~- )
I _ I-
- -
1 I
_ L _
J1 __
Rge 28w 1
Figure 1 Bakken Pools and Wells
2
Rge 27w 1
derive a clay volume to radioactivity correlaton (see Appendix A) This correlation Is applied throughout the study to calculate illite clay volumes for the Bakken formation
Figure 2 shows a Matrix Identification (MID) plot The MID plot is used to Identify lithology from LOT data The apparent matrix density vYmaa) Is plotted along the Y axis The apparent matrix volumetric cross-section (Umaa) is plotted along the X axis Both Pmaa and Umaa are derived from the bulk density and photoelectric absorption Index from the LOT log (see Appendix B)
Uma and Pma data for some common minerals can be obtained from the IIterature(3) The table below lists Uma and Pma values for three of the four minerals from the Bakken lithology model
Mineral Uma Pma -- --quartz 4 78 264
dolomite 900 288
illite 1180 306
Because the fourth component of the model is a complex feldspar mineral assemblage its Uma and Pma values are not readily available from the literature By combining special core analysis data with simple material balance the Uma and Pma parameters for feldspar were estimated to be 1506 and 265 respectively (see Appendix B)
The MID plot in Figure 2 can be used to estimate the percentages of quartz dolomite and feldspar for the Bakken sand The procedure is as follows
1) obtain Vcl ay (clay volume) from gamma ray log (see Appendix A)
2) calculate Pmaa Umaa (see Appendix B)
3) locate point on MID plot
4) apply Vclay correction along a line joining illite clay point and point of interest
5) read quartz dolomite and feldspar percentages at clay-corrected point
The MID plot should only be used to obtain rough estimates of mineral percentages for the Bakken sand Many factors can affect the accuracy of the MID plot For example radioactive feldspars increase the gamma ray response Consequently calculated clay volumes are too high and the clay correction to the MID plot is too severe The Bakken sand contains potassium feldspars which can adversely affect MID plot results
b) Total Porosity
All Bakken core samples in the study area have been dried in conventional ovens before porosity determination Clay-bound water is evaporated under the quick-drying conditions of a conventionshyal oven Because the Bakken Is a clay-bearing sand all available core-measured porosities are equivalent to total porosities (flr To obtain effective porosities core samples must be dried in humidity-controlled ovens which do not drive off clay-bound water
By depth-adjusting Bakken core data to log traces the following core bulk density ipb core) to log bulk density ipb log) correlation is obtained
3
-
aj aj
E a
24
25
26
27
28
2 9
30
Quartz (478264) )- 7 X 7 7 7 ~t 7 Feldspars (1506 265)
bC V
Dolomite (900288)
beC
~C ~e
tOC oO~ ~Q
Illite Clay ( 118306)
Definitions
L = length of line from cia y point to point A
Lclean = length of line from clay point to point A
A= uncorrected pmaaUmaa
A= clay-corrected pmaaUmaa
SamRle Calculation
point A pmaa 275 Umaa 90 Vclay 10
Lclean= Lx100 L J=862cm 100-Vclay
Lclean = 8 62x 100- 9S8cm 100-10 (point A)
311 I I I I I I I I I I o 2 4 6 8 10 12 14 16 18 20
Umaa
Figure 2 MID Plot
(1) Pb core = ~b log + 0252) 1 111
Pin gmcm3
The log bulk density Is a function of the (density) porosity as shown in the equation
(2) Pb log = (Ilo + (l -ltllo) x 271 ltflo in fraction limestone scale (6)
rearranging (2) we get a corrected density porosity
(3) (Ilo corr = (271 - Pb core)
171
ltfgto corr in fraction limestone scale
Figure 3 is a ltPo corr versus lt11N crossplot for the Bakken sand in the study area The following procedure was used to develop this crossplot
1) depth-adjust core porosities to log porosity traces
2) plot (Jo corr and lt[IN (point A)
3) locate lt[lcore or ltM along diagonal or clean sand line (point A)
4) join A to A
5) calculate slope of line in (4) ((Jo corr(11N or total porosity slope)
These steps were followed for a number of core intervals A total porosity to log porosity correlation was derived
(4) (IJr ((110 corr + (0095 X (flN )
1095
c) Water Saturations
i) Choice of Water Saturation Models
(ll in percentage limestone scale
The Waxman-Smits shaly sand model(l) has been selected to calculate water saturations for the Bakken formation A modified version of the Archie equation is also used to calculate saturations The empirical Archie equation with a = 1 and m = 2 is not well suited to clay-bearing sands like the Bakken
The Waxman-Smits model assumes that an electrical current through a clay-bearing sand will flow along a parallel conductance path Part of the current flows through the brine solution within the pore system The remainder of the current Hows through a cation-rich layer of water bound to the clay
The Waxman-Smits model was developed on the premise that the suppression of resistivity by water-bearing clays is a function of the cation exchange capacity (CEC) of the clays Different clay types have different CECs Special core analyses on clay-rich samples usually yield reliable CEC values No such analyses are available for the Bakken sand The literature(1) offers lists of typical CEC values associated with different clay types
The Bakken contains Illite clay The CEC for illite usually ranges from 02 to 03 megg A CEC of 025 Is used in this study
5
30
25 Ql
i 0 en Ql c 0 (ij
Clean Sand Line Ql 20 r ~ ~
0 0
A (1515) ~ 15r I
gt-t ()
0 ~
en o 10 (l
gt-t ()
z w 0 0 w 5 t-U W ~ ~ 0 u
0
Total Porosity Lines -51 I I I I I II
o 5 10 15 -- -- --
NEUTRON POROSITY- ltliN (lmestone scale)
Figure 3 Neutron -Density Porosity Crosspot
II) Swt from Waxman-Smits Model
The Waxman-Smits equation can be written in the form
5) Ct = Cwt n + BOvSwtn-1
F F
where Ct Is the formation conductivity
Cw is the formation water conductivity
B Is the conductance of the clay exchange cations
Ov Is the cation concentration per unit volume of fluid in pore space
F Is the Waxman-Smits formation factor
Swt Is the total water saturation including clay-bound water
Ct = Rt from deep resistivity log trace
Rt
Cw = 1 = 1 = 20 ohm-meters ---Rw 005
Rw = 005 ohm-meters from produced Bakken water at t 31degC
B = -1 28 + 225t - 0004059t2 = 516
1 + Rw 123 (0045 t - 27)
Ov = CEC (Pflr) Pma = 025 (1-cfT) Pma
cll
F = F (1 + RwBOv)
To obtain F plot F RoRw versus cflr (log-log plot) for wet Bakken sand intervals (see Figure 4)
If n = 2 in equation (5) the Waxman-Smits equation can be solved as a simple quadratic
(6) X = -bplusmn (b2 _ 4ac) 5 (1)
where
2a
X = Swt
a = CwF
b = B OvF
c = -Ct
iii) Swt from Archie Equation
From Figure 4 10glOF = 00098743 - 174 IOg10 cl~ the slope m = -1 74 and a or the y-intercept = 1023 (cflr = 100) The parameters a and m are used in the Archie water saturation equation
7
1000 900 800 700
600
500
400
300
200
100 90 80 70 60
50 -~ a 0 a -u
40
30
20
10 9 8 7
6
5
4
3
2
02
slopem=174
y intercept at 0 T =10=1023
03 04 05 07 09 23 4 56 789 10 06 08 1
Total Porosity-(2JT (fraction)
Figure 4 F versus (Igtr Crosspot
8
The Archie equation for the Bakken sand in the study area can be written as
(7) Swt n = a Rw (IgtTmRt
where n =20
a = 1023 m = 174 Rw = 005
Archie water saturations were calculated for the Daly Bakken sand
A modlfed version of equation (7) yields accurate quick-look results
(8) Swt = (aRw(j)Dm Rt) 05
132
Daly Bakken Pool Descriptions
Each of the designated Bakken pools have been analysed in detail for lithology porosity water saturation original oil-In-place per unit area and estimated primary recovery Calculations were made on well data available to September 1 1988 Appendix C lists these results
a) Lithology
MID plot calculations consistently show that the Bakken in the study area is a feldspathic dolomitic clay-bearing sandstone Core descriptions confer with these log-derived results The litho-density log is a reliable lithology indicator for the Bakken sand
b) Total Porosity (see Figure 5)
A Pool Porosities range from 13 to 23 and average 17 The best porosity development Is In the central portion of the pool at the locations 16-20 13-21 2-28 3-28 4-28 all in Township 10 Range 29 WPM Porosities drop off rapidly to the west away from the centre of the pool
B Pool (includes F Pool) Porosities range from 13 to 19 and average 16 Because of their narrow range porosities were not contoured
0 Pool Porosities range from 9 to 21 and average 18 The highest porosities occur near the eastern edge of the pool (12-13 9-14 and 16-14 Township 10 Range 29 WPM) Porosities decrease quickly to the west Lack of data at the east side of the pool limits contouring of porosity data
9
c) Total Water Saturation (see Figure 6)
A Pool The average water saturation Is 45 Saturation conlstently rmqe from l0 to 40 In the middle of the pool and Increase to the west which Is downdlp from the centre of the pool
B Pool (Includes F Pool) Water saturations do not vary appreciably The average saturation Is 54
D Pool The average water saturation at the eastern edge of the pool Is 33 Saturations inshycrease sharply on the west side of the pool
d) Original Oil-in-Place per Unit Area (see Figure 7)
Table 1 lists reservoir properties for the Daly Bakken A B and D Pools The shrinkage factor (1Bol) was obtained from a PVT analysis on the well 3-28-10-29 WPM
A Pool The total oll-In-place for this pool Is calculated to be 1 123 180 m3 Most all appears to be trapped In the geographic centre of the pool The west side of the pool Is probably limited by a downdlp water zone The north south and east sides of the pool exhibit rapid decreases In net pay thickness There appears to be a limited amount of future drilling potential
B Pool (Includes F Pool) The oil-In-place for this pool is calculated to be 492 043 m3 The edge of the pool Is difficult to define because of the lack of data to the north and south
D Pool The oil-In-place for this pool Is calculated to be 231 000 m3 The edge of the pool Is loosely defined
e) Production Decline and Recovery Factor
The lower economic limit for oil production Is assumed to be 05 m3 per day per well for all three Bakken pools (see Appendix D)
A Pool A primary recovery factor of 71 was estimated from an annual production decline of 20 The decline was obtained over a period of time when the pool was not being actively developed (Dec86 - June87) (see Figure 8) The ultimate recoverable reserves are 80 631 m3 all
B Pool (Includes F Pool) A very low primary recovery factor of 10 was calculated for this pool B Pool oil production Is very erratic with time Overall production from the pool Is declinshying quite rapidly Assuming an annual decline of 42 (based on production from 12-29) the ulshytimate recoverable reserves are 4 174m3 all Many of the wells In this pool have been recompleted to the overlying Lodgepole formation because of uneconomic Bakken production
D Pool A recovery factor of 11 was calculated based on an annual decline of 24 for the well 15-11-10-29 WPM A decline rate could not be estimated for the pool as a whole because of active development throughout its production history The ultimate recoverable reserves are 25 742 m3
oil
10
middot~i)k(JMi~~O-raquomiddot][ampdHi~~f __ ~~
bull ~secti
~1
0 ~ ~ A--
r-- 4 ~
z laquo ~
1
~~ () Eshylaquo
~
~ ill () t~i---
bull
bull 1 1
bull Kola
bull I ltIgt
Rge 29w1 Rge28w1
bull
I ~ ~ bullbull B Pool ~l r ~poundfeEwgt~~~~17~--~i~~~~0~-or~ ~~1~
If - - - - - -- -_ ~~ = b=poundf= r ~ - -~ ---1 =- ~~1 T 1 17 15 17 13 17 Y
[1 bullbull bull bullbull
rE~i~$i~~
ie ~
~~~ tJ
19 15 fpound 18 16 bullbull 1 +14 W~~
bull 13 13 euroll bull ~~ f bull middot ~_jMill1l$i bullbull ~1~middot---
bull
- -- (I) I bull bull bull bull 16
+ 11 1 bull bull ltIgt bull bull bull 1 ___ __ _ _
bull bull bull
bull bull bull 1 bull bull
bull ltIgt bull CLAYmiddot
12 bull bull bull -- ---
bull bull 11
bull bull
bull bull
16
~ ~ ~ bull bull 18 lt1gt14 bull --- lt1gt12---- - ---
bull I
bull bull bull
bull
bull + ~
bull bull bull
bull bull bull bull bull Bakken Formation-Daly Field
Total Porosity Map
Contour Intral 2 Y bull
Figure 5 Bakken Formation - Daly Field Total Porosity Map
N
Rge29w1
r-~~ r7l __ ~ ~ t~
00 - II g ill
bull J-ill
2 ~ Q ~ __ so ~ z L- ~( --- r
0~~ ~
bull
bull
bull Ko la
II agt
bull
II BAKKEN OIL WELLS
bull
bull
M
If ~ bullbullbullbullbull ~~~ bullbullbull dlmiddot _- bull
II
agt1
1
00 33
bull Il Il ~o 100 ~001l 32 []
WmiddotI +46 bull
-tagt bull bull __ _ __ _------
bull bull bull
bull bull i 1
bull bull
bull bull bull LODGEPOLE OL WELLS
Rge28w1
+
~H~~(~~~~~
bull bull bull I bull Iagt bull bullbull I agt
bull
bull
bull 1 1gtshy bull _ __ _----- +---
bull bull I bull bull bull bull bull bull bull bull bull
Bakken Formation-Daly Field Water Saturation Map
Contour Intrval 10-bull
Figure 6 Bakken Formation - Daly Field Water Saturation Map
()
Rge 29w1
~
~ bull
~t
0 -__1 r-
$( - ~
bull bull 1 bull 1
III bull Il BAKKEN OIL WELLS
Rge 28w1
~~-M 1 I B Pool
I middoti~ x fl
~
0 Pool
Il
CDI Il bull I bull 23 07
1 bull bull I CD bull bull bull
bull bull bull bull
bull bull 1 -
bull LODGEPOLE OIL WELLS
bull CD
bull bull bullbull bull bull
bull bull bull
~ g~iiil bull
bull bull I CD
CD
bull bullbullbull
bull + ~ bull -t -------- ------t---- - ---
bull bull I bull bull bull bull bull bull bull bull
bull bull bull bull bull bull Bakken Formation-Daly Field OIl-ill-Place per unit Area Map
Contour Intrval 0 m3 m 2
Figure 7 Bakken Formation - Daly Field Oil-in-Place per Unit Area Map
100 r
or 80
70
60
50
~ 40
30
20
10
o
0 0 0 -0
0 0 0 I)
o o o
o o I)
o o
o I)
o
~-
1985 L-_____ MONTHLY OIL - m3 M
WELL COUNT
1986 19 8 7
Figure 8 Daly Bakken A Pool History Plot
198 8
WOR-----
100
50
10
5
05
01
01
POOL General Information
1 Year of Discovery 2 Number of wells a) capable of oil production
b) produced first half of 88 c) previous producers
3 Spacing 4 Average Depth of Producing Zone 5 Crude Oil Quality a) density
b) sulphur content
BAKKEN A BAKKEN B
1985 1986 19 6 17 6 o 0
16 ha 16 ha -340 m(subsea elev) NA 7764 kgm3 7764 kgm3
013
BAKKEN 0
1986 7 7 o
16 ha NA
7764 kgm3
6 Initial Pressure (at datum) 8500 kPa 7716 kPa 7900 kPa (3) 7 Current Pressure (at datum) 4000 - 6 000 kPa NA NA 8 Recovery Mechanism ---------------------------- low energy natural water drive -------------------
Reserves Information 1 Production Area 2 Net Pay 3 Porosity (Or) 4 Connate Water Saturation (Sm) 5 Shrinking Factor (1Boi) 6 Original oil-in-place 7 Recovery Factor 8 Ultimate Recoverable Reserves 9 Cummulative Production (to Sept 30 1988)
10 Remaining Recoverable Reserves (Sept 30 1988)
(1) 20 annual production decline for pool (2) 42 annual production decline from 12-29-10-28 (WPM) (3) DSTs show dramatic pressure drop
853 ha 16 m
170 450 0893
1 125180 m3
71 (1) 80631 m3
27539 m3
53092 m3
(4) 24 annual production decline from the well 15-11-10-29 (WPM)
Trap Type (For all pools) 1 Primarily stratigraphie (related to the lateral pinch-out of the Middle Member)
424 ha 18 m
160 540 0893
492043 m3
10 (2) 4174 m3
4216 m3
2 Secondary structural (related to minor structural elevation on top of the Middle Member)
Table 1 Reservoir Engineering Properties of the Bakken Formation
196 ha 11 m
180 330 0893
231000 m3
110(4) 25742 m3
5759 m3
19983 m3
Conclusions
1) The Waxman-Smits equation has been successfully used to derive total water saturations for the Bakken sand In the Daly area This approach Involves a number of complex empirical and derived equations and cannot be used as a quick-look method of calculating total water saturashytions
2) A modified form of the Archie equation using log density porosities [equation (8) I yields total water saturations which almost mimic those obtained from the Waxman-Smits equation This provides a simple way of calculating the total water saturation for the Bakken formation If the calculation Is done on a Bakken Interval In Daly Rw = 005 ohm-meters When evaluating the Bakken outside the study area Rw should be obtained from temperature-corrected water analyses on produced water
3) Many Daly wells produce at extremely low water cuts yet their total water saturations are fairly high (gt30) These apparently high irreduceable saturations along with relatively low log resisshytivity measurements Indicate that the Bakken is strongly water-wet A strongly water-wet rock produces more efficiently under waterflood conditions than does an oil-wet rock
4) Based on petrophysical data It appears that there are some limited future development posshysibilities within existing Bakken Pools of the Daly Field Development locations proposed within these pools are listed below A Pool 1-20-10-29 WPM 5-29-10-29 WPM B Pool 12-30-10-28 WPM 5-30-10-28 WPM 6-30-10-28 WPM D Pool 2-23-10-29 WPM
Recommendations
a) Pressure Maintenance
Reservoir pressure and production data Indicates that the Daly Bakken formation Is being effected by a very low energy recovery mechanism Over a production period of two years there has been a substantial drop In the production rate reflecting a decline In reservoir pressures In the Bakken A Pool Due to the lack of data the pressure drop has not been quantified for other Bakken pools All Bakken pools have shown rapid production declines
It Is evident that a pressure maintenance scheme such as waterflooding is necessary to maxishymize the economically recoverable reserves in the Bakken However illite and dolomite fines are abundant In the Bakken sand Migrating illite and dolomite fines can clog pore throats between sand grains and reduce permeability If water injection pressures are too high or if fluids are produced at unrestricted rates a fines migration problem can be initiated Some of the dolomite fines appear to be lodged within the illite clays If these clays are dlsolved by Injection water an even greater migration problem can develop Water compatibility tests would indicate which fluids dissolve illite clay andor react with dolomite Laboratory tests should be conducted in order to establish the benefits of dissolving Illite clays to increase permeability taking Into account the increased fine migration problem associated with clay dissolution
b) Data Collection
The following shopping list could lead to a more accurate and meaningful formation evaluation of the Bakken sand
16
1) Conduct humidity-controlled and conventionally-dried core analyses on a Bakken core Effecshytive porosities are obtained from humidity-dried core total porosities are obtained from conshyventionally-dried core Data from both types of anaiyses can also be used to estimate formashytion cation exchange capacity (CEC)
2) More special core analysis work would result in a more reliable clay volume to gamma ray correlation for the Bakken (ie X-Ray diffraction and Scanning Electron Microscopy)
3) Meaningful Bakken formation water resistivities (Rw) can be measured from samples of produced water Drill stem test water samples are often contaminated by drilling mud filtrate which has invaded the formation
17
References
1) Berry WR
1983 Modern Shaly Sand Log Analysis
2) Core Laboratories Inc
1988 Petrographic Analysis for The Manitoba Oil and Gas Corporation MOGC Daly 9-14-10-29 WPM
3) Core Laboratories Inc
1982 Special Core Analysis p v-17
4)Dowell Schlumberger Canada
1986 Formation Analysis Report for Newscope Resources Limited 4-28-10-29 WPM and 1-29-10-29 WPM Bakken Formation
5) Helander DP
1971 Oil and Gas Consultants International Inc Formation Evaluation Manual
6) Schlumberger Educational Services
1987 Schlumberger Log Interpretation PrinciplesApplications
18
Appendix A
Clay Volume from Gamma Ray Response
--~ 0
850 (
(
~
~ Igt -- JJ
II v U I--
-
c 1 b V- ~ 1-_
fit I-No1 ( J
~ No1 P ( - Nn 12 ) --
lt ~ - 1
J
~ I
) C 1--
GR ~ ) 1- 1 ~ ~ CNL
- - Porosi ( 1----
Pet ~ -1(
I - i I I I
Compensated Neutron-Llthodensity Log for 9-14-10-29 WPM
From SEM(1) - Log Correlation
Sample No core depth (m Kb)
14 85910-85919
16 85930-85942
22 86031 ~86041
illite
18
9
30
V I~
~ t-
F F0-
tgt It
e--I--~
lt lt ) )
lt
tv gt -
~C ----gt
D
0
-
em ity Po osi tv
0 0
Gamma Ray (API)(2)
80
75 85
Gamma ray versus percentage illite was plotted on a log-log grid (Figure A-1) and a correlation was establ ished
log1Q (Vclay) = (log1o(GR)-1776)0l033 Vclay in
(1) Scanning Electron Microscope
(2) Repeat run used
19
GR in API units
I) o
o r
lffL_~ __ _ 60
a 50 laquo -gt 40 ra
cr ra E 30 E ra
20
091O(VcaY)~(I091O(GR)_1776) 01033
101r~~~~~~-----LL1 2 3 4 5 6 7 8 9 10
Illite Clay
(Figure A -1 )
20 30 40 50 60 70 8090100
Appendix B
MID Plot Construction
1----- 8~O c
i
(
c ) -
f l--
-c [
I-- I
If ( ~
(
) lt -
l I(
l 1- (
~ r
C --GR ~ r--
tr ~ Ill-L- ~
r 1 -I-
Pe -rl 0- It
l - i I I
Compensated Neutron-Lithodenslty Log for 9-14-10-29 WPM
X-Ray Diffraction Results for Sample No 169-14-10-29 WPM
core porosity 21 3
minerai percentages quartz = 64 K-feldspar = 10 plagioclase = 4 dolomite = 13 illite = 9
Log Response at Sample No 16
Pe = 25 barnselectron ltfN = 21 5 (limestone scale) lt1gt0 = 205 (limestone scale)
Pb log = (flo + (1-lt1gt0) x 271 = 205 + (1 - 205) x 271 = 236
Pb core (Pb log + 252)1111 (236 + 252)1111 235
21
~
~ -
-)
- - ~ ~ v r---
D gt 1-- e-
~
-f--- Sam Ie 6 -- ---
Ie lt ~ b I)
(
CNL Po osi ~y P
r--lt [ ens ity Po psi Iy
f- -
gt ~- 6P b
(10 corr == (271 - Pb core)1 71 == (271 - 235)171 == 0211
(11 == [(1)0 corr + (095 x PN)]1095 == [0 211 + (0 95 x 0215)]1 095 == 0211 (porosity from Core Labs == 0213)
Pmaa == Pb core - ltfTPFL = 235 - (0211 X 10) = 271
(1 - ltrr) (1 -0211 )
Pe == Pb core + 01883 (235 + 01883) = 237 ------
10704 10704
Umaa PeDe - rfTUFL == (25 X 237) - (0211 X 398) = 740
where
(1-(lrr) (1-0211)
P = matrix density P = fraction q == quartz d == dolomite i == illite F == feldspar
271 == (264 X 064) + (288 X 013) + (306 x 009) + (PF x 014)
PF == 265
where U == matrix volumetric cross section P == fraction
740 == (478 x 0 64) + (900 x 0 13) + (1180 x 009) + (UF x 014)
UF == 1506
We now have the three MID plot points for our Bakken quartz-dolomite-feldspar (+ illite) model Mineral Pma Uma -----quartz 2 64 478 (known)
dolomite 288 900 (known)
feldspar 2 65 1506
illite 3 06 1180 (known)
MiD plot shown in Figure 2 of study
22
Lout i on
7-30-11)-28 10-30-10-28 11-30-10-28 5-2-10-29
11-11-10-29
9-20-11)-29
10-21-10-29
11-21-10-29
12-21-10-29
13-21-1 0-29
14-21 - 10-29
1-22-10-29
1-23-10-29
9lt5-10-29
2-28-11)-29
3-28-10-29
4-28-10-29
5-28-10-29
6-28-10-29
7-8-10-29
11-28-10-29
1-29- 10-29
8-29-1(1-29
9-29-10-n
a-30-10-29
Too Deoth
ISIft)
81400 81500 81540 87700 88020 86250 86520 88300 88700 86940 87400 87350 87750 87500 88000 875 00 87BOO 86700 871 00 85980 86300 85000 85300 81900 82200 86070 86400 86780 87 1 01) 874 00 87700 86900 87280 86400 86750 85900 36240 86060 86450 87950 883 00 86950 87350 864 00 86800 881 )0 884 )0
Appendix C
Formation Evaluation Results
aottOil lJepth
(lI fti
81600 81850 81700 87880 88180 86400 86630 88500 88930 871 30 87600 87500 88000 877 00 882 00 87600 88050 86870 87220 861 50 86400 85300 85520 821 00 82300 86260 86560 86960 87310 87500 87900 87000 87400 86550 86900 86060 86400 86250 86750 881 00 88520 872 00 876 00 86600 8701)0 88250 886 )1)
Total Volue Quartz Dolomite Porosity of Clay (frac) Ifrac) (f rac) Ifrac)
018 015 017 009 015 007 011 O II 016 010 018 012 015 010 015 012 022 010 019 009 015 012 I) 14 019 (1 11 012 023 O 0 020 0 10 0 21 010 021 01 t 019 012 013 o Il 0 19 010 014 O 1 ) 018 II ij V J
019 011 O 7
23
012 009 027 005 003 1 00 005 019 004 001 0 01 031 005 009 005 009 003 004 004 034 009 053 002 048 009 005 001 ) 05 000 007 0 01 005 003 009 000 O i3 001 001 001 024 00 4 (ilj9
J OS ( 09 005 (1 09 002
065 055
040 053 050 036 055
045
044 048 037 038
035
047
047 040 049 041 042 1)39
050 034 u49 047 046 049 j44 044 042
045 044 049 046 047 043 043
011 017
024 002 027 033 030
026
018 027 029 027
017
025
024 028 031 027 031 024 031 025 027 019 029 (112 032 033 030
~) 27 019 ) I t O lr 026 020 029
Otner ~a X~ dn Mooified -SlIi ts Archie
(fracl Swt (ir ) SHt (fr i
012 019
032 025 019 030 015
024
029 022 030 032
039
025
O2i 028 (1 19 027
030 0 18 036 021 026 024 025 024 02~
026
1)24 i) ~8
026 025 0i3 028 0 26
038 055 052 100 048 1 00 046 097 050 093 038 084 045 (0 058 074 031 (1 92 035 l OO 058 073 0 gt33 i) 54 100 1) 83 030 id4 029 099 032 095 046 1 80 031 080 055 085 044 093 063 i 0 1 V 1 1
047 O BO 046 087 047
0 40 056 Umiddot c bull J i
10(1 049 1 )1
055 096 O5l 094 040 030 048 100 057 073 033 O ~4 038 1 00 057 070 040 02 1 00 083
088 033 1 00 0 34 094 044 080 034 080 058 083 044 O ~4
093
080 046 Ci 89 047
Location Too Depth
[1Ift)
BortolD Depth
(11 ft)
13-6-9-27 82860 83020 7-30-9-27 86000 86230 13-31-9-27 80800 81050 2-2-9-28 851 60 85500
85600 85800 14-13-9-28 dual lilt 81500 81620 4-18-9-28 90370 90600
90700 q08DO 2-23-9-28 83000 83150
83150 93300 13-26-9-28 B1880 82200 5-36-9-28 80940 81270 12-5-9-29 95400 95550
95780 95970 5-15-9-29 91900 92000 1-16-9-29 92200 92450
93000 93100 11)-16-9-29 92050 92300
92600 92720 1-21-9-29 91560 91650
92100 92200 8-29-9-29 90900 91050
915 50 91700 6-33-9-29 90040 90350
90500 90600 11-35-9-29 88200 88380
88500 98600 10-7-10-27 258800 259400 7-18-1 0-27 dual lat 55800 256400
2568 00 257200 11-19-10-27 257600 258300 12-9-10-28 92960 83100
83200 83370 10a-12-10-28 254400 255400 13-16-1 0-28 81880 82010 15-18-10-28 83000 83100 13-20-10-28 80780 80900
1-21-10-28
4-22-10-28
5-29-10-28 7-29-10-28 10-29 -10-28
~ 1-29-[ )-28 12-29-10-28
81100 81200 81530 B1800 81050 81550 90900 80950 81UO 81320 81301) 81300 81500
81770 81900 81200 817 00 81200 8120 81260 81500 81670 815 1)0 816(10
Total Volu~e Q~artz Dolomite Porosity of Clay (frac) [frac i (frac) frac)
016 010 012 011 012 O 11 009 012 O 11 013 ( 15 012 012 016 015 015 013 013 013 012 015 011 014 010 Oli O 11 015 002 016 Ij22
009 0i5 011) 012 011 01i) 014 010 018 01 (1 014 016 015 (I 17 ) 15 013 1)16 ( 18
24
005 017 000 019 001 053 053 006 053 009 009 100 031 009 006 009 001 017 001 1 00 001 017 002 022 0()9 009 006 1 00 007 031 t (10
100 009 ) 31 100 100 073 005 bull (1)
031 005 01)4
) 05 01)1
100 () 2~ 031 134 031
047
048 039
055 044
033 027
043 050 041
043 050
046
023 048 046 056
052
005
001 036
021 023
006 036
0 32 005 034
020 022
024
021 027 024 017
006
Otner ~ax~an Modified -Slits Archie
(frac) 5101t (fr) Swt ifrl
059 031 083
087 032 077 024 097
078 1 00
080 084 069 056 080 054
015 037 027 04 1
0 56 063
044 057 036 055
079 024 049 028 072 023 Ij49
091 07
028 082 022 059
047 (J24
11)0 059 095 074 081 076
024 062
O 5t 021 025 017
~J 32
1)79 038 093 043 056 ~) 48 055 060 069
056
058 087 086 078 094 078 100 080 088 ) 69 055 080 060 042 046 0~7
067 062 061 080 0~2
O i7 054 094 078 084 058
049 027
OO 058 097 073 083 082 062 082 41 1)90 J 48
055 1)51 053 058 067 i c- )~i
053
~ocation Tao Depth
lQ f t)
[-20-9-28 86500 15-12-9-29 iOB 00
90260 3-13-9-29 90200
90530 3-3i-9-29 91750
92000 3-34-9-29 89200 11-9-10-28 83100
83300 3-19-10-28 82700 7-20-10-28 81000 12-20-10-28 81200 13-21-10-28 dual lat 80400 6-28-10-28 81350 3-29-10-28 80880 4-2-10-29 87800
881 00 15-11-10-29 85850 12-13-10-29 85950 7-14-10-29 85560 9-l4-10-29 85600
85900 14-14-10-29 85100 15 -1 4-l0-29 85600 16-14-1 0-29 86lO0
86200 7-[0-10-29 88280
88600 14-16-(1)-29 il83 50
88650 16-17-10-29 90600
911 00 8-20-10-29 88480
88900 15-20 -10-29 87900
88200 16-20-10-29 87B00
88 1 50 5-21- 10-29 87400
88400 16-21 -10lt9 86100
865 1)0 2-25-10-29 82800
3-27-10-n
12-28-10-29
831 00 85750 861 Or) 86400 86800
8ottoll Deoth
(adU
86660 90920 90400 90320 90670 919 00 92200 89380 83240 8~480
82860 81350 81400 80730 81700 811 80 87950 88200 861 90 861 00 86000 85700 86030 85250 85730 86200 8b330 88460 88700 88500 38730 90820 91300 88660 891 00 88030 88300 88000 983~0
67600 8850( 86380 86660 82930 83200 85950 8620 86500 871 00
Total Volume Quartz Dolomite Other Wax Ian Modified Porosity of Clay -S~jts ~rchie
(frac) (frac) (frac) (frac) (frac) Swt (Ir) Sl4t (fr I
0 10 009 009 007 012 012 013 008 013 014 012 014 016 016 014 013 009 013 016 018 010 015 021 009 017 015 019 (j I (J
013 007 015 015 018 010 013 0 II 013 011
O 1 ~ 015 011 015 009 ) 13 )11 016 011 016
25
053 001 053 000 001 015 005 012 000 007 1 00
005 002 004 099 000 012 010 1 00 100 017 aOl 013 022 1 00 009 009 ) )8
048 O I) S (11)9
002 ( 08 001 053 1)27 0 )6 O i) I 004 005 005
000 i) 53 ) U9 (103 004 003
043
035 030 044 045 036 032 033
047 0 51 045
030 052 051
057 055 037
058 037 0 54
OSt 049 tJ 52 048 045
041 05) 034 043 0 39 046 032
)37 029 041 045
035
O 32
009 027 012 033 018
023 028 027
035 012 014
0 05 027 012
015 018 O 8
) 17 I) ~9
(122
031
031 02 024 026 032 O bull 35
017 026
021
033 036 031 023 040 035 0 42
025 0 18 024
035 024 025
I) 17 038
018 036 ) 2)
026 025 017 022 024
030 0117 033 027 030 i)21 034
037 042 028 025
081 089 tOO 1 04 052 (79 063 078 074 052 082 067 045 052 O ~5 071 093 058 056 034 096 059 039 100 041 058 (J 30 075 O6i i (H)
Ii ~6 69 049 095 )48 057 083 a83 037 012 057 080 057 090 i71 082 048 (181 aSl
087 099 100 iOO 060 08( 064 095 071 054 082 065 047
) 64 0 70 lOO 061 055 1) 37 100 058 039 100 042 058 ) 34 053 062 00 048 065 048 096 053 0 67 082 0S (137 092 056 080 057 099 069
049 080 051
Location Too Bottom Totai Volume Quartz DololBite Other WaXiian Modi f ied Depth Depth Porosity of Clay -Silits Archie
mft i (lIft) (frac) (frac ) (frac i frac (frac ) Swt f r ) SHt if r I
4-29-10-29 88200 88400 007 0 17 045 007 030 1 1)0 1 00 88350 38500 O 14 004 044 029 023 073 070 88500 88600 012 009 046 020 025 0Q5 092
26
Appendix 0
Economic Production limit
To obtain the economic production limit for an average Daly Bakken producer set the monthly revenue = monthly expenses as shown (1) P x D x WHP (R x WHP x P X D) + 0
where
equation (1) becomes
P = daily economic production limit D = number of days in one month = 304 WHP = wellhead price = $10300m3 (August88) R = royalties = 15 (015) o = monthly operating cost = $130000
P x 304 x 10300 = (015 x 10300 x P x 304) + 130000
P = 05 m3day 011
27

Petroleum Open File Report POF 9-88
Evaluation of the Daly Field Bakken Formation Southwestern Manitoba
By M Arbez
Manitoba ~ Energy and Mines Petroleum ~
1988
Manitoba (R Energy and Mines Petroleum - J
Petroleum Open File Report POF 9-88
Evaluation of the Daly Field Bakken Formation Southwestern Manitoba
By M Arbez
Winnipeg 1988
Energy and Mines
Han Harold J Neufeld Minister
Charles S Kang Deputy Minister
Energy Divi sio n
H CICHe Moster Assistant Deputy Mini ster
Petroleum Branch L R Dubreuil Director
TABLE OF CONTENTS
Abstract Introduction Methodology
a) Bakken Sand Lithology b) Total Porosity c) Water Saturations
Daly Bakken Pool Descriptions a) Lithology b) Total Porosity c) Total Water Saturation d) Original Oil-In-Place per Unit Area e) Production Decline and Recovery Factor
Conclusions
Recommendations a) Pressure Maintenance b) Data Collection
References Appendix A Clay Volume from Gamma Ray Response Appendix B MID Plot Construction Appendix C Formation Evaluation Results Appendix D Economic Production Limit
FIGURES
Figure 1 Bakken Pools and Wells Figure 2 MID Plot
Figure 3 Neutron-Density Porosity Crossplot
Figure 4 F versus ltIgtr Crossplot Figure 5 Bakken Formation - Daly Field Total Porosity Map Figure 6 Bakken Formation - Daly Field Water Saturation Map Figure 7 Bakken Formation - Daly Field Oil-In-Place per Unit Area Map Figure 8 Daly Bakken A Pool History Plot
TABLE
Page
1 3 5
9 9 9
middot 10 middot 10 middot 10
middot 16
middot 16 middot 16 middot 16
middot 18
middot 19
middot 21
23
27
2
4
6
8
middot 11
middot 12
middot 13 14
Table 1 Reservoir Engineering Properties of the Bakken Formation 15
Abstract
This study Is a petrophysical evaluation of the Bakken sand in the study area (Figure 1) The study includes a description of the methods used to evaluate the Bakken formation as well as the results from these methods
Log analysis techniques have been developed to obtain Bakken porosities and water saturashytions Quick-look porosity estimates are obtained directly from porosity logs A modified Archie equashytion gives fairly reliable water saturation estimates
Introduction
The Bakken formation underlies the Mississippian Lodgepole and unconformably overlies the Devonian Lyleton or Three Forks Formation For more detailed information on the geology of the Bakken sand please refer to the Petroleum Open File Report POF 8-88 The Bakken is productive elsewhere in the Williston Basin notably at Rocanville in southeastern Saskatchewan
In 1985 Newscope Resources Limited discovered the Daly Bakken A Pool by completing the well 13-21-10-29 WPM Further development and exploratory drilling has resulted In the discovery of a number of Bakken pools in the Daly Field The location of these pools and the study area are shown on Figure 1
The Bakken Is a clay-bearing sand Because of this conventional log analysis techniques often result in misleading or erroneous porosity and water saturation calculations This study presents a reliable and effective Bakken formation evaluation method using production core and open-hole log data
Methodology
a) Bakken Sand Lithology
I) Mineralogy
The Bakken formation is a very fine-grained quartz sandstone The most abundant intergranular mineral is dolomite in the form of microcrystalline fines andor cement Dolomite cement helps lithify the rock but reduces formation porosity Feldspars (potassium feldspar and plagioclase) and iillte clay are also present in the Bakken sand Illite generally occurs as a low relief clay which binds dolomite fines to larger grains and bridges and infills intergranular pore space
il) Log Lithology Model
The LDT or litho-density tool is a relatively new and expanded version of the compensated density log In addition to measuring the formation bulk density the LDT also records the formation photoelectric absorption cross-section index Pe(6) middot Because Pe primarily reflects mineralogy the LDT is a good lithology indicator
Quantitative Bakken clay volumes were obtained from special core analyses of samples from the well 9-14-10-29 WPM These clay volumes were matched with gamma ray log readings to
reference listed at end of report
o
m o ci ~ ~
co o a ~ ~
-~t I
r-r- 1-- I iii I 0 1 60E
Rge 29w 1
-r--Y-l
-6 - ~- )
I _ I-
- -
1 I
_ L _
J1 __
Rge 28w 1
Figure 1 Bakken Pools and Wells
2
Rge 27w 1
derive a clay volume to radioactivity correlaton (see Appendix A) This correlation Is applied throughout the study to calculate illite clay volumes for the Bakken formation
Figure 2 shows a Matrix Identification (MID) plot The MID plot is used to Identify lithology from LOT data The apparent matrix density vYmaa) Is plotted along the Y axis The apparent matrix volumetric cross-section (Umaa) is plotted along the X axis Both Pmaa and Umaa are derived from the bulk density and photoelectric absorption Index from the LOT log (see Appendix B)
Uma and Pma data for some common minerals can be obtained from the IIterature(3) The table below lists Uma and Pma values for three of the four minerals from the Bakken lithology model
Mineral Uma Pma -- --quartz 4 78 264
dolomite 900 288
illite 1180 306
Because the fourth component of the model is a complex feldspar mineral assemblage its Uma and Pma values are not readily available from the literature By combining special core analysis data with simple material balance the Uma and Pma parameters for feldspar were estimated to be 1506 and 265 respectively (see Appendix B)
The MID plot in Figure 2 can be used to estimate the percentages of quartz dolomite and feldspar for the Bakken sand The procedure is as follows
1) obtain Vcl ay (clay volume) from gamma ray log (see Appendix A)
2) calculate Pmaa Umaa (see Appendix B)
3) locate point on MID plot
4) apply Vclay correction along a line joining illite clay point and point of interest
5) read quartz dolomite and feldspar percentages at clay-corrected point
The MID plot should only be used to obtain rough estimates of mineral percentages for the Bakken sand Many factors can affect the accuracy of the MID plot For example radioactive feldspars increase the gamma ray response Consequently calculated clay volumes are too high and the clay correction to the MID plot is too severe The Bakken sand contains potassium feldspars which can adversely affect MID plot results
b) Total Porosity
All Bakken core samples in the study area have been dried in conventional ovens before porosity determination Clay-bound water is evaporated under the quick-drying conditions of a conventionshyal oven Because the Bakken Is a clay-bearing sand all available core-measured porosities are equivalent to total porosities (flr To obtain effective porosities core samples must be dried in humidity-controlled ovens which do not drive off clay-bound water
By depth-adjusting Bakken core data to log traces the following core bulk density ipb core) to log bulk density ipb log) correlation is obtained
3
-
aj aj
E a
24
25
26
27
28
2 9
30
Quartz (478264) )- 7 X 7 7 7 ~t 7 Feldspars (1506 265)
bC V
Dolomite (900288)
beC
~C ~e
tOC oO~ ~Q
Illite Clay ( 118306)
Definitions
L = length of line from cia y point to point A
Lclean = length of line from clay point to point A
A= uncorrected pmaaUmaa
A= clay-corrected pmaaUmaa
SamRle Calculation
point A pmaa 275 Umaa 90 Vclay 10
Lclean= Lx100 L J=862cm 100-Vclay
Lclean = 8 62x 100- 9S8cm 100-10 (point A)
311 I I I I I I I I I I o 2 4 6 8 10 12 14 16 18 20
Umaa
Figure 2 MID Plot
(1) Pb core = ~b log + 0252) 1 111
Pin gmcm3
The log bulk density Is a function of the (density) porosity as shown in the equation
(2) Pb log = (Ilo + (l -ltllo) x 271 ltflo in fraction limestone scale (6)
rearranging (2) we get a corrected density porosity
(3) (Ilo corr = (271 - Pb core)
171
ltfgto corr in fraction limestone scale
Figure 3 is a ltPo corr versus lt11N crossplot for the Bakken sand in the study area The following procedure was used to develop this crossplot
1) depth-adjust core porosities to log porosity traces
2) plot (Jo corr and lt[IN (point A)
3) locate lt[lcore or ltM along diagonal or clean sand line (point A)
4) join A to A
5) calculate slope of line in (4) ((Jo corr(11N or total porosity slope)
These steps were followed for a number of core intervals A total porosity to log porosity correlation was derived
(4) (IJr ((110 corr + (0095 X (flN )
1095
c) Water Saturations
i) Choice of Water Saturation Models
(ll in percentage limestone scale
The Waxman-Smits shaly sand model(l) has been selected to calculate water saturations for the Bakken formation A modified version of the Archie equation is also used to calculate saturations The empirical Archie equation with a = 1 and m = 2 is not well suited to clay-bearing sands like the Bakken
The Waxman-Smits model assumes that an electrical current through a clay-bearing sand will flow along a parallel conductance path Part of the current flows through the brine solution within the pore system The remainder of the current Hows through a cation-rich layer of water bound to the clay
The Waxman-Smits model was developed on the premise that the suppression of resistivity by water-bearing clays is a function of the cation exchange capacity (CEC) of the clays Different clay types have different CECs Special core analyses on clay-rich samples usually yield reliable CEC values No such analyses are available for the Bakken sand The literature(1) offers lists of typical CEC values associated with different clay types
The Bakken contains Illite clay The CEC for illite usually ranges from 02 to 03 megg A CEC of 025 Is used in this study
5
30
25 Ql
i 0 en Ql c 0 (ij
Clean Sand Line Ql 20 r ~ ~
0 0
A (1515) ~ 15r I
gt-t ()
0 ~
en o 10 (l
gt-t ()
z w 0 0 w 5 t-U W ~ ~ 0 u
0
Total Porosity Lines -51 I I I I I II
o 5 10 15 -- -- --
NEUTRON POROSITY- ltliN (lmestone scale)
Figure 3 Neutron -Density Porosity Crosspot
II) Swt from Waxman-Smits Model
The Waxman-Smits equation can be written in the form
5) Ct = Cwt n + BOvSwtn-1
F F
where Ct Is the formation conductivity
Cw is the formation water conductivity
B Is the conductance of the clay exchange cations
Ov Is the cation concentration per unit volume of fluid in pore space
F Is the Waxman-Smits formation factor
Swt Is the total water saturation including clay-bound water
Ct = Rt from deep resistivity log trace
Rt
Cw = 1 = 1 = 20 ohm-meters ---Rw 005
Rw = 005 ohm-meters from produced Bakken water at t 31degC
B = -1 28 + 225t - 0004059t2 = 516
1 + Rw 123 (0045 t - 27)
Ov = CEC (Pflr) Pma = 025 (1-cfT) Pma
cll
F = F (1 + RwBOv)
To obtain F plot F RoRw versus cflr (log-log plot) for wet Bakken sand intervals (see Figure 4)
If n = 2 in equation (5) the Waxman-Smits equation can be solved as a simple quadratic
(6) X = -bplusmn (b2 _ 4ac) 5 (1)
where
2a
X = Swt
a = CwF
b = B OvF
c = -Ct
iii) Swt from Archie Equation
From Figure 4 10glOF = 00098743 - 174 IOg10 cl~ the slope m = -1 74 and a or the y-intercept = 1023 (cflr = 100) The parameters a and m are used in the Archie water saturation equation
7
1000 900 800 700
600
500
400
300
200
100 90 80 70 60
50 -~ a 0 a -u
40
30
20
10 9 8 7
6
5
4
3
2
02
slopem=174
y intercept at 0 T =10=1023
03 04 05 07 09 23 4 56 789 10 06 08 1
Total Porosity-(2JT (fraction)
Figure 4 F versus (Igtr Crosspot
8
The Archie equation for the Bakken sand in the study area can be written as
(7) Swt n = a Rw (IgtTmRt
where n =20
a = 1023 m = 174 Rw = 005
Archie water saturations were calculated for the Daly Bakken sand
A modlfed version of equation (7) yields accurate quick-look results
(8) Swt = (aRw(j)Dm Rt) 05
132
Daly Bakken Pool Descriptions
Each of the designated Bakken pools have been analysed in detail for lithology porosity water saturation original oil-In-place per unit area and estimated primary recovery Calculations were made on well data available to September 1 1988 Appendix C lists these results
a) Lithology
MID plot calculations consistently show that the Bakken in the study area is a feldspathic dolomitic clay-bearing sandstone Core descriptions confer with these log-derived results The litho-density log is a reliable lithology indicator for the Bakken sand
b) Total Porosity (see Figure 5)
A Pool Porosities range from 13 to 23 and average 17 The best porosity development Is In the central portion of the pool at the locations 16-20 13-21 2-28 3-28 4-28 all in Township 10 Range 29 WPM Porosities drop off rapidly to the west away from the centre of the pool
B Pool (includes F Pool) Porosities range from 13 to 19 and average 16 Because of their narrow range porosities were not contoured
0 Pool Porosities range from 9 to 21 and average 18 The highest porosities occur near the eastern edge of the pool (12-13 9-14 and 16-14 Township 10 Range 29 WPM) Porosities decrease quickly to the west Lack of data at the east side of the pool limits contouring of porosity data
9
c) Total Water Saturation (see Figure 6)
A Pool The average water saturation Is 45 Saturation conlstently rmqe from l0 to 40 In the middle of the pool and Increase to the west which Is downdlp from the centre of the pool
B Pool (Includes F Pool) Water saturations do not vary appreciably The average saturation Is 54
D Pool The average water saturation at the eastern edge of the pool Is 33 Saturations inshycrease sharply on the west side of the pool
d) Original Oil-in-Place per Unit Area (see Figure 7)
Table 1 lists reservoir properties for the Daly Bakken A B and D Pools The shrinkage factor (1Bol) was obtained from a PVT analysis on the well 3-28-10-29 WPM
A Pool The total oll-In-place for this pool Is calculated to be 1 123 180 m3 Most all appears to be trapped In the geographic centre of the pool The west side of the pool Is probably limited by a downdlp water zone The north south and east sides of the pool exhibit rapid decreases In net pay thickness There appears to be a limited amount of future drilling potential
B Pool (Includes F Pool) The oil-In-place for this pool is calculated to be 492 043 m3 The edge of the pool Is difficult to define because of the lack of data to the north and south
D Pool The oil-In-place for this pool Is calculated to be 231 000 m3 The edge of the pool Is loosely defined
e) Production Decline and Recovery Factor
The lower economic limit for oil production Is assumed to be 05 m3 per day per well for all three Bakken pools (see Appendix D)
A Pool A primary recovery factor of 71 was estimated from an annual production decline of 20 The decline was obtained over a period of time when the pool was not being actively developed (Dec86 - June87) (see Figure 8) The ultimate recoverable reserves are 80 631 m3 all
B Pool (Includes F Pool) A very low primary recovery factor of 10 was calculated for this pool B Pool oil production Is very erratic with time Overall production from the pool Is declinshying quite rapidly Assuming an annual decline of 42 (based on production from 12-29) the ulshytimate recoverable reserves are 4 174m3 all Many of the wells In this pool have been recompleted to the overlying Lodgepole formation because of uneconomic Bakken production
D Pool A recovery factor of 11 was calculated based on an annual decline of 24 for the well 15-11-10-29 WPM A decline rate could not be estimated for the pool as a whole because of active development throughout its production history The ultimate recoverable reserves are 25 742 m3
oil
10
middot~i)k(JMi~~O-raquomiddot][ampdHi~~f __ ~~
bull ~secti
~1
0 ~ ~ A--
r-- 4 ~
z laquo ~
1
~~ () Eshylaquo
~
~ ill () t~i---
bull
bull 1 1
bull Kola
bull I ltIgt
Rge 29w1 Rge28w1
bull
I ~ ~ bullbull B Pool ~l r ~poundfeEwgt~~~~17~--~i~~~~0~-or~ ~~1~
If - - - - - -- -_ ~~ = b=poundf= r ~ - -~ ---1 =- ~~1 T 1 17 15 17 13 17 Y
[1 bullbull bull bullbull
rE~i~$i~~
ie ~
~~~ tJ
19 15 fpound 18 16 bullbull 1 +14 W~~
bull 13 13 euroll bull ~~ f bull middot ~_jMill1l$i bullbull ~1~middot---
bull
- -- (I) I bull bull bull bull 16
+ 11 1 bull bull ltIgt bull bull bull 1 ___ __ _ _
bull bull bull
bull bull bull 1 bull bull
bull ltIgt bull CLAYmiddot
12 bull bull bull -- ---
bull bull 11
bull bull
bull bull
16
~ ~ ~ bull bull 18 lt1gt14 bull --- lt1gt12---- - ---
bull I
bull bull bull
bull
bull + ~
bull bull bull
bull bull bull bull bull Bakken Formation-Daly Field
Total Porosity Map
Contour Intral 2 Y bull
Figure 5 Bakken Formation - Daly Field Total Porosity Map
N
Rge29w1
r-~~ r7l __ ~ ~ t~
00 - II g ill
bull J-ill
2 ~ Q ~ __ so ~ z L- ~( --- r
0~~ ~
bull
bull
bull Ko la
II agt
bull
II BAKKEN OIL WELLS
bull
bull
M
If ~ bullbullbullbullbull ~~~ bullbullbull dlmiddot _- bull
II
agt1
1
00 33
bull Il Il ~o 100 ~001l 32 []
WmiddotI +46 bull
-tagt bull bull __ _ __ _------
bull bull bull
bull bull i 1
bull bull
bull bull bull LODGEPOLE OL WELLS
Rge28w1
+
~H~~(~~~~~
bull bull bull I bull Iagt bull bullbull I agt
bull
bull
bull 1 1gtshy bull _ __ _----- +---
bull bull I bull bull bull bull bull bull bull bull bull
Bakken Formation-Daly Field Water Saturation Map
Contour Intrval 10-bull
Figure 6 Bakken Formation - Daly Field Water Saturation Map
()
Rge 29w1
~
~ bull
~t
0 -__1 r-
$( - ~
bull bull 1 bull 1
III bull Il BAKKEN OIL WELLS
Rge 28w1
~~-M 1 I B Pool
I middoti~ x fl
~
0 Pool
Il
CDI Il bull I bull 23 07
1 bull bull I CD bull bull bull
bull bull bull bull
bull bull 1 -
bull LODGEPOLE OIL WELLS
bull CD
bull bull bullbull bull bull
bull bull bull
~ g~iiil bull
bull bull I CD
CD
bull bullbullbull
bull + ~ bull -t -------- ------t---- - ---
bull bull I bull bull bull bull bull bull bull bull
bull bull bull bull bull bull Bakken Formation-Daly Field OIl-ill-Place per unit Area Map
Contour Intrval 0 m3 m 2
Figure 7 Bakken Formation - Daly Field Oil-in-Place per Unit Area Map
100 r
or 80
70
60
50
~ 40
30
20
10
o
0 0 0 -0
0 0 0 I)
o o o
o o I)
o o
o I)
o
~-
1985 L-_____ MONTHLY OIL - m3 M
WELL COUNT
1986 19 8 7
Figure 8 Daly Bakken A Pool History Plot
198 8
WOR-----
100
50
10
5
05
01
01
POOL General Information
1 Year of Discovery 2 Number of wells a) capable of oil production
b) produced first half of 88 c) previous producers
3 Spacing 4 Average Depth of Producing Zone 5 Crude Oil Quality a) density
b) sulphur content
BAKKEN A BAKKEN B
1985 1986 19 6 17 6 o 0
16 ha 16 ha -340 m(subsea elev) NA 7764 kgm3 7764 kgm3
013
BAKKEN 0
1986 7 7 o
16 ha NA
7764 kgm3
6 Initial Pressure (at datum) 8500 kPa 7716 kPa 7900 kPa (3) 7 Current Pressure (at datum) 4000 - 6 000 kPa NA NA 8 Recovery Mechanism ---------------------------- low energy natural water drive -------------------
Reserves Information 1 Production Area 2 Net Pay 3 Porosity (Or) 4 Connate Water Saturation (Sm) 5 Shrinking Factor (1Boi) 6 Original oil-in-place 7 Recovery Factor 8 Ultimate Recoverable Reserves 9 Cummulative Production (to Sept 30 1988)
10 Remaining Recoverable Reserves (Sept 30 1988)
(1) 20 annual production decline for pool (2) 42 annual production decline from 12-29-10-28 (WPM) (3) DSTs show dramatic pressure drop
853 ha 16 m
170 450 0893
1 125180 m3
71 (1) 80631 m3
27539 m3
53092 m3
(4) 24 annual production decline from the well 15-11-10-29 (WPM)
Trap Type (For all pools) 1 Primarily stratigraphie (related to the lateral pinch-out of the Middle Member)
424 ha 18 m
160 540 0893
492043 m3
10 (2) 4174 m3
4216 m3
2 Secondary structural (related to minor structural elevation on top of the Middle Member)
Table 1 Reservoir Engineering Properties of the Bakken Formation
196 ha 11 m
180 330 0893
231000 m3
110(4) 25742 m3
5759 m3
19983 m3
Conclusions
1) The Waxman-Smits equation has been successfully used to derive total water saturations for the Bakken sand In the Daly area This approach Involves a number of complex empirical and derived equations and cannot be used as a quick-look method of calculating total water saturashytions
2) A modified form of the Archie equation using log density porosities [equation (8) I yields total water saturations which almost mimic those obtained from the Waxman-Smits equation This provides a simple way of calculating the total water saturation for the Bakken formation If the calculation Is done on a Bakken Interval In Daly Rw = 005 ohm-meters When evaluating the Bakken outside the study area Rw should be obtained from temperature-corrected water analyses on produced water
3) Many Daly wells produce at extremely low water cuts yet their total water saturations are fairly high (gt30) These apparently high irreduceable saturations along with relatively low log resisshytivity measurements Indicate that the Bakken is strongly water-wet A strongly water-wet rock produces more efficiently under waterflood conditions than does an oil-wet rock
4) Based on petrophysical data It appears that there are some limited future development posshysibilities within existing Bakken Pools of the Daly Field Development locations proposed within these pools are listed below A Pool 1-20-10-29 WPM 5-29-10-29 WPM B Pool 12-30-10-28 WPM 5-30-10-28 WPM 6-30-10-28 WPM D Pool 2-23-10-29 WPM
Recommendations
a) Pressure Maintenance
Reservoir pressure and production data Indicates that the Daly Bakken formation Is being effected by a very low energy recovery mechanism Over a production period of two years there has been a substantial drop In the production rate reflecting a decline In reservoir pressures In the Bakken A Pool Due to the lack of data the pressure drop has not been quantified for other Bakken pools All Bakken pools have shown rapid production declines
It Is evident that a pressure maintenance scheme such as waterflooding is necessary to maxishymize the economically recoverable reserves in the Bakken However illite and dolomite fines are abundant In the Bakken sand Migrating illite and dolomite fines can clog pore throats between sand grains and reduce permeability If water injection pressures are too high or if fluids are produced at unrestricted rates a fines migration problem can be initiated Some of the dolomite fines appear to be lodged within the illite clays If these clays are dlsolved by Injection water an even greater migration problem can develop Water compatibility tests would indicate which fluids dissolve illite clay andor react with dolomite Laboratory tests should be conducted in order to establish the benefits of dissolving Illite clays to increase permeability taking Into account the increased fine migration problem associated with clay dissolution
b) Data Collection
The following shopping list could lead to a more accurate and meaningful formation evaluation of the Bakken sand
16
1) Conduct humidity-controlled and conventionally-dried core analyses on a Bakken core Effecshytive porosities are obtained from humidity-dried core total porosities are obtained from conshyventionally-dried core Data from both types of anaiyses can also be used to estimate formashytion cation exchange capacity (CEC)
2) More special core analysis work would result in a more reliable clay volume to gamma ray correlation for the Bakken (ie X-Ray diffraction and Scanning Electron Microscopy)
3) Meaningful Bakken formation water resistivities (Rw) can be measured from samples of produced water Drill stem test water samples are often contaminated by drilling mud filtrate which has invaded the formation
17
References
1) Berry WR
1983 Modern Shaly Sand Log Analysis
2) Core Laboratories Inc
1988 Petrographic Analysis for The Manitoba Oil and Gas Corporation MOGC Daly 9-14-10-29 WPM
3) Core Laboratories Inc
1982 Special Core Analysis p v-17
4)Dowell Schlumberger Canada
1986 Formation Analysis Report for Newscope Resources Limited 4-28-10-29 WPM and 1-29-10-29 WPM Bakken Formation
5) Helander DP
1971 Oil and Gas Consultants International Inc Formation Evaluation Manual
6) Schlumberger Educational Services
1987 Schlumberger Log Interpretation PrinciplesApplications
18
Appendix A
Clay Volume from Gamma Ray Response
--~ 0
850 (
(
~
~ Igt -- JJ
II v U I--
-
c 1 b V- ~ 1-_
fit I-No1 ( J
~ No1 P ( - Nn 12 ) --
lt ~ - 1
J
~ I
) C 1--
GR ~ ) 1- 1 ~ ~ CNL
- - Porosi ( 1----
Pet ~ -1(
I - i I I I
Compensated Neutron-Llthodensity Log for 9-14-10-29 WPM
From SEM(1) - Log Correlation
Sample No core depth (m Kb)
14 85910-85919
16 85930-85942
22 86031 ~86041
illite
18
9
30
V I~
~ t-
F F0-
tgt It
e--I--~
lt lt ) )
lt
tv gt -
~C ----gt
D
0
-
em ity Po osi tv
0 0
Gamma Ray (API)(2)
80
75 85
Gamma ray versus percentage illite was plotted on a log-log grid (Figure A-1) and a correlation was establ ished
log1Q (Vclay) = (log1o(GR)-1776)0l033 Vclay in
(1) Scanning Electron Microscope
(2) Repeat run used
19
GR in API units
I) o
o r
lffL_~ __ _ 60
a 50 laquo -gt 40 ra
cr ra E 30 E ra
20
091O(VcaY)~(I091O(GR)_1776) 01033
101r~~~~~~-----LL1 2 3 4 5 6 7 8 9 10
Illite Clay
(Figure A -1 )
20 30 40 50 60 70 8090100
Appendix B
MID Plot Construction
1----- 8~O c
i
(
c ) -
f l--
-c [
I-- I
If ( ~
(
) lt -
l I(
l 1- (
~ r
C --GR ~ r--
tr ~ Ill-L- ~
r 1 -I-
Pe -rl 0- It
l - i I I
Compensated Neutron-Lithodenslty Log for 9-14-10-29 WPM
X-Ray Diffraction Results for Sample No 169-14-10-29 WPM
core porosity 21 3
minerai percentages quartz = 64 K-feldspar = 10 plagioclase = 4 dolomite = 13 illite = 9
Log Response at Sample No 16
Pe = 25 barnselectron ltfN = 21 5 (limestone scale) lt1gt0 = 205 (limestone scale)
Pb log = (flo + (1-lt1gt0) x 271 = 205 + (1 - 205) x 271 = 236
Pb core (Pb log + 252)1111 (236 + 252)1111 235
21
~
~ -
-)
- - ~ ~ v r---
D gt 1-- e-
~
-f--- Sam Ie 6 -- ---
Ie lt ~ b I)
(
CNL Po osi ~y P
r--lt [ ens ity Po psi Iy
f- -
gt ~- 6P b
(10 corr == (271 - Pb core)1 71 == (271 - 235)171 == 0211
(11 == [(1)0 corr + (095 x PN)]1095 == [0 211 + (0 95 x 0215)]1 095 == 0211 (porosity from Core Labs == 0213)
Pmaa == Pb core - ltfTPFL = 235 - (0211 X 10) = 271
(1 - ltrr) (1 -0211 )
Pe == Pb core + 01883 (235 + 01883) = 237 ------
10704 10704
Umaa PeDe - rfTUFL == (25 X 237) - (0211 X 398) = 740
where
(1-(lrr) (1-0211)
P = matrix density P = fraction q == quartz d == dolomite i == illite F == feldspar
271 == (264 X 064) + (288 X 013) + (306 x 009) + (PF x 014)
PF == 265
where U == matrix volumetric cross section P == fraction
740 == (478 x 0 64) + (900 x 0 13) + (1180 x 009) + (UF x 014)
UF == 1506
We now have the three MID plot points for our Bakken quartz-dolomite-feldspar (+ illite) model Mineral Pma Uma -----quartz 2 64 478 (known)
dolomite 288 900 (known)
feldspar 2 65 1506
illite 3 06 1180 (known)
MiD plot shown in Figure 2 of study
22
Lout i on
7-30-11)-28 10-30-10-28 11-30-10-28 5-2-10-29
11-11-10-29
9-20-11)-29
10-21-10-29
11-21-10-29
12-21-10-29
13-21-1 0-29
14-21 - 10-29
1-22-10-29
1-23-10-29
9lt5-10-29
2-28-11)-29
3-28-10-29
4-28-10-29
5-28-10-29
6-28-10-29
7-8-10-29
11-28-10-29
1-29- 10-29
8-29-1(1-29
9-29-10-n
a-30-10-29
Too Deoth
ISIft)
81400 81500 81540 87700 88020 86250 86520 88300 88700 86940 87400 87350 87750 87500 88000 875 00 87BOO 86700 871 00 85980 86300 85000 85300 81900 82200 86070 86400 86780 87 1 01) 874 00 87700 86900 87280 86400 86750 85900 36240 86060 86450 87950 883 00 86950 87350 864 00 86800 881 )0 884 )0
Appendix C
Formation Evaluation Results
aottOil lJepth
(lI fti
81600 81850 81700 87880 88180 86400 86630 88500 88930 871 30 87600 87500 88000 877 00 882 00 87600 88050 86870 87220 861 50 86400 85300 85520 821 00 82300 86260 86560 86960 87310 87500 87900 87000 87400 86550 86900 86060 86400 86250 86750 881 00 88520 872 00 876 00 86600 8701)0 88250 886 )1)
Total Volue Quartz Dolomite Porosity of Clay (frac) Ifrac) (f rac) Ifrac)
018 015 017 009 015 007 011 O II 016 010 018 012 015 010 015 012 022 010 019 009 015 012 I) 14 019 (1 11 012 023 O 0 020 0 10 0 21 010 021 01 t 019 012 013 o Il 0 19 010 014 O 1 ) 018 II ij V J
019 011 O 7
23
012 009 027 005 003 1 00 005 019 004 001 0 01 031 005 009 005 009 003 004 004 034 009 053 002 048 009 005 001 ) 05 000 007 0 01 005 003 009 000 O i3 001 001 001 024 00 4 (ilj9
J OS ( 09 005 (1 09 002
065 055
040 053 050 036 055
045
044 048 037 038
035
047
047 040 049 041 042 1)39
050 034 u49 047 046 049 j44 044 042
045 044 049 046 047 043 043
011 017
024 002 027 033 030
026
018 027 029 027
017
025
024 028 031 027 031 024 031 025 027 019 029 (112 032 033 030
~) 27 019 ) I t O lr 026 020 029
Otner ~a X~ dn Mooified -SlIi ts Archie
(fracl Swt (ir ) SHt (fr i
012 019
032 025 019 030 015
024
029 022 030 032
039
025
O2i 028 (1 19 027
030 0 18 036 021 026 024 025 024 02~
026
1)24 i) ~8
026 025 0i3 028 0 26
038 055 052 100 048 1 00 046 097 050 093 038 084 045 (0 058 074 031 (1 92 035 l OO 058 073 0 gt33 i) 54 100 1) 83 030 id4 029 099 032 095 046 1 80 031 080 055 085 044 093 063 i 0 1 V 1 1
047 O BO 046 087 047
0 40 056 Umiddot c bull J i
10(1 049 1 )1
055 096 O5l 094 040 030 048 100 057 073 033 O ~4 038 1 00 057 070 040 02 1 00 083
088 033 1 00 0 34 094 044 080 034 080 058 083 044 O ~4
093
080 046 Ci 89 047
Location Too Depth
[1Ift)
BortolD Depth
(11 ft)
13-6-9-27 82860 83020 7-30-9-27 86000 86230 13-31-9-27 80800 81050 2-2-9-28 851 60 85500
85600 85800 14-13-9-28 dual lilt 81500 81620 4-18-9-28 90370 90600
90700 q08DO 2-23-9-28 83000 83150
83150 93300 13-26-9-28 B1880 82200 5-36-9-28 80940 81270 12-5-9-29 95400 95550
95780 95970 5-15-9-29 91900 92000 1-16-9-29 92200 92450
93000 93100 11)-16-9-29 92050 92300
92600 92720 1-21-9-29 91560 91650
92100 92200 8-29-9-29 90900 91050
915 50 91700 6-33-9-29 90040 90350
90500 90600 11-35-9-29 88200 88380
88500 98600 10-7-10-27 258800 259400 7-18-1 0-27 dual lat 55800 256400
2568 00 257200 11-19-10-27 257600 258300 12-9-10-28 92960 83100
83200 83370 10a-12-10-28 254400 255400 13-16-1 0-28 81880 82010 15-18-10-28 83000 83100 13-20-10-28 80780 80900
1-21-10-28
4-22-10-28
5-29-10-28 7-29-10-28 10-29 -10-28
~ 1-29-[ )-28 12-29-10-28
81100 81200 81530 B1800 81050 81550 90900 80950 81UO 81320 81301) 81300 81500
81770 81900 81200 817 00 81200 8120 81260 81500 81670 815 1)0 816(10
Total Volu~e Q~artz Dolomite Porosity of Clay (frac) [frac i (frac) frac)
016 010 012 011 012 O 11 009 012 O 11 013 ( 15 012 012 016 015 015 013 013 013 012 015 011 014 010 Oli O 11 015 002 016 Ij22
009 0i5 011) 012 011 01i) 014 010 018 01 (1 014 016 015 (I 17 ) 15 013 1)16 ( 18
24
005 017 000 019 001 053 053 006 053 009 009 100 031 009 006 009 001 017 001 1 00 001 017 002 022 0()9 009 006 1 00 007 031 t (10
100 009 ) 31 100 100 073 005 bull (1)
031 005 01)4
) 05 01)1
100 () 2~ 031 134 031
047
048 039
055 044
033 027
043 050 041
043 050
046
023 048 046 056
052
005
001 036
021 023
006 036
0 32 005 034
020 022
024
021 027 024 017
006
Otner ~ax~an Modified -Slits Archie
(frac) 5101t (fr) Swt ifrl
059 031 083
087 032 077 024 097
078 1 00
080 084 069 056 080 054
015 037 027 04 1
0 56 063
044 057 036 055
079 024 049 028 072 023 Ij49
091 07
028 082 022 059
047 (J24
11)0 059 095 074 081 076
024 062
O 5t 021 025 017
~J 32
1)79 038 093 043 056 ~) 48 055 060 069
056
058 087 086 078 094 078 100 080 088 ) 69 055 080 060 042 046 0~7
067 062 061 080 0~2
O i7 054 094 078 084 058
049 027
OO 058 097 073 083 082 062 082 41 1)90 J 48
055 1)51 053 058 067 i c- )~i
053
~ocation Tao Depth
lQ f t)
[-20-9-28 86500 15-12-9-29 iOB 00
90260 3-13-9-29 90200
90530 3-3i-9-29 91750
92000 3-34-9-29 89200 11-9-10-28 83100
83300 3-19-10-28 82700 7-20-10-28 81000 12-20-10-28 81200 13-21-10-28 dual lat 80400 6-28-10-28 81350 3-29-10-28 80880 4-2-10-29 87800
881 00 15-11-10-29 85850 12-13-10-29 85950 7-14-10-29 85560 9-l4-10-29 85600
85900 14-14-10-29 85100 15 -1 4-l0-29 85600 16-14-1 0-29 86lO0
86200 7-[0-10-29 88280
88600 14-16-(1)-29 il83 50
88650 16-17-10-29 90600
911 00 8-20-10-29 88480
88900 15-20 -10-29 87900
88200 16-20-10-29 87B00
88 1 50 5-21- 10-29 87400
88400 16-21 -10lt9 86100
865 1)0 2-25-10-29 82800
3-27-10-n
12-28-10-29
831 00 85750 861 Or) 86400 86800
8ottoll Deoth
(adU
86660 90920 90400 90320 90670 919 00 92200 89380 83240 8~480
82860 81350 81400 80730 81700 811 80 87950 88200 861 90 861 00 86000 85700 86030 85250 85730 86200 8b330 88460 88700 88500 38730 90820 91300 88660 891 00 88030 88300 88000 983~0
67600 8850( 86380 86660 82930 83200 85950 8620 86500 871 00
Total Volume Quartz Dolomite Other Wax Ian Modified Porosity of Clay -S~jts ~rchie
(frac) (frac) (frac) (frac) (frac) Swt (Ir) Sl4t (fr I
0 10 009 009 007 012 012 013 008 013 014 012 014 016 016 014 013 009 013 016 018 010 015 021 009 017 015 019 (j I (J
013 007 015 015 018 010 013 0 II 013 011
O 1 ~ 015 011 015 009 ) 13 )11 016 011 016
25
053 001 053 000 001 015 005 012 000 007 1 00
005 002 004 099 000 012 010 1 00 100 017 aOl 013 022 1 00 009 009 ) )8
048 O I) S (11)9
002 ( 08 001 053 1)27 0 )6 O i) I 004 005 005
000 i) 53 ) U9 (103 004 003
043
035 030 044 045 036 032 033
047 0 51 045
030 052 051
057 055 037
058 037 0 54
OSt 049 tJ 52 048 045
041 05) 034 043 0 39 046 032
)37 029 041 045
035
O 32
009 027 012 033 018
023 028 027
035 012 014
0 05 027 012
015 018 O 8
) 17 I) ~9
(122
031
031 02 024 026 032 O bull 35
017 026
021
033 036 031 023 040 035 0 42
025 0 18 024
035 024 025
I) 17 038
018 036 ) 2)
026 025 017 022 024
030 0117 033 027 030 i)21 034
037 042 028 025
081 089 tOO 1 04 052 (79 063 078 074 052 082 067 045 052 O ~5 071 093 058 056 034 096 059 039 100 041 058 (J 30 075 O6i i (H)
Ii ~6 69 049 095 )48 057 083 a83 037 012 057 080 057 090 i71 082 048 (181 aSl
087 099 100 iOO 060 08( 064 095 071 054 082 065 047
) 64 0 70 lOO 061 055 1) 37 100 058 039 100 042 058 ) 34 053 062 00 048 065 048 096 053 0 67 082 0S (137 092 056 080 057 099 069
049 080 051
Location Too Bottom Totai Volume Quartz DololBite Other WaXiian Modi f ied Depth Depth Porosity of Clay -Silits Archie
mft i (lIft) (frac) (frac ) (frac i frac (frac ) Swt f r ) SHt if r I
4-29-10-29 88200 88400 007 0 17 045 007 030 1 1)0 1 00 88350 38500 O 14 004 044 029 023 073 070 88500 88600 012 009 046 020 025 0Q5 092
26
Appendix 0
Economic Production limit
To obtain the economic production limit for an average Daly Bakken producer set the monthly revenue = monthly expenses as shown (1) P x D x WHP (R x WHP x P X D) + 0
where
equation (1) becomes
P = daily economic production limit D = number of days in one month = 304 WHP = wellhead price = $10300m3 (August88) R = royalties = 15 (015) o = monthly operating cost = $130000
P x 304 x 10300 = (015 x 10300 x P x 304) + 130000
P = 05 m3day 011
27
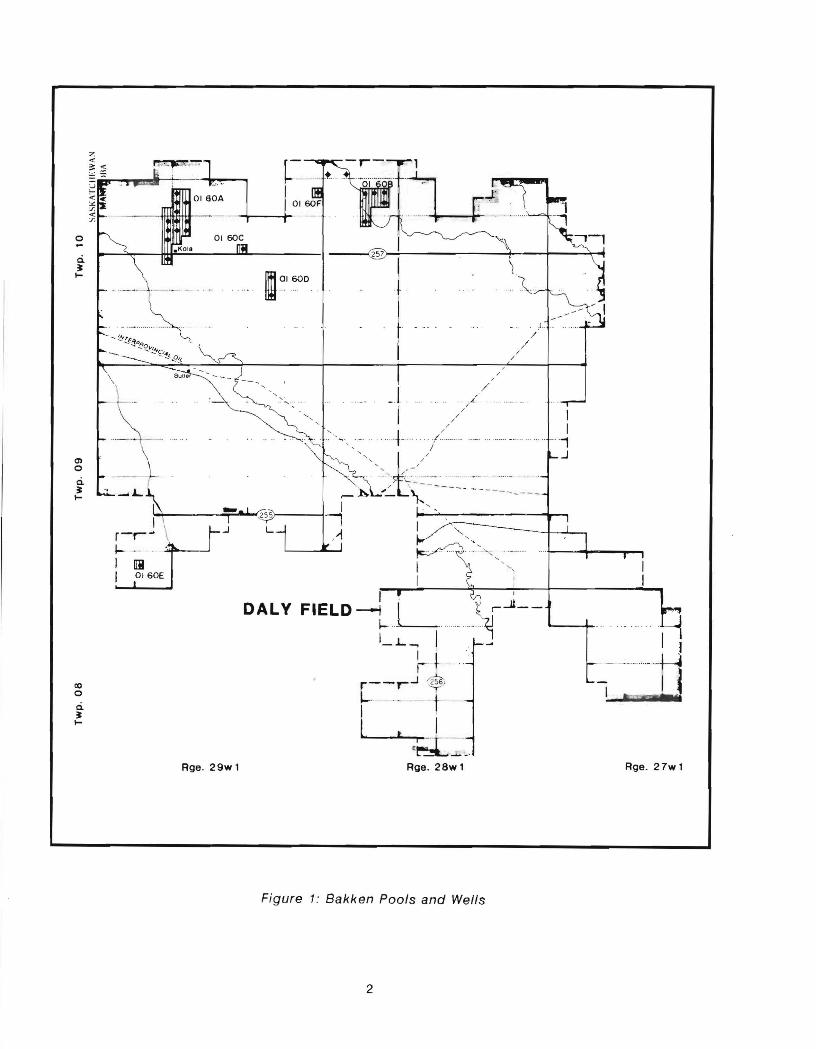
o
m o ci ~ ~
co o a ~ ~
-~t I
r-r- 1-- I iii I 0 1 60E
Rge 29w 1
-r--Y-l
-6 - ~- )
I _ I-
- -
1 I
_ L _
J1 __
Rge 28w 1
Figure 1 Bakken Pools and Wells
2
Rge 27w 1
derive a clay volume to radioactivity correlaton (see Appendix A) This correlation Is applied throughout the study to calculate illite clay volumes for the Bakken formation
Figure 2 shows a Matrix Identification (MID) plot The MID plot is used to Identify lithology from LOT data The apparent matrix density vYmaa) Is plotted along the Y axis The apparent matrix volumetric cross-section (Umaa) is plotted along the X axis Both Pmaa and Umaa are derived from the bulk density and photoelectric absorption Index from the LOT log (see Appendix B)
Uma and Pma data for some common minerals can be obtained from the IIterature(3) The table below lists Uma and Pma values for three of the four minerals from the Bakken lithology model
Mineral Uma Pma -- --quartz 4 78 264
dolomite 900 288
illite 1180 306
Because the fourth component of the model is a complex feldspar mineral assemblage its Uma and Pma values are not readily available from the literature By combining special core analysis data with simple material balance the Uma and Pma parameters for feldspar were estimated to be 1506 and 265 respectively (see Appendix B)
The MID plot in Figure 2 can be used to estimate the percentages of quartz dolomite and feldspar for the Bakken sand The procedure is as follows
1) obtain Vcl ay (clay volume) from gamma ray log (see Appendix A)
2) calculate Pmaa Umaa (see Appendix B)
3) locate point on MID plot
4) apply Vclay correction along a line joining illite clay point and point of interest
5) read quartz dolomite and feldspar percentages at clay-corrected point
The MID plot should only be used to obtain rough estimates of mineral percentages for the Bakken sand Many factors can affect the accuracy of the MID plot For example radioactive feldspars increase the gamma ray response Consequently calculated clay volumes are too high and the clay correction to the MID plot is too severe The Bakken sand contains potassium feldspars which can adversely affect MID plot results
b) Total Porosity
All Bakken core samples in the study area have been dried in conventional ovens before porosity determination Clay-bound water is evaporated under the quick-drying conditions of a conventionshyal oven Because the Bakken Is a clay-bearing sand all available core-measured porosities are equivalent to total porosities (flr To obtain effective porosities core samples must be dried in humidity-controlled ovens which do not drive off clay-bound water
By depth-adjusting Bakken core data to log traces the following core bulk density ipb core) to log bulk density ipb log) correlation is obtained
3
-
aj aj
E a
24
25
26
27
28
2 9
30
Quartz (478264) )- 7 X 7 7 7 ~t 7 Feldspars (1506 265)
bC V
Dolomite (900288)
beC
~C ~e
tOC oO~ ~Q
Illite Clay ( 118306)
Definitions
L = length of line from cia y point to point A
Lclean = length of line from clay point to point A
A= uncorrected pmaaUmaa
A= clay-corrected pmaaUmaa
SamRle Calculation
point A pmaa 275 Umaa 90 Vclay 10
Lclean= Lx100 L J=862cm 100-Vclay
Lclean = 8 62x 100- 9S8cm 100-10 (point A)
311 I I I I I I I I I I o 2 4 6 8 10 12 14 16 18 20
Umaa
Figure 2 MID Plot
(1) Pb core = ~b log + 0252) 1 111
Pin gmcm3
The log bulk density Is a function of the (density) porosity as shown in the equation
(2) Pb log = (Ilo + (l -ltllo) x 271 ltflo in fraction limestone scale (6)
rearranging (2) we get a corrected density porosity
(3) (Ilo corr = (271 - Pb core)
171
ltfgto corr in fraction limestone scale
Figure 3 is a ltPo corr versus lt11N crossplot for the Bakken sand in the study area The following procedure was used to develop this crossplot
1) depth-adjust core porosities to log porosity traces
2) plot (Jo corr and lt[IN (point A)
3) locate lt[lcore or ltM along diagonal or clean sand line (point A)
4) join A to A
5) calculate slope of line in (4) ((Jo corr(11N or total porosity slope)
These steps were followed for a number of core intervals A total porosity to log porosity correlation was derived
(4) (IJr ((110 corr + (0095 X (flN )
1095
c) Water Saturations
i) Choice of Water Saturation Models
(ll in percentage limestone scale
The Waxman-Smits shaly sand model(l) has been selected to calculate water saturations for the Bakken formation A modified version of the Archie equation is also used to calculate saturations The empirical Archie equation with a = 1 and m = 2 is not well suited to clay-bearing sands like the Bakken
The Waxman-Smits model assumes that an electrical current through a clay-bearing sand will flow along a parallel conductance path Part of the current flows through the brine solution within the pore system The remainder of the current Hows through a cation-rich layer of water bound to the clay
The Waxman-Smits model was developed on the premise that the suppression of resistivity by water-bearing clays is a function of the cation exchange capacity (CEC) of the clays Different clay types have different CECs Special core analyses on clay-rich samples usually yield reliable CEC values No such analyses are available for the Bakken sand The literature(1) offers lists of typical CEC values associated with different clay types
The Bakken contains Illite clay The CEC for illite usually ranges from 02 to 03 megg A CEC of 025 Is used in this study
5
30
25 Ql
i 0 en Ql c 0 (ij
Clean Sand Line Ql 20 r ~ ~
0 0
A (1515) ~ 15r I
gt-t ()
0 ~
en o 10 (l
gt-t ()
z w 0 0 w 5 t-U W ~ ~ 0 u
0
Total Porosity Lines -51 I I I I I II
o 5 10 15 -- -- --
NEUTRON POROSITY- ltliN (lmestone scale)
Figure 3 Neutron -Density Porosity Crosspot
II) Swt from Waxman-Smits Model
The Waxman-Smits equation can be written in the form
5) Ct = Cwt n + BOvSwtn-1
F F
where Ct Is the formation conductivity
Cw is the formation water conductivity
B Is the conductance of the clay exchange cations
Ov Is the cation concentration per unit volume of fluid in pore space
F Is the Waxman-Smits formation factor
Swt Is the total water saturation including clay-bound water
Ct = Rt from deep resistivity log trace
Rt
Cw = 1 = 1 = 20 ohm-meters ---Rw 005
Rw = 005 ohm-meters from produced Bakken water at t 31degC
B = -1 28 + 225t - 0004059t2 = 516
1 + Rw 123 (0045 t - 27)
Ov = CEC (Pflr) Pma = 025 (1-cfT) Pma
cll
F = F (1 + RwBOv)
To obtain F plot F RoRw versus cflr (log-log plot) for wet Bakken sand intervals (see Figure 4)
If n = 2 in equation (5) the Waxman-Smits equation can be solved as a simple quadratic
(6) X = -bplusmn (b2 _ 4ac) 5 (1)
where
2a
X = Swt
a = CwF
b = B OvF
c = -Ct
iii) Swt from Archie Equation
From Figure 4 10glOF = 00098743 - 174 IOg10 cl~ the slope m = -1 74 and a or the y-intercept = 1023 (cflr = 100) The parameters a and m are used in the Archie water saturation equation
7
1000 900 800 700
600
500
400
300
200
100 90 80 70 60
50 -~ a 0 a -u
40
30
20
10 9 8 7
6
5
4
3
2
02
slopem=174
y intercept at 0 T =10=1023
03 04 05 07 09 23 4 56 789 10 06 08 1
Total Porosity-(2JT (fraction)
Figure 4 F versus (Igtr Crosspot
8
The Archie equation for the Bakken sand in the study area can be written as
(7) Swt n = a Rw (IgtTmRt
where n =20
a = 1023 m = 174 Rw = 005
Archie water saturations were calculated for the Daly Bakken sand
A modlfed version of equation (7) yields accurate quick-look results
(8) Swt = (aRw(j)Dm Rt) 05
132
Daly Bakken Pool Descriptions
Each of the designated Bakken pools have been analysed in detail for lithology porosity water saturation original oil-In-place per unit area and estimated primary recovery Calculations were made on well data available to September 1 1988 Appendix C lists these results
a) Lithology
MID plot calculations consistently show that the Bakken in the study area is a feldspathic dolomitic clay-bearing sandstone Core descriptions confer with these log-derived results The litho-density log is a reliable lithology indicator for the Bakken sand
b) Total Porosity (see Figure 5)
A Pool Porosities range from 13 to 23 and average 17 The best porosity development Is In the central portion of the pool at the locations 16-20 13-21 2-28 3-28 4-28 all in Township 10 Range 29 WPM Porosities drop off rapidly to the west away from the centre of the pool
B Pool (includes F Pool) Porosities range from 13 to 19 and average 16 Because of their narrow range porosities were not contoured
0 Pool Porosities range from 9 to 21 and average 18 The highest porosities occur near the eastern edge of the pool (12-13 9-14 and 16-14 Township 10 Range 29 WPM) Porosities decrease quickly to the west Lack of data at the east side of the pool limits contouring of porosity data
9
c) Total Water Saturation (see Figure 6)
A Pool The average water saturation Is 45 Saturation conlstently rmqe from l0 to 40 In the middle of the pool and Increase to the west which Is downdlp from the centre of the pool
B Pool (Includes F Pool) Water saturations do not vary appreciably The average saturation Is 54
D Pool The average water saturation at the eastern edge of the pool Is 33 Saturations inshycrease sharply on the west side of the pool
d) Original Oil-in-Place per Unit Area (see Figure 7)
Table 1 lists reservoir properties for the Daly Bakken A B and D Pools The shrinkage factor (1Bol) was obtained from a PVT analysis on the well 3-28-10-29 WPM
A Pool The total oll-In-place for this pool Is calculated to be 1 123 180 m3 Most all appears to be trapped In the geographic centre of the pool The west side of the pool Is probably limited by a downdlp water zone The north south and east sides of the pool exhibit rapid decreases In net pay thickness There appears to be a limited amount of future drilling potential
B Pool (Includes F Pool) The oil-In-place for this pool is calculated to be 492 043 m3 The edge of the pool Is difficult to define because of the lack of data to the north and south
D Pool The oil-In-place for this pool Is calculated to be 231 000 m3 The edge of the pool Is loosely defined
e) Production Decline and Recovery Factor
The lower economic limit for oil production Is assumed to be 05 m3 per day per well for all three Bakken pools (see Appendix D)
A Pool A primary recovery factor of 71 was estimated from an annual production decline of 20 The decline was obtained over a period of time when the pool was not being actively developed (Dec86 - June87) (see Figure 8) The ultimate recoverable reserves are 80 631 m3 all
B Pool (Includes F Pool) A very low primary recovery factor of 10 was calculated for this pool B Pool oil production Is very erratic with time Overall production from the pool Is declinshying quite rapidly Assuming an annual decline of 42 (based on production from 12-29) the ulshytimate recoverable reserves are 4 174m3 all Many of the wells In this pool have been recompleted to the overlying Lodgepole formation because of uneconomic Bakken production
D Pool A recovery factor of 11 was calculated based on an annual decline of 24 for the well 15-11-10-29 WPM A decline rate could not be estimated for the pool as a whole because of active development throughout its production history The ultimate recoverable reserves are 25 742 m3
oil
10
middot~i)k(JMi~~O-raquomiddot][ampdHi~~f __ ~~
bull ~secti
~1
0 ~ ~ A--
r-- 4 ~
z laquo ~
1
~~ () Eshylaquo
~
~ ill () t~i---
bull
bull 1 1
bull Kola
bull I ltIgt
Rge 29w1 Rge28w1
bull
I ~ ~ bullbull B Pool ~l r ~poundfeEwgt~~~~17~--~i~~~~0~-or~ ~~1~
If - - - - - -- -_ ~~ = b=poundf= r ~ - -~ ---1 =- ~~1 T 1 17 15 17 13 17 Y
[1 bullbull bull bullbull
rE~i~$i~~
ie ~
~~~ tJ
19 15 fpound 18 16 bullbull 1 +14 W~~
bull 13 13 euroll bull ~~ f bull middot ~_jMill1l$i bullbull ~1~middot---
bull
- -- (I) I bull bull bull bull 16
+ 11 1 bull bull ltIgt bull bull bull 1 ___ __ _ _
bull bull bull
bull bull bull 1 bull bull
bull ltIgt bull CLAYmiddot
12 bull bull bull -- ---
bull bull 11
bull bull
bull bull
16
~ ~ ~ bull bull 18 lt1gt14 bull --- lt1gt12---- - ---
bull I
bull bull bull
bull
bull + ~
bull bull bull
bull bull bull bull bull Bakken Formation-Daly Field
Total Porosity Map
Contour Intral 2 Y bull
Figure 5 Bakken Formation - Daly Field Total Porosity Map
N
Rge29w1
r-~~ r7l __ ~ ~ t~
00 - II g ill
bull J-ill
2 ~ Q ~ __ so ~ z L- ~( --- r
0~~ ~
bull
bull
bull Ko la
II agt
bull
II BAKKEN OIL WELLS
bull
bull
M
If ~ bullbullbullbullbull ~~~ bullbullbull dlmiddot _- bull
II
agt1
1
00 33
bull Il Il ~o 100 ~001l 32 []
WmiddotI +46 bull
-tagt bull bull __ _ __ _------
bull bull bull
bull bull i 1
bull bull
bull bull bull LODGEPOLE OL WELLS
Rge28w1
+
~H~~(~~~~~
bull bull bull I bull Iagt bull bullbull I agt
bull
bull
bull 1 1gtshy bull _ __ _----- +---
bull bull I bull bull bull bull bull bull bull bull bull
Bakken Formation-Daly Field Water Saturation Map
Contour Intrval 10-bull
Figure 6 Bakken Formation - Daly Field Water Saturation Map
()
Rge 29w1
~
~ bull
~t
0 -__1 r-
$( - ~
bull bull 1 bull 1
III bull Il BAKKEN OIL WELLS
Rge 28w1
~~-M 1 I B Pool
I middoti~ x fl
~
0 Pool
Il
CDI Il bull I bull 23 07
1 bull bull I CD bull bull bull
bull bull bull bull
bull bull 1 -
bull LODGEPOLE OIL WELLS
bull CD
bull bull bullbull bull bull
bull bull bull
~ g~iiil bull
bull bull I CD
CD
bull bullbullbull
bull + ~ bull -t -------- ------t---- - ---
bull bull I bull bull bull bull bull bull bull bull
bull bull bull bull bull bull Bakken Formation-Daly Field OIl-ill-Place per unit Area Map
Contour Intrval 0 m3 m 2
Figure 7 Bakken Formation - Daly Field Oil-in-Place per Unit Area Map
100 r
or 80
70
60
50
~ 40
30
20
10
o
0 0 0 -0
0 0 0 I)
o o o
o o I)
o o
o I)
o
~-
1985 L-_____ MONTHLY OIL - m3 M
WELL COUNT
1986 19 8 7
Figure 8 Daly Bakken A Pool History Plot
198 8
WOR-----
100
50
10
5
05
01
01
POOL General Information
1 Year of Discovery 2 Number of wells a) capable of oil production
b) produced first half of 88 c) previous producers
3 Spacing 4 Average Depth of Producing Zone 5 Crude Oil Quality a) density
b) sulphur content
BAKKEN A BAKKEN B
1985 1986 19 6 17 6 o 0
16 ha 16 ha -340 m(subsea elev) NA 7764 kgm3 7764 kgm3
013
BAKKEN 0
1986 7 7 o
16 ha NA
7764 kgm3
6 Initial Pressure (at datum) 8500 kPa 7716 kPa 7900 kPa (3) 7 Current Pressure (at datum) 4000 - 6 000 kPa NA NA 8 Recovery Mechanism ---------------------------- low energy natural water drive -------------------
Reserves Information 1 Production Area 2 Net Pay 3 Porosity (Or) 4 Connate Water Saturation (Sm) 5 Shrinking Factor (1Boi) 6 Original oil-in-place 7 Recovery Factor 8 Ultimate Recoverable Reserves 9 Cummulative Production (to Sept 30 1988)
10 Remaining Recoverable Reserves (Sept 30 1988)
(1) 20 annual production decline for pool (2) 42 annual production decline from 12-29-10-28 (WPM) (3) DSTs show dramatic pressure drop
853 ha 16 m
170 450 0893
1 125180 m3
71 (1) 80631 m3
27539 m3
53092 m3
(4) 24 annual production decline from the well 15-11-10-29 (WPM)
Trap Type (For all pools) 1 Primarily stratigraphie (related to the lateral pinch-out of the Middle Member)
424 ha 18 m
160 540 0893
492043 m3
10 (2) 4174 m3
4216 m3
2 Secondary structural (related to minor structural elevation on top of the Middle Member)
Table 1 Reservoir Engineering Properties of the Bakken Formation
196 ha 11 m
180 330 0893
231000 m3
110(4) 25742 m3
5759 m3
19983 m3
Conclusions
1) The Waxman-Smits equation has been successfully used to derive total water saturations for the Bakken sand In the Daly area This approach Involves a number of complex empirical and derived equations and cannot be used as a quick-look method of calculating total water saturashytions
2) A modified form of the Archie equation using log density porosities [equation (8) I yields total water saturations which almost mimic those obtained from the Waxman-Smits equation This provides a simple way of calculating the total water saturation for the Bakken formation If the calculation Is done on a Bakken Interval In Daly Rw = 005 ohm-meters When evaluating the Bakken outside the study area Rw should be obtained from temperature-corrected water analyses on produced water
3) Many Daly wells produce at extremely low water cuts yet their total water saturations are fairly high (gt30) These apparently high irreduceable saturations along with relatively low log resisshytivity measurements Indicate that the Bakken is strongly water-wet A strongly water-wet rock produces more efficiently under waterflood conditions than does an oil-wet rock
4) Based on petrophysical data It appears that there are some limited future development posshysibilities within existing Bakken Pools of the Daly Field Development locations proposed within these pools are listed below A Pool 1-20-10-29 WPM 5-29-10-29 WPM B Pool 12-30-10-28 WPM 5-30-10-28 WPM 6-30-10-28 WPM D Pool 2-23-10-29 WPM
Recommendations
a) Pressure Maintenance
Reservoir pressure and production data Indicates that the Daly Bakken formation Is being effected by a very low energy recovery mechanism Over a production period of two years there has been a substantial drop In the production rate reflecting a decline In reservoir pressures In the Bakken A Pool Due to the lack of data the pressure drop has not been quantified for other Bakken pools All Bakken pools have shown rapid production declines
It Is evident that a pressure maintenance scheme such as waterflooding is necessary to maxishymize the economically recoverable reserves in the Bakken However illite and dolomite fines are abundant In the Bakken sand Migrating illite and dolomite fines can clog pore throats between sand grains and reduce permeability If water injection pressures are too high or if fluids are produced at unrestricted rates a fines migration problem can be initiated Some of the dolomite fines appear to be lodged within the illite clays If these clays are dlsolved by Injection water an even greater migration problem can develop Water compatibility tests would indicate which fluids dissolve illite clay andor react with dolomite Laboratory tests should be conducted in order to establish the benefits of dissolving Illite clays to increase permeability taking Into account the increased fine migration problem associated with clay dissolution
b) Data Collection
The following shopping list could lead to a more accurate and meaningful formation evaluation of the Bakken sand
16
1) Conduct humidity-controlled and conventionally-dried core analyses on a Bakken core Effecshytive porosities are obtained from humidity-dried core total porosities are obtained from conshyventionally-dried core Data from both types of anaiyses can also be used to estimate formashytion cation exchange capacity (CEC)
2) More special core analysis work would result in a more reliable clay volume to gamma ray correlation for the Bakken (ie X-Ray diffraction and Scanning Electron Microscopy)
3) Meaningful Bakken formation water resistivities (Rw) can be measured from samples of produced water Drill stem test water samples are often contaminated by drilling mud filtrate which has invaded the formation
17
References
1) Berry WR
1983 Modern Shaly Sand Log Analysis
2) Core Laboratories Inc
1988 Petrographic Analysis for The Manitoba Oil and Gas Corporation MOGC Daly 9-14-10-29 WPM
3) Core Laboratories Inc
1982 Special Core Analysis p v-17
4)Dowell Schlumberger Canada
1986 Formation Analysis Report for Newscope Resources Limited 4-28-10-29 WPM and 1-29-10-29 WPM Bakken Formation
5) Helander DP
1971 Oil and Gas Consultants International Inc Formation Evaluation Manual
6) Schlumberger Educational Services
1987 Schlumberger Log Interpretation PrinciplesApplications
18
Appendix A
Clay Volume from Gamma Ray Response
--~ 0
850 (
(
~
~ Igt -- JJ
II v U I--
-
c 1 b V- ~ 1-_
fit I-No1 ( J
~ No1 P ( - Nn 12 ) --
lt ~ - 1
J
~ I
) C 1--
GR ~ ) 1- 1 ~ ~ CNL
- - Porosi ( 1----
Pet ~ -1(
I - i I I I
Compensated Neutron-Llthodensity Log for 9-14-10-29 WPM
From SEM(1) - Log Correlation
Sample No core depth (m Kb)
14 85910-85919
16 85930-85942
22 86031 ~86041
illite
18
9
30
V I~
~ t-
F F0-
tgt It
e--I--~
lt lt ) )
lt
tv gt -
~C ----gt
D
0
-
em ity Po osi tv
0 0
Gamma Ray (API)(2)
80
75 85
Gamma ray versus percentage illite was plotted on a log-log grid (Figure A-1) and a correlation was establ ished
log1Q (Vclay) = (log1o(GR)-1776)0l033 Vclay in
(1) Scanning Electron Microscope
(2) Repeat run used
19
GR in API units
I) o
o r
lffL_~ __ _ 60
a 50 laquo -gt 40 ra
cr ra E 30 E ra
20
091O(VcaY)~(I091O(GR)_1776) 01033
101r~~~~~~-----LL1 2 3 4 5 6 7 8 9 10
Illite Clay
(Figure A -1 )
20 30 40 50 60 70 8090100
Appendix B
MID Plot Construction
1----- 8~O c
i
(
c ) -
f l--
-c [
I-- I
If ( ~
(
) lt -
l I(
l 1- (
~ r
C --GR ~ r--
tr ~ Ill-L- ~
r 1 -I-
Pe -rl 0- It
l - i I I
Compensated Neutron-Lithodenslty Log for 9-14-10-29 WPM
X-Ray Diffraction Results for Sample No 169-14-10-29 WPM
core porosity 21 3
minerai percentages quartz = 64 K-feldspar = 10 plagioclase = 4 dolomite = 13 illite = 9
Log Response at Sample No 16
Pe = 25 barnselectron ltfN = 21 5 (limestone scale) lt1gt0 = 205 (limestone scale)
Pb log = (flo + (1-lt1gt0) x 271 = 205 + (1 - 205) x 271 = 236
Pb core (Pb log + 252)1111 (236 + 252)1111 235
21
~
~ -
-)
- - ~ ~ v r---
D gt 1-- e-
~
-f--- Sam Ie 6 -- ---
Ie lt ~ b I)
(
CNL Po osi ~y P
r--lt [ ens ity Po psi Iy
f- -
gt ~- 6P b
(10 corr == (271 - Pb core)1 71 == (271 - 235)171 == 0211
(11 == [(1)0 corr + (095 x PN)]1095 == [0 211 + (0 95 x 0215)]1 095 == 0211 (porosity from Core Labs == 0213)
Pmaa == Pb core - ltfTPFL = 235 - (0211 X 10) = 271
(1 - ltrr) (1 -0211 )
Pe == Pb core + 01883 (235 + 01883) = 237 ------
10704 10704
Umaa PeDe - rfTUFL == (25 X 237) - (0211 X 398) = 740
where
(1-(lrr) (1-0211)
P = matrix density P = fraction q == quartz d == dolomite i == illite F == feldspar
271 == (264 X 064) + (288 X 013) + (306 x 009) + (PF x 014)
PF == 265
where U == matrix volumetric cross section P == fraction
740 == (478 x 0 64) + (900 x 0 13) + (1180 x 009) + (UF x 014)
UF == 1506
We now have the three MID plot points for our Bakken quartz-dolomite-feldspar (+ illite) model Mineral Pma Uma -----quartz 2 64 478 (known)
dolomite 288 900 (known)
feldspar 2 65 1506
illite 3 06 1180 (known)
MiD plot shown in Figure 2 of study
22
Lout i on
7-30-11)-28 10-30-10-28 11-30-10-28 5-2-10-29
11-11-10-29
9-20-11)-29
10-21-10-29
11-21-10-29
12-21-10-29
13-21-1 0-29
14-21 - 10-29
1-22-10-29
1-23-10-29
9lt5-10-29
2-28-11)-29
3-28-10-29
4-28-10-29
5-28-10-29
6-28-10-29
7-8-10-29
11-28-10-29
1-29- 10-29
8-29-1(1-29
9-29-10-n
a-30-10-29
Too Deoth
ISIft)
81400 81500 81540 87700 88020 86250 86520 88300 88700 86940 87400 87350 87750 87500 88000 875 00 87BOO 86700 871 00 85980 86300 85000 85300 81900 82200 86070 86400 86780 87 1 01) 874 00 87700 86900 87280 86400 86750 85900 36240 86060 86450 87950 883 00 86950 87350 864 00 86800 881 )0 884 )0
Appendix C
Formation Evaluation Results
aottOil lJepth
(lI fti
81600 81850 81700 87880 88180 86400 86630 88500 88930 871 30 87600 87500 88000 877 00 882 00 87600 88050 86870 87220 861 50 86400 85300 85520 821 00 82300 86260 86560 86960 87310 87500 87900 87000 87400 86550 86900 86060 86400 86250 86750 881 00 88520 872 00 876 00 86600 8701)0 88250 886 )1)
Total Volue Quartz Dolomite Porosity of Clay (frac) Ifrac) (f rac) Ifrac)
018 015 017 009 015 007 011 O II 016 010 018 012 015 010 015 012 022 010 019 009 015 012 I) 14 019 (1 11 012 023 O 0 020 0 10 0 21 010 021 01 t 019 012 013 o Il 0 19 010 014 O 1 ) 018 II ij V J
019 011 O 7
23
012 009 027 005 003 1 00 005 019 004 001 0 01 031 005 009 005 009 003 004 004 034 009 053 002 048 009 005 001 ) 05 000 007 0 01 005 003 009 000 O i3 001 001 001 024 00 4 (ilj9
J OS ( 09 005 (1 09 002
065 055
040 053 050 036 055
045
044 048 037 038
035
047
047 040 049 041 042 1)39
050 034 u49 047 046 049 j44 044 042
045 044 049 046 047 043 043
011 017
024 002 027 033 030
026
018 027 029 027
017
025
024 028 031 027 031 024 031 025 027 019 029 (112 032 033 030
~) 27 019 ) I t O lr 026 020 029
Otner ~a X~ dn Mooified -SlIi ts Archie
(fracl Swt (ir ) SHt (fr i
012 019
032 025 019 030 015
024
029 022 030 032
039
025
O2i 028 (1 19 027
030 0 18 036 021 026 024 025 024 02~
026
1)24 i) ~8
026 025 0i3 028 0 26
038 055 052 100 048 1 00 046 097 050 093 038 084 045 (0 058 074 031 (1 92 035 l OO 058 073 0 gt33 i) 54 100 1) 83 030 id4 029 099 032 095 046 1 80 031 080 055 085 044 093 063 i 0 1 V 1 1
047 O BO 046 087 047
0 40 056 Umiddot c bull J i
10(1 049 1 )1
055 096 O5l 094 040 030 048 100 057 073 033 O ~4 038 1 00 057 070 040 02 1 00 083
088 033 1 00 0 34 094 044 080 034 080 058 083 044 O ~4
093
080 046 Ci 89 047
Location Too Depth
[1Ift)
BortolD Depth
(11 ft)
13-6-9-27 82860 83020 7-30-9-27 86000 86230 13-31-9-27 80800 81050 2-2-9-28 851 60 85500
85600 85800 14-13-9-28 dual lilt 81500 81620 4-18-9-28 90370 90600
90700 q08DO 2-23-9-28 83000 83150
83150 93300 13-26-9-28 B1880 82200 5-36-9-28 80940 81270 12-5-9-29 95400 95550
95780 95970 5-15-9-29 91900 92000 1-16-9-29 92200 92450
93000 93100 11)-16-9-29 92050 92300
92600 92720 1-21-9-29 91560 91650
92100 92200 8-29-9-29 90900 91050
915 50 91700 6-33-9-29 90040 90350
90500 90600 11-35-9-29 88200 88380
88500 98600 10-7-10-27 258800 259400 7-18-1 0-27 dual lat 55800 256400
2568 00 257200 11-19-10-27 257600 258300 12-9-10-28 92960 83100
83200 83370 10a-12-10-28 254400 255400 13-16-1 0-28 81880 82010 15-18-10-28 83000 83100 13-20-10-28 80780 80900
1-21-10-28
4-22-10-28
5-29-10-28 7-29-10-28 10-29 -10-28
~ 1-29-[ )-28 12-29-10-28
81100 81200 81530 B1800 81050 81550 90900 80950 81UO 81320 81301) 81300 81500
81770 81900 81200 817 00 81200 8120 81260 81500 81670 815 1)0 816(10
Total Volu~e Q~artz Dolomite Porosity of Clay (frac) [frac i (frac) frac)
016 010 012 011 012 O 11 009 012 O 11 013 ( 15 012 012 016 015 015 013 013 013 012 015 011 014 010 Oli O 11 015 002 016 Ij22
009 0i5 011) 012 011 01i) 014 010 018 01 (1 014 016 015 (I 17 ) 15 013 1)16 ( 18
24
005 017 000 019 001 053 053 006 053 009 009 100 031 009 006 009 001 017 001 1 00 001 017 002 022 0()9 009 006 1 00 007 031 t (10
100 009 ) 31 100 100 073 005 bull (1)
031 005 01)4
) 05 01)1
100 () 2~ 031 134 031
047
048 039
055 044
033 027
043 050 041
043 050
046
023 048 046 056
052
005
001 036
021 023
006 036
0 32 005 034
020 022
024
021 027 024 017
006
Otner ~ax~an Modified -Slits Archie
(frac) 5101t (fr) Swt ifrl
059 031 083
087 032 077 024 097
078 1 00
080 084 069 056 080 054
015 037 027 04 1
0 56 063
044 057 036 055
079 024 049 028 072 023 Ij49
091 07
028 082 022 059
047 (J24
11)0 059 095 074 081 076
024 062
O 5t 021 025 017
~J 32
1)79 038 093 043 056 ~) 48 055 060 069
056
058 087 086 078 094 078 100 080 088 ) 69 055 080 060 042 046 0~7
067 062 061 080 0~2
O i7 054 094 078 084 058
049 027
OO 058 097 073 083 082 062 082 41 1)90 J 48
055 1)51 053 058 067 i c- )~i
053
~ocation Tao Depth
lQ f t)
[-20-9-28 86500 15-12-9-29 iOB 00
90260 3-13-9-29 90200
90530 3-3i-9-29 91750
92000 3-34-9-29 89200 11-9-10-28 83100
83300 3-19-10-28 82700 7-20-10-28 81000 12-20-10-28 81200 13-21-10-28 dual lat 80400 6-28-10-28 81350 3-29-10-28 80880 4-2-10-29 87800
881 00 15-11-10-29 85850 12-13-10-29 85950 7-14-10-29 85560 9-l4-10-29 85600
85900 14-14-10-29 85100 15 -1 4-l0-29 85600 16-14-1 0-29 86lO0
86200 7-[0-10-29 88280
88600 14-16-(1)-29 il83 50
88650 16-17-10-29 90600
911 00 8-20-10-29 88480
88900 15-20 -10-29 87900
88200 16-20-10-29 87B00
88 1 50 5-21- 10-29 87400
88400 16-21 -10lt9 86100
865 1)0 2-25-10-29 82800
3-27-10-n
12-28-10-29
831 00 85750 861 Or) 86400 86800
8ottoll Deoth
(adU
86660 90920 90400 90320 90670 919 00 92200 89380 83240 8~480
82860 81350 81400 80730 81700 811 80 87950 88200 861 90 861 00 86000 85700 86030 85250 85730 86200 8b330 88460 88700 88500 38730 90820 91300 88660 891 00 88030 88300 88000 983~0
67600 8850( 86380 86660 82930 83200 85950 8620 86500 871 00
Total Volume Quartz Dolomite Other Wax Ian Modified Porosity of Clay -S~jts ~rchie
(frac) (frac) (frac) (frac) (frac) Swt (Ir) Sl4t (fr I
0 10 009 009 007 012 012 013 008 013 014 012 014 016 016 014 013 009 013 016 018 010 015 021 009 017 015 019 (j I (J
013 007 015 015 018 010 013 0 II 013 011
O 1 ~ 015 011 015 009 ) 13 )11 016 011 016
25
053 001 053 000 001 015 005 012 000 007 1 00
005 002 004 099 000 012 010 1 00 100 017 aOl 013 022 1 00 009 009 ) )8
048 O I) S (11)9
002 ( 08 001 053 1)27 0 )6 O i) I 004 005 005
000 i) 53 ) U9 (103 004 003
043
035 030 044 045 036 032 033
047 0 51 045
030 052 051
057 055 037
058 037 0 54
OSt 049 tJ 52 048 045
041 05) 034 043 0 39 046 032
)37 029 041 045
035
O 32
009 027 012 033 018
023 028 027
035 012 014
0 05 027 012
015 018 O 8
) 17 I) ~9
(122
031
031 02 024 026 032 O bull 35
017 026
021
033 036 031 023 040 035 0 42
025 0 18 024
035 024 025
I) 17 038
018 036 ) 2)
026 025 017 022 024
030 0117 033 027 030 i)21 034
037 042 028 025
081 089 tOO 1 04 052 (79 063 078 074 052 082 067 045 052 O ~5 071 093 058 056 034 096 059 039 100 041 058 (J 30 075 O6i i (H)
Ii ~6 69 049 095 )48 057 083 a83 037 012 057 080 057 090 i71 082 048 (181 aSl
087 099 100 iOO 060 08( 064 095 071 054 082 065 047
) 64 0 70 lOO 061 055 1) 37 100 058 039 100 042 058 ) 34 053 062 00 048 065 048 096 053 0 67 082 0S (137 092 056 080 057 099 069
049 080 051
Location Too Bottom Totai Volume Quartz DololBite Other WaXiian Modi f ied Depth Depth Porosity of Clay -Silits Archie
mft i (lIft) (frac) (frac ) (frac i frac (frac ) Swt f r ) SHt if r I
4-29-10-29 88200 88400 007 0 17 045 007 030 1 1)0 1 00 88350 38500 O 14 004 044 029 023 073 070 88500 88600 012 009 046 020 025 0Q5 092
26
Appendix 0
Economic Production limit
To obtain the economic production limit for an average Daly Bakken producer set the monthly revenue = monthly expenses as shown (1) P x D x WHP (R x WHP x P X D) + 0
where
equation (1) becomes
P = daily economic production limit D = number of days in one month = 304 WHP = wellhead price = $10300m3 (August88) R = royalties = 15 (015) o = monthly operating cost = $130000
P x 304 x 10300 = (015 x 10300 x P x 304) + 130000
P = 05 m3day 011
27

-
aj aj
E a
24
25
26
27
28
2 9
30
Quartz (478264) )- 7 X 7 7 7 ~t 7 Feldspars (1506 265)
bC V
Dolomite (900288)
beC
~C ~e
tOC oO~ ~Q
Illite Clay ( 118306)
Definitions
L = length of line from cia y point to point A
Lclean = length of line from clay point to point A
A= uncorrected pmaaUmaa
A= clay-corrected pmaaUmaa
SamRle Calculation
point A pmaa 275 Umaa 90 Vclay 10
Lclean= Lx100 L J=862cm 100-Vclay
Lclean = 8 62x 100- 9S8cm 100-10 (point A)
311 I I I I I I I I I I o 2 4 6 8 10 12 14 16 18 20
Umaa
Figure 2 MID Plot
(1) Pb core = ~b log + 0252) 1 111
Pin gmcm3
The log bulk density Is a function of the (density) porosity as shown in the equation
(2) Pb log = (Ilo + (l -ltllo) x 271 ltflo in fraction limestone scale (6)
rearranging (2) we get a corrected density porosity
(3) (Ilo corr = (271 - Pb core)
171
ltfgto corr in fraction limestone scale
Figure 3 is a ltPo corr versus lt11N crossplot for the Bakken sand in the study area The following procedure was used to develop this crossplot
1) depth-adjust core porosities to log porosity traces
2) plot (Jo corr and lt[IN (point A)
3) locate lt[lcore or ltM along diagonal or clean sand line (point A)
4) join A to A
5) calculate slope of line in (4) ((Jo corr(11N or total porosity slope)
These steps were followed for a number of core intervals A total porosity to log porosity correlation was derived
(4) (IJr ((110 corr + (0095 X (flN )
1095
c) Water Saturations
i) Choice of Water Saturation Models
(ll in percentage limestone scale
The Waxman-Smits shaly sand model(l) has been selected to calculate water saturations for the Bakken formation A modified version of the Archie equation is also used to calculate saturations The empirical Archie equation with a = 1 and m = 2 is not well suited to clay-bearing sands like the Bakken
The Waxman-Smits model assumes that an electrical current through a clay-bearing sand will flow along a parallel conductance path Part of the current flows through the brine solution within the pore system The remainder of the current Hows through a cation-rich layer of water bound to the clay
The Waxman-Smits model was developed on the premise that the suppression of resistivity by water-bearing clays is a function of the cation exchange capacity (CEC) of the clays Different clay types have different CECs Special core analyses on clay-rich samples usually yield reliable CEC values No such analyses are available for the Bakken sand The literature(1) offers lists of typical CEC values associated with different clay types
The Bakken contains Illite clay The CEC for illite usually ranges from 02 to 03 megg A CEC of 025 Is used in this study
5
30
25 Ql
i 0 en Ql c 0 (ij
Clean Sand Line Ql 20 r ~ ~
0 0
A (1515) ~ 15r I
gt-t ()
0 ~
en o 10 (l
gt-t ()
z w 0 0 w 5 t-U W ~ ~ 0 u
0
Total Porosity Lines -51 I I I I I II
o 5 10 15 -- -- --
NEUTRON POROSITY- ltliN (lmestone scale)
Figure 3 Neutron -Density Porosity Crosspot
II) Swt from Waxman-Smits Model
The Waxman-Smits equation can be written in the form
5) Ct = Cwt n + BOvSwtn-1
F F
where Ct Is the formation conductivity
Cw is the formation water conductivity
B Is the conductance of the clay exchange cations
Ov Is the cation concentration per unit volume of fluid in pore space
F Is the Waxman-Smits formation factor
Swt Is the total water saturation including clay-bound water
Ct = Rt from deep resistivity log trace
Rt
Cw = 1 = 1 = 20 ohm-meters ---Rw 005
Rw = 005 ohm-meters from produced Bakken water at t 31degC
B = -1 28 + 225t - 0004059t2 = 516
1 + Rw 123 (0045 t - 27)
Ov = CEC (Pflr) Pma = 025 (1-cfT) Pma
cll
F = F (1 + RwBOv)
To obtain F plot F RoRw versus cflr (log-log plot) for wet Bakken sand intervals (see Figure 4)
If n = 2 in equation (5) the Waxman-Smits equation can be solved as a simple quadratic
(6) X = -bplusmn (b2 _ 4ac) 5 (1)
where
2a
X = Swt
a = CwF
b = B OvF
c = -Ct
iii) Swt from Archie Equation
From Figure 4 10glOF = 00098743 - 174 IOg10 cl~ the slope m = -1 74 and a or the y-intercept = 1023 (cflr = 100) The parameters a and m are used in the Archie water saturation equation
7
1000 900 800 700
600
500
400
300
200
100 90 80 70 60
50 -~ a 0 a -u
40
30
20
10 9 8 7
6
5
4
3
2
02
slopem=174
y intercept at 0 T =10=1023
03 04 05 07 09 23 4 56 789 10 06 08 1
Total Porosity-(2JT (fraction)
Figure 4 F versus (Igtr Crosspot
8
The Archie equation for the Bakken sand in the study area can be written as
(7) Swt n = a Rw (IgtTmRt
where n =20
a = 1023 m = 174 Rw = 005
Archie water saturations were calculated for the Daly Bakken sand
A modlfed version of equation (7) yields accurate quick-look results
(8) Swt = (aRw(j)Dm Rt) 05
132
Daly Bakken Pool Descriptions
Each of the designated Bakken pools have been analysed in detail for lithology porosity water saturation original oil-In-place per unit area and estimated primary recovery Calculations were made on well data available to September 1 1988 Appendix C lists these results
a) Lithology
MID plot calculations consistently show that the Bakken in the study area is a feldspathic dolomitic clay-bearing sandstone Core descriptions confer with these log-derived results The litho-density log is a reliable lithology indicator for the Bakken sand
b) Total Porosity (see Figure 5)
A Pool Porosities range from 13 to 23 and average 17 The best porosity development Is In the central portion of the pool at the locations 16-20 13-21 2-28 3-28 4-28 all in Township 10 Range 29 WPM Porosities drop off rapidly to the west away from the centre of the pool
B Pool (includes F Pool) Porosities range from 13 to 19 and average 16 Because of their narrow range porosities were not contoured
0 Pool Porosities range from 9 to 21 and average 18 The highest porosities occur near the eastern edge of the pool (12-13 9-14 and 16-14 Township 10 Range 29 WPM) Porosities decrease quickly to the west Lack of data at the east side of the pool limits contouring of porosity data
9
c) Total Water Saturation (see Figure 6)
A Pool The average water saturation Is 45 Saturation conlstently rmqe from l0 to 40 In the middle of the pool and Increase to the west which Is downdlp from the centre of the pool
B Pool (Includes F Pool) Water saturations do not vary appreciably The average saturation Is 54
D Pool The average water saturation at the eastern edge of the pool Is 33 Saturations inshycrease sharply on the west side of the pool
d) Original Oil-in-Place per Unit Area (see Figure 7)
Table 1 lists reservoir properties for the Daly Bakken A B and D Pools The shrinkage factor (1Bol) was obtained from a PVT analysis on the well 3-28-10-29 WPM
A Pool The total oll-In-place for this pool Is calculated to be 1 123 180 m3 Most all appears to be trapped In the geographic centre of the pool The west side of the pool Is probably limited by a downdlp water zone The north south and east sides of the pool exhibit rapid decreases In net pay thickness There appears to be a limited amount of future drilling potential
B Pool (Includes F Pool) The oil-In-place for this pool is calculated to be 492 043 m3 The edge of the pool Is difficult to define because of the lack of data to the north and south
D Pool The oil-In-place for this pool Is calculated to be 231 000 m3 The edge of the pool Is loosely defined
e) Production Decline and Recovery Factor
The lower economic limit for oil production Is assumed to be 05 m3 per day per well for all three Bakken pools (see Appendix D)
A Pool A primary recovery factor of 71 was estimated from an annual production decline of 20 The decline was obtained over a period of time when the pool was not being actively developed (Dec86 - June87) (see Figure 8) The ultimate recoverable reserves are 80 631 m3 all
B Pool (Includes F Pool) A very low primary recovery factor of 10 was calculated for this pool B Pool oil production Is very erratic with time Overall production from the pool Is declinshying quite rapidly Assuming an annual decline of 42 (based on production from 12-29) the ulshytimate recoverable reserves are 4 174m3 all Many of the wells In this pool have been recompleted to the overlying Lodgepole formation because of uneconomic Bakken production
D Pool A recovery factor of 11 was calculated based on an annual decline of 24 for the well 15-11-10-29 WPM A decline rate could not be estimated for the pool as a whole because of active development throughout its production history The ultimate recoverable reserves are 25 742 m3
oil
10
middot~i)k(JMi~~O-raquomiddot][ampdHi~~f __ ~~
bull ~secti
~1
0 ~ ~ A--
r-- 4 ~
z laquo ~
1
~~ () Eshylaquo
~
~ ill () t~i---
bull
bull 1 1
bull Kola
bull I ltIgt
Rge 29w1 Rge28w1
bull
I ~ ~ bullbull B Pool ~l r ~poundfeEwgt~~~~17~--~i~~~~0~-or~ ~~1~
If - - - - - -- -_ ~~ = b=poundf= r ~ - -~ ---1 =- ~~1 T 1 17 15 17 13 17 Y
[1 bullbull bull bullbull
rE~i~$i~~
ie ~
~~~ tJ
19 15 fpound 18 16 bullbull 1 +14 W~~
bull 13 13 euroll bull ~~ f bull middot ~_jMill1l$i bullbull ~1~middot---
bull
- -- (I) I bull bull bull bull 16
+ 11 1 bull bull ltIgt bull bull bull 1 ___ __ _ _
bull bull bull
bull bull bull 1 bull bull
bull ltIgt bull CLAYmiddot
12 bull bull bull -- ---
bull bull 11
bull bull
bull bull
16
~ ~ ~ bull bull 18 lt1gt14 bull --- lt1gt12---- - ---
bull I
bull bull bull
bull
bull + ~
bull bull bull
bull bull bull bull bull Bakken Formation-Daly Field
Total Porosity Map
Contour Intral 2 Y bull
Figure 5 Bakken Formation - Daly Field Total Porosity Map
N
Rge29w1
r-~~ r7l __ ~ ~ t~
00 - II g ill
bull J-ill
2 ~ Q ~ __ so ~ z L- ~( --- r
0~~ ~
bull
bull
bull Ko la
II agt
bull
II BAKKEN OIL WELLS
bull
bull
M
If ~ bullbullbullbullbull ~~~ bullbullbull dlmiddot _- bull
II
agt1
1
00 33
bull Il Il ~o 100 ~001l 32 []
WmiddotI +46 bull
-tagt bull bull __ _ __ _------
bull bull bull
bull bull i 1
bull bull
bull bull bull LODGEPOLE OL WELLS
Rge28w1
+
~H~~(~~~~~
bull bull bull I bull Iagt bull bullbull I agt
bull
bull
bull 1 1gtshy bull _ __ _----- +---
bull bull I bull bull bull bull bull bull bull bull bull
Bakken Formation-Daly Field Water Saturation Map
Contour Intrval 10-bull
Figure 6 Bakken Formation - Daly Field Water Saturation Map
()
Rge 29w1
~
~ bull
~t
0 -__1 r-
$( - ~
bull bull 1 bull 1
III bull Il BAKKEN OIL WELLS
Rge 28w1
~~-M 1 I B Pool
I middoti~ x fl
~
0 Pool
Il
CDI Il bull I bull 23 07
1 bull bull I CD bull bull bull
bull bull bull bull
bull bull 1 -
bull LODGEPOLE OIL WELLS
bull CD
bull bull bullbull bull bull
bull bull bull
~ g~iiil bull
bull bull I CD
CD
bull bullbullbull
bull + ~ bull -t -------- ------t---- - ---
bull bull I bull bull bull bull bull bull bull bull
bull bull bull bull bull bull Bakken Formation-Daly Field OIl-ill-Place per unit Area Map
Contour Intrval 0 m3 m 2
Figure 7 Bakken Formation - Daly Field Oil-in-Place per Unit Area Map
100 r
or 80
70
60
50
~ 40
30
20
10
o
0 0 0 -0
0 0 0 I)
o o o
o o I)
o o
o I)
o
~-
1985 L-_____ MONTHLY OIL - m3 M
WELL COUNT
1986 19 8 7
Figure 8 Daly Bakken A Pool History Plot
198 8
WOR-----
100
50
10
5
05
01
01
POOL General Information
1 Year of Discovery 2 Number of wells a) capable of oil production
b) produced first half of 88 c) previous producers
3 Spacing 4 Average Depth of Producing Zone 5 Crude Oil Quality a) density
b) sulphur content
BAKKEN A BAKKEN B
1985 1986 19 6 17 6 o 0
16 ha 16 ha -340 m(subsea elev) NA 7764 kgm3 7764 kgm3
013
BAKKEN 0
1986 7 7 o
16 ha NA
7764 kgm3
6 Initial Pressure (at datum) 8500 kPa 7716 kPa 7900 kPa (3) 7 Current Pressure (at datum) 4000 - 6 000 kPa NA NA 8 Recovery Mechanism ---------------------------- low energy natural water drive -------------------
Reserves Information 1 Production Area 2 Net Pay 3 Porosity (Or) 4 Connate Water Saturation (Sm) 5 Shrinking Factor (1Boi) 6 Original oil-in-place 7 Recovery Factor 8 Ultimate Recoverable Reserves 9 Cummulative Production (to Sept 30 1988)
10 Remaining Recoverable Reserves (Sept 30 1988)
(1) 20 annual production decline for pool (2) 42 annual production decline from 12-29-10-28 (WPM) (3) DSTs show dramatic pressure drop
853 ha 16 m
170 450 0893
1 125180 m3
71 (1) 80631 m3
27539 m3
53092 m3
(4) 24 annual production decline from the well 15-11-10-29 (WPM)
Trap Type (For all pools) 1 Primarily stratigraphie (related to the lateral pinch-out of the Middle Member)
424 ha 18 m
160 540 0893
492043 m3
10 (2) 4174 m3
4216 m3
2 Secondary structural (related to minor structural elevation on top of the Middle Member)
Table 1 Reservoir Engineering Properties of the Bakken Formation
196 ha 11 m
180 330 0893
231000 m3
110(4) 25742 m3
5759 m3
19983 m3
Conclusions
1) The Waxman-Smits equation has been successfully used to derive total water saturations for the Bakken sand In the Daly area This approach Involves a number of complex empirical and derived equations and cannot be used as a quick-look method of calculating total water saturashytions
2) A modified form of the Archie equation using log density porosities [equation (8) I yields total water saturations which almost mimic those obtained from the Waxman-Smits equation This provides a simple way of calculating the total water saturation for the Bakken formation If the calculation Is done on a Bakken Interval In Daly Rw = 005 ohm-meters When evaluating the Bakken outside the study area Rw should be obtained from temperature-corrected water analyses on produced water
3) Many Daly wells produce at extremely low water cuts yet their total water saturations are fairly high (gt30) These apparently high irreduceable saturations along with relatively low log resisshytivity measurements Indicate that the Bakken is strongly water-wet A strongly water-wet rock produces more efficiently under waterflood conditions than does an oil-wet rock
4) Based on petrophysical data It appears that there are some limited future development posshysibilities within existing Bakken Pools of the Daly Field Development locations proposed within these pools are listed below A Pool 1-20-10-29 WPM 5-29-10-29 WPM B Pool 12-30-10-28 WPM 5-30-10-28 WPM 6-30-10-28 WPM D Pool 2-23-10-29 WPM
Recommendations
a) Pressure Maintenance
Reservoir pressure and production data Indicates that the Daly Bakken formation Is being effected by a very low energy recovery mechanism Over a production period of two years there has been a substantial drop In the production rate reflecting a decline In reservoir pressures In the Bakken A Pool Due to the lack of data the pressure drop has not been quantified for other Bakken pools All Bakken pools have shown rapid production declines
It Is evident that a pressure maintenance scheme such as waterflooding is necessary to maxishymize the economically recoverable reserves in the Bakken However illite and dolomite fines are abundant In the Bakken sand Migrating illite and dolomite fines can clog pore throats between sand grains and reduce permeability If water injection pressures are too high or if fluids are produced at unrestricted rates a fines migration problem can be initiated Some of the dolomite fines appear to be lodged within the illite clays If these clays are dlsolved by Injection water an even greater migration problem can develop Water compatibility tests would indicate which fluids dissolve illite clay andor react with dolomite Laboratory tests should be conducted in order to establish the benefits of dissolving Illite clays to increase permeability taking Into account the increased fine migration problem associated with clay dissolution
b) Data Collection
The following shopping list could lead to a more accurate and meaningful formation evaluation of the Bakken sand
16
1) Conduct humidity-controlled and conventionally-dried core analyses on a Bakken core Effecshytive porosities are obtained from humidity-dried core total porosities are obtained from conshyventionally-dried core Data from both types of anaiyses can also be used to estimate formashytion cation exchange capacity (CEC)
2) More special core analysis work would result in a more reliable clay volume to gamma ray correlation for the Bakken (ie X-Ray diffraction and Scanning Electron Microscopy)
3) Meaningful Bakken formation water resistivities (Rw) can be measured from samples of produced water Drill stem test water samples are often contaminated by drilling mud filtrate which has invaded the formation
17
References
1) Berry WR
1983 Modern Shaly Sand Log Analysis
2) Core Laboratories Inc
1988 Petrographic Analysis for The Manitoba Oil and Gas Corporation MOGC Daly 9-14-10-29 WPM
3) Core Laboratories Inc
1982 Special Core Analysis p v-17
4)Dowell Schlumberger Canada
1986 Formation Analysis Report for Newscope Resources Limited 4-28-10-29 WPM and 1-29-10-29 WPM Bakken Formation
5) Helander DP
1971 Oil and Gas Consultants International Inc Formation Evaluation Manual
6) Schlumberger Educational Services
1987 Schlumberger Log Interpretation PrinciplesApplications
18
Appendix A
Clay Volume from Gamma Ray Response
--~ 0
850 (
(
~
~ Igt -- JJ
II v U I--
-
c 1 b V- ~ 1-_
fit I-No1 ( J
~ No1 P ( - Nn 12 ) --
lt ~ - 1
J
~ I
) C 1--
GR ~ ) 1- 1 ~ ~ CNL
- - Porosi ( 1----
Pet ~ -1(
I - i I I I
Compensated Neutron-Llthodensity Log for 9-14-10-29 WPM
From SEM(1) - Log Correlation
Sample No core depth (m Kb)
14 85910-85919
16 85930-85942
22 86031 ~86041
illite
18
9
30
V I~
~ t-
F F0-
tgt It
e--I--~
lt lt ) )
lt
tv gt -
~C ----gt
D
0
-
em ity Po osi tv
0 0
Gamma Ray (API)(2)
80
75 85
Gamma ray versus percentage illite was plotted on a log-log grid (Figure A-1) and a correlation was establ ished
log1Q (Vclay) = (log1o(GR)-1776)0l033 Vclay in
(1) Scanning Electron Microscope
(2) Repeat run used
19
GR in API units
I) o
o r
lffL_~ __ _ 60
a 50 laquo -gt 40 ra
cr ra E 30 E ra
20
091O(VcaY)~(I091O(GR)_1776) 01033
101r~~~~~~-----LL1 2 3 4 5 6 7 8 9 10
Illite Clay
(Figure A -1 )
20 30 40 50 60 70 8090100
Appendix B
MID Plot Construction
1----- 8~O c
i
(
c ) -
f l--
-c [
I-- I
If ( ~
(
) lt -
l I(
l 1- (
~ r
C --GR ~ r--
tr ~ Ill-L- ~
r 1 -I-
Pe -rl 0- It
l - i I I
Compensated Neutron-Lithodenslty Log for 9-14-10-29 WPM
X-Ray Diffraction Results for Sample No 169-14-10-29 WPM
core porosity 21 3
minerai percentages quartz = 64 K-feldspar = 10 plagioclase = 4 dolomite = 13 illite = 9
Log Response at Sample No 16
Pe = 25 barnselectron ltfN = 21 5 (limestone scale) lt1gt0 = 205 (limestone scale)
Pb log = (flo + (1-lt1gt0) x 271 = 205 + (1 - 205) x 271 = 236
Pb core (Pb log + 252)1111 (236 + 252)1111 235
21
~
~ -
-)
- - ~ ~ v r---
D gt 1-- e-
~
-f--- Sam Ie 6 -- ---
Ie lt ~ b I)
(
CNL Po osi ~y P
r--lt [ ens ity Po psi Iy
f- -
gt ~- 6P b
(10 corr == (271 - Pb core)1 71 == (271 - 235)171 == 0211
(11 == [(1)0 corr + (095 x PN)]1095 == [0 211 + (0 95 x 0215)]1 095 == 0211 (porosity from Core Labs == 0213)
Pmaa == Pb core - ltfTPFL = 235 - (0211 X 10) = 271
(1 - ltrr) (1 -0211 )
Pe == Pb core + 01883 (235 + 01883) = 237 ------
10704 10704
Umaa PeDe - rfTUFL == (25 X 237) - (0211 X 398) = 740
where
(1-(lrr) (1-0211)
P = matrix density P = fraction q == quartz d == dolomite i == illite F == feldspar
271 == (264 X 064) + (288 X 013) + (306 x 009) + (PF x 014)
PF == 265
where U == matrix volumetric cross section P == fraction
740 == (478 x 0 64) + (900 x 0 13) + (1180 x 009) + (UF x 014)
UF == 1506
We now have the three MID plot points for our Bakken quartz-dolomite-feldspar (+ illite) model Mineral Pma Uma -----quartz 2 64 478 (known)
dolomite 288 900 (known)
feldspar 2 65 1506
illite 3 06 1180 (known)
MiD plot shown in Figure 2 of study
22
Lout i on
7-30-11)-28 10-30-10-28 11-30-10-28 5-2-10-29
11-11-10-29
9-20-11)-29
10-21-10-29
11-21-10-29
12-21-10-29
13-21-1 0-29
14-21 - 10-29
1-22-10-29
1-23-10-29
9lt5-10-29
2-28-11)-29
3-28-10-29
4-28-10-29
5-28-10-29
6-28-10-29
7-8-10-29
11-28-10-29
1-29- 10-29
8-29-1(1-29
9-29-10-n
a-30-10-29
Too Deoth
ISIft)
81400 81500 81540 87700 88020 86250 86520 88300 88700 86940 87400 87350 87750 87500 88000 875 00 87BOO 86700 871 00 85980 86300 85000 85300 81900 82200 86070 86400 86780 87 1 01) 874 00 87700 86900 87280 86400 86750 85900 36240 86060 86450 87950 883 00 86950 87350 864 00 86800 881 )0 884 )0
Appendix C
Formation Evaluation Results
aottOil lJepth
(lI fti
81600 81850 81700 87880 88180 86400 86630 88500 88930 871 30 87600 87500 88000 877 00 882 00 87600 88050 86870 87220 861 50 86400 85300 85520 821 00 82300 86260 86560 86960 87310 87500 87900 87000 87400 86550 86900 86060 86400 86250 86750 881 00 88520 872 00 876 00 86600 8701)0 88250 886 )1)
Total Volue Quartz Dolomite Porosity of Clay (frac) Ifrac) (f rac) Ifrac)
018 015 017 009 015 007 011 O II 016 010 018 012 015 010 015 012 022 010 019 009 015 012 I) 14 019 (1 11 012 023 O 0 020 0 10 0 21 010 021 01 t 019 012 013 o Il 0 19 010 014 O 1 ) 018 II ij V J
019 011 O 7
23
012 009 027 005 003 1 00 005 019 004 001 0 01 031 005 009 005 009 003 004 004 034 009 053 002 048 009 005 001 ) 05 000 007 0 01 005 003 009 000 O i3 001 001 001 024 00 4 (ilj9
J OS ( 09 005 (1 09 002
065 055
040 053 050 036 055
045
044 048 037 038
035
047
047 040 049 041 042 1)39
050 034 u49 047 046 049 j44 044 042
045 044 049 046 047 043 043
011 017
024 002 027 033 030
026
018 027 029 027
017
025
024 028 031 027 031 024 031 025 027 019 029 (112 032 033 030
~) 27 019 ) I t O lr 026 020 029
Otner ~a X~ dn Mooified -SlIi ts Archie
(fracl Swt (ir ) SHt (fr i
012 019
032 025 019 030 015
024
029 022 030 032
039
025
O2i 028 (1 19 027
030 0 18 036 021 026 024 025 024 02~
026
1)24 i) ~8
026 025 0i3 028 0 26
038 055 052 100 048 1 00 046 097 050 093 038 084 045 (0 058 074 031 (1 92 035 l OO 058 073 0 gt33 i) 54 100 1) 83 030 id4 029 099 032 095 046 1 80 031 080 055 085 044 093 063 i 0 1 V 1 1
047 O BO 046 087 047
0 40 056 Umiddot c bull J i
10(1 049 1 )1
055 096 O5l 094 040 030 048 100 057 073 033 O ~4 038 1 00 057 070 040 02 1 00 083
088 033 1 00 0 34 094 044 080 034 080 058 083 044 O ~4
093
080 046 Ci 89 047
Location Too Depth
[1Ift)
BortolD Depth
(11 ft)
13-6-9-27 82860 83020 7-30-9-27 86000 86230 13-31-9-27 80800 81050 2-2-9-28 851 60 85500
85600 85800 14-13-9-28 dual lilt 81500 81620 4-18-9-28 90370 90600
90700 q08DO 2-23-9-28 83000 83150
83150 93300 13-26-9-28 B1880 82200 5-36-9-28 80940 81270 12-5-9-29 95400 95550
95780 95970 5-15-9-29 91900 92000 1-16-9-29 92200 92450
93000 93100 11)-16-9-29 92050 92300
92600 92720 1-21-9-29 91560 91650
92100 92200 8-29-9-29 90900 91050
915 50 91700 6-33-9-29 90040 90350
90500 90600 11-35-9-29 88200 88380
88500 98600 10-7-10-27 258800 259400 7-18-1 0-27 dual lat 55800 256400
2568 00 257200 11-19-10-27 257600 258300 12-9-10-28 92960 83100
83200 83370 10a-12-10-28 254400 255400 13-16-1 0-28 81880 82010 15-18-10-28 83000 83100 13-20-10-28 80780 80900
1-21-10-28
4-22-10-28
5-29-10-28 7-29-10-28 10-29 -10-28
~ 1-29-[ )-28 12-29-10-28
81100 81200 81530 B1800 81050 81550 90900 80950 81UO 81320 81301) 81300 81500
81770 81900 81200 817 00 81200 8120 81260 81500 81670 815 1)0 816(10
Total Volu~e Q~artz Dolomite Porosity of Clay (frac) [frac i (frac) frac)
016 010 012 011 012 O 11 009 012 O 11 013 ( 15 012 012 016 015 015 013 013 013 012 015 011 014 010 Oli O 11 015 002 016 Ij22
009 0i5 011) 012 011 01i) 014 010 018 01 (1 014 016 015 (I 17 ) 15 013 1)16 ( 18
24
005 017 000 019 001 053 053 006 053 009 009 100 031 009 006 009 001 017 001 1 00 001 017 002 022 0()9 009 006 1 00 007 031 t (10
100 009 ) 31 100 100 073 005 bull (1)
031 005 01)4
) 05 01)1
100 () 2~ 031 134 031
047
048 039
055 044
033 027
043 050 041
043 050
046
023 048 046 056
052
005
001 036
021 023
006 036
0 32 005 034
020 022
024
021 027 024 017
006
Otner ~ax~an Modified -Slits Archie
(frac) 5101t (fr) Swt ifrl
059 031 083
087 032 077 024 097
078 1 00
080 084 069 056 080 054
015 037 027 04 1
0 56 063
044 057 036 055
079 024 049 028 072 023 Ij49
091 07
028 082 022 059
047 (J24
11)0 059 095 074 081 076
024 062
O 5t 021 025 017
~J 32
1)79 038 093 043 056 ~) 48 055 060 069
056
058 087 086 078 094 078 100 080 088 ) 69 055 080 060 042 046 0~7
067 062 061 080 0~2
O i7 054 094 078 084 058
049 027
OO 058 097 073 083 082 062 082 41 1)90 J 48
055 1)51 053 058 067 i c- )~i
053
~ocation Tao Depth
lQ f t)
[-20-9-28 86500 15-12-9-29 iOB 00
90260 3-13-9-29 90200
90530 3-3i-9-29 91750
92000 3-34-9-29 89200 11-9-10-28 83100
83300 3-19-10-28 82700 7-20-10-28 81000 12-20-10-28 81200 13-21-10-28 dual lat 80400 6-28-10-28 81350 3-29-10-28 80880 4-2-10-29 87800
881 00 15-11-10-29 85850 12-13-10-29 85950 7-14-10-29 85560 9-l4-10-29 85600
85900 14-14-10-29 85100 15 -1 4-l0-29 85600 16-14-1 0-29 86lO0
86200 7-[0-10-29 88280
88600 14-16-(1)-29 il83 50
88650 16-17-10-29 90600
911 00 8-20-10-29 88480
88900 15-20 -10-29 87900
88200 16-20-10-29 87B00
88 1 50 5-21- 10-29 87400
88400 16-21 -10lt9 86100
865 1)0 2-25-10-29 82800
3-27-10-n
12-28-10-29
831 00 85750 861 Or) 86400 86800
8ottoll Deoth
(adU
86660 90920 90400 90320 90670 919 00 92200 89380 83240 8~480
82860 81350 81400 80730 81700 811 80 87950 88200 861 90 861 00 86000 85700 86030 85250 85730 86200 8b330 88460 88700 88500 38730 90820 91300 88660 891 00 88030 88300 88000 983~0
67600 8850( 86380 86660 82930 83200 85950 8620 86500 871 00
Total Volume Quartz Dolomite Other Wax Ian Modified Porosity of Clay -S~jts ~rchie
(frac) (frac) (frac) (frac) (frac) Swt (Ir) Sl4t (fr I
0 10 009 009 007 012 012 013 008 013 014 012 014 016 016 014 013 009 013 016 018 010 015 021 009 017 015 019 (j I (J
013 007 015 015 018 010 013 0 II 013 011
O 1 ~ 015 011 015 009 ) 13 )11 016 011 016
25
053 001 053 000 001 015 005 012 000 007 1 00
005 002 004 099 000 012 010 1 00 100 017 aOl 013 022 1 00 009 009 ) )8
048 O I) S (11)9
002 ( 08 001 053 1)27 0 )6 O i) I 004 005 005
000 i) 53 ) U9 (103 004 003
043
035 030 044 045 036 032 033
047 0 51 045
030 052 051
057 055 037
058 037 0 54
OSt 049 tJ 52 048 045
041 05) 034 043 0 39 046 032
)37 029 041 045
035
O 32
009 027 012 033 018
023 028 027
035 012 014
0 05 027 012
015 018 O 8
) 17 I) ~9
(122
031
031 02 024 026 032 O bull 35
017 026
021
033 036 031 023 040 035 0 42
025 0 18 024
035 024 025
I) 17 038
018 036 ) 2)
026 025 017 022 024
030 0117 033 027 030 i)21 034
037 042 028 025
081 089 tOO 1 04 052 (79 063 078 074 052 082 067 045 052 O ~5 071 093 058 056 034 096 059 039 100 041 058 (J 30 075 O6i i (H)
Ii ~6 69 049 095 )48 057 083 a83 037 012 057 080 057 090 i71 082 048 (181 aSl
087 099 100 iOO 060 08( 064 095 071 054 082 065 047
) 64 0 70 lOO 061 055 1) 37 100 058 039 100 042 058 ) 34 053 062 00 048 065 048 096 053 0 67 082 0S (137 092 056 080 057 099 069
049 080 051
Location Too Bottom Totai Volume Quartz DololBite Other WaXiian Modi f ied Depth Depth Porosity of Clay -Silits Archie
mft i (lIft) (frac) (frac ) (frac i frac (frac ) Swt f r ) SHt if r I
4-29-10-29 88200 88400 007 0 17 045 007 030 1 1)0 1 00 88350 38500 O 14 004 044 029 023 073 070 88500 88600 012 009 046 020 025 0Q5 092
26
Appendix 0
Economic Production limit
To obtain the economic production limit for an average Daly Bakken producer set the monthly revenue = monthly expenses as shown (1) P x D x WHP (R x WHP x P X D) + 0
where
equation (1) becomes
P = daily economic production limit D = number of days in one month = 304 WHP = wellhead price = $10300m3 (August88) R = royalties = 15 (015) o = monthly operating cost = $130000
P x 304 x 10300 = (015 x 10300 x P x 304) + 130000
P = 05 m3day 011
27

30
25 Ql
i 0 en Ql c 0 (ij
Clean Sand Line Ql 20 r ~ ~
0 0
A (1515) ~ 15r I
gt-t ()
0 ~
en o 10 (l
gt-t ()
z w 0 0 w 5 t-U W ~ ~ 0 u
0
Total Porosity Lines -51 I I I I I II
o 5 10 15 -- -- --
NEUTRON POROSITY- ltliN (lmestone scale)
Figure 3 Neutron -Density Porosity Crosspot
II) Swt from Waxman-Smits Model
The Waxman-Smits equation can be written in the form
5) Ct = Cwt n + BOvSwtn-1
F F
where Ct Is the formation conductivity
Cw is the formation water conductivity
B Is the conductance of the clay exchange cations
Ov Is the cation concentration per unit volume of fluid in pore space
F Is the Waxman-Smits formation factor
Swt Is the total water saturation including clay-bound water
Ct = Rt from deep resistivity log trace
Rt
Cw = 1 = 1 = 20 ohm-meters ---Rw 005
Rw = 005 ohm-meters from produced Bakken water at t 31degC
B = -1 28 + 225t - 0004059t2 = 516
1 + Rw 123 (0045 t - 27)
Ov = CEC (Pflr) Pma = 025 (1-cfT) Pma
cll
F = F (1 + RwBOv)
To obtain F plot F RoRw versus cflr (log-log plot) for wet Bakken sand intervals (see Figure 4)
If n = 2 in equation (5) the Waxman-Smits equation can be solved as a simple quadratic
(6) X = -bplusmn (b2 _ 4ac) 5 (1)
where
2a
X = Swt
a = CwF
b = B OvF
c = -Ct
iii) Swt from Archie Equation
From Figure 4 10glOF = 00098743 - 174 IOg10 cl~ the slope m = -1 74 and a or the y-intercept = 1023 (cflr = 100) The parameters a and m are used in the Archie water saturation equation
7
1000 900 800 700
600
500
400
300
200
100 90 80 70 60
50 -~ a 0 a -u
40
30
20
10 9 8 7
6
5
4
3
2
02
slopem=174
y intercept at 0 T =10=1023
03 04 05 07 09 23 4 56 789 10 06 08 1
Total Porosity-(2JT (fraction)
Figure 4 F versus (Igtr Crosspot
8
The Archie equation for the Bakken sand in the study area can be written as
(7) Swt n = a Rw (IgtTmRt
where n =20
a = 1023 m = 174 Rw = 005
Archie water saturations were calculated for the Daly Bakken sand
A modlfed version of equation (7) yields accurate quick-look results
(8) Swt = (aRw(j)Dm Rt) 05
132
Daly Bakken Pool Descriptions
Each of the designated Bakken pools have been analysed in detail for lithology porosity water saturation original oil-In-place per unit area and estimated primary recovery Calculations were made on well data available to September 1 1988 Appendix C lists these results
a) Lithology
MID plot calculations consistently show that the Bakken in the study area is a feldspathic dolomitic clay-bearing sandstone Core descriptions confer with these log-derived results The litho-density log is a reliable lithology indicator for the Bakken sand
b) Total Porosity (see Figure 5)
A Pool Porosities range from 13 to 23 and average 17 The best porosity development Is In the central portion of the pool at the locations 16-20 13-21 2-28 3-28 4-28 all in Township 10 Range 29 WPM Porosities drop off rapidly to the west away from the centre of the pool
B Pool (includes F Pool) Porosities range from 13 to 19 and average 16 Because of their narrow range porosities were not contoured
0 Pool Porosities range from 9 to 21 and average 18 The highest porosities occur near the eastern edge of the pool (12-13 9-14 and 16-14 Township 10 Range 29 WPM) Porosities decrease quickly to the west Lack of data at the east side of the pool limits contouring of porosity data
9
c) Total Water Saturation (see Figure 6)
A Pool The average water saturation Is 45 Saturation conlstently rmqe from l0 to 40 In the middle of the pool and Increase to the west which Is downdlp from the centre of the pool
B Pool (Includes F Pool) Water saturations do not vary appreciably The average saturation Is 54
D Pool The average water saturation at the eastern edge of the pool Is 33 Saturations inshycrease sharply on the west side of the pool
d) Original Oil-in-Place per Unit Area (see Figure 7)
Table 1 lists reservoir properties for the Daly Bakken A B and D Pools The shrinkage factor (1Bol) was obtained from a PVT analysis on the well 3-28-10-29 WPM
A Pool The total oll-In-place for this pool Is calculated to be 1 123 180 m3 Most all appears to be trapped In the geographic centre of the pool The west side of the pool Is probably limited by a downdlp water zone The north south and east sides of the pool exhibit rapid decreases In net pay thickness There appears to be a limited amount of future drilling potential
B Pool (Includes F Pool) The oil-In-place for this pool is calculated to be 492 043 m3 The edge of the pool Is difficult to define because of the lack of data to the north and south
D Pool The oil-In-place for this pool Is calculated to be 231 000 m3 The edge of the pool Is loosely defined
e) Production Decline and Recovery Factor
The lower economic limit for oil production Is assumed to be 05 m3 per day per well for all three Bakken pools (see Appendix D)
A Pool A primary recovery factor of 71 was estimated from an annual production decline of 20 The decline was obtained over a period of time when the pool was not being actively developed (Dec86 - June87) (see Figure 8) The ultimate recoverable reserves are 80 631 m3 all
B Pool (Includes F Pool) A very low primary recovery factor of 10 was calculated for this pool B Pool oil production Is very erratic with time Overall production from the pool Is declinshying quite rapidly Assuming an annual decline of 42 (based on production from 12-29) the ulshytimate recoverable reserves are 4 174m3 all Many of the wells In this pool have been recompleted to the overlying Lodgepole formation because of uneconomic Bakken production
D Pool A recovery factor of 11 was calculated based on an annual decline of 24 for the well 15-11-10-29 WPM A decline rate could not be estimated for the pool as a whole because of active development throughout its production history The ultimate recoverable reserves are 25 742 m3
oil
10
middot~i)k(JMi~~O-raquomiddot][ampdHi~~f __ ~~
bull ~secti
~1
0 ~ ~ A--
r-- 4 ~
z laquo ~
1
~~ () Eshylaquo
~
~ ill () t~i---
bull
bull 1 1
bull Kola
bull I ltIgt
Rge 29w1 Rge28w1
bull
I ~ ~ bullbull B Pool ~l r ~poundfeEwgt~~~~17~--~i~~~~0~-or~ ~~1~
If - - - - - -- -_ ~~ = b=poundf= r ~ - -~ ---1 =- ~~1 T 1 17 15 17 13 17 Y
[1 bullbull bull bullbull
rE~i~$i~~
ie ~
~~~ tJ
19 15 fpound 18 16 bullbull 1 +14 W~~
bull 13 13 euroll bull ~~ f bull middot ~_jMill1l$i bullbull ~1~middot---
bull
- -- (I) I bull bull bull bull 16
+ 11 1 bull bull ltIgt bull bull bull 1 ___ __ _ _
bull bull bull
bull bull bull 1 bull bull
bull ltIgt bull CLAYmiddot
12 bull bull bull -- ---
bull bull 11
bull bull
bull bull
16
~ ~ ~ bull bull 18 lt1gt14 bull --- lt1gt12---- - ---
bull I
bull bull bull
bull
bull + ~
bull bull bull
bull bull bull bull bull Bakken Formation-Daly Field
Total Porosity Map
Contour Intral 2 Y bull
Figure 5 Bakken Formation - Daly Field Total Porosity Map
N
Rge29w1
r-~~ r7l __ ~ ~ t~
00 - II g ill
bull J-ill
2 ~ Q ~ __ so ~ z L- ~( --- r
0~~ ~
bull
bull
bull Ko la
II agt
bull
II BAKKEN OIL WELLS
bull
bull
M
If ~ bullbullbullbullbull ~~~ bullbullbull dlmiddot _- bull
II
agt1
1
00 33
bull Il Il ~o 100 ~001l 32 []
WmiddotI +46 bull
-tagt bull bull __ _ __ _------
bull bull bull
bull bull i 1
bull bull
bull bull bull LODGEPOLE OL WELLS
Rge28w1
+
~H~~(~~~~~
bull bull bull I bull Iagt bull bullbull I agt
bull
bull
bull 1 1gtshy bull _ __ _----- +---
bull bull I bull bull bull bull bull bull bull bull bull
Bakken Formation-Daly Field Water Saturation Map
Contour Intrval 10-bull
Figure 6 Bakken Formation - Daly Field Water Saturation Map
()
Rge 29w1
~
~ bull
~t
0 -__1 r-
$( - ~
bull bull 1 bull 1
III bull Il BAKKEN OIL WELLS
Rge 28w1
~~-M 1 I B Pool
I middoti~ x fl
~
0 Pool
Il
CDI Il bull I bull 23 07
1 bull bull I CD bull bull bull
bull bull bull bull
bull bull 1 -
bull LODGEPOLE OIL WELLS
bull CD
bull bull bullbull bull bull
bull bull bull
~ g~iiil bull
bull bull I CD
CD
bull bullbullbull
bull + ~ bull -t -------- ------t---- - ---
bull bull I bull bull bull bull bull bull bull bull
bull bull bull bull bull bull Bakken Formation-Daly Field OIl-ill-Place per unit Area Map
Contour Intrval 0 m3 m 2
Figure 7 Bakken Formation - Daly Field Oil-in-Place per Unit Area Map
100 r
or 80
70
60
50
~ 40
30
20
10
o
0 0 0 -0
0 0 0 I)
o o o
o o I)
o o
o I)
o
~-
1985 L-_____ MONTHLY OIL - m3 M
WELL COUNT
1986 19 8 7
Figure 8 Daly Bakken A Pool History Plot
198 8
WOR-----
100
50
10
5
05
01
01
POOL General Information
1 Year of Discovery 2 Number of wells a) capable of oil production
b) produced first half of 88 c) previous producers
3 Spacing 4 Average Depth of Producing Zone 5 Crude Oil Quality a) density
b) sulphur content
BAKKEN A BAKKEN B
1985 1986 19 6 17 6 o 0
16 ha 16 ha -340 m(subsea elev) NA 7764 kgm3 7764 kgm3
013
BAKKEN 0
1986 7 7 o
16 ha NA
7764 kgm3
6 Initial Pressure (at datum) 8500 kPa 7716 kPa 7900 kPa (3) 7 Current Pressure (at datum) 4000 - 6 000 kPa NA NA 8 Recovery Mechanism ---------------------------- low energy natural water drive -------------------
Reserves Information 1 Production Area 2 Net Pay 3 Porosity (Or) 4 Connate Water Saturation (Sm) 5 Shrinking Factor (1Boi) 6 Original oil-in-place 7 Recovery Factor 8 Ultimate Recoverable Reserves 9 Cummulative Production (to Sept 30 1988)
10 Remaining Recoverable Reserves (Sept 30 1988)
(1) 20 annual production decline for pool (2) 42 annual production decline from 12-29-10-28 (WPM) (3) DSTs show dramatic pressure drop
853 ha 16 m
170 450 0893
1 125180 m3
71 (1) 80631 m3
27539 m3
53092 m3
(4) 24 annual production decline from the well 15-11-10-29 (WPM)
Trap Type (For all pools) 1 Primarily stratigraphie (related to the lateral pinch-out of the Middle Member)
424 ha 18 m
160 540 0893
492043 m3
10 (2) 4174 m3
4216 m3
2 Secondary structural (related to minor structural elevation on top of the Middle Member)
Table 1 Reservoir Engineering Properties of the Bakken Formation
196 ha 11 m
180 330 0893
231000 m3
110(4) 25742 m3
5759 m3
19983 m3
Conclusions
1) The Waxman-Smits equation has been successfully used to derive total water saturations for the Bakken sand In the Daly area This approach Involves a number of complex empirical and derived equations and cannot be used as a quick-look method of calculating total water saturashytions
2) A modified form of the Archie equation using log density porosities [equation (8) I yields total water saturations which almost mimic those obtained from the Waxman-Smits equation This provides a simple way of calculating the total water saturation for the Bakken formation If the calculation Is done on a Bakken Interval In Daly Rw = 005 ohm-meters When evaluating the Bakken outside the study area Rw should be obtained from temperature-corrected water analyses on produced water
3) Many Daly wells produce at extremely low water cuts yet their total water saturations are fairly high (gt30) These apparently high irreduceable saturations along with relatively low log resisshytivity measurements Indicate that the Bakken is strongly water-wet A strongly water-wet rock produces more efficiently under waterflood conditions than does an oil-wet rock
4) Based on petrophysical data It appears that there are some limited future development posshysibilities within existing Bakken Pools of the Daly Field Development locations proposed within these pools are listed below A Pool 1-20-10-29 WPM 5-29-10-29 WPM B Pool 12-30-10-28 WPM 5-30-10-28 WPM 6-30-10-28 WPM D Pool 2-23-10-29 WPM
Recommendations
a) Pressure Maintenance
Reservoir pressure and production data Indicates that the Daly Bakken formation Is being effected by a very low energy recovery mechanism Over a production period of two years there has been a substantial drop In the production rate reflecting a decline In reservoir pressures In the Bakken A Pool Due to the lack of data the pressure drop has not been quantified for other Bakken pools All Bakken pools have shown rapid production declines
It Is evident that a pressure maintenance scheme such as waterflooding is necessary to maxishymize the economically recoverable reserves in the Bakken However illite and dolomite fines are abundant In the Bakken sand Migrating illite and dolomite fines can clog pore throats between sand grains and reduce permeability If water injection pressures are too high or if fluids are produced at unrestricted rates a fines migration problem can be initiated Some of the dolomite fines appear to be lodged within the illite clays If these clays are dlsolved by Injection water an even greater migration problem can develop Water compatibility tests would indicate which fluids dissolve illite clay andor react with dolomite Laboratory tests should be conducted in order to establish the benefits of dissolving Illite clays to increase permeability taking Into account the increased fine migration problem associated with clay dissolution
b) Data Collection
The following shopping list could lead to a more accurate and meaningful formation evaluation of the Bakken sand
16
1) Conduct humidity-controlled and conventionally-dried core analyses on a Bakken core Effecshytive porosities are obtained from humidity-dried core total porosities are obtained from conshyventionally-dried core Data from both types of anaiyses can also be used to estimate formashytion cation exchange capacity (CEC)
2) More special core analysis work would result in a more reliable clay volume to gamma ray correlation for the Bakken (ie X-Ray diffraction and Scanning Electron Microscopy)
3) Meaningful Bakken formation water resistivities (Rw) can be measured from samples of produced water Drill stem test water samples are often contaminated by drilling mud filtrate which has invaded the formation
17
References
1) Berry WR
1983 Modern Shaly Sand Log Analysis
2) Core Laboratories Inc
1988 Petrographic Analysis for The Manitoba Oil and Gas Corporation MOGC Daly 9-14-10-29 WPM
3) Core Laboratories Inc
1982 Special Core Analysis p v-17
4)Dowell Schlumberger Canada
1986 Formation Analysis Report for Newscope Resources Limited 4-28-10-29 WPM and 1-29-10-29 WPM Bakken Formation
5) Helander DP
1971 Oil and Gas Consultants International Inc Formation Evaluation Manual
6) Schlumberger Educational Services
1987 Schlumberger Log Interpretation PrinciplesApplications
18
Appendix A
Clay Volume from Gamma Ray Response
--~ 0
850 (
(
~
~ Igt -- JJ
II v U I--
-
c 1 b V- ~ 1-_
fit I-No1 ( J
~ No1 P ( - Nn 12 ) --
lt ~ - 1
J
~ I
) C 1--
GR ~ ) 1- 1 ~ ~ CNL
- - Porosi ( 1----
Pet ~ -1(
I - i I I I
Compensated Neutron-Llthodensity Log for 9-14-10-29 WPM
From SEM(1) - Log Correlation
Sample No core depth (m Kb)
14 85910-85919
16 85930-85942
22 86031 ~86041
illite
18
9
30
V I~
~ t-
F F0-
tgt It
e--I--~
lt lt ) )
lt
tv gt -
~C ----gt
D
0
-
em ity Po osi tv
0 0
Gamma Ray (API)(2)
80
75 85
Gamma ray versus percentage illite was plotted on a log-log grid (Figure A-1) and a correlation was establ ished
log1Q (Vclay) = (log1o(GR)-1776)0l033 Vclay in
(1) Scanning Electron Microscope
(2) Repeat run used
19
GR in API units
I) o
o r
lffL_~ __ _ 60
a 50 laquo -gt 40 ra
cr ra E 30 E ra
20
091O(VcaY)~(I091O(GR)_1776) 01033
101r~~~~~~-----LL1 2 3 4 5 6 7 8 9 10
Illite Clay
(Figure A -1 )
20 30 40 50 60 70 8090100
Appendix B
MID Plot Construction
1----- 8~O c
i
(
c ) -
f l--
-c [
I-- I
If ( ~
(
) lt -
l I(
l 1- (
~ r
C --GR ~ r--
tr ~ Ill-L- ~
r 1 -I-
Pe -rl 0- It
l - i I I
Compensated Neutron-Lithodenslty Log for 9-14-10-29 WPM
X-Ray Diffraction Results for Sample No 169-14-10-29 WPM
core porosity 21 3
minerai percentages quartz = 64 K-feldspar = 10 plagioclase = 4 dolomite = 13 illite = 9
Log Response at Sample No 16
Pe = 25 barnselectron ltfN = 21 5 (limestone scale) lt1gt0 = 205 (limestone scale)
Pb log = (flo + (1-lt1gt0) x 271 = 205 + (1 - 205) x 271 = 236
Pb core (Pb log + 252)1111 (236 + 252)1111 235
21
~
~ -
-)
- - ~ ~ v r---
D gt 1-- e-
~
-f--- Sam Ie 6 -- ---
Ie lt ~ b I)
(
CNL Po osi ~y P
r--lt [ ens ity Po psi Iy
f- -
gt ~- 6P b
(10 corr == (271 - Pb core)1 71 == (271 - 235)171 == 0211
(11 == [(1)0 corr + (095 x PN)]1095 == [0 211 + (0 95 x 0215)]1 095 == 0211 (porosity from Core Labs == 0213)
Pmaa == Pb core - ltfTPFL = 235 - (0211 X 10) = 271
(1 - ltrr) (1 -0211 )
Pe == Pb core + 01883 (235 + 01883) = 237 ------
10704 10704
Umaa PeDe - rfTUFL == (25 X 237) - (0211 X 398) = 740
where
(1-(lrr) (1-0211)
P = matrix density P = fraction q == quartz d == dolomite i == illite F == feldspar
271 == (264 X 064) + (288 X 013) + (306 x 009) + (PF x 014)
PF == 265
where U == matrix volumetric cross section P == fraction
740 == (478 x 0 64) + (900 x 0 13) + (1180 x 009) + (UF x 014)
UF == 1506
We now have the three MID plot points for our Bakken quartz-dolomite-feldspar (+ illite) model Mineral Pma Uma -----quartz 2 64 478 (known)
dolomite 288 900 (known)
feldspar 2 65 1506
illite 3 06 1180 (known)
MiD plot shown in Figure 2 of study
22
Lout i on
7-30-11)-28 10-30-10-28 11-30-10-28 5-2-10-29
11-11-10-29
9-20-11)-29
10-21-10-29
11-21-10-29
12-21-10-29
13-21-1 0-29
14-21 - 10-29
1-22-10-29
1-23-10-29
9lt5-10-29
2-28-11)-29
3-28-10-29
4-28-10-29
5-28-10-29
6-28-10-29
7-8-10-29
11-28-10-29
1-29- 10-29
8-29-1(1-29
9-29-10-n
a-30-10-29
Too Deoth
ISIft)
81400 81500 81540 87700 88020 86250 86520 88300 88700 86940 87400 87350 87750 87500 88000 875 00 87BOO 86700 871 00 85980 86300 85000 85300 81900 82200 86070 86400 86780 87 1 01) 874 00 87700 86900 87280 86400 86750 85900 36240 86060 86450 87950 883 00 86950 87350 864 00 86800 881 )0 884 )0
Appendix C
Formation Evaluation Results
aottOil lJepth
(lI fti
81600 81850 81700 87880 88180 86400 86630 88500 88930 871 30 87600 87500 88000 877 00 882 00 87600 88050 86870 87220 861 50 86400 85300 85520 821 00 82300 86260 86560 86960 87310 87500 87900 87000 87400 86550 86900 86060 86400 86250 86750 881 00 88520 872 00 876 00 86600 8701)0 88250 886 )1)
Total Volue Quartz Dolomite Porosity of Clay (frac) Ifrac) (f rac) Ifrac)
018 015 017 009 015 007 011 O II 016 010 018 012 015 010 015 012 022 010 019 009 015 012 I) 14 019 (1 11 012 023 O 0 020 0 10 0 21 010 021 01 t 019 012 013 o Il 0 19 010 014 O 1 ) 018 II ij V J
019 011 O 7
23
012 009 027 005 003 1 00 005 019 004 001 0 01 031 005 009 005 009 003 004 004 034 009 053 002 048 009 005 001 ) 05 000 007 0 01 005 003 009 000 O i3 001 001 001 024 00 4 (ilj9
J OS ( 09 005 (1 09 002
065 055
040 053 050 036 055
045
044 048 037 038
035
047
047 040 049 041 042 1)39
050 034 u49 047 046 049 j44 044 042
045 044 049 046 047 043 043
011 017
024 002 027 033 030
026
018 027 029 027
017
025
024 028 031 027 031 024 031 025 027 019 029 (112 032 033 030
~) 27 019 ) I t O lr 026 020 029
Otner ~a X~ dn Mooified -SlIi ts Archie
(fracl Swt (ir ) SHt (fr i
012 019
032 025 019 030 015
024
029 022 030 032
039
025
O2i 028 (1 19 027
030 0 18 036 021 026 024 025 024 02~
026
1)24 i) ~8
026 025 0i3 028 0 26
038 055 052 100 048 1 00 046 097 050 093 038 084 045 (0 058 074 031 (1 92 035 l OO 058 073 0 gt33 i) 54 100 1) 83 030 id4 029 099 032 095 046 1 80 031 080 055 085 044 093 063 i 0 1 V 1 1
047 O BO 046 087 047
0 40 056 Umiddot c bull J i
10(1 049 1 )1
055 096 O5l 094 040 030 048 100 057 073 033 O ~4 038 1 00 057 070 040 02 1 00 083
088 033 1 00 0 34 094 044 080 034 080 058 083 044 O ~4
093
080 046 Ci 89 047
Location Too Depth
[1Ift)
BortolD Depth
(11 ft)
13-6-9-27 82860 83020 7-30-9-27 86000 86230 13-31-9-27 80800 81050 2-2-9-28 851 60 85500
85600 85800 14-13-9-28 dual lilt 81500 81620 4-18-9-28 90370 90600
90700 q08DO 2-23-9-28 83000 83150
83150 93300 13-26-9-28 B1880 82200 5-36-9-28 80940 81270 12-5-9-29 95400 95550
95780 95970 5-15-9-29 91900 92000 1-16-9-29 92200 92450
93000 93100 11)-16-9-29 92050 92300
92600 92720 1-21-9-29 91560 91650
92100 92200 8-29-9-29 90900 91050
915 50 91700 6-33-9-29 90040 90350
90500 90600 11-35-9-29 88200 88380
88500 98600 10-7-10-27 258800 259400 7-18-1 0-27 dual lat 55800 256400
2568 00 257200 11-19-10-27 257600 258300 12-9-10-28 92960 83100
83200 83370 10a-12-10-28 254400 255400 13-16-1 0-28 81880 82010 15-18-10-28 83000 83100 13-20-10-28 80780 80900
1-21-10-28
4-22-10-28
5-29-10-28 7-29-10-28 10-29 -10-28
~ 1-29-[ )-28 12-29-10-28
81100 81200 81530 B1800 81050 81550 90900 80950 81UO 81320 81301) 81300 81500
81770 81900 81200 817 00 81200 8120 81260 81500 81670 815 1)0 816(10
Total Volu~e Q~artz Dolomite Porosity of Clay (frac) [frac i (frac) frac)
016 010 012 011 012 O 11 009 012 O 11 013 ( 15 012 012 016 015 015 013 013 013 012 015 011 014 010 Oli O 11 015 002 016 Ij22
009 0i5 011) 012 011 01i) 014 010 018 01 (1 014 016 015 (I 17 ) 15 013 1)16 ( 18
24
005 017 000 019 001 053 053 006 053 009 009 100 031 009 006 009 001 017 001 1 00 001 017 002 022 0()9 009 006 1 00 007 031 t (10
100 009 ) 31 100 100 073 005 bull (1)
031 005 01)4
) 05 01)1
100 () 2~ 031 134 031
047
048 039
055 044
033 027
043 050 041
043 050
046
023 048 046 056
052
005
001 036
021 023
006 036
0 32 005 034
020 022
024
021 027 024 017
006
Otner ~ax~an Modified -Slits Archie
(frac) 5101t (fr) Swt ifrl
059 031 083
087 032 077 024 097
078 1 00
080 084 069 056 080 054
015 037 027 04 1
0 56 063
044 057 036 055
079 024 049 028 072 023 Ij49
091 07
028 082 022 059
047 (J24
11)0 059 095 074 081 076
024 062
O 5t 021 025 017
~J 32
1)79 038 093 043 056 ~) 48 055 060 069
056
058 087 086 078 094 078 100 080 088 ) 69 055 080 060 042 046 0~7
067 062 061 080 0~2
O i7 054 094 078 084 058
049 027
OO 058 097 073 083 082 062 082 41 1)90 J 48
055 1)51 053 058 067 i c- )~i
053
~ocation Tao Depth
lQ f t)
[-20-9-28 86500 15-12-9-29 iOB 00
90260 3-13-9-29 90200
90530 3-3i-9-29 91750
92000 3-34-9-29 89200 11-9-10-28 83100
83300 3-19-10-28 82700 7-20-10-28 81000 12-20-10-28 81200 13-21-10-28 dual lat 80400 6-28-10-28 81350 3-29-10-28 80880 4-2-10-29 87800
881 00 15-11-10-29 85850 12-13-10-29 85950 7-14-10-29 85560 9-l4-10-29 85600
85900 14-14-10-29 85100 15 -1 4-l0-29 85600 16-14-1 0-29 86lO0
86200 7-[0-10-29 88280
88600 14-16-(1)-29 il83 50
88650 16-17-10-29 90600
911 00 8-20-10-29 88480
88900 15-20 -10-29 87900
88200 16-20-10-29 87B00
88 1 50 5-21- 10-29 87400
88400 16-21 -10lt9 86100
865 1)0 2-25-10-29 82800
3-27-10-n
12-28-10-29
831 00 85750 861 Or) 86400 86800
8ottoll Deoth
(adU
86660 90920 90400 90320 90670 919 00 92200 89380 83240 8~480
82860 81350 81400 80730 81700 811 80 87950 88200 861 90 861 00 86000 85700 86030 85250 85730 86200 8b330 88460 88700 88500 38730 90820 91300 88660 891 00 88030 88300 88000 983~0
67600 8850( 86380 86660 82930 83200 85950 8620 86500 871 00
Total Volume Quartz Dolomite Other Wax Ian Modified Porosity of Clay -S~jts ~rchie
(frac) (frac) (frac) (frac) (frac) Swt (Ir) Sl4t (fr I
0 10 009 009 007 012 012 013 008 013 014 012 014 016 016 014 013 009 013 016 018 010 015 021 009 017 015 019 (j I (J
013 007 015 015 018 010 013 0 II 013 011
O 1 ~ 015 011 015 009 ) 13 )11 016 011 016
25
053 001 053 000 001 015 005 012 000 007 1 00
005 002 004 099 000 012 010 1 00 100 017 aOl 013 022 1 00 009 009 ) )8
048 O I) S (11)9
002 ( 08 001 053 1)27 0 )6 O i) I 004 005 005
000 i) 53 ) U9 (103 004 003
043
035 030 044 045 036 032 033
047 0 51 045
030 052 051
057 055 037
058 037 0 54
OSt 049 tJ 52 048 045
041 05) 034 043 0 39 046 032
)37 029 041 045
035
O 32
009 027 012 033 018
023 028 027
035 012 014
0 05 027 012
015 018 O 8
) 17 I) ~9
(122
031
031 02 024 026 032 O bull 35
017 026
021
033 036 031 023 040 035 0 42
025 0 18 024
035 024 025
I) 17 038
018 036 ) 2)
026 025 017 022 024
030 0117 033 027 030 i)21 034
037 042 028 025
081 089 tOO 1 04 052 (79 063 078 074 052 082 067 045 052 O ~5 071 093 058 056 034 096 059 039 100 041 058 (J 30 075 O6i i (H)
Ii ~6 69 049 095 )48 057 083 a83 037 012 057 080 057 090 i71 082 048 (181 aSl
087 099 100 iOO 060 08( 064 095 071 054 082 065 047
) 64 0 70 lOO 061 055 1) 37 100 058 039 100 042 058 ) 34 053 062 00 048 065 048 096 053 0 67 082 0S (137 092 056 080 057 099 069
049 080 051
Location Too Bottom Totai Volume Quartz DololBite Other WaXiian Modi f ied Depth Depth Porosity of Clay -Silits Archie
mft i (lIft) (frac) (frac ) (frac i frac (frac ) Swt f r ) SHt if r I
4-29-10-29 88200 88400 007 0 17 045 007 030 1 1)0 1 00 88350 38500 O 14 004 044 029 023 073 070 88500 88600 012 009 046 020 025 0Q5 092
26
Appendix 0
Economic Production limit
To obtain the economic production limit for an average Daly Bakken producer set the monthly revenue = monthly expenses as shown (1) P x D x WHP (R x WHP x P X D) + 0
where
equation (1) becomes
P = daily economic production limit D = number of days in one month = 304 WHP = wellhead price = $10300m3 (August88) R = royalties = 15 (015) o = monthly operating cost = $130000
P x 304 x 10300 = (015 x 10300 x P x 304) + 130000
P = 05 m3day 011
27
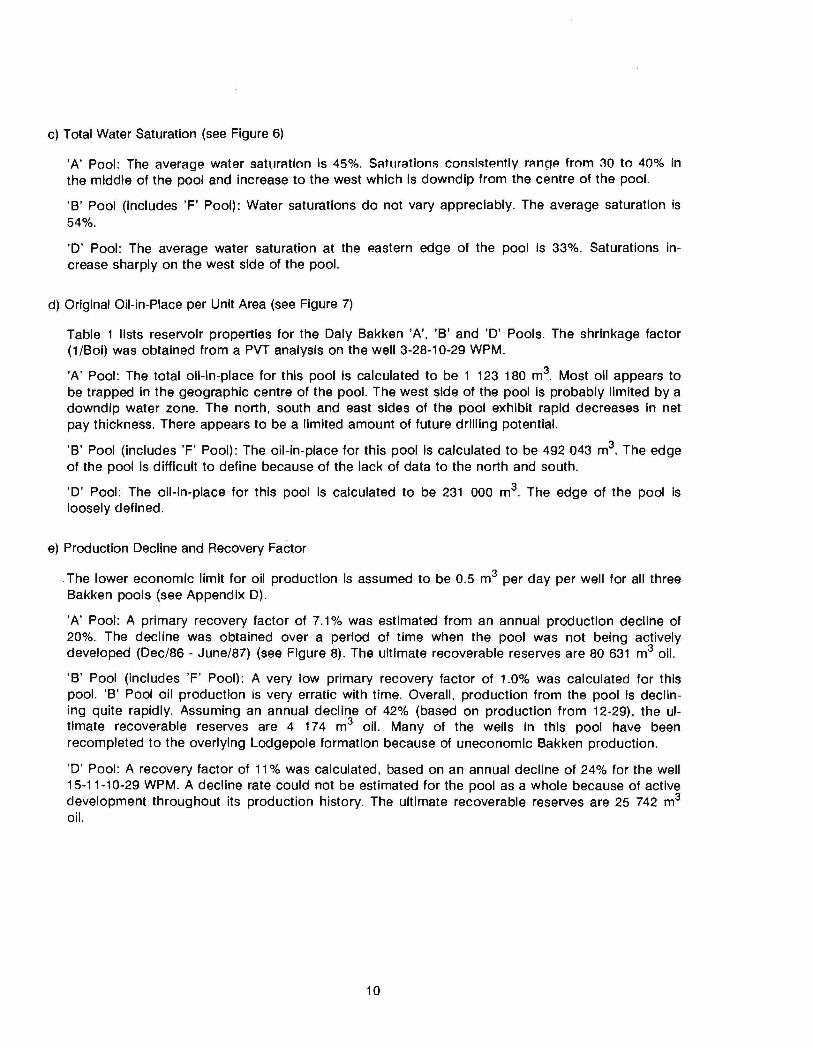
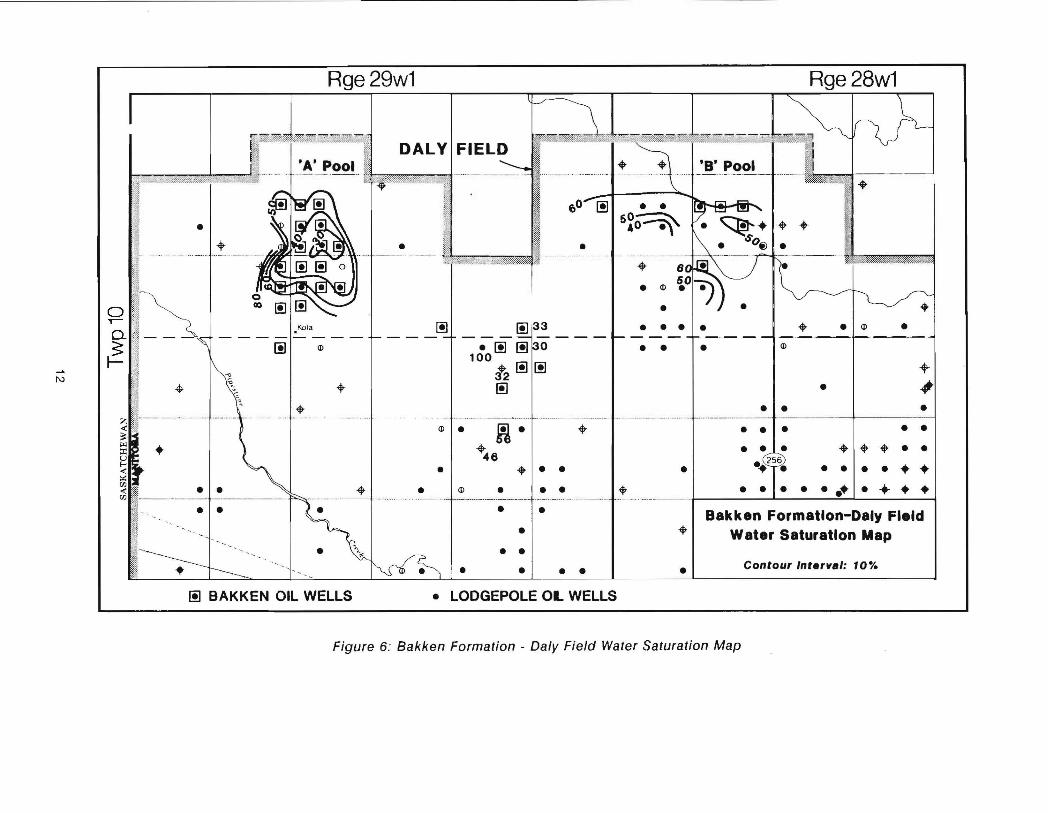
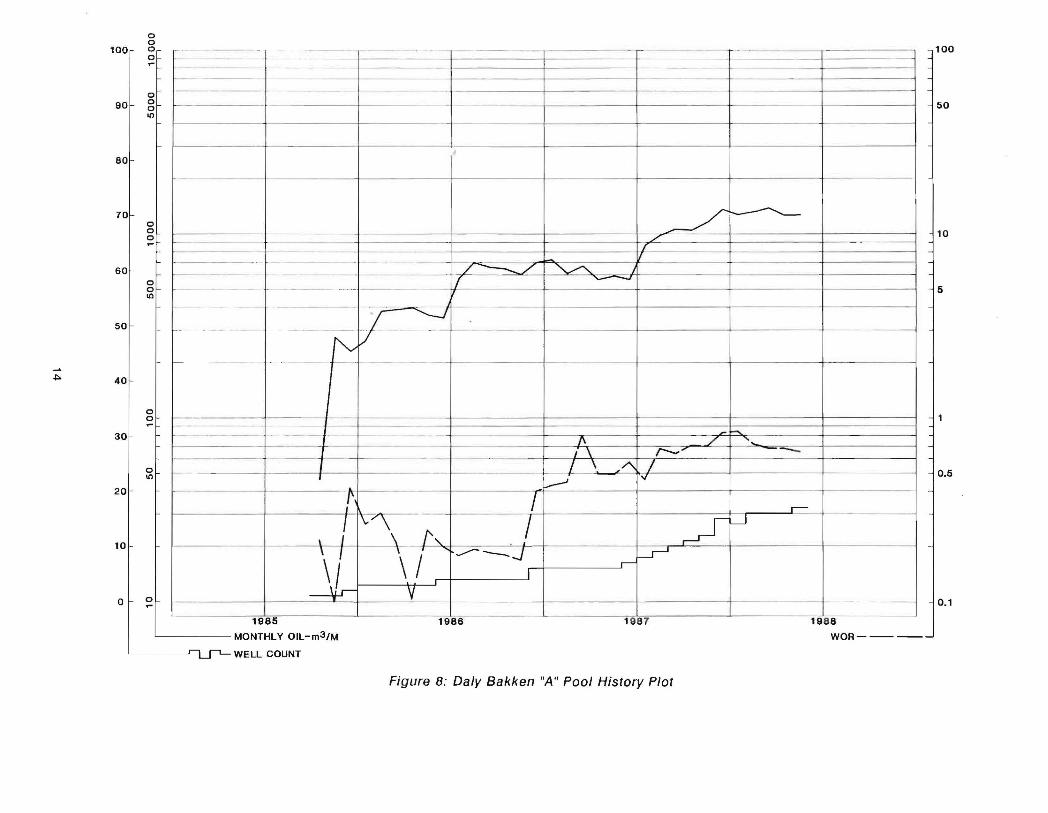