![Evaluationof a Dual Tank Indirect Solar-Assisted Heat ......5.6 Sensitivitystudyofheatpumpcontrolconditions(adaptedfrom[17]) 81 5.7 Sensitivitystudyofratedheatpumpparameters(adaptedfrom[17])](https://static.fdocuments.us/doc/165x107/60b663ca57535e7c2a2beaef/evaluationof-a-dual-tank-indirect-solar-assisted-heat-56-sensitivitystudyofheatpumpcontrolconditionsadaptedfrom17.jpg)
Evaluation of the Cost Effectiveness of Illumination as a Safety Treatment at Rural...
115
Evaluation of the Cost Effectiveness of Illumination as a Safety Treatment at Rural Intersections Contract # DTRT12GUTC12 with USDOT Office of the Assistant Secretary for Research and Technology (OST-R) Final Report December 2016 Principal Investigator: Angshuman Guin, Ph.D. National Center for Transportation Systems Productivity and Management O. Lamar Allen Sustainable Education Building 788 Atlantic Drive, Atlanta, GA 30332-0355 P: 404-894-2236 F: 404-894-2278 [email protected] nctspm.gatech.edu
Transcript of Evaluation of the Cost Effectiveness of Illumination as a Safety Treatment at Rural...

Evaluation of the Cost Effectiveness of Illumination as a Safety Treatment at Rural
Intersections
Contract # DTRT12GUTC12 with USDOT Office of the Assistant Secretary for Research and Technology (OST-R)
Final Report
December 2016
Principal Investigator: Angshuman Guin, Ph.D.
National Center for Transportation Systems Productivity and Management O. Lamar Allen Sustainable Education Building 788 Atlantic Drive, Atlanta, GA 30332-0355 P: 404-894-2236 F: 404-894-2278 [email protected] nctspm.gatech.edu

DISCLAIMER
The contents of this report reflect the views of the authors, who are responsible for the facts and the
accuracy of the information presented herein. This document is disseminated under the sponsorship of
the U.S. Department of Transportation’s University Transportation Centers Program, in the interest of
information exchange. The U.S. Government assumes no liability for the contents or use thereof.

Technical Report Documentation Page
1. Report No.:
FHWA-GA-XX-XXXX
2. Government Accession No.:
3. Recipient’s Catalog No.:
4. Title and Subtitle:
Evaluation of the Cost-Effectiveness of Illumination as a Safety
Treatment at Rural Intersections
5. Report Date:
December 2016
6. Performing Organization Code:
7. Author(s):
Angshuman Guin, Ph.D., Michael O. Rodgers, Ph.D., Franklin Gbologah, Ph.D., Roger Purcell, Ph.D.
8. Performing Organization Report No.
GTI-2006V60-01
9. Performing Organization Name and Address:
Georgia Tech Research Corp., 505 Tenth St., Atlanta, GA. 30318
10. Work Unit No.:
11. Contract or Grant No.:
RP 14-32
12. Sponsoring Organization Name and Address:
Georgia Department of Transportation, Office of Materials and Research; 15 Kennedy Drive; Forest Park, GA 30297-2534
13. Type of Report & Period Covered:
Final Report
14. Sponsoring Agency Code:
15. Supplementary Notes:
Prepared in cooperation with the U.S. Department of Transportation, Federal Highway Administration
16. Abstract:
This research study seeks to improve current understanding of the relationship between rural intersection safety
and different illumination levels. It uses three parallel studies: a survey of rural intersection illumination practices
among US state departments of transportation (DOTs), a safety analysis of rural intersection illumination, and a
benefit-to-cost analysis of rural intersection illumination. These parallel studies indicate the following:
(a) Most DOTs do not consider cost-effectiveness in rural intersection illumination projects.
(b) There is little or no benefit to rural intersection illumination beyond a threshold of 12 lux.
(c) Illuminance levels lower than the minimum recommended value or 8 lux could provide significant safety
benefit.
(d) Any rural intersection that does not require electrification would be cost-effective for illuminances not
exceeding 12 lux. The cost-effectiveness of other intersections must be determined based on overall costs,
AADT, crash rate, and a target benefit-to-cost ratio that signifies the DOT’s required level of cost-effectiveness.
This research study provides a companion benefit-to-cost spreadsheet model to facilitate tradeoff analysis by DOTs.
17. Key Words
Illumination, Roadway Safety, Rural Intersections, Benefit–Cost Analysis, Survey, Georgia
18. Distribution Statement
19. Security Class (This Report)
UNCLASSIFIED
20. Security Class (This Page)
UNCLASSIFIED
21. No of Pages 115
22. Price
Form DOT F 1700.7 (8/72) Reproduction of form and completed page is authorized


GDOT Research Project No. RP 14-32
Evaluation of the Cost Effectiveness of Illumination as a Safety Treatment at Rural Intersections
Final Report
Safety and Illumination of Rural Conventional Intersections
By
Angshuman Guin, Ph.D., Principal Investigator1
Michael O. Rodgers, Ph.D., co-Principal Investigator1
Franklin Gbologah, Ph.D., Postdoctoral Researcher1
Roger Purcell, Ph.D., co-Principal Investigator2
School of Civil and Environmental Engineering, Georgia Institute of Technology1
and Georgia Southern University2
Contract with
Georgia Department of Transportation
In cooperation with
U.S. Department of Transportation
Federal Highway Administration
December 2016
The contents of this report reflect the views of the authors who are responsible for the facts
and accuracy of the data presented herein. The contents do not necessarily reflect the official
views or policies of the Georgia Department of Transportation or the Federal Highway
Administration. This report does not constitute a standard, specification, or regulation.


Evaluation of Cost Effectiveness of Illumination as a Safety Treatment at Rural Intersections
ii
TABLE OF CONTENTS
LIST OF TABLES ......................................................................................................................... vi
LIST OF FIGURES ..................................................................................................................... viii
EXECUTIVE SUMMARY ............................................................................................................ x
ACKNOWLEDGEMENT ............................................................................................................ xii
INTRODUCTION .......................................................................................................................... 1
Overview of Project .................................................................................................................... 2
Project Objectives ....................................................................................................................... 2
Report Organization .................................................................................................................... 2
SECTION A: LITERATURE REVIEW ........................................................................................ 5
A.1 Illumination Impact on Intersection Safety ...................................................................... 5
A.1.1 Before-and-After Studies ............................................................................................. 5
A.1.2 Cross-sectional Studies ................................................................................................ 7
A.1.3 Issues with Before-and-After and Cross-sectional Studies ......................................... 9
A.2 Evaluation of Roadway Illumination ............................................................................. 11
A.2.1 Relationship between Luminance and Illuminance ................................................... 11
A.2.2 Quantity and Quality of Roadway Illumination ........................................................ 12
A.2.3 Roadway Lighting Benefits and Costs ...................................................................... 16

Evaluation of Cost Effectiveness of Illumination as a Safety Treatment at Rural Intersections
iii
SECTION B: A REVIEW OF RURAL INTERSECTION ILLUMINATION
PRACTICES – SURVEY OF STATE TRANSPORTATION AGENCIES .................... 21
B.1 Introduction .................................................................................................................... 21
B.2 Survey Results ................................................................................................................ 22
SECTION C: ESTIMATION OF THE SAFETY IMPACT OF ILLUMINATION AT
RURAL CONVENTIONAL INTERSECTIONS IN GEORGIA .................................... 27
C.1 Introduction .................................................................................................................... 27
C.2 Data Requirements and Availability .............................................................................. 28
C.2.1 Minimum Data Requirements ................................................................................... 28
C.2.2 Data Sources .............................................................................................................. 29
C.3 Methodology .................................................................................................................. 30
C.3.1 Selection of 60 Rural Intersections for Luminance Measurement ............................ 31
C.3.2 Selection of All Eligible Rural Intersections ............................................................. 39
C.3.3 Computation of Intersection Daily Entering Volume ............................................... 41
C.3.4 Treatment of the Georgia Crash Data ........................................................................ 41
C.3.5 Computation of Crash Rates ...................................................................................... 43
C.3.6 Measurement of Intersection Illumination Levels ..................................................... 43
C.4 Results and Discussion ................................................................................................... 48
C.4.1 Rural Intersection Illumination Levels ...................................................................... 49
C.4.2 Injury Severities ......................................................................................................... 50

Evaluation of Cost Effectiveness of Illumination as a Safety Treatment at Rural Intersections
iv
C.4.3 Overview of Observed Crash Experience at the Studied Intersections ..................... 51
C.4.4 Effect of Illumination Level on Nighttime Total Crash Rates at Rural
Intersections ............................................................................................................... 53
C.5 Summary Findings for Safety Analysis ......................................................................... 56
SECTION D: BENEFIT-TO-COST ANALYSIS OF RURAL CONVENTIONAL
INTERSECTION ILLUMINATION IN GEORGIA ....................................................... 59
D.1 Introduction .................................................................................................................... 59
D.2 Cost Estimation .............................................................................................................. 59
D.2.1 Development of the Illumination Models .................................................................. 60
D.2.2 Illumination Modeling Results and Estimated Costs ................................................ 61
D.3 Benefit Analysis ............................................................................................................. 68
D.3.1 Estimating Crash Rate Reductions ............................................................................ 68
D.3.2 Estimating Crash Injury Severity Costs at Rural Conventional Intersection ............ 70
D.3.3 Sample Benefit-to-Cost Analysis Results from Spreadsheet Model ......................... 72
D.4 Summary of Benefit-to-Cost Analysis ........................................................................... 77
PROJECT SUMMARY AND RECOMMENDATIONS ............................................................. 79
REFERENCES ............................................................................................................................. 83
APPENDIX: SURVEY QUESTIONNAIRE ............................................................................... 91
APPENDIX 2: RESULTS OF INTERSECTION LIGHTING MEASUREMENTS ................... 95

Evaluation of Cost Effectiveness of Illumination as a Safety Treatment at Rural Intersections
v

Evaluation of Cost Effectiveness of Illumination as a Safety Treatment at Rural Intersections
vi
LIST OF TABLES
Table 1 Highway Safety Improvements with the Highest Benefit–Cost Ratios, 1974–1995 ....... 19
Table 2 Selected Rural Intersections with No Dedicated Illumination ......................................... 34
Table 3 Selected Rural Intersections with Partial Illumination .................................................... 35
Table 4 Selected Intersections with Full Illumination .................................................................. 36
Table 5 Number of Rural Intersections with No Missing AADT Information ............................. 40
Table 6 Number of Available Stop or Yield Control Rural Intersections .................................... 41
Table 7 Observed Proportions of Nighttime Crash Severity Types ............................................. 50
Table 8 Observed Proportions of Daytime Crash Severity Types ................................................ 50
Table 9 Distribution of Crash Severity Types within Nighttime Rural Intersection
Incidents in Georgia ................................................................................................................ 51
Table 10 Effect of Different Illumination Levels on Observed Nighttime Total Crash
Rates at Rural Intersections .................................................................................................... 55
Table 11 Intersection Illuminance, Power Consumption, and Luminaire Configuration
Chart ........................................................................................................................................ 63
Table 12 Estimated Installation Costs per Luminaire Type .......................................................... 64
Table 13 Estimated Annual Maintenance Costs per Luminaire Type .......................................... 65
Table 14 Estimated Annual Energy Consumption Costs for Luminaire Configuration ............... 66
Table 15 Estimated Total Annual Costs for Different Intersection Illuminance Level
Groupings ................................................................................................................................ 67
Table 16 Proportion of Crash Severities in Georgia ..................................................................... 69
Table 17 Distribution of Injury Crash Severity in Georgia .......................................................... 69

Evaluation of Cost Effectiveness of Illumination as a Safety Treatment at Rural Intersections
vii
Table 18 Distribution of Crash Severity Types within Nighttime Intersection Incidents in
Georgia .................................................................................................................................... 70
Table 19 Comprehensive Accident Injury Severity Costs ............................................................ 71
Table 20 Accident Severity Costs Applied to Georgia Crashes ................................................... 71
Table 21 Number of Nighttime Fatalities and Injuries per Related Crash in Georgia ................. 72
Table 22 Required AADT at Rural Conventional Intersections for Different Illuminance
Levels based on a Target Benefit to Cost Ratio of 2.0 ........................................................... 76
Table 23 Required AADT at Rural Conventional Intersections to Meet Different
Economic Justification Goals ................................................................................................. 76
Table 24 Illuminance Characteristics of Surveyed Intersections .................................................. 96

Evaluation of Cost Effectiveness of Illumination as a Safety Treatment at Rural Intersections
viii
LIST OF FIGURES
Figure 1 States Responding to Survey .......................................................................................... 21
Figure 2 Developed Illumination Guidelines in Use by DOTs ..................................................... 22
Figure 3 Reasons for Illuminating Rural Intersections ................................................................. 24
Figure 4 Indicated Strategies used by States to Assess Cost-effectiveness of Rural
Intersection Lighting ............................................................................................................... 25
Figure 5 Locations of Intersections in the Northern Half of Georgia ........................................... 37
Figure 6 Locations of Intersections in the Southern Half of Georgia ........................................... 38
Figure 7 Exposure Time vs. Pixel Intensity .................................................................................. 47
Figure 8 Pixel Intensity vs. ISO Sensitivity .................................................................................. 47
Figure 9 Pixel Intensity vs. Aperture ............................................................................................ 47
Figure 10 Estimated Rural Intersection Illuminance .................................................................... 49
Figure 11 Comparison of Nighttime and Daytime Crash Rate at Intersections ........................... 52
Figure 12 Observed Effect of Illumination Level on Total Crash Rates at Rural
Intersections ............................................................................................................................ 55
Figure 13 Modeled Luminaire Layouts for Rural Conventional Four-Leg Intersections ............. 60
Figure 14 Modeled Luminaire Layouts for Rural Conventional Three-Leg Intersections ........... 60
Figure 15 Benefit-Cost Ratios of Different LED Lighting Levels at Rural Conventional
Intersections with 4000 AADT for Various Electrification Costs .......................................... 74
Figure 16 Benefit–Cost Curves for Different LED Lighting Levels at Rural Conventional
Intersections with Electrification Costs of $100,000 .............................................................. 75

Evaluation of Cost Effectiveness of Illumination as a Safety Treatment at Rural Intersections
ix

Evaluation of Cost Effectiveness of Illumination as a Safety Treatment at Rural Intersections
x
EXECUTIVE SUMMARY
The major goal this research study is to determine the cost-effectiveness of illumination at
uncontrolled and stop-controlled rural intersections in Georgia. This report consolidates three
parallel studies that were performed to meet this goal. These three parallel studies are presented
in in separate sections of this report.
Section B presents results of a survey of state departments of transportation (DOTs) to help
understand current rural intersection illumination practices. The survey results from 24
responding states revealed four key characteristics of rural illumination practices among DOTs:
a) Most DOTs use published illumination guidance and standard. The overwhelming
majority use either the guidance from the Illuminating Engineering Society of North
America (IESNA) or the standard from the American Association of State Highway and
Transportation Officials (AASHTO).
b) Most DOTs currently use standard lighting in rural areas when lighting is deemed
necessary.
c) There is limited study going on among DOTs to determine the applicability of published
illumination crash modification factors to their local conditions.
d) Most DOTs do not include an actual cost-effectiveness analysis in decision making for
rural intersection illumination projects. Most often, DOTs measure cost-effectiveness in
terms of either an overall minimization project cost or existence of potential safety
benefits.

Evaluation of Cost Effectiveness of Illumination as a Safety Treatment at Rural Intersections
xi
The results presented in Section C, Estimation of the Safety Impact of Illumination at Rural
Intersections in Georgia, show overwhelming evidence that lower illumination levels, not
included in the existing lighting standards/guidelines, would also provide significant benefits.
The existing guidelines prescribe recommended lighting levels ranging from about 8 lux to 34
lux for intersections. However, the findings from this study show that there is little or no benefit
to illuminating rural intersections beyond a dose-response range of 0–12 lux.
The third parallel study, Benefit-to-Cost Analysis of Conventional Rural Intersection
Illumination in Georgia, is presented in Section D. The findings from this study indicate that for
rural intersection locations that require no electrification, basically any illumination level within
the dose-response range identified in this study will be cost-effective for any entering annual
average daily traffic (AADT). However, locations that require electrification need to be
evaluated based on the overall costs, entering AADT, existing crash rate, and a target benefit-to-
cost ratio that signifies the level of cost-effectiveness required by the state DOT. Consequently, a
spreadsheet benefit-to-cost model has been developed as part of the study to facilitate the cost-
effectiveness analysis at any rural uncontrolled or stop-controlled intersection.
Generally, the findings support other published studies, which have indicated that lower
illumination levels could be used on roads without compromising safety

Evaluation of Cost Effectiveness of Illumination as a Safety Treatment at Rural Intersections
xii
ACKNOWLEDGEMENT
This work was sponsored by the Georgia Department of Transportation Research Project
RP 14-32. The authors thank the Georgia Department of Transportation for its support
throughout this research effort. The findings and conclusions presented herein represent the
opinion of the authors and not necessarily that of the Georgia Department of Transportation.

Evaluation of Cost Effectiveness of Illumination as a Safety Treatment at Rural Intersections
xiii

Evaluation of Cost Effectiveness of Illumination as a Safety Treatment at Rural Intersections
1
INTRODUCTION
Late-night/early-morning driving is associated with significantly higher fatality rates than other
periods of the day. According to the National Highway Transportation Safety Administration
(NHTSA) [1], nighttime driving conditions account for more than 40 percent of fatalities, even
though only 27 percent of total crashes occur during nighttime hours. Likewise, road
intersections are disproportionately represented among crashes [2-5] and are associated with 50
percent of all urban crashes and 25 percent of all rural crashes [6], even though they form only a
small part of the overall road transportation network. Road intersections thus require effective
safety countermeasures to help drivers complete the navigational task, especially during
nighttime.
One of the proven nighttime intersection safety countermeasures is the provision of illumination
[7-12]. According to crash modification factors in the Highway Safety Manual, intersection
lighting is expected to reduce 38 percent of nighttime crashes and 42 percent of pedestrian-
involved nighttime crashes [6]. In a comparative analysis of 376 illuminated and unilluminated
rural and near-urban intersections, researchers found that nonstandard lighting and standard
lighting can reduce nighttime accident rates by 29 percent and 39 percent, respectively [12].
Intersection illumination represents one of the principal contributors to roadway maintenance
and operations cost. In an era of constrained resources and increasing demands on state
transportation agencies, comprehensive information on the cost-effectiveness of illumination
compared to other safety treatments, as well as the relationship between different illumination

Evaluation of Cost Effectiveness of Illumination as a Safety Treatment at Rural Intersections
2
levels and safety at intersections would be beneficial to transportation planners and other
stakeholders.
Overview of Project
The research reported here is for the Georgia Department of Transportation (GDOT)–sponsored
research study to evaluate the cost-effectiveness of illumination as a safety treatment at rural
intersections. It is designed to improve understanding of (a) the relationship between
illumination and safety at rural intersections, and (b) current illumination practices among other
state departments of transportation (DOTs).
Project Objectives
This project, Evaluation of the Cost-Effectiveness of Illumination as a Safety Treatment at Rural
Intersections, was designed to meet the following six major objectives.
Literature review of safety impacts of different illumination levels at rural intersections
Comprehensive rural intersection illumination and safety analysis
Cost-effectiveness analysis of illumination at rural intersections
Review of North American agencies to determine their current illumination practices
Synthesis of lighting techniques and technologies that may be applicable for rural areas
Recommendations for Georgia practice
Report Organization
This final report consolidates different studies that collectively address the project’s objectives.
These studies have been organized into the following four sections:

Evaluation of Cost Effectiveness of Illumination as a Safety Treatment at Rural Intersections
3
Section A: Literature Review
Section B: A Review of Rural Intersection Illumination Practices: Survey of US DOTs
Section C: Estimation of the Safety Impact of Illumination at Rural Conventional
Intersections in Georgia
Section D: Benefit-to-Cost Analysis of Rural Conventional Intersection Illumination in
Georgia
There is a separate Microsoft Excel® spreadsheet model the researchers developed to facilitate
benefit–cost analysis. The spreadsheet is provided in electronic form along with this report.

Evaluation of Cost Effectiveness of Illumination as a Safety Treatment at Rural Intersections
4

Evaluation of Cost Effectiveness of Illumination as a Safety Treatment at Rural Intersections
5
SECTION A: LITERATURE REVIEW
A.1 Illumination Impact on Intersection Safety
Review of the literature on illumination and intersection safety shows that most of these studies
were conducted using either a before-and-after analysis method or a cross-sectional method
comparing intersections with lighting to those without lighting. A few of the studies have been
compelled to use other methods because of their inherent data availability limitations.
A.1.1 Before-and-After Studies
In 1976, Walker and Roberts [13] analyzed crash data from 47 rural at-grade intersections in
Iowa using crash data that spanned 3 years before and after lighting was installed. The study
assumed that nighttime traffic volume was 0.27 times the existing daily traffic volume. The
results showed a reduced crash rate of 0.91 crashes per million entering vehicles (MEV) in the
after period compared to 1.89 crashes per MEV in the before period. That study generally found
that the impact of lighting was less for low-volume roads with daily traffic volume lower than
3500 vehicles per day. After that study and in the wake of the 1973 energy crisis, the Iowa
Department of Transportation commissioned another study, Effects of Reduced Intersection
Lighting on Nighttime Accident Frequency [14]. The study analyzed crash data from 19 pairs of
intersections with similar geometrics. One intersection from each pair had some lights turned off
to produce a lighting differential. The results showed that the nighttime crash rate at rural
intersections with full lighting was 1.06, while the rate at rural intersections with reduced
lighting was 1.01. Based on those results, it was concluded that the lighting level at lighted rural

Evaluation of Cost Effectiveness of Illumination as a Safety Treatment at Rural Intersections
6
at-grade intersections does not have a significant effect on the accident frequency as long as the
conflict area(s) is sufficiently illuminated.
In 1999, Preston and Schoenecker [15] undertook a study of 12 rural Minnesota intersections
associated with installation of lighting to determine the relative changes in crash frequencies and
other crash characteristics. They reported findings of about 40 percent reduction in total
nighttime crash rates and this was statistically significant with a 95 percent confidence interval.
Also, they indicated a statistically significant 20 percent crash severity index reduction with a 90
percent confidence interval. Crash severity index was estimated as the sum of fatal crashes and
personal injury crashes divided by total number of crashes. Also, Green et al. [16] investigated
the effect of roadway lighting on driver safety using crash data from nine Kentucky intersections.
Their study was severely limited by sample size and reported no statistical tests, but the results
indicated a 45 percent reduction in nighttime crash frequency after installing lights.
Isebrands et al. [17] also used a Poisson regression model to evaluate the change in expected
crash frequencies after installation of lighting at 33 rural intersections. They defined rural
intersection as an intersection that is at least 1 mile away from any development or 1 mile away
from a signalized intersection on the same roadway. Both the before and after data had at least 3
years of information, and the Poisson model included intersection-related variables such as
night/day (ND), before/after, number of intersection legs, posted speed limits, intersection
control, presence of turn lanes, and presence of horizontal or vertical curve. Using a significance
threshold of 10 percent, the Poisson regression model revealed a statistically significant
reduction in nighttime crash rate of 37 percent after lighting was installed. There was also a
reduction in daytime crash rate of 4 percent, but this was not found to be statistically significant.

Evaluation of Cost Effectiveness of Illumination as a Safety Treatment at Rural Intersections
7
A.1.2 Cross-sectional Studies
Sometimes it is difficult to identify intersection locations with enough samples of before and
after crash data where illumination was the only safety treatment applied during the study period.
In such instances a cross-sectional study can be used. Cross-sectional studies compare
intersections with a particular attribute (in this case, lighting) to intersections without it.
Wortman and Lipinski [18] evaluated the impacts of intersection lighting on crashes at rural
highway intersections by analyzing 263 lighted intersection-data-years and 182 unlighted
intersection-data-years. Their findings indicate an average night/total crash ratio of 0.25 for
lighted intersections and 0.33 for unlighted intersections. This corresponds to a 24 percent
reduction in night accidents. Later on, Lipinski and Wortman [19] analyzed 445 intersection-
data-years and their results show a 22 percent reduction in night/day crash ratio, 45 percent
reduction in nighttime total crash rate, and 35 percent reduction in total crash rate at all
intersections.
Preston and Schoenecker [15] performed a cross-sectional study of over 3400 intersections in
Minnesota with crash data from 1995 to 1997. Their results indicate a 25 percent reduction in
nighttime total crash rate (0.63 to 0.47 per million entering vehicles) and an 8 percent reduction
in injury severity index. Crash severity index was estimated as the sum of fatal crashes and
personal injury crashes divided by total number of crashes. Similarly, Bruneau and Morin [12]
evaluated the safety aspects of roadway lighting at rural and near-urban intersections in Quebec,
Canada, by comparing unlit intersections with lit intersections. The lit intersections were those
with standard lighting and nonstandard lighting with both three-legged and four-legged
intersections included. The study analyzed a total of 376 sites, and the results that were

Evaluation of Cost Effectiveness of Illumination as a Safety Treatment at Rural Intersections
8
statistically significant at the 5 percent level showed that rural intersection lighting can reduce
nighttime total accident rate by 29 percent for nonstandard lighting and by 39 percent for
standard lighting.
Isebrands et al. [20] evaluated 3622 rural illuminated and unilluminated intersections in
Minnesota. Their linear regression model indicated that the relevant variables that affect the ratio
of nighttime accidents to total accidents were presence of lighting, volume, and number of
intersection legs. Furthermore, the model showed that the expected ratio of nighttime to total
crashes was 7 percent higher for unilluminated intersections than for illuminated intersections.
Also, Hallmark et al. [21] conducted a cross-sectional study of 223 rural intersections using a
hierarchical Bayesian model with Poisson distribution. The authors found that the expected mean
of nighttime accidents was 2.01 times higher for unlit intersections than for illuminated
intersections.
Donnell et al. [9] estimated the safety effects of roadway lighting at intersections from
Minnesota and California using a cross-sectional approach with 4 years of intersection data.
They computed expected night-to-day crash ratios at intersections with and without roadway
lighting, and their results indicate 12 and 23 percent reductions in expected night-to-day accident
ratios between intersections with and without lighting in Minnesota and California, respectively.
More recently, Donnell [22] undertook a study exploring statistical issues in relating lighting to
safety. As part of that study, he compared two cross-sectional studies. Each analysis was
undertaken with a negative binomial regression, but the input data were treated differently. One
analysis incorporated observed crash data while the other analysis used a propensity score–
potential outcome framework. Propensity scores are estimated using binary logit regression to

Evaluation of Cost Effectiveness of Illumination as a Safety Treatment at Rural Intersections
9
determine probability that an entity contains intersection lighting based on site-specific
conditions to identify lighted and unlighted sites based on covariates. The results indicate a
lighting safety benefit of 11.9 percent and 9.5 percent for the analysis based on observed data
and propensity scores, respectively.
A.1.3 Issues with Before-and-After and Cross-sectional Studies
Before-and-after studies are faced with issues that can affect the statistical validity of results.
First, such studies can give biased results due to the phenomenon called regression to the mean
[23, 24]. Usually, it is difficult to find a large sample of data for the before case and the after
case. Therefore, before-and-after studies usually use datasets covering a few years on either side
of light installation. The mean of such data is easily affected by temporary events, and this can
bias the results. On the other hand, if the duration of the before and after samples are increased
too much, the study can be influenced by long-term trends that might not continue to be true.
Furthermore, a before-and-after study can be faced with selection bias [8] or endogeneity bias, as
referred to in other studies [23]. This bias arises because a traffic safety countermeasure such as
lighting is normally applied to a site with a recent or proportionately higher nighttime number of
crashes. However, warrants for lighting are usually applied with other operational considerations,
so other safety influences may be influencing the results.
Cross-sectional studies attempt to address the regression to the mean bias faced in before-and-
after studies. In cross-sectional studies no treatment is applied to a site; rather, sites with
particular attributes are compared to those without. However, these studies also face a selection
bias issue, so it is difficult to categorically make a case for causation [8].

Evaluation of Cost Effectiveness of Illumination as a Safety Treatment at Rural Intersections
10
To address these challenges, different approaches have been adopted in previous studies. Hauer
[25] proposed a before-and-after study in which the observed effect of a treatment is compared to
an estimate of the expected number of crashes that would have occurred if the treatment had not
been applied. Also, Donnell et al. [8] point out that the empirical Bayes (EB) method has been
advocated by Hauer [26] and Persaud and Lyon [27] as a way to address issues of selection bias.
Bo et al. [28] also developed a full Bayesian empirical approach that addresses issues of
selection bias as well as the empirical Bayes method. The empirical Bayes method provides
several advantages [29]:
Properly accounts for regression to the mean effects
Overcomes difficulties in the use of crash rates to normalize for changes in before and
after period traffic volumes
Reduces the level of uncertainty in the estimate of the safety benefit
Properly accounts for differences in crash experience and crash reporting practice when
combining data and results from different jurisdictions
However, the empirical Bayes method also has some drawbacks [22]:
Requires installation dates and time-sequence
Possible confounding impacts with other “treatments”
Needs adequate reference and treatment sites for evaluation.
While the first two drawbacks are common to the other methods, the third is the most critical
drawback for empirical Bayes in that the method has a much larger data availability requirement
that is hard to satisfy in illumination studies. Thus, other researchers such as Donnell et al. [8]
have used cross-sectional studies with application of multivariate regression models that permit

Evaluation of Cost Effectiveness of Illumination as a Safety Treatment at Rural Intersections
11
the controlling of other safety influences. The most popular of these multivariate regression
models is the negative binomial model because it is suited for count data such as crash data and it
is also able to account for both over-dispersion and under-dispersion in count data.
A.2 Evaluation of Roadway Illumination
The performance of roadway illumination can be evaluated by illuminance, luminance, or small
target visibility (STV) methods [30]. Luminance is a measure of the quantity of light reflected
from a surface [31-33] and it is measured in candela per square meter (cd/m2). It is what is
perceived by the human eye as brightness of the road surface. Illuminance measures the quantity
of light falling on the road surface [31-33] and it is measured in lux or foot candles. STV is a
metric used to determine the visibility of an array of targets on the roadway [33]. The
recommended method for conflict points including intersections is horizontal illuminance [33,
34] Also, vertical illuminance, which helps drivers to see pedestrians and objects in the
crosswalk, should be measured at a height of 1.5 meters above the roadway in the crosswalk.
A.2.1 Relationship between Luminance and Illuminance
The two main performance measures for road lighting, luminance and illuminance, are related as
shown in Equation 1 [35]:
𝐿 = 𝑞 ∗ 𝐸 ≅ 𝜌
𝜋∗ 𝐸 … … … (𝟏)
Where:
L = luminance in cd/m2
q = luminance coefficient in cd/m2/lux

Evaluation of Cost Effectiveness of Illumination as a Safety Treatment at Rural Intersections
12
E = illuminance in lux
ρ = reflection coefficient
The luminance coefficient varies across different points of the pavement surface [36] because it
depends on the pavement material, observer position, and the luminaire position relative to the
point of interest. Casol et al. [37] have shown that for the purposes of simplifying road lighting
analysis a road surface can be assumed to be perfectly diffused with a reflection coefficient equal
to πQ0. Many values of this reflection coefficient have been indicated in published studies; Uncu
and Kayaku [38] found an average value of 0.13 for asphalt roads while Fotios et al. [36] found
an average value of 0.16 and 0.27 for asphalt and concrete road surfaces, respectively.
A.2.2 Quantity and Quality of Roadway Illumination
Four studies [39-42] that evaluated the relationship between illumination parameters
(illuminance, luminance, uniformity, and glare) on crashes all concluded that luminance was
statistically related to ND crash frequency ratio. One of these four studies [42] further estimated
that within the luminance range of 0.5–2.0 cd/m2, an increase in average surface luminance of
1.0 cd/m2 results in a 35 percent reduction in nighttime crash frequency ratio. Similarly, in a
review of 62 studies [43] from 15 nations, the International Commission on Illumination (CIE)
noted that crashes might increase as uniformity of lighting increases beyond a certain level due
to reduction in contrast between an object and its surrounding visual environment.
Oya et al. [44] also evaluated illuminance at 18 trunk road intersections, each with at least
10,000 AADT, using 1 year of before data and 4 years of after data. Illuminance data were
calculated for each intersection and the results show that illuminance levels of 30 lux or more
can positively reduce nighttime crashes. This was found to be significant at the 1 percent level.

Evaluation of Cost Effectiveness of Illumination as a Safety Treatment at Rural Intersections
13
Also, the study found that illuminance levels between 20 and 30 lux can reduce nighttime
crashes even though the study could not find any statistical significance for this category of
lighting level. Subsequently, a Japanese study [45] found that an illuminance of 10 lux or more is
needed for drivers to have good visibility of pedestrians at an intersection and an illuminance
uniformity ratio of 0.4 will make an intersection safer.
Medina et al. [46] measured illuminance from three different sets of LEDs and one set of HPS
luminaires and compared the measured values to estimates derived from computer analysis with
AGi32®, a professional lighting design software. The measurements were taken on dry days and
under skies with no full moon, and the results show both close agreement and significant
differences between measured values and software estimates. The authors attribute this to
luminaire-specific differences, underscoring the need to perform periodic audits to verify if in-
situ lighting levels meet the design specifications.
Performing street lighting audits with handheld meters over large sections of the roadway system
can pose both a data collection and safety challenge for the data collection personnel. Efforts to
overcome this challenge have resulted in the development of automatic mobile reading systems
and the use of photography methods that enable quicker data collection from either intersections
or road segments. Zhou et al. [30] developed a mobile measurement system for collecting
illuminance data for Florida DOT. The system employs a vehicle moving at 30 mph that collects
data every 17.5 ft. through a computer linked to a lighting meter and a distance measuring
instrument. An inverse square method is used to transform measurements made at the top of the
moving vehicle to the equivalent measurements at 6 inches above the pavement and the
researchers used a Wilcoxon test to compare the measurements. The results showed that the
median of differences between the two is not significantly different from zero.

Evaluation of Cost Effectiveness of Illumination as a Safety Treatment at Rural Intersections
14
Schmidt et al. [47] also explored the feasibility of LED roadway luminaires by analyzing eight
LED luminaires produced by different manufacturers and three HPS luminaires with power
ratings of 150 W, 250 W, and 400 W. Annualized life cycle costs were used for economic
analysis while the technical feasibility was determined by comparing in-situ measurements to
recommended IES standards. The study results showed that only one LED luminaire conformed
to the IES standard for moderately busy, medium pedestrian-conflict road with R3 (asphalt)
pavement. Also, only one of the eight studied LED luminaires economically outperformed the
existing HPS in life cycle costs. Therefore, the study concluded that LED luminaires are a
promising technology, but more technological advancement would be needed to accurately
confirm their feasibility in roadway illumination.
Bullough et al. [11] argue that existing installation methods for roundabout illumination, with
luminaires hanging from fixed heights on poles, do not necessarily provide the best visibility for
drivers and can be energy/cost intensive. Therefore, they evaluated a new lighting method called
ecoluminance that relies on both illuminance and luminance, using a combination of roadside
vegetation to provide visual delineation, lower-level lighting such as landscape lighting to
reinforce delineation, pedestrian-level lighting to provide illumination at important safety
hazards, and retroreflective elements to provide cues about road geometry. Ecoluminance was
tested in New York and its performance was checked by various photometric measurements of
luminance and illuminance in the circulating roadway, the crosswalk, and the roundabout exit.
These measurements confirmed that pedestrians and roadway elements were visible to both
drivers and pedestrians. According to the authors, their results show comparable approach speeds
and initial costs for ecoluminance and conventional lighting; however, ecoluminance used only a
quarter of the energy required by the conventional illumination method.

Evaluation of Cost Effectiveness of Illumination as a Safety Treatment at Rural Intersections
15
Niaki et al. [7] developed a method for performing illumination audits for intersections using
light sensors attached to a handle and a data logger for recording both spot illumination and
position via GPS coordinates. The method simplifies the time-consuming spot measurements of
illuminance required at intersections by the existing measurement protocols. Measurement can
be made by walking across the exit/entrance line of each intersection leg and then averaging to
obtain the mean intersection illuminance. The results from a case study of 85 intersections in
Montreal indicate that about 59 percent had substandard lighting level. Although this method can
simplify the measurements compared to existing protocols, it increases the safety risk for both
personnel and equipment since they must be in the active travel lane to collect data. In addition,
measurements with this method may lack luminance constancy since onsite voltage can fluctuate
before all the intersections are covered.
Jackett and Frith [48] studied the relationship between road lighting levels and safety using 5
years of crash data and road lighting measurements from mid-block road sections in New
Zealand. The lighting levels were obtained by the photographic method. The authors calibrated
sixth-order polynomials for pixel-to-luminance conversions at specific settings of camera
exposure. The study included 152 mid-block road sections, and the results showed that the most
important performance measure in predicting expected crashes on road sections is average
luminance. The authors tried to apply the lighting data to intersections, but the results were not
very strong compared to road sections.
Bhagavathula et al. [49] investigated the effect of lighting quality and quantity on the ND crash
frequency ratios at rural intersections. They used negative binomial regression to model
illuminance, luminance, and crash data from 99 lighted and unlighted rural intersections. The
results indicate that a 1 lux increase in the average horizontal illuminance at all rural

Evaluation of Cost Effectiveness of Illumination as a Safety Treatment at Rural Intersections
16
intersections corresponded to a 7 percent reduction in the ND crash ratio. For the lighted
intersections, a 1 lux increase in average horizontal illuminance corresponded to a 9 percent
decrease in the ND crash ratio, while for unlighted intersections a 1 lux increase in average
horizontal illuminance corresponded to a 21 percent reduction in the ND crash ratio. The
findings also showed that stop-controlled intersections experience smaller ND crash ratios than
signalized intersections, while intersections with posted speed limit less than or equal to 40 mph
also experienced lower ND crash ratios than those with posted speed limit greater than 40 mph.
In another study Gibbons et al. [50] investigated the relationship between lighting level and
crashes on roadways. Crash data were obtained from select states and the Highway Safety
Information System, while lighting measurements were collected in situ with a mobile road
lighting measurement system. The results showed there was no benefit to illumination beyond a
certain level on an urban interstate, which in the study was about 5 lux. The authors further
indicated that there is a potential to reduce lighting requirements on highways and freeways by
as much as 50 percent while maintaining traffic safety. Also, the results indicate that the
relationship between lighting level and safety was not as strong as that of lighting presence (lit or
unlit) and safety.
A.2.3 Roadway Lighting Benefits and Costs
Previous research on the benefits and costs of roadway illumination are few, are mostly dated,
and have been focused on either intersections or urban freeway systems. A benefit–cost analysis
helps to compare the tradeoff between the costs of a project and its benefits. Benefits are usually
estimated as the avoided costs due to reduction in crash occurrence. The costs of implementing
road lighting are often estimated as the direct initial costs of installation, maintenance, and repair

Evaluation of Cost Effectiveness of Illumination as a Safety Treatment at Rural Intersections
17
[10]. The incremental benefit–cost ratio of one lighting alternative, j, to another lighting
alternative, i, can be estimated as shown in Equation 2.
𝐵𝐶𝑗−𝑖 = 𝐴𝐶𝑗 − 𝐴𝐶𝑖
𝐷𝐶𝑗 − 𝐷𝐶𝑖 … … … … (𝟐)
Where:
𝐵𝐶𝑗−𝑖 = the incremental benefit–cost ratio of alternative j to alternative i
AC = the annualized avoided costs due to the crash reduction
DC = the annualized direct costs of the alternatives
Box [51] analyzed benefit–cost ratios for illuminating different multilane urban freeways, and
his results indicate benefit–cost ratios of 2.3, 1.4, and 1.7 for lighting four-lane, six-lane, and
eight- to ten-lane urban freeways, respectively. In another study on urban freeway systems,
Griffith [52] evaluated the benefits and cost of lighting. Based on an analysis of 22 miles of
urban freeway segments in Minnesota, he identified benefits and costs that yield a ratio of 1.2.
The Federal Highway Administration (FHWA) produces an annual report to Congress on the
Highway Safety Improvement Programs (HSIP) in the US. One of the key components of the
earlier reports is a benefit–cost ranking of different highway safety improvement programs. The
findings in the 1994 report indicated that illumination offered the highest benefit–cost ratio of
21.0 [53]. Also, a subsequent report to Congress in 1996 again ranked illumination as the highest
out of 20 highway improvements, with a benefit–cost ratio of 26.8 [10, 54]. Table 1 presents the
benefit–cost ranking of highway safety improvement programs from 1974 to 1995.

Evaluation of Cost Effectiveness of Illumination as a Safety Treatment at Rural Intersections
18
Preston and Schoenecker [15] evaluated the impacts of street lighting at isolated rural
intersections in Minnesota. As part of their evaluation they estimated the avoided costs of
crashes and the direct costs of illumination. Their findings show that the benefits outweighed the
costs by a ratio of 15.0. The analysis annualized costs and benefits over 10 years at a 5 percent
discount rate. Notably, the ratios for road segments (e.g., urban freeway systems) appear to be
very small compared to intersections.
Other studies evaluated the benefits and costs of road lighting in terms of its societal benefit from
crime reduction. Painter and Farrington [55] used official crime valuation data to evaluate the
benefits and cost of lighting installation in Dudley and Stoke-on-Trent in the UK. The results for
Dudley showed that 1 year after installation of lighting, the benefit–cost ratio was approximately
10:1 and increases to about 121:1 if a 20-year payback is assumed. Similarly, the results for
Stoke-on-Trent showed that the benefit–cost ratio after 1 year of lighting installation was 2.4:1 or
24:1 if a 20-year payback is assumed.

Evaluation of Cost Effectiveness of Illumination as a Safety Treatment at Rural Intersections
19
Table 1 Highway Safety Improvements with the Highest Benefit–Cost Ratios, 1974–1995
Rank Improvement Description Benefit–Cost Ratio
1 Illumination 26.8
2 Upgrade Median Barrier 22.6
3 Traffic Signs 22.4
4 Relocated/Breakaway Utility Poles 17.7
5 Remove Obstacles 10.7
6 New Traffic Signals 8.5
7 Impact Attenuators 8
8 New Median Barrier 7.6
9 Upgrade Guardrail 7.5
10 Upgrade Traffic Signal 7.4
11 Upgrade Rail Bridge 6.9
12 Improve Sight Distance 6.1
13 Median for Traffic Separation 6.1
14 Groove Pavement for Skid 5.8
15 Improve Minor Stricture 5.3
16 Turning Lanes and Channelization 4.5
17 New RR Crossing Gates 3.4
18 New RR Crossing Flashing Lights 3.1
19 Pavement Marking and Delineation 3.1
20 New RR Crossing Lights & Gates 2.9
(Table data are from Rea et al. 2009 [10])

Evaluation of Cost Effectiveness of Illumination as a Safety Treatment at Rural Intersections
20

Evaluation of Cost Effectiveness of Illumination as a Safety Treatment at Rural Intersections
21
SECTION B: A REVIEW OF RURAL INTERSECTION ILLUMINATION
PRACTICES – SURVEY OF STATE TRANSPORTATION AGENCIES
B.1 Introduction
This section presents the results of a survey of rural intersection illumination practices among
US DOTs. All 50 state DOTs were contacted to participate in the survey. The research team
administered contact mostly through telephone interviews; however, there were a few states that
preferred an emailed survey questionnaire. As of the time of writing this report, the survey had
been successfully administered to 24 of the 50 state DOTs. The responding states are shown
below in Figure 1. The survey questionnaire can be found in the Appendix.
Figure 1 States Responding to Survey

Evaluation of Cost Effectiveness of Illumination as a Safety Treatment at Rural Intersections
22
B.2 Survey Results
Of the responding state agencies, 23 indicated that they use developed standards/guidance in
illuminating rural intersections. Out of this group, two agencies use only the Illuminating
Engineering Society of North America (IESNA) standard; six agencies use only the American
Association of State Highway and Transportation Officials (AASHTO) guidelines; four agencies
use a state-specific guidelines; four agencies use a combination of IESNA, AASHTO, and state-
specific guidelines; six agencies use a combination of IESNA and AASHTO guidelines; and one
agency did not give a valid response. Figure 2 shows a graphical representation of this
breakdown in percentages.
Figure 2 Developed Illumination Guidelines in Use by DOTs
0
5
10
15
20
25
30
% o
f R
esp
on
din
g St
ate
s
Developed Illumination Guidelines in Use by DOTS

Evaluation of Cost Effectiveness of Illumination as a Safety Treatment at Rural Intersections
23
The states were asked about their rural illumination policies. None of the respondents had a
systematic rural conventional intersection illumination policy. All 24 states gave a valid response
to this question. Their responses break down as follows: three agencies (13 percent) said they
illuminate if signalized or requested by local government; one agency (4 percent) indicated that it
illuminates an intersection if it is on two US routes, a US route and state route, or two state
routes; 13 agencies (54 percent) said they treated illumination on a case-by-case basis with
decision falling on warrants or engineering judgment; and five agencies (21 percent) said they
had no policy and the decision rests with the local government.
The survey asked the agencies if they sometimes use nonstandard lighting and also how the
agencies made decisions to use standard or nonstandard illumination. Nonstandard lighting (i.e.,
lighting that does not meet the recommended minimum illumination level) can usually be
identified as a single pole with one luminaire. The survey results from these questions indicate
that nine agencies (38 percent) sometimes use nonstandard lighting while the remaining 15
agencies (62 percent) strictly use standard lighting. Only 10 agencies (58 percent) were unable to
give the factors that drive decisions to install standard lighting or nonstandard lighting. Among
these 10 agencies, standard lighting is installed according to the following criteria:
If the intersection is on a state-managed facility (one agency)
If the location has a history of high crash frequency (two agencies)
When requested by the local government (one agency)
On a case-by-case basis (three agencies)
If funding is from a federal source (one agency)

Evaluation of Cost Effectiveness of Illumination as a Safety Treatment at Rural Intersections
24
Also, two agencies indicated that they use nonstandard lighting for destination lighting to give
drivers advance warning of the presence of the intersection. Some of the factors that influence
the case-by-case decisions include a geometry that can violate driver expectancy, or presence of
a raised median on the leg. Figure 3 summarizes the reasons given by the DOTs for illuminating
rural intersections with standard lighting.
Figure 3 Reasons for Illuminating Rural Intersections
The survey next asked if cost-effectiveness is considered in the design process for rural
intersection illumination and, if so, how it is done. The responses to the cost-effectiveness
question indicated that about 13 agencies (54 percent of the respondents) consider cost-
effectiveness in the design process. However, the latter follow-up question revealed that only a
small number actually considered cost-effectiveness: four agencies (17 percent) included a real
benefit–cost analysis in the design process, six agencies (25 percent) equated cost-effectiveness
0
2
4
6
8
10
12
14
StateManaged
Facility
High CrashHistory
FundingSource isFederal
LocalGovernment
Request
EngineeringJudgment
% o
f R
esp
on
din
g St
ate
s
Reasons DOTs use Standard Lighting at Rural Intersections

Evaluation of Cost Effectiveness of Illumination as a Safety Treatment at Rural Intersections
25
to cost minimization through the bidding process or through the use of low-cost technology (e.g.,
LED vs HPS), and the remaining three agencies (13 percent) considered cost-effectiveness in
terms of maximized safety benefit (or crash reduction benefits; i.e., cost is a minor issue). Figure
4 summarizes the indicated strategies used by the DOTs to assess the cost-effectiveness of rural
intersection lighting.
Figure 4 Indicated Strategies used by States to Assess Cost-effectiveness
of Rural Intersection Lighting
Also, 12 agencies (50 percent of the responding states) indicated that they use alternatives to
illumination for nighttime safety at rural intersections. The alternatives used by these states
include retroreflective signage, markings, and stripping to delineate edges. Others also rely on
transverse rumble strips, raised pavement markers, and flashing beacons.
The survey results showed that limited comprehensive research is being done by state agencies to
see how applicable published national crash modification factors (CMFs) are to their local
conditions. When asked if they have found a relationship between illumination levels and
0
5
10
15
20
25
30
Benefit-to-Cost Analysis Cost Minimization in BidProcess
Safety BenefitMaximization
% o
f R
esp
on
din
g St
ate
s
Indicated Strategies to Assess Cost-effectiveness of Rural Intersection Lighting

Evaluation of Cost Effectiveness of Illumination as a Safety Treatment at Rural Intersections
26
observed crashes and/or injury severities at rural intersections, 19 agencies (79 percent of the
states) said they have not done any studies to evaluate the effectiveness of lighting. These states
rely on only published studies from the federal administration. None of the responding states
could provide any published figures or documentation on their illumination costs. This is not
surprising since most of the agencies indicated they do not consider cost-effectiveness.
Finally, nine agencies (38 percent of the responding states) said changes to their intersection
illumination policy were being considered. These changes seem driven by the need to reduce
costs in the form of adopting LED luminaire technologies and using reduced illumination levels.

Evaluation of Cost Effectiveness of Illumination as a Safety Treatment at Rural Intersections
27
SECTION C: ESTIMATION OF THE SAFETY IMPACT OF
ILLUMINATION AT RURAL CONVENTIONAL INTERSECTIONS IN
GEORGIA
C.1 Introduction
The effectiveness of roadway illumination as a crash countermeasure has been well established
through previous research studies as outlined in Section A (Literature Review). An
overwhelming majority of these studies are based on a binary (i.e., lit or unlit) lighting variable
due to a lack of available repositories of quantitative roadway illumination-level data.
Consequently, the current version of the Highway Safety Manual is lacking a quantitative
illumination crash modification factor. The available CMF is an aggregated value, which is
largely uninformative in terms of the crash reduction response/impact of different doses of
illumination levels. This implies that transportation agencies are unable to undertake more
detailed benefit and cost tradeoff analysis that could maximize the benefit-to-cost ratios of their
investments in roadway illumination.
This section presents the methodology and analysis performed in this project on rural
conventional intersection crash and illumination data to estimate the safety impact of different
quantitative illumination levels. The results from this section form the basis for evaluation of the
benefits and costs of providing lighting for rural conventional intersections in Georgia. In this
report, rural conventional intersections are referred to as rural intersections.

Evaluation of Cost Effectiveness of Illumination as a Safety Treatment at Rural Intersections
28
C.2 Data Requirements and Availability
C.2.1 Minimum Data Requirements
A successful evaluation of the effect of illumination on rural intersection safety requires the
simultaneous availability of several types of data: crash data, roadway characteristics,
intersection characteristics (including intersection type and presence/absence of purpose-built
lighting and illumination levels), and traffic data. Historical sunrise and sunset data are also
required to establish times for civil twilight.
The crash data must provide case-by-case information on accidents within the study period. At a
minimum it must include the following information:
Date of accident
Accident or case ID
Time of accident
Location of accident (roadway and milepost or latitude/longitude, rural/urban
designation, road segment or intersection)
Crash severity (fatal, serious, injury, possible injury, and property damage only [PDO]).
The roadway characteristics data must include information that allows the identification of
different homogenous segments (e.g., county route name, number of lanes, width of lanes, posted
speed limits, beginning milepost, and ending milepost). It must also distinguish between one-
way and two-way segments for accurate computation of intersection entering volumes.
Also, there must be information on the intersections of interest within the study area. Information
must be available as follows:

Evaluation of Cost Effectiveness of Illumination as a Safety Treatment at Rural Intersections
29
Intersection type
Traffic control mechanism
Illumination levels
Location (rural/urban designation, route, and milepost)
Traffic volume data or the annual average daily traffic (AADT) for every intersection leg
for all the years of the analysis period
Also, historical sunrise and sunset data with adjustments for daylight savings are needed to
distinguish nighttime crashes from daytime crashes.
C.2.2 Data Sources
C.2.2.1 Existing Databases
This study uses crash data obtained from the Georgia crash database for accident information.
The crash data cover years 2009 to 2014. The study period was selected based on the availability
of roadway exposure data that could be computed into daily entry volumes (DEV) for
intersections. These exposure (i.e., AADT) data were extracted from the Georgia Department of
Transportation RCLINK database for roadway information. The available RCLINK database
covers years 2009–2012. Therefore, the researchers projected the exposure data for years 2013
and 2014 by applying a 1 percent growth rate for each year to the known 2012 AADT. The
RCLINK database also provided other roadway characteristics information such as one-way
designations and rural/urban coding of intersection locations. Also, it includes intersection-level
information such as name, type of intersection, traffic control, and layout (four legs or three
legs). C.2.2.2 Field Surveys

Evaluation of Cost Effectiveness of Illumination as a Safety Treatment at Rural Intersections
30
The RCLINK database lacked information regarding intersection illumination. Therefore,
quantitative intersection illumination data were collected from 60 rural intersections in Georgia.
The illumination data collected from the rural intersections measure the luminance from the road
surface. Luminance refers to reflected light from the pavement surface into the eye of the
observer. This is the brightness seen by a driver. The luminance values were converted into the
equivalent illuminance values by dividing with the pavement reflection coefficient [36, 38].
Illuminance is the lighting performance value usually recommended for conflict areas such as
intersections. Illuminance refers to incident light on the pavement surface.
The field survey collected additional intersection data such as number and width of lanes,
presence of horizontal curves, intersection skew angle, and presence of rumble strips on
intersection approaches.
C.3 Methodology
This section explains the methodology for selecting the 60 rural intersections where illumination
data were collected. The intersections were selected from a pool of rural intersections around
Georgia. A quasi-random process was used to ensure that all 60 selected intersections (a) were
unsignalized, (b) had all legs paved, (c) had a minimum AADT of 500, (d) had at least one leg on
a state or county route, and (e) were not part of an interchange. This section describes the
selection of a larger set of rural intersections that were used to establish the applicability of the
study results to the bigger population of rural intersection crashes. This larger set of intersections
was subjected to the same selection criteria except for the condition that all intersection legs
should be paved. The methodologies for computing the intersection daily entry volumes, as well
as volume-weighted crash rates, are explained. Finally, this section explains the photographic

Evaluation of Cost Effectiveness of Illumination as a Safety Treatment at Rural Intersections
31
method of light measurement and the roadway luminance sampling methodology used to make
in-situ measurements from the 60 intersections.
C.3.1 Selection of 60 Rural Intersections for Luminance Measurement
The rural intersections were selected from areas around four cities within Georgia: Dalton,
Atlanta, Cochran, and Brunswick. The quasi-random selection process for these intersections
involved the steps described below. There is currently no intersection inventory database for
Georgia; however, the GDOT RCLINK database for road inventory has a companion GIS
(Geographic Information System) shapefile that can be spatially analyzed to extract information
on the intersections/nodes.
C.3.1.1 GIS Analysis
First, an ArcGIS® file containing nodes within the Georgia road network was used in a spatial
intersection analysis of the GDOT RCLINK shapefile to extract node (intersection) information
on the names of the connecting links (road segments). Next, duplicate nodes were eliminated and
nodes with either less than three or more than four connecting legs were eliminated.
Following this, the research team performed a spatial buffer analysis on the nodes to select all
those within 50 miles of the four cities. This buffer analysis was followed by a database analysis
on the attribute table to select only the nodes with at least one link/leg on the state or county
route. Last, ArcGIS® was used to extract the latitude and longitude of each intersection.
C.3.1.2 Google Earth Analysis
All the latitude and longitude pairs were uploaded into Google Earth® and each of the rural
intersections was visually checked to ensure that no interchanges or interchange terminals had

Evaluation of Cost Effectiveness of Illumination as a Safety Treatment at Rural Intersections
32
been selected. Also, the streetview function in Google® Earth was used to check each approach
up to about 400 ft upstream of the stop line to collect information on posted speed limits.
Additionally, streetview was used to identify and omit signalized intersections and intersections
where all the legs are not paved. Signalized intersections were omitted because they would
complicate the analysis for illumination impact. Also, intersections with unpaved legs were
omitted because unpaved roads are associated with low levels of traffic exposure. Also, the
streetview function was used to identify the layout of luminaires on the approaches as well as the
presence of abutting buildings/facilities such as stores and gas stations that might unintentionally
serve as other sources of lighting for drivers approaching the intersection.
All the rural intersections were then assigned to one of three illumination groupings based on the
identified luminaire layout. The first illumination category is “None” and it refers to a site where
there is no purposely built street light on the approaches. Thus, a site with no fixed street lighting
but a gas station located at the intersection corner with bright lights that illuminate parts of the
intersection would still be considered “None.” The second category is “Partial” and it refers to a
site where (a) some of the approaches have no installed lighting, (b) there are luminaires within
400 feet upstream of the intersection on the approach but no luminaire at the intersection itself,
or, (c) lighting is provided at the intersection but there is none on the approaches. The “Full”
illumination category applies to sites with installed fixed lighting on both its approaches as well
as the intersection.
C.3.1.3 Selection of Final 60 Intersections for Luminance Measurement
The daily entering volume was computed for each intersection by summing all the approach
AADTs for each analysis year. Those with missing AADTs were omitted from further analysis.
The computed annual DEVs were then averaged to obtain a mean for the analysis period. This

Evaluation of Cost Effectiveness of Illumination as a Safety Treatment at Rural Intersections
33
mean was used to assign each intersection an exposure code of High or Low. Intersections with
DEV not exceeding 4000 vehicles were assigned to Low. Also, all locations with DEV less than
500 were omitted. This final filter resulted in a total of 148 candidate intersections.
Each of the 148 intersections had an illumination category code as well as a DEV code.
Therefore, there were six unique combinations: None-Low, None-High, Partial-Low, Partial-
High, Full-Low, and Full-High. Next, 10 intersections were randomly selected from each of
these combination groupings to obtain a final selection of 60 conventional intersections.
Table 2, Table 3, and Table 4 present the list of intersections selected with no dedicated
illumination, partial illumination, and full illumination, respectively. Figure 5 and Figure 6 also
show maps of Georgia with the intersection locations identified and labeled with the intersection
ID on the map.

Evaluation of Cost Effectiveness of Illumination as a Safety Treatment at Rural Intersections
34
Table 2 Selected Rural Intersections with No Dedicated Illumination
ID Area
Illumination
Scheme
6-Year
AADT Latitude Longitude
1 Atlanta None 12020 33.610942 −84.164771
2 Atlanta None 12040 33.328946 −84.506553
3 Atlanta None 8866 33.460053 −85.128609
4 Dalton None 9979 34.369142 −85.003718
5 Cochran None 18155 32.551695 −83.610783
6 Dalton None 9124 34.688607 −84.466841
7 Dalton None 6377 34.9748 −85.403825
8 Dalton None 5736 34.4693954 −85.3867744
9 Dalton None 7740 34.640838 -84.507932
10 Cochran None 4501 32.1810091 −84.134394
11 Atlanta None 2471 33.409001 −83.760712
12 Cochran None 1980 31.692196 −83.113783
13 Cochran None 1256 31.752663 −83.677117
14 Cochran None 2447 32.431813 −84.002947
15 Cochran None 612 32.412943 −83.933468
16 Dalton None 2112 34.927671 −85.5869896
17 Dalton None 3938 34.9765363 −85.3667792
18 Cochran None 3986 31.942601 −83.738504
19 Cochran None 837 32.123434 −82.863377
20 Cochran None 2647 32.27341 −82.710022

Evaluation of Cost Effectiveness of Illumination as a Safety Treatment at Rural Intersections
35
Table 3 Selected Rural Intersections with Partial Illumination
ID Area
Illumination
Scheme
6-Year
AADT Latitude Longitude
21 Atlanta Partial 8145 33.510852 −84.439024
22 Dalton Partial 7512 34.8936246 −85.1848787
23 Brunswick Partial 4327 31.743804 −81.439981
24 Dalton Partial 4079 34.484807 −85.479902
25 Dalton Partial 9206 34.684957 −84.474753
26 Dalton Partial 5468 34.8706584 −85.2287353
27 Dalton Partial 11418 34.9283653 −85.2109702
28 Dalton Partial 5389 34.977439 −85.415864
29 Cochran Partial 11042 32.495781 −83.607992
30 Cochran Partial 6529 32.859922 −83.347219
31 Brunswick Partial 1630 31.633891 −81.396489
32 Dalton Partial 1235 34.49462 −84.452927
33 Dalton Partial 1792 34.978912 −85.433719
34 Dalton Partial 3676 34.8073337 −85.3892644
35 Dalton Partial 3441 34.7938924 −85.334694
36 Cochran Partial 1085 32.204694 −82.668616
37 Cochran Partial 2630 32.2589 −82.700656
38 Cochran Partial 1822 32.806965 −82.913333
39 Cochran Partial 2913 32.810497 −82.757167
40 Cochran Partial 3480 31.944808 −83.54261

Evaluation of Cost Effectiveness of Illumination as a Safety Treatment at Rural Intersections
36
Table 4 Selected Intersections with Full Illumination
ID Area
Illumination
Scheme
6-Year
AADT Latitude Longitude
41 Dalton Full 5934 34.69849 −84.481714
42 Cochran Full 5559 32.541576 −82.903634
43 Dalton Full 8483 34.694238 −84.481535
44 Dalton Full 5697 34.689081 −85.30046
45 Dalton Full 7982 34.69774 −84.481912
46 Atlanta Full 12176 33.565767 −85.045059
47 Atlanta Full 16192 31.85 −81.595833
48 Atlanta Full 15019 33.441022 −84.457578
49 Brunswick Full 8866 33.46 −85.128611
50 Atlanta Full 15430 33.368122 −84.779261
51 Dalton Full 2767 34.696972 −84.480126
52 Cochran Full 1324 31.807311 −83.487729
53 Cochran Full 1978 31.948536 −83.456307
54 Cochran Full 2156 31.949674 −83.454632
55 Cochran Full 1695 31.946251 −83.456309
56 Cochran Full 921 32.18756 −82.566154
57 Cochran Full 1378 32.53928 −82.90251
58 Cochran Full 1037 31.809023 −83.490021
59 Cochran Full 2084 31.949702 −83.45626
60 Atlanta Full 1566 33.791296 −83.596102

Evaluation of Cost Effectiveness of Illumination as a Safety Treatment at Rural Intersections
37
Figure 5 Locations of Intersections in the Northern Half of Georgia

Evaluation of Cost Effectiveness of Illumination as a Safety Treatment at Rural Intersections
38
Figure 6 Locations of Intersections in the Southern Half of Georgia

Evaluation of Cost Effectiveness of Illumination as a Safety Treatment at Rural Intersections
39
C.3.2 Selection of All Eligible Rural Intersections
It was necessary to develop a separate database of all eligible rural intersections in order to
analyze them in comparison with the smaller number of survey intersections. This comparison
identified any differences between the two datasets that can hinder a direct application of the
findings from the survey intersections to the larger population.
There is currently no intersection inventory database for Georgia. However, the GDOT RCLINK
database for road inventory has a companion GIS shapefile that can be spatially analyzed to
extract information on the intersections/nodes. Therefore, the selection process started with a
GIS spatial analysis of the shapefile and was followed with a regular database analysis of all
extracted intersection data.
C.3.2.1 GIS Analysis
A spatial intersect analysis of an ArcGIS® ® shapefile of nodes in the Georgia road network and
the GDOT RCLINK road network shapefile was used to obtain the name, traffic exposure, and
RCLINK ID for each intersection leg in Georgia. ArcGIS® was used to extract the easting and
northing (in feet) of each intersection, and this was later converted into the corresponding
decimal degree latitude and longitude values.
The extracted intersection information was analyzed with a filter that selected only three-leg and
four-leg rural intersections. This filter identified a total of 306,999 eligible rural intersections.
RCLINK IDs of the intersection legs were found in the GDOT RCLINK shapefile under the
INVROUTE field. Next, all intersections with no missing RCLINK ID and road name for each
leg were selected. This was necessary because while the RCLINK database can be used to
identify an intersection leg based on the RCLINK ID, the adjoining intersection legs can only be

Evaluation of Cost Effectiveness of Illumination as a Safety Treatment at Rural Intersections
40
identified by their names. This filter reduced the number of eligible rural intersections to
251,928.
C.3.2.2 RCLINK Data Analysis
A query was run (using the information on the 251,928 intersections created from the spatial
analysis) on each annual RCLINK database (i.e., 2009–2012) to identify the legs of the rural
intersections. For each identified intersection leg the AADTs, traffic control, one-way
designation, and rural/urban codes were extracted. Next, any intersections with missing leg
AADTs for any of the analysis years was filtered out. This further reduced the eligible
nodes/intersections as shown in Table 5.
Table 5 Number of Rural Intersections with No Missing AADT Information
Annual Node-RCLINK File Number of Eligible Nodes/Intersections
2009 75,687
2010 75,687
2011 79,334
2012 71,736
For each annual set shown in Table 5, further analyses were conducted to omit all nodes with a
traffic control code other than the RCLINK codes shown in the bullet list below.
A – Stop sign
C – Stop sign (all directions)
O – Stop sign (opposite direction of inventory)
Y – Yield sign
W – Yield sign (opposite direction of inventory)
Table 6 shows the total number of identified stop-controlled and uncontrolled intersections in
each annual RCLINK database. These intersections were compared across the years and only

Evaluation of Cost Effectiveness of Illumination as a Safety Treatment at Rural Intersections
41
those available for each year were selected, resulting in 22,431 eligible rural intersections for
each year.
Table 6 Number of Available Stop or Yield Control Rural Intersections
Annual Node-
RCLINK File Total Rural Area Urban Area
2009 73,402 28,876 44,526
2010 73,402 28,876 44,526
2011 76,987 31,347 45,640
2012 69,400 27,968 41,432
C.3.3 Computation of Intersection Daily Entering Volume
The daily entering volume was computed for each intersection by summing all the approach
AADTs. AADTs on one-way legs that exit the intersection were omitted. AADT on two-way
approaches were split into two, and only one half was included in the analysis. The assumed
50/50 split was necessary because the actual split of traffic between the two directions on a two-
way road was not available in the RCLINK files. Annual entering volumes were calculated by
multiplying these DEVs by 365. Also, the nighttime AADT split was assumed to be 24 percent.
Next, all intersections with a DEV of less than 500 were omitted from the analysis. This filtering
further reduced the number of eligible rural intersections for each analysis year to 18,893.
C.3.4 Treatment of the Georgia Crash Data
GDOT’s crash database contains about 46 sub-datasets, which can be electronically merged
through the incident ID variable. One of these datasets is the Incident Table, which primarily
contains information on incident ID; incident date; incident location variables (city, county,
latitude, longitude); main road on which crash occurred; nearest intersecting road; distance to
nearest intersection; and a variable indicating whether the crash occurred at an intersection, near

Evaluation of Cost Effectiveness of Illumination as a Safety Treatment at Rural Intersections
42
an intersection, at an interchange, or on a private property. There is also a Collision Table that
gives further information on each incident (e.g., the type of injury severity and number of people
involved).
Similar to most crash databases, the GDOT database has some data quality issues; chief amongst
them are missing variable information and possibly wrongly coded location information.
Identification of incident records with missing variable information can be easily accomplished
with a simple database query. However, deciphering the incident records with wrongly entered
data would require a rigorous quality-assurance/quality-control (QA/QC) procedure for the over
1.85 million crash records within the analysis period of 2009–2014. In addition, for each of the
1.85 million crash records, there are 18,893 candidate intersections that must be manually
checked before a crash can be assigned to an intersection. This would require an extremely large
number of man-hours if the rigorous manual QA/QC approach is adopted.
A possible solution would have been to create a control group out of the 18,893 intersections for
use in the analysis. However, the selection of the control group might introduce additional biases
if it is not truly representative of the population. Using a control group of intersections also
means that some crashes would be unnecessarily excluded from the analysis. Therefore, the
research team favored a method that is inclusive of as many intersections and crashes as possible
(based on limitations of available data) with a reasonable degree of accuracy. Analysis of the
crash data showed that 16.5 percent of crashes had the RCLINK ID of the location coded, while
about 71 percent of crashes had the latitude and longitude of the location coded. Therefore, a
shortest distance algorithm that makes assignments based on the latitude/longitude of
intersections, latitude/longitude of crashes, and a buffer distance of 250 ft was adopted. This

Evaluation of Cost Effectiveness of Illumination as a Safety Treatment at Rural Intersections
43
method could be limited by the accuracy of the coded latitude and longitude information.
However, it offers the most pragmatic approach for this study.
C.3.5 Computation of Crash Rates
A volume-weighted method was used to compute the crash rate for each intersection over the
entire analysis period. Equation 3 shows the formula for computing the volume-weighted crash
rate. The volume-weighted analysis minimizes the possible effect of trend/temporal effects.
𝑐𝑟𝑎𝑠ℎ 𝑟𝑎𝑡𝑒 = 1000000 ∗ 𝑠𝑢𝑚 𝑜𝑓 𝑐𝑟𝑎𝑠ℎ𝑒𝑠 𝑖𝑛 𝑎𝑛𝑎𝑙𝑦𝑠𝑖𝑠 𝑝𝑒𝑟𝑖𝑜𝑑
𝑠𝑢𝑚 𝑜𝑓 𝑎𝑛𝑛𝑢𝑎𝑙 𝑡𝑟𝑎𝑓𝑓𝑖𝑐 𝑣𝑜𝑙𝑢𝑚𝑒(𝑠) (𝟑)
C.3.6 Measurement of Intersection Illumination Levels
Like most states, Georgia does not have archived intersection illumination-level data. Therefore,
this study undertook a data collection effort whereby actual intersection illumination-level data
were measured from 60 rural intersections. Illuminance measurements require in-situ spot
measurements, with a hand-held illuminance meter, from an imaginary 6 6 ft grid within the
intersection area. This procedure requires both data collection personnel and equipment in the
active travel lanes, posing increased risk. To mitigate the risks of using this method for all 60
rural intersections, which are located on state routes, would require extensive traffic management
and road closures with possible coordination between multiple agencies, including the police.
This is likely to increase costs in terms of man-hours and measurement time.
C.3.6.1 Existing Methods for Illuminance Measurement
As discussed in the literature review in Section A, luminance can alternatively be measured and
converted into an equivalent illuminance measurement. There are two major existing protocols

Evaluation of Cost Effectiveness of Illumination as a Safety Treatment at Rural Intersections
44
for roadway luminance measurement. The first protocol is a European standard developed by the
CIE [32] and the second protocol is a North American standard developed by the Illuminating
Engineering Society (IESNA) [56]. A third and less common protocol has been developed in
New Zealand [57] in response to the very time-consuming requirements of the two major
protocols.
Even though the protocol developed in New Zealand is more streamlined than the other two, all
three methods are time consuming because they require the use of high-precision hand-held light
meters to make many spot measurements of luminance from long distances (CIE ≈ 60 meters,
IES ≈ 84 meters, New Zealand ≈ 33 meters) and very small observation angles (1° for CIE and
IES, and 2° for the New Zealand method). Therefore, they do not seem practical for measuring
illumination from a large number of intersections as this study attempts. Additionally, these
methods have three major limitations:
a) It is difficult to reproduce measurements.
b) Measurements are usually not made at the same luminance constancy because luminaire
output is subject to AC voltage fluctuations.
c) It is impossible to make spot measurements from such long distances as the methods
require because actual measurement areas become elliptical, several feet long and wide.
As a result of these limitations, researchers in this study opted to use a photographic method to
measure luminance levels at the intersections. The sampling method used is a slight variation of
the New Zealand method since it allows measurements to be made at shorter distances with both
personnel and equipment on the road shoulder, away from the active travel lanes. Furthermore,

Evaluation of Cost Effectiveness of Illumination as a Safety Treatment at Rural Intersections
45
the New Zealand method does not require personnel and equipment in the active travel lanes.
Therefore, it carries less risk to the data collectors and is also less resource intensive.
C.3.6.2 The Photographic Method
The photographic method of evaluating lighting levels offers an effective solution to the
challenges involved with using hand-held illumination meters to evaluate intersection
illumination levels. The photographic method is able to achieve luminance constancy that
reduces variation in luminance during measurements because the luminance is
measured/captured at the same time [58]. Also, because the luminance information is captured in
an image, the method guarantees repeatability. Uncertainties associated with re-identifying the
exact points in the field where measurements were made are eliminated.
The photographic method is an image-analysis approach that can be used to extract pixel-level
luminance information from an image taken with a digital camera. A digital camera can
effectively serve as a luminance meter because the output from each element of its imaging array
is proportional to the luminance of some scene element modified by the optical properties of the
lens system and the exposure settings of the camera [59]. By calibrating a digital camera, the
pixel intensities in an image can be linked to the scene luminance through a specific camera
calibration constant [59]. The relationship between pixel intensity and scene luminance can be
expressed as in Equation 3 [59].
𝑁𝑑 = 𝐾𝑐 (𝑡𝑆
𝑓𝑠2) 𝐿𝑠 ……… (4)
Where:
Nd is the digital number or pixel intensity in the image
Kc is the calibration constant of the camera

Evaluation of Cost Effectiveness of Illumination as a Safety Treatment at Rural Intersections
46
t is the exposure time in seconds
fs is the aperture number (f-stop)
S is the ISO sensitivity of the film
Ls is the luminance of the scene (cd/m2)
This is essentially an equation of a straight line with slope of Kc and zero intercept, and it implies
that under proper exposure conditions (i.e., no saturation in the image) pixel intensity (Nd) will
vary linearly with the exposure time, the ISO sensitivity, and the squared inverse of aperture.
Hiscocks and Eng [59] showed that this relationship holds true for ISO and exposure time at all
exposure settings of a digital camera. Figure 7 shows the relationship between pixel intensity and
exposure time, while Figure 8Figure 8 shows the relationship between pixel intensity and ISO.
However, they found that at larger apertures (i.e., below f/4.0) the relationship between pixel
value and aperture became nonlinear. It is unclear whether the observed threshold between
linearity and nonlinearity is device specific since they used a single camera in their study and
there is no verification of the phenomenon across other devices. Figure 9 shows the relationship
between pixel intensity and aperture size.

Evaluation of Cost Effectiveness of Illumination as a Safety Treatment at Rural Intersections
47
(Source: [59])
Figure 7 Exposure Time vs. Pixel Intensity
(Source: [59])
Figure 8 Pixel Intensity vs. ISO Sensitivity
(Source: [59])
Figure 9 Pixel Intensity vs. Aperture

Evaluation of Cost Effectiveness of Illumination as a Safety Treatment at Rural Intersections
48
There are a few minor limitations of the photographic method for illumination measurement.
First, it is best to store images in a lossless format such as TIFF rather than a compressed format
like JPEG. However, the TIFF format has a downside of putting a constraint on storage space
due to very large image files. Next, as pixel intensity in an image increases, the relationship
between pixel intensity and luminance becomes nonlinear. Therefore, images should be taken in
the underexposed range. Underexposed images are generally dark and, depending on the level of
illumination at a site, the images could be too dark to permit easy identification of the
intersection’s layout later. Therefore, at least one overexposed image of the site must also be
taken. Finally, there is often a decrease in light transmission at the ends or periphery of a digital
camera lens [59]. This is known as vignetting. According to Inanici [60], vignetting increases
with aperture size. Therefore, smaller apertures should generally be used. Also, intersection
images must be centered so that the image has enough room around the intersection and no part
of the intersection falls in the vignetting-affected zones.
In this study, researchers calibrated two digital single lens reflex cameras for use in measuring
illumination at the intersections. More information on the calibration process is available in
Gbologah 2015 [61] or Gbologah 2016 [62].
C.4 Results and Discussion
The results presented in this section are based on only crashes that were successfully matched to
rural intersections with the shortest distance algorithm and a buffer of 250 ft.

Evaluation of Cost Effectiveness of Illumination as a Safety Treatment at Rural Intersections
49
C.4.1 Rural Intersection Illumination Levels
All 60 rural intersections were surveyed, but only 43 were eligible for inclusion in the analysis
after detailed analysis of the field results. Some intersections had to be omitted for various
reasons, including installation of signals during the analysis period or conversion to a roundabout
within the analysis period. Figure 10 presents the plot of derived illuminance levels at the 43
rural intersections. All the intersections studied are isolated traffic conflict areas without
continuous lighting. Therefore, their recommended maintained average illuminance level should
not be greater than 9.0 lux [63]. Table 24 presents further details on illuminance characteristics
of the surveyed intersections including the presence of ambient and/or purpose built lighting,
calculated average uniformity ratios, and measured average illuminance (lux)
Figure 10 Estimated Rural Intersection Illuminance
0.00
5.00
10.00
15.00
20.00
25.00
30.00
0 10 20 30 40 50
Illu
min
an
ce (
Lu
x)
Intersection Count
Estimated Average Illumininance at Surveyed Rural Intersections

Evaluation of Cost Effectiveness of Illumination as a Safety Treatment at Rural Intersections
50
C.4.2 Injury Severities
The Georgia crash database categorizes crashes as fatal, injury, or PDO. Table 7 and Table 8
respectively, present the observed distribution/proportions of these injury severities for nighttime
and daytime crashes for three different subsets of the Georgia crash database.
Table 7 Observed Proportions of Nighttime Crash Severity Types
Proportion of Crash Severities
Dataset Fatality Injury PDO
Surveyed Intersections 0.02 0.27 0.71
Rural Intersections Only 0.01 0.27 0.72
All Intersections 0.01 0.27 0.72
Table 8 Observed Proportions of Daytime Crash Severity Types
Proportion of Crash Severities
Dataset Fatality Injury PDO
Surveyed Intersections 0.02 0.34 0.64
Rural Intersections Only 0.01 0.33 0.66
All Intersections 0.01 0.33 0.66
The proportions of fatal crashes, injury crashes, and PDO crashes in both Table 7 (nighttime
crashes) and Table 8 (daytime crashes) show that there isn’t much difference between the
observed crash occurrence at the surveyed intersections, rural intersections, and all intersections.
Therefore, the sample intersections that were surveyed are a good representation of rural
intersection.
The “injury” crash severity as shown in Table 7 and Table 8 is usually further broken down into
severe crashes, injury crashes, and possible injury crashes. Severe injury crash refers to a crash
where the victim required transportation to the hospital, injury crash refers to a crash where the
victim is physically injured but did not require transportation to the hospital, while possible

Evaluation of Cost Effectiveness of Illumination as a Safety Treatment at Rural Intersections
51
injury crash refers to a crash where an injury could not be physically confirmed on-site. Analysis
of available (most recent) 2000 to 2006 data from the Georgia Governor’s Office of Highway
Safety [64] shows that the injury crashes in Georgia break down into 4.5 percent serious injury,
24.1 percent visible injury, and 71.4 percent complaint. This distribution was used to
proportionately split the observed 26 percent injury crashes at rural intersections in Table 7 to
yield the final crash injury severity distribution shown in Table 9.
Table 9 Distribution of Crash Severity Types within
Nighttime Rural Intersection Incidents in Georgia
Injury Severity Proportion
Fatal 0.02
Severe 0.01
Injury 0.07
Possible Injury 0.19
PDO 0.71
C.4.3 Overview of Observed Crash Experience at the Studied Intersections
Of the 43 available intersections, 26 had neither nighttime nor daytime crashes within the 6-year
analysis period. The measured illuminances within this set ranged from 0 to about 25 lux, while
AADTs ranged from about 800 to 8100 vehicles per day. The other 17 intersections, which had
at least one crash, had measured illuminances ranging from 0 to about 9 lux, while their AADTs
ranged from about 612 to 10,000 vehicles per day. Figure 11 shows a comparison of the daytime
and nighttime crash rates at all 43 intersections. Both the observed daytime and nighttime crash
rates decrease with increasing average intersection nighttime illuminance. However, the
reduction is much steeper for nighttime than for daytime. This is an indication that illumination
may have an effect on nighttime crashes because it is the only safety influence factor that truly
separates nighttime and daytime crash experience. Figure 11 further indicates that part of the

Evaluation of Cost Effectiveness of Illumination as a Safety Treatment at Rural Intersections
52
observed nighttime crash rate reductions may be unrelated to illumination since daytime crash
rates show the same decreasing trend. Therefore, this unrelated component must be estimated
and excluded from the estimated crash reductions due to illuminance. Since the main difference
between nighttime and daytime conditions is the level of illuminance, this unrelated component
can be fairly assumed as the mean daytime crash rate.
Figure 11 Comparison of Nighttime and Daytime Crash Rate at Intersections

Evaluation of Cost Effectiveness of Illumination as a Safety Treatment at Rural Intersections
53
C.4.4 Effect of Illumination Level on Nighttime Total Crash Rates at Rural
Intersections
As mentioned in Section C.4.3, more than half (26) of the study’s intersections did not
experience any crash within the 6-year analysis period of 2009 to 2014. Even though zero
crashes were observed, the expected number of crashes at these intersections based on
underlying Poisson or negative binomial distribution and the total exposure within the period
may not necessarily be zero. It is possible that a single crash may have been observed given a
different analysis period. Therefore, treating more than half of the available intersections as zero-
crash intersections might lead to erroneous conclusions. Consequently, this study uses a
maximum likelihood method to estimate the 95 percent upper bound crash frequency for each
intersection based on its exposure level.
Statistical analysis of the annual crashes for each of the other 17 intersections that had at least
one observed crash showed that a Poisson crash distribution can be assumed for the intersections.
Therefore, the discrete Poisson probability function was used to estimate the 0.95 cumulative
probability crash frequency, n, given a mean crash frequency, γ, equal to the total crashes
observed over the analysis period. Due to the small number of intersections with observed
crashes and an even smaller crash frequency at the intersections, it was not possible to estimate n
for different injury severity types. Equation 5 shows how n can be estimated from total crashes.
0.95 = ∑𝑒−𝛾𝛾𝑛
𝑛!
𝑛
0 … … … . . (𝟓)

Evaluation of Cost Effectiveness of Illumination as a Safety Treatment at Rural Intersections
54
For the other 26 intersections with no observed crashes, n was estimated by relaxing the discrete
Poisson assumption and assuming a continuous Poisson probability density function as shown in
Equation 6.
0.05 = 𝑒−𝑛 … … … (𝟔)
The estimated 95 percent cumulative crash frequencies were then used to estimate corresponding
upper bound crash rates based on entering volumes. Figure 12 shows the log of observed crash
rates and estimated upper bound crash rates versus illuminance. Also shown on Figure 12 is the
estimated curve of the relationship between illumination level and total crash rate at rural
intersections. The curve meets almost all the upper bound crash frequency constraints and also
averages between the observed crash rates. It is constrained by the horizontal line representing
the mean daytime crash rate. As explained previously, the mean daytime crash rate is assumed in
this study to be representative of the proportion of nighttime crash experience, which is unrelated
to illumination. A dose-response relationship between illuminance and crash rates at rural
intersections is almost non-existent beyond an illuminance level of about 12 lux. Table 10
tabulates the expected percentage reduction in crash rates in response to different illumination
levels.

Evaluation of Cost Effectiveness of Illumination as a Safety Treatment at Rural Intersections
55
Figure 12 Observed Effect of Illumination Level on Total Crash Rates at Rural
Intersections
Table 10 Effect of Different Illumination Levels on Observed Nighttime
Total Crash Rates at Rural Intersections
Average
Intersection
Illuminance
(Lux)
Expected
Reduction in
Nighttime Total
Crash Rates (%)
0 0.00
0.5 3.38
1.0 6.77
2.0 13.54
3.0 20.31
4.0 27.08
5.0 33.85
6.0 40.62
7.0 47.39
8.0 54.16
10.0 60.93
11.0 67.70
11.5 74.47
≥12.0 81.21

Evaluation of Cost Effectiveness of Illumination as a Safety Treatment at Rural Intersections
56
With the estimated crash rate reductions shown in Table 10, the effect of a specific illumination
level for different injury severity types can be estimated by breaking down the crash reduction
estimate according to the injury severity proportions shown in Table 9.
C.5 Summary Findings for Safety Analysis
This report presents the findings of a rural intersection safety analysis performed with crash data
from Georgia. The studied intersections are conventional, non-signalized, and paved four-legged
or three-legged intersections with at least one leg on a state or county route.
Crashes were matched to intersections using a minimum distance algorithm and a buffer distance
of 250 ft. Distance between intersections and recorded crashes were estimated from their
respective latitude and longitude values.
The results show that different illumination levels can provide direct safety benefits compared to
the “no light” situation. Also, the study finds that there is an illuminance threshold beyond which
the dose-response relationship between nighttime crash rate and illuminance becomes non-
existent (i.e., an increase in illuminance does not improve the crash rate any further). This study
finds that for rural conventional intersections in Georgia this illuminance threshold is about 12
lux. The minimum recommended intersection illuminance by the Illuminating Engineering
Society of North America [33] is about 8 lux. This study finds that even lower illuminance levels
can provide significant benefits. Table 10 of this report gives the expected reduction in crash
rates for different illuminance levels.
It was not possible to directly estimate the impact of illumination levels on different crash
severity types due to the relatively small sample of illuminated intersections that could be studied

Evaluation of Cost Effectiveness of Illumination as a Safety Treatment at Rural Intersections
57
in this analysis within the constraints of the budget and time, and even smaller number of crashes
at these intersections. Consequently, the study made a necessary assumption that any observed
effect on total crashes will proportionately split among the different crash severities (fatal,
serious, injury, possible injury, and PDO) based on their distribution within the larger rural
intersection crash dataset.
It is critical in considering these potential benefits of lighting to recall that the impact on
frequency of incidents or expected percentage crash rate reductions may not be justified for all
intersections depending on the average entering volumes, especially for safety programs where
funds may be needed to reduce more substantial risks to the public elsewhere. Making these
decisions requires access to additional decision making tools, such as the Benefit to Cost Model
provided as part of this study, which utilizes the estimated benefits from this section

Evaluation of Cost Effectiveness of Illumination as a Safety Treatment at Rural Intersections
58
.

Evaluation of Cost Effectiveness of Illumination as a Safety Treatment at Rural Intersections
59
SECTION D: BENEFIT-TO-COST ANALYSIS OF RURAL
CONVENTIONAL INTERSECTION ILLUMINATION IN GEORGIA
D.1 Introduction
In this section, the research team presents a limited economic analysis of the costs associated
with illuminating rural conventional intersections in Georgia and the safety benefits (cost
savings) due to illumination. In the first subsection the researchers present the cost analysis for
rural conventional intersection illumination, and in the second subsection they follow up with the
steps undertaken to monetize the associated safety benefits to provide a preliminary estimate of
the benefit-to-cost ratios associated with various illumination levels. They also discuss results
from a spreadsheet model that the research team developed to facilitate the benefit-to-cost
analysis.
D.2 Cost Estimation
The cost estimation analysis considered Philips Lumec® Roadstar LED luminaires ranging from
27 watts to 150 watts. These luminaires were selected because they have been recently used in
the GDOT-sponsored Lighting Operation and Maintenance Study [65]. Illumination models for
different average intersection illuminance levels were developed to estimate their associated
power consumption. The illuminance levels cover the full range of the dose-response
relationship of nighttime crash rate and illuminance identified in Section B of this report.

Evaluation of Cost Effectiveness of Illumination as a Safety Treatment at Rural Intersections
60
Figure 13 Modeled Luminaire Layouts for
Rural Conventional Four-Leg Intersections
D.2.1 Development of the Illumination Models
The models were developed with DIALux® (www.dial.de/en/dialux/), a professional lighting
design software. The lighting models developed are applicable to both three-leg and four-leg
intersections with two-way travel directions on each leg and 13-ft-wide travel lanes. Pole heights
are 35 ft with each pole mounted on a 2-ft-diameter by 8-ft-deep concrete footing. Luminaires
are attached to the poles via 4-ft extension arms. All the developed lighting models meet the
recommended standard [63]; minimum maintained illuminance level, maximum uniformity ratio,
and maximum veiling luminance ratio. Figure 13 and Figure 14 show the luminaire layouts for
four-leg and three-leg intersections, respectively. The modeling also assumed that a photocell
located at a central service station is used to switch luminaires on/off for 12 hours a day.
Figure 14 Modeled Luminaire Layouts for
Rural Conventional Three-Leg Intersections

Evaluation of Cost Effectiveness of Illumination as a Safety Treatment at Rural Intersections
61
Horizontal illuminance was evaluated with a calculation grid covering the entire intersection area
bounded by the corners. The calculation grid also extends 5 ft. on each approach/leg. The
evaluation points within the calculation grid were arranged as a 6 ft. 6 ft. grid. There are many
intersection-related cost factors that could be considered, but for the purposes of this study only
factors that introduce variability were considered. These factors were identified as follows [65]:
Luminaires and associated components
Luminaire poles and arms (overhangs)
Foundations for poles
Cost of replacement parts for maintenance. (This does not include costs due to motor
vehicle damage)
Power consumption
Cost of labor, contractor markup, and other associated fees
All other costs of power distribution and service, such as conduit, conductors, service panels,
grounding, etc., are assumed to be similar for all the intersections.
D.2.2 Illumination Modeling Results and Estimated Costs
The results of the intersection illumination modeling have been summarized in Table 11. These
are the minimum power consumption and luminaire configurations required to meet the modeled
illuminance ranges with the Philips Lumec Roadstar luminaires. The calculated ratios of average
horizontal illuminance (Eavg) to minimum horizontal illuminance (Emin), also called uniformity
ratios, are all below the recommended maximums for major, collector, and local roads [63].
Additionally, the largest calculated veiling luminance ratio for any of the modeled luminaire

Evaluation of Cost Effectiveness of Illumination as a Safety Treatment at Rural Intersections
62
configurations is 0.04 and this meets the recommended maximum veiling luminance ratio of 0.3
[63].
The costs for the various luminaire installation components and the price per kilowatt-hour
(kWh) were obtained from the Lighting Operation and Maintenance Study [65], which was
conducted by Gresham Smith and Partners for GDOT. The cost estimates in that report were in
year 2013 dollars, so they were converted into year 2016 dollars using consumer price index
factors [66]. The annualized installation costs for these components are shown in Table 12. Table
13 presents the estimated annual maintenance costs for each luminaire type modeled, and Table
14 shows the estimated annual energy costs per luminaire type. Table 15 presents the final
estimated costs for each illuminance range and corresponding luminaire configuration/schedule.
All cost estimates have been annualized over a 30-year period at a social discount of 3 percent.
.

Evaluation of Cost Effectiveness of Illumination as a Safety Treatment at Rural Intersections
63
Table 11 Intersection Illuminance, Power Consumption, and Luminaire Configuration Chart
Scenario #
Intersection
Illuminance
(Lux)
Uniformity
Ratio
(Eavg/Emin)
Luminaire
Schedule Philips Product #
Mounting
Height
(ft)
System Power
Consumption
(Watts)
1 2.58 1.09 2 @ 27W 2@GPLS-16L530NW-G2-5 35 54
2 2.59–4.62 1.23 2 @ 27W 2@GPLS-16L530NW-G2-4 35 54
3 4.63–6.14 1.33 2 @ 27W 2@GPLS-16L530NW-G2-R2M 35 54
4 6.15 – 8.07 1.36 2 @ 60W 2@GPLS-60W30LED4K-ES-LE3 35 136
5 8.08 – 11.51 1.53 2 @ 65W 2@GPLS-65W49LED4K-ES-LEH2 35 144
6 11.52 – 13.78 1.52 2 @ 90W 2@GPLS-90W49LED4K-ES-LEH2 35 192
7 13.79 -16.25 1.48 2@ 105W 2@GPLM-105W79LED4K-ES-LEH2 35 238
8 16.26 – 20.99 1.48 2 @ 130W 2@GPLM-130W98LED4K-ES-LEH2 35 277
9 21.00 – 22.93 1.13 4 @ 65W 4@GPLS-65W49LED4K-ES-LEH3 35 288
10 22.94 – 27.56 1.14 4 @ 90W 4@GPLS-90W49LED4K-ES-LEH2 35 384
11 27.57 – 32.61 1.14 4 @ 105W 4@GPLM-105W79LED4K-ES-LEH2 35 476
12 32.62 – 39.82 1.15 4 @ 150W 4@GPLM-150W79LED4K-ES-LEH2 35 680

Evaluation of Cost Effectiveness of Illumination as a Safety Treatment at Rural Intersections
64
Table 12 Estimated Installation Costs per Luminaire Type
# Luminaire
Unit Cost
Photocell
at Service
Point
Cost of
Mounting
Pole
2′ 8′
Pole
Footing
4′
Luminaire
Arm
Contractor
Markup
(%)
Installation
Charge
Total
Cost
per
Item
Annualized
Cost per
Luminaire
Type
1 $526.71 $69.16 $2,128.13 $316.03 $266.02 15% $761 $4,563 $232.79
2 $526.71 $69.16 $2,128.13 $316.03 $266.02 15% $761 $4,563 $232.79
3 $526.71 $69.16 $2,128.13 $316.03 $266.02 15% $761 $4,563 $232.79
4 $633.12 $69.16 $2,128.13 $316.03 $266.02 15% $761 $4,685 $239.03
5 $728.88 $69.16 $2,128.13 $316.03 $266.02 15% $761 $4,795 $244.65
6 $728.88 $69.16 $2,128.13 $316.03 $266.02 15% $761 $4,795 $244.65
7 $1,058.74 $69.16 $2,128.13 $316.03 $266.02 15% $761 $5,175 $264.00
8 $1,058.74 $69.16 $2,128.13 $316.03 $266.02 15% $761 $5,175 $264.00
9 $728.88 $69.16 $2,128.13 $316.03 $266.02 15% $761 $4,795 $244.65
10 $728.88 $69.16 $2,128.13 $316.03 $266.02 15% $761 $4,795 $244.65
11 $1,058.74 $69.16 $2,128.13 $316.03 $266.02 15% $761 $5,175 $264.00
12 $1,058.74 $69.16 $2,128.13 $316.03 $266.02 15% $761 $5,175 $264.00

Evaluation of Cost Effectiveness of Illumination as a Safety Treatment at Rural Intersections
65
Table 13 Estimated Annual Maintenance Costs per Luminaire Type
Scenario
# Wattage Parts Cost
Service
Cost
per
Unit
Rated
Life
(Hours)
First
Maintenance
Occurs
(Years)
Second
Maintenance
Occurs
(Years)
Present
Value
of
Costs
Annualized
Cost per
Item
Annualized
Cost per
Luminaire
Type
1
27 Driver $112 $80 70,000 16.0 32.0 $118.56 $6.05
$14.61 LED Array $192 $80 70,000 16.0 32.0 $167.96 $8.57
2
27 Driver $112 $80 70,000 16.0 32.0 $118.56 $6.05
$14.61 LED Array $192 $80 70,000 16.0 32.0 $167.96 $8.57
3
27 Driver $112 $80 70,000 16.0 32.0 $118.56 $6.05
$14.61 LED Array $192 $80 70,000 16.0 32.0 $167.96 $8.57
4
60 Driver $112 $80 70,000 16.0 32.0 $118.56 $6.05
$16.96 LED Array $266 $80 70,000 16.0 32.0 $214.06 $10.92
5
65 Driver $112 $80 70,000 16.0 32.0 $118.56 $6.05
$19.32 LED Array $341 $80 70,000 16.0 32.0 $260.17 $13.27
6
90 Driver $112 $80 70,000 16.0 32.0 $118.56 $6.05
$19.32 LED Array $341 $80 70,000 16.0 32.0 $260.17 $13.27
7
105 Driver $112 $80 70,000 16.0 32.0 $118.56 $6.05
$26.03 LED Array $553 $80 70,000 16.0 32.0 $391.90 $19.99
8
130 Driver $112 $80 70,000 16.0 32.0 $118.56 $6.05
$26.03 LED Array $553 $80 70,000 16.0 32.0 $391.90 $19.99
9
65 Driver $112 $80 70,000 16.0 32.0 $118.56 $6.05
$19.32 LED Array $341 $80 70,000 16.0 32.0 $260.17 $13.27
10
90 Driver $112 $80 70,000 16.0 32.0 $118.56 $6.05
$19.32 LED Array $341 $80 70,000 16.0 32.0 $260.17 $13.27
11
105 Driver $112 $80 70,000 16.0 32.0 $118.56 $6.05
$26.03 LED Array $553 $80 70,000 16.0 32.0 $391.90 $19.99
12
150 Driver $112 $80 70,000 16.0 32.0 $118.56 $6.05 $26.03
LED Array $553 $80 70,000 16.0 32.0 $391.90 $19.99

Evaluation of Cost Effectiveness of Illumination as a Safety Treatment at Rural Intersections
66
Table 14 Estimated Annual Energy Consumption Costs for Luminaire Configuration
Scenario
#
Luminaire
Schedule
Total System
Power
Consumption
(Watts)
Daily
Hours of
Operation
Total
kWh per
Year
Power
Cost per
kWh
Power
Cost per
Year
1 2 @ 27W 54 12 236.52 $0.12 $28.38
2 2 @ 27W 54 12 236.52 $0.12 $28.38
3 2 @ 27W 54 12 236.52 $0.12 $28.38
4 2 @ 60W 136 12 595.68 $0.12 $71.48
5 2 @ 65W 144 12 630.72 $0.12 $75.69
6 2 @ 90W 192 12 840.96 $0.12 $100.92
7 2@ 105W 238 12 1042.44 $0.12 $125.09
8 2 @ 130W 277 12 1213.26 $0.12 $145.59
9 4 @ 65W 288 12 1261.44 $0.12 $151.37
10 4 @ 90W 384 12 1681.92 $0.12 $201.83
11 4 @ 105W 476 12 2084.88 $0.12 $250.19
12 4 @ 150W 680 12 2978.4 $0.12 $357.41

Evaluation of Cost Effectiveness of Illumination as a Safety Treatment at Rural Intersections
67
Table 15 Estimated Total Annual Costs for Different Intersection Illuminance Level Groupings
Intersection
Illuminance
(Lux)
Luminaire
Configuration
Annual
Unit
Installation
Costs
Annual Unit
Maintenance
Costs
Annual
Energy
Costs
Total Annual
Costs for
Luminaire
Configuration 2.58 2 @ 27W $232.79 $14.61 $28.38 $523.18
2.59–4.62 2 @ 27W $232.79 $14.61 $28.38 $523.18
4.63–6.14 2 @ 27W $232.79 $14.61 $28.38 $523.18
6.15 – 8.07 2 @ 60W $239.03 $16.96 $71.48 $583.47
8.08 – 11.51 2 @ 65W $244.65 $19.32 $75.69 $603.62
11.52 – 13.78 2 @ 90W $244.65 $19.32 $100.92 $628.84
13.79 -16.25 2@ 105W $264.00 $26.03 $125.09 $705.17
16.26 – 20.99 2 @ 130W $264.00 $26.03 $145.59 $725.66
21.00 – 22.93 4 @ 65W $244.65 $19.32 $151.37 $1,207.23
22.94 – 27.56 4 @ 90W $244.65 $19.32 $201.83 $1,257.69
27.57 – 32.61 4 @ 105W $264.00 $26.03 $250.19 $1,410.33
32.62 – 39.82 4 @ 150W $264.00 $26.03 $357.41 $1,517.55

Evaluation of Cost Effectiveness of Illumination as a Safety Treatment at Rural Intersections
68
D.3 Benefit Analysis
The benefits of illuminating rural conventional intersections in Georgia were estimated from the
observed reduction in various injury severity crash rates for different intersection illuminance
levels in Georgia.
D.3.1 Estimating Crash Rate Reductions
Section C of this final report, Estimation of the Safety Impact of Illumination at Rural
Conventional Intersections in Georgia, estimates crash rate reductions for different intersection
illuminance levels compared to the unlit situation. The estimates are for only stop-controlled or
uncontrolled rural intersections with a daily entry volume of at least 500 vehicles. The
illuminance levels used were measured from 43 randomly selected intersections from around
Cochran, Brunswick, Atlanta, and Dawsonville, Georgia. The crash records for these rural
intersections were obtained from the GDOT crash database. The estimated total crash rate
reductions for the different intersection illuminance levels are as shown previously in Table 10.
The data in Table 10 show that beyond an illuminance of 12 lux there is little or no benefit to
additional illumination for rural conventional intersections in Georgia.
As explained in Section C, the sample size of available illuminated intersections was not enough
to permit crash rate reduction analysis for different crash injury severities (fatal, severe, injury,
possible injury, and PDO). Therefore, it is assumed that the estimated crash rate reductions for
total crashes proportionately splits between the crash injury severity types based on their
distribution within the entire Georgia crash database (2009–2014). The Georgia crash database
includes three crash injury severity types: fatal, injury, and PDO. Table 16 gives the distribution
of those three crash injury severity types in the database.

Evaluation of Cost Effectiveness of Illumination as a Safety Treatment at Rural Intersections
69
Table 16 Proportion of Crash Severities in Georgia
Injury Severity Type Surveyed Intersections All Rural Intersections
Fatal Crashes 0.02 0.01
Injury Crashes 0.27 0.27
PDO 0.71 0.72
The “injury” crashes shown in Table 16 are an aggregate of severe injury, injury, and possible
injury severities. Severe injury refers to injuries where the victim requires transportation to the
hospital. Injury refers to crashes where a victim is physically injured but requires no
transportation to the hospital. Possible injury refers to crashes where no physical injury can be
confirmed. Analysis of available crash data from the Georgia Governor’s Office of Highway
Safety (www.gahighwaysafety.org/research/crash-injuries/) disaggregates injury crashes as
shown in Table 17.
Table 17 Distribution of Injury
Crash Severity in Georgia
Type of Injury Proportion
Serious 0.045
Visible 0.241
Complaint 0.714
It should be noted that “serious injury” is equivalent to severe injury as described above, “visible
injury” is equivalent to injury, and “complaint” is equivalent to possible injury. Therefore, the
data in Table 16 and Table 17 were combined to yield the final distribution of nighttime injury
severities at rural conventional intersections shown in Table 18.

Evaluation of Cost Effectiveness of Illumination as a Safety Treatment at Rural Intersections
70
Table 18 Distribution of Crash Severity Types within
Nighttime Intersection Incidents in Georgia
Injury Severity Proportion
Fatal 0.02
Severe 0.01
Injury 0.07
Possible Injury 0.19
PDO 0.71
These crash injury severity proportions will be used to apportion estimated crash reductions for
total crashes.
D.3.2 Estimating Crash Injury Severity Costs at Rural Conventional Intersection
The comprehensive unit cost for each crash injury severity was obtained from The Economic and
Societal Impact of Motor Vehicle Crashes, 2010 (Revised), which was published by the National
Highway Traffic Safety Administration (NHTSA) in 2015 [67]. The NHTSA document gives
comprehensive unit costs in year 2010 dollars, for the maximum abbreviated injury scale
(MAIS), PDO, and fatal injuries. Some of the factors NHTSA included in estimating these
comprehensive unit costs are lost market and household productivity, medical costs, legal and
court costs, emergency service costs (EMS), insurance administration costs, congestion costs,
property damage, workplace losses, and loss of quality of life. Table 19 presents the
comprehensive unit costs for the different injury severities. To match the smaller injury severity
scale available in the Georgia crash data MAIS 5 and MAIS 4 were combined as severe, MAIS 3
and MAIS 2 were combined as injury, and MAIS 1 and MAIS 0 were combined as possible
injury. Since these costs are in year 2010 dollars, they were converted to year 2016 dollars to
facilitate comparisons with the illumination costs. The conversion was done using available

Evaluation of Cost Effectiveness of Illumination as a Safety Treatment at Rural Intersections
71
consumer price index factors [66]. Table 20Table 20 presents the final comprehensive unit costs
for the injury severity scale used in the analysis.
Table 19 Comprehensive Accident Injury Severity Costs
Severity Descriptor
Cost per
Incident
(2010 $)
Fatal Fatal 5,348,855
MAIS 5 Critical 3,335,503
MAIS 4 Severe 1,433,442
MAIS 3 Serious 592,721
MAIS 2 Moderate 229,538
MAIS 1 Minor 29,660
MAIS 0 2,843
PDO PDO 3,862
Table 20 Accident Severity Costs Applied to Georgia Crashes
Severity Cost Per Injury
(2010 $)
Cost Per Injury
(2016 $)
Fatal 5,348,855 6,105,131
Severe 2,384,473 2,721,614
Injury 411,130 469,260
Possible Injury 16,252 18,550
PDO 3,862 4,408
Rural conventional intersection crashes in Georgia were analyzed to determine the number of
nighttime fatalities per fatal crash and the number of nighttime injuries per injury crash. These
results are shown in Table 21. Also shown in Table 21 is the comparable statistic on number of
fatalities per fatal crash obtained from the Fatal Accident Reporting System (FARS). The
number of injuries per injury crash was distributed among the three injury severity types based
on proportions shown in Table 17.

Evaluation of Cost Effectiveness of Illumination as a Safety Treatment at Rural Intersections
72
Table 21 Number of Nighttime Fatalities and Injuries
per Related Crash in Georgia
Georgia
Intersections FARS
Fatalities/Fatality crash 1.1 1.08
Injuries/Injury crash 1.50
D.3.3 Sample Benefit-to-Cost Analysis Results from Spreadsheet Model
To estimate the benefits and costs associated with illuminating rural conventional intersections in
Georgia, the results described earlier were incorporated into a benefit–cost model. The model
was encoded into a Microsoft Excel® spreadsheet workbook for ease of use in future work. This
accompanying benefit–cost model can be used to compute benefit-to-cost ratios for different
combinations of intersection illuminance, daily entering volume, and associated electrification
costs (to bring power to the site). The spreadsheet can model up to 20 scenarios at a time.
Operating instructions for the model are provided on the “Quick Start” tab of the spreadsheet.
Figure 15 shows estimated benefit-to-cost ratios for different lighting levels at a typical
intersection with a daily entry volume of 4000 vehicles. Various electrification cost scenarios of
zero costs (no electrification required), $5,000 costs, $10,000 costs, $15,000 costs, $20,000
costs, $50,000 costs, and $100,000 costs are shown for each illuminance level. As can be
expected, the benefit-to-cost ratios increase with decreasing electrification costs as well as
increasing intersection illuminance. Also, the benefit to cost ratios can be affected by the power
consumption rating of the luminaire combination required to achieve a specific illuminance or
illuminance range. For example, there is a slight decrease in benefit to cost ratios in moving from
an intersection illuminance level of 8 lux to 9 lux as can be seen in Figure 15. Also, as seen
earlier in Section C: Estimation of the Safety Impact of Illumination at Rural Conventional

Evaluation of Cost Effectiveness of Illumination as a Safety Treatment at Rural Intersections
73
Intersections in Georgia there is no additional benefit to safety beyond an average intersection
illuminance of 12 Lux. Consequently, Figure 15 shows decreasing benefit-cost ratios for
illuminances higher than 12 Lux.

Evaluation of Cost Effectiveness of Illumination as a Safety Treatment at Rural Intersections
74
Figure 15 Benefit-Cost Ratios of Different LED Lighting Levels at Rural Conventional Intersections with 4000 AADT for
Various Electrification Costs
0
20
40
60
80
100
120
140
160
180
200
2 3 4 5 6 7 8 9 10 11 12 25 34
B/C
Rat
io
Illuminance (Lux)
Benefit-Cost Ratios of Different LED Lighting Levels at Rural Conventional Intersections (AADT =
4000) for Various Electrificatin Costs
$0K $5K $10K $15K $20K $50K $100K

Evaluation of Cost Effectiveness of Illumination as a Safety Treatment at Rural Intersections
75
Next, Figure 16 presents benefit–cost curves for different illuminance levels for an intersection
with an assumed electrification cost of $100,000. Such curves and/or their underlying equations
can be used to determine an adequate illumination level for an intersection based on its AADT
and a target benefit–cost ratio. For example, a minimum benefit–cost ratio of 2.0 is usually
accepted as an indication of an economically justified highway project. Table 22 shows the
required intersection AADT for various illuminance levels for various electrification cost
scenarios based on a target benefit-cost ratio of 2.0. These results show that basically all rural
conventional intersections requiring no electrification would be economically justified for the
dose-response range of intersection illuminances identified in this study ( 0 – 12 lux) and the
proposed luminaire layouts. Consequently, for such intersections the decision on the adequate
level of illuminance might depend on the agencies preference for either cost minimization or
benefit maximization.
Figure 16 Benefit–Cost Curves for Different LED Lighting Levels at Rural Conventional
Intersections with Electrification Costs of $100,000
0
20
40
60
80
100
120
0 2,000 4,000 6,000 8,000 10,000 12,000 14,000 16,000 18,000 20,000
B/C
Rat
io
AADT
Benefit-Cost Curves for Different LED Lighting Levels at Rural
Conventional Intersections with $100,000 Electrification Costs
2 Lux 4 Lux 6 Lux 8 Lux 10 Lux 12 Lux
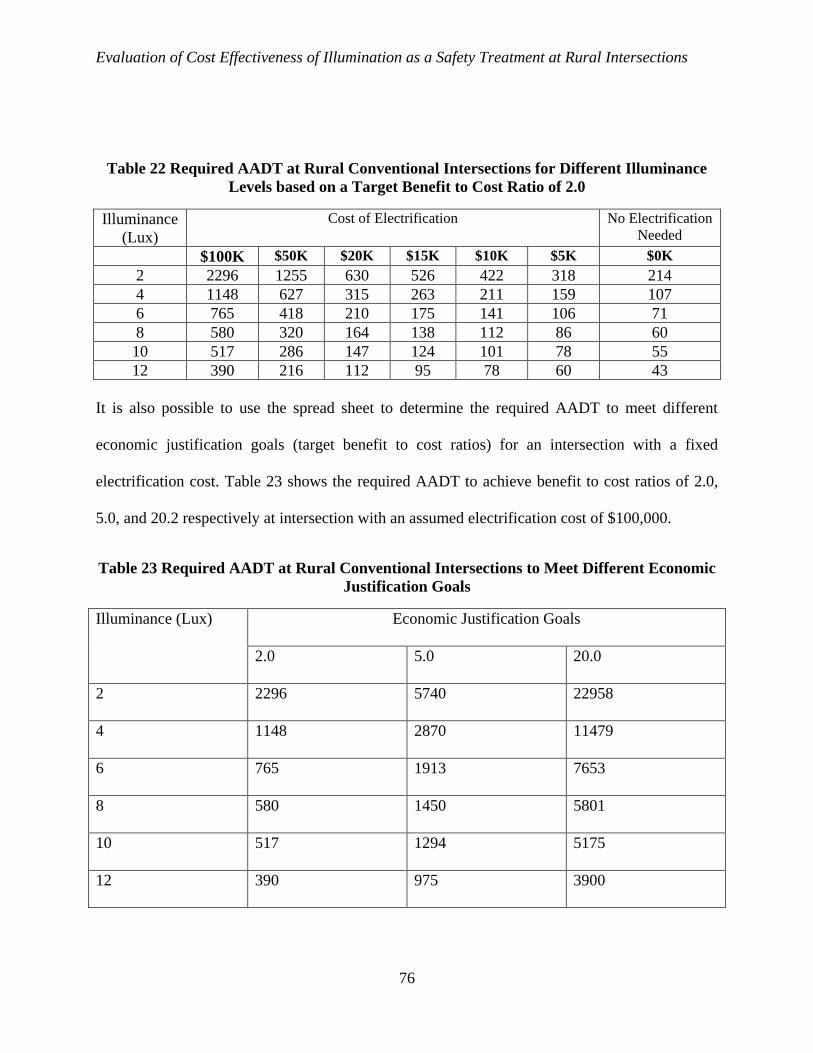
Evaluation of Cost Effectiveness of Illumination as a Safety Treatment at Rural Intersections
76
Table 22 Required AADT at Rural Conventional Intersections for Different Illuminance
Levels based on a Target Benefit to Cost Ratio of 2.0
Illuminance
(Lux)
Cost of Electrification No Electrification
Needed
$100K $50K $20K $15K $10K $5K $0K
2 2296 1255 630 526 422 318 214
4 1148 627 315 263 211 159 107
6 765 418 210 175 141 106 71
8 580 320 164 138 112 86 60
10 517 286 147 124 101 78 55
12 390 216 112 95 78 60 43
It is also possible to use the spread sheet to determine the required AADT to meet different
economic justification goals (target benefit to cost ratios) for an intersection with a fixed
electrification cost. Table 23 shows the required AADT to achieve benefit to cost ratios of 2.0,
5.0, and 20.2 respectively at intersection with an assumed electrification cost of $100,000.
Table 23 Required AADT at Rural Conventional Intersections to Meet Different Economic
Justification Goals
Illuminance (Lux) Economic Justification Goals
2.0 5.0 20.0
2 2296 5740 22958
4 1148 2870 11479
6 765 1913 7653
8 580 1450 5801
10 517 1294 5175
12 390 975 3900

Evaluation of Cost Effectiveness of Illumination as a Safety Treatment at Rural Intersections
77
D.4 Summary of Benefit-to-Cost Analysis
This report presents results of analyses performed to determine the benefit-to-cost ratios of rural
conventional intersection illumination in Georgia. The analysis uses illumination crash
modification factors estimated from Section C: Estimation of Safety Impact of Illumination at
Rural Conventional Intersections in Georgia. Intersection illumination power consumption and
luminaire configuration were determined using DIALux®, a professional lighting design
software.
The analysis further considers various electrification cost scenarios; no cost scenario
representing an intersection location with ready power, $5,000, $10,000, $15,000, $20,000,
$50,000, and a $100,000 electrification cost scenario. Electrification costs are assumed to include
actual cost for the electrical equipment and materials to bring power to the site as well as
additional costs occurred in the relocation of utilities.
Based on an assumed economic justification criterion, with a benefit-cost ratio of 2.0, the study
finds that illumination will generally be cost-effective as a safety treatment at rural conventional
intersections requiring no or little electrification costs. This finding is based on the dose-response
range of intersection illuminance identified in this study, i.e., 0 - 12 Lux, and the luminaire
configurations used in this study. For locations requiring no electrification, an agency might
decide on the adequate illumination level based on either a cost minimization or benefit
maximization objective.
In the case of rural conventional intersections requiring electrification, the adequate or cost-
effective lighting level is dependent on the AADT. Therefore, intersections must be evaluated on
an individual basis.

Evaluation of Cost Effectiveness of Illumination as a Safety Treatment at Rural Intersections
78
The analysis for these individual evaluations can be facilitated by the accompanying Microsoft
Excel® spreadsheet model. Instructions on how to use the spreadsheet model are provided on the
“Quick Start” tabs of the spreadsheet.

Evaluation of Cost Effectiveness of Illumination as a Safety Treatment at Rural Intersections
79
PROJECT SUMMARY AND RECOMMENDATIONS
The major goal of this research study is to determine the cost-effectiveness of illumination at
uncontrolled and stop-controlled rural intersections in Georgia. This report consolidates three
parallel studies that were performed to meet this goal. These three parallel studies have been
presented in Sections B, C, and D.
Section B presents results of a survey of DOTs to understand their current rural intersection
illumination practices. The survey results from 24 responding states revealed four key
characteristics of rural illumination practices among DOTs:
a) Most DOTs use published illumination guidance and standards. The overwhelming
majority use either the guidance from the Illuminating Engineering Society of North
America or the standard from the American Association of State Highway and
Transportation Officials.
b) Most DOTs currently use standard lighting in rural areas when lighting is deemed
necessary.
c) There is not much activity among DOTs in terms of studies to determine the applicability
of published illumination crash modification factors to their local conditions.
d) Most DOTs do not include an actual cost-effectiveness analysis in decision making for
rural intersection illumination projects. Most often, DOTs measure cost-effectiveness in
terms of either an overall minimization of project costs or existence of potential safety
benefits.

Evaluation of Cost Effectiveness of Illumination as a Safety Treatment at Rural Intersections
80
The results of Section C, Estimation of the Safety Impact of Illumination at Rural Conventional
Intersections in Georgia, show overwhelming evidence that lower illumination levels than those
included in the existing lighting standards/guidelines would also provide significant benefits. The
existing guidelines prescribe recommended lighting levels ranging from about 8 lux to 34 lux for
intersections. However, the findings from this study show that beyond a dose-response range of
0–12 lux there is basically little or no benefit to illuminating rural intersections.
The third parallel study, Benefit-to-Cost Analysis of Conventional Rural Intersection
Illumination in Georgia, is presented in Section D. The findings from this study indicate that for
rural intersection locations that require no electrification, basically any illumination level within
the dose-response range and luminaire configurations identified in this study will be cost-
effective for any entering AADT. However, locations that require electrification need to be
evaluated based on the overall costs, entering AADT, existing crash rate, and a target benefit-to-
cost ratio that signifies the level of cost-effectiveness required by the state DOT. Consequently, a
spreadsheet benefit-to-cost model has been developed as part of the study to facilitate the cost-
effectiveness analysis at any rural uncontrolled or stop-controlled intersection.
Generally, the findings support other published studies which have indicated that lower
illumination levels could be used on roads without compromising safety [44, 50]. However, if
researchers are to develop reliable guidance, it will be necessary to include more intersections in
the analysis.
There is a strong need to improve both asset management and crash reporting systems to
facilitate these important safety studies. There is currently no systematic way of identifying if a
particular intersection (both rural and urban) in Georgia is illuminated and, if it is, the type and

Evaluation of Cost Effectiveness of Illumination as a Safety Treatment at Rural Intersections
81
nature of the lighting devices. A complete and accurate asset management system for road
segments and intersections, which is electronically linked to crash data, would help in
developing a reliable guidance. At the least, a simplified version in the form of a lighting and
intersection database system that gives lighting information (the installation date, luminaire type,
mounting height, number of luminaires, luminaire location, and, if available, the illuminance
level), as well as intersection characteristics (number of lanes, lane width, presence of horizontal
curve on upstream approach, presence of vertical curve on upstream approach, posted speed,
skew angle, etc.) would be needed. It is recommended that GDOT partners with other municipal
and city transportation agencies to develop a database of measured installed illumination levels
at intersections, roundabouts etc.
Also, with the design of this current study it is difficult to control for possible selection bias due
to other safety improvements which may have been installed together with illumination. This
limitation means that the findings must always be interpreted with caution because the
significance of this limitation is unknown. Therefore, it is recommended that a future study be
implemented that will ensure that no other safety improvement factor other than illumination is
present at study sites. This will require a number of sites without purposely-built illumination to
be randomly selected with the same criteria. Half of these sites will then have illumination
installed while the other half will serve as a control group. No other safety improvement would
be implemented at the study and control intersections within the study years. These two groups
would then be studied when at least 3 years of post-deployment crash data are available.

Evaluation of Cost Effectiveness of Illumination as a Safety Treatment at Rural Intersections
82

Evaluation of Cost Effectiveness of Illumination as a Safety Treatment at Rural Intersections
83
REFERENCES
1. National Highway Traffic Safety Administration. Traffic Safety Facts 2012: A
Compilation of Motor Vehicle Crash Data from the Fatality Analysis Reporting System
and General Estimates System. DOT HS 812 032. Washington, DC. 2012.
2. Al-Ghamdi, A.S., Analysis of Traffic Accidents at Urban Intersections in Riyadh. In
Accident Analysis & Prevention, No. 35(5), 2003, p.p 717-724.
3. Montella, A., Identifying Crash Contributory Factors at Urban Roundabouts and Using
Association Rules to Explore Their Relationships to Different Crash Types. In Accident
Analysis and Prevention, No. 43, 2011, p.p 1451-1463.
4. Neuman, T., R. Pfefer, K. Slack, D. Hardwood, I. Potts, D. Torbic and E. Rabbani.
Guidance for Implementation of the Aashto Strategic Highway Safety Plan Volume 5: A
Guide for Addressing Unsignalized Intersection Collisions. NCHRP Report 500, 2003.
Transportation Research Board of the National Academies, Washington DC
5. Retting, R., R. Ulmer and A. Williams, Prevalence and Characteristics of Red Light
Running Crashes in the United States. In Accident Analysis & Prevention, No. 31, 1999,
p.p 687-694.
6. AASHTO, Highway Safety Manual, 1st Ed. Vol 1. 2010, American Association of State
Highway and Transportation Officials, Washington DC.
7. Niaki, M., N. Saunier, L. Miranda-Moreno, L. Amador and J.-F. Bruneau, Method for
Road Lighting Audit and Safety Screening at Urban Intersections. In Transportation
Research Record: Journal of the Transportation Research Board, No. 2458, 2014, p.p
27-36.
8. Donnell, E.T., R.J. Porter and V.N. Shankar, A Framework for Estimating the Safety
Effects of Roadway Lighting at Intersections. In SAFETY SCIENCE, No. 48(10), 2010,
p.p 1436-1444.
9. Donnell, E., R.J. Porter, V.N. Shankar, F. Gross, W. Hu, M. Gemar and J. Oh. Estimating
the Safety Effects of Roadway Lighting at Intersections: A Cross-Sectional Study
Approach. 90th Annual Meeting of the Transportation Research Board. 2011.
Washington D.C.: Transportation Research Board.

Evaluation of Cost Effectiveness of Illumination as a Safety Treatment at Rural Intersections
84
10. Rea, M., J. Bullough, C. Fay, J. Brons, J. Derlofske and E. Donnell. Review of the Safety
Benefits and Other Effects of Roadway Lighting. NCHRP 5-19, 2009. NCHRP,
Washington, DC.
11. Bullough, J., J. Snyder, N. Skinner, R. Capo, P. Rizzo and U. Besenecker. Demonstration
and Evaluation of New Approaches for Roundabout Lighting. Transportation Research
Board 93rd Annual Meeting. 2014. Washington, DC.
12. Bruneau, J.F. and D. Morin, Standard and Nonstandard Roadway Lighting Compared
with Darkness at Rural Intersections. In Transportation Research Record: Journal of the
Transportation Research Board, No. 1918, 2005, p.p 116-122.
13. Walker, F.W. and S.E. Roberts, Influence of Lighting on Accident Frequency at Highway
Intersections. In Transportation Research Record, No. (562), 1976, p.p 73-78.
14. Marks, V. Effects of Reduced Intersection Lighting on Nightime Accident Frequency.
Project HR-1003A, 1977. Iowa Department of Transportation
15. Preston, H. and T. Schoenecker. Safety Impacts of Street Lighting at Isolated Rural
Intersections. 1999-17, 1999. Minnesota Department of Transportation
16. Green, E.R., K.R. Agent, M.L. Barret and J.G. Pigman. Roadway Lighting and Driver
Safety. KTC-03-12/SPR247-02-IF, 2003.
17. Isebrands, H., S. Hallmark, W. Li, T. McDonald, R. Storm and H. Preston, Roadway
Lighting Shows Safety Benefits at Rural Intersections. In Journal of Transportation
Engineering, No. 136(11), 2010, p.p 949-955.
18. Wortman, R.H. and M.E. Lipinski. Rural at-Grade Intersection Illumination. 1974.
19. Lipinski, M.E. and R.H. Wortman, Effect of Illumination on Rural at-Grade Intersection
Accidents. In Transportation Research Record, No. (611), 1978, p.p 3.
20. Isebrands, H., S. Hallmark, Z. Hans, T. McDonald, H. Preston and R. Storm. Safety
Impacts of Street Lighting at Isolated Rural Intersection - Part 2. MN/RC-2006-35, 2006.
Minesota Department of Transportation,

Evaluation of Cost Effectiveness of Illumination as a Safety Treatment at Rural Intersections
85
21. Hallmark, S., N. Hawkins, S. Omar, Z. Hans, C. Kinsenbaw, M. Orellano and H.
Isebrands. Strategies to Address Nighttime Crashes at Rural, Unsignalized Intersections.
2008. Center for Transportation and Education, Iowa State University
22. Donnell, E. Statistical Issues in Relating Roadway Lighting to Safety. Transportation
Research Board 94th Annual Meeting. 2015. Washington, DC.
23. Per Ole, W., Effects of Road Lighting: An Analysis Based on Dutch Accident Statistics
1987–2006. In Accident Analysis and Prevention, No. 41, 2009, p.p 123-128.
24. Retting, R., B. Persaud, P. Garder and D. Lord, Crash and Injury Reduction Following
Installation of Roundabouts in the United States. In American Journal of Public Health,
No. 91(4), 2001, p.p 628 - 631.
25. Hauer, E. Cause and Effect in Observational Cross-Sectional Studies in Road Safety.
Transportation Research Board Annual Meeting. 2005.
26. Hauer, E., Observational before-after Studies in Road Safety. 1997, Pergamon, , Oxford,
OX, U.K. ; Tarrytown, N.Y., U.S.A.
27. Persaud, B. and C. Lyon, Empirical Bayes before–after Safety Studies: Lessons Learned
from Two Decades of Experience and Future Directions. In Accident Analysis &
Prevention, No. 39(3), 2007, p.p 546-555.
28. Bo, L., P. Bhagwant, L. Craig and B. Ravi, Validation of a Full Bayes Methodology for
Observational before-after Road Safety Studies and Application to Evaluation of Rural
Signal Conversions. In Accident Analysis & Prevention, No. 41, 2009, p.p 574-580.
29. Gross, F., C. Lyon, B. Persaud and R. Srinivasan, Safety Effectiveness of Converting
Signalized Intersections to Roundabouts. In Accident Analysis and Prevention, No. 50,
2013, p.p 234-241.
30. Zhou, H.G., F. Pirinccioglu and P. Hsu, A New Roadway Lighting Measurement System.
In Transportation Research Part C-Emerging Technologies, No. 17(3), 2009, p.p 274-
284.
31. Illuminating Engineering Society, Design Guide for Roundabout Lighting. 2008,
Illuminating Engineering Society of North America: New York.

Evaluation of Cost Effectiveness of Illumination as a Safety Treatment at Rural Intersections
86
32. International Commission on Illumination, Cie 115:2010 Lighting of Roads for Motor
and Pedestrian Traffic 2nd Edition. 2010, CIE Central Bureau: Austria.
33. Illuminating Engineering Society, Roadway Lighting 2000, Illumination Engineering
Society of North America: New York.
34. CEN, Road Lighting - Part 3: Calculation of Performance. In, 2008c.
35. Bassani, M. and G. Mutani, Effects of Environmental Lighting Conditions on Operating
Speeds on Urban Arterials. In Transportation Research Record: Journal of the
Transportation Research Board, No. 2298(-1), 2012, p.p 78-87.
36. Fotios, S., P. Boyce and C. Ellis. The Effect of Pavement Material on Road Lighting
Performance. PPAD 9/100/77 2005. UK
37. Casol, M., P. Fiorentin and A. Scroccaro. On Road Measurements of the Luminance
Coefficient of Paving. 16th IMEKO TC4 Symposium Exploring New Frontiers of
Instrumentation and Methods for Electrical and Electronic Measurements, . 2008.
Florence, Italy.
38. Uncu, I. and M. Kayaku, Analysis of Visibility Level in Road Lighting Using Image
Processing Techniques. In Scientific Research and Essays, No. 5(18), 2010, p.p 6.
39. Cobb, J., R.A. Hargroves, A.M. Marsden and P. Scott. Road Lighting and Accidents.
Meeting of the International Commision on Illumination (CIE). 1979. Kyoto, Japan.
40. Green, J. and R.A. Hargroves, A Mobile Laboratory for Dynamic Road Lighting
Measurement. In Lighting Research & Technology, No. (11), 1979, p.p 7.
41. Hargroves, R.A. and P. Scott, Measurements of Road Lighting and Accident Results. In
Public Lighting, No. (44), 1979, p.p 8.
42. Scott, P. The Relationship between Road Lighting Quality and Accident Frequency. LR
929, 1980.
43. International Commission on Illumination. Road Lighting as an Accident
Countermeasure. Publication No. 93, 1992. Central Bureau of the CIE, Vienna

Evaluation of Cost Effectiveness of Illumination as a Safety Treatment at Rural Intersections
87
44. Oya, H., K. Ando and H. Kanoshima, A Research on Interrelation between Illuminance at
Intersections and Reduction in Traffic Accidents. In Journal of Light & Visual
Environment, No. 26(1), 2002, p.p 1_29-1_34.
45. Minoshima, O., K. Oka, K. Ikehara and N. Inukai. Research on Accident Reduction by
Intersection Lighting. Road Engineering Association of Asia and Australia (REAAA).
2006. Philippines.
46. Medina, J., K. Avrenli and R. Benekohal, Field and Software Evaluation of Illuminance
from Led Luminaires for Roadway Applications. In Transportation Research Record:
Journal of the Transportation Research Board, No. 2384(-1), 2013, p.p 55-64.
47. Schmidt, S., S. Long and J. Harper. Economic and Technical Feasibility of Led Lighting
on State Routes in Missouri. Transportation Research Board 93rd Annual Meeting.
2014. Washington, DC: Transportation Research Board.
48. Jackett, M. and W. Frith, Quantifying the Impact of Road Lighting on Road Safety — a
New Zealand Study. In IATSS Research, No. 36(2), 2013, p.p 139-145.
49. Bhagavathula, R., R. Gibbons and C. Edwards, Relationship between Roadway
Illumination Level and Nighttime Rural Intersection Safety. In Transportation Research
Record: Journal of the Transportation Research Board, No. 2485, 2015, p.p 8.
50. Gibbons, R., F. Guo, J. Du, A. Medina, P. Lutkevich, T. Terry and Q. Li. Linking Road
Lighting and Crash Safety. Transportation Research Board 94th Annual Meeting. 2015.
Washington, DC.
51. Box, P. Relationship between Illumination and Freeway Accidents. 1970. Illuminating
Research Institute, New York
52. Griffith, M., Comparison of the Safety of Lighting Options for Urban Freeways, in Public
Roads. 1994, Federal Highway Administration: Washington, DC.
53. FHWA. The 1994 Annual Report on Highway Safety Improvement Programs. 1994.
O.o.S. U.S. Department of Transportation Federal Highway Administration, Washington,
DC

Evaluation of Cost Effectiveness of Illumination as a Safety Treatment at Rural Intersections
88
54. FHWA. The 1996 Annual Report on Highway Safety Improvement Programs. 1996. U.S.
Department of Transportation Federal Highway Administration Office of Safety,
Washington, DC
55. Painter, K. and D. Farrington, The Financial Benefits of Improved Street Light, Based on
Crime Reduction. In Lighting Research & Technology, No. 33(1), 2001, p.p 3 - 12.
56. Illuminating Engineering Society. Lm 5099 - Iesna Guide for Photometric Measurement
of Roadway Lighting Installations. 1999.
57. Nicholas, J. A Road Lighting Survey Method for Accidents Sites. Report No. 4, 1991.
58. Wuller, D. and H. Gabele. The Usage of Digital Cameras as Luminance Meters. 2007.
Place of Publication: San Jose, CA, USA. Country of Publication: USA.: SPIE - The
International Society for Optical Engineering.
59. Hiscocks, P. and P. Eng, Measuring Luminance with a Digital Camera. In, 2011.
60. Inanici, M.N., Evaluation of High Dynamic Range Photography as a Luminance Data
Acquisition System. In Lighting Research and Technology, No. 38(2), 2006, p.p 123-136.
61. Gbologah, F. The Impacts of Illumination Level on Nighttime Safety at Roundabouts.
Doctoral Dissertation, School of Civil & Environmental Engineering, Georgia Institute of
Technology. Atlanta, GA. 2015
62. Gbologah, F., A. Guin, R. Purcell and M. Rodgers. Calibration of a Digital Camera for
Rapid Auditing of in-Situ Intersection Illumination. 95th Annual Meeting of the
Transportation Research Board. 2016. Washington, DC: Transportation Research Board.
63. Illuminating Engineering Society. Roadway Lighting Ansi/Ies Rp 8-14. RP 8-14, 2014.
I.E. Society,
64. Georgia Governor's Office of Highway Safety. Crash Injuries.
http://www.gahighwaysafety.org/research/crash-injuries/ Accessed. 7/14/2014
65. Gresham Smith and Partners. Lighting Operation and Maintenance Study. Project
CSSFT-0008(534), 2013. Georgia Department of Transportation,

Evaluation of Cost Effectiveness of Illumination as a Safety Treatment at Rural Intersections
89
66. Sahr, R. Consumer Price Index (Cpi) Conversion Factors 1774 to Estimated 2023. 2013.
Political Science Department, Oregon State University.
67. Blincoe, L., J. Miller, R. Zaloshnja and B. Lawrence. The Economic and Societal Impact
of Motor Vehicle Crashes, 2010. (Revised). Report No. DOT HS 812 013, 2015.
N.H.T.S. Administration, Washington, DC

Evaluation of Cost Effectiveness of Illumination as a Safety Treatment at Rural Intersections
90

Evaluation of Cost Effectiveness of Illumination as a Safety Treatment at Rural Intersections
91
APPENDIX: SURVEY QUESTIONNAIRE

Evaluation of Cost Effectiveness of Illumination as a Safety Treatment at Rural Intersections
92
Name of State:...............................................
Name of Safety Engineer interviewedd:..........................................................................................
Phone contact:.................................................................................................................................
Email:..............................................................................................................................................
A1. Does your state follow developed standards/guidance on the illumination conventional
intersections (not roundabouts)?
a) Yes
b) NO
A2. If Yes, what are the standards
a) AASHTO roadway lighting design guide
b) ANSI/IES-RP-8 (Roadway Lighting)
c) State Specific. (Name..........................................................................................................)
d) Other. (Name.......................................................................................................................)
A3. What is your state’s policy concerning rural intersection illumination?
......................................................................................................................................................
......................................................................................................................................................
......................................................................................................................................................
......................................................................................................................................................
......................................................................................................................................................
......................................................................................................................................................
.........................................
A4. Do you sometimes use non-standard illumination?
a) Yes
b) No
A5. If Yes, how is the decision for standard and non-standard illumination made?
Standard lighting: ............................................................................................................
......................................................................................................................................................
..............................................................................................................................
Non-standard lighting: .....................................................................................................
......................................................................................................................................................
..............................................................................................................................
A6. Is cost-effectiveness considered in the design process for rural intersections illumination?
a) Yes
b) No
A7. If Yes, how is cost-effectiveness considered?
......................................................................................................................................................
......................................................................................................................................................
......................................................................................................................................................
......................................................................................................................................................

Evaluation of Cost Effectiveness of Illumination as a Safety Treatment at Rural Intersections
93
......................................................................................................................................................
..............................................................................
A8. Does your state utilize other alternatives to illumination for nighttime safety at rural
intersections?
a) Yes
b) No
A9. If Yes, Can you kindly list these other alternatives (preferably in the order of most effective
first) and the conditions where may be used?
a) ....................................................................................................................................
b) ....................................................................................................................................
c) ....................................................................................................................................
d) ....................................................................................................................................
e) ....................................................................................................................................
Use a different sheet if there are more than five alternatives
A10. Has you state found any relationship between illumination levels and observed crashes
and/or injury severities at rural intersections?
......................................................................................................................................................
......................................................................................................................................................
......................................................................................................................................................
......................................................................................................................................................
......................................................................................................................................................
A11. Does your state have any published figures on costs of illumination or nighttime safety
treatment for different types of rural intersections? If Yes, please name the
reports/documents
......................................................................................................................................................
......................................................................................................................................................
......................................................................................................................................................
......................................................................................................................................................
......................................................................................................................................................
A12. Do you know if changes to your department’s intersection illumination policy are being
considered?
a) Yes
b) No

Evaluation of Cost Effectiveness of Illumination as a Safety Treatment at Rural Intersections
94

Evaluation of Cost Effectiveness of Illumination as a Safety Treatment at Rural Intersections
95
APPENDIX 2: RESULTS OF INTERSECTION LIGHTING
MEASUREMENTS

Evaluation of Cost Effectiveness of Illumination as a Safety Treatment at Rural Intersections
96
Table 24 Illuminance Characteristics of Surveyed Intersections
ID
6-Year
AADT
Latitude Longitude
Purpose-
Built
Lighting?
Ambient
Lighting?
Average
Uniformity
Ratio
Average
Illuminance
(Lux)
4 9979 34.3691 −85.0037 No Yes > 4.0 0.07
6 9124 34.6886 −84.4668 No Yes > 4.0 0.24
7 6377 34.9748 −85.4038 No No > 4.0 0.03
8 5736 34.4693 −85.3867 No Yes 3.9 1.00
9 7740 34.6408 -84.5079 No Yes 2.4 1.01
10 4501 32.1810 −84.1343 No No > 4.0 0.21
11 2471 33.4090 −83.7607 No No > 4.0 0.03
12 1980 31.6921 −83.1137 No No 2.0 0.01
13 1256 31.7526 −83.6771 No Yes > 4.0 0.06
14 2447 32.4318 −84.0029 No No > 4.0 0.09
15 612 32.4129 −83.9334 No No > 4.0 0.04
16 2112 34.9276 −85.5869 No No > 4.0 0.18
17 3938 34.9765 −85.3667 Yes No > 4.0 2.37
18 3986 31.9426 −83.7385 Yes No > 4.0 3.69
19 837 32.1234 −82.8633 No No > 4.0 0.02
20 2647 32.2734 −82.7100 No No > 4.0 0.01
21 8145 33.5108 −84.4390 No Yes > 4.0 0.33
22 7512 34.8936 −85.1848 No Yes 2.0 1.07
23 4327 31.7438 −81.4399 Yes No 3.1 5.47
24 4079 34.4848 −85.4799 Yes No 2.82 3.7
25 9206 34.6849 −84.4747 No No 2.0 0.55
26 5468 34.8706 −85.2287 Yes No 2.7 2.49
31 1630 31.6338 −81.3964 Yes No 4.0 3.18
33 1792 34.9789 −85.4337 No Yes 3.0 0.43
36 1085 32.2046 −82.6686 No Yes > 4.0 0.27
37 2630 32.2589 −82.7006 No Yes 3.3 0.69
38 1822 32.8069 −82.9133 No Yes > 4.0 0.40
40 3480 31.9448 −83.5426 Yes Yes > 4.0 9.06
41 5934 34.6984 −84.4817 Yes No 2.5 5.45
42 5559 32.5415 −82.9036 Yes Yes 3.9 8.69
43 8483 34.6942 −84.4815 Yes No 1.9 8.33
44 5697 34.6890 −85.3004 Yes No 2.2 3.52
45 7982 34.6977 −84.4819 Yes No 2.8 11.74
51 2767 34.6969 −84.4801 Yes No 2.6 8.38
52 1324 31.8073 −83.4877 Yes No 3.1 6.56
53 1978 31.9485 −83.4563 Yes No > 4.0 5.38
54 2156 31.9496 −83.4546 Yes No > 4.0 8.85

Evaluation of Cost Effectiveness of Illumination as a Safety Treatment at Rural Intersections
97
55 1695 31.9462 −83.4563 Yes No > 4.0 4.00
56 921 32.1875 −82.5661 Yes No 3.5 4.66
57 1378 32.5392 −82.9025 Yes No 3.2 25.68
58 1037 31.8090 −83.4900 Yes No > 4.0 3.23
59 2084 31.9497 −83.4562 Yes No > 4.0 4.70
60 1566 33.7912 −83.5961 No No > 4.0 0.02