Evaluation of the Community Futures Program - Industry · PDF fileCSBFP Canada Small Business...
44
Evaluation of the Community Futures Program Final Report April 2014 Presented to the Departmental Evaluation Committee on March 26, 2014 Approved by the Deputy Minister on April 29, 2014
Transcript of Evaluation of the Community Futures Program - Industry · PDF fileCSBFP Canada Small Business...
Evaluation of the Community Futures Program
Final Report
April 2014
Presented to the Departmental Evaluation Committee on March 26, 2014
Approved by the Deputy Minister on April 29, 2014
Audit and Evaluation Branch
Evaluation of the Community Futures Program
March 2014
TABLE OF CONTENTS
EXECUTIVE SUMMARY ........................................................................................................... i
1.0 INTRODUCTION............................................................................................................. 1
1.1 Program Description ............................................................................................... 1 1.2 Program Resources ................................................................................................. 4 1.3 Logic Model ............................................................................................................ 5
2.0 METHODOLOGY ........................................................................................................... 7
2.1 Evaluation Strategy ................................................................................................. 7 2.2 Evaluation Scope and Objectives ............................................................................ 7
2.3 Evaluation Questions .............................................................................................. 7
2.4 Evaluation Approach .............................................................................................. 8 2.5 Data Collection Methods ........................................................................................ 8 2.6 Limitations ............................................................................................................ 11
3.0 FINDINGS ....................................................................................................................... 13
3.1 Relevance .............................................................................................................. 13 3.2 Performance .......................................................................................................... 22
4.0 CONCLUSIONS AND RECOMMENDATIONS ........................................................ 37
4.1 Relevance .............................................................................................................. 37 4.2 Performance .......................................................................................................... 37
Audit and Evaluation Branch
Evaluation of the Community Futures Program
March 2014
LIST OF ACRONYMS USED IN REPORT
Acronym Meaning
APR Annual Performance Report
ACOA Atlantic Canada Opportunities Agency
AEB Audit and Evaluation Branch
BDC Business Development Bank of Canada
CSBFP Canada Small Business Financing Program
CF Community Futures
CFP Community Futures Program
CFDC Community Futures Development Corporation
CED-Q Economic Development Agency of Canada for the Regions of Quebec
EDI Economic Development Initiative
FedDev Federal Economic Development Agency for Southern Ontario
FedNor Federal Economic Development Initiative for Northern Ontario
IC Industry Canada
LIC Local Initiatives Contribution
NODP Northern Ontario Development Program
NOHFC Northern Ontario Heritage Fund Corporation
OACFDC Ontario Association of Community Futures Development Corporations
OSEB Ontario Self-Employment Benefit
PM Performance Measurement
RDA Regional Development Agency
RED Rural Economic Development Program
SMEs Small and Medium sized Enterprises
SBEC Small Business Enterprise Centre
SFT Speech from the Throne
TEA The Exceptional Assistant
WD Western Economic Diversification Canada
Audit and Evaluation Branch
Evaluation of the Community Futures Program
March 2014
LIST OF TABLES
Table 1 NODP Funding to Northern Ontario CFDCs, April 1, 2008 to
March 2012
3
Table 2 5-Year Funding Profile for the FedNor Component of the
Community Futures Program
5
Table 3 Income Profile of Northern Ontario 2011
13
Table 4 Perceived Community Need for Service Provided by CFDCs 15
Table 5 Key Excerpts from Press Release, Recent Federal Budgets and
Speeches from the Throne
16
Table 6 Client Business Services Received and Satisfaction Levels 23
Table 7 Type and Level of Impact on CFDC Counselling Clients 24
Table 8 Perceived Level of Impact of CFDC on Community 27
Table 9 FedNor Targets for CFDC Investment Activities 33
Table 10 Five Year Average Loan Loss Ratio Distribution for CFDCs 34
LIST OF FIGURES
Figure 1 Community Futures Development Corporations in Northern
Ontario
2
Figure 2 Community Futures Program Logic Model 6
Audit and Evaluation Branch
Evaluation of the Community Futures Program
March 2014
i
EXECUTIVE SUMMARY
Program Overview
The Community Futures Program (CFP) supports rural economic development across
Canada through four key activities: working with local partners to advance strategic
community planning and socio-economic development; providing business services to
small and medium-sized enterprise (SMEs); providing access to capital for SMEs; and
supporting community-based projects and special initiatives. In Northern Ontario, the
program is delivered by Industry Canada’s Federal Economic Development Initiative for
Northern Ontario (FedNor), which provides funding to 24 Community Futures
Development Corporations (CFDCs) to support costs related to delivering the four key
activities. These CFDC’s are independent, arms-length organizations that employ
professional staff and are governed by volunteer local boards of directors.
Evaluation Purpose and Methodology
In accordance with the Treasury Board Policy on Evaluation and the Directive on the
Evaluation Function, the purpose of this evaluation was to assess the core issues of
relevance and performance of the CFP. The evaluation covered the period from
April 2008 to March 2013.
The evaluation findings and conclusions are based on the analysis of multiple lines of
evidence. The methodology included a review of documents, a literature review, a review
of program and Statistics Canada data, case studies, a survey of clients and interviews
with clients and stakeholders.
Findings
Relevance
The economic situation in Northern Ontario and the barriers experienced by small
businesses in this region suggest a continued need for the CFP. While the need for
services varies by community depending on local capacities and the availability of
alternate services, the flexibility of the CFP allows CFDCs to target their services in areas
where they are most needed.
Industry Canada has a clear mandate to deliver rural economic development activities in
Northern Ontario under the Department of Industry Act and such activities continue to be
priorities of the Government. CFP is also aligned with Industry Canada’s strategic
outcomes and activities related to community economic development and developing
competitive Canadian businesses and communities. The province and municipalities also
provide rural economic development programs in Northern Ontario and while some of
their programs may be similar to those offered under the CFP, their availability is often
more limited and their eligibility criteria differ.
Audit and Evaluation Branch
Evaluation of the Community Futures Program
March 2014
ii
Performance
Overall, evidence suggests that CFP is achieving its intended immediate and intermediate
outcomes. However, some outcomes are partially attributable to the Northern Ontario
Development Program (NODP), which has provided funding to CFDCs to capitalize their
Investment Funds and support the implementation of community economic development
projects. CFDCs primarily focus on providing access to capital and business services,
and, therefore, show the greatest impacts through these activities. Ultimate outcomes are
difficult to attribute directly to CFP as a number of factors can influence these outcomes;
nonetheless, data collected from Statistics Canada and CFP clients suggest that the CFP is
contributing to job creation and economically sustainable local rural economies.
The program also appears to have had an incremental impact. A Statistics Canada
comparison of CFP assisted businesses to matched non-assisted businesses showed that
CFP-assisted businesses had higher employment growth, sales growth and business
survival rates than non-assisted businesses. Further, a high proportion of surveyed loan
clients indicated it would have been unlikely that they would have been able to start or
expand their business in the absence of the CFP loan.
The delivery of the CFP is efficient in that the program’s flexibility allows CFDCs to
focus on activities within their communities that will have the greatest impact. While the
loan component has been efficient in achieving leveraging, the overall loan loss ratios are
low and cash reserves held by some CFDCs are high. There is an opportunity for FedNor
to explore why this is occurring and determine whether further action is required.
Recommendations
The evaluation led to the following recommendations:
1. FedNor should continue to further develop the CFP Performance Measurement
Strategy in concert with its RDA partners (e.g., examine whether to expand data
collection to cover all indicators in the Performance Measurement Strategy and add
additional outcome indicators).
2. FedNor should examine the reason for the overall low loan loss ratios and high cash
reserves held by some CFDCs and determine whether further action is required.
Audit and Evaluation Branch
Evaluation of the Community Futures Program
March 2014
1
1.0 INTRODUCTION
This report presents the results of an evaluation of the Community Futures Program (CFP) as
delivered by Industry Canada (IC). It should be noted that the national delivery of the CFP is
shared with the four Regional Development Agencies (RDAs): the Atlantic Canada Opportunities
Agency (ACOA), the Economic Development Agency of Canada for the Regions of Quebec
(CED-Q), Western Economic Diversification Canada (WD), and the Federal Economic
Development Agency for Southern Ontario (FedDev). The RDAs are conducting their own
individual evaluations of CFP. Throughout this document, references to the performance of CFP
will relate solely to that of IC unless otherwise specified.
The purpose of the evaluation was to assess the relevance and performance of CFP. The report is
organized into four sections:
Section 1 provides the profile of CFP;
Section 2 presents the evaluation methodology, along with a discussion of data limitations;
Section 3 presents the findings pertaining to the evaluation issues of relevance and
performance; and,
Section 4 summarizes the evaluation’s conclusions and provides recommendations for future
action.
1.1 Program Description
The CFP is a federal government program that supports rural economic development across the
country with the ultimate objective of assisting communities to:
foster economic stability, growth and job creation;
create diversified and competitive local rural economies; and
build economically sustainable communities.
The roots of the CFP began in the early 1970’s with the establishment of “local employment
development” type programs such as the Local Employment Assistance Program (1973) and the
Community Employment Strategy (1975) delivered by Employment and Immigration Canada. In
the 1980’s, assistance to local businesses was provided through two community-based programs:
Local Economic Development Assistance (1980), and Local Employment Assistance and
Development (1983). These program concepts were expanded in 1985 with the establishment of
the Community Futures Program under the Canadian Jobs Strategy. The CFP was targeted to
communities with ‘chronic’ or ‘acute’ labour market problems and designed to provide a suite of
measures to assist communities in planning and developing local solutions to local problems.
In 1995, the program was transferred to IC and the RDAs. IC delivers its portion of the program
through the Federal Economic Development Initiative for Northern Ontario (FedNor). In August
2009, responsibility for the CFP in southern Ontario was transferred to the Federal Economic
Development Agency for Southern Ontario (FedDev) and consequentially the budget allocation
for program delivery was split proportionally between southern and northern Ontario.
Audit and Evaluation Branch
Evaluation of the Community Futures Program
March 2014
2
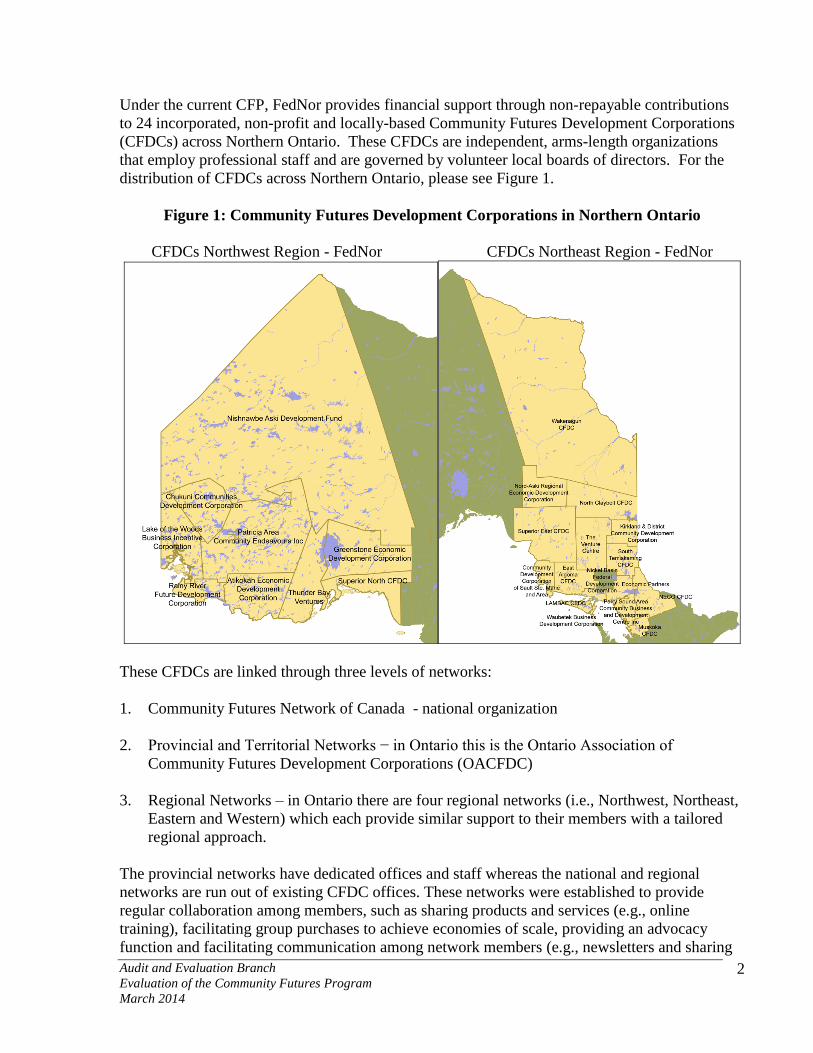
Under the current CFP, FedNor provides financial support through non-repayable contributions
to 24 incorporated, non-profit and locally-based Community Futures Development Corporations
(CFDCs) across Northern Ontario. These CFDCs are independent, arms-length organizations
that employ professional staff and are governed by volunteer local boards of directors. For the
distribution of CFDCs across Northern Ontario, please see Figure 1.
Figure 1: Community Futures Development Corporations in Northern Ontario
CFDCs Northwest Region - FedNor CFDCs Northeast Region - FedNor
These CFDCs are linked through three levels of networks:
1. Community Futures Network of Canada - national organization
2. Provincial and Territorial Networks − in Ontario this is the Ontario Association of
Community Futures Development Corporations (OACFDC)
3. Regional Networks – in Ontario there are four regional networks (i.e., Northwest, Northeast,
Eastern and Western) which each provide similar support to their members with a tailored
regional approach.
The provincial networks have dedicated offices and staff whereas the national and regional
networks are run out of existing CFDC offices. These networks were established to provide
regular collaboration among members, such as sharing products and services (e.g., online
training), facilitating group purchases to achieve economies of scale, providing an advocacy
function and facilitating communication among network members (e.g., newsletters and sharing
Audit and Evaluation Branch
Evaluation of the Community Futures Program
March 2014
3
best practices). They typically host regular meetings where group training is offered and where
CFDCs can discuss common problems and share best practices. These network associations
receive financial support through the CFP as well as revenue generated by membership dues,
annual conferences and other activities.
CFP provides financial support to CFDCs to offset their operating costs (e.g., salaries, rent,
utilities). These contributions allow CFDCs to provide support to small and medium-sized
enterprises (SMEs), social enterprises1 and their local communities to meet the objectives of the
program by engaging in four key activities:
1. Fostering strategic community planning and socio-economic development by working with
their communities to assess local problems, establish objectives, and plan and implement
strategies to develop human capital, institutional and physical infrastructure,
entrepreneurship, employment, and the economy;
2. Providing business services by delivering a range of business counselling and information
services to SMEs and Social Enterprises (e.g., on site libraries providing general business
information, counselling on preparing a business plan, how to start or expand a business,
marketing, or referral to another organization that can provide the assistance required);
3. Providing access to capital for new and existing SMEs and Social Enterprises (e.g., loans,
loan guarantees and equity investments)2; and
4. Supporting community-based projects and special initiatives in areas such as tourism,
entrepreneurship, and opportunities for women, youth, and Aboriginals.
In addition to the funds provided by CFP to support operating costs, CFDCs receive funding from
other FedNor programs to support activities that are incremental and complementary to those
supported by CFP. For example, on an as needed basis, funds are provided to CFDCs by
FedNor’s Northern Ontario Development Program (NODP) to capitalize local Investment Funds.
The investment funds are to be used by the CFDCs to provide access to capital for new and
existing SMEs and Social Enterprises. These loans are repayable and provided at a minimum
interest rate of two percent above prime. As loans are repaid, CFDCs re-invest the funds as new
loans to SMEs and as a result the original funds provided by the Government continuously
circulate through local communities.
NODP also provided funding over the evaluation period to CFDCs under other NODP priorities3.
One source of NODP funding for CFDCs was the Local Initiatives Contribution (LIC), which
provided funding to undertake projects with community economic development objectives.
Specifically, LIC projects support activities related to community economic development
1 A social enterprise is an organization that applies commercial strategies to maximize improvements in human and
environmental well-being, rather than maximizing profits for external shareholders. 2 CFDCs provide repayable financial assistance in the form of loans, loan guarantees, or equity investments to SMEs,
including Social Enterprises (CFP Terms and Conditions, Schedule 2.1 ii). For the purposes of the Evaluation
Report, the term ‘loan’ or ‘loans’ is understood as any one of these types of investments. 3 For example, Youth Internship, Regional Competitiveness, CED Implementation and Business Management Skills
and Networking
Audit and Evaluation Branch
Evaluation of the Community Futures Program
March 2014
4
objectives that create short to medium-term measureable results for the communities and
businesses in the region, such as working with communities to assess local problems, establish
objectives, plan and implement strategies to develop human, institutional and physical
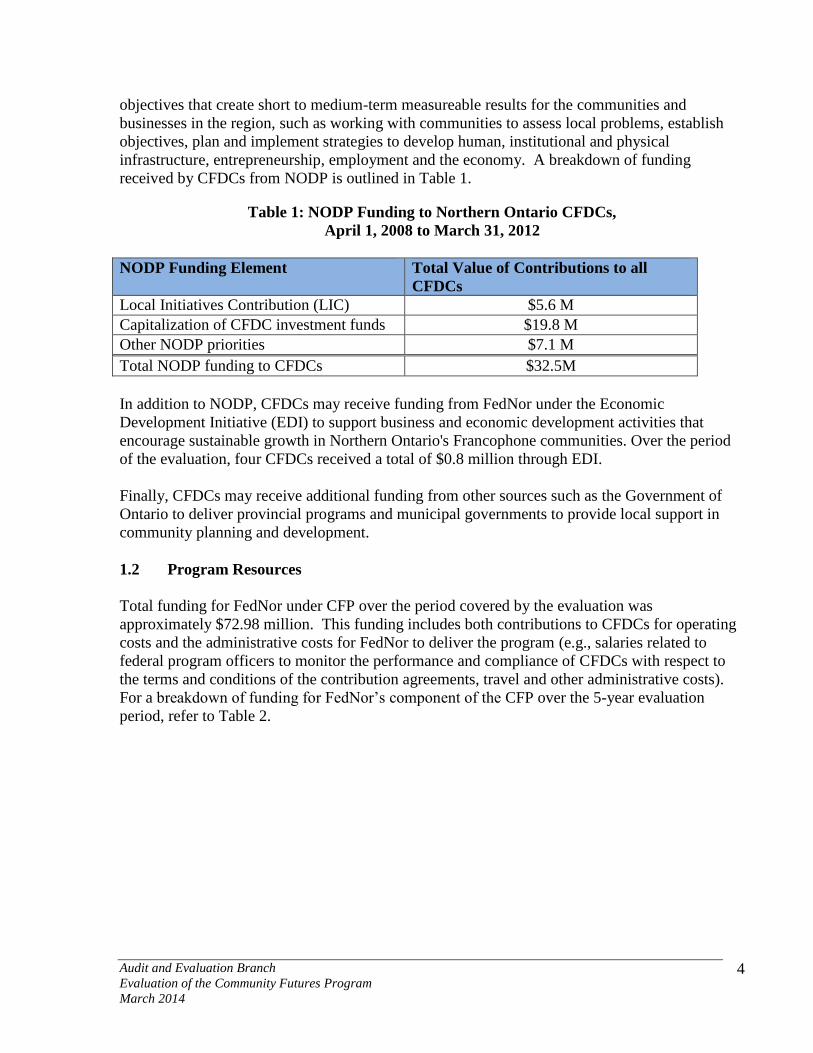
infrastructure, entrepreneurship, employment and the economy. A breakdown of funding
received by CFDCs from NODP is outlined in Table 1.
Table 1: NODP Funding to Northern Ontario CFDCs,
April 1, 2008 to March 31, 2012
NODP Funding Element Total Value of Contributions to all
CFDCs
Local Initiatives Contribution (LIC) $5.6 M
Capitalization of CFDC investment funds $19.8 M
Other NODP priorities $7.1 M
Total NODP funding to CFDCs $32.5M
In addition to NODP, CFDCs may receive funding from FedNor under the Economic
Development Initiative (EDI) to support business and economic development activities that
encourage sustainable growth in Northern Ontario's Francophone communities. Over the period
of the evaluation, four CFDCs received a total of $0.8 million through EDI.
Finally, CFDCs may receive additional funding from other sources such as the Government of
Ontario to deliver provincial programs and municipal governments to provide local support in
community planning and development.
1.2 Program Resources
Total funding for FedNor under CFP over the period covered by the evaluation was
approximately $72.98 million. This funding includes both contributions to CFDCs for operating
costs and the administrative costs for FedNor to deliver the program (e.g., salaries related to
federal program officers to monitor the performance and compliance of CFDCs with respect to
the terms and conditions of the contribution agreements, travel and other administrative costs).
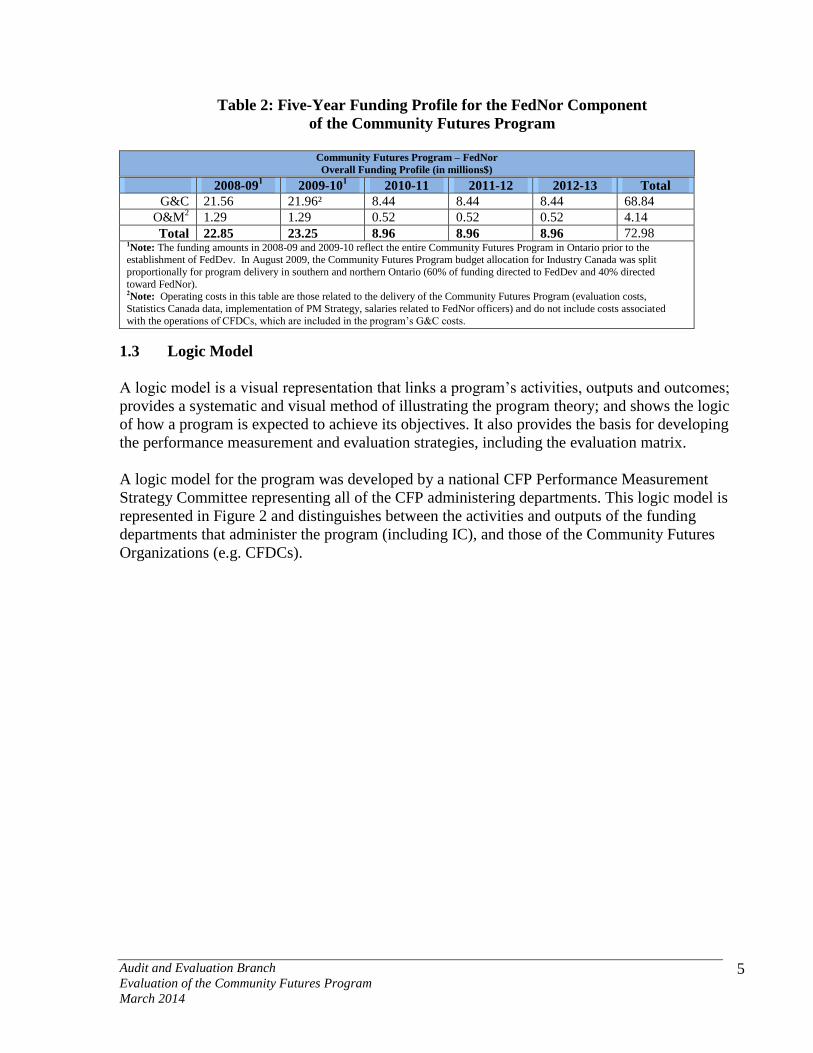
For a breakdown of funding for FedNor’s component of the CFP over the 5-year evaluation
period, refer to Table 2.
Audit and Evaluation Branch
Evaluation of the Community Futures Program
March 2014
5
Table 2: Five-Year Funding Profile for the FedNor Component
of the Community Futures Program
Community Futures Program – FedNor
Overall Funding Profile (in millions$)
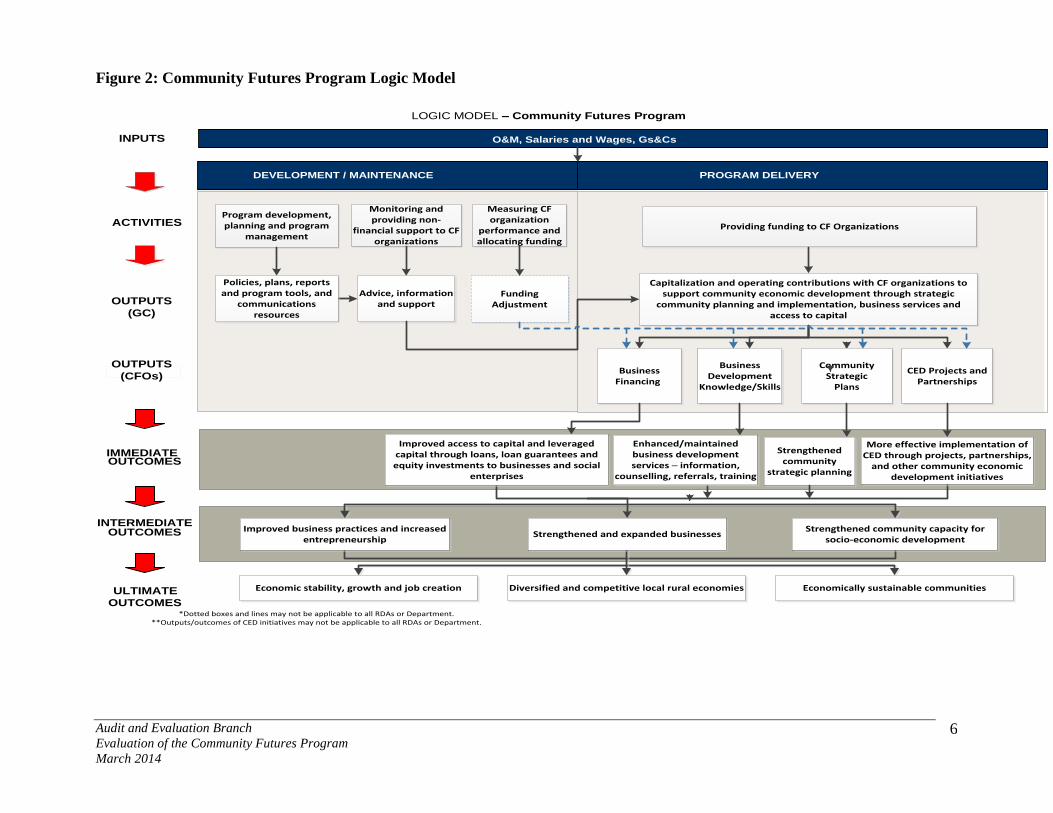
1.3 Logic Model
A logic model is a visual representation that links a program’s activities, outputs and outcomes;
provides a systematic and visual method of illustrating the program theory; and shows the logic
of how a program is expected to achieve its objectives. It also provides the basis for developing
the performance measurement and evaluation strategies, including the evaluation matrix.
A logic model for the program was developed by a national CFP Performance Measurement
Strategy Committee representing all of the CFP administering departments. This logic model is
represented in Figure 2 and distinguishes between the activities and outputs of the funding
departments that administer the program (including IC), and those of the Community Futures
Organizations (e.g. CFDCs).
2008-091 2009-10
1 2010-11 2011-12 2012-13 Total
G&C 21.56 21.96² 8.44 8.44 8.44 68.84
O&M2 1.29 1.29 0.52 0.52 0.52 4.14
Total 22.85 23.25 8.96 8.96 8.96 72.98 1Note: The funding amounts in 2008-09 and 2009-10 reflect the entire Community Futures Program in Ontario prior to the establishment of FedDev. In August 2009, the Community Futures Program budget allocation for Industry Canada was split
proportionally for program delivery in southern and northern Ontario (60% of funding directed to FedDev and 40% directed
toward FedNor). 2Note: Operating costs in this table are those related to the delivery of the Community Futures Program (evaluation costs,
Statistics Canada data, implementation of PM Strategy, salaries related to FedNor officers) and do not include costs associated
with the operations of CFDCs, which are included in the program’s G&C costs.
Audit and Evaluation Branch
Evaluation of the Community Futures Program
March 2014
6
Figure 2: Community Futures Program Logic Model
INTERMEDIATE
IMMEDIATE
ACTIVITIES
OUTCOMES
OUTCOMES
OUTCOMES
OUTPUTS
(CFOs)
OUTPUTS
(GC)
ULTIMATE
DEVELOPMENT / MAINTENANCE PROGRAM DELIVERY
LOGIC MODEL – Community Futures Program
Providing funding to CF Organizations
Capitalization and operating contributions with CF organizations to support community economic development through strategic
community planning and implementation, business services and access to capital
INPUTS O&M, Salaries and Wages, Gs&Cs
Business Financing
Business Development
Knowledge/Skills
CommunityStrategic
Plans
CED Projects and Partnerships
Program development, planning and program
management
Monitoring and providing non-
financial support to CF organizations
Policies, plans, reports and program tools, and
communications resources
Advice, information and support
*Dotted boxes and lines may not be applicable to all RDAs or Department. **Outputs/outcomes of CED initiatives may not be applicable to all RDAs or Department.
Measuring CF organization
performance and allocating funding
Funding Adjustment
Strengthened community capacity for socio-economic development
Strengthened and expanded businessesImproved business practices and increased
entrepreneurship
Economically sustainable communitiesEconomic stability, growth and job creation Diversified and competitive local rural economies
Strengthened community
strategic planning
Enhanced/maintained business development services ─ information,
counselling, referrals, training
Improved access to capital and leveraged capital through loans, loan guarantees and equity investments to businesses and social
enterprises
More effective implementation of CED through projects, partnerships,
and other community economic development initiatives
Audit and Evaluation Branch Evaluation of the Community Futures Program
March 2014
7
2.0 METHODOLOGY
This section provides information on the evaluation strategy, approach, objectives and scope, the
specific evaluation issues and questions that were addressed, the data collection methods, and
data limitations for the evaluation.
2.1 Evaluation Strategy
A CFP Performance Measurement (PM) Strategy was developed by a national CFP PM Strategy
Committee representing all of the administering departments. This PM Strategy was initially
approved by all the CFP administering departments in October 2010 and includes the logic
model contained in this document and an evaluation strategy. The committee subsequently
approved a revised strategy in January 2013, upon which this evaluation is based.
The CFP evaluation strategy was developed based on the last CFP evaluation (2008) and lessons
learned from that process. The administering departments agreed that a common national
evaluation framework would be applied across departments, with flexibility to account for
regional variations in programming if needed.
2.2 Evaluation Scope and Objectives
The objectives of the evaluation are to address the core issues of relevance and performance in
accordance with the Directive on the Evaluation Function. The evaluation covers the period from
April 2008 to March 2013.
2.3 Evaluation Questions
As set out in the CFP National Performance Measurement Strategy, all CFP evaluations were
required to address the following questions of relevance and performance:
Relevance
1. Is there a continued need for the CFP?
2. To what extent are the objectives of the CFP aligned with: i) departmental strategic
outcomes; ii) federal priorities and strategies?
3. To what extent are the objectives of the CFP aligned with the federal government's
activities, roles and responsibilities? Does the CFP complement, duplicate or overlap other
government programs or private services?
Audit and Evaluation Branch Evaluation of the Community Futures Program
March 2014
8
Performance
4. What impact would the absence of CFP funding have had on the start-up, survival and
growth of businesses, and on community strategic planning and development?
5. To what extent have the immediate, intermediate and ultimate outcomes of the CFP been
achieved?
6. What are the barriers to achieving the CFP immediate, intermediate and ultimate outcomes
and to what extent are these being mitigated?
7. To what extent are the CFP’s performance measurement and reporting structures effective in
reporting on the achievement of the CFP outcomes?
8. To what extent is the CFP efficient in the context of the results achieved? Is there a more
cost effective way of achieving expected results?
9. Are the loss rates of the CFDC loans acceptable and do the CFDCs carry an acceptable level
of risk?
2.4 Evaluation Approach
This evaluation was based on the expected outcomes of the program as stated in the program's
foundational documents and logic model. The evaluation was managed by IC’s Audit and
Evaluation Branch (AEB).
2.5 Data Collection Methods
Both qualitative and quantitative data were collected to provide multiple lines of evidence that
were subsequently integrated in a triangulation of findings to support the conclusions and
recommendations.
The data collection methods were set out in the CFP National Performance Measurement
Strategy and included:
Document review
Literature review
Interviews
Survey of CFDC clients
Data analysis
Case studies
Audit and Evaluation Branch Evaluation of the Community Futures Program
March 2014
9
Document Review
The document review was conducted to gain an understanding of the CFP and insight into the
performance of the program. Key documents reviewed included departmental reports, Treasury
Board submissions, CFP documentation, policy bulletins, forms and templates, CFP reports, CFP
audits, FedNor documentation, Speeches from the Throne and Federal Budgets.
Literature Review
The review of academic literature covered evaluation issues of both relevance and performance.
In relation to relevance, the literature review focused on the continued need for the program,
including: challenges specific to rural communities; the economic situation in Northern Ontario;
the capacity for community economic development, business start-up and expansion; access to
capital for SMEs; and, similar and complementary programming to CFP that is available.
The literature review also covered evaluation issues related to performance, including: the
economic impact of CFP, best practices in fostering rural business development and expansion,
and best practices in the support of community strategic planning and development activities.
Interviews
The objective of the interviews was to gather in-depth information for evaluation purposes,
including views, explanations and factual information that address the evaluation questions. The
interviews were designed to obtain qualitative feedback from a wide range of respondents. The
interviews were primarily conducted by telephone.
A total of 72 interviews4 were conducted, including the following types of respondents:
Program staff (10) ;
Subject matter experts (3 academics and 1 consultant);
Regional network and Provincial CF associations’ representatives (3);
Provincial government staff representatives (3);
Other federal lending program representatives (1);
CFDCs (24); and,
Community partners (27)
Survey of CFDC Clients
AEB designed and administered a web-based survey of loan and counselling clients. Clients that
had used the services of a CFDC in the past five years were invited to participate in the survey.
The objective of the survey was to assess the client perspective on whether the program met their
needs, how it assisted them, and what the results were, as well as their perspective on how the
4 It should be noted that 4 of the CFDC and 11 of the community partner interviews were conducted in the context
of the case studies
Audit and Evaluation Branch Evaluation of the Community Futures Program
March 2014
10
program could be improved.
Each CFDC produced a client list, which was to include contact information (e.g., phone
numbers and e-mail addresses). The CFDCs identified a total of 4,184 unique clients served over
the five year evaluation period. Based on this number of clients, a sample size of 352 was
required to provide a confidence level of 95% with a margin of error of +/- 5%.
Of the 4,184 unique clients identified, the CFDCs and AEB were able to identify 2,137 email
addresses. Email invitations were sent to these clients, which resulted in 434 complete surveys5
for a response rate of approximately 20%. This final sample size exceeded what was required for
the sought confidence level and margin of error while providing representation from all CFDCs.
Data Analysis – FedNor/CFDC Data
Operational, performance monitoring, and financial data compiled by FedNor, as well as by the
CFDCs was reviewed (e.g., CFDC quarterly reports, Annual Performance Reports and financial
statement data). The objective of the data analysis was to document costs, activity levels, outputs
and outcomes associated with the CFP.
Data Analysis – Statistics Canada Data
The objective of the data analysis was to assess the need for the program through comparisons of
the CFDC profiles to the larger population of Ontario and assess the performance of program
assisted businesses versus non-assisted businesses.
As part of the CFP National Performance Measurement Strategy, FedNor and the RDAs initiated
Statistics Canada data runs to compare the performance of CFP assisted clients to matched non-
assisted clients in the areas served by each CFDC. Comparisons were made on metrics such as
employment growth, sales growth, and business survival rates. Three data runs were completed
covering the years 2004-2009, 2005-2010, and 2006-2011.
Case Studies
The case studies were undertaken to answer evaluation questions pertaining to the achievement
of immediate, intermediate and ultimate outcomes. In addition, they also provided:
information regarding the operational environment of the CFDC sites and the process by
which projects are undertaken;
illustrative examples that support the program theory (i.e., not only whether outcomes have
occurred, but how activities and outputs contribute to the intended outcomes); and
challenges and lessons learned.
To obtain representative results from the cross case analysis, and to have a range of illustrative
examples to support other lines of evidence, five CFDCs were selected for case studies. The
5 26 additional surveys were partially completed.
Audit and Evaluation Branch Evaluation of the Community Futures Program
March 2014
11
following criteria were applied for case study selection: geographical representation
(representing both regions of Northern Ontario), community economic development activities,
First Nation population, level of unemployment, population density, strategic community
planning, support to community-based projects and special initiatives, materiality (i.e., the dollar
value of projects), and nature and extent of partnerships with other community organizations.
The five CFDCs selected based on these criteria were:
Nishnawbe Aski Development Fund (main office in Thunder Bay, but CFDC is responsible
for many small communities throughout Northwestern Ontario)
East Algoma Community Futures Development Corporation, Blind River
North Claybelt Community Futures Development Corporation, Kapuskasing
Thunder Bay Ventures, Thunder Bay
Greenstone Economic Development Corporation, Geraldton
In carrying-out the case studies, the following activities were undertaken:
document review (e.g., community strategic plan);
review of program data provided by the CFDC (e.g., loan portfolio and community economic
development projects);
review of economic data obtained through Statistics Canada;
interviews with the staff and board members of the CFDC;
interviews with community representatives;
visits with loan and counselling clients; and
visits with community economic development partners.
2.6 Limitations
The following were limitations of the methodology:
Socio-economic data on CFDC service areas: Developing socio-economic profiles of CFDC
service areas requires custom tabulations. At the time of this study, the custom tabulations
using 2011 Census Data for CFDC service areas were not yet available. To mitigate this
limitation, the evaluation looked at the data for the 12 Census Divisions that are considered to
comprise Northern Ontario.
Availability of client contact information: Approximately half of the clients identified for the
evaluation period had no email address available, thereby limiting potential respondents to the
survey. To mitigate for this limitation, for under-represented CFDCs, clients with telephone
contact information and no email address were contacted by phone to solicit email addresses
and to encourage them to participate in the survey.
Aboriginal representation in client survey: The representation of identified Aboriginal target
group clients in the client survey was significantly lower than the population (8% vs. 14%).
The CFDCs with high Aboriginal client bases were also the CFDCs that were under-

Audit and Evaluation Branch Evaluation of the Community Futures Program
March 2014
12
represented overall. Again to mitigate for this limitation, for under-represented CFDCs,
clients with telephone contact information and no email address were contacted by phone to
solicit email addresses and to encourage them to participate in the survey.
Audit and Evaluation Branch Evaluation of the Community Futures Program
March 2014
13
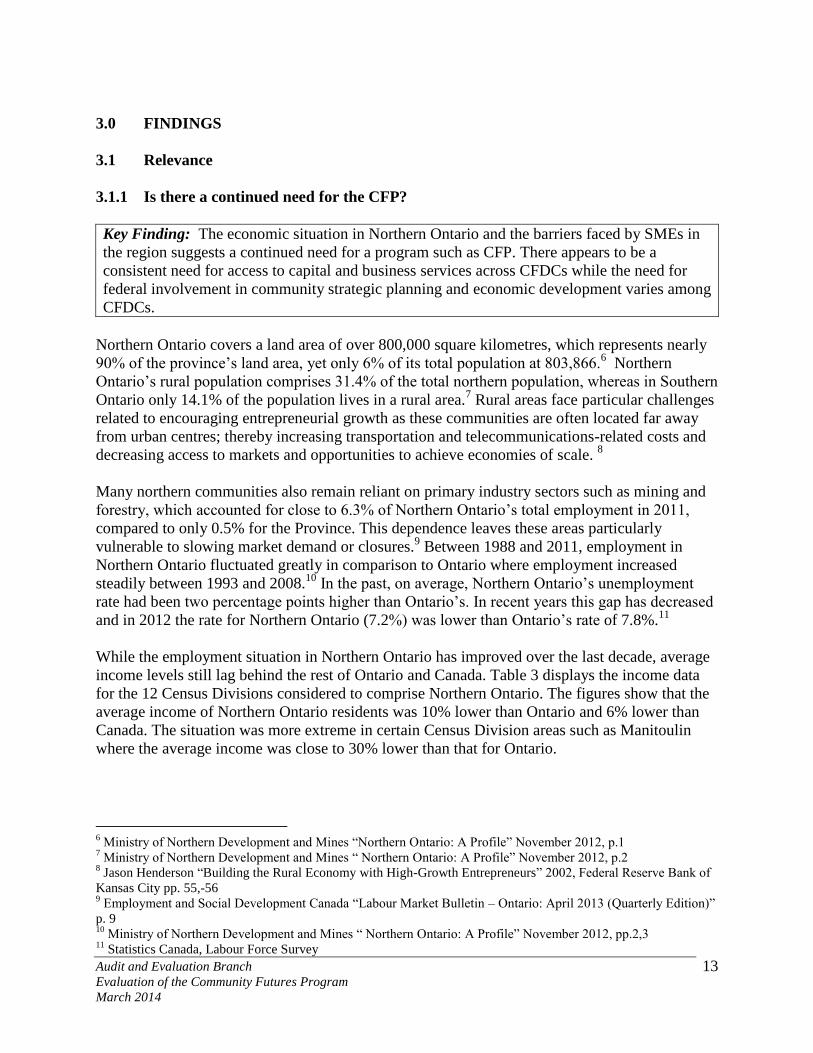
3.0 FINDINGS
3.1 Relevance
3.1.1 Is there a continued need for the CFP?
Key Finding: The economic situation in Northern Ontario and the barriers faced by SMEs in
the region suggests a continued need for a program such as CFP. There appears to be a
consistent need for access to capital and business services across CFDCs while the need for
federal involvement in community strategic planning and economic development varies among
CFDCs.
Northern Ontario covers a land area of over 800,000 square kilometres, which represents nearly
90% of the province’s land area, yet only 6% of its total population at 803,866.6 Northern
Ontario’s rural population comprises 31.4% of the total northern population, whereas in Southern
Ontario only 14.1% of the population lives in a rural area.7 Rural areas face particular challenges
related to encouraging entrepreneurial growth as these communities are often located far away
from urban centres; thereby increasing transportation and telecommunications-related costs and
decreasing access to markets and opportunities to achieve economies of scale. 8
Many northern communities also remain reliant on primary industry sectors such as mining and
forestry, which accounted for close to 6.3% of Northern Ontario’s total employment in 2011,
compared to only 0.5% for the Province. This dependence leaves these areas particularly
vulnerable to slowing market demand or closures.9 Between 1988 and 2011, employment in
Northern Ontario fluctuated greatly in comparison to Ontario where employment increased
steadily between 1993 and 2008.10
In the past, on average, Northern Ontario’s unemployment
rate had been two percentage points higher than Ontario’s. In recent years this gap has decreased
and in 2012 the rate for Northern Ontario (7.2%) was lower than Ontario’s rate of 7.8%.11
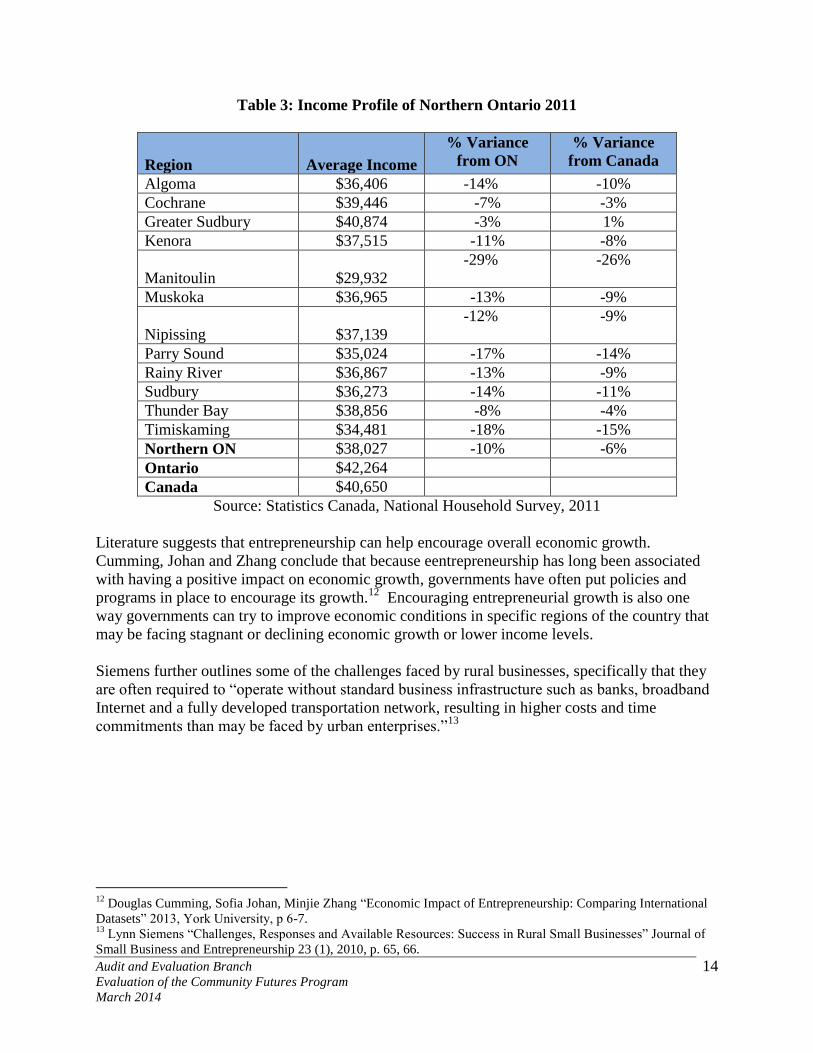
While the employment situation in Northern Ontario has improved over the last decade, average
income levels still lag behind the rest of Ontario and Canada. Table 3 displays the income data
for the 12 Census Divisions considered to comprise Northern Ontario. The figures show that the
average income of Northern Ontario residents was 10% lower than Ontario and 6% lower than
Canada. The situation was more extreme in certain Census Division areas such as Manitoulin
where the average income was close to 30% lower than that for Ontario.
6 Ministry of Northern Development and Mines “Northern Ontario: A Profile” November 2012, p.1
7 Ministry of Northern Development and Mines “ Northern Ontario: A Profile” November 2012, p.2
8 Jason Henderson “Building the Rural Economy with High-Growth Entrepreneurs” 2002, Federal Reserve Bank of
Kansas City pp. 55,-56 9 Employment and Social Development Canada “Labour Market Bulletin – Ontario: April 2013 (Quarterly Edition)”
p. 9 10
Ministry of Northern Development and Mines “ Northern Ontario: A Profile” November 2012, pp.2,3 11
Statistics Canada, Labour Force Survey
Audit and Evaluation Branch Evaluation of the Community Futures Program
March 2014
14
Table 3: Income Profile of Northern Ontario 2011
Region Average Income
% Variance
from ON
% Variance
from Canada
Algoma $36,406 -14% -10%
Cochrane $39,446 -7% -3%
Greater Sudbury $40,874 -3% 1%
Kenora $37,515 -11% -8%
Manitoulin $29,932
-29% -26%
Muskoka $36,965 -13% -9%
Nipissing $37,139
-12% -9%
Parry Sound $35,024 -17% -14%
Rainy River $36,867 -13% -9%
Sudbury $36,273 -14% -11%
Thunder Bay $38,856 -8% -4%
Timiskaming $34,481 -18% -15%
Northern ON $38,027 -10% -6%
Ontario $42,264
Canada $40,650
Source: Statistics Canada, National Household Survey, 2011
Literature suggests that entrepreneurship can help encourage overall economic growth.
Cumming, Johan and Zhang conclude that because eentrepreneurship has long been associated
with having a positive impact on economic growth, governments have often put policies and
programs in place to encourage its growth.12
Encouraging entrepreneurial growth is also one
way governments can try to improve economic conditions in specific regions of the country that
may be facing stagnant or declining economic growth or lower income levels.
Siemens further outlines some of the challenges faced by rural businesses, specifically that they
are often required to “operate without standard business infrastructure such as banks, broadband
Internet and a fully developed transportation network, resulting in higher costs and time
commitments than may be faced by urban enterprises.”13
12
Douglas Cumming, Sofia Johan, Minjie Zhang “Economic Impact of Entrepreneurship: Comparing International
Datasets” 2013, York University, p 6-7. 13
Lynn Siemens “Challenges, Responses and Available Resources: Success in Rural Small Businesses” Journal of
Small Business and Entrepreneurship 23 (1), 2010, p. 65, 66.
Audit and Evaluation Branch Evaluation of the Community Futures Program
March 2014
15
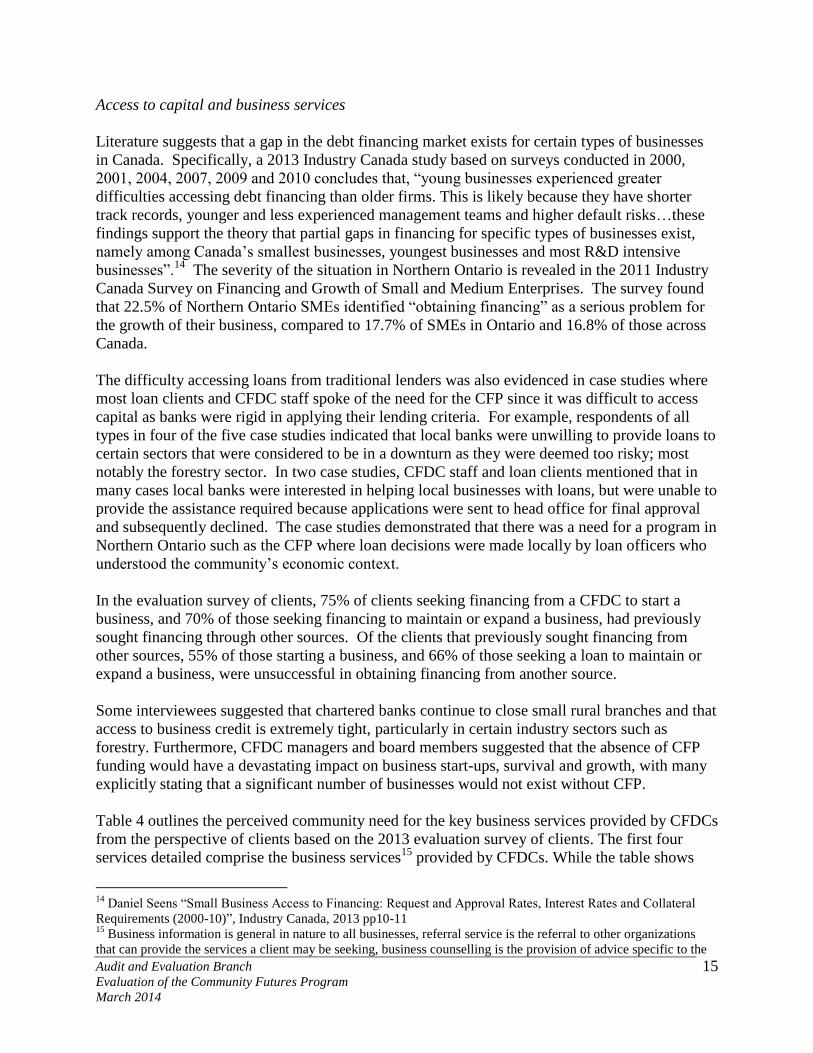
Access to capital and business services
Literature suggests that a gap in the debt financing market exists for certain types of businesses
in Canada. Specifically, a 2013 Industry Canada study based on surveys conducted in 2000,
2001, 2004, 2007, 2009 and 2010 concludes that, “young businesses experienced greater
difficulties accessing debt financing than older firms. This is likely because they have shorter
track records, younger and less experienced management teams and higher default risks…these
findings support the theory that partial gaps in financing for specific types of businesses exist,
namely among Canada’s smallest businesses, youngest businesses and most R&D intensive
businesses”.14
The severity of the situation in Northern Ontario is revealed in the 2011 Industry
Canada Survey on Financing and Growth of Small and Medium Enterprises. The survey found
that 22.5% of Northern Ontario SMEs identified “obtaining financing” as a serious problem for
the growth of their business, compared to 17.7% of SMEs in Ontario and 16.8% of those across
Canada.
The difficulty accessing loans from traditional lenders was also evidenced in case studies where
most loan clients and CFDC staff spoke of the need for the CFP since it was difficult to access
capital as banks were rigid in applying their lending criteria. For example, respondents of all
types in four of the five case studies indicated that local banks were unwilling to provide loans to
certain sectors that were considered to be in a downturn as they were deemed too risky; most
notably the forestry sector. In two case studies, CFDC staff and loan clients mentioned that in
many cases local banks were interested in helping local businesses with loans, but were unable to
provide the assistance required because applications were sent to head office for final approval
and subsequently declined. The case studies demonstrated that there was a need for a program in
Northern Ontario such as the CFP where loan decisions were made locally by loan officers who
understood the community’s economic context.
In the evaluation survey of clients, 75% of clients seeking financing from a CFDC to start a
business, and 70% of those seeking financing to maintain or expand a business, had previously
sought financing through other sources. Of the clients that previously sought financing from
other sources, 55% of those starting a business, and 66% of those seeking a loan to maintain or
expand a business, were unsuccessful in obtaining financing from another source.
Some interviewees suggested that chartered banks continue to close small rural branches and that
access to business credit is extremely tight, particularly in certain industry sectors such as
forestry. Furthermore, CFDC managers and board members suggested that the absence of CFP
funding would have a devastating impact on business start-ups, survival and growth, with many
explicitly stating that a significant number of businesses would not exist without CFP.
Table 4 outlines the perceived community need for the key business services provided by CFDCs
from the perspective of clients based on the 2013 evaluation survey of clients. The first four
services detailed comprise the business services15
provided by CFDCs. While the table shows
14
Daniel Seens “Small Business Access to Financing: Request and Approval Rates, Interest Rates and Collateral
Requirements (2000-10)”, Industry Canada, 2013 pp10-11 15
Business information is general in nature to all businesses, referral service is the referral to other organizations
that can provide the services a client may be seeking, business counselling is the provision of advice specific to the
Audit and Evaluation Branch Evaluation of the Community Futures Program
March 2014
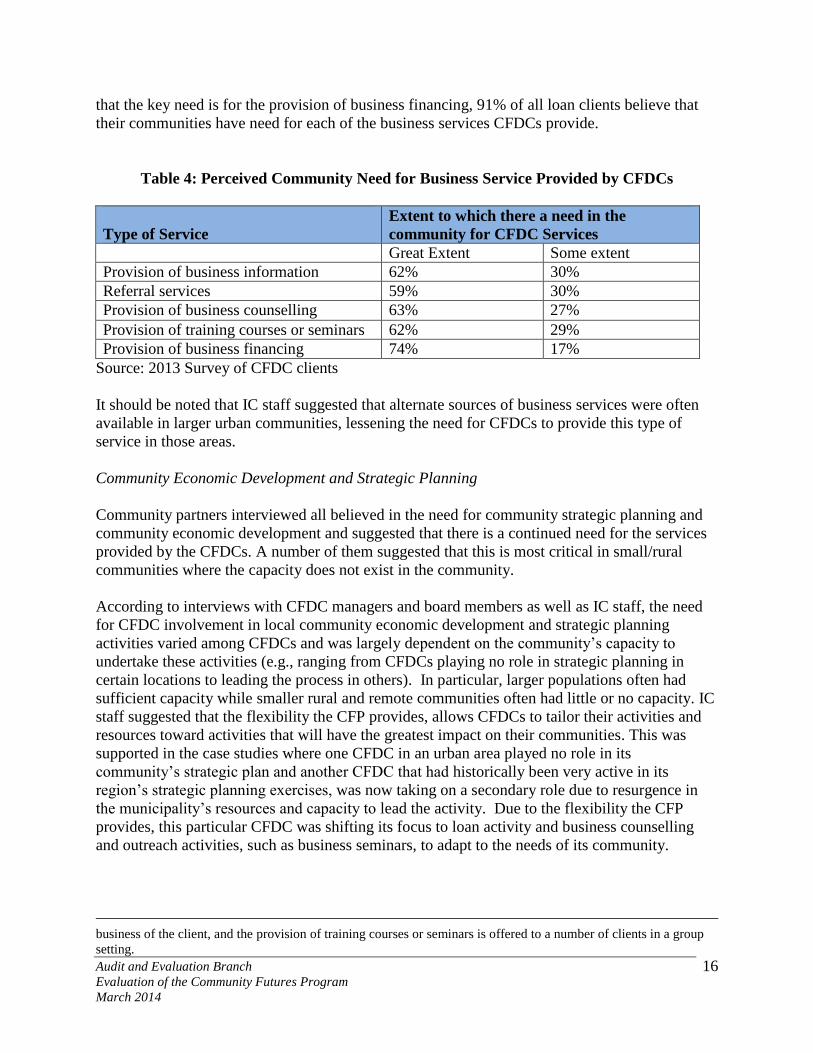
16
that the key need is for the provision of business financing, 91% of all loan clients believe that
their communities have need for each of the business services CFDCs provide.
Table 4: Perceived Community Need for Business Service Provided by CFDCs
Type of Service
Extent to which there a need in the
community for CFDC Services
Great Extent Some extent
Provision of business information 62% 30%
Referral services 59% 30%
Provision of business counselling 63% 27%
Provision of training courses or seminars 62% 29%
Provision of business financing 74% 17%
Source: 2013 Survey of CFDC clients
It should be noted that IC staff suggested that alternate sources of business services were often
available in larger urban communities, lessening the need for CFDCs to provide this type of
service in those areas.
Community Economic Development and Strategic Planning
Community partners interviewed all believed in the need for community strategic planning and
community economic development and suggested that there is a continued need for the services
provided by the CFDCs. A number of them suggested that this is most critical in small/rural
communities where the capacity does not exist in the community.
According to interviews with CFDC managers and board members as well as IC staff, the need
for CFDC involvement in local community economic development and strategic planning
activities varied among CFDCs and was largely dependent on the community’s capacity to
undertake these activities (e.g., ranging from CFDCs playing no role in strategic planning in
certain locations to leading the process in others). In particular, larger populations often had
sufficient capacity while smaller rural and remote communities often had little or no capacity. IC
staff suggested that the flexibility the CFP provides, allows CFDCs to tailor their activities and
resources toward activities that will have the greatest impact on their communities. This was
supported in the case studies where one CFDC in an urban area played no role in its
community’s strategic plan and another CFDC that had historically been very active in its
region’s strategic planning exercises, was now taking on a secondary role due to resurgence in
the municipality’s resources and capacity to lead the activity. Due to the flexibility the CFP
provides, this particular CFDC was shifting its focus to loan activity and business counselling
and outreach activities, such as business seminars, to adapt to the needs of its community.
business of the client, and the provision of training courses or seminars is offered to a number of clients in a group
setting.
Audit and Evaluation Branch Evaluation of the Community Futures Program
March 2014
17
3.1.2 To what extent are the objectives of the CFP aligned with: i) departmental strategic
outcomes; ii) federal priorities and strategies?
Key Finding: The CFP aligns with Government priorities to support community and economic
development in rural Canada through a community-based approach to supporting small
businesses. It is also aligned with Industry Canada’s strategic outcomes and activities related
to community economic development and developing competitive Canadian businesses and
communities.
The CFP’s objectives of fostering economic stability, growth and job creation; creating
diversified and competitive local rural economies; and, building economically sustainable
communities are consistent with federal priorities. Over the period of the evaluation, the
Government has continually stated the priority it places on ensuring competitive local rural
economies and building economically sustainable communities through a community-based
approach to supporting small businesses. Of note, the 2010 Budget provided additional ongoing
funding for CFP, demonstrating the Government’s long-term commitment to developing rural
economies. Subsequent Budgets continued to reiterate the Government’s focus on regional
economic development and its support to rural communities. Further, recent statements by the
Minister for FedNor show continued focus on supporting small businesses to help further
develop communities in Northern Ontario.
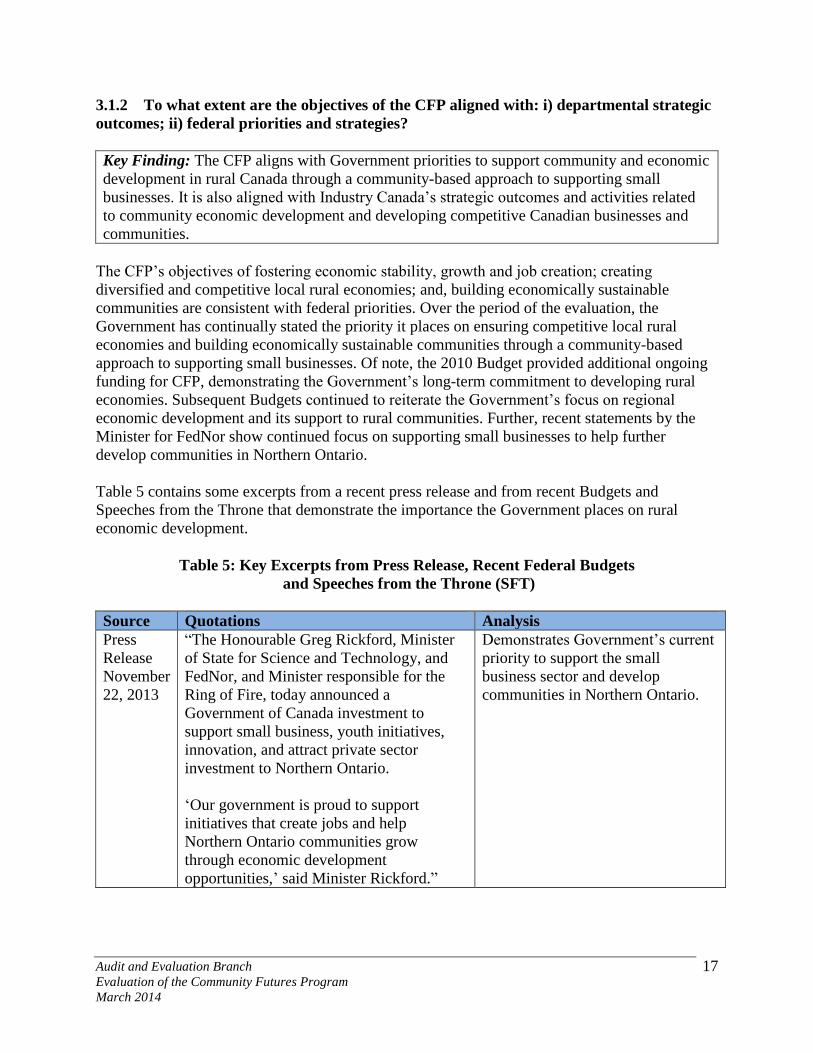
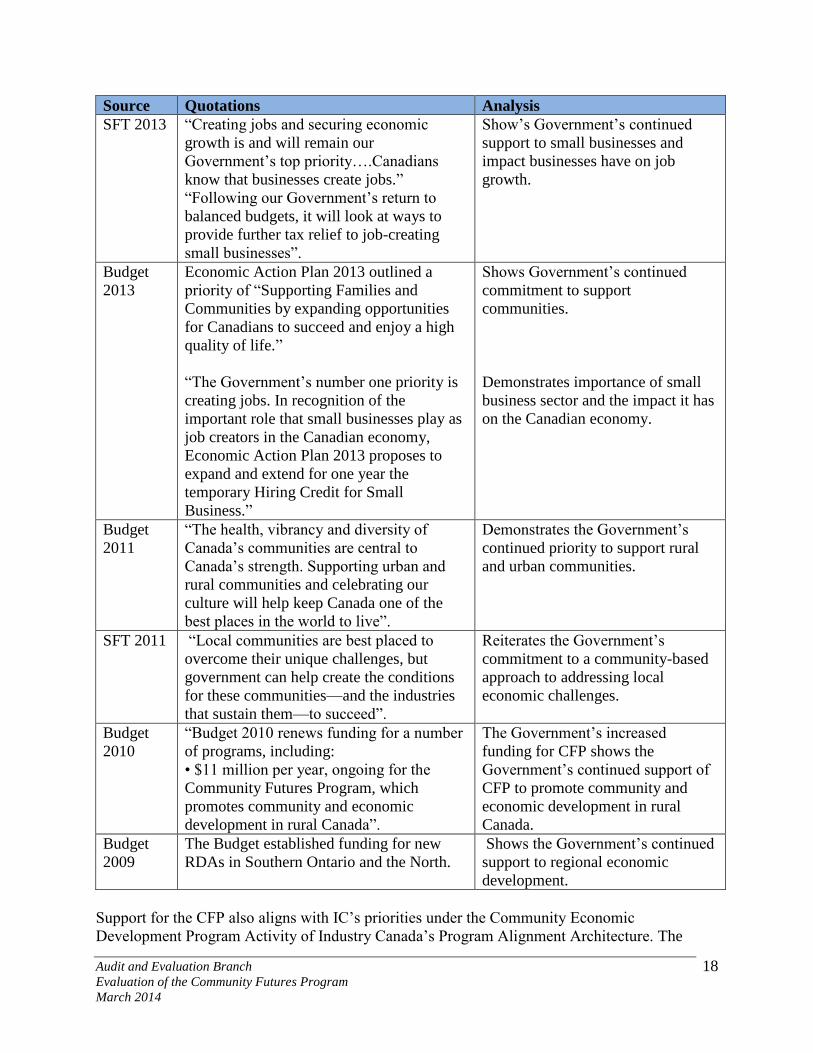
Table 5 contains some excerpts from a recent press release and from recent Budgets and
Speeches from the Throne that demonstrate the importance the Government places on rural
economic development.
Table 5: Key Excerpts from Press Release, Recent Federal Budgets
and Speeches from the Throne (SFT)
Source Quotations Analysis
Press
Release
November
22, 2013
“The Honourable Greg Rickford, Minister
of State for Science and Technology, and
FedNor, and Minister responsible for the
Ring of Fire, today announced a
Government of Canada investment to
support small business, youth initiatives,
innovation, and attract private sector
investment to Northern Ontario.
‘Our government is proud to support
initiatives that create jobs and help
Northern Ontario communities grow
through economic development
opportunities,’ said Minister Rickford.”
Demonstrates Government’s current
priority to support the small
business sector and develop
communities in Northern Ontario.
Audit and Evaluation Branch Evaluation of the Community Futures Program
March 2014
18
Source Quotations Analysis
SFT 2013 “Creating jobs and securing economic
growth is and will remain our
Government’s top priority….Canadians
know that businesses create jobs.”
“Following our Government’s return to
balanced budgets, it will look at ways to
provide further tax relief to job-creating
small businesses”.
Show’s Government’s continued
support to small businesses and
impact businesses have on job
growth.
Budget
2013
Economic Action Plan 2013 outlined a
priority of “Supporting Families and
Communities by expanding opportunities
for Canadians to succeed and enjoy a high
quality of life.”
“The Government’s number one priority is
creating jobs. In recognition of the
important role that small businesses play as
job creators in the Canadian economy,
Economic Action Plan 2013 proposes to
expand and extend for one year the
temporary Hiring Credit for Small
Business.”
Shows Government’s continued
commitment to support
communities.
Demonstrates importance of small
business sector and the impact it has
on the Canadian economy.
Budget
2011
“The health, vibrancy and diversity of
Canada’s communities are central to
Canada’s strength. Supporting urban and
rural communities and celebrating our
culture will help keep Canada one of the
best places in the world to live”.
Demonstrates the Government’s
continued priority to support rural
and urban communities.
SFT 2011 “Local communities are best placed to
overcome their unique challenges, but
government can help create the conditions
for these communities—and the industries
that sustain them—to succeed”.
Reiterates the Government’s
commitment to a community-based
approach to addressing local
economic challenges.
Budget
2010
“Budget 2010 renews funding for a number
of programs, including:
• $11 million per year, ongoing for the
Community Futures Program, which
promotes community and economic
development in rural Canada”.
The Government’s increased
funding for CFP shows the
Government’s continued support of
CFP to promote community and
economic development in rural
Canada.
Budget
2009
The Budget established funding for new
RDAs in Southern Ontario and the North.
Shows the Government’s continued
support to regional economic
development.
Support for the CFP also aligns with IC’s priorities under the Community Economic
Development Program Activity of Industry Canada’s Program Alignment Architecture. The
Audit and Evaluation Branch Evaluation of the Community Futures Program
March 2014
19
main goal of this Program Activity is to strengthen the Northern Ontario economy by providing
financial support, through contribution agreements, for economic and community development
projects led by the private, not-for-profit and public sectors. This focus is consistent with CFP’s
objectives of fostering economic stability, growth and job creation; creating diversified and
competitive local rural economies; and, building economically sustainable communities. This
Program Activity contributes to IC’s Strategic Outcome 3: “Canadian businesses and
communities are competitive”, which is also consistent with CFP’s objectives.
3.1.3 To what extent are the objectives of the CFP aligned with the federal government's
activities, roles and responsibilities? Does the CFP complement, duplicate or overlap other
government programs or private services?
Key Finding: CFP support to CFDCs is consistent with federal roles and responsibilities to
support regional economic development in Ontario with a focus on SMEs and the development
of entrepreneurial talent. While there are many players in regional economic development in
Northern Ontario, most services provided by CFDCs are complementary to those provided by
other parties. Where there is potential overlap, CFDCs coordinate with partners to minimize
actual duplication.
The literature suggests that the federal, provincial and municipal governments all have roles to
play in community economic development. For example, Conteh has concluded that: “In
Canada, although the Constitution grants de-jure responsibility for economic development policy
to provincial governments, in practice, this responsibility is shared between the federal centre (in
Ottawa) and its constituent units in the various provincial capitals. Moreover, although
municipalities are “creatures” of the provinces in Canada, in reality, they have been assuming
greater policy responsibility and attendant policy autonomy and discretion, including the
governance of local economic development”16
.
Within the federal domain, the objectives of the CFP fall under the Department of Industry Act
of 1995. According to this legislation, the powers, duties and functions of the Minister of
Industry extend to matters relating to “small businesses”17
and the Department has
responsibilities related to regional economic development in Ontario18
. The Act further
stipulates that the Minister, in exercising his powers relating to regional economic development,
“focus on small and medium sized enterprises and the development of entrepreneurial talent19
”.
Finally, the Act states that the Minister may provide and coordinate services promoting regional
economic development in Ontario and initiate, recommend, coordinate, direct, promote and
implement programs and projects in relation to regional economic development in Ontario20
.
16
Charles Conteh “Changing Trends in Regional Economic Development Policy Governance: The Case of Northern
Ontario, Canada”, 2013, International Journal of Urban and Regional Research, 37 (4), p1419, 1420. 17
Section 4(1)(a) of the Department of Industry Act of 1995 18
Section 4(2) of the Department of Industry Act of 1995 19
Section 8(c) of the Department of Industry Act of 1995 20
Sections 9(2)(a) and 9(2)(b) of the Department of Industry Act of 1995
Audit and Evaluation Branch Evaluation of the Community Futures Program
March 2014
20
There are many parties that play a role in regional economic development in rural communities
in Northern Ontario or that provide loans to small businesses. This includes federal, provincial
and municipal/community level organizations. NODP invested $32.5 million over the evaluation
period into CFDCs in order to support the NODP objectives of encouraging economic growth,
diversification, job creation and self-reliant communities in Northern Ontario, which is similar to
the objectives of the CFP. The NODP has been the main funding source for the capitalization of
CFDC Investment Funds and has provided the bulk of funds to CFDCs for community based
projects and special initiatives. This is due to the fact that there is no set funding for either
activity. Without NODP, it would have been more difficult for CFDCs to deliver their key
activities related to community economic development and business financing. NODP funding
is complementary to CFP funding in that CFP provides operating funds for CFDCs, but typically
does not provide funds for capitalization of the investment fund or for the implementation of
community based projects and special initiatives due to program budget constraints.
There are also two key federal sources under which SMEs in Northern Ontario may receive
access to capital, namely loans provided by the Business Development Bank of Canada (BDC)
and the Canada Small Business Financing Program (CSBFP) delivered by Industry Canada.
The BDC offers loans and business consulting services to SMEs, which are two of the four main
activities of the CFP. The main difference between the two programs is that the CFP has a
visible presence in Northern Ontario, whereas the BDC’s presence is limited (there are six
business centres in Northern Ontario) especially in rural communities. In terms of counselling
services, BDC provides such services on a fee basis, whereas CFDCs provide these services at
no charge. In addition, interviewees indicated that BDC tends to deal with larger dollar value
loans than the CFDCs and are more risk-averse. Finally, about half of the CFDCs that were
interviewed indicated that they had a referral process in place with BDC such that they would
refer clients to the BDC that they thought would meet the BDC eligibility criteria. The different
eligibility criteria and the referral process would seem to indicate that there is little overlap
between BDC and the CFP, and that the two programs are complementary for the most part.
The objective of CSBFP is to facilitate access to asset-based debt financing for the
establishment, expansion, modernization and improvement of small businesses. It does this by
sharing the financial risk of lending to small businesses among the borrowers, lenders and the
government. The Government pays lenders up to 85% of eligible losses incurred, after lenders’
cost-recovery efforts, on loans that have defaulted. In return, the borrower pays an up-front
registration fee of two percent of the amount financed and an annual fee of 1.25% of the
outstanding loan amount. Commercial lenders are responsible for credit decisions, subject to
eligibility requirements as specified by the Government of Canada. The objectives of the CFP
and the CSBFP are very similar, as both try to increase SME’s access to business financing.
Most interviewees indicated that the presence of commercial lenders is limited in Northern
Ontario and when they are present, they often do not provide significant business financing. It
should be noted that over 70% of CFDC loan recipients reported through the client survey that
they had sought financing from another source prior to applying to the CFDC. For these clients,
over 85% of them had sought financing through a financial institution. As these financial
institutions would have been eligible to offer CSBFP loans, this would seem to indicate that most
Audit and Evaluation Branch Evaluation of the Community Futures Program
March 2014
21
CFDC loan clients were not able to access a CSBFP loan either because the financial institution
was not familiar with the program or the clients did not qualify for a CSBFP loan.
CFDC’s may also receive funding from provincial ministries and municipal/community
organizations to provide certain services to their local communities. At the municipal level,
municipal governments and local chambers of commerce may have some capacity and level of
involvement in community strategic planning and development. In other cases, municipalities
provide funding to CFDCs to undertake such activities on their behalf. Provincially, there are
also a number of programs that complement and potentially overlap with the CFP in serving
communities in Northern Ontario. These include:
The Small Business Enterprise Centres (SBECs) are funded by the Ontario Government and
provides entrepreneurs with consulting/counselling services and tools to start or grow a
business. While there is overlap with the CFP business line of providing business counselling,
SBECs do not provide loans and their visibility and reach is less in some of the smaller
remote communities. Specifically, there are nine SBECs located in Northern Ontario
compared to twenty-four CFDC offices and in only five cases is there a CFDC and SBEC
located in the same community (Bracebridge, Thunder Bay, North Bay, Kenora and
Haileybury).
The Northern Ontario Heritage Fund Corporation (NOHFC), which is a Crown Corporation
under the Ontario Government, invests in northern businesses and municipalities through five
funding programs that provide conditional contributions, forgivable performance loans,
incentive term loans and loan guarantees designed to help municipalities, entrepreneurs and
businesses build, expand and grow. Since 2003, NOHFC has committed more than
$890 million to about 5,800 projects in Northern Ontario21
.
The Rural Economic Development (RED) Program provides funding of $4.5 million per year
over three years to help rural communities remove barriers to community development,
promote economic growth planning processes and contribute to economic competitiveness.
RED projects are cost shared between the province and communities. Since 2003, the Ontario
Government has invested more than $167 million in 418 RED projects.22
The Ontario Self-Employment Benefit (OSEB) provides unemployed people who are, or have
recently been eligible for Employment Insurance with income and entrepreneurial support
while they develop and start their business. A number of CFDCs deliver the OSEB on behalf
of the Province.
A large majority of interviewees suggested that CFDCs play a complementary role to other
programs with little overlap or duplication of services with other federal and provincial
programs. This is partly due to different eligibility criteria of the programs and because CFDCs
are the closest resource in many communities. In addition, CFDCs have the flexibility to tailor
21
Ontario Government News Release “Launching the New Northern Ontario Heritage Fund Programs” October 18,
2013: http://news.ontario.ca/mndmf/en/2013/10/launching-the-new-northern-ontario-heritage-fund-programs.html 22
Ontario Government Website: http://www.omafra.gov.on.ca/english/rural/red/
Audit and Evaluation Branch Evaluation of the Community Futures Program
March 2014
22
their offerings to address gaps in the communities they serve. Finally, many respondents
indicated that there was a high level of coordination among the programs, suggesting that the
CFDCs often work with other service providers to ensure there is no overlap, to agree on roles
and to provide mutual referral services to help communities develop and implement local
solutions to local problems.
3.2 Performance
3.2.1 What impact would the absence of CFP funding have had on the start-up, survival
and growth of businesses, and on community strategic planning and development?
Key finding: Evidence suggests that the absence of CFP funding would have a direct and
negative impact on start-up, survival and growth of businesses in Northern Ontario. The impact
on community strategic planning and economic development in the absence of CFP funding
would be mixed depending on the capacity of the community and the role the CFDC currently
plays in this area.
Evidence from the evaluation suggests that the program has an incremental impact on the
businesses and communities that they serve. The Statistics Canada custom tabulations comparing
CFP-assisted firms to non-assisted firms show that CFP assisted firms were more successful at
achieving job growth, had higher rates of business survival and showed greater sales growth as
compared to non CFP-assisted firms. See section 3.2.2 for further details.
The evaluation client survey provides an indication that the absence of CFP would have a
negative impact on loan clients and their ability to access capital. Specifically, 74% of loan
clients who received financing to start a business indicated that it was somewhat or very unlikely
that they would have been able to start their business without the CFDC financing they received.
In addition, for clients who sought a loan to maintain or expand their business, 71% said it was
somewhat or very unlikely that they could have done so without CFDC financing. The impact
on businesses is further reflected in the context of the client survey where 54% of applicants who
were rejected for a CFDC loan, reported that they were unable to start the business proposed.
In addition, CFDC staff and loan clients at two CFDCs involved in the case studies indicated that
the program was having a significant impact on businesses in their communities and what set
them apart from traditional lenders was the flexibility that they could offer clients regarding loan
repayment schedules. For instance, respondents pointed to examples where CFDCs had worked
with seasonal businesses, those waiting for a payment from a large client, or those communities
only accessible by winter road to adjust loan repayments accordingly. If action was not taken,
respondents suggested that these businesses would have likely had to go out of business.
Respondents in these two case studies further suggested that it was this flexibility, coupled with
the knowledge of the local economy and challenges within their region that was allowing the
CFDC to contribute to the survival of many businesses.
As part of the evaluation, interviewees were asked to consider the impact the absence of CFP
funding would have had on businesses and economic development in their communities. There
was broad agreement across CFDC representatives and community partners interviewed that the
Audit and Evaluation Branch Evaluation of the Community Futures Program
March 2014
23
absence of the CFP would negatively affect businesses in their communities at all stages of
development, including start-up, growth and survival. The majority of interviewees explicitly
stated that a number of businesses would not exist without the CFP. On the other side, experts
and provincial representatives were split regarding the impact in the absence of CFP. Of the two
experts who offered an opinion, one felt that there are enough other programs operating and that
clients would adapt, while the other described the situation as a "disaster" since the absence of
CFP would accelerate issues such as out-migration and urbanization. In addition, one provincial
government respondent indicated that the absence of CFP would impact the growth of businesses
in the region because CFDC’s are involved in community planning, while another provincial
government respondent believed that the number of provincial Small Business Enterprise
Centres would increase if CFP funding was absent.
One method of ensuring incrementality of CFP funding was identified in the case studies
whereby, several CFDCs noted that they require refusal letters from commercial banks or other
lenders before approving a CFP loan.
The impact that the absence of CFP funding would have on community economic development
and community strategic planning was less clear. With respect to the impact on community
economic development activities, a few CFDC representatives felt that these activities would be
negatively affected, although a similar proportion specifically stated that they did not believe
there would be a large negative impact. The discrepancy in responses could be due in large part
to the role the CFDC plays in various communities – varying widely from being heavily
involved in community economic development and strategic planning initiatives to very limited
involvement in municipalities that have the capacity to undertake these roles. However, for their
part, all community economic development partner respondents felt that an absence of CFP
would negatively impact their community’s overall economic development.
3.2.2 To what extent have the immediate, intermediate and ultimate outcomes of the CFP
been achieved?
Key Finding: Overall, evidence suggests that the CFP is achieving its intended immediate and
intermediate outcomes; however, some outcomes are partially attributable to NODP. CFDCs’
primary focus is on providing access to capital and business services, and therefore it shows the
greatest impacts through these activities. Ultimate outcomes are difficult to attribute directly to
CFP; however, data collected from Statistics Canada and CFP clients suggest that the CFP is
contributing to job creation and economically sustainable local rural economies.
This section presents an analysis of the success of CFP in achieving the intended outcomes of the
program as depicted in the logic model contained in section 1.3. The analysis is divided into
three sections, the first section examines immediate and intermediate outcomes as a result of
providing services to SMEs and Social Enterprises (e.g., loans and business counselling), the
second section looks at immediate and intermediate outcomes as a result of support for
community-level planning and projects, and the third section examines ultimate outcomes
resulting from both the provision of services to SMEs and Social Enterprises and from activities
in support of community-level planning and projects.
Audit and Evaluation Branch Evaluation of the Community Futures Program
March 2014
24
Business Related Services to SMEs and Social Enterprises -Immediate and Intermediate
Outcomes
CFDCs provide both financing and business services to SMEs and Social Enterprises under CFP.
Over the evaluation period, the 24 CFDCs in Northern Ontario provided 2,200 loans totalling
$109 million (roughly $908,000 on average per CFDC per year or $50,000 per loan). Over the
same period, they handled 85,931 general inquiries and conducted 12,125 in-depth counselling
sessions. FedNor staff, CFDC board members and CFDC staff interviewed all indicated that
access to capital and business services were the primary focus of CFDCs.
All five case studies demonstrated that the greatest impact the CFDCs were having was on
increasing access to capital. This was substantiated through interviews with loan clients,
community partners and CFDC staff, as well as through CFDC prepared reports submitted to
FedNor (e.g., Annual Performance Reports). Common responses from loan clients were that “I
couldn’t have survived without the loan I received” or that the “banks wouldn’t touch us”,
demonstrating an impact on the CFP’s immediate outcome – improved access to capital.
In terms of financing, the loans are expected to improve access to capital and leverage additional
capital23
. The evaluation client survey showed that 41% of clients surveyed who received a loan
from a CFDC to start a business and 26% for clients who received a loan to maintain or expand a
business, reported that the funding enabled them to obtain additional funding from other sources.
Over the evaluation period, CFDCs reported that the $109 million they lent out leveraged
$219 million ($59 million in owners’ equity and $160 million in third party contributions)24
.
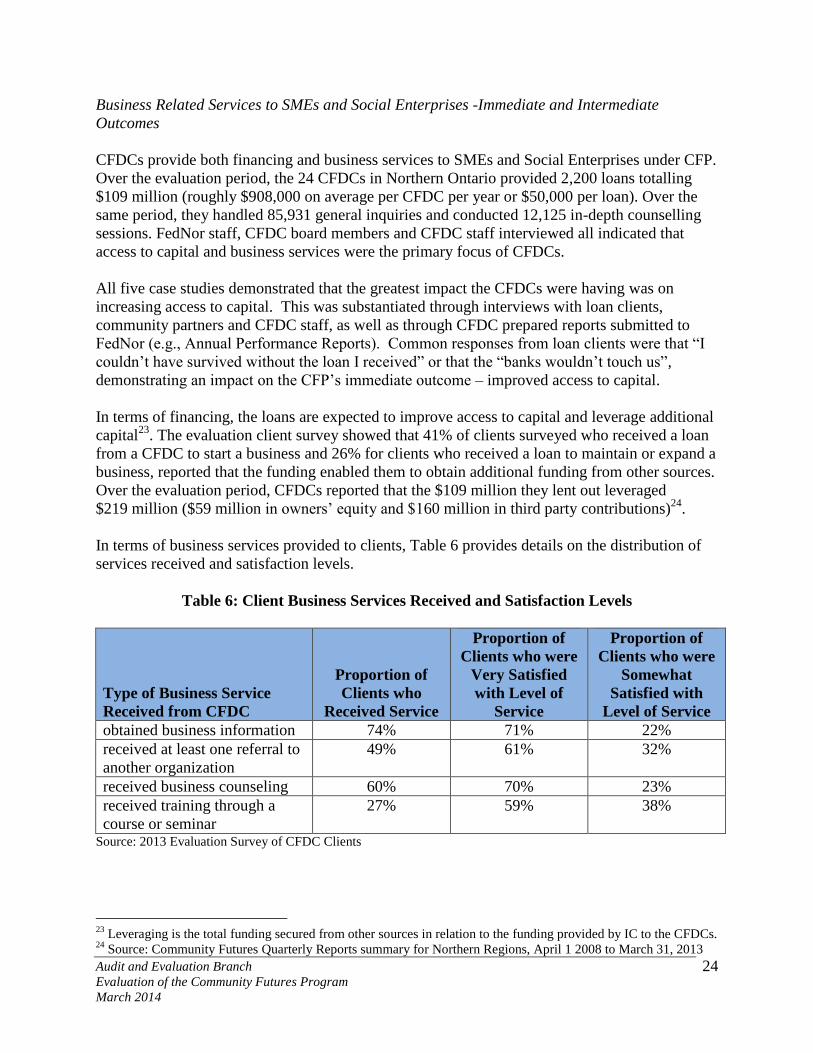
In terms of business services provided to clients, Table 6 provides details on the distribution of
services received and satisfaction levels.
Table 6: Client Business Services Received and Satisfaction Levels
Type of Business Service
Received from CFDC
Proportion of
Clients who
Received Service
Proportion of
Clients who were
Very Satisfied
with Level of
Service
Proportion of
Clients who were
Somewhat
Satisfied with
Level of Service
obtained business information 74% 71% 22%
received at least one referral to
another organization
49% 61% 32%
received business counseling 60% 70% 23%
received training through a
course or seminar
27% 59% 38%
Source: 2013 Evaluation Survey of CFDC Clients
23
Leveraging is the total funding secured from other sources in relation to the funding provided by IC to the CFDCs. 24
Source: Community Futures Quarterly Reports summary for Northern Regions, April 1 2008 to March 31, 2013
Audit and Evaluation Branch Evaluation of the Community Futures Program
March 2014
25
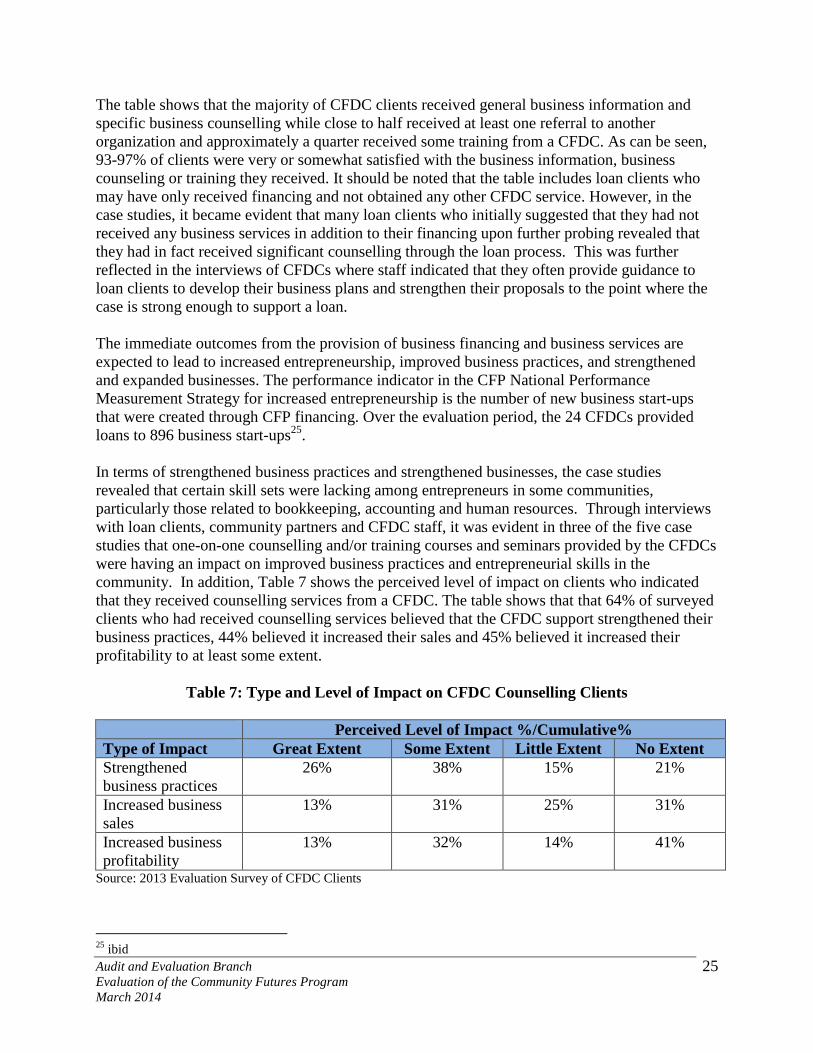
The table shows that the majority of CFDC clients received general business information and
specific business counselling while close to half received at least one referral to another
organization and approximately a quarter received some training from a CFDC. As can be seen,
93-97% of clients were very or somewhat satisfied with the business information, business
counseling or training they received. It should be noted that the table includes loan clients who
may have only received financing and not obtained any other CFDC service. However, in the
case studies, it became evident that many loan clients who initially suggested that they had not
received any business services in addition to their financing upon further probing revealed that
they had in fact received significant counselling through the loan process. This was further
reflected in the interviews of CFDCs where staff indicated that they often provide guidance to
loan clients to develop their business plans and strengthen their proposals to the point where the
case is strong enough to support a loan.
The immediate outcomes from the provision of business financing and business services are
expected to lead to increased entrepreneurship, improved business practices, and strengthened
and expanded businesses. The performance indicator in the CFP National Performance
Measurement Strategy for increased entrepreneurship is the number of new business start-ups
that were created through CFP financing. Over the evaluation period, the 24 CFDCs provided
loans to 896 business start-ups25
.
In terms of strengthened business practices and strengthened businesses, the case studies
revealed that certain skill sets were lacking among entrepreneurs in some communities,
particularly those related to bookkeeping, accounting and human resources. Through interviews
with loan clients, community partners and CFDC staff, it was evident in three of the five case
studies that one-on-one counselling and/or training courses and seminars provided by the CFDCs
were having an impact on improved business practices and entrepreneurial skills in the
community. In addition, Table 7 shows the perceived level of impact on clients who indicated
that they received counselling services from a CFDC. The table shows that that 64% of surveyed
clients who had received counselling services believed that the CFDC support strengthened their
business practices, 44% believed it increased their sales and 45% believed it increased their
profitability to at least some extent.
Table 7: Type and Level of Impact on CFDC Counselling Clients
Perceived Level of Impact %/Cumulative%
Type of Impact Great Extent Some Extent Little Extent No Extent
Strengthened
business practices
26% 38% 15%
21%
Increased business
sales
13% 31% 25%
31%
Increased business
profitability
13% 32% 14%
41%
Source: 2013 Evaluation Survey of CFDC Clients
25
ibid
Audit and Evaluation Branch Evaluation of the Community Futures Program
March 2014
26
Further, the Statistics Canada analysis of CFP-assisted clients to a comparable group of non-
assisted clients showed that sales for CFP-assisted firms climbed from $224.8 million in 2005 to
$376.2 million in 201026
. This represents an average increase of 10.8% per year, which is far
more than the 3.6% per year from non-assisted firms. Sales for the comparable group increased
from $7.1 billion in 2005 to $8.5 billion in 201027
.
In relation to business expansion, CFDC data shows that over the evaluation period, CFDCs
provided loans to 562 businesses in the expansion phase of the business cycle as well as
providing business services to 374 businesses that were seeking to expand28
. Further, the
evaluation client survey showed that for clients who received a CFDC loan to maintain or
expand their business, 71% said that it was somewhat or very unlikely that they could have done
so without the CFDC financing.
Support for Community-Level Planning and Projects -Immediate and Intermediate Outcomes
Support of community-level planning and economic development projects is expected to lead to
the immediate outcomes of strengthened community planning and more effective
implementation of community economic development through projects, partnerships and other
community development initiatives.
Data on CFDC community-level activities was available through the Annual Performance
Reports (APRs), covering the calendar years 2008 through 2012. During this period, the 24
CFDCs in Northern Ontario worked with 304 partners in developing or updating 56 strategic
development plans.
Several CFDCs interviewed suggested that strategic planning was the activity they focused on
least, which would be consistent with the limited number of plans in which CFDCs participated.
This was also highlighted in the case studies where the impact the five CFDCs were having on
strategic planning varied from acting as a resource at the table to not having any impact on the
community’s strategic plan. One CFDC, located in an urban centre noted that it was not
influential in the city’s strategic planning process and it was limited to playing a role in the
development of specific organizational strategic plans (most often those with limited capacity
such as local non-profit organizations). Three other CFDCs were used mainly as a resource to
link stakeholders and provide a broader regional perspective to the strategic planning process.
Finally, one CFDC responsible for a large geographical area made up of a large number of small
remote communities was not able to be directly involved in strategic planning due to proximity,
remoteness and number of communities, but was having an impact by providing communities
with a strategic planning toolkit. Providing the tools to these communities could also be viewed
as building community capacity and empowering these communities to take ownership of the
strategic planning process, their plans and their implementation.
26
Source: Centre for Special Business Projects, Statistics Canada, 2013 27
Ibid 28
Source: Community Futures Quarterly Reports summary for Northern Regions, April 1 2008 to March 31, 2013
Audit and Evaluation Branch Evaluation of the Community Futures Program
March 2014
27
Over the calendar years from 2008 to 2012, the CFDCs reported that they worked with
10,490 partners on 3,372 community economic development projects with a value of
$198 million. CFDCs reported that they contributed $9.4 million to these projects. Interviews of
CFDC board and staff members corroborated that community economic development activities
were largely funded by the NODP’s LIC under which the CFDCs received $5.6 million over the
evaluation period. LIC projects support activities related to community economic development
objectives that create short to medium-term measureable results for the communities and
businesses in the region, such as working with communities to assess local problems, establish
objectives, plan and implement strategies to develop human, institutional and physical
infrastructure, entrepreneurship, employment and the economy.
The immediate community level outcomes are expected to lead to strengthened community
capacity for socio-economic development. Of the CFDC clients surveyed, 93% believed that the
CFDC had an impact on the community capacity with 46% of them suggesting the extent of the
impact was great. While most community economic development partners and subject matter
experts interviewed did not comment on the impact on community capacity, all those that did
suggested that the program had a positive impact. In addition, three of the five CFDCs involved
in the case studies demonstrated that they were having an impact on business practices and
entrepreneurial skills by delivering workshops or information sessions related to book keeping
and financial statements. One CFDC also worked in partnership with the local college to deliver
a 6-week workshop to entrepreneurs on website design.
Ultimate Outcomes
The intermediate outcomes of CFP are expected to lead to the ultimate outcomes of: i) economic
stability, growth and job creation; 2) diversified and competitive local rural economies; and, 3)
economically sustainable communities. Ultimate outcomes are difficult to attribute directly to
CFP, as a number of additional factors can influence these outcomes. Nonetheless, data
collected from Statistics Canada and CFP clients suggest that the CFP is contributing to these
outcomes.
Consistent with the PMS, Statistics Canada data is used to demonstrate how the CFP is
contributing to all of the ultimate outcomes. Specifically, Statistics Canada data analysis of
CFP-assisted firms to a comparison group of non CFP-assisted firms showed employment
growth in CFP assisted firms grew by an average of 7.7% per year over the five-year period
(2005-2010) compared to 3.1% for the comparable group. The analysis also showed a favourable
comparison of business survival rates which represents the number of firms that have entered the
market and are still in business over a given period of time. The business survival rate for all
CFP-assisted firms born between 2000 and 2005 was 84% after the crucial fifth year following
start-up, compared with 64% for comparable firms started in the same time period. This
represents a variation in the five-year business survival rate of 20 percentage points between
CFP-assisted firms and the comparable group29
.
Data from the client survey, displayed in Table 8, shows that CFDC clients perceive that the
CFDCs have a significant impact on all of the CFP ultimate outcomes. Specifically, over 80% of
29
Source: Centre for Special Business Projects, Statistics Canada, 2013
Audit and Evaluation Branch Evaluation of the Community Futures Program
March 2014
28
those surveyed believed that the CFDC activities had an impact on their community’s economic
growth, job creation, diversification and competitiveness, economic sustainability and business
survival to a great or some extent.
Table 8: Perceived Level of Impact of CFDC on Community
Perceived Level of Impact %/Cumulative%
Type of Impact Great Extent Some Extent Little Extent No Extent
Economic growth 45% 40% 9% 6%
Job creation 42% 41% 11% 6%
Diversification and
competitiveness
40% 41% 10% 9%
Economic
sustainability
42% 40% 11%
7%
Survival of
businesses
51% 30% 11%
8%
Source: 2013 Evaluation Survey of CFDC Clients
3.2.3 What are the barriers to achieving the CFP immediate, intermediate and ultimate
outcomes and to what extent are these being mitigated?
Key Finding: While the CFP is largely achieving its expected outcomes, a number of barriers
to its success were identified by interviewees, including the increased pressure on CFDC
operating budgets and large CFDC service areas.
CFDC staff, IC program staff and community partners all suggested that the biggest obstacle
hindering the success of the CFP is that funding to CFDCs has not increased at the same rate as
their costs. Specifically, interviewees indicated that operating costs to maintain CFDC offices
have increased over time30
without a corresponding contribution increase to CFDCs. CFDCs
indicate that with costs rising (e.g., salaries, rent, utilities, and travel costs), there is less
discretionary funds to contribute to the community economic development and strategic
initiatives business lines.
The large geographical area that many CFDCs serve was also identified as a barrier to achieving
CFP outcomes. In particular, large geographic areas put a strain on CFDC operating budgets due
to rising travel costs; leaving less discretionary funding for CFDC investments toward strategic
initiatives and community economic development activities. FedNor does provide additional
funding for five CFDCs to compensate for remote service areas and corresponding travel costs,
but this continues to be a challenge for many CFDCs. In addition, large geographic areas
comprised of many small communities pose challenges for CFDCs in terms of having a local
presence and becoming an integral part of the community, which can be particularly challenging
with staff of two to four employees. To mitigate, CFDCs are taking advantage of
teleconferencing software when possible and bundling trips to reduce travel costs. A CFDC that
was examined in the context of the case studies also identified a recent costing exercise, which
30
This could not be confirmed in a review of CFDC financial statements as FedNor reports that the statements do
not necessarily report all operating costs which may be covered by other revenue sources.
Audit and Evaluation Branch Evaluation of the Community Futures Program
March 2014
29
resulted in the CFDC leasing a car for travel as opposed to paying staff mileage rates as one
strategy to reduce travel costs.
3.2.4 To what extent are the CFP’s performance measurement and reporting structures
effective in reporting on the achievement of the CFP outcomes?
Key Finding: CFP performance measurement has improved significantly since the last
evaluation. The development and implementation of the National CFP Performance
Measurement Strategy is assisting FedNor in assessing and reporting on the achievement of
program outcomes. As well, the introduction of the CFDC Performance Report should improve
the reporting of results on all four CFDC business lines. However, there are still improvements
that could be made to performance measurement for the CFP.
Historically, CFDCs reporting tools have included quarterly reports, annual performance reports
and business plans. The quarterly reports were designed to capture statistical information related
to investment and business counselling activities. The annual performance reports provided a
qualitative assessment of CFDC activities, outcomes and impacts, related to access to capital,
and business services; as well as quantitative and qualitative information related to strategic
planning and community economic development projects. These reports made it possible for
FedNor to monitor CFDC activities, outcomes and impacts, identify where best practices exist,
and collect data for potential benchmarking exercises. Finally, CFDC business plans are
submitted to FedNor on either a one-year or a three-year cycle, depending on FedNor’s
assessment of risk and performance level of the CFDC. The business plans outline the CFDC’s
future goals, objectives, and planned activities as well as performance targets for the duration of
the plan. In addition, CFDCs are contractually obligated to submit an Audited Financial
Statement and Investment Fund Report to FedNor annually. The Investment Fund Report
provides performance information with respect to CFDC investment fund activity and enables an
assessment of the historical and current financial information of individual CFDC investment
portfolios.
The 2008 Evaluation of the Community Futures Program in Ontario recommended that FedNor
complete a review of the performance data collected to ensure reliable and meaningful reporting
and establish additional indicators to provide information for assessing the longer-term impacts
of the program. As a result of the Evaluation, an interdepartmental CFP National Program
Performance Measurement (PM) Strategy Committee was established with the RDAs and
Industry Canada (FedNor) to develop and implement a National PM Strategy for the program
(initially completed in August 2010, and revised January 2013). This strategy was to ensure
consistency in collecting, analysing and reporting on program performance data. In particular,
there are new indicators that rely on Statistics Canada data that are helping to better assess
longer-term impacts. The CFP PM Strategy also includes common indicators across departments
to facilitate a comparison of program results at the national level.
FedNor has been diligent in the implementation of the National PM Strategy and this has served
to strengthen accountability, transparency, and performance reporting to the government. Their
approach included the following activities:
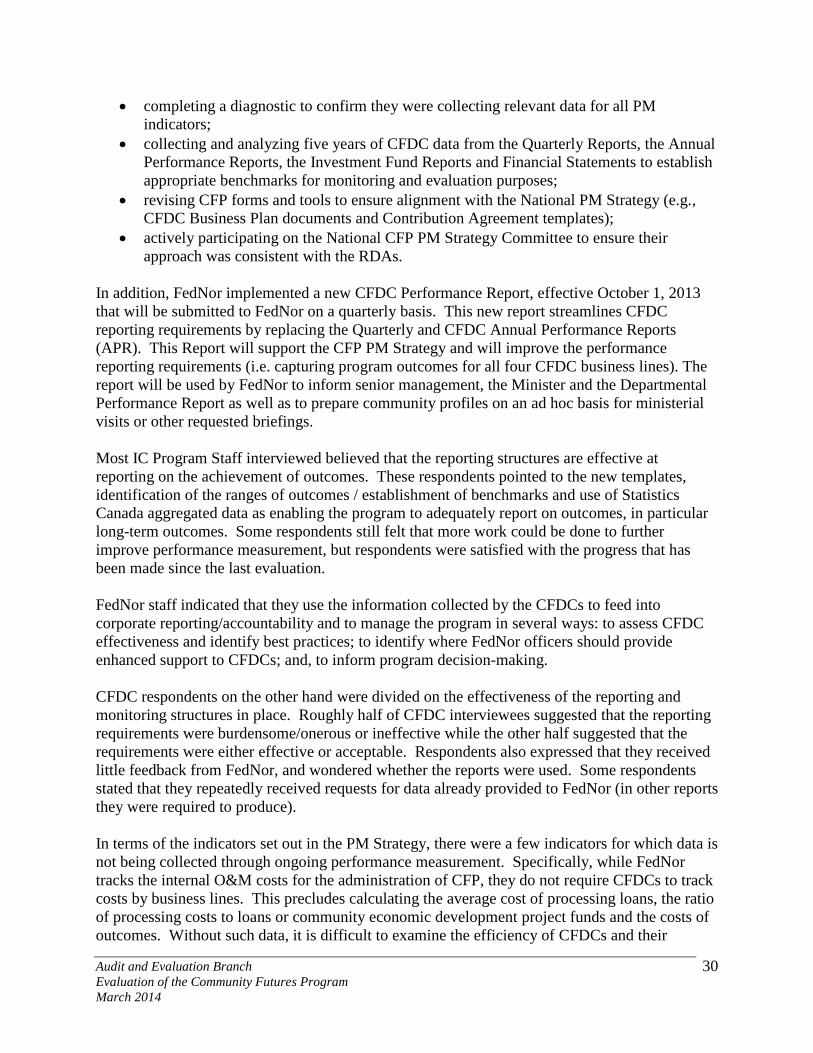
Audit and Evaluation Branch Evaluation of the Community Futures Program
March 2014
30
completing a diagnostic to confirm they were collecting relevant data for all PM
indicators;
collecting and analyzing five years of CFDC data from the Quarterly Reports, the Annual
Performance Reports, the Investment Fund Reports and Financial Statements to establish
appropriate benchmarks for monitoring and evaluation purposes;
revising CFP forms and tools to ensure alignment with the National PM Strategy (e.g.,
CFDC Business Plan documents and Contribution Agreement templates);
actively participating on the National CFP PM Strategy Committee to ensure their
approach was consistent with the RDAs.
In addition, FedNor implemented a new CFDC Performance Report, effective October 1, 2013
that will be submitted to FedNor on a quarterly basis. This new report streamlines CFDC
reporting requirements by replacing the Quarterly and CFDC Annual Performance Reports
(APR). This Report will support the CFP PM Strategy and will improve the performance
reporting requirements (i.e. capturing program outcomes for all four CFDC business lines). The
report will be used by FedNor to inform senior management, the Minister and the Departmental
Performance Report as well as to prepare community profiles on an ad hoc basis for ministerial
visits or other requested briefings.
Most IC Program Staff interviewed believed that the reporting structures are effective at
reporting on the achievement of outcomes. These respondents pointed to the new templates,
identification of the ranges of outcomes / establishment of benchmarks and use of Statistics
Canada aggregated data as enabling the program to adequately report on outcomes, in particular
long-term outcomes. Some respondents still felt that more work could be done to further
improve performance measurement, but respondents were satisfied with the progress that has
been made since the last evaluation.
FedNor staff indicated that they use the information collected by the CFDCs to feed into
corporate reporting/accountability and to manage the program in several ways: to assess CFDC
effectiveness and identify best practices; to identify where FedNor officers should provide
enhanced support to CFDCs; and, to inform program decision-making.
CFDC respondents on the other hand were divided on the effectiveness of the reporting and
monitoring structures in place. Roughly half of CFDC interviewees suggested that the reporting
requirements were burdensome/onerous or ineffective while the other half suggested that the
requirements were either effective or acceptable. Respondents also expressed that they received
little feedback from FedNor, and wondered whether the reports were used. Some respondents
stated that they repeatedly received requests for data already provided to FedNor (in other reports
they were required to produce).
In terms of the indicators set out in the PM Strategy, there were a few indicators for which data is
not being collected through ongoing performance measurement. Specifically, while FedNor
tracks the internal O&M costs for the administration of CFP, they do not require CFDCs to track
costs by business lines. This precludes calculating the average cost of processing loans, the ratio
of processing costs to loans or community economic development project funds and the costs of
outcomes. Without such data, it is difficult to examine the efficiency of CFDCs and their
Audit and Evaluation Branch Evaluation of the Community Futures Program
March 2014
31
individual business lines. In addition, while the evaluation client survey collected information
related to the proportion of loan applicants who were refused funding from other sources or for
whom funding was conditional on CFP funding, it would be useful and more reliable to consider
collecting this information through on-going monitoring. Another area that still needs to be
addressed is setting regional targets (and date to achieve target) for the indicators in the strategy.
This work is currently underway.
There are also additional indicators for which FedNor could require CFDCs to track to improve
the reporting of outcomes, including:
number of clients that were able to obtain bank financing after receiving CFDC business
services assistance or a CFDC loan; and
number of loans paid off in original loan term/ extended loan term/or called.
Overall, the information gathered for the evaluation shows that FedNor has done a lot of work
over the last few years to improve their data collection processes to better assess program
outcomes. They have revised the performance measurement and reporting tools/structures for
the CF Program since the last evaluation to reflect the requirements of the 2013 National PM
Strategy.
3.2.5 To what extent is the CFP efficient in the context of the results achieved? Is there a
more cost effective way of achieving expected results?
Key Finding: CFP programming is efficient in that the program’s flexibility allows CFDCs to
focus on activities within their communities that will have the greatest impact. FedNor’s
administration costs related to the delivery of the CFP is relatively small when compared to the
program’s overall budget. While the loan component has been efficient in achieving leveraging,
the cash reserves held by some CFDCs are high. There is an opportunity for FedNor to explore
why this is occurring and whether further action is required.
CFP is efficient because the program’s flexibility allows CFDCs to focus services and resources
on what is most needed in the local community (i.e., those activities that will have the greatest
impact). The program parameters were designed with this flexibility in mind and it is often
regarded as the biggest strength of the program. As Reimer and Bollman point out, “there is an
old saying among rural analysts—once you’ve seen one rural community, you’ve seen one rural
community. No two rural communities are the same. Thus, rural development policy design and
policy implementation need flexibility to achieve desired outcomes”31
.
Further, place-based design, “which allows for the development of tailor-made solutions to the
problems of a specific community or group of communities”32
creates efficiencies in achieving
expected results by ensuring that CFDCs are not focusing on an activity not needed in one
community that may be vital in another or where services already exist. This was also
31
Bill Reimer and Ray D. Bollman “Understanding Rural Canada: Implications for Rural Development Policy and
Rural Planning Policy” 2010, p.47 32
Dr. Tony Fuller; Dr. Lars Larsson; Carolyn Pletsch “Insights From Comparing The Community Futures Program
Ontario With LEADER in Sweden” 2010, p.15
Audit and Evaluation Branch Evaluation of the Community Futures Program
March 2014
32
substantiated in the context of the case studies, where there was evidence in all five cases of
CFDCs providing services in response to unique local situations (e.g. responding to local flood
conditions or community disasters) and tailoring their services based on what other providers
offered.
Another feature of the program that was identified by interviewees as contributing to efficiency
was the CF Network Organizations. CFDC representatives indicated that the networks,
particularly the regional networks, are a vehicle for attaining economies of scale that benefit all
CFDCs, such as group training, promotion and advocacy activities; pooled investment funds;
centralized group purchasing of products (such as insurance, telephone, health benefits); and
operational policies. The networks were also seen to increase efficiency through the
dissemination of best practices.
FedNor’s delivery costs related to the CFP comprise 5.7% of the overall budget, and have
remained relatively stable over the evaluation period. FedNor has also created operating
efficiencies, such as assigning FedNor officers based on geographical areas for the delivery of
both the CFP and NODP. Assignments based on geography result in greater knowledge of the
region for each officer and decreased travel costs since officers can combine trips related to both
programs.
It is not possible to assess costs related to processing loans and costs per outcome as CFDCs do
not track costs for each of the four CFDC business lines. However, leveraging dollars can be
used as a proxy in determining value for money and the ability to leverage is paramount to the
success of the program33
. Leveraging represents efficiency in that program dollars stimulate
further investment from other sources, such that the impact is greater than what would have
occurred without the leveraged funding. As reported in section 3.2.2, CFDCs reported that over
the evaluation period the $109 million in loans they disbursed leveraged an additional
$219 million in additional financing from other sources (owners’ equity of $59 million and third
party contributions of $160 million)34
.
In the case studies, one CFDC demonstrated that by having a physical office and equipment
funded by CFP, it was able to leverage funding from other sources to deliver additional programs
that have similar objectives or address specific needs within the community (e.g., Northern
Ontario Youth Initiative, Self-Employment Benefit Program) and deliver economies of scale to
all program partners. Delivering these additional programs also helps to increase the knowledge
capacity of the CFDC staff. In addition, through these partnerships the CFDC increases its
presence and reach within the community, thereby receiving additional loan clients and business
counseling clients and ultimately better positioning itself to deliver on its immediate,
intermediate and ultimate outcomes. In essence, the CFDC is able to do more, offer more to
clients with the same amount of base funding as other CFDCs.
When looking at cash reserves, FedNor has set a target range of 21-25% for cash balance as a
percentage of five-year loan disbursements, whereas 2012 CFDC Financial Data showed that the
average rate of the 24 Northern Ontario CFDCs was 41% in 2012. Applying the FedNor target
ratio range of 21-25% suggests that, in total, Northern Ontario CFDCs were carrying excess cash
33
Leveraging is one of the performance measures reported in Industry Canada’s Departmental Performance Reports 34
Source: Community Futures Quarterly Reports summary for Northern Regions, April 1 2008 to March 31, 2013
Audit and Evaluation Branch Evaluation of the Community Futures Program
March 2014
33
in 2012 in the range of $17 to $22 million. Further, FedNor sets a target of 70-79% for the ratio
of active loans to investment fund balance to assess whether CFDCs are improving access to
capital and leveraged capital through investments in SMEs and Social Entreprises. 2012 CFDC
financial data confirmed that the average rate was 65% for the 24 CFDCs. Applying the FedNor
target ratios for this measure suggests that the CFDCs were carrying excess cash in 2012 in the
range of $6 to $18 million.
A KPMG study commissioned by FedNor in 2003 indicated that the BDC could be an
appropriate comparator when analyzing cash reserves as it is similar to CFDCs in the following
ways:
The BDC is not a deposit-taking institution;
The BDC is involved exclusively in commercial lending activities and does not provide
personal financial services; and
The BDC is generally considered to be a secondary lender to traditional financial institutions,
offering financing at interest rates that are higher than those charged by traditional financial
institutions.35
It should be noted that while there are similarities between the CFDCs and the BDC, the BDC
likely has greater lending opportunities due to its greater exposure to urban areas and its ability
to lend out higher value loans. As well, current reality is that the CFDCs catchment area covers
smaller, Northern Ontario communities that have faced difficult economic circumstances as a
result of the global recession.
In 2012, the BDC ratio of cash reserves as a percentage of annual disbursements was 20%.
Applying this ratio to the 24 CFDCs suggests they carried excess cash of $41 million.
The KPMG analysis also looked at cash reserves as a percentage of the outstanding portfolio.
The ratio realized by the BDC in 2012 was 4%. Applying this ratio to the 24 CDFCs suggests
they carried excess cash of $40 million. In section 3.2.6, the evaluation findings indicate that
CFDCs overall are experiencing loan loss ratios at the low end of FedNor’s target range.
There may be a number of possible factors that are contributing to the high cash reserves, which
were evident in the case studies such as, risk aversion, low demand for loans related to either
other financial players in the area or a depressed economic area where few businesses were
looking to start-up or expand. FedNor should examine the underlying reason for these high levels
of cash reserves and determine whether further action is required.
Overall, most FedNor and CFDC interviewees felt that the operation of the program was
efficient. However, suggestions made by FedNor respondents to improve efficiencies were:
better systems and more manageable reporting requirements from FedNor; and increased board
capacity / training. CFDCs indicated that efficiency has been gained through leveraging
partnerships, accessing funding from other sources including NODP (most notably LIC) and
efficient administration of the office through contracting out some services and leasing.
Suggestions from CFDCs to improve were investing in new technology (i.e. implementing
videoconferencing), switching reporting software, and better/stronger partnerships with the
35
Ibid, pg. 38
Audit and Evaluation Branch Evaluation of the Community Futures Program
March 2014
34
province/their community partnerships. In the context of the case studies, CFDC interviewees
also suggested allowing some flexibility around what their Investment Fund could be used to
fund (e.g., community economic development projects).
3.2.6 Are the loss rates of the CFDC loans acceptable and do the CFDCs carry an
acceptable level of risk?
Key Finding: Overall, CFDCs are carrying a low level of risk and a high level of cash
reserves, suggesting that FedNor should examine the reasons for the low loan loss ratios and
high cash reserves held by some CFDCs and determine whether or not CFDCs should revisit
their risk levels and target ranges for cash reserves.
One of the key services that CFDCs provide to SMEs under the CFP is access to capital. CFDCs
provide repayable financing on commercial terms when financing from other sources is either
insufficient or unavailable. This is reflected in the evaluation survey of clients that found that 70-
75% of clients had tried to access capital from other sources before approaching a CFDC for a
loan. As such, CFDC loans would be expected to carry a higher risk than those provided by other
lenders and result in a greater proportion of loan losses.
The 2008 Evaluation of the CFP found that there was a wide range of loan loss rates across
CFDCs and made the following recommendation:
FedNor should work with CFDCs to establish general target ranges related to desirable
levels of funds in active investment and loan loss rates based upon local realities.
The recommendation balances the objective to keep loan losses at acceptable levels while
ensuring that desirable levels of funds are in active investments. The balance is important
because if CFDCs are extremely risk adverse, they will limit the amount of funds that they
actively lend to SMEs in the community, focusing on the lowest risk proposals that may be
eligible for funding from traditional lending sources. While this strategy would minimize risk, it
reduces the amount of funds active in the community that can realize the objectives of CFP.
In response to the 2008 evaluation, FedNor developed the target ranges36
outlined in Table 9
based on their analysis of CFDC Investment Fund data over a five-year review period. It should
be noted that the evaluation matrix in the National CFP PMS outlines that the number and
percentage of write off and default loans should also be measured as loan risk indicators, but
FedNor has only instructed CFDCs to start reporting the number of write off and default loans on
the CFDC Performance Report commencing in October 2013.
36
As outlined in FedNor’s CFDC Capitalization Policy, April 2013
Audit and Evaluation Branch Evaluation of the Community Futures Program
March 2014
35
Table 9: FedNor Targets for CFDC Investment Activities
Indicator Target Range
Five year average loan loss ratio37
3-8%
Cash balance as a percentage of five year loan disbursements 21-25%
Percentage of funds in active loans 70-79%
These indicators and associated targets indicate that FedNor addressed the 2008 evaluation report
recommendation. The question remains whether these targets represent an acceptable level of
risk. What constitutes an “acceptable” level of risk is a policy decision; however, as outlined in
section 3.2.5, the BDC may be an appropriate comparator. The BDC sets global target forecast
loss rates which as of 2008 is considered acceptable up to 7%. BDC’s actual loan loss rates
between 2009 and 2013 have ranged between 3.3% and 6.0%38
. It can be seen that FedNor’s
target range of 3-8% is in line with both BDC’s target and actual performance.
In terms of individual CFDC loan loss targets, approximately half of the CFDCs interviewed
indicated that they did not set targets for their CFDC. For those that set targets, 2/3 had a target
of between 5 and 10 percent and 1/3 set it at 5% or less.
Table 10 displays the distribution of loan loss rates of the CFDCs as reported to FedNor in their
2012 investment fund reports. For all CFDCs combined, the five-year average loan loss ratio was
3.8%, on the low end of FedNor’s target range of 3-8%. On an individual CFDC basis, all loan
loss ratios were within the established target range with the exception of 3 CFDCs where ratios
were below 3%39
.
Table 10: Five Year Average Loan Loss Ratio Distribution for CFDCs
Range Number of CFDCs %
7% - 8% 3 12.5
6% - 7% 2 8.3
5% - 6% 2 8.3
4% - 5% 8 33.3
3% - 4% 6 25.0
Less than 3% 3 12.5
Total 24 100
On an annual basis, the average loan loss rates across all CFDCs have remained within the
3%-8% range for the previous five years. The average rates for all CFDCs have also been
decreasing, from 5.3% in 2008 to 3.8% in 2012. The fact that the rate is decreasing and that 70%
of the loan loss rates are below 5% suggests that the risk is well managed. However, some
37
The loan loss rate represents the annual expense due to loan impairment in relation to the total value of the loan
portfolio. 38
BDC Annual Reports, 2009, 2010, 2011, 2012, 2013 39
The 3 CFDCS in the table that are below 3% are all below 2%
Audit and Evaluation Branch Evaluation of the Community Futures Program
March 2014
36
CFDCs show significant variances on a year-to-year basis. For theses CFDCs, the results of the
five-year loan loss ratio may be a misleading result of the stability and quality of the portfolio.
Only 3 of the 24 CFDCs reported loan loss rates within the range for each of the 5 years.
In terms of cash reserves, FedNor set a target range of 21-25% for cash balance as a percentage
of five-year loan disbursements, whereas the average rate of all CFDCs in 2012 was 41% with
one CFDC below the target range, one within the target range and the remainder above the target
range. On this basis, CFDCs have a low level of risk and by holding large cash balances may be
limiting the potential impact that they could have on the communities under their responsibility.
Another measure that FedNor employs to monitor the investment funds of CFDCs is the ratio of
active loans to investment fund balance. FedNor sets a target of 70-79% to assess whether
CFDCs are improving access to capital and leveraged capital through investments in SMEs and
Social Enterprises. In looking at the performance of CFDCs in the last fiscal year, the average
rate was 65% with two falling into the target range, two above the target range and the remaining
20 falling below the target range. These figures also suggest that it would be worthwhile to
explore why this is the case and whether CFDCs could take on more risk.
In terms of interview findings, all ten IC program staff interviewed were comfortable with how
CFDCs have been managing their portfolios and the level of risk they have been taking on. They
indicated that FedNor approved CFDC investment policies and monitor the administration of the
investment fund in each CFDC. One of the subject matter experts interviewed suggested that
CFDCs should be permitted to take on greater risks to improve on the achievement of intended
outcomes.
Audit and Evaluation Branch Evaluation of the Community Futures Program
March 2014
37
4.0 CONCLUSIONS AND RECOMMENDATIONS
4.1 Relevance
Regarding relevance of the program, the evaluation determined that:
There is a continued need for the CFP based on the economic situation in Northern Ontario
and the barriers that SMEs face in this region.
The CFP aligns with Government priorities to support economic development in rural Canada
through a community-based approach with support to small businesses.
The CFP aligns with Industry Canada’s strategic outcomes and activities related to
community economic development and developing competitive Canadian businesses and
communities.
The CFP is consistent with federal roles and responsibilities to support regional economic
development in Ontario with a focus on SMEs and the development of entrepreneurial talent.
While there are many players in regional economic development in Northern Ontario, most
services provided by CFDCs are complementary to those provided by the other players and
where there are potential overlaps, the flexibility of the CFP allows CFDCs to tailor their
services to what is most needed in the communities they serve.
4.2 Performance
Regarding the effectiveness of the program, the evaluation determined that:
The effects of the CFP are incremental in that a large majority of loan recipients indicated that
it would have been unlikely that they could have started or expanded their business in the
absence of CFP funding. Further the businesses of program participants showed greater
growth in sales and employment and greater survival rates than a comparison group of non-
participants.
Overall, evidence suggests that CFP is achieving its intended immediate and intermediate
outcomes. However, some outcomes are partially attributable to NODP which provided
funding to CFDCs for their investment funds and for community economic development
projects. CFDCs’ primary focus is on providing access to capital and business services, and
therefore it shows the greatest impacts through these activities. Ultimate outcomes are
difficult to attribute directly to CFP; however, data collected from Statistics Canada and CFP
clients suggest that the CFP is contributing to job creation and economically sustainable local
rural economies.
In relation to the performance measurement indicators, there are a few indicators set out in the
PM Strategy for which data is not being collected through ongoing performance
measurement. There are also additional indicators for which FedNor could have the CFDCs
track to improve the reporting of outcomes.
Audit and Evaluation Branch Evaluation of the Community Futures Program
March 2014
38
Regarding the efficiency of the program, the evaluation determined that:
The administration of the program by FedNor is relatively efficient.
The flexibility of the program allows CFDCs to be efficient by targeting their services to
where the needs are greatest in the communities they serve and where they will have the
greatest impacts.
While the loan component has been efficient in achieving leveraging, the overall loan loss
ratios are low and cash reserves held by some CFDCs are high. There is an opportunity for
FedNor to explore why this is occurring and whether further action is required.
Recommendations
The evaluation led to the following recommendations:
1. FedNor should continue to further develop the CFP Performance Measurement Strategy in
concert with its RDA partners. (e.g., examine whether to expand data collection to cover all
indicators in the Performance Measurement Strategy and add additional outcome indicators).
2. FedNor should examine the reason for the overall low loan loss ratios and high cash reserves
held by some CFDCs and determine whether further action is required.