Evaluation of the 55 MPH Speed Limit
25
EVALUATION OF THE 55 MPH SPEED LIMIT T im M. Borg, Graduate Assistant in Research H arold L. M ichael , Associate Director A. A. G adallah , Graduate Instructor in Research G eorge K. Stafford, Traffic Technician Joint Highway Research Project Purdue University INTRODUCTION In the fall of 1973 the United States experienced an unexpected “ energy crisis.” T o deal with the crisis, various steps were taken to help the nation conserve its petroleum resources. One such step was a federal requirement that all states set and enforce a maximum speed limit of 55 mph or have federal aid highway funds withheld. Not since W orld War II had there been a gasoline shortage and an attempt to conserve gasoline by regulating vehicle speeds. During the period from late 1973 until state legislatures could pass legislation for the 55 mph speed limit, Indiana and other states operated under a strongly encouraged voluntary maximum speed limit of 55 mph. The federal requirements that a maximum speed limit of 55 mph be posted on all highways became mandatory in Indiana on March 1, 1974. About 25 years ago, the Joint Highway Research Project (JH RP) began making annual studies of free-flowing traffic on rural state high- ways. These data were used for trend determination of speeds for design purposes as well as by F H W A in their annual speed trends studies of traffic in this country. More recently, JH R P has been making quar- terly speed studies for the required state evaluation of compliance with the 55 mph speed limit as required by 1975 federal legislation. All of this history places the organization in a good position to evaluate the effects, at least on speed, of the 55 mph speed limit. One result was a project titled “ Evaluation of the 55 M P H Speed Limit” by Tim M . Borg. This project and the results of the several speed studies are the primary bases for this paper. BRIEF SUMMARY OF FINDINGS OF PRIOR SPEED STUDIES Speed limits are established for the good of the motoring public, primarily for purposes of safety. Several studies have shown that by 160
Transcript of Evaluation of the 55 MPH Speed Limit
EVALUATION OF THE 55 MPH SPEED LIMIT
T im M . Borg, Graduate Assistant in Research H arold L. M ic h a e l , Associate Director
A. A. G a d a l l a h , Graduate Instructor in Research G eorge K. Stafford, Traffic Technician
Joint Highway Research Project Purdue University
IN T R O D U C T IO NIn the fall of 1973 the United States experienced an unexpected
“ energy crisis.” T o deal with the crisis, various steps were taken to help the nation conserve its petroleum resources. One such step was a federal requirement that all states set and enforce a maximum speed limit of 55 mph or have federal aid highway funds withheld. Not since W orld W ar II had there been a gasoline shortage and an attempt to conserve gasoline by regulating vehicle speeds.
During the period from late 1973 until state legislatures could pass legislation for the 55 mph speed limit, Indiana and other states operated under a strongly encouraged voluntary maximum speed limit of 55 mph. The federal requirements that a maximum speed limit of 55 mph be posted on all highways became mandatory in Indiana on March 1, 1974.
About 25 years ago, the Joint Highway Research Project (JH R P ) began making annual studies of free-flowing traffic on rural state highways. These data were used for trend determination of speeds for design purposes as well as by F H W A in their annual speed trends studies of traffic in this country. More recently, JH R P has been making quarterly speed studies for the required state evaluation of compliance with the 55 mph speed limit as required by 1975 federal legislation.
All of this history places the organization in a good position to evaluate the effects, at least on speed, of the 55 mph speed limit. One result was a project titled “ Evaluation of the 55 M P H Speed Limit” by Tim M . Borg. This project and the results of the several speed studies are the primary bases for this paper.
BRIEF S U M M A R Y OF FIN D IN G S O F PR IO R SPEED STUDIES
Speed limits are established for the good of the motoring public, primarily for purposes of safety. Several studies have shown that by
160
161
reducing the number of high-speed vehicles on freeways, the resulting more uniform speeds contribute to improved capacity and safety.7
The effectiveness of a speed limit on a facility, however, depends on the degree of enforcement and public support.2,3 The public will support and obey speed limits that are safe and reasonable; however, speed limits that are illogically restrictive cannot be enforced except by tremendous effort and expense, and then usually not for long.2
It is the responsibility of traffic engineers to establish speed limits by careful investigation and evaluation. The most common method of establishing speed limits is to use the 85th percentile of the observed speeds as an approximation of the desirable speed limit.10,14
The speed a driver chooses is dependent upon his or her desires and environment; therefore, speed control is difficult because of variations in the driving attitude of individuals.2, 7 That attitude which influences the observance of posted speed limits is influenced by the tolerance permitted and the degree of enforcement by the police agencies.2
Many factors do or do not affect speed characteristics and have been evaluated by numerous researchers. Some of these are noted in the following list:
1. The concealment of the observation vehicle affects the speed recorded.18
2. The percentage of heavy trucks does not affect the speed of free- flowing traffic.6
3. The spot speeds of out-of-state drivers are frequently higher than those of in-state drivers.16
4. It is important to evaluate the standard deviation of spot speeds during periods of low traffic flow in order to approach the maximum standard deviation.15
5. Horizontal alignment is the principal geometric feature affecting spot speeds.16
6. It is critical for free flow speeds that volumes not be too high, since in traffic with increased volumes drivers are forced to adopt the speeds of slower vehicles due to congestion.17
7. Higher priced, heavy vehicles are driven slightly faster than lower priced, light vehicles.16
8. Various weekdays during daylight hours have no significant difference in spot speeds.10,12
There are three major elements in traffic: the driver, the vehicle, and the roadway. Transportation engineers have been primarily concerned with the roadway. Although the direct causal relationship may
162
be low, the roadway undoubtedly influences the accident rate because the highway can require mental and physical responses above and beyond the abilities of the driver.13 One of the responsibilities of the engineer is to determine what changes in the roadway will make travel safer for the public.
The uniformity of vehicle operating speeds appears to have a more important effect on accidents than the absolute vehicle speed. With uniformly flowing traffic, there are fewer conflicts between vehicles.
Accident rates are related to the design of highways and their respective average daily traffic volumes. Freeways, because of their greater degree of access control, use of medians, and adequate setback distances for side interference, have lower accident rates than other highways. Accident rates increase with increasing volumes until congestion slows considerably the flow of traffic.17 In studying accident rates, a three-year period has been found to be the optimum time span.11
It must also be remembered that calculated accident rates are based on the number of reported accidents. An Illinois study found that 75 percent of all highway accidents are not reported; therefore, a highway may have a greater incidence of accidents than the accident rate indicates. It often appears that the public is more concerned with reducing delays and interference than with reducing accident rates.9
PURPOSE OF PU RD U E RESEARCHThe objectives of this research project were:1. T o determine the speed of free-flowing traffic on various classes
of rural arterial highways under the mandatory 55 mph speed limit;
2. T o determine changes in passenger vehicle and heavy truck speeds under the 55 mph speed limit on rural highways and to determine the effectiveness of the 55 mph limit;
3. T o evaluate accident rates on rural arterial highways for the first six months of 1974 to see if there had been any change with implementation of the 55 mph speed limit;
4. T o evaluate the gasoline conservation aspects of the 55 mph speed limit.
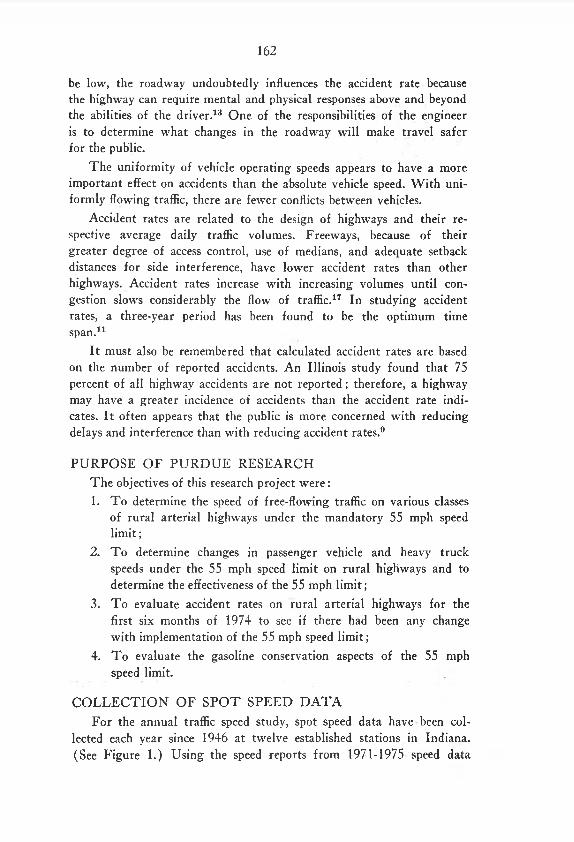
C O L L E C T IO N O F S PO T SPEED D A T AFor the annual traffic speed study, spot speed data have been col
lected each year since 1946 at twelve established stations in Indiana. (See Figure 1.) Using the speed reports from 1971-1975 speed data
163for each type of rural highway— interstate, other four-lane, and two- lane— were tabulated. Passenger vehicle speeds were compared as were
Figure 1. Location of Spot Speed Stations.

164
heavy (over 5000 pounds) truck speeds. For each type of highway and class of vehicle, comparisons were made of the following: average speed, standard deviation, 85th percentile, percent of vehicles exceeding the posted limit, percent of vehicles exceeding the posted limit by more than 5 mph, and percent of vehicles exceeding 65 mph. In addition, the percentage of traffic volume for each year, each class of vehicle, and each type of highway was determined for each 5 mph speed range.
C O L L E C T IO N O F D A T A FO R A C C ID E N T S T U D YThree classes of rural Indiana highways were evaluated to deter
mine accident rates. Twenty-four interstate, 26 other four-lane, and 75 two-lane rural highway sections, each about 12 miles long, were selected. (See Figure 2.) For a section to be acceptable, it had to meet certain criteria. The purpose of the criteria was to minimize the chance variations in accident rates due to factors other than volume change. These criteria included:
1. Homogeneous cross section.2. Outside metropolitan areas.3. No major change in land use along the section during the study
period.4. No alteration of roadway (other than regular maintenance)
during the study period.5. Previous speed limit was 65 mph for all highways except 70
mph for rural interstate highways.
Sections were accepted or rejected based on data made available by the Indiana State Highway Commission. The exact length of each section was gathered at the same office.
Traffic volumes for the accepted rural sections were collected from a 1972 A D T map obtained from the Indiana State Highway Commission (IS H C ) Division of Traffic. The 1972 A D T for each section was determined from the map. Data provided by permanent ISH C counting stations were used to develop factors to convert the 1972 A D T of a section to the relative volumes for the first six months of 1971, 1972, 1973, and 1974.
O f the total of 23 permanent volume stations in Indiana, seven were rejected because at some time in the four-year period 1971-1974 traffic was rerouted due to construction. This would have biased the monthly average by including volumes which were not due to normal chances in driving habits.

Figure 2. Location of Accident Study Sections.

166The Indiana State Police made available the standard accident
report forms from which accident data for the first six months of 1971, 1972, 1973, and 1974 were obtained.
For each section, accident rates for the first six months of each year were calculated using volume data, section length, and accident counts. While accident counts were tallied into four categories— property damage, personal injury, fatal, and total accidents— no attempt was made to confirm the final outcome of an accident, such as an injured person later dying. T o assure complete data, the intersections on each road section were checked to see if accidents had been inadvertently indexed to the crossroad.
The accident rates for the first six months of 1974 (after 55 mph) were compared by category to the first six months of 1971-1973 (before 55 mph). The first six-month period of 1974 was used because accidents reports would have had sufficient time to be processed and filed. T o minimize changes in accident rates due to seasonal variations, only the first six months of 1971, 1972, and 1973 were used in the comparison.
D A T A FO R G ASO LIN E C O N S U M P T IO N E S T IM A T IO NAn evaluation was made of the gasoline savings that were realized
in the first six months of 1974 by a change in speeds and volumes from the same period in the previous year. The amount of vehicular travel in Indiana was obtained from a 1972 statistical compilation by the Department of Transportation, Federal Highway Administration. Again, permanent counting station data were used to convert the quantity of travel in 1972 to the relative quantities in the two study periods. The average speed of passenger vehicles on rural Indiana highways was determined for 1973 and 1974 from the speed study. Using data compiled by Claffey in 1969, the rate of gasoline consumption of an “ average American car” was estimated at the observed speeds.5 The average gasoline consumption rate divided into the number of vehicle miles driven approximated the quantity of gasoline used in that period.
SPEED S T U D Y ANALYSISFor passenger vehicles with the speed limit at 55 mph on rural
interstate highways, the average speeds in 1974 decreased from 1973 about 11 mph, on other rural four-lane highways around 6 mph, and on rural two-lane highways about 5 mph. (See Table 1.) During 1973 the speed limit on interstate facilities was 70 mph while it was 65 mph on all other roads.

167TA B LE 1 AVERAG E VEH ICLE SPEEDS
Average Speed (mph)Passenger Cars 1971 1972 1973 1974
Interstates 68.5 69.3 69.6 58.7Other Four-lanes 64.7 64.3 ... 63.9 58.0Two-lanes 61.3 62.0 62.1 56.7All Types of Highways 64.9 65.2 65.2 57.8
Heavy Trucks (over 5000 lbs.) 1971 1972 1973 1974Interstates 59.4 60.9 61.6 56.4Other Four-lanes 56.4 55.2 57.8 54.4Two-lanes 54.0 55.6 56.4 54.5All Types of Highways 56.8 57.6 58.8 55.1
For heavy trucks on rural interstate highways, the average speeds in 1974 decreased from 1973 about 5 mph, on other four-lane highways around 3 mph, and on rural two-lane highways merely 2 mph.
The 85th percentile speeds for passenger vehicles on rural interstate highways decreased in 1974 almost 12 mph, on other four-lane rural highways around 8 mph, and on two-lane rural highways slightly over 7 mph from 1973. (See Table 2.) The 85th percentile for heavy trucks decreased in 1974 on interstates about 7 mph, on other four-lane highways nearly 5 mph, and on two-lane highways about 3 mph from 1973. It should be noted that the 85th percentile differences are greater than the average speed differences for the vehicles on the several facilities.
TA B LE 2 85th PER C EN TILE VEH ICLE SPEEDS
85th Percentile Speed (mph)
Passenger Cars 1971 1972 1973 1974Interstates 73.7 74.4 74.8 62.6Other Four-lanes 70.7 70.9 70.9 63.1Two-lanes 6 8 . 0 68.7 68.7 61.8
Heavy Trucks (over 5000 lbs) 1971 1972 1973 1974Interstates 65.3 66.5 67.0 59.6Other Four-lanes 62.0 62.4 65.1 59.8Two-lanes 60.7 61.6 62.1 59.4
Table 3 shows the 10 mph range (with vehicles classified only in 5 mph groups) which had the greatest percentage of vehicles. Passenger vehicles in 1974 on interstates dropped from the 65-74 mph range in
168
1973 to the 55-64 mph range, and also increased the percentage of vehicles in that range by nearly 9 percent. Other four-lane highways dropped from the 60-69 mph range to the 55-64 mph range with about 9 percent more vehicles. Two-lane highways fell from the 60-69 mph range to the 50-59 mph range and increased the percentage of vehicles in that range by almost 11 percent.
TA B LE 3 T H E T W O C O N SEC U TIV E 5 M P H GROUPS (10 M P H R A N G E ) W IT H H IG H E S T TR A F F IC V O L U M E
Range (mph) and % Total Volume
65-74 65-74 65-74 55-6463.7 65.7 64.3 73.0
60-69 60-69 60-69 55-6456.9 54.0 51.2 62.6
55-64 60-69 60-69 50-5953.1 54.0 51.4 62.6
55-64 60-69 55-64 50-5960.9 54.6 61.4 75.0
55-64 50-59 55-64 50-5958.5 48.9 50.6 58.4
50-59 50-59 55-64 50-5955.3 55.8 58.1 65.5
The 10 mph range carrying the heaviest volume of traffic of heavy trucks in 1974 fell 5 mph on interstates, other four-lane and two-lane rural highways from 1973 data. The percentage of heavy truck traffic in the 50-59 mph range rose from 1973 nearly 14 percent on interstates, about 8 percent on other four-lanes, and slightly over 7 percent on two lanes.
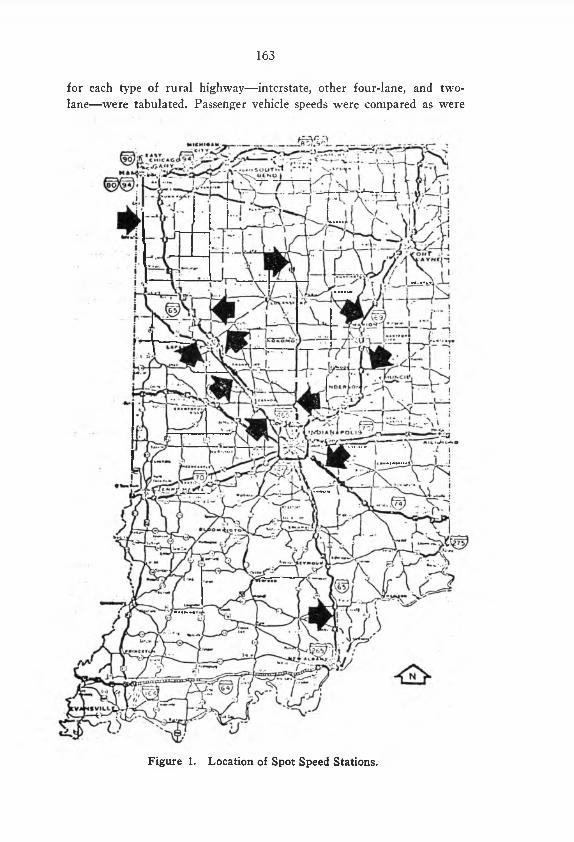
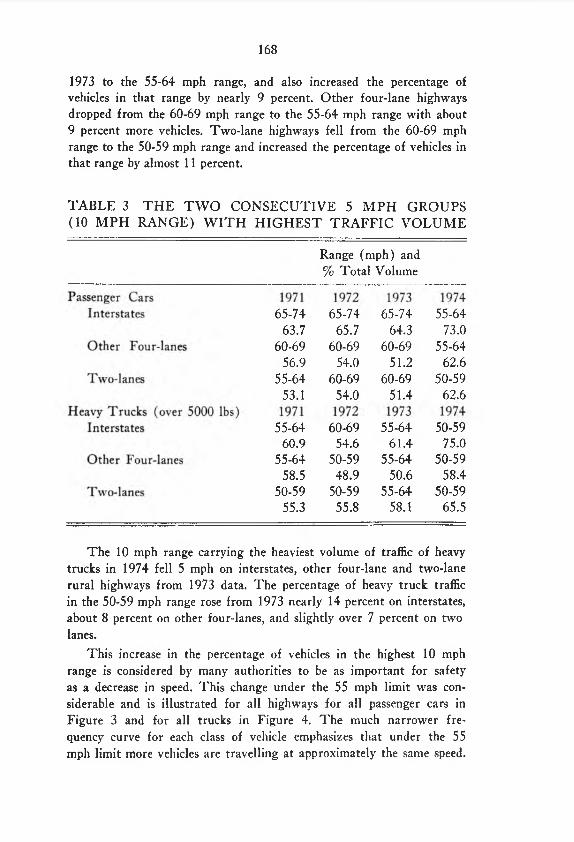
This increase in the percentage of vehicles in the highest 10 mph range is considered by many authorities to be as important for safety as a decrease in speed. This change under the 55 mph limit was considerable and is illustrated for all highways for all passenger cars in Figure 3 and for all trucks in Figure 4. The much narrower frequency curve for each class of vehicle emphasizes that under the 55 mph limit more vehicles are travelling at approximately the same speed.
169
Figure 3. All Highways Passenger Speeds— Relative Frequency Distribution Curves.
Figure 4. All Highways Truck Speeds— Relative Frequency DistributionCurves.
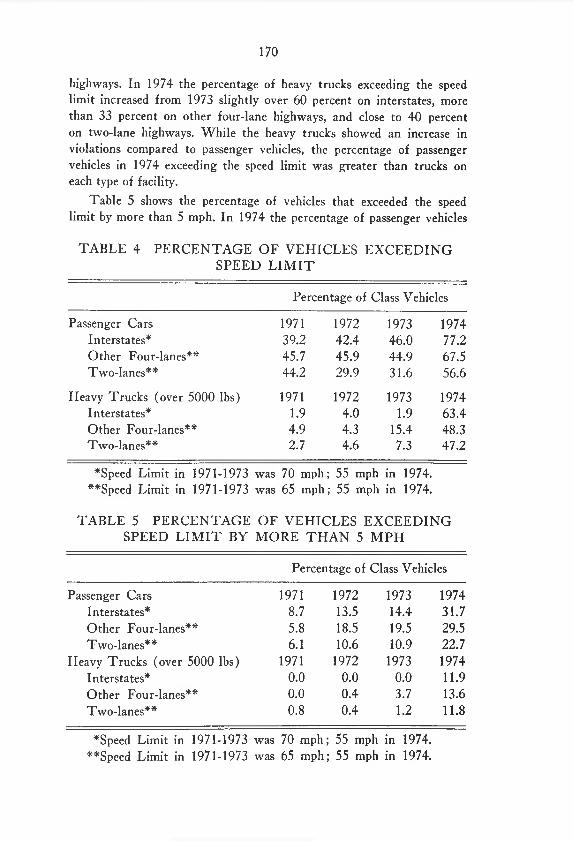
Table 4 shows the percentage of vehicles that exceeded the posted speed limit on rural highways. In 1974 the percentage of passenger vehicles exceeding the speed limit (55 mph) increased from 1973 (70 and 65 mph) almost 30 percent on interstate highways, nearly 22 percent on other four-lane highways, and around 25 percent on two-lane
170
highways. In 1974 the percentage of heavy trucks exceeding the speed limit increased from 1973 slightly over 60 percent on interstates, more than 33 percent on other four-lane highways, and close to 40 percent on two-lane highways. While the heavy trucks showed an increase in violations compared to passenger vehicles, the percentage of passenger vehicles in 1974 exceeding the speed limit was greater than trucks on each type of facility.
Table 5 shows the percentage of vehicles that exceeded the speed limit by more than 5 mph. In 1974 the percentage of passenger vehicles
TA B LE 4 PE RCEN TAG E O F VEHICLES E X C E E D IN G SPEED L IM IT
Percentage of Class Vehicles
Passenger Cars 1971 1972 1973 1974Interstates* 39.2 42.4 46.0 77.2Other Four-lanes** 45.7 45.9 44.9 67.5Two-lanes** 44.2 29.9 31.6 56.6
Heavy Trucks (over 5000 lbs) 1971 1972 1973 1974Interstates* 1.9 4.0 1.9 63.4Other Four-lanes** 4.9 4.3 15.4 48.3Two-lanes** 2.7 4.6 7.3 47.2
*Speed Limit in 1971-1973 was 70 mph; 55 mph in 1974. **Speed Limit in 1971-1973 was 65 mph; 55 mph in 1974.
TA B LE 5 PER C EN TA G E O F VEHICLES E X C E E D IN G SPEED L IM IT BY M O R E T H A N 5 M PH
Percentage of Class Vehicles
Passenger Cars 1971 1972 1973 1974Interstates* 8.7 13.5 14.4 31.7Other Four-lanes** 5.8 18.5 19.5 29.5Two-lanes** 6.1 10.6 10.9 22.7
Heavy Trucks (over 5000 lbs) 1971 1972 1973 1974Interstates* 0.0 0.0 0.0 11.9Other Four-lanes** 0.0 0.4 3.7 13.6Two-lanes** 0.8 0.4 1.2 11.8
*Speed Limit in 1971-1973 was 70 mph; 55 mph in 1974. **Speed Limit in 1971-1973 was 65 mph; 55 mph in 1974.

171showed an increase from 1973 of nearly 17 percent on rural interstates, almost 10 percent on other four-lane rural highways, and a little over 12 percent on rural two-lane highways. The percentage of heavy trucks showed an increase from 1973 of nearly 12 percent on interstates, more than 10 percent on other four-lanes, and about 11 percent on two-lanes in 1974. Although the increased violation percentages for passenger cars and trucks on each highway were similar, the actual percentages of passenger cars and of trucks exceeding the speed limit by more than 5 mph were not. In fact, the percentages of passenger vehicles exceeding speed limit by 5 mph or more were about double that of heavy trucks.
Table 6 shows the percentage of vehicles that exceeded 65 mph on rural highways. The percentage of passenger vehicles in 1974 that exceeded 65 mph dropped from 1973 by more than 71 percent on interstate highways. It fell almost 34 percent on other four-lane highways and nearly 26 percent on two-lane highways. The percentage of heavy trucks in 1974 exceeding 65 mph fell from 1973 by almost 28 percent on interstate highways, nearly 14 percent on other four-lane highways, and slightly more than 6 percent on two-lane highways.
TA B LE 6 PE RCEN TAG E O F VEHICLES E X C E E D IN G65 M P H
Percentage of Class Vehicles
Passenger Cars 1971 1972 1973 1974Interstates* 77.3 81.6 81.3 9.9Other Four-lanes** 53.7 51.2 47.5 13.0Two-lanes** 31.0 34.6 35.2 9.2
Heavy Trucks (over 5000 lbs) 1971 1972 1973 1974Interstates* 18.4 30.6 30.1 2.2Other Four-lanes** 6.4 8.5 17.8 4.2Two-lanes** 4.7 6.2 8.9 2.4
*Speed Limit in 1971-1973 was 70 mph; 55 mph in 1974. **Speed Limit in 1971-1973 was 65 mph; 55 mph in 1974.
It should be noted that prior to 1974 the percentage of trucks exceeding 65 mph was much less than the percentage of passenger vehicles. This was probably because trucks do not have the potential to exceed 65 mph as easily as passenger cars.
The rural mean spot speeds of passenger cars, then trucks, were compared for statistically significant changes. For each type of vehicle and each class of highway, an analysis of variance (A N O V A ) using

172orthogonal contrasts was used to test if the mean speeds for 1974 were different from 1971, 1972, and 1973.
Using a level of confidence of 0.95 for the A N O V A , the passenger vehicle speeds on interstates, other four-lanes, two-lanes, and overall did experience a significant change in 1974 over the three previous years. Heavy truck speeds on interstates, other four-lanes, and overall also were significantly different, but no significant change was found for heavy trucks on two-lane highways.
Summary of Speed ObservationsThe overall average rural free-flow speed of passenger cars on all
types of facilities decreased 7.4 mph to 57.8 mph in 1974 from 1973. Similarly, heavy truck (over 5000 pounds) speeds fell 3.6 mph to 55.2 mph in 1974 from 1973. (See Table 1.) The greatest reduction in rural speeds occurred on interstate highways. There was a tendency for average speeds in 1974, besides being lower, to be less variable than in 1973. The average rural speeds for passenger vehicles and heavy trucks showed a statistically significant change in 1974 except for trucks on two-lane highways. The average speed of heavy trucks on two-lane highways did not significantly change, possibly because the geometric design and not the speed limit controlled their speed.
Additional StudiesThe speeds reported to this point in this paper for 1974 were taken
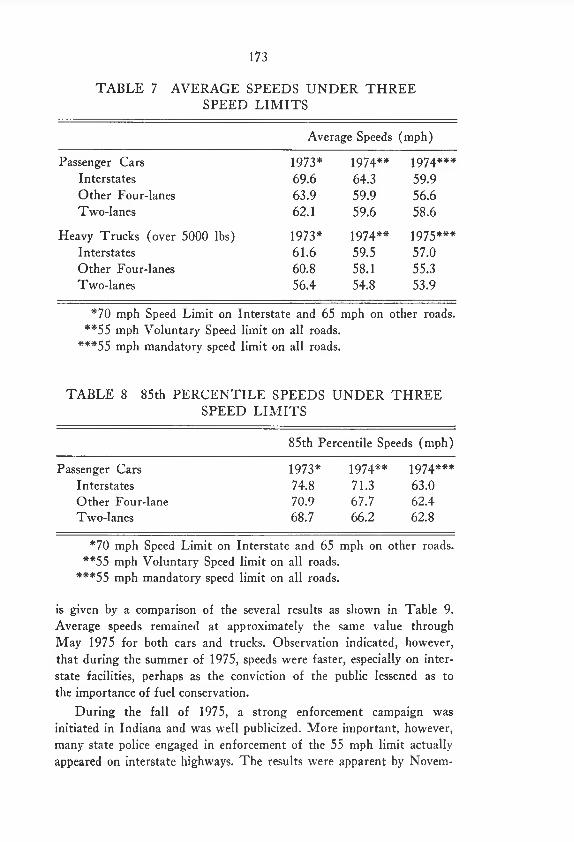
in May 1974 with the 55 mph mandatory. As noted earlier the 55 mph limit was only voluntary to March 1, 1974. Because of interest in the relationship between actual speeds under voluntary and mandatory speed limits, a speed study was made at the same 12 stations prior to March 1, 1974. A comparison of the average speeds on the three classes of roads is given in Table 7 for cars and heavy trucks. Table 8 gives the 85th percentile speeds for passenger cars under the three speed limit conditions.
In general, the reduction in average speeds under the voluntary 55 mph was about one-half that under the mandatory 55 mph. This was true for both cars and trucks. Perhaps more important, however, is the fact that the 85th percentile speed of passenger cars (and also trucks although not shown) decreased only about one-third as much under the voluntary 55 mph as under the mandatory. This indicates that the decreased variability of speeds obtained with the mandatory 55 mph, and probably an important factor in the decreased fatality rate, was not nearly as pronounced under the voluntary 55 mph.
Since 1974 additional speed studies have been made quarterly. An indication of the increase in average speeds which many feel has occurred
173
T A B LE 7 AVERAG E SPEEDS U N D E R TH R E E SPEED L IM IT S
Passenger Cars 1973* 1974** 2974# * *Interstates 69.6 64.3 59.9Other Four-lanes 63.9 59.9 56.6Two-lanes 62.1 59.6 58.6
Heavy Trucks (over 5000 lbs) 1973* 1974** 1975***Interstates 61.6 59.5 57.0Other Four-lanes 60.8 58.1 55.3Two-lanes 56.4 54.8 53.9
*70 mph Speed Limit on Interstate and 65 mph on other roads. **55 mph Voluntary Speed limit on all roads.
***55 mph mandatory speed limit on all roads.
TA B LE 8 85th PER C EN TILE SPEEDS SPEED L IM IT S
U N D E R TH R E E
85th Percentile Speeds (mph)
Passenger Cars 1973* 1974** 1974*##Interstates 74.8 71.3 63.0Other Four-lane 70.9 67.7 62.4Two-lanes 68.7 66.2 62.8
*70 mph Speed Limit on Interstate and 65 mph on other roads. **55 mph Voluntary Speed limit on all roads.
***55 mph mandatory speed limit on all roads.
is given by a comparison of the several results as shown in Table 9. Average speeds remained at approximately the same value through May 1975 for both cars and trucks. Observation indicated, however, that during the summer of 1975, speeds were faster, especially on interstate facilities, perhaps as the conviction of the public lessened as to the importance of fuel conservation.
During the fall of 1975, a strong enforcement campaign was initiated in Indiana and was well publicized. More important, however, many state police engaged in enforcement of the 55 mph limit actually appeared on interstate highways. The results were apparent by Novem
Average Speeds (mph)

174
ber 1975 when the average speeds were clearly reduced, but primarily only on the interstate system— where enforcement was most apparent.
Since November 1975, average speeds have remained approximately the same, as enforcement has continued. One unusual result, however, does appear. The result that average speeds are less or little more on the interstate system than on two-lane roads is not consistent with the higher design and operation standards and the lower accident rates on interstate facilities. The difference in speeds should be greater; perhaps speeds should be less on two-lane roads— or higher on the interstate system— or a combination of both. Certainly the design, operating, and accident conditions on interstate highways warrant higher speeds on these facilities than on two-lane rural roads.
TA B LE 9 AVERAG E SPEED V A R IA T IO N SINCE IM P L E M E N T A T IO N OF T H E 55 M P H L IM IT
Average Speed (mph)Interstate Roads Two-lane Roads
Passenger Heavy Passenger Heavy Speed Study Date Cars Trucks Cars Trucks
May 1974 59.9 57.0 58.7 53.9July 1974 58.7 56.4 56.7 54.5May 1975 57.4 56.7 57.1 53.6Aug. 1975 59.9 59.3 57.8 56.2Nov. 1975 56.9 56.5 57.4 55.4March 1976 57.5 56.7 56.4 53.4June 1976 57.1 57.0 55.3 53.5
V O L U M E D A T A ANALYSISSeventeen permanent counting stations throughout the state pro
vided the monthly average daily traffic volumes for the first half of the years 1971-1974. These average daily volumes of traffic at these count stations are shown in Figure 5. The average daily traffic volumes for the first half of 1971, 1972, and 1973 increased about 500 vehicles per day each year. But in the first half of 1974, instead of growing to an average daily volume of about 6900, the average was only 5989 vehicles per day, a drop of over 13 percent. The average volume decreased by6.5 percent in 1974 from 1973. People did travel less during the early months of the 55 mph limit than in the previous year. They apparently agreed that conservation of fuel was desirable.

175
Figure 5. Average Daily Volumes for First Half of Each Year.
A C C ID E N T ANALYSISEach of the 125 sample highway sections had sixteen accident rates
calculated— accident rates for the first half of each of the four years for each of four types of accidents— property, personal injury, fatal, and total. Accident rates were expressed as accidents per hundred million vehicle miles.
The rates for each type of accident were lowest on interstates with accident rates on two-lane highways nearly four times at great. Other four-lane highways experienced accident rates about twice as great as those on interstate highways.
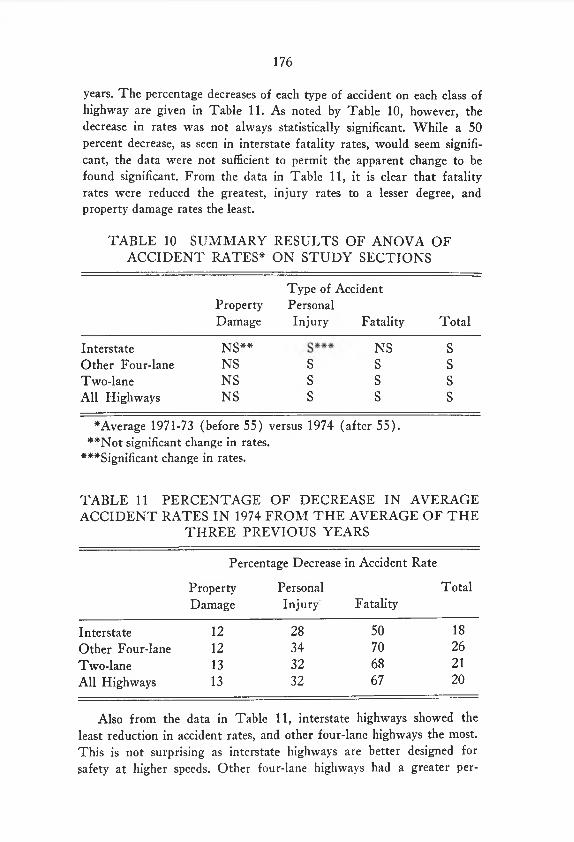
An analysis of variance using orthogonal contrasts was used to test whether the rate change, average 1971-73 (before 55) versus 1974 (after 55), was significant for each class of highway and each type of accident. A summary of A N O V A significance findings is shown in Table 10.
There was a decrease in the accident rates in the first half of 1974 from the average accident rates of the same period in the three previous
176
years. The percentage decreases of each type of accident on each class of highway are given in Table 11. As noted by Table 10, however, the decrease in rates was not always statistically significant. While a 50 percent decrease, as seen in interstate fatality rates, would seem significant, the data were not sufficient to permit the apparent change to be found significant. From the data in Table 11, it is clear that fatality rates were reduced the greatest, injury rates to a lesser degree, and property damage rates the least.
TA B LE 10 S U M M A R Y RESULTS O F A N O V A OF A C C ID E N T RATES* O N S T U D Y SECTION S
Type of AccidentPropertyDamage
PersonalInjury Fatality Total
Interstate NS** NS sOther Four-lane NS s S sTwo-lane NS s s sAll Highways NS s s s
* Average 1971-73 (before 55) versus 1974 (after 55).**Not significant change in rates.
***Significant change in rates.
TA B LE 11 PE R C EN TA G E O F DECREASE IN AVERAG E A C C ID E N T RATES IN 1974 FR O M T H E AVERAG E O F T H E
TH R E E PREVIOU S YEARS
Percentage Decrease in Accident Rate
PropertyDamage
PersonalInjury Fatality
Total
Interstate 1 2 28 50 18Other Four-lane 1 2 34 70 26Two-lane 13 32 6 8 2 1
All Highways 13 32 67 2 0
Also from the data in Table 11, interstate highways showed the least reduction in accident rates, and other four-lane highways the most. This is not surprising as interstate highways are better designed for safety at higher speeds. Other four-lane highways had a greater per-

177
centage of accident rate reduction than two-lane highways, perhaps because of the heavier traffic volumes and greater development with increased roadside conflicts without the benefits of access control typically associated with such highways.
It should be noted that the accident reductions that were experienced occurred under several changed conditions. This study found speeds to be reduced, speeds to be more uniform, and traffic volumes to be less. All three are recognized as important factors in accidents. There, of course, may be other factors which have not been evaluated but which are important to reductions in accidents. One recent study estimated that reduced and more uniform speeds accounted for 11 percent of the reduction of fatalities, reduced travel accounted for 5 percent, and other effects accounted for 7 percent.8
Some of the reduction in fatalities and accidents was undoubtedly due to the reduction in speeds resulting from the lower speed limit. The lower speeds of vehicles on highways, especially on older roads not designed for high speeds, placed less demand on drivers for safe handling of their vehicles and provided drivers with greater opportunities to react safely in emergency situations. The more uniform speed resulted in less accidents because there was less internal friction; for example, the hazards of passing maneuvers were reduced.
It is also clear that reduced travel accounted for some of the reduction of accidents. Although accident rates take into consideration the vehicle miles of travel, the assumption is made that all drivers are exposed to the same degree of hazard. It can easily be understood, however, that a driver on a higher volume road has a higher probability of collision than if on a road of lower volume because of greater opportunity for vehicular conflict.
There are other effects that contribute to the savings of lives and property. Everyday, older cars are being replaced by newer and safer cars on the highway. The new cars handle better and offer much more protection to the occupants in the event of collision. Highways are daily being improved, not only by construction of new or improved highways, but by pavement repairs and hazard removal. State and local traffic safety programs also continually educate and assist drivers.
These increasing safety conditions were reflected in a declining trend in accident rates on the study sections since 1971 before the 55 mph speed limit became effective. The 1971 overall accident rate was 194 accidents per hundred million vehicle miles; the 1972 rate was 169; that for 1973 was 158; and the 1974 rate was 139. These rates are plotted in Figure 6. There can be little doubt but that at least some

178
Figure 6. Accident Rates 1971-1974.
of the reduction in accident rates in 1974 from previous years can be attributed to the overall trend.
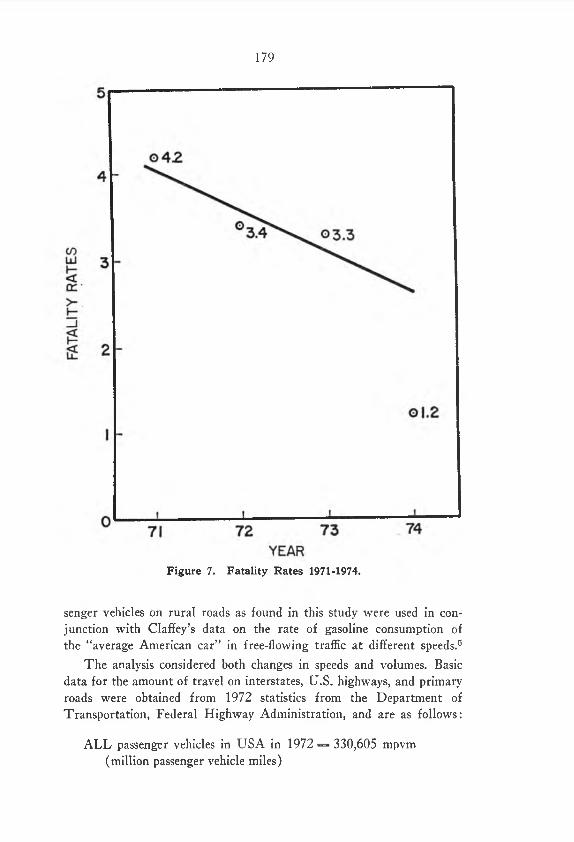
On the other hand, the reduction in fatality rates appears to be much greater than that which occurred because of the decreasing trend. Fatality rates for the study sections are plotted in Figure 7. The rate for 1974, although it is probable the very low rate is partly a chance occurrence, probably was desirably affected by the 55 mph limit.
G ASO LIN E C O N S U M P T IO N ANALYSISCalculated rates of gasoline consumption were compared for the
first half of 1973 and the first half of 1974. The mean speeds of pas-
179
Figure 7. Fatality Rates 1971-1974.
senger vehicles on rural roads as found in this study were used in conjunction with Claffey’s data on the rate of gasoline consumption of the “ average American car” in free-flowing traffic at different speeds.5
The analysis considered both changes in speeds and volumes. Basic data for the amount of travel on interstates, U.S. highways, and primary roads were obtained from 1972 statistics from the Department of Transportation, Federal Highway Administration, and are as follows:
A LL passenger vehicles in USA in 1972 = 330,605 mpvm (million passenger vehicle miles)

180
A LL motor vehicles in USA in 1972 = 449,030 mvm (million vehicles miles— rural)
A L L motor vehicles in Indiana in 1 9 7 2 = 15,572 mvm (rural)A L L motor vehicles in Indiana in 1972 on interstates = 4458 mvm
(rural)
Three assumptions were made in estimating 1973 and 1974 travel from the available 1972 data. First, the proporation of passenger vehicles to total traffic remained the same. Second, the trip lengths in 1972 were the same in 1973 and 1974. Third, the mileages of each type of rural state highway were the same for all three years. O f the total vehicular travel, passenger vehicle travel was:
Factors to estimate travel for the first half of 1973 and 1974 on rural Indiana highways were derived by summing the monthly average daily volumes at the permanent counting stations in Indiana for the first half of the subject years and dividing by the sum of the monthly average daily volumes for all of 1972.
The number of passenger vehicle miles on all rural primary Indiana highways was then estimated by multiplying the appropriate factors by the 1972 F H W A data:
(15.572) X (0.7363) X (0.5147) = 5901.4 mpvm on all rural primary Indiana highways in the first half of 1973.
(15.572) X (0.7363) X (0.4813) = 5518.4 mpvm on all rural primary Indiana highways in the first half of 1974.
The average observed speeds on all rural primary Indiana highways as reported in this study (65.2 mph in 1973 and 57.8 mph in 1974) provided a rate of gasoline consumption from Claffey’s data. The number of vehicle miles driven divided by rate of consumption gave the relative net volumes of gasoline used. The amount of gasoline estimated as used by passenger cars on all rural state primary highways was:

181
A savings of 55,292,000 gallons of gasoline was realized in the first half of 1974 over the first six months of 1973 in passenger car travel on all Indiana primary highways.
A further estimate of the amount of gasoline saved in the first half of 1974 over the first half of 1973 on interstate highways in Indiana by passenger cars was made in the same manner. T o estimate the number of passenger vehicle miles on rural Indiana interstates, the 1972 F H W A data was multiplied by the two appropriate factors.
(4458) X (0.7363) X (0.5147) = 1689.5 mpvm on interstates in the first half of 1973
(4458) X (0.7363) X (0.4813) = 1579.8 mpvm on interstates in the first half of 1974
This gave a savings of 22,359,000 gallons on Indiana interstate highways.
Lower speeds and reduced travel accounted for a savings of about 55 million gallons of gasoline on Indiana rural primary highways in the first half of 1974 over the first half of 1973 for passenger car travel. It was not possible to obtain satisfactory data to estimate similar fuel savings by trucks. O f the savings, approximately 22 million gallons were saved on rural Indiana interstates.
It has been estimated that three billion gallons of gasoline are being saved annually by the lower speed limits in the U.S.1 Reduced speed must share the credit for this gasoline savings, however, with reduced travel. For example, the savings of 55 million gallons estimated for Indiana primary highways by passenger cars was due to a reduction of travel (1974 from 1973) of 383 mpvm and an average improvement of 1.6 mpg. O f the 55 million gallon reduction, 40 percent (about 24 million gallons) was due to reduced travel.
182
CON CLUSIONSThis study has evaluated changes in speeds, traffic volumes, acci
dent rates, and gasoline consumption on Indiana rural primary highways. On the basis of the results obtained, the following conclusions are made relative to the 55 mph mandatory speed limit:
1. Average passenger vehicle speeds in free-flowing traffic decreased approximately 11 mph on rural interstate highways, 6 mph on other rural four-lane highways, and 5 mph on rural two-lane highways.
2. The 85th percentile speeds for passenger vehicles in free-flowing traffic decreased approximately 12 mph on rural interstate highways, 8 mph on other rural four-lane highways, and 7 mph on rural two-lane highways.
3. Average heavy (over 5,000 pounds) truck speeds in free-flowing traffic decreased approximately 5 mph on rural interstates, 3 mph on other rural four-lane highways, and 2 mph on rural two-lane highways.
4. The 85th percentile speeds for heavy trucks in free-flowing traffic decreased around 7 mph on rural interstates, 5 mph on other rural four-lane highways, and 3 mph on rural two-lane highways.
5. Average speeds under a voluntary 55 mph speed limit decreased only about one-half as much as under a mandatory 55 mph limit. The 85th percentile speeds decreased only about one-third as much.
6. Average speeds of passenger cars and trucks were maintained at approximately the same speed when enforcement was maintained. Without enforcement average speeds showed an increasing trend.
7. Speeds of traffic on all types of rural highways are more uniform under the 55 mph than before it was imposed as a greater percentage of vehicles of each type are travelling in the highest 10 mph group.
8. Average daily volumes of traffic fell in the first half of 1974 by about 13 percent from a projected average daily volume from the three previous years and were 6.5 percent less than the volumes of the previous year.
9. Fatality accident rates on rural primary highways decreased in the first half of 1974 from the same period of 1971, 1972, and 1973 by about 67 percent, personal injury rates by around 32 percent, and property damage rates by approximately 13 percent.

18310. Statistical evaluation of the decline in accident rates was sig
nificant for each type of accident on each type of facility investigated except for fatality accidents on interstate highways and for property accidents on all types of facilities.
11. The decrease in accident rates occurred under conditions of decreased speeds of travel, more uniform speeds of travel, decreased amounts of travel, and many other safety improvements. It was not possible to evaluate the contribution each of these factors made toward the decrease in accident rates but a trend analysis indicated other safety improvements to be most important for accidents and reduced speed to be most important for fatality rates.
12. A savings of approximately 22 million gallons of gasoline was realized by the changes in average speed and volumes on rural Indiana interstates in the first half of 1974 over the first half of 1973.
13. A savings of about 55 million gallons of gasoline was realized from the reduction in speed and volumes on all rural Indiana primary highways in the first half of 1974 over the first half of 1973. Approximately 40 percent of the savings resulted from reduced travel.
B IB LIO G R A P H Y1. American Association of State Highway and Transportation Offi
cials, Effects of the 55 M P H Speed Limit, November 1974.2. Baerwald, John E., ed., Traffic Engineering Handbook, 3rd Edi
tion, 1965.3. Berry, Donald S., “ Speed Control,” Proceedings of AASH O ,
September 19-24, 1948.4. Bureau of Public Roads, “Accidents on Main Rural Highways
as Related to Speed, Driver, and Vehicle,” 1964.5. Claffey, Paul, “ Running Costs of Motor Vehicles as Affected by
Road Design and Traffic,” N C H R P Report I I I , 1971.6. Coleman, Robert T ., “ Effect of Speed Limit Signs,” Traffic
Engineering, January 1957.7. Elmberg, Curt M., and Harold L. Michael, “ Effect of Speed
Limit Signs on Suburban Arterial Streets,” HRB Bulletin 303, 1961.
8. Huber, Albert, ed., Traffic Light, Indiana Traffic Safety Council, Inc., Indianapolis, Indiana, 1974.

1849. Kihlberg, Joako, and K. J. Tharp, “ Accident Rates as Related to
Design Elements of Rural Highways,” N C H R P Report 47, 1968.10. Lawshe, C. H., Jr., “ Studies in Automobile Speeds on the High
way,” Journal of Applied Psychology, 1940.11. May, J. F., “ A Determination of an Accident Prone Location,”
Traffic Engineering, February 1964.12. Meyer, R. L., “ Hourly and Daily Deviation in Vehicle Speeds
on a Rural Highway,” Traffic Engineering, July 1951.13. Michaels, R. M ., “ Human Factors in Highway Safety,” Traffic
Quarterly, October 1961.14. Ogawa, T ., E. S. Fisher, and J. C. Oppenlander, “ Driver Be
havior Study— Influence of Speed on Spot Speed Characteristics in a Series of Contiguous Rural and Urban Areas,” H RB Bulletin 341, January 1962.
15. Oppenlander, J. C., “ Sample Size Determination for Spot Speed Studies at Rural Intermediate and Urban Locations,” HBR Record 35, 1963.
16. Oppenlander, J. C., “ Variables Influencing Spot Speed Characteristics,” H RB Special Report 89, 1966.
17. Rowan, Neilon E., and Charles J. Keese, “ A Study of Factors Influencing Speeds,” HRB Bulletin 341, 1962.
18. Wilson, J. E., and D. C. Chenu, “ Effects of Color and Location of Observation Car When Conducting Speed Checks,” Traffic Engineering, January 1960.