Evaluation of Station Post Porcelain Insulators with Room ... · Evaluation of Station Post...
29
Evaluation of Station Post Porcelain Insulators with Room Temperature Vulcanized (RTV) Silicone Rubber Coatings FInal Project Report Power Systems Engineering Research Center Empowering Minds to Engineer the Future Electric Energy System
Transcript of Evaluation of Station Post Porcelain Insulators with Room ... · Evaluation of Station Post...
Evaluation of Station Post PorcelainInsulators with Room Temperature
Vulcanized (RTV) SiliconeRubber Coatings
FInal Project Report
Power Systems Engineering Research Center
Empowering Minds to Engineerthe Future Electric Energy System
Evaluation of Station Post Porcelain Insulators with Room Temperature Vulcanized (RTV) Silicone Rubber
Coating
Final Project Report
Ravi Gorur, Project Leader Arizona State University
PSERC Publication 12-19
July 2012

For information about this project, contact: Ravi Gorur Department of Electrical Engineering Arizona State University P.O. Box 875706 Tempe, AZ 85287-5706 Tel: 480-965-4894 Fax: 480-965-0745 Email: [email protected] Power Systems Engineering Research Center The Power Systems Engineering Research Center (PSERC) is a multi-university Center conducting research on challenges facing the electric power industry and educating the next generation of power engineers. More information about PSERC can be found at the Center’s website: http://www.pserc.org. For additional information, contact: Power Systems Engineering Research Center Arizona State University 527 Engineering Research Center Tempe, Arizona 85287-5706 Phone: 480-965-1643 Fax: 480-965-0745 Notice Concerning Copyright Material PSERC members are given permission to copy without fee all or part of this publication for internal use if appropriate attribution is given to this document as the source material. This report is available for downloading from the PSERC website.
2012 Arizona State University All rights reserved.
i
Acknowledgments
This is the final report for PSERC project “Evaluation of RTV Coated Station Insulators” (Project T-46G). The project is a targeted research project supported by additional membership funds provided by San Diego Gas & Electric. Thanks are given to William Assurian and William Torre at SDG&E for their assistance in this project. PSERC is a National Science Foundation Industry/University Cooperative Research Center.
ii
Executive Summary
Several methods are presently available to improve performance of station insulators under contaminated conditions, of which the application of hydrophobic coatings (like grease, oils and room temperature vulcanized (RTV) silicone rubber material, fluorinated compounds) are attractive to utilities as it can be applied over existing installations. Of the hydrophobic coatings, RTV silicone rubber has proven to be the most popular type. The chief concerns with this method are the time of effectiveness of the coating, and insulator performance with time in service. This project describes the testing and analysis of porcelain post insulators that were coated with a room temperature vulcanized (RTV) silicone rubber material. The tests were performed in a fog chamber using the clean fog method and the insulators were artificially contaminated with different levels of contamination ranging from light to very heavy (as expressed by equivalent salt deposition density-ESDD).
It was found that the RTV coated insulators were able to withstand levels of contamination that are far higher than experienced in the SDG&E service territory. The adhesion of the coating to the porcelain was excellent even after many tests which involved substantial surface discharge activity.
Statistical analysis was performed to quantify the improvement provided by the RTV coating when it had completely lost its hydrophobicity. It was found to in the range of 15-40%, the higher number for 69 kV system voltage and the lower number for 230 kV system voltage. In practice, this number should be higher than these as the protected surface of the insulator sheds are usually hydrophobic.
iii
Table of Contents
1. Introduction ..................................................................................................................... 1
2. Sample Evaluation .......................................................................................................... 2
3. Contamination Level on Outdoor Insulators .................................................................. 3
4. Hydrophobicity Classification ........................................................................................ 5
5. Sample Preparation ......................................................................................................... 8
5.1 Flashover phenomena on outdoor insulators ..............................................................8
5.2 Artificial contamination procedure ............................................................................8
5.3 Measurement of insulator contamination level ..........................................................8
6. Laboratory Experiments ............................................................................................... 10
6.1 Surface resistance measurement ...............................................................................11
6.2 Flashover test results ................................................................................................13
7. Statistical Modeling ...................................................................................................... 14
7.1 Regression Analysis: FOV versus ESDD, Perm, LD, Rating ..................................14
7.2 Analysis of variance .................................................................................................15
8. Conclusions ................................................................................................................... 18
References ......................................................................................................................... 19
iv
List of Figures
Figure 1: RTV coated insulator...................................................................................................... 2
Figure 2: Porcelain insulator .......................................................................................................... 2
Figure 3: Zed curve approximation to IEC site pollution severity (SPS) guidelines [1] ............... 3
Figure 4: Definition of contact angles [3] ...................................................................................... 5
Figure 5: Typical examples of surfaces with HC from 1 to 6 [3] .................................................. 6
Figure 6: (a) RTV silicone rubber coated porcelain insulator hydrophobicity classification HC-1. (b) Bare porcelain insulator hydrophobicity classification HC-4 .................................. 7
Figure 7: Schematic of testing in fog chamber for surface resistance measurement [6] ............. 10
Figure 8: Experimental set up in the fog chamber for testing the RTV silicone rubber coated insulator. ....................................................................................................................... 11
Figure 9: Normal distribution plot for surface resistance values ................................................. 14
Figure 10: Residual plots for flashover voltage ........................................................................... 16
Figure 11: Plot for flashover performance of RTV silicone rubber and porcelain insulators at different operating voltages ........................................................................................ 17
v
List of Tables
Table 1: ESDD values as per IEC 60815 [2] ................................................................................. 4
Table 2: Criteria for the hydrophobicity classification [3] ............................................................ 6
Table 3: Factor b values at various temperatures [5] ..................................................................... 9
Table 4: Surface Resistance values for Porcelain sample at different ESDD levels ................... 12
Table 5: Surface Resistance for RTV Silicone Rubber coated insulators ................................... 12
Table 6: Surface Resistance values for EPDM samples (values obtained from previous research work at ASU [7]) ........................................................................................................... 12
Table 7: Flashover voltages for RTV silicone rubber coated and porcelain samples .................. 13

vi
Nomenclature
AC Alternating current ASU Arizona State University B Temperature factor CIGRE International Council for Large Electric Systems (in English) Cl Chlorine Cm Centimeter DF Degrees of Freedom EPDM Ethylene propylene diene monomer ESDD Equivalent Salt Deposit Density F Standard “F” Statistic FOV Flashover Voltage HC Hydrophobicity Classification HLD High Leakage Distance IEC International Electrotechnical Commission IEEE Institute of Electrical and Electronics Engineers K Potassium kV Kilovolts kVA Kilovolt Amperes kΩ/cm Kilo-ohms per centimeter LD Leakage Distance L-G Line to ground LMW Low Molecular Weight M Meters Mg Magnesium mg Milligram ml Milliliters MS Mean sum of squares N1,N2,N3 RTV coated Silicone Rubber Insulators designators Na Sodium NaCl Sodium chloride (common salt) Obs Observation number P Probability of testing the significance of null hypothesis Perm Permittivity of the material R-Sq Residual sum of squares R-Sq(adj) Adjusted Residual Sum of Squares RTV Room Temperature Vulcanized S Standard deviation Sa Salinity in μS/cm SDG&E San Diego Gas and Electric SE Coef Standard error coefficient Seq SS Sequential sum of squares SS Sum of squares STRI Swedish Technical Research Institute T Standard “T” Statistic
vii
V Volume in ml θa Advancing contact angle θr Receding contact angle μg Microgram μS micro Siemens Ω Ohm Temperature in degree Celsius Temperature at 20 0C
Temperature at degree Celsius 0C Degree Celsius
1
1. Introduction
The reliability of a power system is reduced whenever the flashover strength across an insulator falls below the breakdown strength of the air in its working environment. Mitigation of outages due to lightning or switching surges is a well discussed topic among the industrial and academic communities. However, contamination caused flashovers are still a major problem. Contamination flashover is a complex problem faced by utilities today which have a wide geographical working span. Different types of pollutants on the insulation equipment are encountered due to various environmental conditions. The outdoor insulation equipments used in substations, overhead transmission and distribution lines must withstand the over-voltages due to switching or lightning transients in addition to their service voltages. The performance of insulation in contaminated conditions is paramount for providing a reliable service to the end user.
The utilities are able to select the insulator type according to the system and design requirements. In order to improve the contamination flashover performance, the utilities need to opt for high leakage porcelain (HLD) units, which can be taller or have wider sheds than standard porcelain units. However, for an optimal design of substation insulation it is desirable to improve the contamination flashover without increasing the height or width of the unit.
Room temperature vulcanized (RTV) Silicone Rubber coated insulators is a practical option for improving the flashover performance in presence of the pollution without compromising on the mechanical aspects of the substation design. The motivation of this study is to compare the performance of bare and RTV Silicone Rubber coated porcelain insulators by performing accelerated aging tests in the laboratory. Overall assessment of several important aspects of the coating such as adhesion to porcelain, hydrophobicity, contamination flashover performance and weathering is provided in the study. A good theoretical model for predicting the flashover will be a desirable asset to the utilities, helping to improve the substation design in the future. The study aims to build a comprehensive model for predicting the flashover performance of the RTV coated insulators.

2
2. Sample Evaluation
Twelve 69 kV post insulators were provided by San Diego Gas and Electric (SDG&E). The insulator units were manufactured by NGK-Locke Inc. Eleven samples were coated with Room Temperature Vulcanized (RTV) Silicone Rubber by a private contractor also provided by SDG&E.
The RTV Silicone Rubber coating was applied in a dust-free spray booth facility available at the Arizona State University Campus. After, the coating, the samples were left to dry for one day before subjecting to laboratory tests.
Artificial contamination tests provide valuable information on the behavior of external insulation by simulating the service environment in lab conditions. The contaminants consist of a suspension prepared by mixing appropriate proportions of kaolin and common salt (NaCl) in de-mineralized water.
Figure 1: RTV coated insulator
Figure 2: Porcelain insulator
3
3. Contamination Level on Outdoor Insulators
In CIGRE Task Force 33.04.01 [1], the typical pollution environments are defined as follows.
Marine environment, where proximity of the sea introduce Na, Cl, Mg, K and other marine salts into the atmosphere.
Industrial environment include sources of soluble pollution from steel mills, refineries or sources of inert dust such as quarries and cement factories
Agricultural environment includes pollutants from highly soluble fertilizers as well as insoluble dust and chaff
Desert environment introduces pollutants like inert sand as well as salt in some areas.
The electrically conductive deposit on the surface of the insulators is expressed as an equivalent salt deposit density (ESDD) in units of mg or μg of sodium chloride (NaCl) per cm2 of surface area.
According to IEC Standard 60815, 1986 values of 10 μg/cm2 are considered light, while values above 400 μg/cm2 are very heavy.
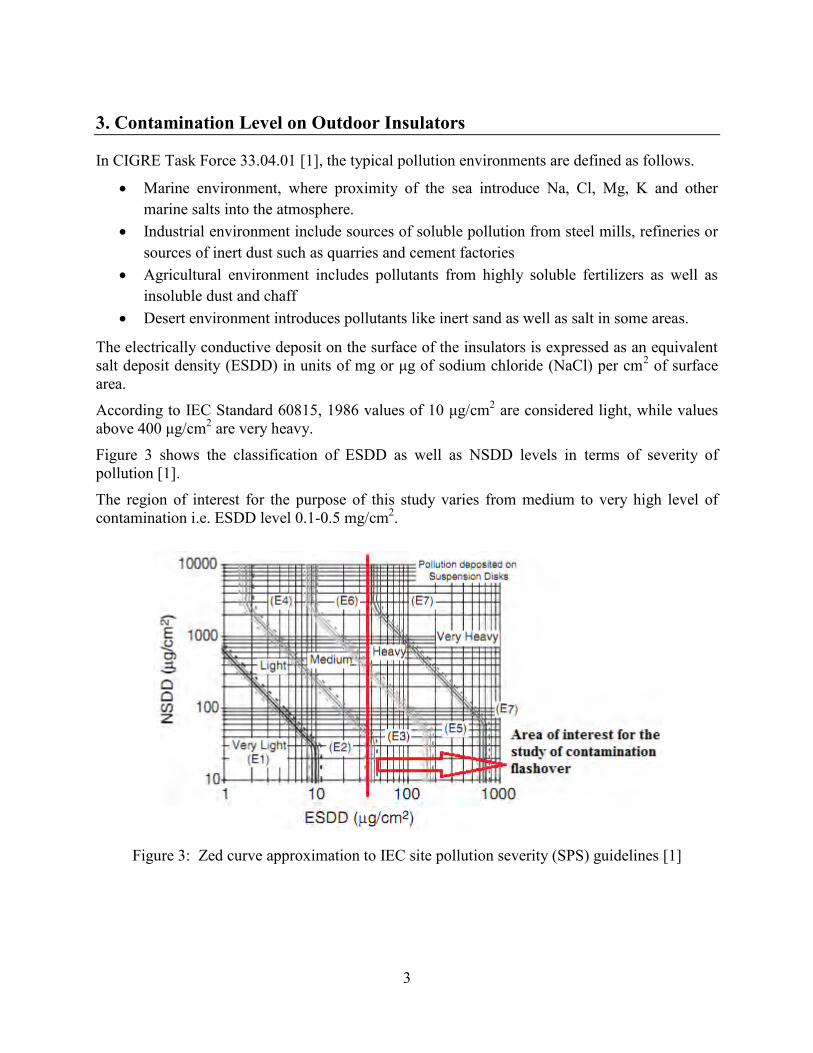
Figure 3 shows the classification of ESDD as well as NSDD levels in terms of severity of pollution [1].
The region of interest for the purpose of this study varies from medium to very high level of contamination i.e. ESDD level 0.1-0.5 mg/cm2.
Figure 3: Zed curve approximation to IEC site pollution severity (SPS) guidelines [1]
4
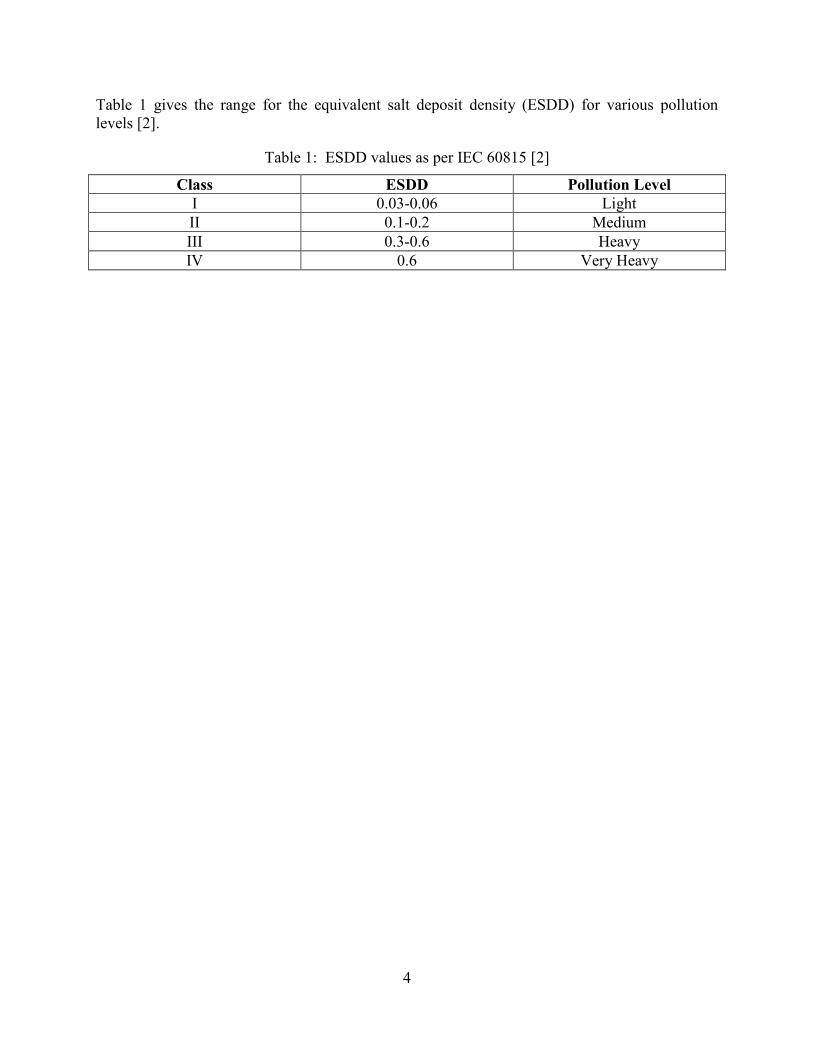
Table 1 gives the range for the equivalent salt deposit density (ESDD) for various pollution levels [2].
Table 1: ESDD values as per IEC 60815 [2]
Class ESDD Pollution Level I 0.03-0.06 Light II 0.1-0.2 Medium III 0.3-0.6 Heavy IV 0.6 Very Heavy
5
4. Hydrophobicity Classification
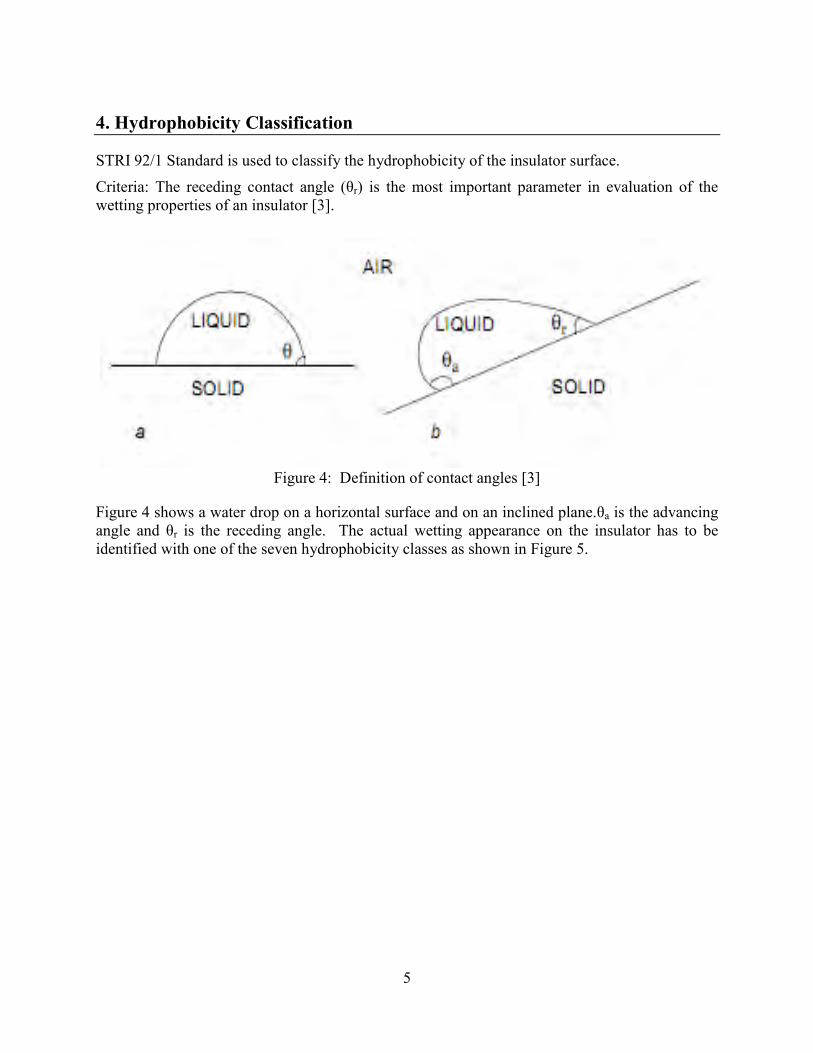
STRI 92/1 Standard is used to classify the hydrophobicity of the insulator surface.
Criteria: The receding contact angle (θr) is the most important parameter in evaluation of the wetting properties of an insulator [3].
Figure 4: Definition of contact angles [3]
Figure 4 shows a water drop on a horizontal surface and on an inclined plane.θa is the advancing angle and θr is the receding angle. The actual wetting appearance on the insulator has to be identified with one of the seven hydrophobicity classes as shown in Figure 5.
6
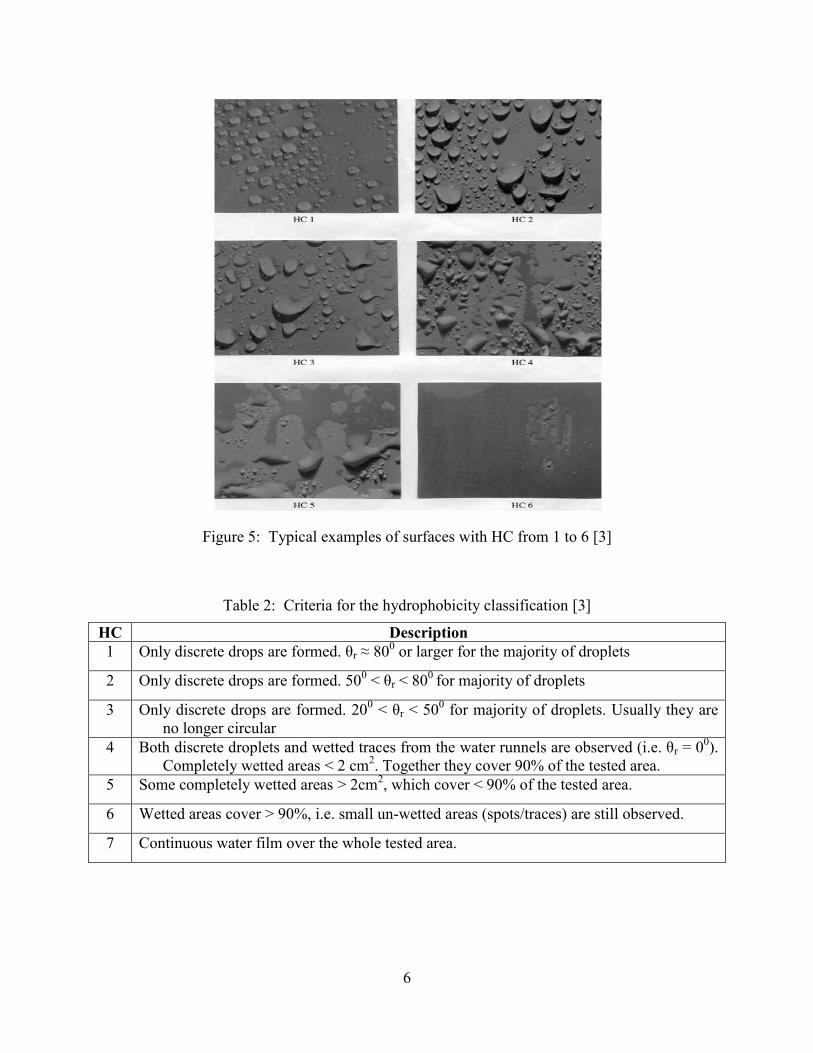
Figure 5: Typical examples of surfaces with HC from 1 to 6 [3]
Table 2: Criteria for the hydrophobicity classification [3]
HC Description 1 Only discrete drops are formed. θr ≈ 800 or larger for the majority of droplets
2 Only discrete drops are formed. 500 < θr < 800 for majority of droplets
3 Only discrete drops are formed. 200 < θr < 500 for majority of droplets. Usually they are no longer circular
4 Both discrete droplets and wetted traces from the water runnels are observed (i.e. θr = 00). Completely wetted areas < 2 cm2. Together they cover 90% of the tested area.
5 Some completely wetted areas > 2cm2, which cover < 90% of the tested area.
6 Wetted areas cover > 90%, i.e. small un-wetted areas (spots/traces) are still observed.
7 Continuous water film over the whole tested area.
7
(a) (b)
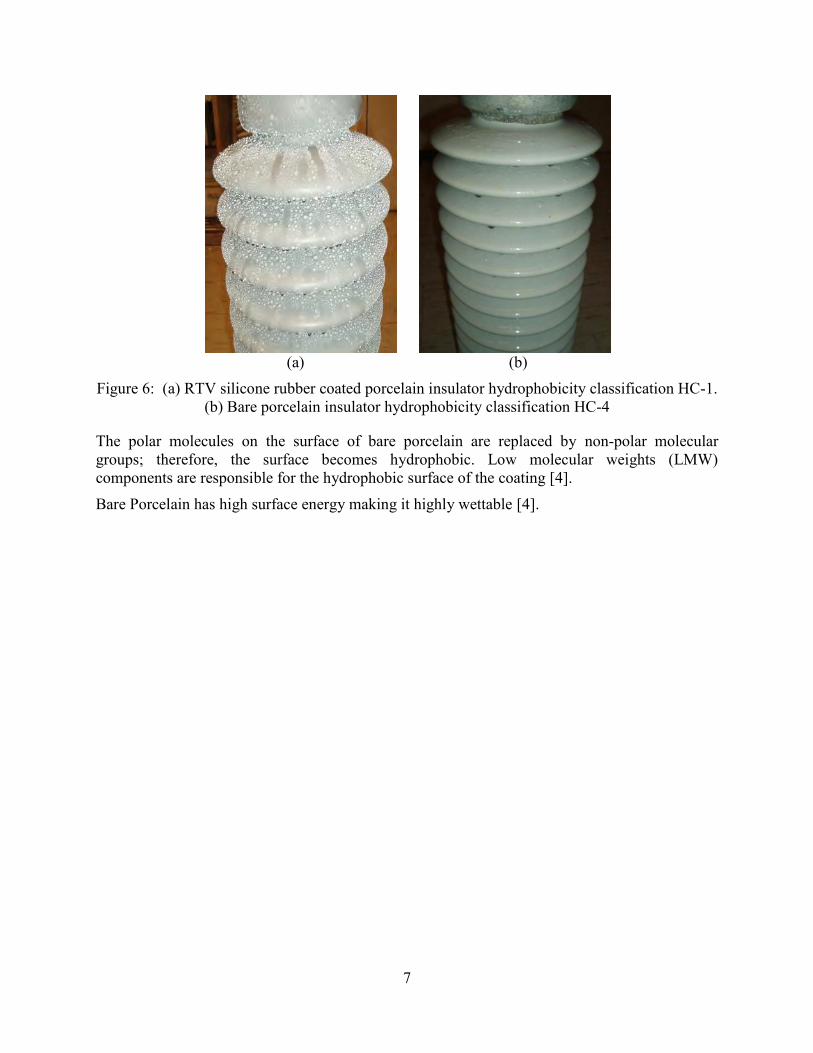
Figure 6: (a) RTV silicone rubber coated porcelain insulator hydrophobicity classification HC-1. (b) Bare porcelain insulator hydrophobicity classification HC-4
The polar molecules on the surface of bare porcelain are replaced by non-polar molecular groups; therefore, the surface becomes hydrophobic. Low molecular weights (LMW) components are responsible for the hydrophobic surface of the coating [4].
Bare Porcelain has high surface energy making it highly wettable [4].

8
5. Sample Preparation
5.1 Flashover phenomena on outdoor insulators
Flashover for an insulator is defined as a disruptive discharge over the surface of a solid insulation in a gas or liquid [5]. Outdoor insulators are subjected to various conditions in their working environment. During the service, contaminants accumulate on the insulator surface. Contamination on the surface increases the risk of a flashover under wet conditions such as light rain, fog or dew. When the surface of the insulator is wet, the contaminants dissolve to form a conducting film. As a result, leakage current flows on the surface which leads to the formation of dry band regions.
The sequence of events for contamination flashover:
Deposition of conducting salts and moisture Dry band formation Electrical breakdown of dry-bands Propagation of the discharge across the film, bridging the insulator
5.2 Artificial contamination procedure
The pollution layer in the laboratory is achieved by artificially contaminating the insulators prepared by mixing kaolin and common salt in water. Fixed proportions of salt and kaolin are used to achieve contamination at various ESDD levels. The test object is carefully cleaned, so that all traces of dirt is removed. The contamination slurry is then applied to the insulator surface using a brush. Drying period for the insulator was about 10 hours before putting it to test under high voltage.
5.3 Measurement of insulator contamination level
Equivalent Salt Deposit Density (ESDD) is the standard measure for the contamination level on the insulator surface. It is expressed in mg/cm2. The technique used to measure ESDD level in the laboratory is known as the rag-wipe method. A clean cloth/ cotton is rinsed in a fixed volume of deionized water. A fixed area on the shed is wiped using the cloth/cotton. The cloth is then rinsed in the deionized water. Conductivity ( ) of the rinsed solution is then measured using a Horiba conductivity meter at temperature ϴ (0 C). Then the value σ20 is obtained from σϴ by the following relationship:
( ) 1
is the layer conductivity at a temperature of 200 C in S/m
is the layer conductivity at a temperature of ϴ (0 C) in S/m b is a factor depending on the temperature as given in Table 3 show below [5].
9
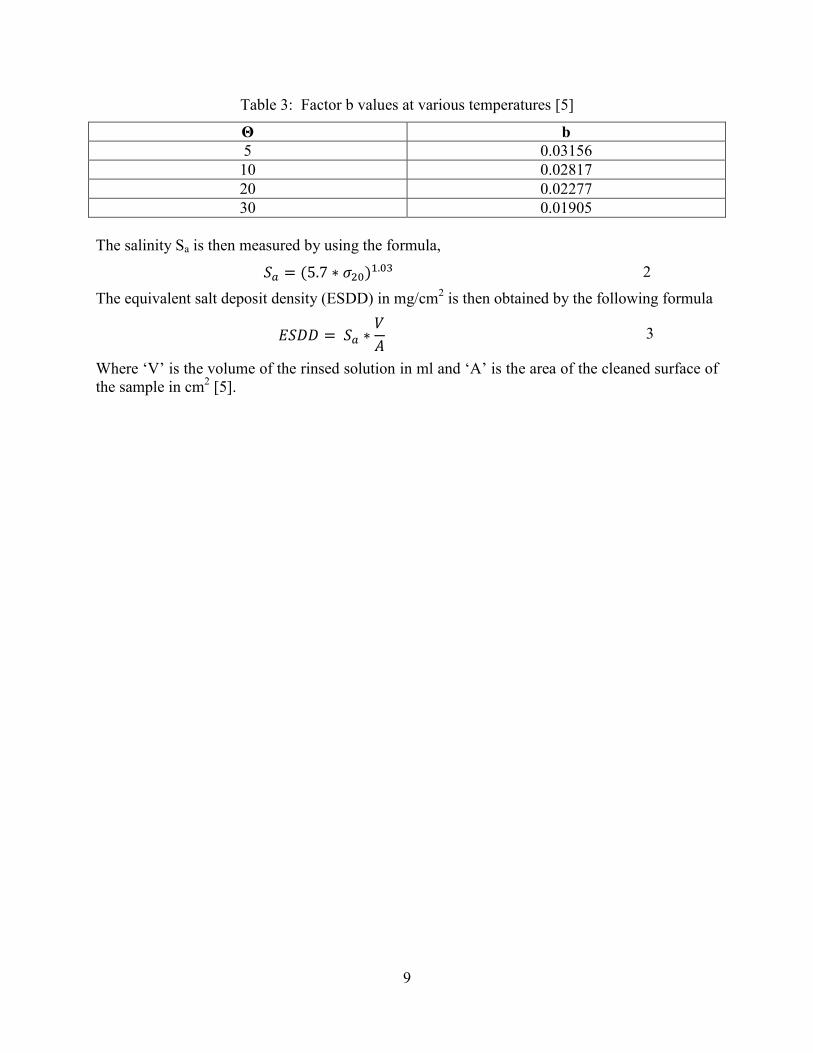
Table 3: Factor b values at various temperatures [5]
Θ b 5 0.03156 10 0.02817 20 0.02277 30 0.01905
The salinity Sa is then measured by using the formula,
( ) 2
The equivalent salt deposit density (ESDD) in mg/cm2 is then obtained by the following formula
3
Where ‘V’ is the volume of the rinsed solution in ml and ‘A’ is the area of the cleaned surface of the sample in cm2 [5].
10
6. Laboratory Experiments
The samples were subjected to high voltages in a fog chamber available in the Arizona State University High Voltage Laboratory. Two types of experiments were carried out on each samples viz. 1. Surface Resistance Measurement Test and 2. Flashover Test.
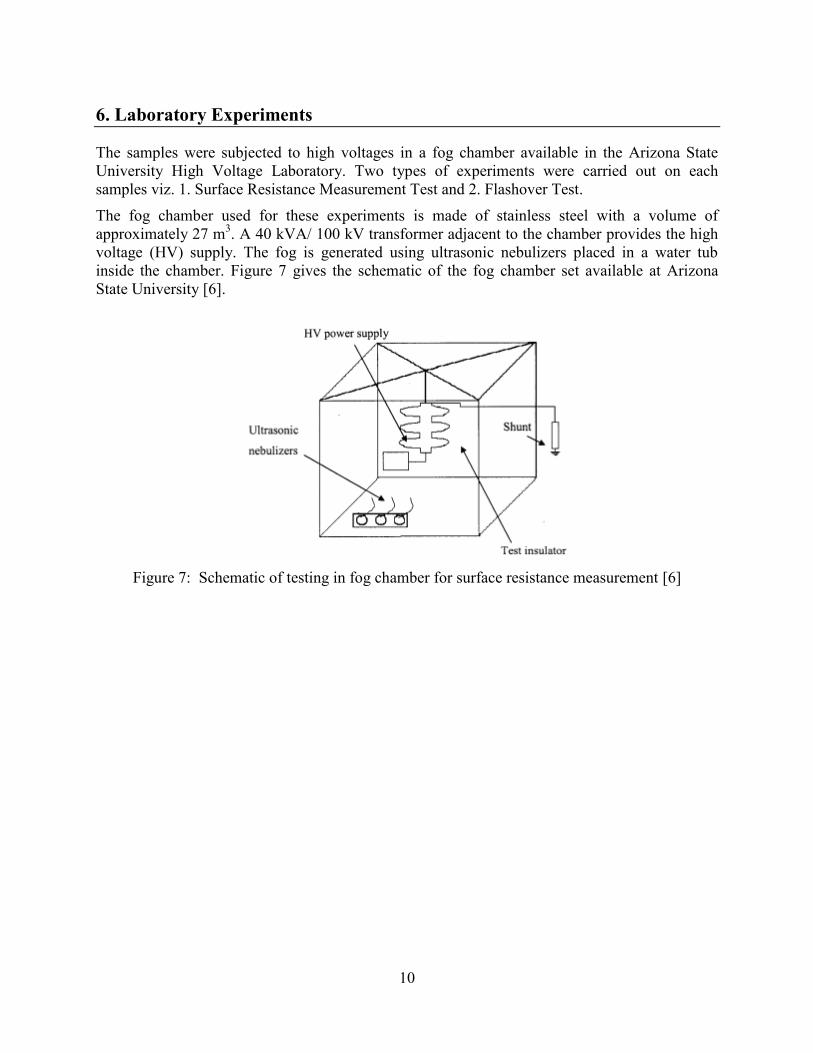
The fog chamber used for these experiments is made of stainless steel with a volume of approximately 27 m3. A 40 kVA/ 100 kV transformer adjacent to the chamber provides the high voltage (HV) supply. The fog is generated using ultrasonic nebulizers placed in a water tub inside the chamber. Figure 7 gives the schematic of the fog chamber set available at Arizona State University [6].
Figure 7: Schematic of testing in fog chamber for surface resistance measurement [6]
11
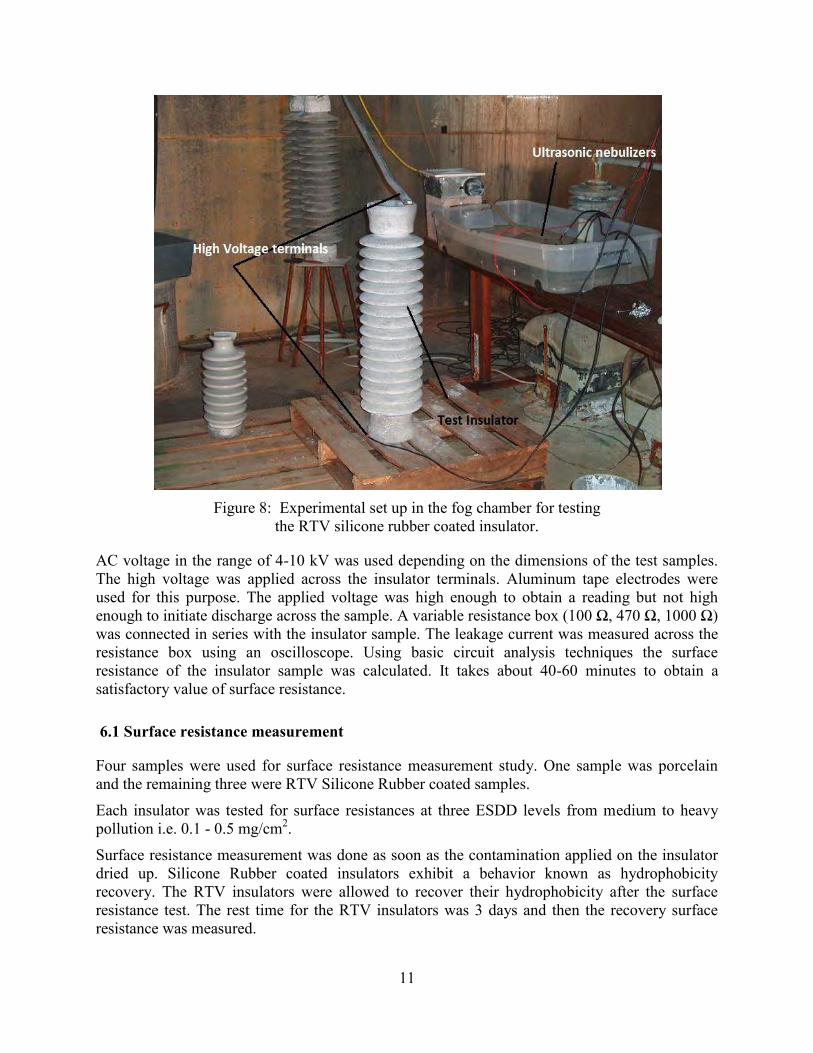
Figure 8: Experimental set up in the fog chamber for testing
the RTV silicone rubber coated insulator.
AC voltage in the range of 4-10 kV was used depending on the dimensions of the test samples. The high voltage was applied across the insulator terminals. Aluminum tape electrodes were used for this purpose. The applied voltage was high enough to obtain a reading but not high enough to initiate discharge across the sample. A variable resistance box (100 Ω, 470 Ω, 1000 Ω) was connected in series with the insulator sample. The leakage current was measured across the resistance box using an oscilloscope. Using basic circuit analysis techniques the surface resistance of the insulator sample was calculated. It takes about 40-60 minutes to obtain a satisfactory value of surface resistance.
6.1 Surface resistance measurement
Four samples were used for surface resistance measurement study. One sample was porcelain and the remaining three were RTV Silicone Rubber coated samples.
Each insulator was tested for surface resistances at three ESDD levels from medium to heavy pollution i.e. 0.1 - 0.5 mg/cm2.
Surface resistance measurement was done as soon as the contamination applied on the insulator dried up. Silicone Rubber coated insulators exhibit a behavior known as hydrophobicity recovery. The RTV insulators were allowed to recover their hydrophobicity after the surface resistance test. The rest time for the RTV insulators was 3 days and then the recovery surface resistance was measured.
12
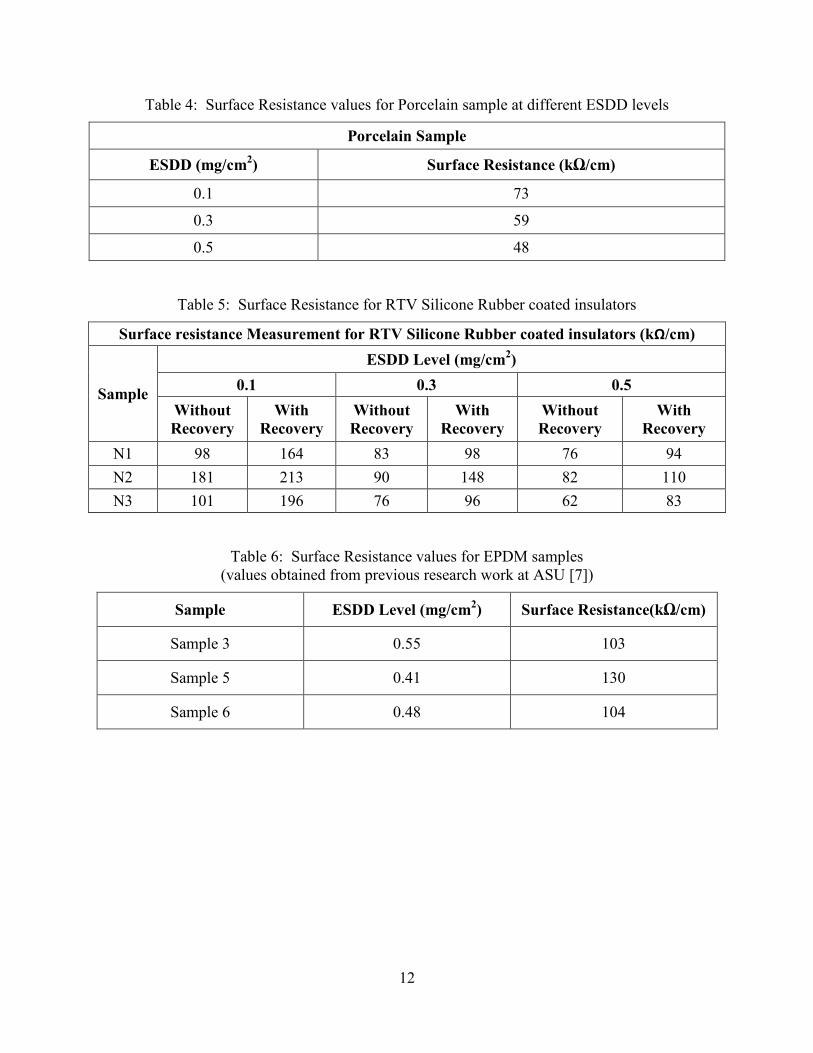
Table 4: Surface Resistance values for Porcelain sample at different ESDD levels
Porcelain Sample
ESDD (mg/cm2) Surface Resistance (kΩ/cm)
0.1 73
0.3 59
0.5 48
Table 5: Surface Resistance for RTV Silicone Rubber coated insulators
Surface resistance Measurement for RTV Silicone Rubber coated insulators (kΩ/cm)
Sample
ESDD Level (mg/cm2) 0.1 0.3 0.5
Without Recovery
With Recovery
Without Recovery
With Recovery
Without Recovery
With Recovery
N1 98 164 83 98 76 94 N2 181 213 90 148 82 110 N3 101 196 76 96 62 83
Table 6: Surface Resistance values for EPDM samples (values obtained from previous research work at ASU [7])
Sample ESDD Level (mg/cm2) Surface Resistance(kΩ/cm)
Sample 3 0.55 103
Sample 5 0.41 130
Sample 6 0.48 104

13
6.2 Flashover test results
Flashover experiments were carried out for each of the samples at various ESDD Levels. The results are as shown in Table 7. Note that the flashover experiments were carried out immediately as the samples dried up after contamination process.
Table 7: Flashover voltages for RTV silicone rubber coated and porcelain samples
Flashover Voltage Measurements
Sample ESDD (mg/cm2) Flashover voltage (kV)
Porcelain
0.1 48
0.3 40
0.5 30
N1
0.1 > 66
0.3 60
0.5 50
N2
0.1 >66
0.3 60
0.5 58
N3
0.1 > 66
0.3 66
0.5 46
14
7. Statistical Modeling
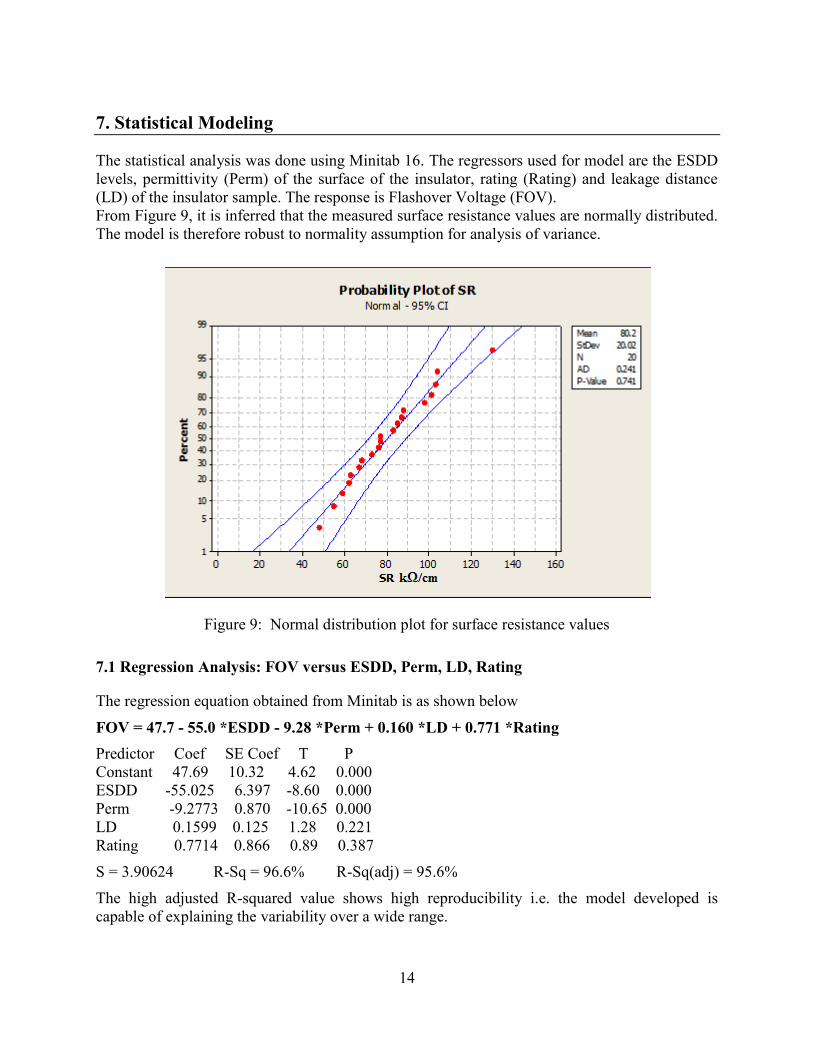
The statistical analysis was done using Minitab 16. The regressors used for model are the ESDD levels, permittivity (Perm) of the surface of the insulator, rating (Rating) and leakage distance (LD) of the insulator sample. The response is Flashover Voltage (FOV). From Figure 9, it is inferred that the measured surface resistance values are normally distributed. The model is therefore robust to normality assumption for analysis of variance.
Figure 9: Normal distribution plot for surface resistance values
7.1 Regression Analysis: FOV versus ESDD, Perm, LD, Rating
The regression equation obtained from Minitab is as shown below
FOV = 47.7 - 55.0 *ESDD - 9.28 *Perm + 0.160 *LD + 0.771 *Rating Predictor Coef SE Coef T P Constant 47.69 10.32 4.62 0.000 ESDD -55.025 6.397 -8.60 0.000 Perm -9.2773 0.870 -10.65 0.000 LD 0.1599 0.125 1.28 0.221 Rating 0.7714 0.866 0.89 0.387
S = 3.90624 R-Sq = 96.6% R-Sq(adj) = 95.6%
The high adjusted R-squared value shows high reproducibility i.e. the model developed is capable of explaining the variability over a wide range.
15
The high P values for LD and Rating indicate that leakage distance (LD) and rating of the insulator are not major contributors in the model. This limitation can be eliminated by including more data points in the regression model.
7.2 Analysis of variance
Source DF SS MS F P Regression 4 6409.3 1602.3 105.01 0.000 Residual Error 15 228.9 15.3 Total 19 6638.2
Source DF Seq SS ESDD 1 2954.6 Perm 1 313.6 LD 1 3129.1 Rating 1 12.1
Unusual Observations Obs ESDD FOV Fit SE Fit Residual St Resid 5 0.100 80.000 72.589 1.787 7.411 2.13R 14 0.500 58.000 50.579 1.627 7.421 2.09R 20 0.500 25.000 25.000 3.906 -0.000 * X
R denotes an observation with a large standardized residual.
X denotes an observation whose X value gives it large leverage
SE Coef – Standard error coefficient T - Standard “T” Statistic P - Probability of testing the significance of null hypothesis F- Standard “F” Statistic S - Standard deviation R-Sq – Residual sum of squares R-Sq(adj) – Adjusted Residual Sum of Squares DF – Degrees of Freedom SS – Sum of Squares MS - Mean sum of squares.
16
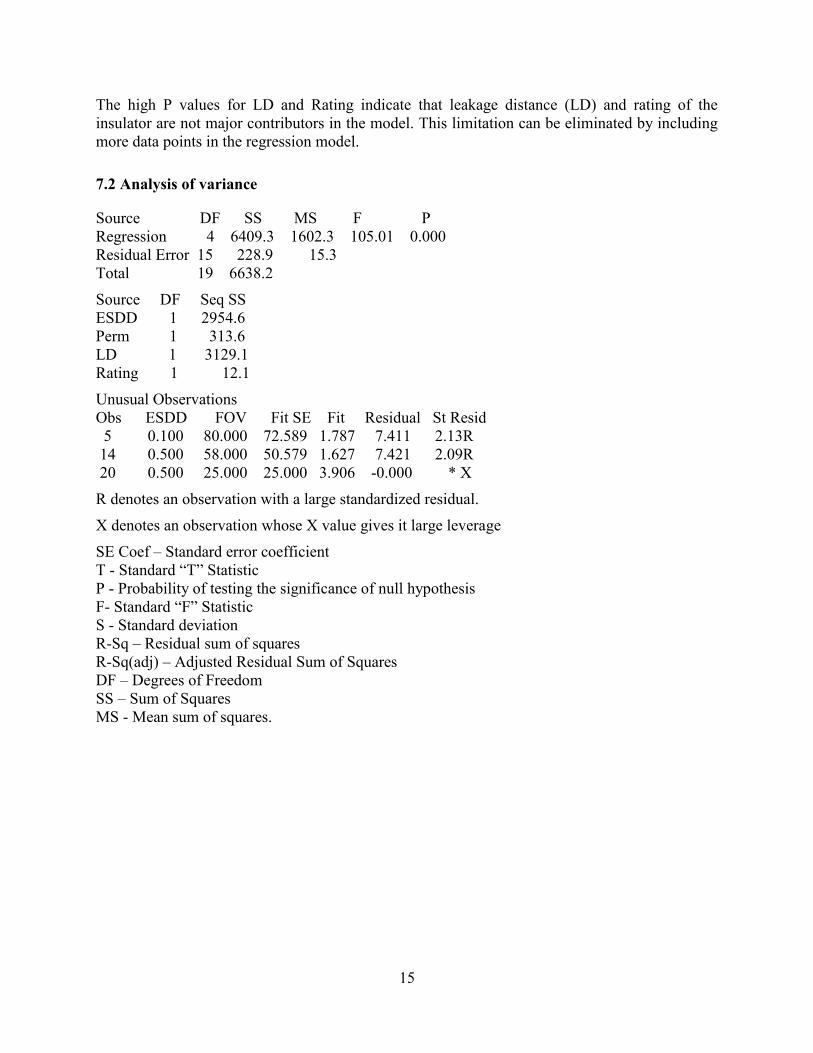
Figure 10: Residual plots for flashover voltage
The developed regression model is valid only when certain assumptions are true.
The assumptions that were checked are listed below.
The errors are normally distributed. From Figure 10, the normal probability plot, it is seen that there are no outliers and the residuals lie approximately in a straight line. There is no considerable deviation from normality.
The errors have zero mean and constant variance. The plot residual v/s fitted values from Figure 10 it is infers that there is no pattern or shape indicated. Therefore the constant variance assumption for errors stands true.
The errors are uncorrelated. The plot residual v/s observations order from Figure 10 shows no discernible trend which implies that the errors were uncorrelated.
All the assumptions were checked and found satisfied, therefore, the model developed is valid [8].
1050-5-10
99
90
50
10
1
Residual
Pe
rce
nt
80604020
5
0
-5
Fitted Value
Re
sid
ua
l
86420-2-4
6.0
4.5
3.0
1.5
0.0
Residual
Fre
qu
en
cy
2018161412108642
5
0
-5
Observation Order
Re
sid
ua
l
Normal Probability Plot Versus Fits
Histogram Versus Order
Residual Plots for FOV
17
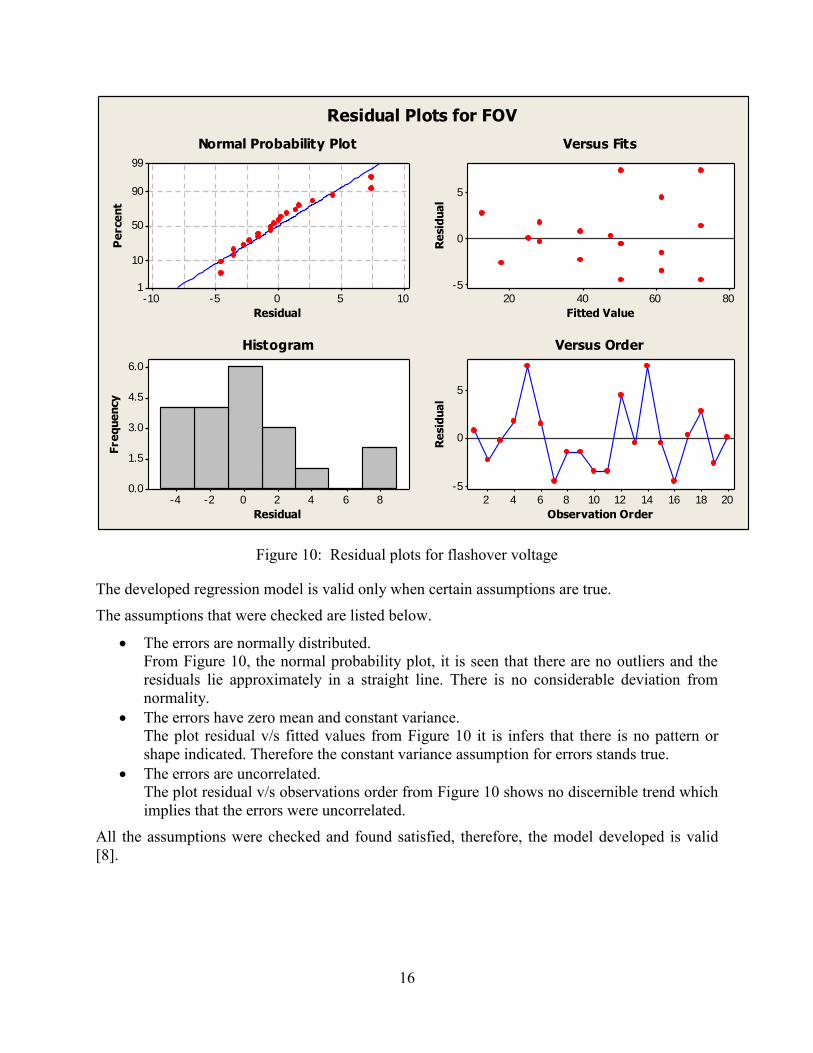
The regression model was used to obtain plots for RTV Silicone Rubber Coated and bare porcelain insulators.
Figure 11 shows flashover performance for the insulators at different service voltages.
Figure 11: Plot for flashover performance of RTV silicone rubber and porcelain insulators at different operating voltages

18
8. Conclusions
1. The adhesion of the RTV coatings to the porcelain was excellent. This was even after many tests where there was significant discharge activity during the tests. The coating was sprayed on to the insulators by a trained employee of the coating supplier.
2. RTV coated insulators withstood much higher levels of contamination when compared with porcelain. This was the case when the coating had completely lost its hydrophobicity. The hydrophobicity loss was created by spraying isopropyl alcohol on the coated insulators.
3. RTV coated porcelain posts can for a reduced height give same or better performance than taller posts or posts with extended leakage distance.
19
References
[1] Farzaneh, M.; W. Chisholm, Insulators for Icing and Polluted Environments, First Edition, 2009.
[2] IEC 815 Selection and Dimensioning of High Voltage Insulators for Polluted Conditions, Std., 1986.
[3] STRI Guide 92/1, Hydrophobicity Classification Guide, Swedish Technical Research Institute, 1992.
[4] RTV Catalog, The Very Best RTV Silicone Coating, Seves Group. Available at : http://www.sevespower.com/substations/rtv_coating_service.html
[5] IEEE Standard Techniques for High-Voltage Testing, IEEE Std-4, 1995. [6] Power Systems Engineering Research Center, Prediction of Flashover Voltage of Insulators
Using Low Voltage Surface Resistance Measurement, November 2006. [7] Iyer, G.; Evaluation of Electrical Performance of Medium Voltage Epoxy Insulated
Equipment, Master of Science Thesis, Arizona State University, August 2009. [8] Venkataraman, S.; Prediction of Flashover Voltage for Outdoor Insulators, Ph. D
Dissertation, Department of Electrical Engineering, Arizona State University, December 2007.