Evaluation of Soil Water Assessment Tool for the …Soil Water Assessment Tool conference, 2017,...
19
Evaluation of Soil Water Assessment Tool for the simulation of preferential contaminant transport in the cultivated lands near Zarqa river Michel Rahbeh, Raghavan Srinivasan and Rabi Mohtar Dr. Michel Rahbeh Department of Land, Water and Environment University of Jordan Soil Water Assessment Tool conference, 2017, Warsaw, Poland
Transcript of Evaluation of Soil Water Assessment Tool for the …Soil Water Assessment Tool conference, 2017,...

Evaluation of Soil Water Assessment Tool for the simulation of preferential contaminant transport in the cultivated lands near
Zarqa river
Michel Rahbeh, Raghavan Srinivasan and Rabi Mohtar
Dr. Michel RahbehDepartment of Land, Water and Environment
University of Jordan
Soil Water Assessment Tool conference, 2017, Warsaw, Poland

• Zarqa river basin is one of most important surface water basins
• Home of major cities in Jordan (Amman, Zarqa)
• Drains an approximate area of 3900 km2 .
• Drains in King Talal Dam • Runoff Dilutes wastewater from
Khirbat Es-Samra treatment station.
Zarqa River Basin
Soil Water Assessment Tool conference, 2017, Warsaw, Poland

Soil Water Assessment Tool conference, 2017, Warsaw, Poland

Soil Water Assessment Tool conference, 2017, Warsaw, Poland

Soil Water Assessment Tool conference, 2017, Warsaw, Poland

Preferential flow and transport investigation• In-situ measurements using tension infiltrometer• three tensions of -6, -3 and 0 cm• Locations recorded using Etrex 30 GPS device
• 𝑄𝑄 ℎ𝑖𝑖 = 𝜋𝜋𝑟𝑟2𝐾𝐾𝑠𝑠exp(𝑎𝑎ℎ𝑖𝑖) 1 + 4𝜋𝜋𝜋𝜋∝
• 𝑎𝑎 is inverse macroporostiy capillary length( λC)• λC > 80 mm indicates preferential flow
Soil Water Assessment Tool conference, 2017, Warsaw, Poland

Soil Water Assessment Tool conference, 2017, Warsaw, Poland

Soil Water Assessment Tool conference, 2017, Warsaw, Poland
Landuse Area (hectare)
Area%
Bare soil 2519 44.7Sparse vegetation 1067 18.9
Rainfed barley 1341 23.8Irrigated vegetables 707 12.6
Average Precipitation (mm) 170.4Potential evapotranspiration (mm) 1537.0Watershed area (Km2) 56.3

Annual Precipitation (1990 – 2005)
Soil Water Assessment Tool conference, 2017, Warsaw, Poland
050
100150200250300
1990
1991
1992
1993
1994
1995
1996
1997
1998
1999
2000
2001
2002
2003
2004
2005
Rai
nfal
l (m
m)
Year

Management operations
Soil Water Assessment Tool conference, 2017, Warsaw, Poland
Timing Operation Crop Criteria Type30/1 Auto fertilization initialization Plant stress > 0.95 Composite
30/1 Fertilizer application Composite
30/1 Auto irrigation initialization 20 mm of field capacity
5/2 Plant/begin. growing season AGRC15/5 Harvest and kill operation1/6 Plant/begin. growing season CAUF1/6 Fertilizer application composite23/9 Harvest and kill operation27/9 Plant/begin. growing season AGRC20/12 Kill/end of growing season

SWAT – Average annual outputParameter Slope
0 – 5 5 -10 10 -15 > 15
Irrigation (mm) 867.5 861.2 870.0 900.0
Actual evapotranspiration (mm) 983.9 983.0 984.0 988.9
Percolation (mm) 47.2 44.3 40.9 37.1
Lateral discharge (mm) 5.9 3.4 14.9 43.8
Runoff generation (mm) 1.6 1.3 1.2 1.3
Soil Water Assessment Tool conference, 2017, Warsaw, Poland

SWAT 2015 output
Soil Water Assessment Tool conference, 2017, Warsaw, Poland
Parameter Slope
0 – 5 5 -10 10 -15 > 15
Irrigation (mm) 880 880 880 920
Actual evapotranspiration (mm) 1012.4 1009.8 1001.6 1017.9
Percolation (mm) 109.5 114.3 97.3 94.8
Lateral discharge (mm) 7.5 4.0 17.1 51.0
Runoff generation (mm) 5.6 6.6 5.9 7.0
Rainfall (mm) 256.9 256.9 256.9 256.9
Potential evapotranspiration (mm) 1563.2 1563.2 1563.2 1563.2
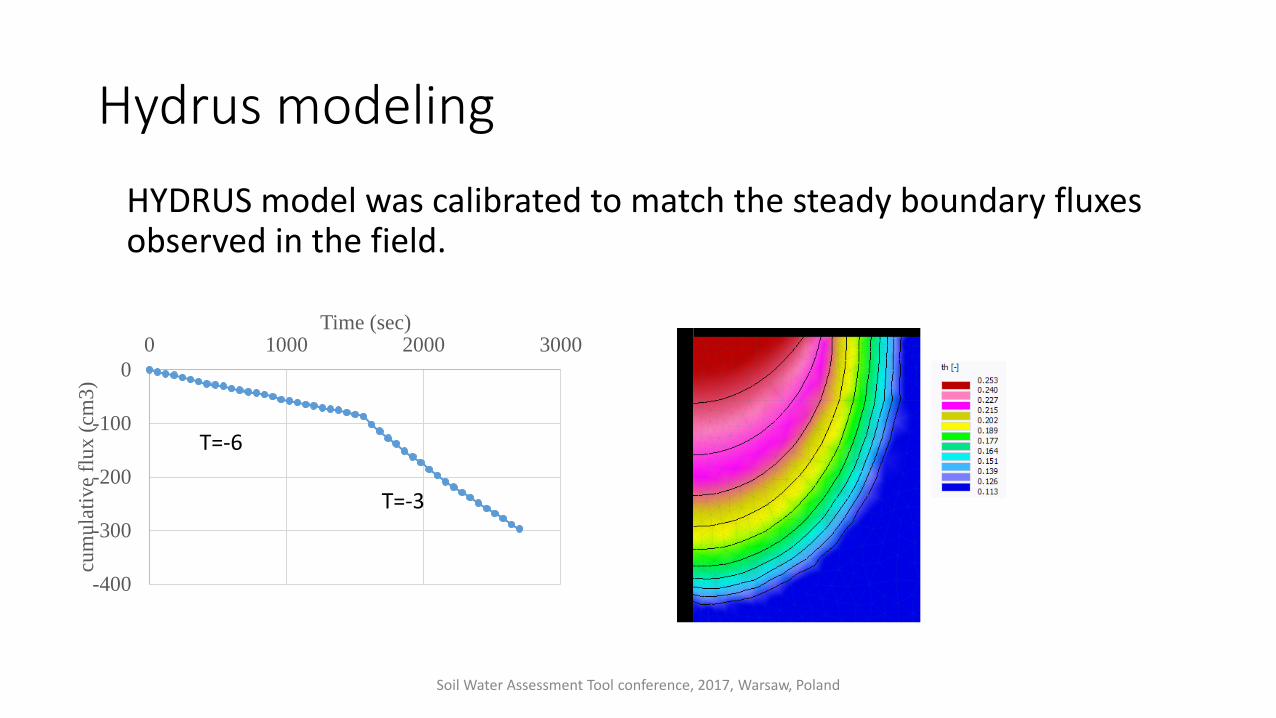
Hydrus modelingHYDRUS model was calibrated to match the steady boundary fluxes observed in the field.
Soil Water Assessment Tool conference, 2017, Warsaw, Poland
-400
-300
-200
-100
00 1000 2000 3000
cum
ulat
ive
flux
(cm
3)
Time (sec)
T=-6
T=-3

HYDRUS input
• Dual porosity model /Van Genuchten parameters
Soil Water Assessment Tool conference, 2017, Warsaw, Poland
Depth (mm)
Qr Qs n α(1/m)
Ks(m/day)
w α2 n2
470 0.0513 0.38 0.030 1.500 0.500 0.09 0.9 1.2
1420 0.0764 0.44 0.590 1.583 0.128

Soil Water Assessment Tool conference, 2017, Warsaw, Poland
70160 m2

Soil Water Assessment Tool conference, 2017, Warsaw, Poland
• Atmospheric conditions• Potential transpiration• Potential evaporation• Irrigation
Seepage face boundary condition
Free drainage boundary conditions

HYDRUS –SWAT comparison -Percolation
Soil Water Assessment Tool conference, 2017, Warsaw, Poland
0
50
100
150
0 70 140 210 280 350
perc
olat
ion
mm
Day
SWAT - PERC HYDRUS DUAL
SWAT-LATQ HYDRUS

HYDRUS –SWAT comparison -AET
Soil Water Assessment Tool conference, 2017, Warsaw, Poland
0
400
800
1200
0 70 140 210 280 350
ET m
m
Day
HYDRUS SWAT

AcknowledgementThis research was made possible by grand from USAID/Partnership for Enhanced Engagement in Research (PEER) program (Grant No. 2000006244)
Soil Water Assessment Tool conference, 2017, Warsaw, Poland