Evaluation of smart energy management measures for District …€¦ · energy grids –Electricity...
18
2 nd International Conference on Smart Energy Systems and 4th Generation District Heating Aalborg, 27-28 September 2016 Evaluation of smart energy management measures for District Heating Networks Network modelling methodology C. Marguerite, R-R. Schmidt, G. Andresen, R. Pedersen
Transcript of Evaluation of smart energy management measures for District …€¦ · energy grids –Electricity...

2nd International Conference on Smart Energy Systems and 4th Generation District Heating
Aalborg, 27-28 September 2016
Evaluation of smart energy management measures for District Heating Networks
Network modelling methodology
C. Marguerite, R-R. Schmidt, G. Andresen, R. Pedersen

Presentation Outline
2nd International Conference on Smart Energy Systems and
4th Generation District Heating, Aalborg, 27-28 September 2016
- The READY project
- Demonstration case: Aarhus
Objectives & Challenges
Modelling Methodology
Retrofitting scenarios Methodology
- Next steps
2

The READY project
2nd International Conference on Smart Energy Systems and
4th Generation District Heating, Aalborg, 27-28 September 2016
Objectives:
• Demonstrate new solutions for CO2 neutral districts:
– Retrofitting
– New solutions for LTDH
– Storage solutions for flexible combined energy grids
– Electricity and water efficiency
Resource Efficient cities implementing ADvanced smart citY solutions
FP7-ENERGY-SMARTCITIES-2012
3

The READY project
2nd International Conference on Smart Energy Systems and
4th Generation District Heating, Aalborg, 27-28 September 2016
Savings on energy demand: 51-62% DHC grid efficiency: +2-5% 100% CO2 neutral DH supply by 2018
Savings on energy demand: 38-53% DHC grid efficiency: +12% 100% CO2 neutral DH supply by 2016
4

2nd International Conference on Smart Energy Systems and
4th Generation District Heating, Aalborg, 27-28 September 2016
Temperatures: -Transmission grid: 120-50°C - Distribution grid: 70-40°C
CHP Boilers (oil, electric and biomass) Waste incineration Industrial waste heat
Total Energy demand 4,5GWh/y
http://transmissionsnet.varmeplanaarhusapps.dk/ 5
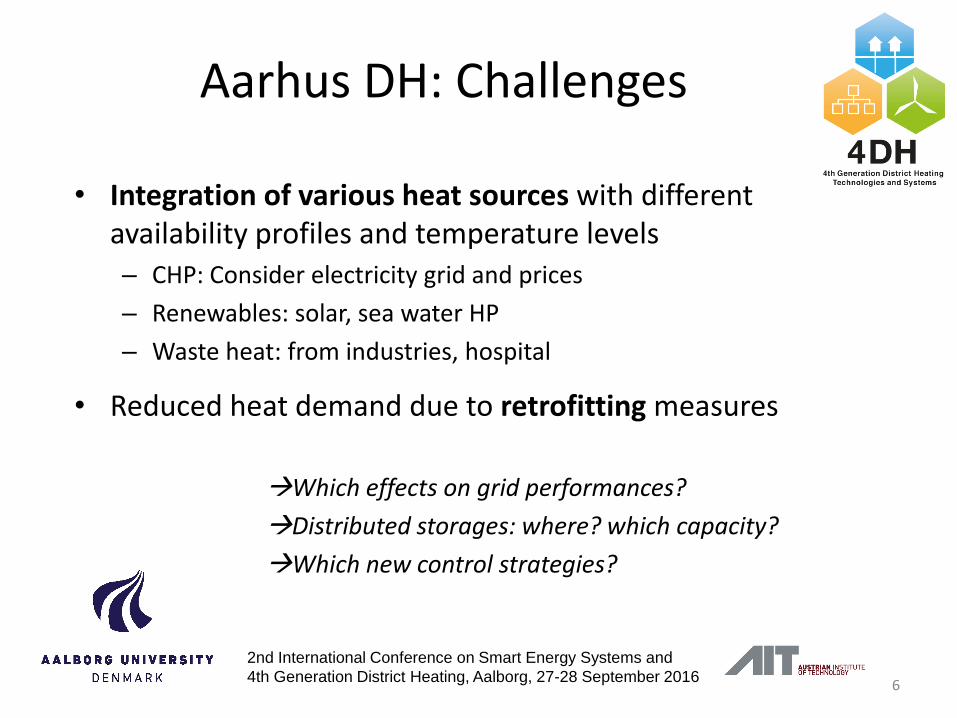
Aarhus DH: Challenges
2nd International Conference on Smart Energy Systems and
4th Generation District Heating, Aalborg, 27-28 September 2016
• Integration of various heat sources with different availability profiles and temperature levels – CHP: Consider electricity grid and prices
– Renewables: solar, sea water HP
– Waste heat: from industries, hospital
• Reduced heat demand due to retrofitting measures
Which effects on grid performances?
Distributed storages: where? which capacity?
Which new control strategies?
6

Demonstration Case: Aarhus DH
2nd International Conference on Smart Energy Systems and
4th Generation District Heating, Aalborg, 27-28 September 2016
• To be investigated: impacts of different operational strategies on the network performances
• Scenarios to be simulated:
– Retrofitting
– Retrofitting + distributed storages
– Heat pumps + wind2heat
– Absorption cooling + solar collectors
7

Modelling Methodology
2nd International Conference on Smart Energy Systems and
4th Generation District Heating, Aalborg, 27-28 September 2016
Simulation in Modelica/Dymola
Supply
modelling
Customer
modelling
Building data
(area, age,
type)
ΔT signature
method
Customers
aggregation
Grid
modelling
Priorities
settings
(partner data)
Renovation
scenarios
Grid
properties
(partner data)
Return/supply
Temperatures
Partner data
measurement
Grid
aggregation
GIS grid data
(partner data)
GIS
Vis
ualis
ation
8

Modelling Methodology
2nd International Conference on Smart Energy Systems and
4th Generation District Heating, Aalborg, 27-28 September 2016
Simulation in Modelica/Dymola
Supply
modelling
Customer
modelling
Building data
(area, age,
type)
ΔT signature
method
Customers
aggregation
Grid
modelling
Priorities
settings
(partner data)
Renovation
scenarios
Grid
properties
(partner data)
Return/supply
Temperatures
Partner data
measurement
Grid
aggregation
GIS grid data
(partner data)
Based on load
duration curve
and outdoor
temperature
dependencies
GIS
Vis
ualis
ation
9

Modelling Methodology
2nd International Conference on Smart Energy Systems and
4th Generation District Heating, Aalborg, 27-28 September 2016
Simulation in Modelica/Dymola
Supply
modelling
Customer
modelling
Building data
(area, age,
type)
ΔT signature
method
Customers
aggregation
Grid
modelling
Priorities
settings
(partner data)
Renovation
scenarios
Grid
properties
(partner data)
Return/supply
Temperatures
Partner data
measurement
Grid
aggregation
GIS grid data
(partner data)
Validation of the
grid model
based on the
yearly heat
losses/return
temp.
GIS
Vis
ualis
ation
10

Aarhus DH: Network aggregation
2nd International Conference on Smart Energy Systems and
4th Generation District Heating, Aalborg, 27-28 September 2016 11

2nd International Conference on Smart Energy Systems and
4th Generation District Heating, Aalborg, 27-28 September 2016
Aarhus DH: Network aggregation
12
Initial network: 261 nodes Aggregated network:
32 nodes

Modelling Methodology
2nd International Conference on Smart Energy Systems and
4th Generation District Heating, Aalborg, 27-28 September 2016
Simulation in Modelica/Dymola
Supply
modelling
Customer
modelling
Building data
(area, age,
type)
ΔT signature
method
Customers
aggregation
Grid
modelling
Priorities
settings
(partner data)
Renovation
scenarios
Grid
properties
(partner data)
Return/supply
Temperatures
Partner data
measurement
Grid
aggregation
GIS grid data
(partner data)
GIS
Vis
ualis
ation
13

Modelling Methodology
2nd International Conference on Smart Energy Systems and
4th Generation District Heating, Aalborg, 27-28 September 2016
Simulation in Modelica/Dymola
Supply
modelling
Customer
modelling
Building data
(area, age,
type)
ΔT signature
method
Customers
aggregation
Grid
modelling
Priorities
settings
(partner data)
Renovation
scenarios
Grid
properties
(partner data)
Return/supply
Temperatures
Partner data
measurement
Grid
aggregation
GIS grid data
(partner data)
GIS
Vis
ualis
ation
14
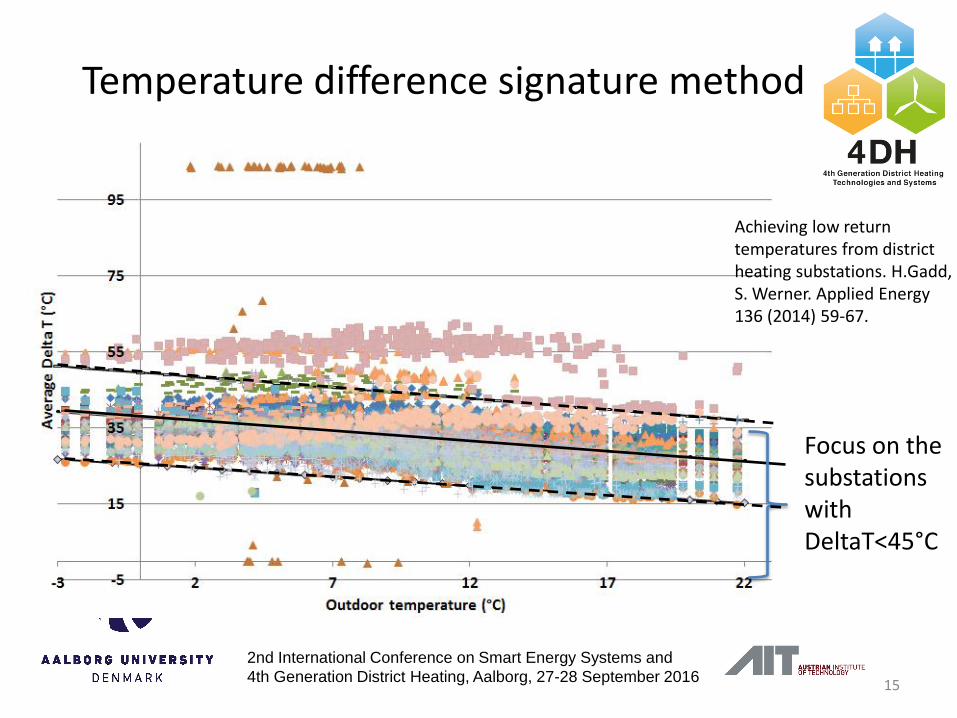
Temperature difference signature method
2nd International Conference on Smart Energy Systems and
4th Generation District Heating, Aalborg, 27-28 September 2016
Achieving low return temperatures from district heating substations. H.Gadd, S. Werner. Applied Energy 136 (2014) 59-67.
Focus on the substations with DeltaT<45°C
15

Temperature difference signature method
2nd International Conference on Smart Energy Systems and
4th Generation District Heating, Aalborg, 27-28 September 2016
Substations supplying buildings to be retrofitted
Type of buildings involved:
- 55% office buildings, 45% residential
- Construction year: 1970’s
Renovation measures:
- Extra insulation in roofs and facades
- Removal of existing thermal bridges
- Super insulated glassing and windows
- Intelligent controls for lightings and HVAC
Expected Energy savings: 51%
16

Next steps
2nd International Conference on Smart Energy Systems and
4th Generation District Heating, Aalborg, 27-28 September 2016
• READY: end 2019 • On-going work for Växjö and Aarhus demo case
• Aarhus - Simulate retrofitting scenarios: Analyse the effects on the network of the return temperature, distribution losses, economic savings how much retrofitting does Aarhus need to lower
significantly the return temperature? • Simulate and analyse other scenarios: Integration of storages, renewables, use of waste heat
17

Thank you for your attention
2nd International Conference on Smart Energy Systems and
4th Generation District Heating, Aalborg, 27-28 September 2016 18