Evaluation of Severity-Adjusted DRG Systems - RAND Corporation
34
Evaluation of Severity- Adjusted DRG Systems Addendum to the Interim Report BARBARA O. WYNN MOLLY SCOTT WR434/1-CMS July 2007 Prepared for the Centers for Medicare and Medicaid Services WORKING P A P E R This product is part of the RAND Health working paper series. RAND working papers are intended to share researchers’ latest findings and to solicit informal peer review. They have been approved for circulation by RAND Health but have not been formally edited or peer reviewed. Unless otherwise indicated, working papers can be quoted and cited without permission of the author, provided the source is clearly referred to as a working paper. RAND’s publications do not necessarily reflect the opinions of its research clients and sponsors. is a registered trademark.
Transcript of Evaluation of Severity-Adjusted DRG Systems - RAND Corporation
Evaluation of Severity-Adjusted DRG Systems Addendum to the Interim Report
BARBARA O. WYNN MOLLY SCOTT
WR434/1-CMS
July 2007
Prepared for the Centers for Medicare and Medicaid Services
WORK ING P A P E R
This product is part of the RAND Health working paper series. RAND working papers are intended to share researchers’ latest findings and to solicit informal peer review. They have been approved for circulation by RAND Health but have not been formally edited or peer reviewed. Unless otherwise indicated, working papers can be quoted and cited without permission of the author, provided the source is clearly referred to as a working paper. RAND’s publications do not necessarily reflect the opinions of its research clients and sponsors.
is a registered trademark.
iii
PREFACE
The Centers for Medicare and Medicaid Services (CMS), the federal
agency responsible for administering the Medicare program, has proposed
to adopt Medicare-Severity (MS) diagnosis-related groups (DRGs) in
fiscal year 2008 to account for differences in patient mix in its
inpatient hospital payment system for Medicare patients. In March 2007,
RAND released an interim report evaluating five other severity-adjusted
DRG systems that the agency was considering. This addendum reports our
findings with respect to the MS-DRGs. While some comparative information
is presented for the other severity-adjusted DRGs, readers should refer
to the interim report for a more complete assessment of those systems.1
This project is funded by CMS under contract no. 500-2005-000281.
The research was conducted in RAND Health, a division of the RAND
Corporation. A profile of RAND Health, abstracts of its publications,
and ordering information can be found at www.rand.org/health. Comments
on this report should be directed to Barbara Wynn, the principal
investigator (wynn @ rand.org).
1 See Wynn et al., “Evaluation of Severity-adjusted DRG Systems: Interim Report,” RAND: Santa Monica, CA., WR-434-CMS, 2007 (available at www.rand.org/pubs/working_papers/WR434/).
1. PURPOSE
The Centers for Medicare & Medicaid Services (CMS) asked RAND to
evaluate “off-the-shelf” severity-adjusted DRG systems that might be
considered for Medicare’s inpatient prospective payment system (PPS).
The focus of the study was on five DRG systems maintained by the
following vendors:
3M/Health Information Systems (3M/HIS)
CMS-DRGs modified for AP-DRG Logic (CMS+AP-DRGs)
Consolidated Severity-Adjusted DRGs (Con-APR-DRGs)(i.e., All-
Patient Refined DRGs with Medicare modifications)
Health Systems Consultants (HSC)
Refined DRGs (HSC-DRGs)
HSS/Ingenix
All-Payer Severity DRGs with Medicare modifications (MM-APS-
DRGs)
Solucient
Solucient Refined DRGs (Sol-DRGs)
RAND released an interim report evaluating the five systems as a
working paper in March 2007. Shortly thereafter, CMS proposed in the
Fiscal Year 2008 (FY08) proposed rule to adopt a different system
(Medicare-Severity or MS-DRGs). CMS developed the MS-DRG system in
response to comments and issues raised during the FY07 rulemaking
process. This addendum reports our findings with respect to the MS-DRGs.
While some comparative information is presented for the other severity-
adjusted DRGs, readers should refer to the main body of the interim
report for a more complete assessment of those systems.2
2 See Wynn et al., “Evaluation of Severity-adjusted DRG Systems: Interim Report,” RAND: Santa Monica, CA., WR-434-CMS, 2007 (available at www.rand.org/pubs/working_papers/WR434/).
2
2. DATA AND METHODS
The analyses reported in this addendum use the same data and
methods that were used to evaluate the other severity-adjusted DRG
systems. These methods are described in the main body of the report. In
our comparison of the severity-adjustments, we wanted to use a
consistent set of base CMS-DRGs. All the severity-adjusted DRG systems
other than the Con-APR-DRG system use the base CMS-DRGs and are likely
to incorporate refinements in the CMS-DRGs when those systems are
updated. In addition to proposing the MS-DRGs in FY08, CMS proposed to
make a few refinements to the base CMS-DRGs that are reflected in the
proposed FY08 MS-DRGs. CMS supplied us with the FY08 MS-DRG assignments
that would have applied to FY05 Medicare discharges from acute-care
hospitals. Where feasible, we “mapped” the affected records back to the
base DRG assignments that would have applied using the FY07 CMS-DRG
classification logic.3 We then repeated the earlier quantitative
analyses using this version of the MS-DRG assignments. The results
presented in the remainder of this addendum add the findings for the MS-
DRGs to the findings for the other severity-adjusted systems.
3. OVERVIEW OF MS-DRG SYSTEM
The MS-DRG system builds on the DRG refinements that CMS developed
but did not adopt in 1994. The system utilizes the CMS-DRGs as the
foundation for its grouping logic. The logic collapses any paired DRGs
(DRGs distinguished by the presence or absence of complications or
comorbidities (CCs) and/or age) into base DRGs and then splits the base
DRGs into CC-severity levels. In particular:
CMS collapsed the paired DRGs (with and without CC) and DRGs
with age splits (0-17, >age 17) into base DRGs. CMS-DRGs that
split based on the presence of a major cardiovascular condition,
3 For example, the FY08 rule proposes to reassign spinal fusions involving nine or more vertebrae(procedure code 81.64) from MS-DRGs 459 and 460 (Spinal Fusion Except Cervical With and Without MCC)to proposed MS-DRGs 456-458 (Spinal Fusion Except Cervical With Curvature of the Spine or Malignancy With MCC, With CC and Without CC). Because we evaluated the other CMS-based systems using the FY07 base CMS-DRGs, we reassigned these discharges from MS-DRGs 456-458 to MS-DRGs 459 and 460.
3
AMI with and without major complications, or cardiac
catheterization with and without complex diagnoses were also
collapsed. CMS also consolidated three pairs of burn DRGs that
are distinguished based on the presence of CC or a significant
trauma. Further, 34 current base CMS-DRGs with low Medicare
volume (e.g., pediatric or primarily outpatient procedures) were
consolidated with clinically similar proposed base MS-DRGs. A
new base DRG was created for cranial-facial bone procedures.
The general structure of the MS-DRG logic establishes three
severity levels for each base DRG: With MCC, With CC, and
Without CC. However, CMS consolidated severity levels for the
same base DRG if the following criteria for a subgroup were not
met:
– At least a 3 percent reduction in variance would result.
– At least 5 percent of discharges would be assigned to the
subgroup.
– At least 500 discharges would be assigned to the subgroup.
– There would be at least a 20% difference in average charges
between subgroups.
– There would be a $4,000 difference in average charges between
subgroups.
When the criteria for a subgroup were not met, the MCC and CC
severity levels may have been collapsed, resulting in a With
CC/MCC DRG and a Without CC/MCC DRG; alternatively, the no CC
and CC severity levels may have been collapsed, resulting in a
With MCC DRG and a Without MCC DRG. Some base MS-DRGs were not
subdivided because there was not sufficient difference between
the subgroups.
CMS assigned each diagnosis code a uniform CC-severity level
across all base DRGs (in conjunction with CC exclusion logic)
based on an evaluation of the impact of the condition on cost.
Because of the small number of cases, CMS used the APR-DRG
assignments for newborn, obstetric and congenital anomaly
diagnoses. Thirteen percent of diagnoses are MCCs, 27.2 percent
are CCs, and 59.8 percent are non-CC. Imprecise codes (Not
Otherwise Specified or NOS) and E-codes (causes of injury) are
4
generally categorized as non-CCs. Diagnoses that are closely
associated with mortality are assigned differently depending on
whether the patient is discharged alive (MCC) or dies (non-CC).
A CC exclusions list is used to exclude clinical situations in
which the condition should be a non-CC.
Each discharge is assigned to the highest severity level of any
secondary diagnosis. Generally, there is no adjustment in the
severity-level for additional factors or CCs. However,
discharges with no CC but certain high cost devices are assigned
to a CC severity level.
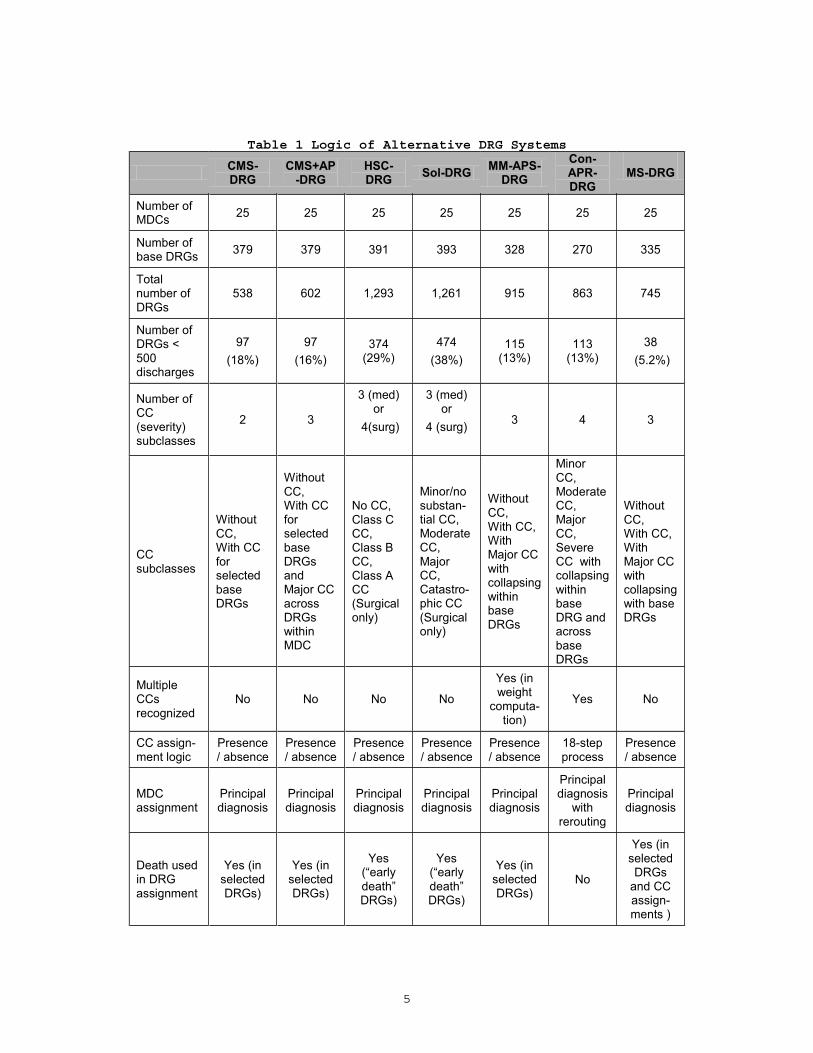
Table 1 summarizes how the MS-DRG system logic compares to the
other severity-adjusted systems along key dimensions.
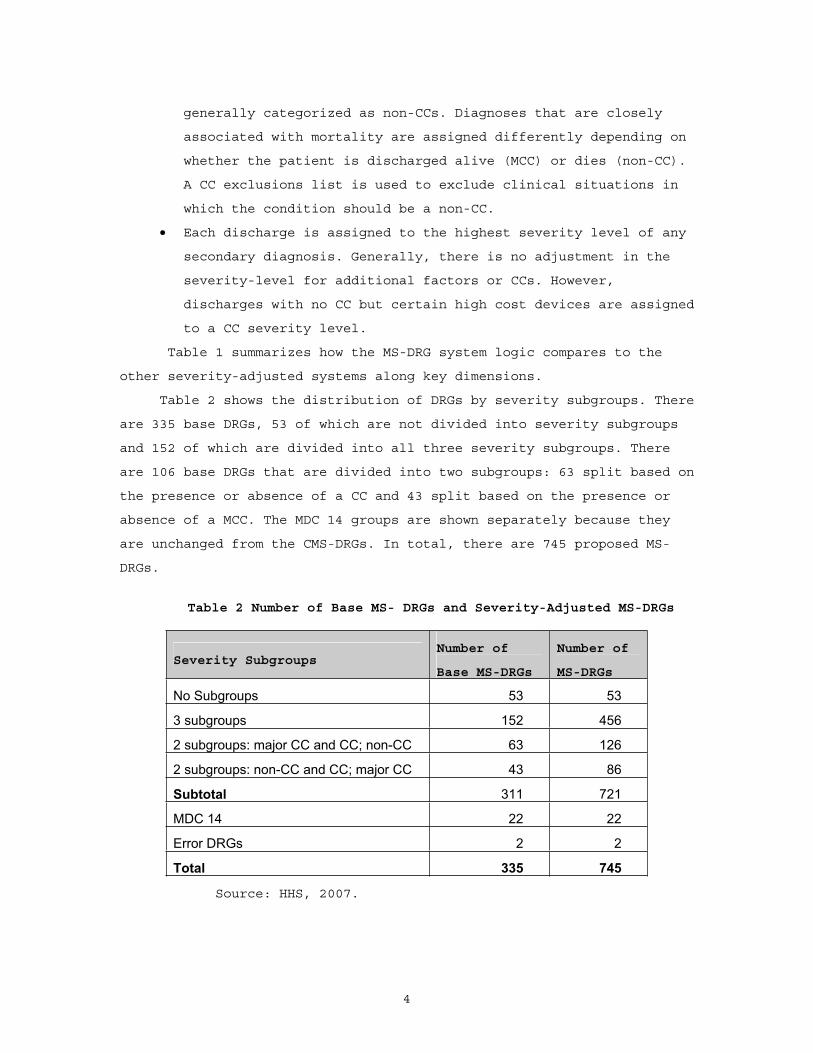
Table 2 shows the distribution of DRGs by severity subgroups. There
are 335 base DRGs, 53 of which are not divided into severity subgroups
and 152 of which are divided into all three severity subgroups. There
are 106 base DRGs that are divided into two subgroups: 63 split based on
the presence or absence of a CC and 43 split based on the presence or
absence of a MCC. The MDC 14 groups are shown separately because they
are unchanged from the CMS-DRGs. In total, there are 745 proposed MS-
DRGs.
Table 2 Number of Base MS- DRGs and Severity-Adjusted MS-DRGs
Severity Subgroups Number of
Base MS-DRGs
Number of
MS-DRGs
No Subgroups 53 53
3 subgroups 152 456
2 subgroups: major CC and CC; non-CC 63 126
2 subgroups: non-CC and CC; major CC 43 86
Subtotal 311 721
MDC 14 22 22
Error DRGs 2 2
Total 335 745
Source: HHS, 2007.
5
Table 1 Logic of Alternative DRG Systems
CMS-DRG
CMS+AP-DRG
HSC-DRG Sol-DRG MM-APS-
DRGCon-APR-DRG
MS-DRG
Number of MDCs 25 25 25 25 25 25 25
Number of base DRGs 379 379 391 393 328 270 335
Total number of DRGs
538 602 1,293 1,261 915 863 745
Number of DRGs < 500discharges
97(18%)
97(16%)
374 (29%)
474(38%)
115(13%)
113(13%)
38 (5.2%)
Number of CC(severity) subclasses
2 3
3 (med) or
4(surg)
3 (med) or
4 (surg) 3 4 3
CCsubclasses
Without CC,With CC forselected base DRGs
Without CC,With CC forselected base DRGs andMajor CC across DRGs within MDC
No CC, Class C CC,Class B CC,Class A CC(Surgical only)
Minor/no substan-tial CC, Moderate CC,Major CC,Catastro-phic CC (Surgical only)
Without CC,With CC, With Major CC with collapsing within base DRGs
Minor CC,Moderate CC,Major CC,Severe CC with collapsing within base DRG and across base DRGs
Without CC,With CC, With Major CC with collapsing with base DRGs
Multiple CCs recognized
No No No No
Yes (in weight
computa-tion)
Yes No
CC assign-ment logic
Presence/ absence
Presence/ absence
Presence/ absence
Presence/ absence
Presence/ absence
18-step process
Presence/ absence
MDCassignment
Principal diagnosis
Principal diagnosis
Principal diagnosis
Principal diagnosis
Principal diagnosis
Principal diagnosis
with rerouting
Principal diagnosis
Death used in DRG assignment
Yes (in selected DRGs)
Yes (in selected DRGs)
Yes (“early death”DRGs)
Yes (“early death”DRGs)
Yes (in selected DRGs)
No
Yes (in selected DRGs
and CC assign-ments )
6
To facilitate comparisons across the severity-adjusted DRG
systems, we assigned a severity level to each MS-DRG consistent with the
method used for the other DRG systems. The severity level is based on
the lowest severity-level of any CCs assigned to that DRG. We assigned a
0 to the lowest level. If a base MS-DRG divides into two DRGs, one for
both discharges with no CC and discharges with CCs and the other for
discharges with MCCs, we assigned Level 0 to the DRG for discharges with
no MCC and Level 2 to the DRG for discharges with MCCs. We also assigned
severity level 0 to base DRGs that do not split by CC level.
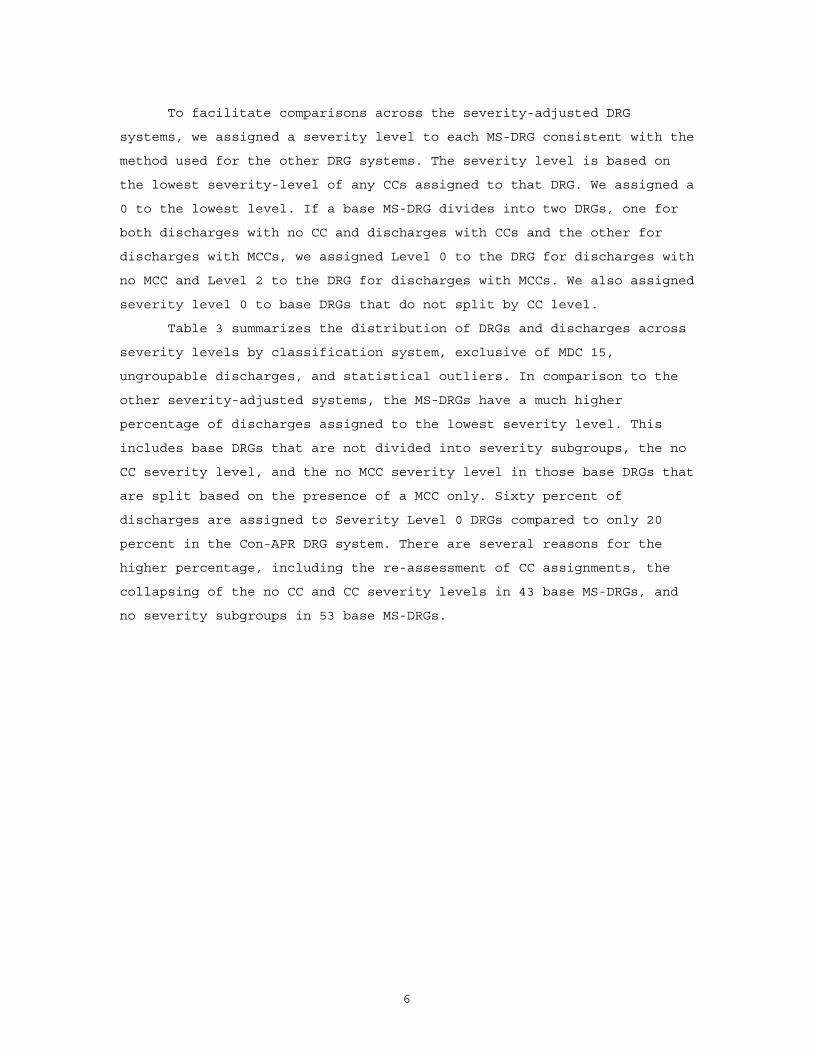
Table 3 summarizes the distribution of DRGs and discharges across
severity levels by classification system, exclusive of MDC 15,
ungroupable discharges, and statistical outliers. In comparison to the
other severity-adjusted systems, the MS-DRGs have a much higher
percentage of discharges assigned to the lowest severity level. This
includes base DRGs that are not divided into severity subgroups, the no
CC severity level, and the no MCC severity level in those base DRGs that
are split based on the presence of a MCC only. Sixty percent of
discharges are assigned to Severity Level 0 DRGs compared to only 20
percent in the Con-APR DRG system. There are several reasons for the
higher percentage, including the re-assessment of CC assignments, the
collapsing of the no CC and CC severity levels in 43 base MS-DRGs, and
no severity subgroups in 53 base MS-DRGs.
7
Table 3: Distribution of DRGs and Discharges by Severity-Level Assignments
SOI Level 0 SOI Level 1 SOI Level 2 SOI Level 3 Age 0-17 DRGs TotalN DRGs 358 128 25 511N Discharges 6,782,845 5,074,736 278,401 12,135,982 % Discharges 56% 42% 2% 100%
SOI Level 0 SOI Level 1 SOI Level 2 SOI Level 3 Age 0-17 DRGs TotalN DRGs 358 128 64 25 575N Discharges 5,842,981 3,933,710 2,262,260 97,030 12,135,981
% Discharges 48% 32% 19% 1% 100%
SOI Level 0 SOI Level 1 SOI Level 2 SOI Level 3 Age 0-17 DRGs TotalN DRGs 373 349 348 175 1245N Discharges 2,788,346 5,501,541 3,145,959 700,136 12,135,982
% Discharges 23% 45% 26% 6% 100%
SOI Level 0 SOI Level 1 SOI Level 2 SOI Level 3 Age 0-17 DRGs TotalN DRGs 368 336 331 169 1204N Discharges 2,923,930 6,609,026 2,113,606 489,520 12,136,082
% Discharges 24% 54% 17% 4% 100%
SOI Level 0 SOI Level 1 SOI Level 2 SOI Level 3 Age 0-17 DRGs TotalN DRGs 325 316 265 906N Discharges 3,892,398 6,283,024 1,960,560 12,135,982
% Discharges 32% 52% 16% 100%
SOI Level 0 SOI Level 1 SOI Level 2 SOI Level 3 Age 0-17 DRGs TotalN DRGs 261 262 263 59 845N Discharges 2,475,008 5,588,117 3,308,104 764,821 12,136,050
% Discharges 20% 46% 27% 6% 100%MS-DRGs
SOI Level 0 SOI Level 1 SOI Level 2 SOI Level 3 Age 0-17 DRGs TotalN DRGs 325 196 215 736N Discharges 7,308,649 2,847,838 1,979,495 12,135,982
% Discharges 60% 23% 16% 100%
Sol-DRGs
MM-APS-DRGs
Con-APR-DRGs
CMS DRGs
CMS+AP DRGs
HSC-DRGs
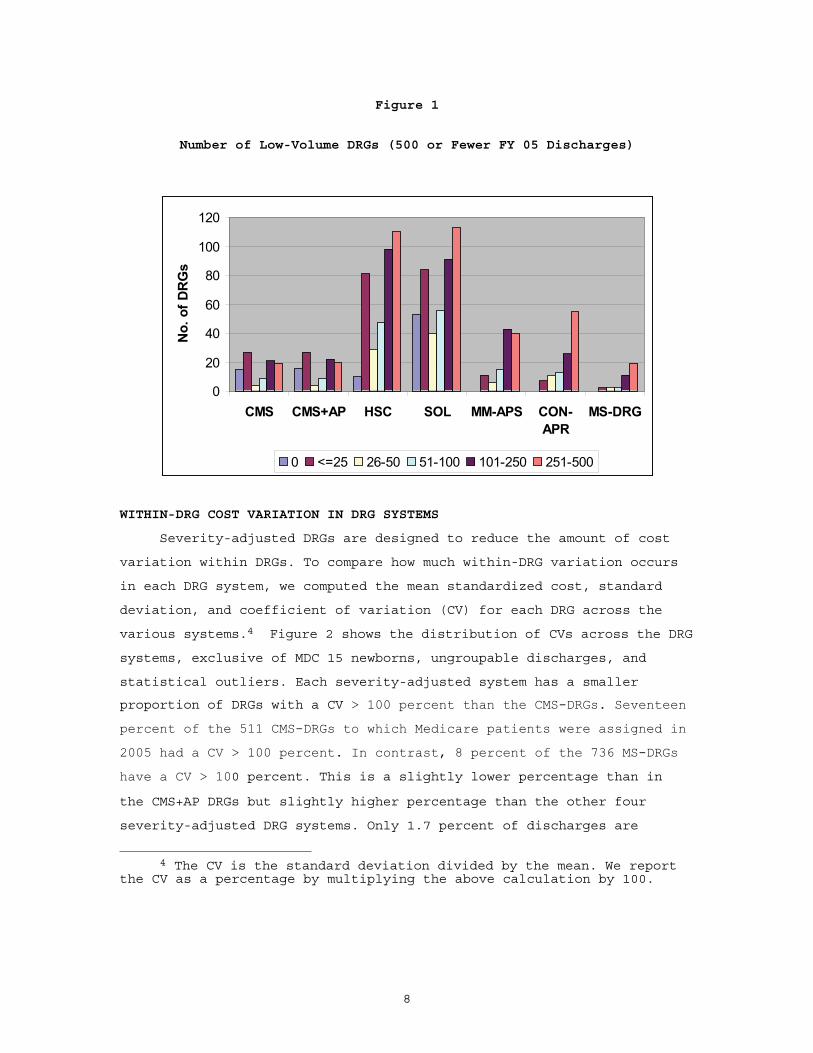
Figure 1 shows the distribution of low-volume DRGs in each system
in FY05, exclusive of MDC 15 newborns and ungroupable discharges.
Because the MS-DRGs combine low-volume severity classes (and several
low-volume base DRGs) and do not have separate DRGs for age 0-17, there
are fewer low-volume DRGs than in the other systems. In total, there
were 38 MS-DRGs with 500 or fewer discharges, 19 of which had more than
250 discharges. In comparison, because the current CMS-DRG system has
age splits and has not consolidated low-volume base DRGs, it has 95 DRGs
with 500 or fewer FY05 discharges.
8
Figure 1
Number of Low-Volume DRGs (500 or Fewer FY 05 Discharges)
0
20
40
60
80
100
120
CMS CMS+AP HSC SOL MM-APS CON-APR
MS-DRG
No.
of D
RG
s
0 <=25 26-50 51-100 101-250 251-500
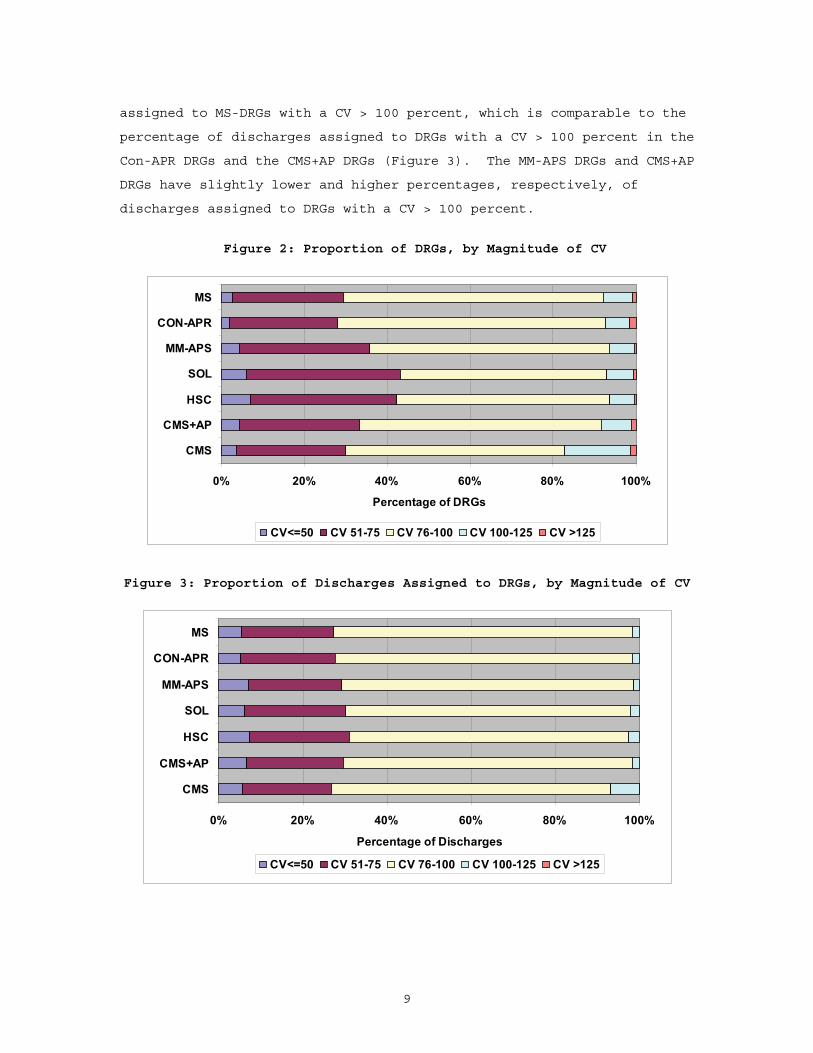
WITHIN-DRG COST VARIATION IN DRG SYSTEMS
Severity-adjusted DRGs are designed to reduce the amount of cost
variation within DRGs. To compare how much within-DRG variation occurs
in each DRG system, we computed the mean standardized cost, standard
deviation, and coefficient of variation (CV) for each DRG across the
various systems.4 Figure 2 shows the distribution of CVs across the DRG
systems, exclusive of MDC 15 newborns, ungroupable discharges, and
statistical outliers. Each severity-adjusted system has a smaller
proportion of DRGs with a CV > 100 percent than the CMS-DRGs. Seventeen
percent of the 511 CMS-DRGs to which Medicare patients were assigned in
2005 had a CV > 100 percent. In contrast, 8 percent of the 736 MS-DRGs
have a CV > 100 percent. This is a slightly lower percentage than in
the CMS+AP DRGs but slightly higher percentage than the other four
severity-adjusted DRG systems. Only 1.7 percent of discharges are
4 The CV is the standard deviation divided by the mean. We report the CV as a percentage by multiplying the above calculation by 100.
9
assigned to MS-DRGs with a CV > 100 percent, which is comparable to the
percentage of discharges assigned to DRGs with a CV > 100 percent in the
Con-APR DRGs and the CMS+AP DRGs (Figure 3). The MM-APS DRGs and CMS+AP
DRGs have slightly lower and higher percentages, respectively, of
discharges assigned to DRGs with a CV > 100 percent.
Figure 2: Proportion of DRGs, by Magnitude of CV
0% 20% 40% 60% 80% 100%
CMS
CMS+AP
HSC
SOL
MM-APS
CON-APR
MS
Percentage of DRGs
CV<=50 CV 51-75 CV 76-100 CV 100-125 CV >125
Figure 3: Proportion of Discharges Assigned to DRGs, by Magnitude of CV
0% 20% 40% 60% 80% 100%
CMS
CMS+AP
HSC
SOL
MM-APS
CON-APR
MS
Percentage of Discharges
CV<=50 CV 51-75 CV 76-100 CV 100-125 CV >125
10
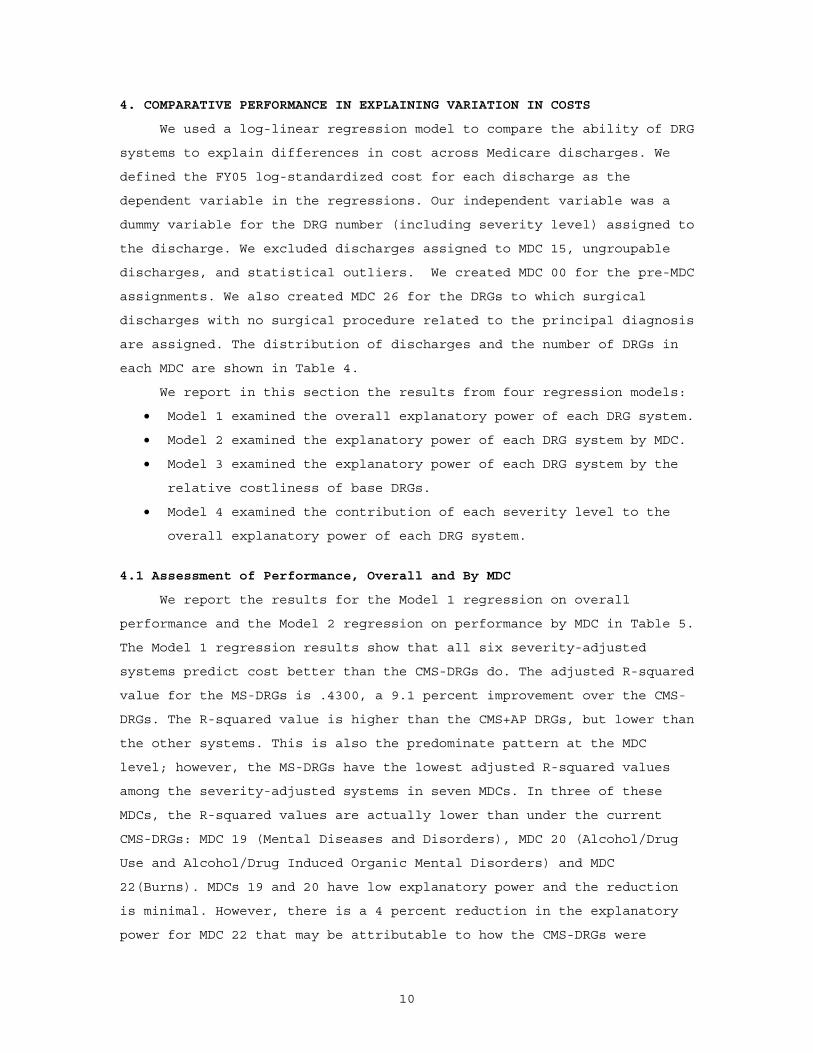
4. COMPARATIVE PERFORMANCE IN EXPLAINING VARIATION IN COSTS
We used a log-linear regression model to compare the ability of DRG
systems to explain differences in cost across Medicare discharges. We
defined the FY05 log-standardized cost for each discharge as the
dependent variable in the regressions. Our independent variable was a
dummy variable for the DRG number (including severity level) assigned to
the discharge. We excluded discharges assigned to MDC 15, ungroupable
discharges, and statistical outliers. We created MDC 00 for the pre-MDC
assignments. We also created MDC 26 for the DRGs to which surgical
discharges with no surgical procedure related to the principal diagnosis
are assigned. The distribution of discharges and the number of DRGs in
each MDC are shown in Table 4.
We report in this section the results from four regression models:
Model 1 examined the overall explanatory power of each DRG system.
Model 2 examined the explanatory power of each DRG system by MDC.
Model 3 examined the explanatory power of each DRG system by the
relative costliness of base DRGs.
Model 4 examined the contribution of each severity level to the
overall explanatory power of each DRG system.
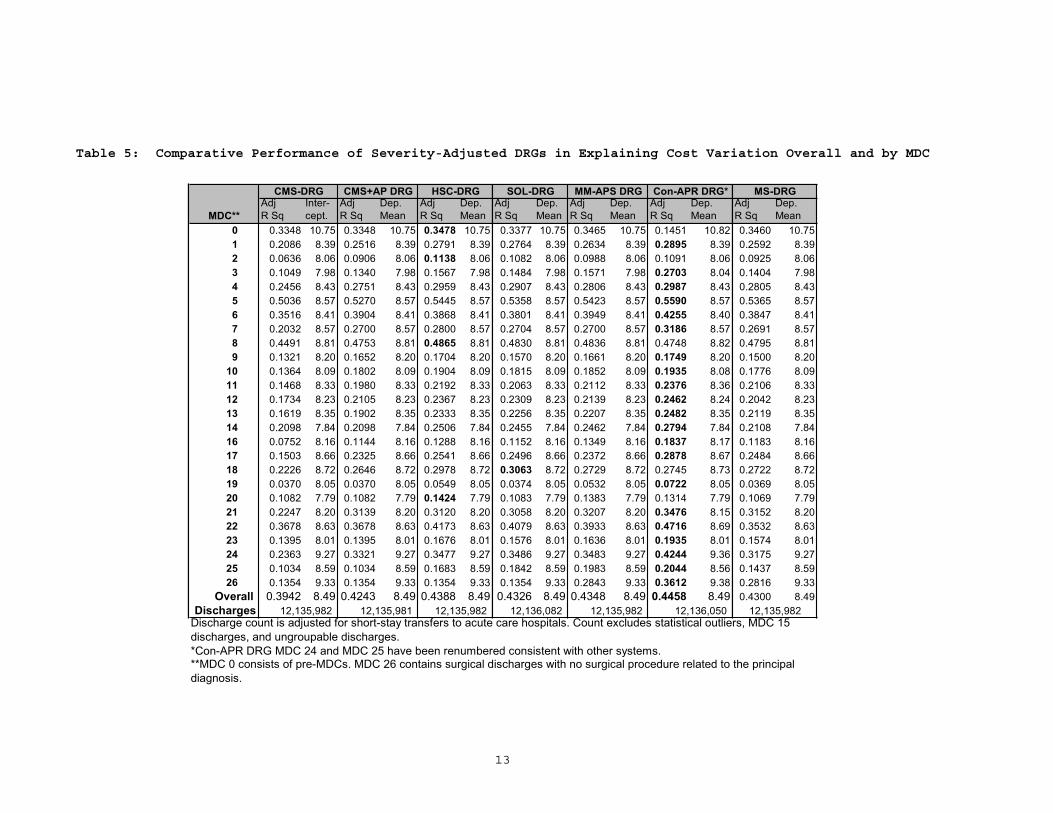
4.1 Assessment of Performance, Overall and By MDC
We report the results for the Model 1 regression on overall
performance and the Model 2 regression on performance by MDC in Table 5.
The Model 1 regression results show that all six severity-adjusted
systems predict cost better than the CMS-DRGs do. The adjusted R-squared
value for the MS-DRGs is .4300, a 9.1 percent improvement over the CMS-
DRGs. The R-squared value is higher than the CMS+AP DRGs, but lower than
the other systems. This is also the predominate pattern at the MDC
level; however, the MS-DRGs have the lowest adjusted R-squared values
among the severity-adjusted systems in seven MDCs. In three of these
MDCs, the R-squared values are actually lower than under the current
CMS-DRGs: MDC 19 (Mental Diseases and Disorders), MDC 20 (Alcohol/Drug
Use and Alcohol/Drug Induced Organic Mental Disorders) and MDC
22(Burns). MDCs 19 and 20 have low explanatory power and the reduction
is minimal. However, there is a 4 percent reduction in the explanatory
power for MDC 22 that may be attributable to how the CMS-DRGs were

11
collapsed to form the base DRGs. The three pairs of burn CMS-DRGs that
were defined based on the presence of a CC or a significant trauma were
consolidated. There are eight CMS-DRGs in MDC 22 compared to 6 MS-DRGs.
12
Table 4: FY05 Distribution of Discharges and DRGs, by MDC
NDischarges
NDRGs
NDischarges
NDRGs
NDischarges
NDRGs
NDischarges
NDRGs
NDischarges
NDRG
NDischarges
NDRGs
NDischarges
NDRGs
0 54,989 9 54,989 9 54,988 29 54,988 24 54,999 16 31,654 19 55,026 131 914,600 44 914,600 48 914,600 90 914,600 92 914,600 90 916,073 78 914,600 752 14,525 11 14,525 13 14,525 37 14,525 37 14,525 17 13,764 14 14,525 103 110,288 29 110,288 31 110,288 79 110,288 79 110,288 41 120,721 41 110,288 254 1,828,135 30 1,828,135 35 1,828,135 51 1,828,135 51 1,828,135 44 1,812,316 51 1,828,132 405 3,310,026 54 3,310,026 63 3,310,011 158 3,310,092 138 3,310,026 126 3,233,387 97 3,310,026 876 1,296,899 44 1,296,899 49 1,296,899 69 1,296,899 72 1,296,899 69 1,330,895 75 1,296,899 617 342,584 20 342,584 24 342,584 48 342,584 48 342,574 29 345,721 36 342,555 368 1,386,779 57 1,386,779 63 1,386,779 153 1,386,779 157 1,386,779 110 1,439,888 80 1,386,779 999 300,256 27 300,256 31 300,256 58 300,256 58 300,256 34 311,494 32 300,256 29
10 473,540 17 473,540 19 473,540 48 473,540 50 473,540 28 415,684 32 473,540 2611 697,529 32 697,529 35 697,529 60 697,529 60 697,529 46 756,521 48 697,529 4312 97,787 16 97,787 18 97,787 45 97,787 45 97,787 25 100,198 23 97,782 2113 125,316 17 125,316 19 125,316 52 125,316 52 125,316 37 125,300 35 125,316 2514 16,510 15 16,510 15 16,510 48 16,510 48 16,510 20 16,435 22 16,510 1516 157,689 8 157,689 10 157,615 18 157,615 18 157,689 18 157,965 20 157,689 1517 103,747 17 103,747 21 103,747 41 103,747 39 103,747 28 105,083 24 103,747 2718 417,815 11 417,814 14 417,815 20 417,815 22 417,815 23 424,053 23 417,815 1719 121,261 9 121,261 9 121,261 29 121,261 12 121,261 19 120,162 16 121,261 920 59,298 4 59,298 4 59,298 10 59,317 4 59,298 9 59,396 6 59,298 421 132,951 15 132,951 17 132,946 32 132,951 33 132,951 25 110,994 17 132,951 2022 4,902 8 4,902 8 4,902 23 4,902 18 4,902 13 5,008 11 4,902 623 53,901 7 53,901 7 53,901 17 53,901 17 53,901 11 53,037 14 53,901 1024 12,043 4 12,043 7 12,040 16 12,043 16 12,043 12 13,093 10 12,043 825 19,913 3 19,913 3 19,988 11 19,988 11 19,913 7 22,978 10 19,913 626 82,699 3 82,699 3 82,722 3 82,714 3 82,699 9 94,229 11 82,699 9
Total 12,135,982 511 12,135,981 575 12,135,982 1,245 12,136,082 1,204 12,135,982 906 12,136,049 845 12,135,982 736
MS-DRG
* Con-APR-DRG MDC 24 and MDC 25 have been relabeled to be consistent with other classification systems. **MDC 0 consists of pre-MDCs. MDC 26 contains surgical discharges with no surgical procedure related to the principal diagnosis.
SOL-DRG MM-APS DRG Con-APR DRG*
Discharge count is adjusted for short-stay transfers to acute care hospitals. Count excludes statistical outliers, MDC 15 discharges, and ungroupable discharges.
MDC**
CMS-DRG CMS+AP DRG HSC-DRG
13
Table 5: Comparative Performance of Severity-Adjusted DRGs in Explaining Cost Variation Overall and by MDC
MDC**Adj R Sq
Inter-cept.
Adj R Sq
Dep. Mean
Adj R Sq
Dep. Mean
Adj R Sq
Dep. Mean
Adj R Sq
Dep. Mean
Adj R Sq
Dep. Mean
Adj R Sq
Dep. Mean
0 0.3348 10.75 0.3348 10.75 0.3478 10.75 0.3377 10.75 0.3465 10.75 0.1451 10.82 0.3460 10.751 0.2086 8.39 0.2516 8.39 0.2791 8.39 0.2764 8.39 0.2634 8.39 0.2895 8.39 0.2592 8.392 0.0636 8.06 0.0906 8.06 0.1138 8.06 0.1082 8.06 0.0988 8.06 0.1091 8.06 0.0925 8.063 0.1049 7.98 0.1340 7.98 0.1567 7.98 0.1484 7.98 0.1571 7.98 0.2703 8.04 0.1404 7.984 0.2456 8.43 0.2751 8.43 0.2959 8.43 0.2907 8.43 0.2806 8.43 0.2987 8.43 0.2805 8.435 0.5036 8.57 0.5270 8.57 0.5445 8.57 0.5358 8.57 0.5423 8.57 0.5590 8.57 0.5365 8.576 0.3516 8.41 0.3904 8.41 0.3868 8.41 0.3801 8.41 0.3949 8.41 0.4255 8.40 0.3847 8.417 0.2032 8.57 0.2700 8.57 0.2800 8.57 0.2704 8.57 0.2700 8.57 0.3186 8.57 0.2691 8.578 0.4491 8.81 0.4753 8.81 0.4865 8.81 0.4830 8.81 0.4836 8.81 0.4748 8.82 0.4795 8.819 0.1321 8.20 0.1652 8.20 0.1704 8.20 0.1570 8.20 0.1661 8.20 0.1749 8.20 0.1500 8.20
10 0.1364 8.09 0.1802 8.09 0.1904 8.09 0.1815 8.09 0.1852 8.09 0.1935 8.08 0.1776 8.0911 0.1468 8.33 0.1980 8.33 0.2192 8.33 0.2063 8.33 0.2112 8.33 0.2376 8.36 0.2106 8.3312 0.1734 8.23 0.2105 8.23 0.2367 8.23 0.2309 8.23 0.2139 8.23 0.2462 8.24 0.2042 8.2313 0.1619 8.35 0.1902 8.35 0.2333 8.35 0.2256 8.35 0.2207 8.35 0.2482 8.35 0.2119 8.3514 0.2098 7.84 0.2098 7.84 0.2506 7.84 0.2455 7.84 0.2462 7.84 0.2794 7.84 0.2108 7.8416 0.0752 8.16 0.1144 8.16 0.1288 8.16 0.1152 8.16 0.1349 8.16 0.1837 8.17 0.1183 8.1617 0.1503 8.66 0.2325 8.66 0.2541 8.66 0.2496 8.66 0.2372 8.66 0.2878 8.67 0.2484 8.6618 0.2226 8.72 0.2646 8.72 0.2978 8.72 0.3063 8.72 0.2729 8.72 0.2745 8.73 0.2722 8.7219 0.0370 8.05 0.0370 8.05 0.0549 8.05 0.0374 8.05 0.0532 8.05 0.0722 8.05 0.0369 8.0520 0.1082 7.79 0.1082 7.79 0.1424 7.79 0.1083 7.79 0.1383 7.79 0.1314 7.79 0.1069 7.7921 0.2247 8.20 0.3139 8.20 0.3120 8.20 0.3058 8.20 0.3207 8.20 0.3476 8.15 0.3152 8.2022 0.3678 8.63 0.3678 8.63 0.4173 8.63 0.4079 8.63 0.3933 8.63 0.4716 8.69 0.3532 8.6323 0.1395 8.01 0.1395 8.01 0.1676 8.01 0.1576 8.01 0.1636 8.01 0.1935 8.01 0.1574 8.0124 0.2363 9.27 0.3321 9.27 0.3477 9.27 0.3486 9.27 0.3483 9.27 0.4244 9.36 0.3175 9.2725 0.1034 8.59 0.1034 8.59 0.1683 8.59 0.1842 8.59 0.1983 8.59 0.2044 8.56 0.1437 8.5926 0.1354 9.33 0.1354 9.33 0.1354 9.33 0.1354 9.33 0.2843 9.33 0.3612 9.38 0.2816 9.33
Overall 0.3942 8.49 0.4243 8.49 0.4388 8.49 0.4326 8.49 0.4348 8.49 0.4458 8.49 0.4300 8.49Discharges
*Con-APR DRG MDC 24 and MDC 25 have been renumbered consistent with other systems.
12,135,982 12,136,050
CMS-DRG CMS+AP DRG HSC-DRG SOL-DRG MS-DRG
12,135,982Discharge count is adjusted for short-stay transfers to acute care hospitals. Count excludes statistical outliers, MDC 15 discharges, and ungroupable discharges.
**MDC 0 consists of pre-MDCs. MDC 26 contains surgical discharges with no surgical procedure related to the principal diagnosis.
MM-APS DRG Con-APR DRG*
12,135,982 12,135,981 12,135,982 12,136,082
14
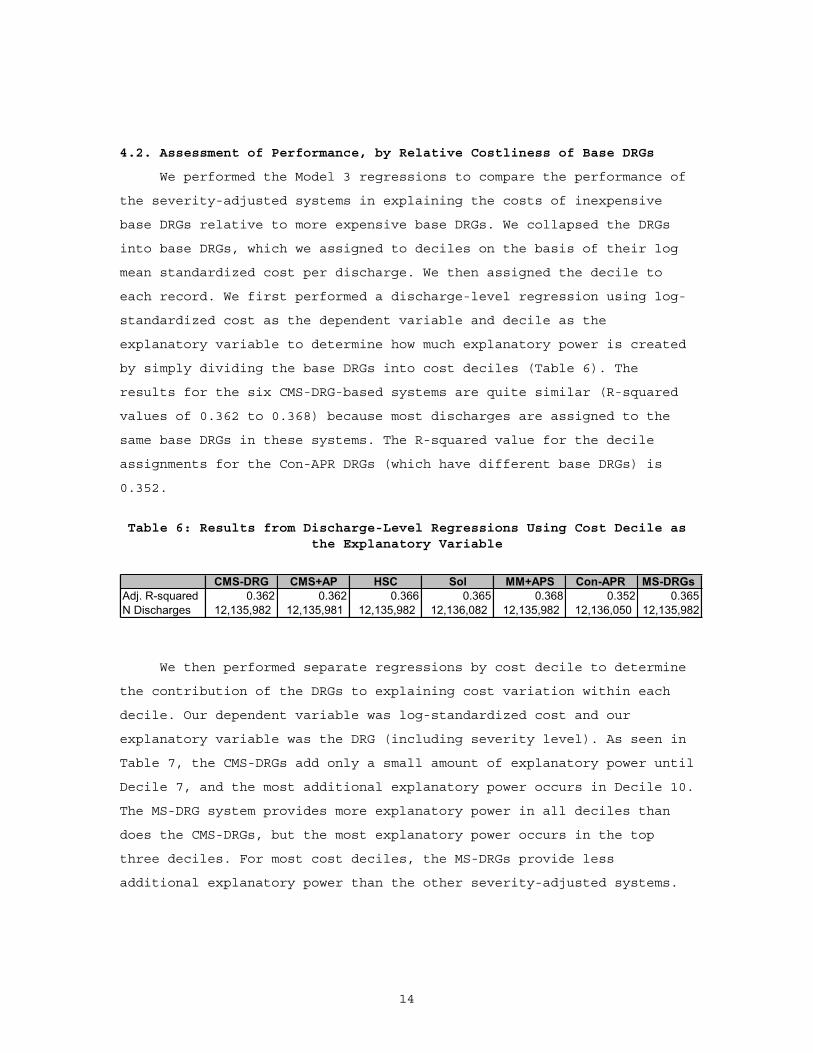
4.2. Assessment of Performance, by Relative Costliness of Base DRGs
We performed the Model 3 regressions to compare the performance of
the severity-adjusted systems in explaining the costs of inexpensive
base DRGs relative to more expensive base DRGs. We collapsed the DRGs
into base DRGs, which we assigned to deciles on the basis of their log
mean standardized cost per discharge. We then assigned the decile to
each record. We first performed a discharge-level regression using log-
standardized cost as the dependent variable and decile as the
explanatory variable to determine how much explanatory power is created
by simply dividing the base DRGs into cost deciles (Table 6). The
results for the six CMS-DRG-based systems are quite similar (R-squared
values of 0.362 to 0.368) because most discharges are assigned to the
same base DRGs in these systems. The R-squared value for the decile
assignments for the Con-APR DRGs (which have different base DRGs) is
0.352.
Table 6: Results from Discharge-Level Regressions Using Cost Decile as the Explanatory Variable
CMS-DRG CMS+AP HSC Sol MM+APS Con-APR MS-DRGs Adj. R-squared 0.362 0.362 0.366 0.365 0.368 0.352 0.365N Discharges 12,135,982 12,135,981 12,135,982 12,136,082 12,135,982 12,136,050 12,135,982
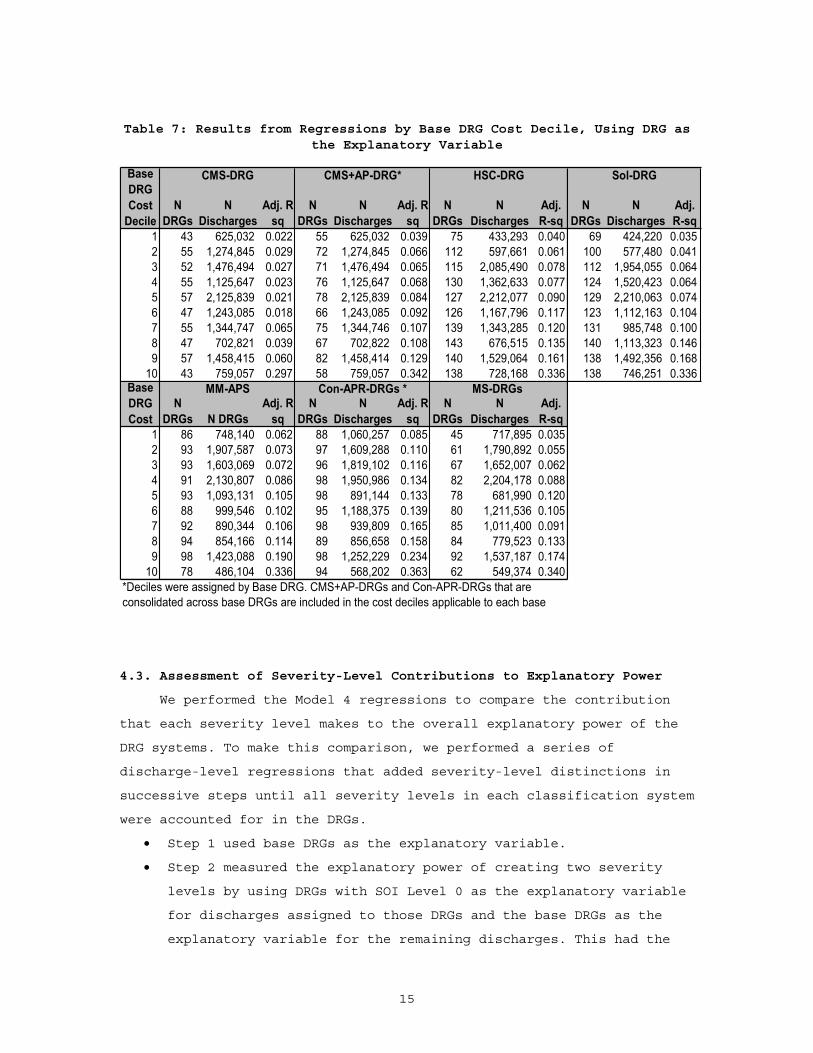
We then performed separate regressions by cost decile to determine
the contribution of the DRGs to explaining cost variation within each
decile. Our dependent variable was log-standardized cost and our
explanatory variable was the DRG (including severity level). As seen in
Table 7, the CMS-DRGs add only a small amount of explanatory power until
Decile 7, and the most additional explanatory power occurs in Decile 10.
The MS-DRG system provides more explanatory power in all deciles than
does the CMS-DRGs, but the most explanatory power occurs in the top
three deciles. For most cost deciles, the MS-DRGs provide less
additional explanatory power than the other severity-adjusted systems.
15
Table 7: Results from Regressions by Base DRG Cost Decile, Using DRG as the Explanatory Variable
NDRGs
NDischarges
Adj. R-sq
NDRGs
NDischarges
Adj. R-sq
NDRGs
NDischarges
Adj. R-sq
NDRGs
NDischarges
Adj. R-sq
1 43 625,032 0.022 55 625,032 0.039 75 433,293 0.040 69 424,220 0.0352 55 1,274,845 0.029 72 1,274,845 0.066 112 597,661 0.061 100 577,480 0.0413 52 1,476,494 0.027 71 1,476,494 0.065 115 2,085,490 0.078 112 1,954,055 0.0644 55 1,125,647 0.023 76 1,125,647 0.068 130 1,362,633 0.077 124 1,520,423 0.0645 57 2,125,839 0.021 78 2,125,839 0.084 127 2,212,077 0.090 129 2,210,063 0.0746 47 1,243,085 0.018 66 1,243,085 0.092 126 1,167,796 0.117 123 1,112,163 0.1047 55 1,344,747 0.065 75 1,344,746 0.107 139 1,343,285 0.120 131 985,748 0.1008 47 702,821 0.039 67 702,822 0.108 143 676,515 0.135 140 1,113,323 0.1469 57 1,458,415 0.060 82 1,458,414 0.129 140 1,529,064 0.161 138 1,492,356 0.168
10 43 759,057 0.297 58 759,057 0.342 138 728,168 0.336 138 746,251 0.336
NDRGs N DRGs
Adj. R-sq
NDRGs
NDischarges
Adj. R-sq
NDRGs
NDischarges
Adj.R-sq
1 86 748,140 0.062 88 1,060,257 0.085 45 717,895 0.0352 93 1,907,587 0.073 97 1,609,288 0.110 61 1,790,892 0.0553 93 1,603,069 0.072 96 1,819,102 0.116 67 1,652,007 0.0624 91 2,130,807 0.086 98 1,950,986 0.134 82 2,204,178 0.0885 93 1,093,131 0.105 98 891,144 0.133 78 681,990 0.1206 88 999,546 0.102 95 1,188,375 0.139 80 1,211,536 0.1057 92 890,344 0.106 98 939,809 0.165 85 1,011,400 0.0918 94 854,166 0.114 89 856,658 0.158 84 779,523 0.1339 98 1,423,088 0.190 98 1,252,229 0.234 92 1,537,187 0.174
10 78 486,104 0.336 94 568,202 0.363 62 549,374 0.340*Deciles were assigned by Base DRG. CMS+AP-DRGs and Con-APR-DRGs that are consolidated across base DRGs are included in the cost deciles applicable to each base
BaseDRG Cost
Con-APR-DRGs *
Sol-DRG
MS-DRGs MM-APS
BaseDRG Cost
Decile
CMS-DRG CMS+AP-DRG* HSC-DRG
4.3. Assessment of Severity-Level Contributions to Explanatory Power
We performed the Model 4 regressions to compare the contribution
that each severity level makes to the overall explanatory power of the
DRG systems. To make this comparison, we performed a series of
discharge-level regressions that added severity-level distinctions in
successive steps until all severity levels in each classification system
were accounted for in the DRGs.
Step 1 used base DRGs as the explanatory variable.
Step 2 measured the explanatory power of creating two severity
levels by using DRGs with SOI Level 0 as the explanatory variable
for discharges assigned to those DRGs and the base DRGs as the
explanatory variable for the remaining discharges. This had the
16
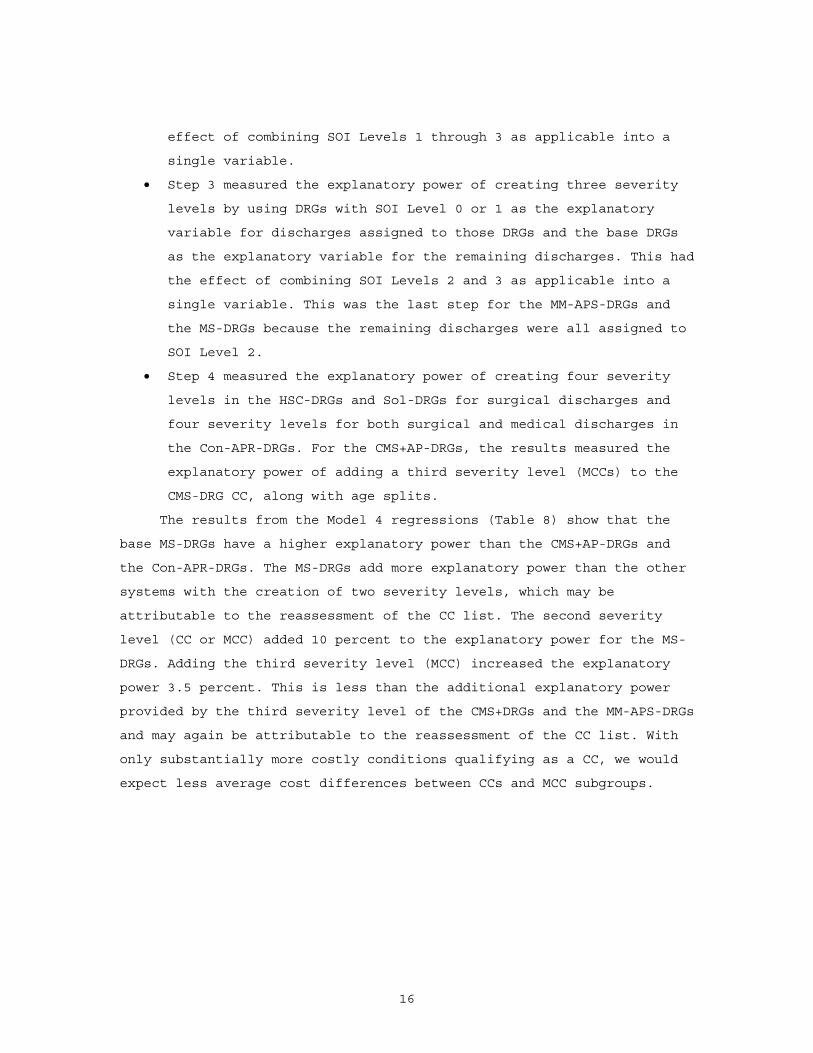
effect of combining SOI Levels 1 through 3 as applicable into a
single variable.
Step 3 measured the explanatory power of creating three severity
levels by using DRGs with SOI Level 0 or 1 as the explanatory
variable for discharges assigned to those DRGs and the base DRGs
as the explanatory variable for the remaining discharges. This had
the effect of combining SOI Levels 2 and 3 as applicable into a
single variable. This was the last step for the MM-APS-DRGs and
the MS-DRGs because the remaining discharges were all assigned to
SOI Level 2.
Step 4 measured the explanatory power of creating four severity
levels in the HSC-DRGs and Sol-DRGs for surgical discharges and
four severity levels for both surgical and medical discharges in
the Con-APR-DRGs. For the CMS+AP-DRGs, the results measured the
explanatory power of adding a third severity level (MCCs) to the
CMS-DRG CC, along with age splits.
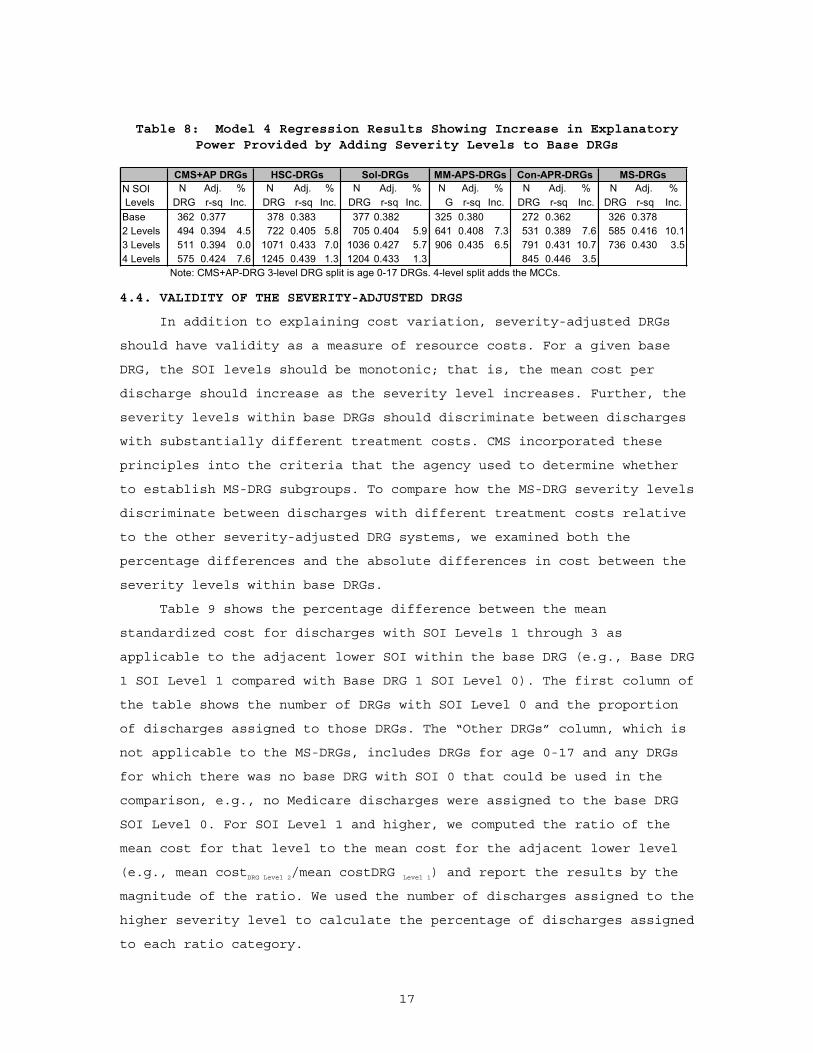
The results from the Model 4 regressions (Table 8) show that the
base MS-DRGs have a higher explanatory power than the CMS+AP-DRGs and
the Con-APR-DRGs. The MS-DRGs add more explanatory power than the other
systems with the creation of two severity levels, which may be
attributable to the reassessment of the CC list. The second severity
level (CC or MCC) added 10 percent to the explanatory power for the MS-
DRGs. Adding the third severity level (MCC) increased the explanatory
power 3.5 percent. This is less than the additional explanatory power
provided by the third severity level of the CMS+DRGs and the MM-APS-DRGs
and may again be attributable to the reassessment of the CC list. With
only substantially more costly conditions qualifying as a CC, we would
expect less average cost differences between CCs and MCC subgroups.
17
Table 8: Model 4 Regression Results Showing Increase in Explanatory Power Provided by Adding Severity Levels to Base DRGs
N SOI N Adj. % N Adj. % N Adj. % N Adj. % N Adj. % N Adj. % Levels DRG r-sq Inc. DRG r-sq Inc. DRG r-sq Inc. G r-sq Inc. DRG r-sq Inc. DRG r-sq Inc.Base 362 0.377 378 0.383 377 0.382 325 0.380 272 0.362 326 0.3782 Levels 494 0.394 4.5 722 0.405 5.8 705 0.404 5.9 641 0.408 7.3 531 0.389 7.6 585 0.416 10.13 Levels 511 0.394 0.0 1071 0.433 7.0 1036 0.427 5.7 906 0.435 6.5 791 0.431 10.7 736 0.430 3.54 Levels 575 0.424 7.6 1245 0.439 1.3 1204 0.433 1.3 845 0.446 3.5
Note: CMS+AP-DRG 3-level DRG split is age 0-17 DRGs. 4-level split adds the MCCs.
MS-DRGsCon-APR-DRGsCMS+AP DRGs HSC-DRGs Sol-DRGs MM-APS-DRGs
4.4. VALIDITY OF THE SEVERITY-ADJUSTED DRGS
In addition to explaining cost variation, severity-adjusted DRGs
should have validity as a measure of resource costs. For a given base
DRG, the SOI levels should be monotonic; that is, the mean cost per
discharge should increase as the severity level increases. Further, the
severity levels within base DRGs should discriminate between discharges
with substantially different treatment costs. CMS incorporated these
principles into the criteria that the agency used to determine whether
to establish MS-DRG subgroups. To compare how the MS-DRG severity levels
discriminate between discharges with different treatment costs relative
to the other severity-adjusted DRG systems, we examined both the
percentage differences and the absolute differences in cost between the
severity levels within base DRGs.
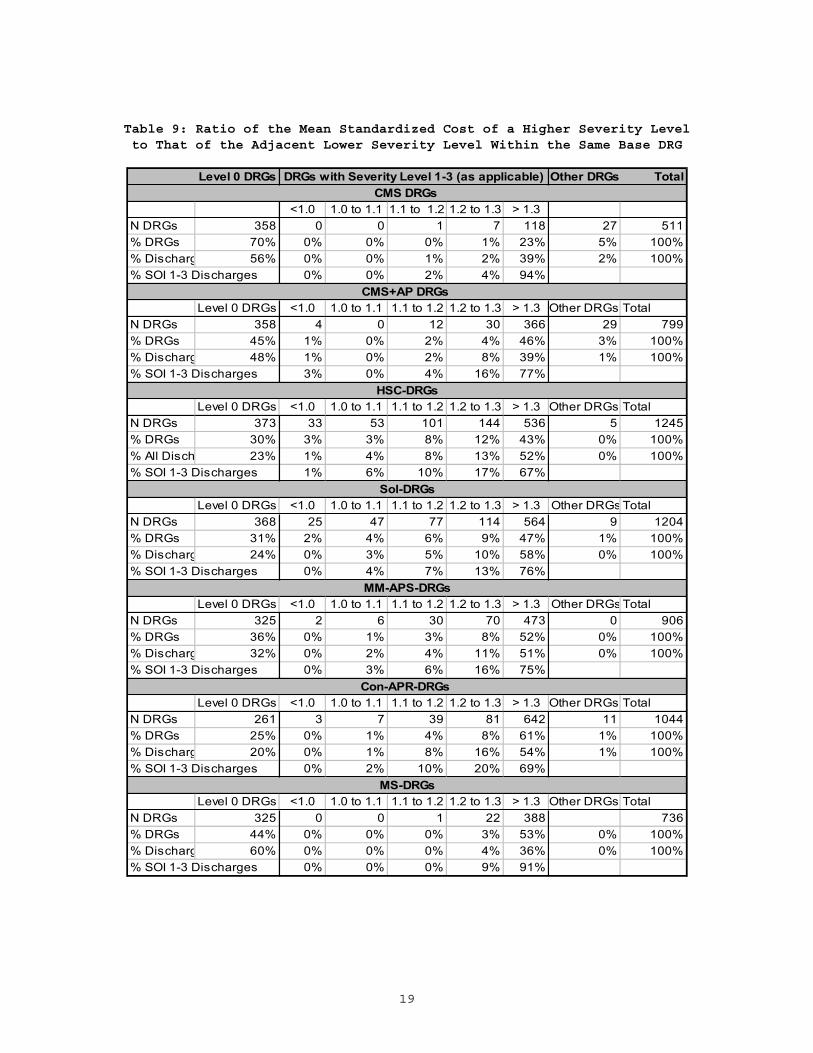
Table 9 shows the percentage difference between the mean
standardized cost for discharges with SOI Levels 1 through 3 as
applicable to the adjacent lower SOI within the base DRG (e.g., Base DRG
1 SOI Level 1 compared with Base DRG 1 SOI Level 0). The first column of
the table shows the number of DRGs with SOI Level 0 and the proportion
of discharges assigned to those DRGs. The “Other DRGs” column, which is
not applicable to the MS-DRGs, includes DRGs for age 0-17 and any DRGs
for which there was no base DRG with SOI 0 that could be used in the
comparison, e.g., no Medicare discharges were assigned to the base DRG
SOI Level 0. For SOI Level 1 and higher, we computed the ratio of the
mean cost for that level to the mean cost for the adjacent lower level
(e.g., mean costDRG Level 2/mean costDRG Level 1) and report the results by the
magnitude of the ratio. We used the number of discharges assigned to the
higher severity level to calculate the percentage of discharges assigned
to each ratio category.
18
Medicare beneficiaries were assigned to 325 MS-DRGs with SOI Level
0. These DRGs represented 44 percent of the severity-adjusted DRGs and
60 percent of the Medicare discharges. As previously noted, this is a
higher percentage of discharges assigned to SOI Level 0 than under the
current CMS-DRGs or any of the other severity-adjusted DRG systems. The
remaining Medicare discharges were assigned to 411 DRGs with SOI Levels
1 or 2, of which 387 were on average at least 30 percent more costly
than the discharges in the adjacent lower-severity DRG. Unlike the other
systems, all SOI Level 1 or 2 DRGs were monotonic and at least 20
percent more costly than the adjacent lower-severity DRG.
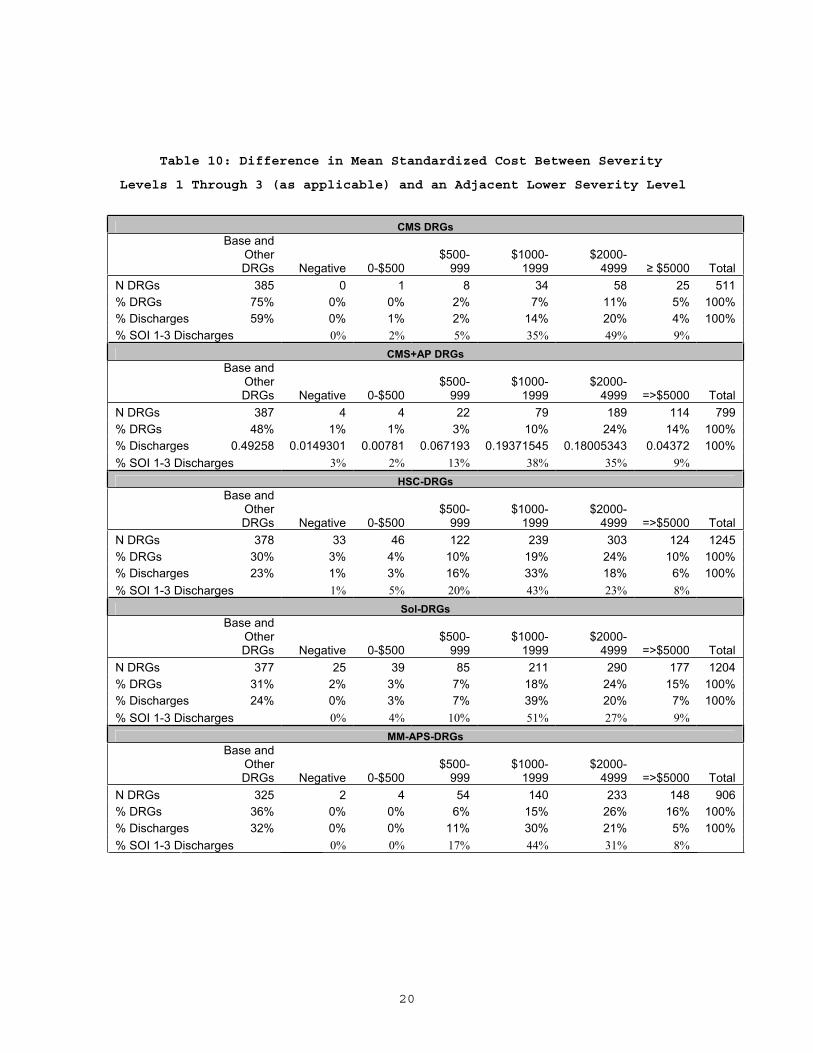
Table 10 shows the distribution of the absolute dollar differences
in the mean standardized costs between discharges assigned to DRG SOI
Levels 1 through 3 (as applicable) and those assigned to the adjacent
lower severity level in the same base DRG. Consistent with Table 9, the
discharge counts are based on the discharges assigned to the DRG with
the higher severity level in the comparison. Of the discharges assigned
to the MS-DRGs SOI Levels 1 and 2, 58 percent were assigned to DRGs that
were at least $2,000 more costly than the adjacent lower severity level.
This is a higher percentage than any other severity-adjusted DRG system.
19
Table 9: Ratio of the Mean Standardized Cost of a Higher Severity Level to That of the Adjacent Lower Severity Level Within the Same Base DRG
Level 0 DRGs Other DRGs Total
<1.0 1.0 to 1.1 1.1 to 1.2 1.2 to 1.3 > 1.3N DRGs 358 0 0 1 7 118 27 511% DRGs 70% 0% 0% 0% 1% 23% 5% 100%% Discharg 56% 0% 0% 1% 2% 39% 2% 100%% SOI 1-3 Discharges 0% 0% 2% 4% 94%
Level 0 DRGs <1.0 1.0 to 1.1 1.1 to 1.2 1.2 to 1.3 > 1.3 Other DRGs TotalN DRGs 358 4 0 12 30 366 29 799% DRGs 45% 1% 0% 2% 4% 46% 3% 100%% Discharg 48% 1% 0% 2% 8% 39% 1% 100%% SOI 1-3 Discharges 3% 0% 4% 16% 77%
Level 0 DRGs <1.0 1.0 to 1.1 1.1 to 1.2 1.2 to 1.3 > 1.3 Other DRGs TotalN DRGs 373 33 53 101 144 536 5 1245% DRGs 30% 3% 3% 8% 12% 43% 0% 100%% All Disch 23% 1% 4% 8% 13% 52% 0% 100%% SOI 1-3 Discharges 1% 6% 10% 17% 67%
Level 0 DRGs <1.0 1.0 to 1.1 1.1 to 1.2 1.2 to 1.3 > 1.3 Other DRGs TotalN DRGs 368 25 47 77 114 564 9 1204% DRGs 31% 2% 4% 6% 9% 47% 1% 100%% Discharg 24% 0% 3% 5% 10% 58% 0% 100%% SOI 1-3 Discharges 0% 4% 7% 13% 76%
Level 0 DRGs <1.0 1.0 to 1.1 1.1 to 1.2 1.2 to 1.3 > 1.3 Other DRGs TotalN DRGs 325 2 6 30 70 473 0 906% DRGs 36% 0% 1% 3% 8% 52% 0% 100%% Discharg 32% 0% 2% 4% 11% 51% 0% 100%% SOI 1-3 Discharges 0% 3% 6% 16% 75%
Level 0 DRGs <1.0 1.0 to 1.1 1.1 to 1.2 1.2 to 1.3 > 1.3 Other DRGs TotalN DRGs 261 3 7 39 81 642 11 1044% DRGs 25% 0% 1% 4% 8% 61% 1% 100%% Discharg 20% 0% 1% 8% 16% 54% 1% 100%% SOI 1-3 Discharges 0% 2% 10% 20% 69%
Level 0 DRGs <1.0 1.0 to 1.1 1.1 to 1.2 1.2 to 1.3 > 1.3 Other DRGs TotalN DRGs 325 0 0 1 22 388 736% DRGs 44% 0% 0% 0% 3% 53% 0% 100%% Discharg 60% 0% 0% 0% 4% 36% 0% 100%% SOI 1-3 Discharges 0% 0% 0% 9% 91%
Con-APR-DRGs
DRGs with Severity Level 1-3 (as applicable)CMS DRGs
MS-DRGs
CMS+AP DRGs
HSC-DRGs
Sol-DRGs
MM-APS-DRGs
20
Table 10: Difference in Mean Standardized Cost Between Severity
Levels 1 Through 3 (as applicable) and an Adjacent Lower Severity Level
CMS DRGs Base and
OtherDRGs Negative 0-$500
$500-999
$1000-1999
$2000-4999 $5000 Total
N DRGs 385 0 1 8 34 58 25 511 % DRGs 75% 0% 0% 2% 7% 11% 5% 100% % Discharges 59% 0% 1% 2% 14% 20% 4% 100% % SOI 1-3 Discharges 0% 2% 5% 35% 49% 9%
CMS+AP DRGs Base and
OtherDRGs Negative 0-$500
$500-999
$1000-1999
$2000-4999 =>$5000 Total
N DRGs 387 4 4 22 79 189 114 799 % DRGs 48% 1% 1% 3% 10% 24% 14% 100% % Discharges 0.49258 0.0149301 0.00781 0.067193 0.19371545 0.18005343 0.04372 100% % SOI 1-3 Discharges 3% 2% 13% 38% 35% 9%
HSC-DRGs Base and
OtherDRGs Negative 0-$500
$500-999
$1000-1999
$2000-4999 =>$5000 Total
N DRGs 378 33 46 122 239 303 124 1245 % DRGs 30% 3% 4% 10% 19% 24% 10% 100% % Discharges 23% 1% 3% 16% 33% 18% 6% 100% % SOI 1-3 Discharges 1% 5% 20% 43% 23% 8%
Sol-DRGs Base and
OtherDRGs Negative 0-$500
$500-999
$1000-1999
$2000-4999 =>$5000 Total
N DRGs 377 25 39 85 211 290 177 1204 % DRGs 31% 2% 3% 7% 18% 24% 15% 100% % Discharges 24% 0% 3% 7% 39% 20% 7% 100% % SOI 1-3 Discharges 0% 4% 10% 51% 27% 9%
MM-APS-DRGs Base and
OtherDRGs Negative 0-$500
$500-999
$1000-1999
$2000-4999 =>$5000 Total
N DRGs 325 2 4 54 140 233 148 906 % DRGs 36% 0% 0% 6% 15% 26% 16% 100% % Discharges 32% 0% 0% 11% 30% 21% 5% 100% % SOI 1-3 Discharges 0% 0% 17% 44% 31% 8%
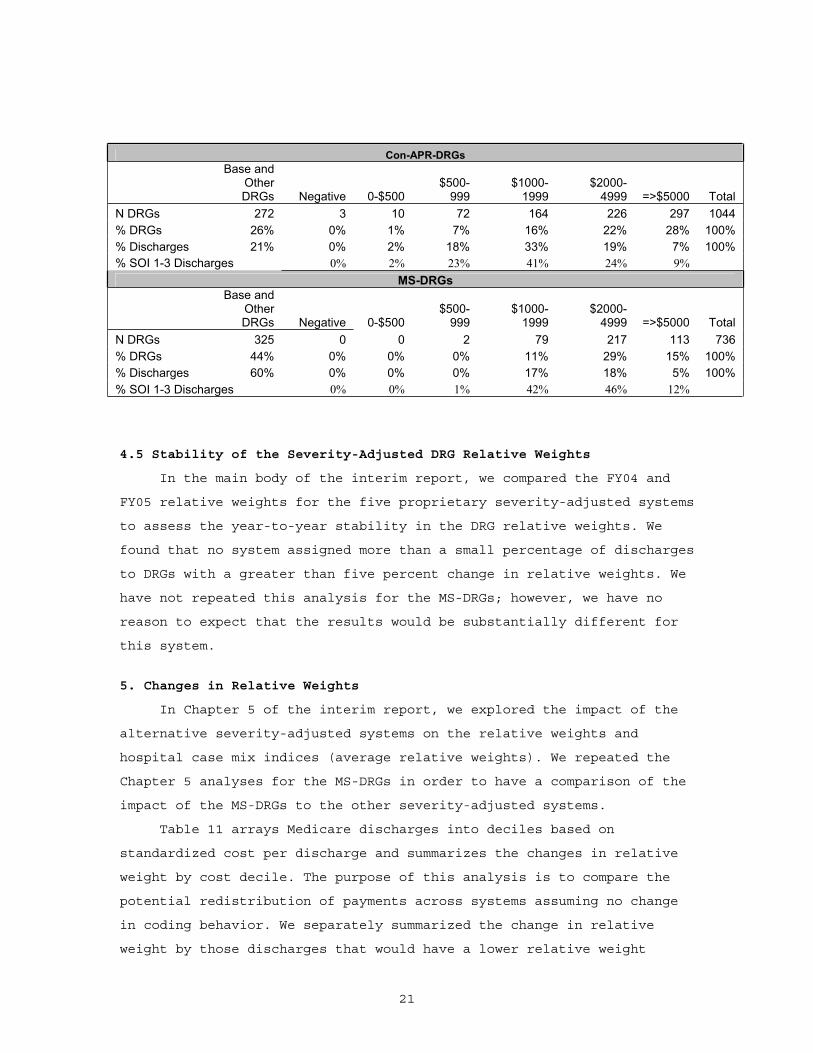
21
Con-APR-DRGs Base and
OtherDRGs Negative 0-$500
$500-999
$1000-1999
$2000-4999 =>$5000 Total
N DRGs 272 3 10 72 164 226 297 1044 % DRGs 26% 0% 1% 7% 16% 22% 28% 100% % Discharges 21% 0% 2% 18% 33% 19% 7% 100% % SOI 1-3 Discharges 0% 2% 23% 41% 24% 9%
MS-DRGsBase and
OtherDRGs Negative 0-$500
$500-999
$1000-1999
$2000-4999 =>$5000 Total
N DRGs 325 0 0 2 79 217 113 736 % DRGs 44% 0% 0% 0% 11% 29% 15% 100% % Discharges 60% 0% 0% 0% 17% 18% 5% 100% % SOI 1-3 Discharges 0% 0% 1% 42% 46% 12%
4.5 Stability of the Severity-Adjusted DRG Relative Weights
In the main body of the interim report, we compared the FY04 and
FY05 relative weights for the five proprietary severity-adjusted systems
to assess the year-to-year stability in the DRG relative weights. We
found that no system assigned more than a small percentage of discharges
to DRGs with a greater than five percent change in relative weights. We
have not repeated this analysis for the MS-DRGs; however, we have no
reason to expect that the results would be substantially different for
this system.
5. Changes in Relative Weights
In Chapter 5 of the interim report, we explored the impact of the
alternative severity-adjusted systems on the relative weights and
hospital case mix indices (average relative weights). We repeated the
Chapter 5 analyses for the MS-DRGs in order to have a comparison of the
impact of the MS-DRGs to the other severity-adjusted systems.
Table 11 arrays Medicare discharges into deciles based on
standardized cost per discharge and summarizes the changes in relative
weight by cost decile. The purpose of this analysis is to compare the
potential redistribution of payments across systems assuming no change
in coding behavior. We separately summarized the change in relative
weight by those discharges that would have a lower relative weight
22
(losers) and those that would have a higher relative weight (gainers).
We estimated the impact on aggregate payments by multiplying the
estimated FY07 average payment per Medicare discharge5 by the mean gain
(or loss) in each decile and the number of discharges that were gainers
(or losers). The result provides a rough estimate of the payment impact
when the hospital payment factors and outliers are comparable across the
cost deciles. Because case mix is positively correlated with IME, DSH
and outlier payments, it is likely that the amount of redistribution is
understated but the relative relationships across the severity-adjusted
DRG systems should be the same.
Each severity-adjusted DRG system improves payment accuracy by
redistributing payment from lower-cost discharges to higher-cost
discharges.6 For example, in the MS-DRG system, there is an estimated
net loss of more than $334 million in Decile 1 and more than a $1.4
billion estimated net increase in payments for discharges in Decile 10.
The total payment redistribution from the losers to the gainers is $9.7
billion, or 8.4 percent of the total payment. The redistribution is less
than the Con-APR-DRG system, the same as the HSC-DRG system, and more
than in the other systems even though some of these systems have higher
explanatory power.
5 We used $9,601 as our estimated average FY07 PPS payment. This figure is based on the impact statement published in the FY07 PPS final rule, which estimated that the average per-discharge payments for operating costs and capital costs were $8,830 and $771, respectively.
6 The net gains do not equal the net losses because a slightly different set of providers were used to develop the relative weights.

23
Table 11: Changes in Relative Weights, by Cost Deciles of Discharges
CMS+AP-DRG
N losers %
Change$ Impact
(Millions) N Gainers%
Change$ Impact
(Millions) N losers %
Change$ Impact
(Millions) N Gainers%
Change$ Impact
(Millions)1 828,633 -11.21 -$549 362,549 13.68 $249 822,329 -16.42 -$803 369,797 13.34 $2442 857,947 -11.51 -$617 343,163 16.81 $325 817,112 -15.40 -$797 384,412 17.06 $3623 855,227 -11.77 -$660 349,595 18.30 $394 804,686 -15.13 -$813 400,351 19.31 $4624 840,558 -12.04 -$703 366,339 19.24 $472 789,729 -14.95 -$837 417,311 21.09 $5685 825,750 -12.21 -$758 382,521 20.17 $565 775,205 -14.68 -$872 433,131 22.69 $6966 810,343 -11.93 -$815 399,265 21.07 $679 758,051 -14.10 -$914 451,508 23.87 $8537 806,186 -11.03 -$866 404,490 22.18 $810 742,954 -13.17 -$957 467,602 24.18 $1,0238 795,886 -10.41 -$925 415,594 22.86 $983 712,968 -12.66 -$1,005 498,384 23.60 $1,2369 741,641 -10.72 -$1,048 470,339 22.64 $1,338 644,836 -13.40 -$1,147 567,091 22.65 $1,613
10 550,104 -11.76 -$1,277 662,156 15.55 $2,413 489,245 -15.56 -$1,550 723,051 16.16 $2,652Payment Redistribution -$8,218 $8,225 -$9,694 $9,709
-7.1% 7.1% -8.4% 8.4%
N losers %
Change$ Impact
(Millions) N Gainers%
Change$ Impact
(Millions) N losers %
Change$ Impact
(Millions) N Gainers%
Change$ Impact
(Millions)1 738,767 -13.58 -$623 452,616 8.04 $171 781,620 -13.93 -$662 410,618 13.58 $2682 757,894 -12.17 -$606 443,205 10.48 $242 801,741 -13.57 -$704 399,957 15.80 $3333 759,591 -11.93 -$624 445,186 12.31 $311 802,725 -13.45 -$735 402,511 17.30 $3974 753,690 -11.97 -$655 453,151 14.03 $395 795,854 -13.42 -$771 411,378 18.56 $4735 745,211 -12.12 -$702 463,017 15.63 $502 787,309 -13.41 -$824 421,234 19.81 $5676 729,538 -12.26 -$764 479,964 17.08 $652 775,285 -13.23 -$890 434,479 20.75 $6907 713,598 -12.16 -$839 496,928 18.18 $835 758,853 -12.77 -$958 451,866 20.86 $8348 688,489 -12.22 -$925 522,830 19.23 $1,079 728,537 -12.58 -$1,032 482,941 20.86 $1,0389 636,296 -13.37 -$1,112 575,571 20.56 $1,513 673,445 -12.90 -$1,161 538,511 21.94 $1,466
10 519,662 -15.30 -$1,614 692,601 17.51 $2,771 530,441 -12.64 -$1,318 681,756 18.85 $3,006Payment Redistribution -$8,464 $8,474 -$9,055 $9,073% of Payments -7.3% 7.3% -7.8% 7.8%
N losers %
Change$ Impact
(Millions) N Gainers%
Change$ Impact
(Millions) N losers %
Change$ Impact
(Millions) N Gainers%
Change$ Impact
(Millions)1 824,179 -18.81 -$907 368,985 20.31 $388 676,544 -16.98 -$712 514,960 14.98 $3792 801,229 -19.05 -$961 400,927 21.71 $489 696,588 -17.18 -$782 504,912 15.59 $4283 774,654 -19.41 -$1,005 430,929 22.53 $583 691,122 -17.35 -$821 514,033 16.12 $4884 746,332 -19.83 -$1,060 461,106 23.47 $693 678,431 -17.46 -$860 528,758 16.75 $5655 717,822 -20.23 -$1,137 490,818 24.53 $831 666,923 -17.34 -$910 541,581 17.60 $6626 688,466 -20.15 -$1,227 521,320 25.33 $1,005 657,572 -16.56 -$963 552,177 18.75 $7957 658,400 -19.39 -$1,307 552,282 25.57 $1,216 660,777 -14.94 -$1,008 549,958 19.79 $9408 626,685 -18.89 -$1,411 584,713 26.48 $1,514 665,086 -13.75 -$1,073 546,402 21.07 $1,1339 590,010 -18.85 -$1,633 621,802 30.62 $2,149 636,426 -13.76 -$1,214 575,563 22.32 $1,530
10 537,096 -21.66 -$3,174 675,055 42.48 $4,978 504,129 -13.75 -$1,428 708,099 17.92 $2,865Payment Redistribution -$13,821 $13,845 -$9,771 $9,785% of Payments -11.9% 11.9% -8.4% 8.4%
Decile
Con-APR-DRGs MS-DRGs
Decile
HSC-DRG
% of Payments
Decile
Sol-DRG MM-APS-DRG
24
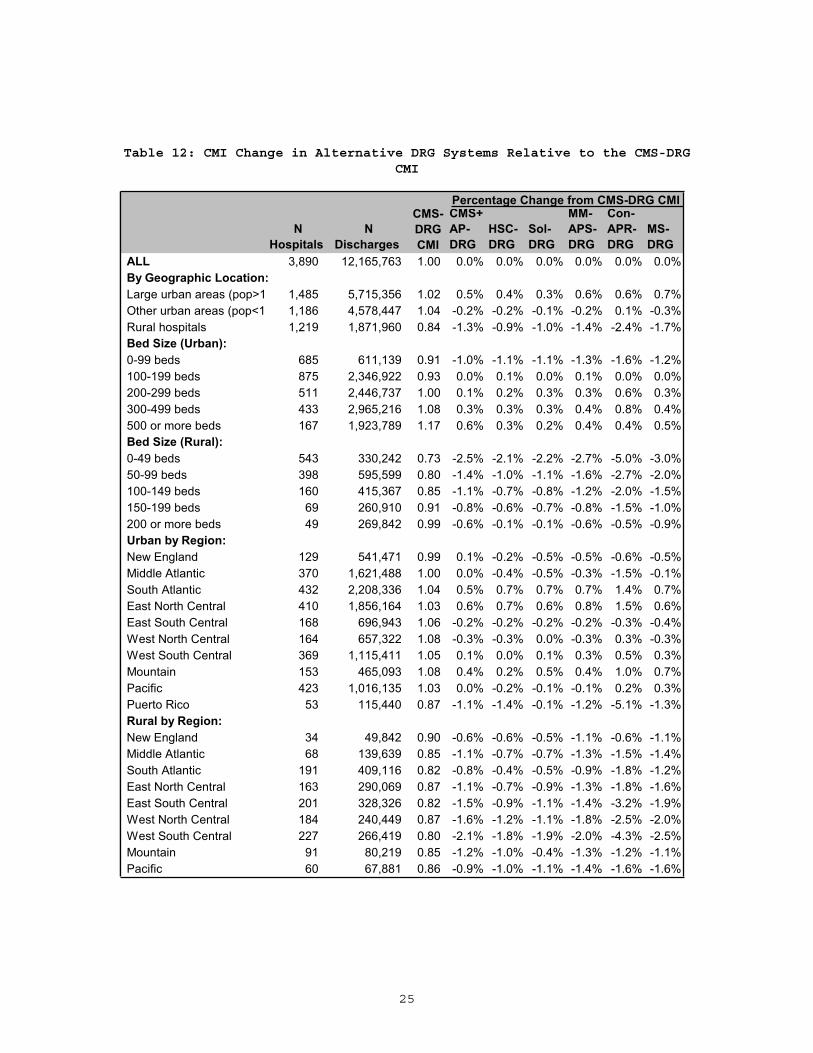
Changes in the Case-Mix Index
Table 12 compares the CMI for categories of hospitals across the
DRG systems studied, assuming no behavioral changes in coding practices
or types of patients. On average, the CMI for urban hospitals increases
under the severity-adjusted systems, and that for rural hospitals
decreases. The change is greatest in the Con-APR DRGs, where the CMI for
rural hospitals is 2.4 percent lower than that under the CMS-DRGs. The
CMI for large urban hospitals (those located in metropolitan areas with
more than 1 million population) and other urban hospitals is 0.6 and 0.1
percent higher, respectively, under the Con-APR-DRGs. Under the MS-DRGs,
there is a slightly larger increase in the average CMI for large urban
hospitals (0.7 percent), a reduction in the CMI for other urban
hospitals (-0.3 percent), and a smaller reduction for rural hospitals
(-1.7%).
Consistent with the other severity-adjusted systems, the MS-DRG
system would reduce the CMI for smaller hospitals and increase the CMI
for larger hospitals. Larger hospitals tend to have more complex and
severely ill patients than smaller hospitals do. Teaching hospitals also
tend to treat more complex cases. The CMI for non-teaching hospitals
under the MS-DRGs would be lower(-0.4 percent) and the CMI for major
teaching hospitals would increase more (0.6 percent)than the CMI for
hospitals with small teaching programs (0.2 percent). Other than the
Con-APR-DRGs, the other severity-adjusted systems would have a similar
impact. Under the Con-APR-DRGs, the CMI for hospitals with large
teaching programs would be about the same, but that for hospitals with
smaller teaching programs would increase 0.7 percent relative to the
CMS-DRGs.
25
Table 12: CMI Change in Alternative DRG Systems Relative to the CMS-DRG CMI
N Hospitals
N Discharges
CMS+AP-DRG
HSC-DRG
Sol-DRG
MM-APS-DRG
Con-APR-DRG
MS-DRG
ALL 3,890 12,165,763 1.00 0.0% 0.0% 0.0% 0.0% 0.0% 0.0%By Geographic Location:Large urban areas (pop>1 1,485 5,715,356 1.02 0.5% 0.4% 0.3% 0.6% 0.6% 0.7%Other urban areas (pop<1 1,186 4,578,447 1.04 -0.2% -0.2% -0.1% -0.2% 0.1% -0.3%Rural hospitals 1,219 1,871,960 0.84 -1.3% -0.9% -1.0% -1.4% -2.4% -1.7%Bed Size (Urban):0-99 beds 685 611,139 0.91 -1.0% -1.1% -1.1% -1.3% -1.6% -1.2%100-199 beds 875 2,346,922 0.93 0.0% 0.1% 0.0% 0.1% 0.0% 0.0%200-299 beds 511 2,446,737 1.00 0.1% 0.2% 0.3% 0.3% 0.6% 0.3%300-499 beds 433 2,965,216 1.08 0.3% 0.3% 0.3% 0.4% 0.8% 0.4%500 or more beds 167 1,923,789 1.17 0.6% 0.3% 0.2% 0.4% 0.4% 0.5%Bed Size (Rural):0-49 beds 543 330,242 0.73 -2.5% -2.1% -2.2% -2.7% -5.0% -3.0%50-99 beds 398 595,599 0.80 -1.4% -1.0% -1.1% -1.6% -2.7% -2.0%100-149 beds 160 415,367 0.85 -1.1% -0.7% -0.8% -1.2% -2.0% -1.5%150-199 beds 69 260,910 0.91 -0.8% -0.6% -0.7% -0.8% -1.5% -1.0%200 or more beds 49 269,842 0.99 -0.6% -0.1% -0.1% -0.6% -0.5% -0.9%Urban by Region:New England 129 541,471 0.99 0.1% -0.2% -0.5% -0.5% -0.6% -0.5%Middle Atlantic 370 1,621,488 1.00 0.0% -0.4% -0.5% -0.3% -1.5% -0.1%South Atlantic 432 2,208,336 1.04 0.5% 0.7% 0.7% 0.7% 1.4% 0.7%East North Central 410 1,856,164 1.03 0.6% 0.7% 0.6% 0.8% 1.5% 0.6%East South Central 168 696,943 1.06 -0.2% -0.2% -0.2% -0.2% -0.3% -0.4%West North Central 164 657,322 1.08 -0.3% -0.3% 0.0% -0.3% 0.3% -0.3%West South Central 369 1,115,411 1.05 0.1% 0.0% 0.1% 0.3% 0.5% 0.3%Mountain 153 465,093 1.08 0.4% 0.2% 0.5% 0.4% 1.0% 0.7%Pacific 423 1,016,135 1.03 0.0% -0.2% -0.1% -0.1% 0.2% 0.3%Puerto Rico 53 115,440 0.87 -1.1% -1.4% -0.1% -1.2% -5.1% -1.3%Rural by Region:New England 34 49,842 0.90 -0.6% -0.6% -0.5% -1.1% -0.6% -1.1%Middle Atlantic 68 139,639 0.85 -1.1% -0.7% -0.7% -1.3% -1.5% -1.4%South Atlantic 191 409,116 0.82 -0.8% -0.4% -0.5% -0.9% -1.8% -1.2%East North Central 163 290,069 0.87 -1.1% -0.7% -0.9% -1.3% -1.8% -1.6%East South Central 201 328,326 0.82 -1.5% -0.9% -1.1% -1.4% -3.2% -1.9%West North Central 184 240,449 0.87 -1.6% -1.2% -1.1% -1.8% -2.5% -2.0%West South Central 227 266,419 0.80 -2.1% -1.8% -1.9% -2.0% -4.3% -2.5%Mountain 91 80,219 0.85 -1.2% -1.0% -0.4% -1.3% -1.2% -1.1%Pacific 60 67,881 0.86 -0.9% -1.0% -1.1% -1.4% -1.6% -1.6%
CMS-DRGCMI
Percentage Change from CMS-DRG CMI
26
N Hospitals
N Discharges
CMS+AP-DRG
HSC-DRG
Sol-DRG
MM-APS-DRG
Con-APR-DRG
MS-DRG
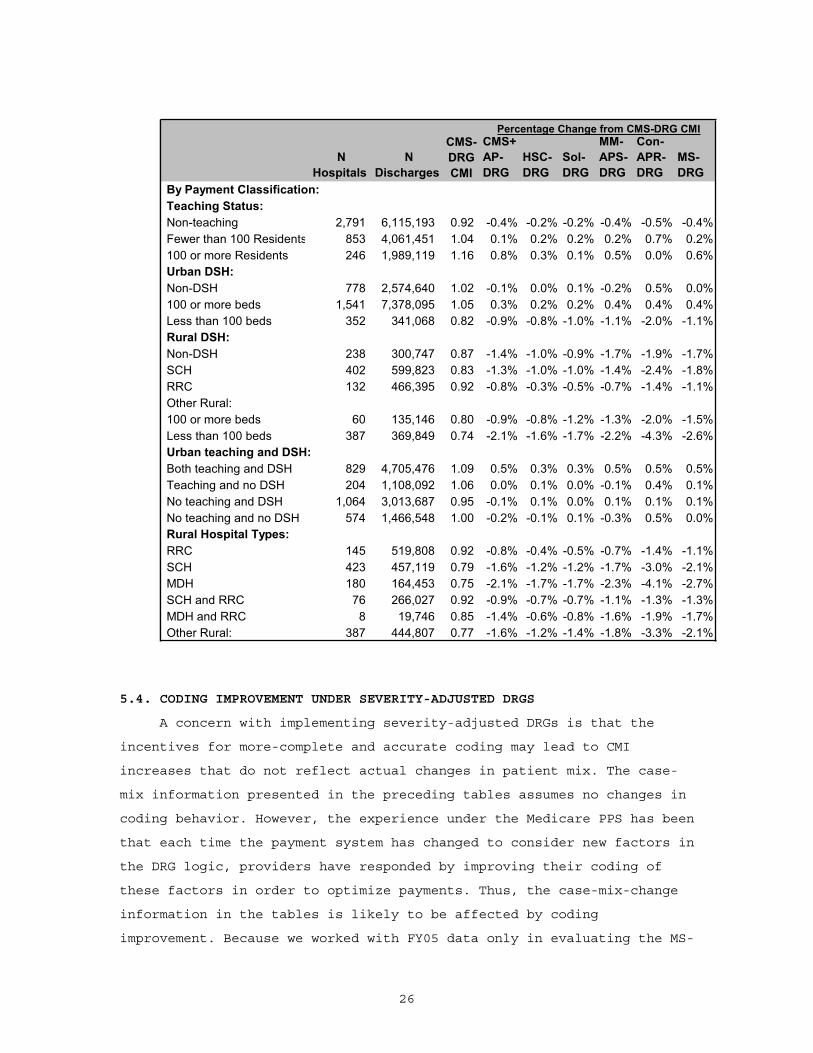
By Payment Classification:Teaching Status:Non-teaching 2,791 6,115,193 0.92 -0.4% -0.2% -0.2% -0.4% -0.5% -0.4%Fewer than 100 Residents 853 4,061,451 1.04 0.1% 0.2% 0.2% 0.2% 0.7% 0.2%100 or more Residents 246 1,989,119 1.16 0.8% 0.3% 0.1% 0.5% 0.0% 0.6%Urban DSH:Non-DSH 778 2,574,640 1.02 -0.1% 0.0% 0.1% -0.2% 0.5% 0.0%100 or more beds 1,541 7,378,095 1.05 0.3% 0.2% 0.2% 0.4% 0.4% 0.4%Less than 100 beds 352 341,068 0.82 -0.9% -0.8% -1.0% -1.1% -2.0% -1.1%Rural DSH: Non-DSH 238 300,747 0.87 -1.4% -1.0% -0.9% -1.7% -1.9% -1.7%SCH 402 599,823 0.83 -1.3% -1.0% -1.0% -1.4% -2.4% -1.8%RRC 132 466,395 0.92 -0.8% -0.3% -0.5% -0.7% -1.4% -1.1%Other Rural:100 or more beds 60 135,146 0.80 -0.9% -0.8% -1.2% -1.3% -2.0% -1.5%Less than 100 beds 387 369,849 0.74 -2.1% -1.6% -1.7% -2.2% -4.3% -2.6%Urban teaching and DSH:Both teaching and DSH 829 4,705,476 1.09 0.5% 0.3% 0.3% 0.5% 0.5% 0.5%Teaching and no DSH 204 1,108,092 1.06 0.0% 0.1% 0.0% -0.1% 0.4% 0.1%No teaching and DSH 1,064 3,013,687 0.95 -0.1% 0.1% 0.0% 0.1% 0.1% 0.1%No teaching and no DSH 574 1,466,548 1.00 -0.2% -0.1% 0.1% -0.3% 0.5% 0.0%Rural Hospital Types:RRC 145 519,808 0.92 -0.8% -0.4% -0.5% -0.7% -1.4% -1.1%SCH 423 457,119 0.79 -1.6% -1.2% -1.2% -1.7% -3.0% -2.1%MDH 180 164,453 0.75 -2.1% -1.7% -1.7% -2.3% -4.1% -2.7%SCH and RRC 76 266,027 0.92 -0.9% -0.7% -0.7% -1.1% -1.3% -1.3%MDH and RRC 8 19,746 0.85 -1.4% -0.6% -0.8% -1.6% -1.9% -1.7%Other Rural: 387 444,807 0.77 -1.6% -1.2% -1.4% -1.8% -3.3% -2.1%
CMS-DRGCMI
Percentage Change from CMS-DRG CMI
5.4. CODING IMPROVEMENT UNDER SEVERITY-ADJUSTED DRGS
A concern with implementing severity-adjusted DRGs is that the
incentives for more-complete and accurate coding may lead to CMI
increases that do not reflect actual changes in patient mix. The case-
mix information presented in the preceding tables assumes no changes in
coding behavior. However, the experience under the Medicare PPS has been
that each time the payment system has changed to consider new factors in
the DRG logic, providers have responded by improving their coding of
these factors in order to optimize payments. Thus, the case-mix-change
information in the tables is likely to be affected by coding
improvement. Because we worked with FY05 data only in evaluating the MS-
27
DRGs, we do not repeat using the MS-DRGs the analysis in Chapter 5 of
the interim report on case mix change. The reader is referred to the
FY08 proposed rule for a detailed analysis by CMS and 3M/HIS concerning
the likely impact of introducing the MS-DRGs.
6. OTHER ISSUES
6.1 How Understandable Are the Severity-Adjusted DRGs?
The DRG grouping logic should be understandable to clinicians and
others desiring to use the system for benchmarking and other activities
related to assessing the cost and quality of care. Features of the
grouping logic that make the classification system easier to understand
include:
Uniform rules for assignments to MDCs, DRGs, and severity levels.
The MS-DRG classification logic relies on uniform hierarchical
rules for assigning discharges to their respective MDCs, base
DRGs, and severity levels. Except for the Con-APR-DRGs, the other
severity-adjusted systems also use uniform hierarchical rules for
DRG assignment based on the CMS-DRGs.
Standard DRG severity levels. The underlying logic of the MS-DRG
system uses standard severity levels, but the criteria for
establishing severity subgroups results in severity levels that
vary by base DRG. Because the severity levels are often collapsed
and the resulting subgroups depend on the particular DRG, it is a
more complicated system to understand than those systems that
uniformly define subgroups, namely the HSC-DRGs, Sol-DRGs and
CMS+AP-DRGs. The MM-APS-DRGs and Con-APR-DRGs also collapse
severity levels to eliminate low-volume and monotonicity issues.
Standard severity-level assignments for diagnoses. The MS-DRG
system assigns a standard severity level to each CC (coupled with
a CC exclusions list). The CMS+AP DRGs and the MM-APS-DRGs also
use standard severity-level assignments. The remaining systems use
more complex logic that makes severity-level assignments by
categories of base DRGs or diagnoses.
28
A transition issue is how easily discharges can be cross-walked
between the current CMS-DRGs and the MS-DRGs. Although the MS-DRGs are
based on the CMS-DRGs, there are challenges in cross-walking discharges
between the two systems because of the revisions in the CC list and the
sequential renumbering of the DRGs. The revisions in the CC list mean
that it is not possible to crosswalk groups of discharges from paired
CMS-DRGs to the corresponding MS-DRG. Because a discharge that is
assigned to a CMS-DRG With CC cannot be assumed to crosswalk to the
corresponding MS-DRG With CC, the crosswalk must be done on discharge-
specific CCs. Further, crosswalking between collapsed MS-DRG subgroups
for no CC/With CC to the corresponding CMS-DRG cannot be done without
knowing the secondary diagnoses.
6.2 Does the Grouper Logic Reflect Current Patterns of Care?
DRG classification logic should be periodically reviewed and
updated to reflect changes in patient mix and patterns of care. The MS-
DRGs are the most updated of the severity-adjusted DRG systems. CMS
reviewed the CC list and severity-level assignments in developing the
MS-DRGs. The other CMS-based systems use CC lists and severity-level
assignments that are based on outdated analyses of the effect on a
condition on treatment costs from either the 1988 Yale study or the 1994
CMS refinement study. Further, the MS-DRGs incorporate recent
refinements in the CMS-DRGs to account for complexity as well as
severity. The APR-DRG system has not been reviewed for several years and
is not as current as the MS-DRG system.
6.3 Does the Public Have Access to the System Logic and Software?
The classification logic for the MS would be in the public domain
and, as is the case with the current CMS-DRGs, the source code, logic,
and documentation are available for purchase through the National
Technical Information Service. Each of the other severity-adjusted
systems evaluated in this report is maintained as a proprietary system,
although 3M/HIS has indicated that it would put the CMS+AP-DRGs in the
public domain should CMS decide to adopt that system.
29
6.4 What Are the Operational Implications of the System?
Two aspects of the severity-adjusted DRG system have the most
implications for administrative costs. First, increased emphasis on
complete coding is likely to lead to implementation costs for training
coders and ongoing costs for additional coding staff. Some hospitals
have been coding “efficiently,” that is, they have not been coding more
than necessary to assign the patient to the highest possible DRG. In
theory, “efficient” coding practices could continue under MS-DRGs and
the other systems that assign patients based on the highest severity
level of any CCs, but it would still require training to make to make
sure coders were sensitive to the severity-level assigned to various
CCs. Because of the revised CC list, more training may be needed for
the MS-DRGs than for the other CMS-based systems.
Systems modifications represent the second major category of costs
of implementing a severity-adjusted DRG system. These costs are likely
to be less expensive for the MS-DRGs. Most importantly, because the MS-
DRGs are in the public domain, there should be less disruption to
existing arrangements for acquiring and installing the grouper software
and integrating that software with other hospital systems. Also, because
the 3-digit numbering convention is retained, the more extensive systems
modifications required for the 4-digit systems (HSC-DRG and Sol-DRG) are
not an issue.
6.5. How Applicable Is Each System to Other Payers and Purposes?
The current CMS-DRGs are used by other payers and for benchmarking
and quality-assessment purposes. All else being equal, adopting a system
that can be used by other payers has considerable benefits. All five
proprietary severity-adjusted systems that we review in the interim
report were initially developed as all-payer systems. Two (HSC-DRG and
Sol-DRG) have retained their all-payer focus, while the others have
modified the all-payer structure to address low-volume Medicare DRGs and
reduce the total number of DRGs. Except for MDC 15 (Newborns) where the
current CMS DRGs were retained, the MS-DRGs also consolidate base DRGs,
eliminate the age splits, and collapse severity levels. This is likely
30
to diminish the utility of the MS-DRG system for other payers and for
quality assessment.
7. SUMMARY OF FINDINGS AND DISCUSSION
Each of the severity-adjusted DRG systems improves upon the
explanatory power of the CMS-DRGs. The MS-DRGs explain 43 percent of the
cost variation, which is a 9.1 percent improvement over the CMS-DRGs.
The explanatory power of the MS-DRGs is higher than the CMS+AP DRGs, but
lower than the other systems. This is also the predominate pattern at
the MDC level; however, the MS-DRGs have the lowest adjusted R-squared
values among the severity-adjusted systems in seven MDCs. In three of
these MDCs, the R-squared values are actually lower than under the
current CMS-DRGs: MDC 19 (Mental Diseases and Disorders), MDC 20
(Alcohol/Drug Use and Alcohol/Drug Induced Organic Mental Disorders) and
MDC 22(Burns). MDCs 19 and 20 have low explanatory power and the
reduction is minimal. However, there is a 4 percent reduction in the
explanatory power for MDC 22. This may be attributable to how the CMS-
DRGs were collapsed to form the base DRGs and warrants further
examination. The MS-DRGs have fewer DRGs (745) than any of the systems
other than CMS-DRGs and CMS+AP-DRGs. The lower explanatory power
relative to the systems with more DRGs reflects a tradeoff between
explanatory power and the criteria used to establish the severity-level
groupings, i.e., the minimum volume and cost differential requirements.
Using the FY05 MedPAR data and FY07 average payment rates, we
estimate that the MS-DRGs are likely to redistribute less Medicare
payments than the Con-APR-DRGs but more payments than the other systems.
Our analysis was based on FY05 MedPAR data and FY08 average payments per
discharge and assumed no changes in coding behavior. Readers are
referred to the CMS FY08 proposed rule for an analysis of estimated FY08
impact derived through a payment simulation that accounts for coding
improvement and the transition to cost-based relative weights as well as
implementation of the MS-DRGs.
As discussed in the interim report, the Con-APR-DRG system explains
more cost variation than the other systems but is also the most complex
and is likely to impose the highest implementation and ongoing costs.
31
Three CMS-based systems have higher explanatory power than the MS-DRGs:
the HSC-DRGs, MM-APS-DRGs, and the Sol-DRGs. The strengths and
weaknesses of these systems are discussed in the interim report. The MS-
DRGs have two important advantages over the other systems:
The CC list and severity-level assignments reflect current
Medicare data.
The classification logic is in the public domain and, as a result,
systems implementation and on-going costs are likely to be less
than with the other CMS-based systems.
Limitations
Our focus was on the overall performance of the MS-DRG system
relative to the five proprietary systems that we had evaluated in the
March 2006 report. We used the same general methodological approach and
the limitations noted in Chapter 6 of the interim report apply to our
evaluation of the MS-DRGs. Most importantly, we did not assess how
specific elements of the classification logic, such as the updating of
the CC list and the consolidation of severity levels within base DRGs,
affect clinical coherency and cost homogeneity. We used only the FY05
MedPAR file and, as a result, did not explore the stability of the MS-
DRGs or the likely impact of coding improvement on case mix change.
The FY08 proposed rule contains an impact analysis for the MS-DRGs
derived through payment simulation. This is a more precise methodology
than the methodology that we used in the report and we refer the reader
to the proposed rule for a better estimation of the impact of moving
from the CMS-DRGs to the MS-DRGs.
32
REFERENCES
Wynn, BO, MK Beckett, LH Hilborne, M Scott, B Bahney. Evaluation of Severity-Adjusted DRG Systems: Interim Report. RAND: Santa Monica, 2007. WR-434-CMS.
U.S. Department Of Health And Human Services (HHS), Centers for Medicare & Medicaid Services. “Medicare Program; Proposed Changes to the Hospital Inpatient Prospective Payment Systems and Fiscal Year 2008 Rates (CMS-1533-P)”, Federal Register Doc. 07–1920 of May 3, 2007(72 FR 24680).