Evaluation of several silicone, phenolic, and expoxy base ...
59
, _.- .,e -_ NASA TECHNICAL NOTE o* - z c 4 v3 e z SILICONE, PHENOLIC, AND E EVALUATION OF SEVERAL BASE HEAT-SHIELD MATERIALS AT VARIOUS HEAT-TRANSFER. RATES AND DYNAMIC PRESSURES by Andrew J. Chupmun LungZey Reseurcb Center Lungley Stution, Humpton, Vu. NASA TN D-3619 -- -- e. I NATIONAL AERONAUTICS AND SPACE ADMINISTRATION WASHINGTON, D. C. OCTOBER 1966 1 1 4
Transcript of Evaluation of several silicone, phenolic, and expoxy base ...

, _. -
.,e - _
NASA TECHNICAL NOTE
o* - z c 4 v3 e z
SILICONE, PHENOLIC, AND E EVALUATION OF SEVERAL
BASE HEAT-SHIELD MATERIALS AT VARIOUS HEAT-TRANSFER. RATES AND DYNAMIC PRESSURES
by Andrew J. Chupmun
LungZey Reseurcb Center Lungley Stution, Humpton, Vu.
N A S A TN D-3619 -- -- e . I
N A T I O N A L AERONAUTICS A N D SPACE A D M I N I S T R A T I O N WASHINGTON, D. C . O C T O B E R 1 9 6 6 1 1
4

EVALUATION OF SEVERAL SILICONE, PHENOLIC, AND EPOXY BASE
HEAT-SHIELD MATERIALS AT VARIOUS HEAT-TRANSFER RATES
AND DYNAMIC PRESSURES
By Andrew J. Chapman
Langley Resea rch Center Langley Station, Hampton, Va.
N A T I O N A L AERONAUTICS AND SPACE ADMINISTRATION
F a r s a l e by the C l e a r i n g h o u s e for F e d e r a l S c i e n t i f i c and T e c h n i c a l Information Spr ingf ie ld , V i r g i n i a 22151 - P r i c e $2.50
EVALUATION OF SEVERAL SILICONE, PHENOLIC, AND EPOXY BASE
HEAT-SHIELD MATERJALS AT VARIOUS HEAT-TRANSFER RATES
AND DYNAMIC PRESSURES
By Andrew J. Chapman Langley Research Center
SUMMARY
Three elastomeric ablative materials with a silicone resin base and three rigid ablators with an epoxy or phenolic resin base were tested in an electric-arc-heated gas stream. The materials were reinforced with a phenolic-glass-fiber honeycomb matrix. Seventy-one specimens, fabricated as 3-in-diameter (76 mm) flat-face disks, were exposed to a range of test stream conditions which included stagnation enthalpy from 1850 to 3370 Btu/lbm (4.3 to 7.8 MJ/kg), dynamic pressure f rom nearly 0 to 1000 lbf/ft2 (48 kN/m2), and heat-transfer ra te from 20 to 220 Btu/ft2-sec (0.23 to 2.5 MW/m2). A test stream of reduced oxygen concentration (3 percent oxygen and approximately 97 per- cent nitrogen) was used to simulate oxidation conditions in air at high enthalpy. The results presented include back-surface. temperature response, thickness of degraded and undegraded layers after testing, and photographs showing conditions of the materials after testing. The thermal shielding performance of the materials is compared. resin base elastomeric materials produced the highest performance in a range of condi- tions where heating rate was l e s s than 100 Btu/ft2-sec (1.14 MW/m2) and dynamic pres- sure was less than 50 lbf/ft2 (2.4 kN/m2). In a range of conditions where heating rate w a s greater than 150 Btu/fta-sec (1.7 MW/m2) and dynamic pressure w a s greater than 155 lbf/ft2 (7.4 kN/m2) a more rigid epoxy base material produced superior performance, whereas the performance of the elastomeric materials deteriorated.
Silicone
INTRODUCTION
An effective and practical method for reducing aerodynamic heating to the substruc- ture of a spacecraft entering a planetary atmosphere is the use of a charring ablative coating on the heated surfaces. Such materials dissipate heat by simultaneous processes of ablation and reradiation. A continuing ser ies of investigations has been in progress to further the understanding and to improve the performance of charring ablators. Among these investigations are references 1 and 2 which report the effect of varying composition

and density in a typical c lass of charring ablators and references 3 to 7 which report investigations of several materials at various environmental conditions.
The study of the effect of varying certain environmental parameters on the per- formance of charring ablators was continued in the present investigation. Two classes of charring ablators were considered: elastomeric formulations with a silicone resin base and more rigid formulations with a phenolic or epoxy resin base. A detailed inves- tigation of a typical material in each of these classes is reported in reference 3.. It was desired, however, to obtain performance data on several commercially available materials in each class which were under consideration for the heat shield for a manned reentry vehicle. The elastomeric material investigated in reference 3 and a Langley elastomeric formulation a re also included in this investigation.
A test environment was produced by an electric-arc -heated gas stream composed of approximately 97 percent nitrogen and 3 percent oxygen. The range of nominal stream conditions included stagnation enthalpy from 1850 to 3370 Btu/lbm (4.3 to 7.8 MJ/kg), heat-transfer rate from 20 to 220 Btu/ft2-sec (0.23 to 2.5 MW/m2), and dynamic pressure from nearly 0 to 1000 lbf/ft2 (48 kN/m2).
SYMBOLS
The units used for the physical quantities defined in this paper a r e given both in the U.S. Customary Units and in the International System of Units (SI) (ref. 8). The appendix presents factors relating these two systems of units.
A area, feet’ (meters21
C oxygen concentration
specific heat at constant pressure, British thermal units per pound mass-OR cP (joules per kilogram-OK)
d diameter, feet (meters)
E shielding effectiveness, British thermal units per pound mass (joules per kilogram)
F C compressibility factor
h enthalpy, British thermal units per pound mass (joules per kilogram)
2

m
P
Q
qaJ
4
T
AT
t
U
W
X
P
mass flow rate, pounds mass per second (kilograms per second)
pressure, pounds force per foot2
cold-wall heat load, British thermal units per foot' (joules per meter2)
dynamic pressure, pounds force per foot' (newtons per metera)
cold-wall stagnation-point heat-transfer rate (British thermal units per
(newtons per metera)
2 foot -second (watts per meter2)
temperature, OR (OK)
back-surface sensor temperature rise, OR (OK)
time, seconds
velocity, feet per second (meters per second)
mass distribution (unit mass) of test material, pounds mass per foot 2
(kilograms per metera)
thickness of layers or distance from original front surface (see fig. 8)
density, pounds mass per foot3 (kilograms per mete$)
Subscripts :
A atmospheric
a char surface position
C char layer
e external to boundary layer
f termination of exposure
i undegraded layer
3

m
0
P
S
t
A T
W
00
192
maximum
initial value
char-undegraded layer interface position
stagnation or front surface
total o r arc chamber
temperature rise
wall
free s t ream
stream conditions
HEAT-SHIELD SPECIMENS
Heat-Shield Materials
Six materials were tested in this investigation. Five of the materials were products of companies which have been active in the design of thermal protection systems while the remaining material was fabricated at the Langley Research Center. Three of the mate- rials had a silicone resin base and are elastomeric. The other materials had either a phenolic or epoxy resin base and are more rigid in nature than the elastomeric materials.
The materials are identified in table I by a code designation which is used hereafter throughout the paper. Known components are given for each material; however, the exact composition of the commercial materials was not available and the composition may vary from the information given in table I . The exact composition is given only for the Langley Research Center material E-1. All the materials were reinforced by a phenolic-glass- fiber honeycomb matrix. The honeycomb material had 3/16- to 1/4-in. (4.76 to 6.35 mm) hexagonal cells and a density of 4 to 9 lbm/ft3 (64 to 144 kg/m3),
Specimen Configuration and Instrumentation
Seventy-one ablative specimens were tested in this program. These specimens were 3-in-diameter (76 mm) disks with the thickness varied to give the mass per unit area for the particular test condition. The specimen assembly consisted of the test
4

material with a brass mounting ring and copper sensor bonded to the back surface as shown in figure 1. The back-surface sensor consisted of a 0.0625- or 0.125-in-thick (1.6 o r 3.2 mm) copper calorimeter and concentric guard ring with the thermocouples attached at the center of the back surface of the calorimeter. The temperature monitored at the center of the calorimeter is hereafter referred to as the back-surface temperature.
Some specimens which were tested at the more severe stream conditions were modified by the addition of an asbestos phenolic shroud which is also shown in figure 1. The shrouded specimens had a 3.15-in-diameter (80 mm) flat face and a 20' flared afterbody.
Specimens were mounted in a water-cooled sting which protected the back-surface sensor from heating in all directions except through the test material.
TEST CONDITIONS AND PROCEDURE
The 2500-kilowatt a rc jet at the Langley Research Center w a s used for this inves- tigation. Descriptions of this facility are given in references 9 to 11. Nominal values of test stream conditions a r e given in table II. Each condition is identified by a letter from A to G and a symbol which is used in the text and in the figures, respectively. For con- venience, conditions A, B, and C a re referred to as moderate test conditions, D and E as severe conditions, and F and G as intermediate tes t conditions. Specimens of each mate- rial were tested at conditions A to E. Two of the materials were also tested at interme- diate conditions F and G.
The test stream enthalpy and dynamic pressure were obtained by adjusting the elec- tr ical power input to the arc and the stream mass flow rate. These conditions and also the ablation specimen stagnation-point heat-transfer rates were determined from calibra- tion tests.
Test Stream Composition
The test stream w a s a mixture of air and nitrogen with the flow rate of each gas regulated to provide a stream composition of 3 percent oxygen and approximately 97 per- cent nitrogen. This modification of stream composition from that of air w a s made to reduce the oxidizing effect of the low enthalpy tes t stream to match the oxidizing effect of air at high enthalpy values associated with reentry. In reference 4 the relation between enthalpy and oxygen concentration in two different s t reams having the same oxidizing effect is
'e72 (he - hw)2
.. .

From the relation, the oxidizing effect of the present test stream is equivalent to that of air with a stagnation enthalpy approximately 6- t imes greater than that of the test stream. 2
3
Dynamic Pressure
The dynamic pressure is
where the compressibility factor Fc is given in reference 11.
total pressure and atmospheric pressure: The pressure rise measured in the a rc chamber was the difference between stream
However, if the static pressure was assumed to be atmospheric,
then the dynamic pressure was approximately
- pc q, - F, (5)
The value of (50.8 mm) nozzle w a s used at high flow rates.
Fc was substantially different from 1 only when the 2-in-diameter
Enthalpy
Static enthalpy was determined from the arc-chamber pressure r i se by the method presented in reference 11. Stagnation enthalpy was then obtained from the charts of ref- erence 12 by assuming an isentropic compression from static conditions to stagnation conditions. For the test conditions at low pressure there was not a significant difference in the values of static and stagnation enthalpy. The difference in static and stagnation values was significant only for test conditions D and E.
Static enthalpy w a s obtained with the method of reference 11 for test conditions C to G . However, at test conditions A and B it w a s not possible to obtain an accurate measurement of arc-chamber pressure which is necessary in order to use this method. Consequently, static temperature measurements were obtained at test conditions A to E by the spectrometric method described in reference 13. Static enthalpy was then obtained for a pressure of p, = 1 atm (1 atm = 0.1013 MN/m2) from the charts of reference 12.
6

The enthalpy values obtained from spectrometric measurements are given in a separate column in table II. pressure-rise method of reference 11. A comparison of enthalpy values obtained by these two methods is also given in reference 11, and a similar result is noted.
These values are slightly higher than the values obtained from the
Heat-Transfer Rate
Heat-transfer rate was measured on the surface of a calorimeter having shape and dimensions identical to the ablation specimens. Two calorimeter shapes were used, one corresponding to the cylindrical specimen shape and the other corresponding to the trun- cated conical shape.
The temperature-rise rate was measured on the back surface of a 0.030-in-thick (0.8 mm) inconel sheet which constituted the front surface of the calorimeter model. Cold-wall heat-transfer rate was calculated from the temperature-rise rate and the thermophysical properties of inconel by the formula
dT P )d t
q = ( C px -
Test Procedure
The tests were performed in a manner similar to that described in references 3, 7, and 9. The a r c jet was operated for several minutes to allow stream conditions to sta- bilize. The calorimeter was then positioned in the s t ream momentarily to obtain a heat- transfer-rate measurement. The material specimen was positioned in the test s t ream upon removal of the calorimeter, and temperature rise on the back-surface sensor was recorded. When a back-surface temperature rise at AT = 600' R (333' K) was reached, the test was terminated. After the specimen was withdrawn from the stream, the back- surface temperature rise was recorded until a maximum value was reached and a decrease was noted. A second heat-transfer measurement was made immediately after removing the specimen from the stream.
Color motion pictures were taken of most tests. From these fi lms it was possible to observe the reaction of the model during exposure. Also, still photographs were made of each specimen after testing. The specimens were then coated with a thin layer of clear epoxy and sectioned on the diameter. Measurements of char-layer thickness and undegraded layer thickness of each specimen were made on the sectioned surface. The sectioned surface was then photographed.
7

RESULTS
The results of all tes t s a r e summarized in table III. This information includes the test conditions identified by the le t ters used in table 11 and the heating rate measured in each test. Specimen dimensions include the mass per unit area and thickness before testing and the thickness of the degraded char layer and the layer of undegraded material after testing. The back-surface temperature history is described by the exposure t imes at which temperature-rise values of 50' R (28' K), 100' R (56' K), 300' R (167' K), and 600' R (333' K) were indicated at the back-surface sensor. Back-surface temperature history is further described by the time and temperature at termination of exposure and the maximum temperature r i se and time at which it occurred after termination of expo- sure. In some tes t s the back-surface temperature r ise did not reach 600' R (333' K), the nominal value for termination of exposure. Such tes t s were usually terminated early because of equipment malfunction. The maximum back-surface temperature r ise is not given for most of the tests at severe conditions (conditions D and E). The temperature- r i se rate at termination of exposure at these conditions was extremely high as a result of material being completely removed from the sensor.
Appearance of Exposed Materials
Photographs of each material before and after testing a re shown in figures 2 to 7. Each part of the figures represents a particular material at one test condition and shows an oblique view of the surface before and after exposure, a complete view of the sec- tioned surface of the tested specimen, and an enlarged view of the sectioned surface. An outline of the original specimen shape is shown on the full section view so that shape changes as a result of exposure are evident. The enlarged cross-section view shows details of the residual material such as the characteristics of the char, the interface between the char layer and undegraded layer, when this existed, and the attachment of the residual material to the back-surface sensor and mounting ring.
Char Surface and Interface Positions
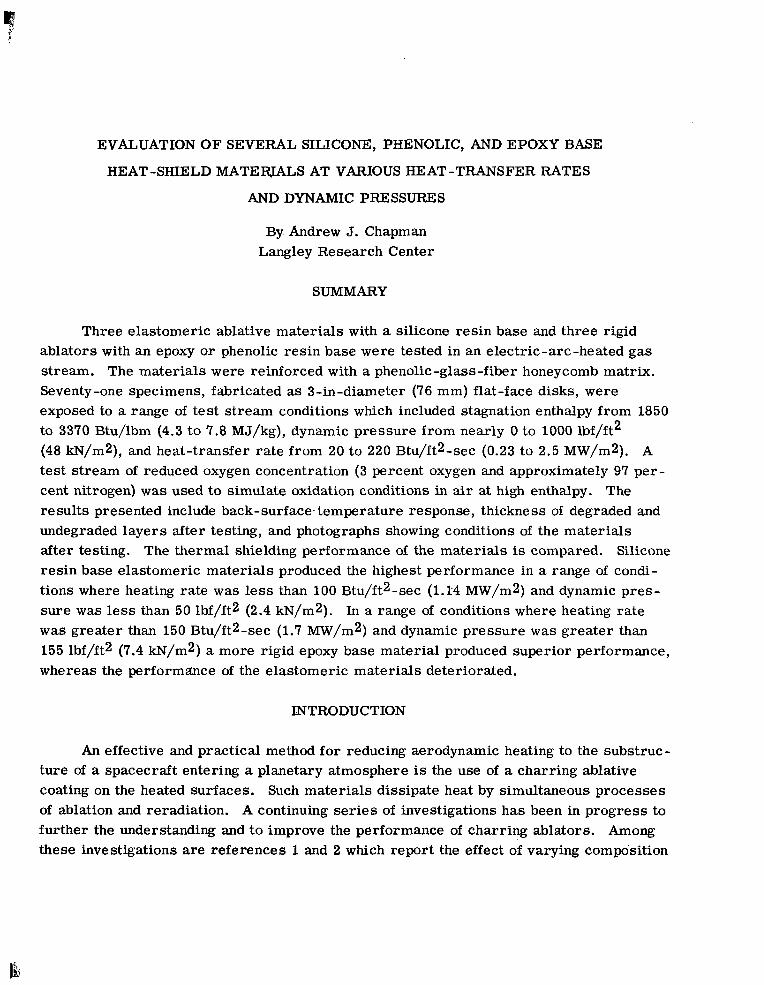
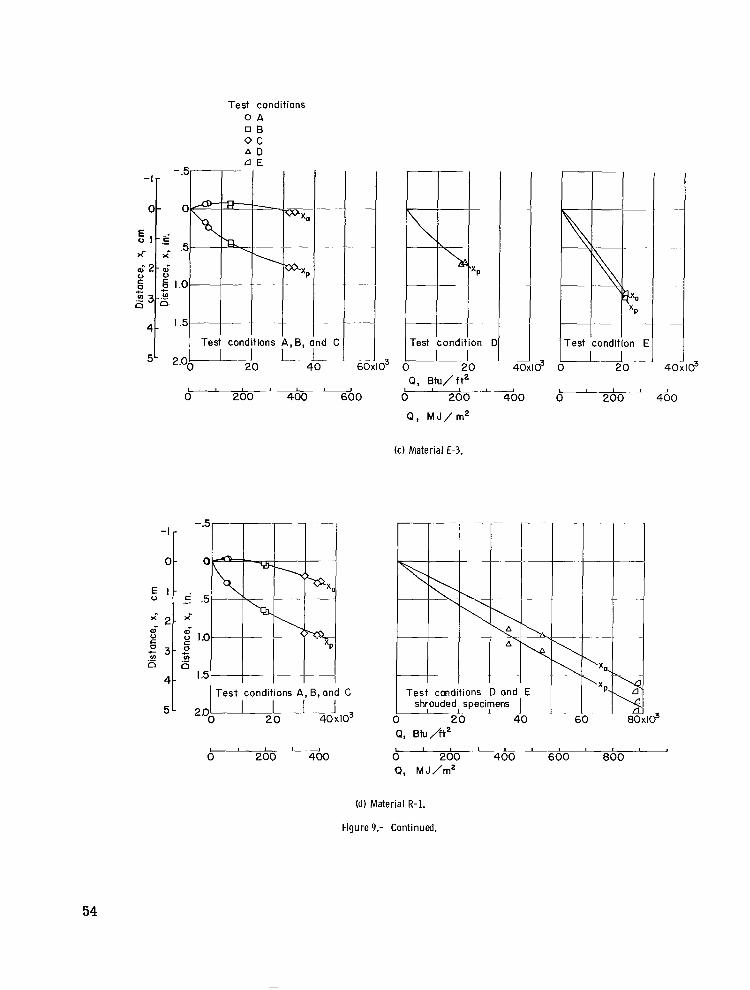
A cross-section diagram of the residual layers which may exist after degradation of a char-producing material is shown in figure 8. Coordinates which describe the posi- tion and thickness of these layers a re also shown. These positions were measured on the sectioned specimens at the center line referenced to the original specimen diameter. The thickness of the undegraded material layer xi and the thickness of the char layer xc a re given in table III for each test.
In figure 9 the distance from the original front surface of the specimen to the char layer surface xa and the distance from the original front surface to the char layer
8

undegraded material interface xp a re plotted against the total cold-wall heat load experienced by the specimens. The total stagnation-point heat load is the product of the cold-wall heating rate and the exposure time:
The zero of the distance scale in figure 9 represents the original front surface of the specimen. Values above the zero position represent swelling and values below this posi- tion represent recession.
DISCUSSION
Thermal Shielding Ef f ec tivne s s
A convenient parameter for evaluating thermal shielding performance is the cold- wal l heat input to a unit mass of material required to produce a given temperature rise at thchack-surface sensor. data in the following manner:
This shielding effectiveness is evaluated from experimental
it^^ E~~ = w
Effectiveness has been calculated for back-surface temperature-rise values of AT = 300' R (167' K) from information given in table 111 and is shown as a function of heat-transfer rate in figure 10.
Shielding effectiveness is actually a function of several stream conditions such as heat-transfer rate, dynamic pressure, and enthalpy. There is evidence that shielding effectiveness also var ies with unit mass. (See ref. 7.) It w a s difficult to separate the effect of each of these conditions since, in most cases, they varied simultaneously. The performance of each material must therefore be evaluated for the combined effect of all these parameters at each test condition. Although effectiveness of the six materials is plotted against cold-wall heating rate in figure 10, the values for other stream param- e t e r s at each test condition may be obtained from table II. The data points in figure 10 a r e identified by the symbols given in table II. given in table III.
The unit mass of each specimen is
Effectiveness of the elastomeric materials increased with increasing heat-transfer rate and dynamic pressure at the moderate tes t conditions (A, B, and C) where heat- transfer rate was l e s s than 100 Btu/ft2-sec (1.14 MW/m2) and dynamic pressure was less than 50 lbf/ft2 (2.4 kN/m2). As the severity of the test conditions increased, the unshrouded E-1 specimens at intermediate test conditions F and G showed a smooth
9

transition from increasing to decreasing effectiveness. (See fig. lO(a).) The data for material E-2, shown in figure lO(b), also show a smooth transition and correlate with data f rom reference 3 taken over a similar range of conditions. At condition E the shrouded E -2 specimens experienced a moderate decrease in performance which agrees with the continuous trend of the data from reference 3. The E-1 and E-3 specimens tested at conditions D and E were not modified with a shroud as were the other specimens tested at the severe conditions. experienced by these materials at the severe test conditions (figs. lO(a) and lO(c)) should not be compared with the performance of other materials in this range.
Therefore, the very abrupt decrease in performance
Shielding effectiveness of the rigid materials increased with increasing values of However, the rigid materials did s t ream parameters at the moderate test conditions.
not, in general, experience a decrease in performance at the severe test conditions. Instead, the trend of effectiveness values tended to level off and approach a constant value with increasing heating rate and dynamic pressure. Effectiveness values for material R-3 were not obtained at severe test condition E because of equipment malfunction; how- ever, the trend of these data suggests that the effectiveness of R-3 also approached a con- stant value.
Values of the effectiveness parameter in figure 10 can be compared as follows. Elastomeric material E-1 produced the highest values at moderate test conditions. In this range of conditions material E-2 ranked second whereas materials R-1 and R-2 ranked third. highest values of the effectiveness parameter.
In the severe range of test conditions materials R-1 and R-2 produced the
Shielding Performance and Condition of the Materials
In order to make a realistic evaluation of overall shielding performance, i t is nec- essary to compare the results indicated by the effectiveness parameter in figure 10 with the condition of the materials after exposure as shown in the photographs of figures 2 to 7, and the recession of the char surface and interface shown in figure 9.
At the moderate test conditions (A, B, and C) the materials which produced accept- able performance showed a symmetrical variation of thickness across the specimen diameter. Materials which showed poor performance at the moderate test conditions experienced varying degrees of uneven ablation. However, at the severe test conditions (D and E) all the materials tended to experience uneven ablation as a result of the com- bination of higher heating rate and dynamic pressure which produced high shear force at the edge of the specimen.
The first materials tested at the severe condition were the elastomeric E-1 speci- mens shown in figures 2(d) and 2(e) and the E-3 specimens shown in figures 4(d) and 4(e).
10

In these photographs, it is shown that large quantities of material were removed from the edge of the specimen in an uneven manner. It w a s believed that a specimen configu- ration which would resist the eroding shear force at the edge of the specimen and allow the material to ablate near the center of the disk would give a more realistic evaluation of thermal shielding performance. A shroud machined from molded asbestos phenolic w a s bonded to the circumference of the specimens used in subsequent tests at these con- ditions. (See fig. 1.) Most of these specimens continued to experience some uneven removal of material near the edge and in a few cases the shroud was lost near the end of the test.
At the moderate test conditions, the elastomeric materials formed comparatively strong and symmetrical char layers. Char surface positions xa were characterized by swelling and very slight recession while interface positions showed moderate reces- sion. The decrease in effectiveness of elastomeric materials in the severe range of conditions was accompanied by uneven removal of mate- rial over the specimen surface. In this range of conditions, char surface and interface recessions were higher and char layer thickness w a s smaller than for the moderate conditions.
xp (See figs. 9(a), 9(b), and s ( ~ ) . )
Rigid material R- 1, which produced intermediate values of effectiveness at moder - ate test conditions, also produced very strong char layers in this range of conditions although the char surface and interface recessions were somewhat greater than for elasto- meric materials (fig. 9(d)). In the severe range of test conditions, material R-1 produced the highest values of effectiveness, but like the elastomeric materials, experienced uneven removal of material over the specimen surface. of material R-1 were somewhat irregular in the severe range of test conditions.
Char surface and interface recessions
Rigid material R-2 produced effectiveness values comparable to those produced by material R-1 over the entire range of test conditions. However, the char produced by material R-2 w a s extremely fragile at all test conditions. The char surface and interface recession values at moderate test conditions were quite high (fig. 9(e)). At the severe test conditions, char surface and interface recessions were very high and were also irregular in that they did not follow a continuous trend with increasing heat load.
Rigid material R-3 produced comparatively low values of effectiveness over the entire range of test conditions. At moderate conditions the char layer w a s extremely fragile although char surface and interface recession formed a continuous trend with increasing heat load and the recession w a s moderate (fig. 9(f)). In the severe range of conditions the char actually appeared to be somewhat improved, probably as a result of the residual layer of unaffected material which supported the char.
11

The performance of all materials in the severe range of test conditions appeared to be marginal as a result of the uneven removal of material. This behavior may be at least partially attributed to the test configuration. The flat specimens mounted 90' to the test s t ream were designed to provide approximately one-dimensional heating for thermal per - formance evaluation. However, as explained previously, this arrangement resulted in shear force being concentrated at the edge of the specimen and the consequent uneven removal of material at this point. Further investigation with a configuration which pro- vides a more even distribution of force over the specimen surface may show that these materials give satisfactory performance at conditions more severe than the range of the present tests where performance was satisfactory.
CONCLUDING REMARKS
The thermal shielding performance of three ablative materials with a silicone resin base and three ablative materials with an epoxy or phenolic resin base has been investigated at varying tes t stream conditions in an electric-arc -heated gas stream com- posed of approximately 97 percent nitrogen and 3 percent oxygen. Stagnation enthalpy varied from 1850 to 3370 Btu/lbm (4.3 to 7.8 MJ/kg), dynamic pressure varied from approximately 0 to 1000 lbf/ft2 (48 kN/"2), and stagnation-point heat-transfer rate varied from 20 to 220 Btu/ft2-sec (0.23 to 2.5 MW/m2).
Silicone base materials produced the highest performance in a moderate range of conditions where the stagnation-point heat-transfer rate was less than 100 Btu/ft2-sec (1.14 MW/m2) and dynamic pressure w a s less than 50 lbf/ft2 (2.4 kN/m2). A formula- tion designated as "LRC ElB2" produced the highest performance in this range.
In a more severe range of conditions where the stagnation-point heat-transfer rate was greater than 150 Btu/ft2-sec (1.7 MW/m2) and dynamic pressure w a s greater than 155 lbf/ft2 (7.4 kN/m2), the performance of silicone materials deteriorated rapidly whereas the performance of phenolic and epoxy base materials continued to increase slightly. The material which produced the highest performance in this range of condi- tions was an epoxy silica composition in a phenolic-glass-fiber honeycomb matrix.
Langley Research Center, National Aeronautics and Space Administration,
Langley Station, Hampton, Va., April 18, 1966, 124-08-03-10-23.
12
I

APPENDIX
Prefix
CONVERSION OF U.S. CUSTOMARY UNITS TO SI UNITS
Multiple
The International System of Units (SI) w a s adopted in October 1960 by the Eleventh General Conference on Weights and Measures held in Paris, France. Conversion factors
mega (MI kilo (k) centi (c) milli (m)
required for units used herein a r e given in the following table:
lo6 103 10-2 10-3
Physical quantity
Length . . . . . . . . . Specific heat . . . . . . Enthalpy. . . . . . . . . Mass-flow rate . . . . . Pressure or stress . . . Heat load . . . . . . . . Heating rate . . . . . . Temperature . . . . . . M a s s per unit area . . . Density . . . . . . . . .
U.S. Customary Unit
c. Btu/lbm-OR Btu/lbm lbm/ft2 -sec lbf /f t Btu/ft2 Btu/ft2-sec OR = ( O F + 459.67) lbm/ft2 lbm/ft3
Conversion factor
(*I
0.3048
0.0254 4.18 x lo3 2.32 x 10³ 4.88 47.88 1.135 X lo4 1.135 X lo4 5/9 4.88 16.02
SI Unit
m
m J/kg -OK
kg/m2-sec N/m2 J/m2 W/m2 OK
kg/m2 kg/m3
J/kg
* Multiply value given in U.S. Customary Unit by conversion factor to obtain equivalent value in SI units.
13

REFERENCES
1. Peters, Roger W.; and Wadlin, Kenneth L.: The Effect of Resin Composition and Fillers on the Performance of a Molded Charring Ablator. NASA TN D-2024, 1963.
2. Swann, Robert T.; Brewer, William D.; and Clark, Ronald K.: Effect of Composition and Density on the Ablative Performance of Phenolic-Nylon. Paper presented at VIII Natl. Meeting of Am. SOC. Aerospace Mater. Process Engr. (San Francisco), May 25-28, 1965.
3. Clark, Ronald K.: Effect of Environmental Parameters on the Performance of Low- Density Silicone -Resin and Phenolic-Nylon Ablation Materials. NASA TN D-2543, 1965.
4. Swann, Robert T.; DOW, Marvin B.; and Tompkins, Stephen S.: Analysis of the Effects of Environmental Conditions on the Performance of Charring Ablators. AIAA Entry Technology Conference, CP-9, Am. Inst. Aeron. Astronaut., Oct. 1964, pp. 259-269.
5. Dow, Marvin B.; and Swann, Robert T.: Determination of Effects of Oxidation on Performance of Charring Ablators. NASA TR R-196, 1964.
6. Swann, Robert T.: Approximate Analysis of the Performance of Char-Forming Ablators. NASA TR R-195, 1964.
7. Chapman, Andrew J.: Effect of Weight, Density, and Heat Load on Thermal-Shielding Performance of Phenolic Nylon. NASA T N D-2196, 1964.
8. Mechtly, E. A.: The International System of Units - Physical Constants and Conversion Factors. NASA SP-7012, 1964.
9. Chapman, Andrew J.: An Experimental Evaluation of Three Types of Thermal Protection Materials at Moderate Heating Rates and High Total Heat Loads. NASA TN D-1814, 1963.
10. Scott, Samuel J.: Subsonic Aerodynamic Heat Transfer to a Surface Recessed Within a Forward Stagnation Region Slit. NASA TN D-2034, 1963.
11. Brown, Ronald D.; and Fowler, Bruce: Enthalpy Calculated From Pressure and Flow- Rate Measurements in High-Temperature Subsonic Streams. NASA TN D-3013, 1965.
12. Fowler, Bruce; and Brown, Ronald D.: Charts for Approximate Thermodynamic Properties of Nitrogen-Oxygen Mixtures. NASA SP-3017, 1965.
13. Greenshields, David H.: Spectrometric Measurements of Gas Temperatures in Arc- Heated Jets and Tunnels. NASA T N D-1960, 1963.
14

TABLE I.- TEST MATERIALS
[Ml materials were reinforced by a phenolic-glass-fiber honeycomb matrix which had 3 to 1 in. (4.76 to 6.35 mm)
hexagonal cel ls and a density of 4 to 9 lbm/ft3 (64 to 144 kg/m3d
16 4
Stream liameter
Name
E 1B2
Mass-flow rate per unit
a r e a +l/L
Composition
0.48
5.24
0.16
5.08
5.08
5.08
5.08
Specific gravity
0.67
0.19 0.92
.77 3.73
4.02 19.50
16.05 77.80
16.05 77.80
6.88 33.40
6.88 33.40
Material
E-1
E-2
E-3
R-1
R-2
R-3
Source
Langley Research Center Silicone resin 75% mass (Sylgard 182)
Silica microspheres (Eccospheres SI)
15% mass
Microballoons 10% mass (Made of BJO-0930 phenolic resin)
Silicone resin with additives 0.93 Dow Corning
General Electric Company
AVCO Corporation
325
ESM 1000
Avcoat 5026-39
0.79
0.61
0.71
1.38
Foamed silicone resin with additives
Epoxy resin Silica Phenolic Microballoons
Melamine resin Phenolic resin Phenolic microballoons Chopped quartz
Ling-Temco-Vought, Inc. Melamine phenolic
Inorganic salts Phenolic res in
Emerson Electric Manufacturing Company
Thermolag T-500
TABLE 11.- NOMINAL TEST CONDITIONS
Enthalpy
%agnation-poinl heat-transfer
rate, 9
Dynamic ?re ssure ,
9, Pressure - r ise
method Spectographic
method Test
condition Jower, kW
1100
1200
1650
1750
2300
1025
1700
hS ~~
E rt2
__ - _ _ _ 47
800
000
115
155
Btu f t l -sec
M w - m2
!E m2
--_ _ _ _ 2.25
8.30
7.88
5.50
7.42
n.
L2
6
4
2
2
2
2
Moderate
A 0
B O
c o
22
48
88
150
220
100
155
0.25
.54
1.00
1.70
2.50
1.13
1.76
3300 5.34 2300 5.3d
Z300 5.34 2300 5 . 3 ~
3600 6.03 2600 6.0:
Z950 6.84 3030 7.0:
3700 8.59 3850 8.91
- - - - - - - - - - - - - - _--- --- ---- ---
Severe
D A
E d
ntermedial
F O
G C I
15

TABLE III.- TEST RESULTS
tf
sec
342 322
429 429 210
459 534 520
155 112
91 151 121 71
539 531
253 251 235
(a) Material E-1
Back-surface temperature
ATf
OR OK
~~ ~ _ _ 615 342 614 341
614 341 621 345
95 53
650 361 612 340 632 351
I71 428 101 56
... _ _ _
... _ _ _ 0 0 0 0
632 351 609 338
852 473 625 347 354 197
-
Specimen dimensions
Mw m2
0.26 .24
.56
.57
.60
1.07 1.06
.94
2.01 1.93
2.86 2.24 2.22 2.60
1.14 1.11
1.76 1.83 1.76
_ - lbm &!% in, cm
- . - ft2 m2
1.06 5.17 0.31 0.79 1.06 5.17 .31 .79
2.14 10.44 .54 1.37 2.14 10.44 .54 1.37 3.00 14.64 .86 2.18
3.18 15.52 .92 2.34 3.19 15.57 .92 2.34 3.00 14.64 .87 2.21
4.26 20.79 1.23 3.12 4.26 20.79 1.23 3.12
6.32 30.84 1.82 4.62 6.32 30.84 1.82 4.62 3.00 14.64 .87 2.21 3.00 14.64 .87 2.21
3.00 14.64 .87 2.21 3.00 14.64 .88 2.23
3.00 14.64 .87 2.21 3.00 14.64 .88 2.23 3.00 14.64 .87 2.21
in.
0 0 0 0
0 0 0 0
.42
0 0 0 0 0 0
.52
. I4
1.00 .70 .20 .42
0 0 0 0
0 0 0 0 0 0
-
cm
1.07
1.32 1.88
2.54 1.78
.51
.42
__
Test mditior
After test Heat- I Before test transfer Maximum temwratur
3har layer thickness,
XC
rise
ATm
rate, ~ ~ a r ~ ~ Thickness l w l X o Exposure time, tAT, sec, for -
tm
sec -
391 347
494 482 430
540 607 597
.__
_..
__.
...
_..
.__
64 1 695
264 267 270
cm
- 0.89
.86
1.65 1.63 1.19
2.21 2.24 2.06
.38
.61
.05
.15
.38
.36
2.03 2.06
.36
.36
.4 1 __
O K
385 359
398 398
98
519 372 433
_..
_..
...
...
35 8
44 1 450
i38 110 283
in.
-
1.35 3 4
.65
.64
.47
.87
.88
.81
.15
.24
.02
.06
.I5
.14
.80
.81
.14
.14
.16
iT = 50' R (28' K
._
LT = 100' R (56' K
4T = 300' R (167' K
OR
693 646
717 717 117
934 670 780
_..
_ _ _ _ _ _ _ _ _ 63 15
794 a i 0
968 738 510
iT = 600' R (333' K
338 315
425 422 ..._
448 530 511
154 ....
86 150.5 ..._
_.._
530 530
248 250 _._.
220 226
336 317 _._.
357 438 403
153 __..
85.5 150 ..._
_...
444 451
232 234.5 231
68 67
125 115 144
82 163 176
152 -_._
8 3 149.6 _...
..._
297 315
199 220 198
_ _
(b) Mati
97 ...
183 190 _ _ _ 165 273 250
.__
...
...
_..
...
_.-
354 366
212 215 211
a.l E-2
A A
B B B C C C
D D
E E E E
F F
G G G
23 21
49 50 53
94 93 83
177 170
252 191 196 229
100 98
155 161 155
- - I I Specimen dimensions Back-surface temperature
Termination of Maximum temperature expasure 1 rise transfer I--. !
Jndegraded Exposure time, tAT, sec, for - layer
thichess , xi
-
tf
sec
223 250
374 361
416 426
206 308
278.3 275
Test :onditic
ATm
OK
375 372
387 409
471 483
__.
_..
_ _ _ _..
in.
0.04 .04
.06
.04
0 0
2 4 0
.12
.04
AT = 100' R (56O K
5 1 55
133 131
192 196
203 231
274 267
AT = 300' R (167' K
119 124
245 237
316 323
205 279
277 274
OR
676 670
696 737
847 870
_ _ _ _-- ...
.._
LT = 600' R (333' K
220 243
372 350
410 406
.__
306
278 275
- A A
B B
C C
D G
E E
0.10 37 .10 40
.15 102
.10 104
0 140 0 141
.61 201 0 205
.30 266
.10 252 _. . -
.16

AT = 50' R (28' K)
42 43
104 80
119 65
.__
.._
74 82
AT = 100' R (56' K)
58 59
139 121
111 131
.__
.._
_ _ _ .__
Btu tz-sec
23 23
51 53
86 86 80
132 171
231 226 219
-- MW m2
0.2f .26
.5€
.6(
.9t
.9€
.91
1.5( 1.94
2.61 2.5f 2.4E
TABLE m.- TEST RESULTS - Continued
(e) Material E-3
I I Specimen dimensions Back-surface t empera tu re
Terminat ion of Maximum temperature exposure rise
tAT, sec, fo r - mier test
Exposure t ime,
XC
sec
278 311
396 389
410 450
.__
_ _ _ _.-
.__
.-
OR Bt" t2-see
21 22
40 39
91 89
177 111
255 254
in.
0.24 .23
.53
.48
.I3
. I3
in. cm I_ AT = 300' R AT = 600' R (161' K) (333' K)
118 224 124 263
223 318 229 327 I
see OR OK
230 614 341 266 606 337
326 611 343 330 612 340
370 624 347 351 629 349
100 _ _ _ 108 _._
...
_ _ _ 86 .__ _ _ _ 84 _ _ _ __.
c m
0.61 .58
1.35 1.22
1.85 1.85
...
.._
_ _ _ i .15
693 684
760 142
819 922
0.08 0.20 .10 2 5
.06 .15
.01 .18
0 0 0 0
2 8 .I1 .33 .84
_ _ _ _..
.38 .97
0.24 1.06 5.17 0.26 0.66 2 5 1.06 5.17 2 6 .66
.46 2.11 10.30 .52 1.32
.44 2.11 10.30 .52 1.32
1.03 3.14 15.30 .I1 1.96 1.01 3.14 15.30 .I1 1.96
2.01 4.12 20.10 1.01 2.51 2.01 4.11 20.35 1.02 2.59
2.90 6.34 30.94 --- --- 2.89 6.26 30.55 1.54 3.91
212 251
364 347
99 101
...
.__
.._
...
_ _ _ .Of
(d) Mater ia l R - l
Back-surface temperature Specimen dimensions
After test .~ ~~
Before test
I Terminat ion of
exposure Iaximum temperatur i
r i s e
~-
Exposure t ime, tAT, sec, f o r - Tes t
,onditior
A A
B B
C C C
D D
E E E
4 sec
~
211 220
326 330
410 396 311
214 216
331 341 160
t -
OK
-
397 406
483 511
589 569 504
_ _ _ .._
.__
201 ... -
A
,T = 50' R (28' K
50 52
100 113
138 105 104
210 250
324 342 156
LT = l o O D R (56' K:
67 I O
146 154
205 116 154
21 1 264
332 _ _ _ 158
LT = 300' R (167' K)
122 128
249 255
340 328 301
213 214
336 .._
__.
sec OR & % ft2 ,2 in. c m
1.00 4.88 0.29 0.14 1.00 4.88 .28 . I1
rT = 600' R (333O K]
203 213
323 324
401 393 375
274 275
337 _ _ _ 159
244 258
386 395
465 443 451
...
...
_..
433 ...
114 131
870 919
1061 1024 908
..__
....
_.__
362 .__.
2.14 10.44 .64 1.63 2.14 10.44 .67 1.70
3.21 15.66 .97 2.46 3.21 15.66 .98 2.49 2.98 14.55 .95 2.41
4.28 20.90 1.37 3.48 4.28 20.90 1.36 3.46
6.42 31.33 1.99 5.06 6.42 31.33 1.91 5.00 3.00 14.64 .93 2.36
17

44 46
100 98
108 94
279 _ _ _ 271 320
62 62
135 138
165 160
_ _ _ 275
274 328
638 632
640 615
1143 1014
600 600
354 351
356 342
634 563
333 333
644 905
1076 934
. -. .
- __.
. - - -
. - - .
358 503
598 519
. -.
- -. - -. - - -
281 ...
275 333
282 283
275 333
OR
635 638
610 655
606 600
600 600
26 47
OK
353 354
339 364
337 333
333 333
14 26
0 0 0 0
0 0 0 0
0 0 0 0
.os 0 0
.35 3 2
.za
.89
.81
TABLE ID.- TEST RESULTS - Concluded
(e) Mater ia l R-2
condition
Back-surface tempera ture
I I Heat-
t ransfer Before tes t After t e s t
ra te , 9 Exposure t ime, tAT, see, f o r - exposure r i s e
I I
AT = 600' R (3330 j s e c zjz
0 0 0 0
0 0 0 0
0 0 0 0
0 0 0 0
0 0 0 0
in. em AT = 300' R (167' K)
0.24 0.61 .24 1 .61
245 245
265 405
37 5 346
135 131
233 265
295 250
280 282
_..
332
A A
B B
C C
D D
E E
259 350
329 282
48 .55 2.01 9.81 .48 1.22 .46 1.17 .53 2.00 9.76 .49 1.24 .42 1.07
.94 2.66 12.98 1.08 2.14 . I O 1.78
240 2.73 5.69 27.77 1.97 5.00 .13 .33
263 353
331 283
(f) Material R-3
Back-surface tempera ture
~
Specimen dimensions
Before tes t
I Termination 01 exposure
Heat- t ransfer
ra!e, 9
After tes t vlaximum temperaturi
r i s e Test onditioi
Exposure t ime, tAT, see, fo r - 3har layer thickness
XC
- t i
s e c
191 188
282 265
281 311
257 294
218 226
-
tm
s e c
218 211
3 18 298
356 348
__.
__.
444 430
ATm
OK
420 406
449 480
577 623
_._
_ _ _ 76 84
,T = 50' R (28' K
21 21
64 65
102 73
154 160
_..
_ _ _
LT = 100' F (56' P
31 33
90 88
135 117
190 199
_ _ _ __.
LT = 300' F (167' P
88 99
186 206
245 257
255 290
__.
.__
LT = 600' R (3330 K
185 183
279 262
280 311
257 294
_ _ _ _--
OR
757 731
80R 864
LO38 i n 2
.__.
137 152
A A
B B
C
C
D D
E E
6.42 31.32 .89 2.26 6.42 131.321 3 9 12.26
18

I Water-cooled sting 1
Sensor I , I Calorimeter: I I
guard ring: 0.0625 in. or 0.125 in. (1.6 or 3.2 m) copper
!=- d = 3 in. (76 m)-
Mounting ring: 0.0625 in. (1.6 mm) brass
Specimen for moderate test conditions
'f 7 Thickness variable for desired mass distribution
d = 3 in. (76 m) -4 d = 3.15 in. (80 m)
shroud
Specimen for severe test conditions
Figure 1.- Cross-section diagram of material specimen assemblies.

F r o n t s u r f a c e b e f o r e t e s t F r o n t s u r f a c e a f t e r t e s t
I I 1 I I in . I cm u
S e c t i o n e d s p e c i m e n a f t e r t e s t
I I I 0 . 5 in. - I cm
S e c t i o n e d s p e c i m e n a f t e r t e s t ( e n l a r g e d v iew)
(a) Test condition A.
Figure 2.- Material E-I.
L-66-1141
20

F r o n t s u r f a c e b e f o r e t e s t F r o n t s u r f a c e a f t e r t e s t
I 1 I I I I i n . I c n -
S e c t i o n e d sDec imen a f t e r t e s t
I I I 10.5 i n . I cm
S e c t i o n e d s p e c i m e n a f t e r t e s t (en I a r G e d view)
(b) Test condition B.
Figure 2.- Continued.
L-66-1142
21

F r o n t s u r f a c e h e f o r e t e s t F r o n t s u r f a c e a f t e r t e s t
I J I in. I cm -
S e c t i o n e d s p e c i m e n a f t e r t e s t
1 I 10.5 in. - I cm S e c t i o n e d s p e c i m e n a f t e r t e s t ( e n l a r g e d v iew)
( c ) Test condition C.
Figure 2.- Continued.
L-66-1143
22

I
~~~~t s u r f a c e b e f o r e t e s L , I " -
23

F r o n t s u r f a c e b e f o r e t e s t F r o n t s u r f a c e a f t e r t e s t
I I , 1 1 i n . - I cm
S e c t i o n e d s p e c l m e n a f t e r t e s t
I I I 0 .5 i n .
I , I cm
S e c t i o n e d s p e c i m e n a f t e r t e s t ( e n l a r g e d v iew)
(e) Test condition E.
Figure 2.- Continued.
L-66-1145
24

F r o n t s u r f a c e b e f o r e t e s t F r o n t s u r f a c e a f t e r t e s t
f
l a I i n . I I cm
S e c t i o n e d s p e c i m e n a f t e r t e s t
I I I 0 . 5 i n . L I cm
S e c t i o n e d s p e c i m e n a f t e r t e s t ( e n l a r g e d v i e w )
(f ) Test condition E. Exposure time, 71 sec.
Figure 2.- Continued.
L-661146
25

I i n .
U I cm
S e c t i o n e d s p e c i m e n a f t e r t e s t
111 0 . 5 i n . u I cm
S e c t i o n e d s p e c i m e n a f t e r t e s t ( g n l a r g e d v i e w )
(g) Test condition E. Exposure time, 121 sec.
Figure 2.- Concluded.
L-66-1147
26

I
/
F r o n t s u r f a c e b e f o r e t e s t
F r o n t s u r f a c e a f t e r t e s t
I I I I i n . - I cm
S e c t i o n e d s p e c i m e n a f t e r t e s t
0 . 5 i-n. I I 1 L I cm
S e c t i o n e d s p e c i m e n a f t e r t e s t (en l a r g e d v i ew)
(a) Test condition A.
Figure 3.- Material E-2.
L-66-1 I48
27

28
F r o n t s u r f a c e b e f o r e t e s t F r o n t s u r f a c e a f t e r t e s t
.
I I 1 1 in. - I cm
S e c t i o n e d s p e c i m e n a f t e r t e s t
L I 10.5 in. I I ~ I c m
S e c t i o n e d s p e c i m e n a f t e r t e s t [ e n l a r g e d v i e w )
(b) Test condition B.
Figure 3.- Continued.
L-66-1149

F r o n t s u r f a c e b e f o r e t e s t F r o n t s u r f a c e a f t e r t e s t
I I 1 1 i n . u I cm
S e c t i o n e d s p e c i m e n a f t e r t e s t
I I J0.5 in. I I I I c m
S e c t i o n e d s p e c i m e n a f t e r t e s t ( e n l a r g e d v iew)
(c) Test condition C.
Figure 3.- Continued.
L-66-1150
29

F r o n t s u r f a c e b e f o r e t e s t F r o n t s u r f a c e a f t e r t e s t
I I I : I i n . w I cm
S e c t i o n e d s p e c i m e n a f t e r t e s t
L - I 1 0 . 5 in . I I t l c m
S e c t i o n e d s p e c i m e n a f t e r t e s t ( e n l a r g e d v i e w ]
(d) Test condition D.
Figure 3.- Continued.
L-66-1151
30

I
F r o n t s u r f a c e b e f o r e t e s t
F r o n t s u r f a c e a f t e r t e s t
-1 in. -1 cm
S e c t i o n e d s p e c i m e n a f t e r t e s t
I 10.5 in . I cml
S e c t i oned s pec i men a f t e r t e s t (en l a r g e d v i e.)
le) Test condition E. L-66-1152
Figure 3.- Concluded.
31

'. ..
F r o n t s u r f a c e b e f o r e t e s t
F r o n t s u r f a c e a f t e r t e s t
- - I I I I in . u I cm
S e c t i o n e d s p e c i m e n a f t e r t e s t
I I 1 0 . 5 i n . 1 I j l c m
S e c t i oned s p e c i m e n a f t e r P e s t ( e n l a r g e d v i ew)
(a) Test condition A.
Figure 4.- Material E-3.
L-66- I I53
.
32

F r o n t s u r f a c e b e f o r e t e s t
F r o n t s u r f a c e a f t e r t e s t
I I i I in . - I cm
S e c t i o n e d s p e c i m e n a f t e r t e s t
I I 1 0 . 5 i n . I , ~ I c m
S e c t i o n e d s p e c i m e n a f t e r t e s t [ e n l a r g e d v i e w )
(b) Test condition B.
Figure 4.- Continued.
L-66- I I54

F r o n t s u r f a c e b e f o r e t e s t
F r o n t s u r f a c e ' a f t e r t e s t
L I 1 1 in . L I i l c m
S e c t i o n e d s p e c i m e n a f t e r t e s t
I , J 0.5 i n . 111 I cm
S e c t i o n e d s p e c i m e n a f t e r t e s t ( e n l a r g e d v i e w ]
(c) Test condition C.
Figure 4.- Continued.
L-66-1155
34

F r o n t s u r f a c e b e f o r e t e s t F r o n t s u r f a c e a f t e r t e s t
I I I I in. u I cm
S e c t i o n e d s p e c i m e n a f t e r t e s t
1 I 1 0 . 5 in. -1 cm
S e c t i o n e d s p e c i m e n a f t e r t e s t ( e n l a r g e d view)
(d) Test condition D. L-66-1156
Figure 4.- Continued.
35

F r o n t s u r f a c e b e f o r e t e s t F r o n t s u r f a c e a f t e r t e s t
1 I I I i n . - I cm S e c t i oned s ~ e c i m e n a f t e r t e s t
I I 1 0 . 5 i n . -1 cm
S e c t i o n e d s p e c i m e n a f t e r t e s t ( e n l a r g e d v iew]
36
(e) Test condition E. L-66-1157
Figure 4.- Concluded.

F r o n t s u r f a c e a f t e r t e s t
,I in . I 1 I c m
S e c t i o n e d s p e c i m e n a f t e r t e s t
1 r I1 in. I I I c m
S e c t i o n e d s p e c i men a f t e r t e s t (en l a r g e d v i ew)
(a) Test condition A.
Figure 5.- Material R- I .
L-66- I158
37

x
F r o n t s u r f a c e b e f o r e t e s t
F r o n t s u r f a c e a f t e r t e s t
U I i n . U I cm
S e c t i o n e d s p e c i m e n a f t e r t e s t
1-10.5 in. 1 I I cm
S e c t i oned spec imen a f t e r t e s t ( e n l a r g e d view)
(b) Test condition B.
Figure 5.- Continued.
L-66- I I59
38

-1 in. I 1 I c m
Sectioned s p e c i m e n a f t e r t e s t
'1.5 in. I cml J
S e c t i o n e d s p e c i m e n a f t e r t e s t (enlarged v i ewl
(c) Test condition C.
Figure 5.- Continued.
L-66- I160
39

F r o n t s u r f a c e b e f o r e t e s t F r o n t s u r f a c e a f t e r t e s t
I 1 i n . U I cm
S e c t i o n e d s p e c i m e n a f t e r t e s t
1 1 0 . 5 i n . U I cm
S e c t i o n e d s p e c i m e n a f t e r t e s t ( e n l a r g e d v i e w )
(d) Test condition D.
Figure 5.- Continued.
L-66-1161
40

F r o n t s u r f a c e a f t e r t e s t F r o n t s u r f a c e b e f o r e t e s t
/ \
-1 i n . 1 I 1 I c m
S e c t i o n e d s p e c i m e n a f t e r t e s t
, 0 . 5 i n .
I I I c m S e c t i o n e d s p e c i m e n a f t e r t e s t (en I z r g e d v i ew)
(e) Test condition E.
Figure 5.- Concluded.
L-66-1162
4 1

- - I- in* w
Front sur face before t e s t
-
1 in.1 I I
Front sur face after t e s t
(a) Test condition A.
Figure 6.- Material R-2.
L-66-1163
42

F r o n t s u r f a c e b e f o r e t e s t F r o n t s u r f a c e a f t e r t e s t
1-1 I i n . U I cm
S e c t i o n e d s p e c i m e n a f t e r t e s t
I I 1 0 . 5 in. I cm
S e c t i o n e d s p e c i m e n a f t e r t e s t ( e n l a r g e d v i e w )
(b) Test condition B.
Figure 6.- Continued.
L-66-1164
43

F r o n t s u r f a c e b e f o r e t e s t F r o n t s u r f a c e a f t e r t e s t
1 I I I i n . W I cm
S e c t i o n e d s p e c i m e n a f t e r t e s t
0.5 i n . I I I I c m i I I
S e c t i o n e d s p e c i m e n a f t e r t e s t ( e n l a r g e d v iew)
(c) Test condition C.
Figure 6.- Continued.
L-66-1165
44 L-3951

F r o n t s u r t a c e b e f o r e t e s t F r o n t s u r f a c e a f t e r t e s t
III I i n . I cm
S e c t i o n e d s p e c i m e n a f t e r t e s t
I
I I 10 .5 i n . I cm
S e c t i o n e d s p e c i m e n a f t e r t e s t ( e n l a r g e d v i e w )
(d) Test condition D.
Figure 6.- Continued.
L-66- I I66
45

46
Front surface before t e s t
1 in.- 1 cm w
Front surface after t e s t
(e) Test condition E.
Figure 6.- Concluded.
L-66- I167

F r o n t s u r f a c e a f t e r t e s t
r 1 I I I in. - I cm
S e c t i o n e d s p e c i m e n a f t e r t e s t
I I I 0 .5 i n . I cm
S e c t i o n e d s p e c i m e n a f t e r t e s t ( e n l a r g e d v i e 4
(a) Test condition A.
Figure 7.- Material R-3.
L-66- I I68
47

F r o n t s u r f a c e b e f o r e t e s t F r o n t s u r f a c e a f t e r t e s t
I I I I i n . - I cm
S e c t i o n e d s p e c i m e n a f t e r t e s t
1 I ~ 0 . 5 in . I cm
S e c t i o n e d s p e c i m e n a f t e r t e s t ( e n l a r g e d v i ew)
(bl Test condition B.
Figure 7.- Continued.
L-66-1 I69

F r o n t s u r f a c e b e f o r e t e s t F r o n t s u r f a c e a f t e r t e s t
I 1 I I i n . w I cm
S e c t i o n e d s p e c i m e n a f t e r t e s t
I I 10 .5 in. I cm
S e c t i o n e d s p e c i m e n a f t e r t e s t ( e n l a r g e d v i e w )
(c) Test condition C.
Figure 7.- Continued.
L-66-1170
49

-I i n . - I cm
S e c t i o n e d s p e c i m e n a f t e r t e s t
1 I 1 0 . 5 i n . I cm
S e c t i o n e d s p e c i m e n a f t e r t e s t (en I a r g e d v iew)
(d) Test condition 0.
Figure 7.- Continued.
L-661171
50

~~
L I ' I IT. - I cm
S e c t i o n e d s p e c i m e n a f t e r t e s t
I I 1 0 . 5 in . I cm
S e c t i o n e d s p e c i m e n a f t e r t e s t ( e n l a r g e d v i e w )
(e) Test condition E.
Figure 7.- Concluded.
L-66-1172
51

Original front surface
............................................... .............................................. ................. .................................................. ................. ................. Char layer'.'.'.'.'.'.'.'.'.'.".'.'.'.'. ................ ................. ................ ................. ................ ............................................... .............................................. ............................................... ..............................................
Back surface
Figure 8.- Cross-section diagram and coordinate system for specimen dimensions.
52

Test conditions O A o a o c A D
n G a~
I l L 4~ 20 51 2,d I 20 I I 40 I I 61
260 4-00 I ,
0
..IO3 o3
\ %
XP
Test conditions D and G
I U 20 40x IO3
Q , Btu/tt2
n
n
\:xo a 'XP
t8 ..
Test conditions D,E, and F sh:ouded, speci,mens I
6 ' 2 0 0 0 0 6 ' 260-00 Q , MJ/m2
rest condition E
200 400 6 ' -
(a) Material E-1.
Q , Btu/ft2
Q , MJ/m2 0 200 400 600 6 ' 260 ' 460 660 ' '
(b) Material E-2.
Figure 9.- Char surface and interface recessions as a function of cold-wall heat load.
53
Test conditions O A O B o c A D O E
I 1
0 200 400 600
Test condi t ion I
6Ox1O3 0 20 -
40
I I 8 2
Q, Btu/ft2
Q , M J / m 2
0 200 400
(c) Material E-3.
- .5
0
.5
I .o
I .5 1 2,0/ Test ,cond:cns Ai B;;[,13
5 0
I I
0 200 ' 460
I 0 200
- 400
(d) Material R-1.
Figure 9.- Continued.
54

Test condit ions O A O B o c A D
-I
0 -
E * I - x-
5 2 - c 0
ln c
6 3 -
4 -
5 -
nd C
r
51 2.01.- 0 I 2 0 1 qXld , I I 0 2 00 400
T e s t conditions D ai 1 sh:ouded ,speciyens 1 0 2 0 40
Q , B t u / f t 2
\ '3 E
L 4 %
60
I b- - 2 0 0 '-- 4 6 0 600 800 Q, MJ/m2
(e) Material R-2.
Q, Btu / f t 2
Q, MJ/m2
I I J 0 2 00 400 6 ' 260 ' 460 ' 600 800
(f) Material R-3.
Figure 9.- Concluded.
55
I

Test conditions O A O B
Heat-transfer
Shielding effectivengss,
E, Btu I b m
9
Material d E-3 ~
I 200
Material E-2 data from reference 3 - Mass flow rate, h/A
I bm kg ft*-sec &
0 0.2 0.98 a I .8' 8.80 * 4 19 S O A 16 78 d 16
rate, 4 , MW/m2 0 I I 1 f t
R- 3
300 0 I O 0 200
Heat-transfer rate, q, Btu /ft2-sec
Figure 10.- Shielding effectiveness for a back-surface temperature rise of 300' F (167' K).
78
3 I
I :40 - 30
-20
-10
- 0
-40
- 30
-20
- 1 0
- 0 300
56

“The aeronautical aiid space activities of the United States shall be conducted so as to cotitribste . . . t o the expansion of human knowl- edge of phenomena in the atmosphere aiid space. T h e Administratioti shall provide for the widest practicable aiid appropriate dissetniiiation of informatioiz conceniiiig its actirdies aud the results thereof.”
-NATIONAL AERONAUTICS AND SPACE ACT OF 1958
NASA SCIENTIFIC AND TECHNICAL PUBLICATIONS
TECHNICAL REPORTS: important, complete, and a lasting contribution to existing knowledge.
TECHNICAL NOTES: of importance as a contribution to existing knowledge.
TECHNICAL MEMORANDUMS: Information receiving limited distri- bution because of preliminary data, security classification, or other reasons.
CONTRACTOR REPORTS: Technical information generated in con- nection with a NASA contract or grant and released under NASA auspices.
TECHNICAL TRANSLATIONS: Information published in a foreign language considered to merit NASA distribution in English.
TECHNICAL REPRINTS: Information derived from NASA activities and initially published in the form of journal articles.
SPECIAL PUBLICATIONS: Information derived from or of value to NASA activities but not necessarily reporting the results .of individual NASA-programmed scientific efforts. Publications include conference proceedings, monographs, data compilations, handbooks, sourcebooks, and special bibliographies.
Scientific and technical information considered
Information less broad in scope but nevertheless
Details on the availability of these publications may be obtained from:
SCIENTIFIC AND TECHNICAL INFORMATION DIVISION
NATIONAL AERONAUTICS AND SPACE ADMINISTRATION
Washington, D.C. 20546