Evaluation of Saliva/Oral Fluid as an Alternate Drug ... · PDF fileEvaluation of Saliva/Oral...
77
The author(s) shown below used Federal funds provided by the U.S. Department of Justice and prepared the following final report: Document Title: Evaluation of Saliva/Oral Fluid as an Alternate Drug Testing Specimen Author(s): Dennis J. Crouch, Jayme Day, Jakub Baudys, Alim A. Fatah Document No.: 203569 Date Received: February 2005 Award Number: 94-IJ-R-004 This report has not been published by the U.S. Department of Justice. To provide better customer service, NCJRS has made this Federally- funded grant final report available electronically in addition to traditional paper copies. Opinions or points of view expressed are those of the author(s) and do not necessarily reflect the official position or policies of the U.S. Department of Justice.
Transcript of Evaluation of Saliva/Oral Fluid as an Alternate Drug ... · PDF fileEvaluation of Saliva/Oral...

The author(s) shown below used Federal funds provided by the U.S. Department of Justice and prepared the following final report: Document Title: Evaluation of Saliva/Oral Fluid as an Alternate
Drug Testing Specimen Author(s): Dennis J. Crouch, Jayme Day, Jakub Baudys,
Alim A. Fatah Document No.: 203569 Date Received: February 2005 Award Number: 94-IJ-R-004 This report has not been published by the U.S. Department of Justice. To provide better customer service, NCJRS has made this Federally-funded grant final report available electronically in addition to traditional paper copies.
Opinions or points of view expressed are those
of the author(s) and do not necessarily reflect the official position or policies of the U.S.
Department of Justice.

Evaluation of Saliva/Oral Fluid as an Alternate Drug Testing Specimen
NIJ Report 605−03
Dennis J. Crouch Jayme DayJakub Baudys University of Utah, Center for Human Toxicology (CHT) Salt Lake City, UT 84112–9457 and Alim A. Fatah National Institute of Standards and Technology Gaithersburg, MD 20899
July 2004
NCJ 203569 This report was prepared for the National Institute of Justice, U.S. Department of Justice, by the Office of Law En-forcement Standards (OLES) of the National Institute of Standards and Technology (NIST) under the direction of Alim A. Fatah, Program Manager for Chemical Systems and Materials, and Kathleen M. Higgins, Director of OLES. This report was conducted under Interagency Agreement 94−IJ−R−004, Project No. 03–002.
This document is a research report submitted to the U.S. Department of Justice. This report has not been published by the Department. Opinions or points of view expressed are those of the author(s)
and do not necessarily reflect the official position or policies of the U.S. Department of Justice.

iii
This document is a research report submitted to the U.S. Department of Justice. This report has not been published by the Department. Opinions or points of view expressed are those of the author(s)
and do not necessarily reflect the official position or policies of the U.S. Department of Justice.

CONTENTS Page
COMMONLY USED SYMBOLS AND ABBREVIATIONS...................................................... iv ABOUT THIS REPORT..................................................................................................................v 1. INTRODUCTION ..................................................................................................................1 1.1 Drug Testing Methods ......................................................................................................1 1.2 Oral Fluid as a Drug-Testing Specimen............................................................................1 1.3 Oral Fluid: Pros and Cons.................................................................................................2 1.4 Objectives .........................................................................................................................2 2. LITERATURE SEARCH .......................................................................................................3
2.1 Search Results................................................................................................................3 2.2 Controlled Clinical Study 1 .........................................................................................16 2.3 Clinical Study 2............................................................................................................25
3. REPORT ON THE EFFECTS OF COLLECTION DEVICES ON DRUG CONCENTRATION.............................................................................................................35
3.1 Introduction..................................................................................................................35 3.2 Study Design and Results of In Vitro Oral Fluid Volume Absorption (Part 1)...........35 3.3 Conclusions of In Vitro Oral Fluids Absorption (Part 1) ............................................36 3.4 Study Design and Results of In Vitro Drug Recovery (Part 2)....................................42 3.5 Conclusions of In Vitro Drug Absorption (Part 2) ......................................................43 3.6 Study Design and Results of In Vitro Drug Recovery (Part 3), Volume Corrected....49 3.7 Conclusions of In Vitro Drug Absorption (Part 3), Volume Corrected.......................51
4. REPORT OF SPECIMEN VALIDITY—IMMUNOGLOBULIN G (IgG) CONCENTRATION.............................................................................................................60 4.1 Introduction..................................................................................................................60 4.2 Study Design and Results ............................................................................................60 4.3 Conclusions..................................................................................................................61
5. REFERENCES .....................................................................................................................65
TABLES
Table 1. Mean PK summary ...................................................................................................21 Table 2. Mean S/P ratios .........................................................................................................22 Table 3. Concentration comparisons by device ......................................................................28 Table 4. Duration of positive codeine detection by device.....................................................29 Table 5. Mean PK estimates ...................................................................................................29 Table 6. Codeine concentrations in saliva collected by the control method and the Orasure device with corresponding ratios of control/Orasure concentrations, n=2 subjects .....................................................................................32 Table 7. In vitro study data for Salivette from Sarstedt Company .........................................37 Table 8. In vitro study data for Intercept from STC Company...............................................38 Table 9. In vitro study data for ORALscreen from Avitar Company .....................................39 Table 10. In vitro study data for Finger Collector from Avitar Company................................40 Table 11. In vitro study data for Hooded Collector from Avitar Company..............................41 Table 12. Summary of amphetamine recovery .........................................................................44
ii
This document is a research report submitted to the U.S. Department of Justice. This report has not been published by the Department. Opinions or points of view expressed are those of the author(s)
and do not necessarily reflect the official position or policies of the U.S. Department of Justice.

Table 13. Summary of methamphetamine recovery .................................................................45 Table 14. Summary of phenylcyclidene (PCP) recovery..........................................................46 Table 15. Summary of morphine recovery ...............................................................................47 Table 16. Summary of codeine recovery ..................................................................................48 Table 17. Summary of amphetamine recovery .........................................................................52 Table 18. Summary of methamphetamine recovery .................................................................53 Table 19. Summary of PCP recovery........................................................................................54 Table 20. Summary of morphine recovery ...............................................................................55 Table 21. Summary of codeine recovery ..................................................................................56 Table 22. Summary of cocaine recovery ..................................................................................57 Table 23. Summary of BZE recovery .......................................................................................58 Table 24. Summary of THC-COOH recovery ..........................................................................59 Table 25. IgG concentrations (µg/mL) .....................................................................................62 Table 26. The effect of dilution on IgG concentration .............................................................63 Table 27. The effect of rinsing on IgG concentration...............................................................64
FIGURES Figure 1. Chromatogram of 5 ng/mL codeine..........................................................................19 Figure 2. Mean saliva and plasma codeine concentrations versus time...................................20 Figure 3. Saliva concentration versus plasma codeine concentrations ....................................23 Figure 4. Mean S/P ratio over time ..........................................................................................23 Figure 5. pH versus codeine concentration ..............................................................................24 Figure 6. Codeine time course by device .................................................................................27 Figure 6a. Comparison of oral fluid collection methods............................................................27 Figure 7. In vitro recovery of morphine and codeine...............................................................30 Figure 8. Salivette versus Finger Collector codeine concentrations ........................................31 Figure 9. Control versus Salivette codeine concentrations ......................................................31
iii
This document is a research report submitted to the U.S. Department of Justice. This report has not been published by the Department. Opinions or points of view expressed are those of the author(s)
and do not necessarily reflect the official position or policies of the U.S. Department of Justice.

COMMONLY USED SYMBOLS AND ABBREVIATIONS
A ampere Hf high frequency o.d. outside diameter ac alternating current Hz hertz Ω ohm AM amplitude modulation i.d. inside diameter p. page cd candela in inch Pa pascal cm centimeter IR infrared Pe probable error CP chemically pure J joule pp. pages c/s cycle per second L lambert Ppm parts per million d day L liter Qt quart dB decibel lb pound Rad radian dc direct current lbf pound-force Rf radio frequency °C degree Celsius lbf in pound-force inch Rh relative humidity °F degree Fahrenheit Lm lumen S second dia diameter Ln logarithm (base e) SD standard deviation emf electromotive force Log logarithm (base 10) sec. Section eq equation M molar SWR standing wave ratio F farad m meter uhf ultrahigh frequency fc footcandle µ micron UV ultraviolet fig. figure min minute V volt FM frequency modulation mm millimeter vhf very high frequency ft foot mph miles per hour W watt ft/s foot per second M/s meter per second λ wavelength g acceleration Mo month wk week g gram N newton wt weight gr grain N m newton meter yr year H henry Nm nanometer h hour No. number
area=unit2 (e.g., ft2, in2, etc.); volume=unit3 (e.g., ft3, m3, etc.)
PREFIXES COMMON CONVERSIONS (See ASTM E380)
d deci (10-1) Da deka (10) 0.30480 m =1 ft 4.448222 N = 1 lbf c centi (10-2) H hecto (102) 25.4 mm = 1 in 1.355818 J = 1 ft lbf m milli (10-3) K kilo (103) 0.4535924 kg = 1 lb 0.1129848 N m = 1 lbf in µ micro (10-6) M mega (106) 0.06479891 g = 1 gr 14.59390 N/m = 1 lbf/ft n nano (10-9) G giga (109) 0.9463529 L = 1 qt 6894.757 Pa = 1 lbf/in2
p pico (10-12) T tera (1012) 3600000 J = 1 kW hr 1.609344 km/h = 1 mph psi = mm of Hg x (1.9339 x 10⁻²) mm of Hg = psi x 51.71
Temperature: T °C = (T °F –32)×5/9 Temperature: T °F = (T °C ×9/5)+32
iv
This document is a research report submitted to the U.S. Department of Justice. This report has not been published by the Department. Opinions or points of view expressed are those of the author(s)
and do not necessarily reflect the official position or policies of the U.S. Department of Justice.

ABOUT THIS REPORT
This report presents findings from a study to determine whether saliva/oral fluid is a suitable specimen for drug testing in the criminal justice system. The study involved a literature review; a report based on findings from the review; and a clinical study, using codeine as a model drug, to assess the practical problems of collecting and analyzing oral fluid samples. Findings
• The study found that oral fluid is a promising specimen for drug testing and has several advantages over other testing specimens: (1) It may be collected simply, noninvasively, and under direct supervision; (2) because oral fluids are a filtrate of blood, the oral fluid-drug concentration should reflect blood-drug concentrations; (3) because oral fluid is relatively free of blood constituents, it can be easily processed for testing by conventional drug screening and confirmation methods.
• Researchers discovered that the technique used to collect oral fluid affected the drug con-
centration, and nonstimulated spitting was the most effective technique because it pro-duced the highest levels of drug concentration.
• The current method of using a specified concentration level of the oral fluid immu-
noglobulin G (IgG) appeared to be ineffective in determining if an oral sample had been diluted. Thus, more research is needed to identify a chemical marker that will ensure the validity of oral fluid specimens.
Further Research Using oral fluid to test for drugs requires further research to determine:
• How drug concentrations in oral fluid correlate with drug concentrations in other body fluids.
• How factors such as pKa, physical size, and the degree of protein-binding lipophilicity
affect drug transfer into oral fluid.
v
This document is a research report submitted to the U.S. Department of Justice. This report has not been published by the Department. Opinions or points of view expressed are those of the author(s)
and do not necessarily reflect the official position or policies of the U.S. Department of Justice.

1. INTRODUCTION 1.1 Drug Testing Methods Studies have shown that more than two-thirds of people who are incarcerated admit that they used drugs while incarcerated, and one-third admit that they used drugs while committing their crimes (Bray and Crouch, 1997). In addition, studies reveal that alcohol or drugs are detected in about two-thirds of the drivers who are involved in fatal automobile accidents (Bray and Crouch, 1997). Workplace drug testing has become fairly routine due to concerns about employee safety, health, and productivity. Given the prevalence and impact of drug abuse, it is not surprising that drug testing has become an integral part of society and criminal and civil investigations. Drug testing is conducted at all stages of the criminal justice system: at arrest, before a trial, and during incarceration, probation, and parole (Timrots, 1992). To date, testing has been done pri-marily on blood, plasma, and urine, but alternate biological specimens that can be collected eas-ily and noninvasively and can complement or replace urine and blood are being evaluated, including hair, sweat, and saliva. Each has its own strengths and weaknesses. For example, hair may contain a history of a donor’s drug use, but, if drugs are smoked in the vicinity of the donor, then the hair is subject to external contamination from touching with the hands and drug vapors. Sweat can be collected using sweat patches, but little is known about interpreting the concentra-tions of drugs detected in the patches. 1.2 Oral Fluid as a Drug-Testing Specimen Oral fluid, sometimes called “mixed saliva,” comes from three major and several minor salivary glands. Strictly speaking, oral fluid is the mixed saliva from the glands and other constituents present in the mouth. “Saliva” is the fluid collected from a specific salivary gland and is free from other materials. This report will use the term oral fluid because it best describes the speci-men examined in the studies. Oral fluid contains plasma electrolytes such as potassium, sodium, chloride, and bicarbonate and many other plasma constituents, such as enzymes, immunoglobulins, and DNA. The total vol-ume of oral fluid produced by an adult may be in excess of 1000 mL/day with typical flows of 0.05 mL/min while sleeping, 0.5 mL/min while spitting, and 1 mL/min to 3 mL/min while chew-ing gum. Many drugs of interest in the criminal justice setting have been detected in oral fluid, including ethanol, methamphetamine, amphetamine, barbiturates, benzodiazepines, heroin, cocaine, and cannabinoids. It has been reported (Cone, 1993) that oral fluid-amphetamine concentrations ex-ceeded blood concentrations for 48 hours after use, PCP-oral fluid concentrations may exceed plasma concentrations, and detection times for morphine concentrations in oral fluid were longer than for those in plasma following a single dose of heroin. However, much remains to be learned about the potential to detect drugs in oral fluid and how drug concentrations in oral fluid corre-late with drug concentrations in other body fluids.
1
This document is a research report submitted to the U.S. Department of Justice. This report has not been published by the Department. Opinions or points of view expressed are those of the author(s)
and do not necessarily reflect the official position or policies of the U.S. Department of Justice.

Several factors may affect drug transfer into saliva, such as pKa, physical size, degree of protein binding, and lipophilicity of the drug. In addition, parent drugs and not metabolites are often found in oral fluid because they are more lipid soluble and therefore pass more easily through the capillary and acinar membranes into the oral fluid. 1.3 Oral Fluid: Pros and Cons The presence of parent drugs in oral fluid can be advantageous and disadvantageous. The disad-vantage is that antibodies in most commercially available immunoassay drug screen tests target metabolites. The advantage is that parent drugs are less polar, more easily extracted, and are less likely to require derivatization prior to confirmational analysis. Another consideration for using oral fluid for drug testing also has pros and cons. Drugs that are ingested orally (like ethanol) as well as those that can be smoked (i.e., methamphetamine, PCP, marijuana, and cocaine) may be detected in high concentrations in oral fluid following recent use due to residual drugs remaining in the oral cavity. However, under these circumstances, results may not be accurate because the drug concentration found in the oral fluid may not reflect the blood-drug concentration. At the same time, these transiently elevated concentrations improve the likelihood of detecting the drug. 1.4 Objectives The objectives of this research included the following: 1. To perform a thorough literature search to establish the current state of scientific knowledge
about the use of oral fluid as a testing specimen and to prepare a comprehensive report on the scientific literature related to oral fluid drug testing.
2. To perform a controlled clinical study with the following objectives:
• To assess the practical problems of obtaining oral fluid samples from donors. • To determine if there is a predictable relationship between codeine concentrations in
plasma and oral fluid following controlled administration of the model opiate drug codeine.
• To develop and refine methods for analyzing codeine and its metabolites in oral fluids.
3. To determine the optimum method of collecting oral fluids and the effect of collection de-vices on drug concentration.
4. To determine if the current standards that are used to assess whether an oral fluid sample is
“valid” (i.e., has not been diluted to circumvent testing protocols) are appropriate.
2
This document is a research report submitted to the U.S. Department of Justice. This report has not been published by the Department. Opinions or points of view expressed are those of the author(s)
and do not necessarily reflect the official position or policies of the U.S. Department of Justice.

2. LITERATURE SEARCH 2.1 Search Results
In year 1 of this study, researchers conducted a thorough literature search to determine the state of knowledge about the use of oral fluid/saliva as a drug-testing specimen. Information gathered in the search was used to prepare a report that summarized the scientific literature on oral fluid drug testing. Results of the literature search were then used to design a controlled clinical study in which subjects were dosed with codeine, and oral fluid and plasma samples were collected. In this section, no differentiation was made between oral fluid and saliva because most of the literature did not make that distinction. Generally, the term “saliva” is used in the literature re-gardless of collection technique and actual fluid harvested. The literature review resulted in the identification of 134 references from which reprints were obtained for 85 articles.
The reprints were separated into the following categories:
• Saliva collection and predicting saliva/plasma concentrations–20 • Amphetamines–8 • Cocaine and metabolites–22 • Marijuana and metabolites–11 • Opiates and codeine–10 • Review articles–11 • Therapeutic and other drugs–33 • Miscellaneous–11
Many reprints contained information about one or more drugs and their metabolites. Articles also often contained information about collecting, testing, and the pharmacokinetics of one or more drugs. Therefore, the number of references in the bibliography may not be equal to the to-tal number of reprints listed in each category. Following are summaries of the information ob-tained in each category. 2.1.1 Saliva Collection and Predicting Saliva/Plasma Concentrations
As stated, several fluids combine to constitute what is commonly referred to as “saliva.” These fluids are excreted by the major salivary glands, minor salivary glands, and gingival crevices. A mixture of fluids from the various glands is variously referred to as whole saliva, mixed saliva, oral fluid, or oral fluids (Malamud, 1993). Whole saliva may also contain other materials that are in the mouth such as shed mucosal cells or food residues (Schramm et al., 1993a). Salivary composition and flow can be affected by many factors, including oral diseases (Dawes, 1993; Mandel, 1990).
A variety of methods are available for collecting saliva. Some involve stimulating saliva pro-duction, while others target collection of unstimulated (also referred to as nonstimulated) saliva.
3
This document is a research report submitted to the U.S. Department of Justice. This report has not been published by the Department. Opinions or points of view expressed are those of the author(s)
and do not necessarily reflect the official position or policies of the U.S. Department of Justice.

Unstimulated saliva can be collected by the draining method, which is performed by allowing saliva to drip from the mouth into a collection container (Navazesh, 1993). Several techniques may be used to collect stimulated saliva. The simplest involves tongue, cheek, or lip movements without the use of an external stimulus (Mucklow et al., 1978; Jones, 1995). Chewing paraffin wax, Parafilm®, teflon, rubber bands, gum base, or chewing gum are usually referred to as me-chanical methods of stimulating saliva production (Chang, 1976; Mucklow et al., 1978; Dabbs, 1991; Navazesh, 1993; Hold et al., 1996). A lemon drop or citric acid can be placed in the mouth to provide a gustatory stimulus for saliva production (Mucklow et al., 1978; Dabbs, 1991; Navazesh, 1993). Following stimulation by one or more of these methods, saliva can be spit, suctioned, or swabbed from the mouth (Navazesh, 1993). Some collection techniques combine stimulation and collection of the saliva using absorbent materials such as cotton balls or cotton rolls. After the absorbent material becomes saturated with saliva, it is removed from the mouth and the sa-liva is extracted by centrifugation or by applying pressure to the material (Chee et al., 1993; Lamey and Nolan, 1994). There are several potential problems associated with stimulating saliva production. Parafilm has been shown to absorb some drugs and, therefore, give erroneous results when saliva is tested for drugs or drug metabolites (Chang, 1976). Also, paraffin contains compounds that may affect chromatographic analyses—again affecting drug testing accuracy (Chang, 1976). Some salivary stimulants may change the salivary composition and, therefore, affect the saliva-drug concentra-tion. For example, citric acid may change saliva pH and consequently alter drug concentrations in the saliva. Citric acid and cotton have also been shown to alter immunoassay drug test results (Mucklow et al., 1978; Dabbs, 1991; Cheever, 1997). Several devices are commercially available for collecting saliva.1 Some devices are based on the collection techniques just discussed. They carry names such as Oral Diffusion Sink® (Shipley et al., 1992; Hold et al., 1996), Proflow SialometerTM (Jones, 1995), Orasure® (Gomez et al., 1994), and SalivetteTM` (Shipley et al., 1992). They have been advocated for saliva collection when testing for ethanol, steroids, and many other drugs. Mathematical models have been developed for predicting saliva to plasma (S/P) drug concentra-tion ratios for acidic and basic drugs (Matin et al., 1974). The equations are:
1 + 10(pHs-pKa) x fp Acidic Drugs - S/P = -------------------
1 + 10(pHp-pKa) x fs
1 Certain products or materials are identified in this report to adequately specify the experimental proce-dure. Such identification does not imply recommendation or endorsement by the National Institute of Standards and Technology (NIST), nor does it imply that products are necessarily the best available for the purpose.
4
This document is a research report submitted to the U.S. Department of Justice. This report has not been published by the Department. Opinions or points of view expressed are those of the author(s)
and do not necessarily reflect the official position or policies of the U.S. Department of Justice.

1 + 10(pKa-pHs) x fp Basic Drugs - S/P = -------------------
1 + 10(pKa-pHp) x fs where S = concentration of drug in saliva P = concentration of drug in plasma pKa = pKa of drug pHs = pH of saliva pHp = pH of plasma fp = free (unbound) fraction of drug in plasma fs = free (unbound) fraction of drug in saliva
When using these equations, plasma pH is assumed to be constant at 7.4 and drug protein bind-ing is assumed to be negligible in the saliva. Therefore, a value of 1 is used for fs (Hold, 1996). The binding of drugs to plasma proteins varies from drug to drug. However, it remains fairly consistent between individuals. Normally, saliva pH may vary from 6 to 8. If the pH is measured at the time of sample collection, one can modify this variable in the equation and, theoretically, predict the plasma concentration of a drug given its saliva drug concentration (Mucklow et al., 1978). Much of the pharmacokinetic and pharmacodynamic research reported on therapeutic and abused drugs has been based on plasma drug concentrations. Therefore, if S/P ratios can be shown to be predictable using mathematical models, then the databases on plasma pharmacoki-netic, physiological, and behavioral data could be used to support interpretation of saliva drug concentrations. This would greatly enhance the value of saliva as a matrix for drug testing. 2.1.2 Amphetamines In the context of drug abuse, the term “amphetamines” usually refers to amphetamine and d-methamphetamine (methamphetamine). However, there are several structurally related sym-pathomimetic amines such as phentermine, l-methamphetamine, ephedrine, pseudoephedrine, phenylephrine, methylenedioxyamphetamine (MDA), and methylenedioxymethamphetamine (MDMA/Ecstacy) that are sometimes referred to as amphetamines (Baylor and Crouch, 1993). This section focuses on amphetamine and methamphetamine. These drugs may be used thera-peutically in the treatment of obesity, narcolepsy, and attention deficit disorder (Basalt and Cravey, 1995). However, they are commonly abused for their central nervous system stimulant properties. They may be taken by oral ingestion, IV injection, or smoked (Cone, 1993). In the body, methamphetamine is metabolized by n-demethylation to amphetamine.
A limited number of published reports on amphetamine or methamphetamine in saliva indicate that they both have been detected in saliva. Wan et al. (1978) reported a study involving oral administration of 10 mg of amphetamine (as free base) to four subjects. Plasma and saliva am-phetamine concentrations were determined and the S/P concentration ratio was calculated. Dur-ing the absorption phase, the S/P ratio was generally higher than theoretically predicted. The authors hypothesized that this was due to contamination of the oral cavity during dosing. Fol-lowing the absorption phase, the S/P ratio was 2.76. Using the model for calculating
5
This document is a research report submitted to the U.S. Department of Justice. This report has not been published by the Department. Opinions or points of view expressed are those of the author(s)
and do not necessarily reflect the official position or policies of the U.S. Department of Justice.

the S/P ratio of basic drugs, the authors determined that the S/P ratio of amphetamine, theoreti-cally, should have been 2.21. They suggested their data confirmed that mathematical models could be used to estimate plasma amphetamine concentrations when the saliva amphetamine concentration was known. Amphetamine was also detected in the saliva of a subject undergoing amphetamine therapy (Wan et al., 1978). The authors reported that the salivary concentration of amphetamine was similar to that in the subject’s whole blood. There were two reports of detecting methamphetamine in saliva (Kajutani et al., 1989; Suzuki et al., 1989). Suzuki et al. (1989) detected methamphetamine in saliva from drug users for up to 2 d after their last use. Of the 19 saliva samples collected, 3 had detectable concentrations of methamphetamine. The amount of drug recovered following extraction of the saliva samples was 0.3 µg, 0.5 µg, and 2.1 µg. Amphetamine was not detected in any of the samples. Vapaatalo et al. (1984) reported that the low concentrations of amphetamines found in saliva made thin-layer chromatography (TLC) methods unsuitable for use in the detection of these drugs in saliva. 2.1.3 Cocaine Cocaine is a potent central nervous system stimulant that occurs naturally in the leaves of the Erythroxylon coca plant. In solution, it is used as a local anesthetic during ophthalmological and otorhinolaryngeal procedures. More often, though, cocaine is abused for its stimulant and euphoric effects. Cocaine may be self-administered by IV injection and nasal insufflation or smoked as a free base (Clauwaert et al., 1995). Cocaine is metabolized primarily to ben-zoylecgonine (BZE) and ecgonine methyl ester (EME) and to a lesser extent to norcocaine and ecgonine. A number of articles reported detecting cocaine and its metabolites in saliva. Inaba et al. (1978) demonstrated that radioactivity was detected in the saliva of subjects who had ingested radio-labeled cocaine. Peel et al. (1984) reported detecting cocaine in the saliva of impaired drivers. Thompson et al. (1987) questioned whether the cocaine reported in these two earlier studies was actually absorbed and distributed into the saliva, or if it was the result of salivary contamination from oral use or insufflation. He designed a study in which cocaine was administered by IV in-jection. Sour candy containing citric acid was used to stimulate saliva production. The stimu-lated saliva and corresponding plasma samples were collected and analyzed by gas chromatography/mass spectrometry (GC/MS) for cocaine. Saliva cocaine concentrations paral-leled those detected in the plasma. S/P ratios were calculated and showed an overall mean of 1.25, with a range from 0.5 to 2.96.
Two investigators reported significant correlations between saliva cocaine concentrations and physiological effects. In 1988, Cone et al. reported on a study in which cocaine was adminis-tered by IV to five subjects. Saliva production was stimulated with sour candy containing citric acid. Plasma and saliva samples were collected and analyzed by GC with nitrogen-phosphorus detection (GC-NPD). Plasma cocaine concentrations reached 273 ng/mL 10 min after a 15 mg
6
This document is a research report submitted to the U.S. Department of Justice. This report has not been published by the Department. Opinions or points of view expressed are those of the author(s)
and do not necessarily reflect the official position or policies of the U.S. Department of Justice.

dose, and they declined below the assay sensitivity by 5 h post dose. Following the same dose, saliva cocaine concentrations ranged from 100 ng/mL to 520 ng/mL at 10 min. The saliva con-centration declined to an average of 8 ng/mL by 5 h. At 10 min after a 40 mg IV dose, plasma cocaine concentrations ranged from 204 ng/mL to 523 ng/mL and declined to an average of 6 ng/mL by 5 h. The corresponding saliva concentrations following the 40 mg dose ranged from 237 ng/mL to 1843 ng/mL at 10 min and averaged 29 ng/mL at 5 h. The saliva and plasma co-caine concentrations were compared with several subjective and physiological measures and were found to have a significant correlation (p ≤ 0.05). The subjective measures included self-rating scales such as feelings of “good, bad, restless, rush, and anxious.” The physiological measures included respiration, pulse, and blood pressure. Stillman et al. (1993) also reported on a study that compared saliva cocaine concentrations with subjective and physiological measures. Thirteen subjects were administered oral gelatin capsules containing cocaine hydrochloride (2 mg/Kg). Dental cotton rolls were placed in each subject's mouth to collect the saliva, pressure was applied to the rolls to remove the absorbed saliva for analysis. Physiological measures such as blood pressure, temperature, pupil size, and subjective measures including intoxication (orientation, subjective rating of high, and mood) paralleled sa-liva cocaine concentrations. Saliva cocaine concentrations peaked at 75 min after capsule inges-tion, with a peak concentration of about 826 ng/mL. No cocaine was detected at 3 h post dose. Several authors reported detecting metabolites of cocaine in saliva. Schramm et al. (1993b) was the first to report BZE in saliva. Saliva was collected from 69 volunteers who self-reported using cocaine within the previous 24 h. The saliva was assayed for cocaine and BZE by radioimmuno-assay (RIA). A selected number of the samples were also analyzed by GC/MS. Cocaine concen-trations ranged from 3 ng/mL to 1990 ng/mL, and BZE concentrations ranged from 9 ng/mL to 1960 ng/mL. Correlating these concentrations with drug dose was difficult because the route and time of administration were not controlled. Cone et al. (1994) developed a GC/MS method to simultaneously detect cocaine, BZE, EME, and five other metabolites in biological samples. They successfully detected cocaine, BZE, and EME in saliva and plasma, but the concentrations of the other metabolites were below the limit of detection (LOD) of the assay. The peak saliva cocaine concentration was about 3 times that found in plasma. BZE concentrations were lower in saliva than plasma, however, saliva EME concentrations were higher in saliva than in plasma. The route of administration can affect the distribution of cocaine and its metabolites into bio-logical specimens. In a 1995 study by Jenkins et al., male subjects were administered cocaine intravenously or as free base by smoking. After smoking 40 mg of free base cocaine, cocaine, BZE, and anhydroecgonine methyl ester were detected in saliva. Cocaine was the major analyte detected. Concentrations of cocaine ranged from 15852 ng/mL to 504880 ng/mL, declined to 100 ng/mL by 4 h, and were less than 1 ng/mL in all subjects by 24 h. Cocaine was also detected in saliva after IV administration. After administration of 44.8 mg of cocaine-HCl by IV, peak drug concentrations were reached within 30 min of the dose and were lower than those found after smoking (428 ng/mL to 1927 ng/mL). Anhydroecgonine methyl ester was only detected in saliva and only after smoking. Therefore, the authors concluded that anhydroecgonine methyl ester (a thermal degradation product of cocaine) could be used as a marker of smoked-cocaine.
7
This document is a research report submitted to the U.S. Department of Justice. This report has not been published by the Department. Opinions or points of view expressed are those of the author(s)
and do not necessarily reflect the official position or policies of the U.S. Department of Justice.

Cone et al. (1997) reported a study comparing saliva cocaine concentrations following intravenous, intranasal, and smoked administration. Saliva cocaine concentrations peaked 5 min after IV administration and ranged from 258 ng/mL to 1303 ng/mL. S/P ratios ranged from 1.3 to 10.1. S/P ratios following intranasal and smoked administration were generally higher than those after IV administration. Regardless of route of administration, cocaine usually remained detectable for about 12 h. Peak BZE and EME concentrations occurred at 10 min to 4 h and were consistently lower than peak cocaine concentrations. The authors suggested that the elevated S/P ratios observed after smoked and intranasal administration may have resulted from oral contamination during dosing. The elevated S/P ratios persisted for about 15 min after smoking and for about 2 h after intranasal administration. The authors also determined that the duration of cocaine detection in saliva paralleled its pharmacological effects. Saliva cocaine concentrations may differ between stimulated and unstimulated collections. Kato et al. (1993) reported that cocaine concentrations in unstimulated saliva were higher than those detected in saliva collected using citric acid candy stimulation. In six subjects, the mean ratio of unstimulated to stimulated saliva cocaine concentrations was 5.2 and ranged from 3.0 to 9.5. As demonstrated in the previous discussion, several methods have been used to detect cocaine and its metabolites in saliva. Kidwell (1990) reported the detection of cocaine, BZE, and ecgon-ine in saliva using liquid chromatography/mass spectrometry (LC/MS). He reported that saliva could be analyzed by direct injection using LC/MS. This technique eliminated the need to ex-tract the analytes from the saliva and to derivatize the cocaine metabolites prior to instrumental analysis. This streamlined method resulted in a savings of time and, potentially, costs when compared to GC/MS techniques. Based on the literature discussed above, there appears to be a reasonable correlation between saliva and plasma cocaine concentrations. There also appears to be a relationship between co-caine concentrations in saliva and physiological and pharmacological effects.
2.1.4 Marijuana Tetrahydrocannabinol (THC) is the major psychoactive compound found in marijuana plants. Marijuana may contain up to 15% of THC by weight. It can be administered either by oral in-gestion or by smoking (Cone, 1993). THC may produce sedation, euphoria, hallucinations, and temporal distortion. It does not usually cause physical dependence or withdrawal symptoms, but it can cause psychological dependence. THC has a pKa of approximately 9.5 (Idowu and Caddy, 1982). It is metabolized to 11-hydroxy-THC and 8-beta-hydroxy-THC and is further metabolized to its major urinary metabo-lite, 11-carboxy-THC (THC-COOH). About 70% of a dose of THC is excreted within 72 h. A number of articles were identified that discussed the detection of THC and other cannabinoids in saliva. Using an enzyme immunoassay and GC/MS, Peel et al. in 1984 reported detecting cannabinoids in saliva samples collected from 6 of 56 impaired drivers. Gross et al. (1985) de-veloped an RIA method for detecting THC in saliva. This method was subsequently used to test saliva samples collected from 25 male and 10 female marijuana smokers. Ten of the male and 5
8
This document is a research report submitted to the U.S. Department of Justice. This report has not been published by the Department. Opinions or points of view expressed are those of the author(s)
and do not necessarily reflect the official position or policies of the U.S. Department of Justice.
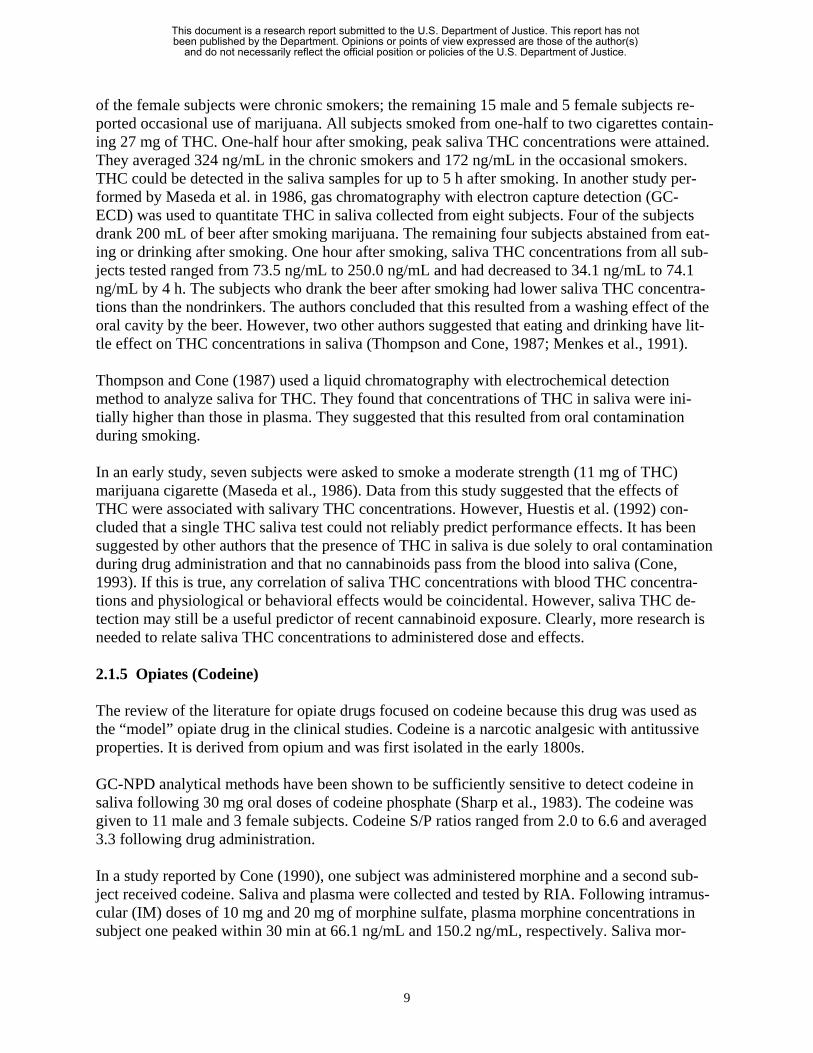
of the female subjects were chronic smokers; the remaining 15 male and 5 female subjects re-ported occasional use of marijuana. All subjects smoked from one-half to two cigarettes contain-ing 27 mg of THC. One-half hour after smoking, peak saliva THC concentrations were attained. They averaged 324 ng/mL in the chronic smokers and 172 ng/mL in the occasional smokers. THC could be detected in the saliva samples for up to 5 h after smoking. In another study per-formed by Maseda et al. in 1986, gas chromatography with electron capture detection (GC-ECD) was used to quantitate THC in saliva collected from eight subjects. Four of the subjects drank 200 mL of beer after smoking marijuana. The remaining four subjects abstained from eat-ing or drinking after smoking. One hour after smoking, saliva THC concentrations from all sub-jects tested ranged from 73.5 ng/mL to 250.0 ng/mL and had decreased to 34.1 ng/mL to 74.1 ng/mL by 4 h. The subjects who drank the beer after smoking had lower saliva THC concentra-tions than the nondrinkers. The authors concluded that this resulted from a washing effect of the oral cavity by the beer. However, two other authors suggested that eating and drinking have lit-tle effect on THC concentrations in saliva (Thompson and Cone, 1987; Menkes et al., 1991). Thompson and Cone (1987) used a liquid chromatography with electrochemical detection method to analyze saliva for THC. They found that concentrations of THC in saliva were ini-tially higher than those in plasma. They suggested that this resulted from oral contamination during smoking. In an early study, seven subjects were asked to smoke a moderate strength (11 mg of THC) marijuana cigarette (Maseda et al., 1986). Data from this study suggested that the effects of THC were associated with salivary THC concentrations. However, Huestis et al. (1992) con-cluded that a single THC saliva test could not reliably predict performance effects. It has been suggested by other authors that the presence of THC in saliva is due solely to oral contamination during drug administration and that no cannabinoids pass from the blood into saliva (Cone, 1993). If this is true, any correlation of saliva THC concentrations with blood THC concentra-tions and physiological or behavioral effects would be coincidental. However, saliva THC de-tection may still be a useful predictor of recent cannabinoid exposure. Clearly, more research is needed to relate saliva THC concentrations to administered dose and effects. 2.1.5 Opiates (Codeine) The review of the literature for opiate drugs focused on codeine because this drug was used as the “model” opiate drug in the clinical studies. Codeine is a narcotic analgesic with antitussive properties. It is derived from opium and was first isolated in the early 1800s. GC-NPD analytical methods have been shown to be sufficiently sensitive to detect codeine in saliva following 30 mg oral doses of codeine phosphate (Sharp et al., 1983). The codeine was given to 11 male and 3 female subjects. Codeine S/P ratios ranged from 2.0 to 6.6 and averaged 3.3 following drug administration. In a study reported by Cone (1990), one subject was administered morphine and a second sub-ject received codeine. Saliva and plasma were collected and tested by RIA. Following intramus-cular (IM) doses of 10 mg and 20 mg of morphine sulfate, plasma morphine concentrations in subject one peaked within 30 min at 66.1 ng/mL and 150.2 ng/mL, respectively. Saliva mor-
9
This document is a research report submitted to the U.S. Department of Justice. This report has not been published by the Department. Opinions or points of view expressed are those of the author(s)
and do not necessarily reflect the official position or policies of the U.S. Department of Justice.

phine concentrations peaked at 30 min postdose and were 10.8 ng/mL after the 10 mg dose and 37.8 ng/mL after the 20 mg dose. The morphine concentrations were less than the analytical sensitivity of 0.6 ng/mL by 24 h. Following IM doses of 60 mg and 120 mg of codeine, peak plasma concentrations in subject 2 of 212.4 ng/mL and 272.4 ng/mL, respectively, were reached in less than 30 min. Corresponding peak saliva concentrations of 183.9 ng/mL and 307.6 ng/mL were reached in 30 min to 45 min after the dose. All concentrations were estimates based on immunoreactivity. Cone also demonstrated that saliva concentrations of heroin and its metabolites, 6-monoacetyl morphine (6-MAM) and morphine, were “highly elevated” over plasma concentrations for the first hour after intranasal heroin administration (Cone, 1993). The concentrations remained higher than those found in plasma for up to 6 h after the dose was administered. It has been demonstrated that opiates can be detected in saliva by immunoassay techniques such as RIA and enzyme immunoassay (EIA) (Gorodetzky and Kullberg, 1974; Cone, 1990). Gorodetzky showed that following single 5 mg/70 Kg or 10 mg/70 Kg IV doses of heroin, opi-ates could be detected in saliva by EIA for 1 h to 2 h (Gorodetzky and Kullberg, 1974). Opiates were not consistently detected in saliva following a dose of 2.5 mg/70 kg. Gorodetzky and Kull-berg also reported that morphine could be detected in saliva by EIA for 3 h to 4 h following chronic subcutaneous administration of 30 mg of morphine. Wang et al. (1994) reported detecting opiates in the saliva of a single subject who received a 12 mg intranasal dose of heroin. In this subject, saliva heroin and 6-MAM concentrations peaked at 10 min following dosing at concentrations of 307.8 ng/mL and 58.7 ng/mL, respectively. One hour after administration, the morphine concentrations peaked at 25.4 ng/mL. By 3 h postdose, the concentrations of all three drugs were less than the LOD of the assay. The saliva samples were analyzed by GC/MS. Jenkins et al. (1995) reported a study designed to compare heroin concentrations in saliva and blood after administering the drug intravenously and by smoking. Two subjects were adminis-tered heroin through smoking (2.6 mg, 5.2 mg, and 10.5 mg doses) and also by IV administra-tion (5 mg, 10 mg, and 20 mg doses). Saliva heroin concentrations peaked 2 min after smoking and 2 min to 5 min after IV administration. After smoking, peak heroin concentrations ranged from 3,534 ng/mL to 20,580 ng/mL. Peak heroin concentrations from 6 ng/mL to 30 ng/mL were measured following the IV dose. The 6-MAM and morphine were also detected in blood and saliva after both routes of administration. Saliva to blood (S/B) concentration ratios were greater than 5 at all time points following smoked administration. Following IV administration, S/B ratios were always less than 2. The authors attributed the differences in S/B ratios to con-tamination of the saliva following smoking. Kidwell (1990) reported detecting morphine and 6-MAM in the saliva of a heroin user by LC/MS. The use of LC/MS for the analysis of morphine and 6-MAM in saliva is of particular interest because the saliva was analyzed directly. This technique offered significant advantages such as reduced analysis time and costs compared to GC/MS methods primarily because LC/MS did not require preextraction of the saliva or derivatization of the opiate drugs and metabolites.
10
This document is a research report submitted to the U.S. Department of Justice. This report has not been published by the Department. Opinions or points of view expressed are those of the author(s)
and do not necessarily reflect the official position or policies of the U.S. Department of Justice.

Several other opioid drugs (opiates or synthetic drugs with opiate-like actions) and their metabo-lites have been reported in saliva. Examples are propoxyphene, pholcodine, hydromorphone, buprenorphine, meperidine, and methadone (Mucklow et al., 1978; Idowu and Caddy, 1982; Schramm et al., 1992; Cone, 1993; Sharp et al., 1983; Jenkins et al., 1995). 2.1.6 Review Articles A number of articles were identified that provided reviews of the drugs-in-saliva literature. Arti-cles were obtained from as early as 1977 (Horning et al., 1977). Early articles focused primarily on the detection of therapeutic drugs in saliva and the use of saliva as a diagnostic specimen for clinical purposes (Horning et al., 1977; Mucklow et al., 1978). They explored the S/P ratios of these drugs and attempted scientific explanations for variations in these ratios, such as protein binding, pKa of the drug, and salivary pH. The reviews warned of factors that can affect salivary flow and ultimately the disposition of drugs into saliva (Mandel, 1990). Later reviews provided summaries of the saliva literature on many drugs of abuse such as opiates, barbiturates, methaqualone, and marijuana (Schramm et al., 1992; Cone, 1993). In addition, they provided information on therapeutic drug classes such as anticonvulsants, antidepressants, and antiar-rhythmics (Drobitch and Svensson, 1992). Each review article and the major topics discussed are listed below:
1. Use of Saliva in Therapeutic Drug Monitoring (Horning et al., 1977). Major drugs/drug classes discussed: antipyrine, caffeine, ethosuximide, phenobarbital, phenytoin, primi-done, and theophylline.
2. Drug Concentration in Saliva (Mucklow et al., 1978). Major drugs/drug classes dis-
cussed: antipyrine, chlorpropamide, meperidine, phenobarbital, phenytoin, propranolol, and tolbutamide.
3. A Review of the Use of Saliva in the Forensic Detection of Drugs and Other Chemicals
(Idowu and Caddy, 1982). Major drugs/drug classes discussed: barbiturates, benzodi-azepines, cannabinoids, ethanol, lithium, heavy metals, and methaqualone. Major topics discussed: secretion of drugs into saliva and advantages and disadvantages of saliva test-ing. This article also contains a table outlining the pKa, percent plasma protein binding, calculated S/P ratios, experimental S/P ratios, and journal references for 106 common drugs of abuse, therapeutic drugs, and other chemicals.
4. Drugs of Abuse in Saliva: A Review (Schramm et al., 1992). Major drugs/drug classes
discussed: amphetamines, barbiturates, benzodiazepines, cannabinoids, cocaine, methaqualone, opioids, and phencyclidine. Major topics discussed: advantages and dis-advantages of saliva testing.
5. The Diagnostic Uses of Saliva (Mandel, 1990). Major topics discussed: saliva collection,
detecting oral diseases, detecting systemic diseases, clinical analyses, hormone monitor-ing, drug monitoring, antiviral antibody screening, and viral antigen screening.
11
This document is a research report submitted to the U.S. Department of Justice. This report has not been published by the Department. Opinions or points of view expressed are those of the author(s)
and do not necessarily reflect the official position or policies of the U.S. Department of Justice.

6. Therapeutic Drug Monitoring in Saliva (Drobitch and Svensson, 1992). Major drugs/drug classes discussed: antidepressants, carbamazepine, cyclosporin, digoxin, disopyramide, ethosuximide, lidocaine, lithium, methotrexate, phenobarbital, phenytoin, primidone, procainamide, quinidine, and theophylline. Major topics discussed: composi-tion, anatomy and physiology of saliva and salivary glands, factors affecting salivary drug concentrations, and saliva collection.
7. Laboratory Tests for Rapid Screening of Drugs of Abuse in the Workplace: A Review (Schwartz et al., 1993). Topics discussed: salivary ethanol tests.
8. Saliva Testing for Drugs of Abuse (Cone, 1993). Major drugs/drug classes discussed:
amphetamines, barbiturates, benzodiazepines, caffeine, cocaine, ethanol, inhalants, ly-sergic acid diethylamide, marijuana, opioids, phencyclidine, and nicotine.
9. Methods for Collecting Saliva (Navazesh, 1993). Major topics discussed: methods for
collecting whole saliva, and methods for collecting saliva from individual glands.
10. Forensic Science (Brettell and Saferstein, 1995). Major drugs/drug classes discussed: co-caine, ethanol, and opioids.
11. Saliva as an Analytical Tool in Toxicology (Hold et al., 1996). Major topics discussed:
composition, anatomy and physiology of saliva and salivary glands, saliva collection, analytical methods, and the secretion of drugs into saliva.
2.1.7 Therapeutic and Other Drugs and Miscellaneous Topics This section encompassed a large number of articles. They were collected primarily because they provide useful background information and present a historical perspective of drugs in sa-liva. The articles discuss saliva collection protocols, pharmacokinetics, and therapeutic value. The following drugs or endogenous compounds were discussed.
1. Acetaminophen (Drehsen and Rohdewald, 1981) 2. Antidepressants (Drobitch and Svensson, 1992) 3. Antipyrine/capillary electrophoresis (Horning et al., 1977; Mucklow et al.,1978; Perrett
and Ross, 1995) 4. Barbiturates (Horning et al., 1977; Mucklow et al., 1978; Idowu and Caddy, 1982; Sharp
et al., 1983; Drobitch and Svensson, 1992; Schramm et al., 1992; Cone, 1993) 5. Basic drugs/capillary electrophoresis (Stalberg et al., 1995) 6. Benzodiazepines (Tjaden et al., 1980; Idowu and Caddy, 1982; Valentine et al., 1982;
Sharp et al., 1983; Hart’t and Wilting, 1988; Schramm et al., 1992; Cone, 1993) 7. Caffeine (Horning et al., 1977; Moncrieff, 1991; Cone, 1993) 8. Carbamazepine (Drobitch and Svensson, 1992; Chee et al., 1993) 9. Chlorpropamide (Mucklow et al., 1978) 10. Cyclosporin (Drobitch and Svensson, 1992) 11. Desipramine (Pi et al., 1991) 12. Digoxin (Drobitch and Svensson, 1992)
12
This document is a research report submitted to the U.S. Department of Justice. This report has not been published by the Department. Opinions or points of view expressed are those of the author(s)
and do not necessarily reflect the official position or policies of the U.S. Department of Justice.

13. Diphenhydramine (Sharp et al., 1983) 14. Disopyramide (Drobitch and Svensson, 1992) 15. Ephedrine/capillary electrophoresis (Chicharro et al., 1995; Jones, 1995) 16. Ethanol (Jones, 1979; Idowu and Caddy, 1982; Bates et al., 1993; Cone, 1993; Jones,
1993; Kiesow et al., 1993; Schwartz et al., 1993; Jones, 1995) 17. Ethosuximide (Horning et al., 1977; Drehsen and Rohdewald, 1981; Paton and Logan,
1986; Drobitch and Svensson, 1992) 18. Heavy metals (Idowu and Caddy, 1982) 19. Human immunodeficiency virus antibodies (Gomez et al., 1994) 20. Ibuprofen (Steijger et al., 1993) 21. Inhalants (Cone, 1993) 22. Lidocaine (Drobitch and Svensson, 1992) 23. Lysergic acid diethylamide (Cone, 1993) 24. Lithium (Idowu and Caddy, 1982; Drobitch and Svensson, 1992) 25. Methadone (Wolff and Hay, 1991) 26. Meperidine (Mucklow et al., 1978) 27. Methaqualone (Peat and Finkle, 1980; Idowu and Caddy, 1982; Sharp et al., 1983;
Schramm et al., 1992) 28. Methotrexate (Drobitch and Svensson, 1992) 29. Nicotine/cotinine (Benkirane et al., 1991; Cone, 1993) 30. Phencyclidine (Bailey and Guba, 1980) 31. Phenytoin (Horning et al., 1977; Mucklow et al., 1978; Paton and Logan, 1986; Drobitch
and Svensson, 1992) 32. Primidone (Horning et al., 1977; Drobitch and Svensson, 1992) 33. Procainamide (Drobitch and Svensson, 1992) 34. Propranolol (Mucklow et al., 1978) 35. Quinidine (Drobitch and Svensson, 1992) 36. Salicylates (Drehsen and Rohdewald, 1981) 37. Steroids (Dabbs, 1991; Schramm et al., 1990; Shipley et al., 1992; Quissell, 1993) 38. Theophylline (Horning et al., 1977; Moncrieff, 1991; Drobitch and Svensson, 1992) 39. Tolbutamide (Mucklow et al., 1978) Miscellaneous: 1. Capillary electrophoresis (Northrop et al., 1994; Perrett and Ross, 1995; Caslavska et al.,
1995) 2. Acetylator phenotyping (Hutchings and Routledge, 1996) 3. Frontline test sticks (Iwersen and Schmoldt, 1996)
2.1.8 Discussion and Conclusions The literature search demonstrated that a substantial amount of scientific information is known about drugs in saliva. This is particularly true of therapeutic drugs where 33 reprints were ob-tained. Less is known about drugs of abuse in saliva. Only eight articles were identified that re-ported amphetamines in saliva. These were limited in scope and did not provide current scientific data. Twenty-two reprints were obtained that discussed cocaine and its metabolites in saliva.
13
This document is a research report submitted to the U.S. Department of Justice. This report has not been published by the Department. Opinions or points of view expressed are those of the author(s)
and do not necessarily reflect the official position or policies of the U.S. Department of Justice.

They provided substantial information about sample collection, testing, S/P ratios, and interpreta-tion. Testing procedures for cocaine and its metabolites in saliva included RIA, GC-NPD, GC/MS, and LC/MS methods. Several authors calculated S/P ratios. Significant correlations were demonstrated between saliva cocaine concentrations and physiological and behavioral ef-fects. Eleven articles reported detecting THC in saliva. Testing methods for THC and its metabo-lites included RIA, EIA, GC-ECD, GC/MS, and LC with electrochemical detection. The articles clearly demonstrated that cannabinoids can be detected in saliva. They also showed that a con-troversy exists about whether cannabinoids detected in saliva are the result of oral contamination from the route of administration, or actually reflect circulating blood concentrations of the drug. Ten articles were identified that discussed opiates in saliva. The opiates included codeine, mor-phine, 6-MAM, and heroin. Testing methods included RIA, EIA, GC-NPD, GC/MS, and LC/MS. The articles presented saliva pharmacokinetic profiles of these drugs and metabolites following oral, intranasal, IV, and smoked administration. Several articles presented S/P or S/B drug concentration ratios.
The literature demonstrated that testing for drugs of abuse in saliva can be readily performed. However, more scientific data are needed to fully assess the utility of saliva as a testing specimen for amphetamines, cannabinoids, and opiates. A number of methods for collecting saliva were presented in the literature. Collections may pro-duce either stimulated or unstimulated saliva. Procedures used to stimulate saliva production may affect the pH of the saliva, which may affect both deposition of the drug into saliva and immunoassay drug tests. A related and controversial topic is the potential for contamination of the saliva with the administered drug. This phenomenon is a potential problem when drugs are administered orally (by mouth), intranasally (through the nose), or are smoked. It was reported as a problem when testing for cocaine, THC, and opiates in saliva. It may also be a potential prob-lem when testing for amphetamine in saliva, since methamphetamine is now commonly abused by smoking. Relating a saliva drug concentration to a dose may be difficult due to the potential for oral contamination and the elevated saliva concentrations seen in many of the studies imme-diately following drug administration. Relating saliva drug concentrations to blood concentra-tions, accurately predicting S/P ratios, and relating saliva drug concentrations to physiological and behavior effects is also problematic when the potential for oral contamination exists. Several issues about saliva collection need to be clarified. First, for each drug of interest, the ki-netics of the drug in stimulated and unstimulated saliva need to be described. Second, collection procedures need to be optimized to reduce the potential for erroneous results from items that in-advertently stimulate saliva production during collection. In addition, collection procedures need to address the potential for oral contamination from the route of drug administration. Perhaps oral contamination can be eliminated by simply “rinsing” the oral cavity with a suitable liquid prior to saliva collection. In most of the studies reviewed above, the authors neglected to address the effect of the saliva collection procedure on their results. All future studies performed on saliva as a matrix for drug testing need to be preceded by a thorough investigation of the potential effects of collection procedures on the data. They should include rationale for the collection procedure chosen and a
14
This document is a research report submitted to the U.S. Department of Justice. This report has not been published by the Department. Opinions or points of view expressed are those of the author(s)
and do not necessarily reflect the official position or policies of the U.S. Department of Justice.

discussion of the potential effects of the procedure on the saliva drug concentrations, results, and conclusions. A variety of analytical methods have been used to test for drugs of abuse in saliva. The thin-layer chromatography (TLC), RIA, EIA, GC-NPD, GC-ECD, GC/MS, and LC/MS were reported. Only TLC procedures lacked the sensitivity to detect drugs in saliva. One topic that was not thoroughly discussed by the authors was the efficacy of commercial immunoassy kits for saliva drug testing. Most commercially available immunoassay kits have primary reactivity to urinary drug metabolites. For cocaine and THC, the major urinary metabolites are BZE and THC-COOH, respectively. However, cocaine and THC were found in greater concentrations in saliva than their metabolites. In addition, saliva concentrations of drugs of abuse are similar to blood concentrations and much lower than urinary concentrations. Therefore, the kits may not have adequate sensitivity to reliably detect drugs of abuse in saliva. An additional potential problem when testing saliva with immunoassay kits is that salivary pH can vary considerably (and be af-fected by the collection technique). Some analysis kits, such as those for cannabinoids, are pH sensitive. Therefore, some commercial immunoassay test kits may have limited utility for the analysis of saliva samples. The use of LC/MS for the detection of cocaine, BZE, ecgonine, mor-phine, and 6-MAM in saliva is of particular interest because the saliva can be analyzed directly. This technique offers additional advantages. It has reduced analysis time and costs compared to conventional methods because it does not require preextraction of aqueous samples or derivatiza-tion of the polar drug metabolites. Also, glucuronide metabolites may be analyzed without hy-drolysis procedures. Although drugs of abuse are readily detected in saliva, care must be taken in selecting an immu-noassay screening method to ensure that the method is not pH dependent, is sufficiently sensi-tive, and is specific for the drug or metabolite found in saliva. LC/MS shows promise as a technique to analyze saliva samples for drugs of abuse and their metabolites. Do saliva concentrations of abused drugs reflect blood concentrations? Much of the pharmacokinetic literature focuses on serum, plasma, or blood drug concentrations. The literature relating physiological and behavioral effects to drug concentrations also focuses on these specimens. Urinary drug and drug metabolite concentrations do not correlate with physiological or behavioral effects. Therefore, if saliva drug concentrations correlate with blood drug concentrations, then saliva would be an extremely valuable specimen for interpretative purposes in the criminal justice system, impaired-driving cases, and post-accident testing, and for therapeutic drug monitoring. Mathematical models have been developed to predict the saliva to plasma ratio for acidic and basic drugs. For amphetamine, the experimentally determined S/P ratios supported the ratios predicted from the model. Cocaine may be ingested orally and is commonly abused by insuffla-tion or by smoking. When ingested by these routes, elevated S/P ratios are observed immediately after consumption. These elevated ratios are attributed to oral contamination of the saliva with cocaine. With the exception of this problem, there appears to be a reasonable correlation between saliva and plasma cocaine concentrations. THC and its metabolites have been detected in saliva. Some reports indicate that there is a relationship among dose, saliva, and blood drug concentra-tion; however, more research is needed to define this relationship. Opiates may be ingested orally
15
This document is a research report submitted to the U.S. Department of Justice. This report has not been published by the Department. Opinions or points of view expressed are those of the author(s)
and do not necessarily reflect the official position or policies of the U.S. Department of Justice.

and are commonly abused intravenously or by smoking. When opiates are smoked, S/P ratios are elevated immediately after consumption. These elevated ratios are attributed to oral contamina-tion of the saliva with the drug. Despite this problem, there appears to be a dose-response rela-tionship for opiates in saliva, and S/P ratios may be useful in predicting blood concentrations from saliva data. There is a dose-response relationship for most drugs of abuse found in saliva. Therefore, saliva concentrations may be used to predict plasma concentrations. However, this should be done with extreme caution since many factors—most notably route of administration—may confound pre-dictions. 2.2 Controlled Clinical Study 1 The second phase of the research was designed to determine through in vivo human studies whether saliva was a suitable specimen for drug testing in the criminal justice system. The study was designed to assess the utility of saliva as a specimen for drugs of abuse testing and for estimating the circulation of blood drug concentrations. Codeine was used as a model drug for this work. It was chosen because it is representative of drugs commonly abused in the criminal justice system and, unlike marijuana, PCP, and cocaine (which are illegal, highly addictive, or dangerous drugs), there were no ethical concerns to consider when administering codeine to human subjects. Codeine is commonly prescribed, very safe to administer, and (like heroin) it is metabolized to morphine. In addition, both codeine and morphine are readily detected by immunoassay screening techniques and by GC/MS. The protocol described below allowed for the collection of saliva and plasma in a controlled clinical environment. The data obtained were invaluable in assessing the usefulness of saliva as a testing specimen, for relating saliva concentrations to dose, and for comparing saliva drug concentrations to those in other specimens. In this section, no distinction is made between oral fluid and saliva. 2.2.1 Human Subjects and Study Protocol Seventeen human subjects were recruited at the University of Utah Health Sciences Center to participate in the Institutional Review Board (IRB) approved study. Subjects were required to sign informed consent forms and be drug free to enter the study. To ensure that the subjects were drug free, urinalysis drug tests were performed for the following drugs: amphetamines, opiates, BZE, cocaine, 9-carboxy-∆9-tetrahydrocannabinol, benzodiazepines, and phencyclidine using EMIT® (Syva Corp., Palo Alto, CA). Subjects were excluded if they had taken any medications containing opiates during the preceding 6 months, or if they had a history of acute or chronic ill-nesses. Subjects were admitted to the Clinical Research Center at the University of Utah Health Sciences Center on the evening before the study. The following morning, the subjects were given a single 30 mg dose of liquid codeine phosphate. The codeine dose was administered under di-rect supervision. The subjects brushed their teeth with toothpaste and/or vigorously rinsed their mouths following drug administration and prior to saliva collection. Blood (10 mL) was col-lected in heparinized tubes at the following times: predose, 15 min, 30 min, and 60 min, and 2 h, 4 h, 6 h, 8 h, 10 h, 12 h, and 24 h. Plasma was separated from the blood by centrifugation and stored at -20 °C until analysis. Saliva was collected at the same time points by having the sub-
16
This document is a research report submitted to the U.S. Department of Justice. This report has not been published by the Department. Opinions or points of view expressed are those of the author(s)
and do not necessarily reflect the official position or policies of the U.S. Department of Justice.

jects spit into 5 mL inert polyethylene tubes. The pH of the saliva was recorded at the time of collection and the samples were then stored at -20 °C until analysis. 2.2.2 Analysis Reference solutions of codeine and morphine were combined and diluted with methanol to ob-tain stock solutions containing 10 ng/µL and 1.0 ng/µL. These stock solutions were used to pre-pare calibrators. Saliva calibration curves contained the following concentrations of codeine and morphine: 0.0 ng/mL, 5.0 ng/mL, 10.0 ng/mL, 25.0 ng/mL, 50.0 ng/mL, 100.0 ng/mL, 200.0 ng/mL, 400.0 ng/mL, and 500.0 ng/mL. A similar procedure was used to make separate stock solutions of codeine and morphine for preparation of quality control (QC) samples. Batches of QC samples were prepared in saliva at 5.0 ng/mL and 250.0 ng/mL, aliquoted into silanized glass tubes in 0.5 mL volumes, and stored at -20 °C until analysis. For the plasma analysis, QC sam-ples were prepared in plasma at 50.0 ng/mL and 100.0 ng/mL, aliquoted in 2.0 mL volumes, and stored at -20 °C until analysis. Concentrated internal standard solutions were combined and di-luted in methanol to achieve a final concentration of 1.0 ng/µL of codeine-d3 and morphine-d3. Drug-free saliva was collected from healthy volunteers and stored at -4 °C until use. In 0.5 mL aliquots of calibrators, controls, and samples were transferred to labeled and silanized glass tubes. Codeine-d3 (25 µL) and morphine-d3 (25 ng) were added to each tube. Distilled water (4 mL) was added followed by 2 mL of 0.1 M phosphate buffer (pH 6.0). The specimens were mixed and then centrifuged at 2000 G for 10 min. Clean Screen® ZSDAU020 (United Chemical Technologies, Horsham, PA) solid phase extraction (SPE) columns were conditioned with methanol (3 mL), distilled water (3 mL), and phosphate buffer (1 mL). Supernatants of the specimens were added to the appropriately labeled SPE column. The columns were washed with distilled water (2 mL), 0.1 M acetate buffer, pH 4.5 (2 mL), and methanol (3 mL). Codeine and morphine were eluted with 3 mL methylene chloride:isopropanol (80:20) contain-ing 3% ammonium hydroxide. The eluates were evaporated to dryness at <40 °C under a stream of nitrogen. The dried extracts were reconstituted in 100 µL chloroform, derivatized with trifluoroacetic anhydride (TFAA) (100 µL) for 30 min at 70 °C and evaporated to dryness at <40 °C under a stream of nitrogen. Derivatized extracts were reconstituted in 50 µL of ethyl acetate and analyzed on a Finnigan-Mat 4500 GC/MS (Finnigan-Mat, San Jose, CA) using positive-ion chemical ionization. Reconstituted residue (1 µL) was injected onto the column and the instrument was operated in the splitless mode. Methane-ammonia was used as the reagent gas, helium as the carrier gas, and the column was a DB1 (15 m x 0.32 mm x 0.25 µm) capillary column (J&W Scientific, Folsom, CA). The initial column temperature of 135 °C was held for 0.5 min and then programmed to 300 °C at the rate of 18 °C/min. The final temperature was held for 1 min. Temperatures of the injection port, interface, and ionizer were 250 °C, 250 °C, and 130 °C, respectively. The MH+ ion for each analyte was monitored with masses at m/z 396, 399, 478, and 481 for trifluoroacetyl derivatives of codeine, codeine-d3, morphine, and morphine-d3, respectively. Peak height ratios of codeine and morphine to their respective internal standards were calculated and the concentration of each analyte in the subject samples was determined by comparing ana-
17
This document is a research report submitted to the U.S. Department of Justice. This report has not been published by the Department. Opinions or points of view expressed are those of the author(s)
and do not necessarily reflect the official position or policies of the U.S. Department of Justice.

lyte response ratio to the least-squares equations generated from peak height ratios of the calibra-tors. The standard curves were linear from 5 ng/mL to 500 ng/mL (r > 0.98) for codeine and morphine. The level of detection (LOD) and level of quantitation (LOQ) were determined using serial dilutions of the lowest calibrator. The LOD for each analyte was the lowest concentration with a signal to noise (S/N) ratio of 3 or greater for each injection (n=5). The LOQ was the low-est concentration yielding a result within ± 20% of the target concentration and a coefficient of variation (CV) less than 10% (n=5). The S/N ratio for the LOQ was 10 or greater. Two QC sam-ples (low and high concentration) were run with every 30 specimens. The 1 mL to 2 mL of plasma were added to internal standards, 2 mL distilled water and 2 mL (10%) trichloroacetic acid. After mixing, the plasma mixture was centrifuged for 5 min. After separating and adjusting the pH to 9.0 with 10N NaOH, the supernatants were transferred to Bond Elut Certify™ (Varian, Harbor City, CA) extraction columns. The columns were pre-washed with methanol and distilled water. The columns were rinsed with distilled water, 0.1 M acetate buffer (pH 4.0), and methanol. Codeine and morphine were eluted with methylene chloride:isopropanol with 2% ammonium hydroxide. The elution step was repeated twice, and the final combined eluates containing drugs were evaporated to dryness at <40 °C under nitro-gen. The dried extracts were derivatized in TFAA (200 µL) with 200 µL chloroform for 30 min at 70 °C and dried under nitrogen at <40 °C. Derivatized extracts were reconstituted in 50 µL of chloroform and analyzed on a Finnigan Magnum ion trap mass spectrometer (Finnigan-Mat, San Jose, CA) in the positive-ion chemical ionization mode using acetone as the reagent gas, helium as the carrier gas, and a DB5MS (30 m x 0.25 mm x 0.25 µm) capillary column (J&W Scientific, Folsom, CA). Reconstituted extracts (1 µL) were injected in the splitless mode. The column tem-perature was held at 175 °C for 1 min, increased to 300 °C at 15 °C/min and held at 300 °C for 0.5 min. The injector and transfer line temperatures were maintained at 250 °C, and the manifold was maintained at 225 °C. Masses at m/z 396, 399, 478, and 481 were monitored for the trifluoroacetyl derivatives of codeine, codeine-d3, morphine, and morphine-d3, respectively. The standard curves were linear from 1 ng/mL to 1500 ng/mL for codeine and morphine. The areas under the pharmacokinetic curves (AUC) were computed for the interval 0 h to 24 h by the trapezoidal rule. The elimination rate constant (k) was estimated by linear regression of the plasma or saliva concentration data points after 2 h. The terminal half-life (t1/2) was estimated from 0.693/k. 2.2.3 Results and Discussion Only 0.5 mL of saliva was needed for the saliva GC/MS assay, and a LOQ of 5 ng/mL and a LOD of 1 ng/mL were routinely achieved. This method was fully validated for LOD, LOQ, pre-cision, and accuracy. Figure 1 shows a GC/MS chromatogram of a saliva specimen containing 5 ng/mL of codeine.
18
This document is a research report submitted to the U.S. Department of Justice. This report has not been published by the Department. Opinions or points of view expressed are those of the author(s)
and do not necessarily reflect the official position or policies of the U.S. Department of Justice.

5:545:315:09 800650
ine
ScansTime (minutes)
750700
Morphine-d3
Codeine-d3
Code
m/z 481
m/z 478
m/z 399
100.0
0.2
45.5
m/z 396 2.2
Figure 1. Chromatogram of 5 ng/mL codeine One objective of this study was to determine if codeine and morphine could be detected in saliva following a single oral dose. The mean time course for the appearance and disappearance of co-deine in plasma and saliva are shown in figure 2. The figure shows the mean codeine concentra-tion for the 17 subjects at each time point. No codeine or morphine was detected in the predose plasma or saliva specimens for any of the subjects. Morphine was not detected in any of the plasma specimens. After the oral administration, the plasma codeine concentrations peaked be-tween 30 min and 2 h (mean = 30 min) at concentrations ranging from 19 ng/mL to 74 ng/mL, with a mean of 46 ng/mL. Plasma concentrations declined rapidly, approaching the LOD for the assay within 12 h. No codeine was detected in any of the plasma specimens collected 24 h after drug administration. Cone (1993; see sec. 2.1.6) reported that heroin and its metabolites, 6-acetylmorphine (6-AM) and morphine were “highly elevated” compared to plasma concentra-tions for the first hour after intranasal heroin administration. Figure 2 demonstrates that the same phenomenon was observed in this study. Elevated saliva codeine concentrations were detected at the early collection times. Contamination of the oral cavity with codeine from the oral admini-stration was evident in the saliva specimens collected for at least the first hour after administra-tion. Codeine concentrations in the 15 min saliva specimens ranged from 690 ng/mL to over 15,000 ng/mL. The rapid decline in the mean saliva codeine concentration observed in the first 2 hours following administration was the result of elimination of codeine from the oral cavity by
19
This document is a research report submitted to the U.S. Department of Justice. This report has not been published by the Department. Opinions or points of view expressed are those of the author(s)
and do not necessarily reflect the official position or policies of the U.S. Department of Justice.

“natural cleansing” and does not reflect metabolism or redistribution. After an initial 2 h period, the mean saliva codeine concentration appeared to decline at a rate similar to that observed in the plasma (fig. 2). However, the mean saliva codeine concentrations remained 3 to 4 times greater than the plasma codeine concentrations throughout the 24 h interval.
10000 Saliva
Plasma
151050
Cod
eine
Con
cent
ratio
n (n
g/m
L)
1000 100 10
1 Time (hours)
Figure 2. Mean saliva and plasma codeine concentrations versus time Even though the slope of the decay curves for the plasma and saliva codeine concentrations were similar, significant differences were observed in the detection times for codeine in the two specimens due to the greater saliva concentrations. Codeine was detected in the 24 h saliva specimens from 11 of the 17 subjects. The concentrations were below the LOQ for the assay. The saliva from one subject contained 5 ng/mL of codeine at 24 h. No codeine was detected at 24 h in any plasma samples. Morphine (<5 ng/mL) was detected in three saliva specimens col-lected 15 min or 30 min post administration, but was not detected in any plasma samples. Estimates of the elimination rate constant, t1/2, and AUC for codeine in plasma and saliva are listed in table 1. Half-life estimates for codeine in plasma and saliva appear to be equivalent, 2.6 h and 2.9 h, respectively. These estimates were consistent with those reported by other re-searchers. Studies involving administration of other drugs of abuse have reported variations in half-life estimates between saliva and plasma. Cone et al. (1993; see sec. 2.1.6) reported similar saliva and plasma t1/2 estimates for cocaine administered intravenously (34.7 min and 34.9 min, respectively). In contrast, Jenkins et al. (1995; see sec. 2.1.6) observed differing pharmacokinetic results with cocaine and heroin in saliva versus plasma. The saliva t1/2 of heroin after smoking was reported to be approximately 14 to 60 times longer than that for blood and 2 to 208 times
20
This document is a research report submitted to the U.S. Department of Justice. This report has not been published by the Department. Opinions or points of view expressed are those of the author(s)
and do not necessarily reflect the official position or policies of the U.S. Department of Justice.
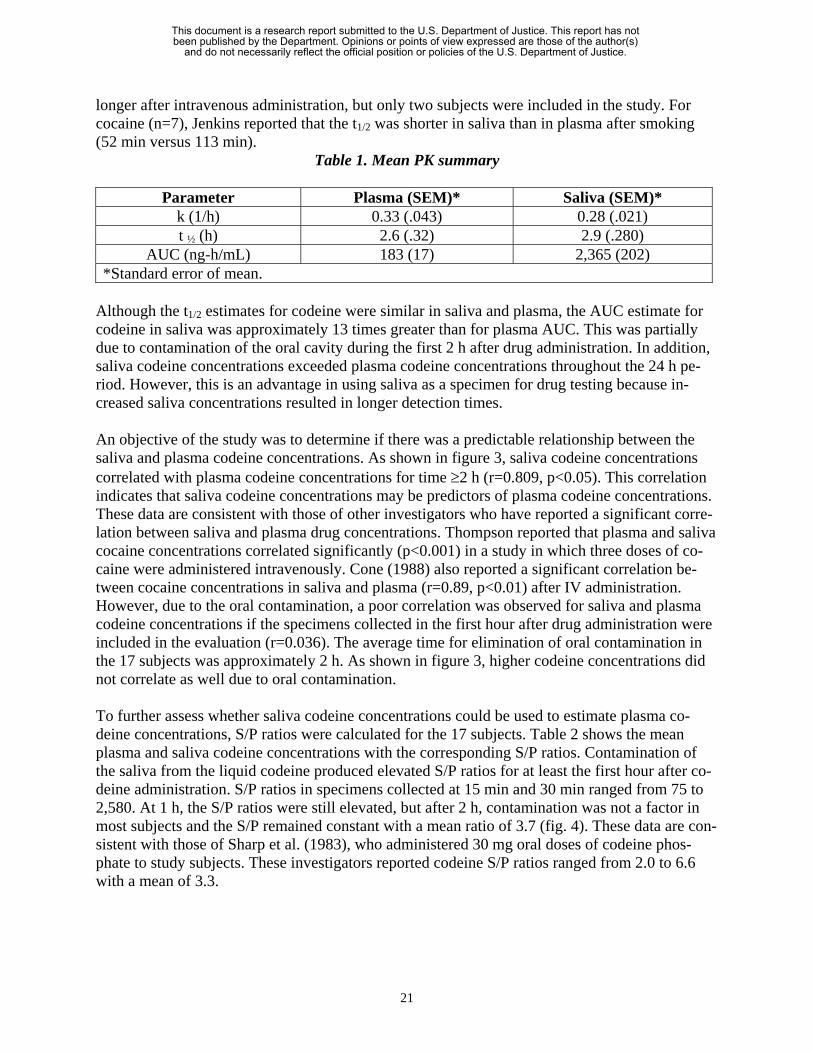
longer after intravenous administration, but only two subjects were included in the study. For cocaine (n=7), Jenkins reported that the t1/2 was shorter in saliva than in plasma after smoking (52 min versus 113 min).
Table 1. Mean PK summary
Parameter Plasma (SEM)* Saliva (SEM)* k (1/h) 0.33 (.043) 0.28 (.021) t ½ (h) 2.6 (.32) 2.9 (.280)
AUC (ng-h/mL) 183 (17) 2,365 (202) *Standard error of mean.
Although the t1/2 estimates for codeine were similar in saliva and plasma, the AUC estimate for codeine in saliva was approximately 13 times greater than for plasma AUC. This was partially due to contamination of the oral cavity during the first 2 h after drug administration. In addition, saliva codeine concentrations exceeded plasma codeine concentrations throughout the 24 h pe-riod. However, this is an advantage in using saliva as a specimen for drug testing because in-creased saliva concentrations resulted in longer detection times. An objective of the study was to determine if there was a predictable relationship between the saliva and plasma codeine concentrations. As shown in figure 3, saliva codeine concentrations correlated with plasma codeine concentrations for time ≥2 h (r=0.809, p<0.05). This correlation indicates that saliva codeine concentrations may be predictors of plasma codeine concentrations. These data are consistent with those of other investigators who have reported a significant corre-lation between saliva and plasma drug concentrations. Thompson reported that plasma and saliva cocaine concentrations correlated significantly (p<0.001) in a study in which three doses of co-caine were administered intravenously. Cone (1988) also reported a significant correlation be-tween cocaine concentrations in saliva and plasma (r=0.89, p<0.01) after IV administration. However, due to the oral contamination, a poor correlation was observed for saliva and plasma codeine concentrations if the specimens collected in the first hour after drug administration were included in the evaluation (r=0.036). The average time for elimination of oral contamination in the 17 subjects was approximately 2 h. As shown in figure 3, higher codeine concentrations did not correlate as well due to oral contamination. To further assess whether saliva codeine concentrations could be used to estimate plasma co-deine concentrations, S/P ratios were calculated for the 17 subjects. Table 2 shows the mean plasma and saliva codeine concentrations with the corresponding S/P ratios. Contamination of the saliva from the liquid codeine produced elevated S/P ratios for at least the first hour after co-deine administration. S/P ratios in specimens collected at 15 min and 30 min ranged from 75 to 2,580. At 1 h, the S/P ratios were still elevated, but after 2 h, contamination was not a factor in most subjects and the S/P remained constant with a mean ratio of 3.7 (fig. 4). These data are con-sistent with those of Sharp et al. (1983), who administered 30 mg oral doses of codeine phos-phate to study subjects. These investigators reported codeine S/P ratios ranged from 2.0 to 6.6 with a mean of 3.3.
21
This document is a research report submitted to the U.S. Department of Justice. This report has not been published by the Department. Opinions or points of view expressed are those of the author(s)
and do not necessarily reflect the official position or policies of the U.S. Department of Justice.

Table 2. Mean S/P ratios
Time Plasma Saliva S/P Ratios Hours (ng/mL) (ng/mL)
0 0 0 0 .25 12 4129 344 .5 38 1172 337 1 37 480 13 2 34 154 4.5 4 18 60 3.3
Mean (2 h to12 h) 3.7 A variety of methods are used to collect saliva and collection protocols may have an effect on saliva drug concentrations. For example, oral contamination was observed even when subjects were instructed to cleanse their oral cavities by brushing their teeth or vigorous rinsing of their mouths. Some collection methods stimulate saliva production, while others are designed to col-lect nonstimulated saliva. Nonstimulated saliva can be collected by spitting into containers or by the draining method. Techniques to collect stimulated saliva include chewing paraffin wax, Tef-lon®, rubber bands, or gum. A lemon drop or citric acid crystals can also be placed in the mouth to provide a stimulus for saliva production. Saliva collected by stimulation may differ in compo-sition from saliva collected by spitting due to changes in saliva flow rate. As saliva flow rate in-creases, the concentration of bicarbonate in the saliva increases. Therefore, the saliva pH increases and this affects saliva drug concentrations in a pH dependent fashion. Salivary pH in normal individuals is usually between 6.2 and 7.4. The pH of stimulated saliva is reported to fall within a narrow range around 7.4. The pH of the specimens in this study ranged from 6.0 to 8.0, but only 8 specimens had a pH above 7.0. As discussed, the pH of saliva may be an important factor in saliva drug concentrations. For ba-sic drugs, as the pH decreases, a greater concentration of drug will be ionized and the salivary concentration will increase. The theoretical S/P ratio for a particular drug can be estimated using the following mathematical model based on the Henderson-Hasselbach equation:
1 + 10(pKa-pHs) x fp S/P = -------------------
1 + 10(pKa-pHp) x fs Therefore, small changes in saliva pH should result in profound changes in the S/P. For codeine (pKa 8.2), the theoretical S/P at pH 6.0 is 20. However, at pH 7.0, it is only 2.1. In this study, the observed S/P ratios at pH 6.0 were not as high as predicted by the equation (except within the first hour of drug administration when oral contamination was still present). The observed mean S/P was 4.7 at pH 6.0, 3.4 at pH 7.0, and 1.8 at pH 8.0. Although there was a large inter- and in-trasubject variability observed for the S/P ratios (fig. 5), the mean S/P ratio decreased with in-creasing pH as predicted. However, the decrease was not as dramatic as predicted by the model.
22
This document is a research report submitted to the U.S. Department of Justice. This report has not been published by the Department. Opinions or points of view expressed are those of the author(s)
and do not necessarily reflect the official position or policies of the U.S. Department of Justice.

Figure 3. Saliva concentration versus plasma codeine concentrations
23
Figure 4. Mean S/P ratio over time
This document is a research report submitted to the U.S. Department of Justice. This report has not been published by the Department. Opinions or points of view expressed are those of the author(s)
and do not necessarily reflect the official position or policies of the U.S. Department of Justice.

Figure 5. pH versus codeine concentration
2.2.4 Conclusion
1. Saliva can be easily and noninvasively collected under direct observation. This eliminates the concerns about specimen integrity and identity often associated with urine collections. From 1 to 2 mL of saliva can be collected in 3 min to 5 min and small specimen volumes can be utilized for GC/MS analysis.
2. The detection time for codeine in saliva is at least 12 h longer than in plasma. Therefore,
saliva provides a much longer detection window for codeine use than does plasma.
3. A disadvantage of saliva drug testing is the potential for contamination of the oral cavity when the drug is administered orally, intranasally, or by smoking.
4. Elevated S/P ratios were observed for 1 h to 2 h after drug administration. However, after
the absorption phase, a significant correlation (r=0.809) between saliva and plasma con-centrations was observed in this study, and the mean S/P ratio remained constant. Saliva codeine concentrations could be used to estimate plasma concentrations through use of the S/P ratio once the oral contamination has been eliminated. However, these estimates should be made cautiously. One must ensure that oral contamination is not a factor. Sim-ple rinsing procedures did not remove the contamination to the oral dose.
24
This document is a research report submitted to the U.S. Department of Justice. This report has not been published by the Department. Opinions or points of view expressed are those of the author(s)
and do not necessarily reflect the official position or policies of the U.S. Department of Justice.
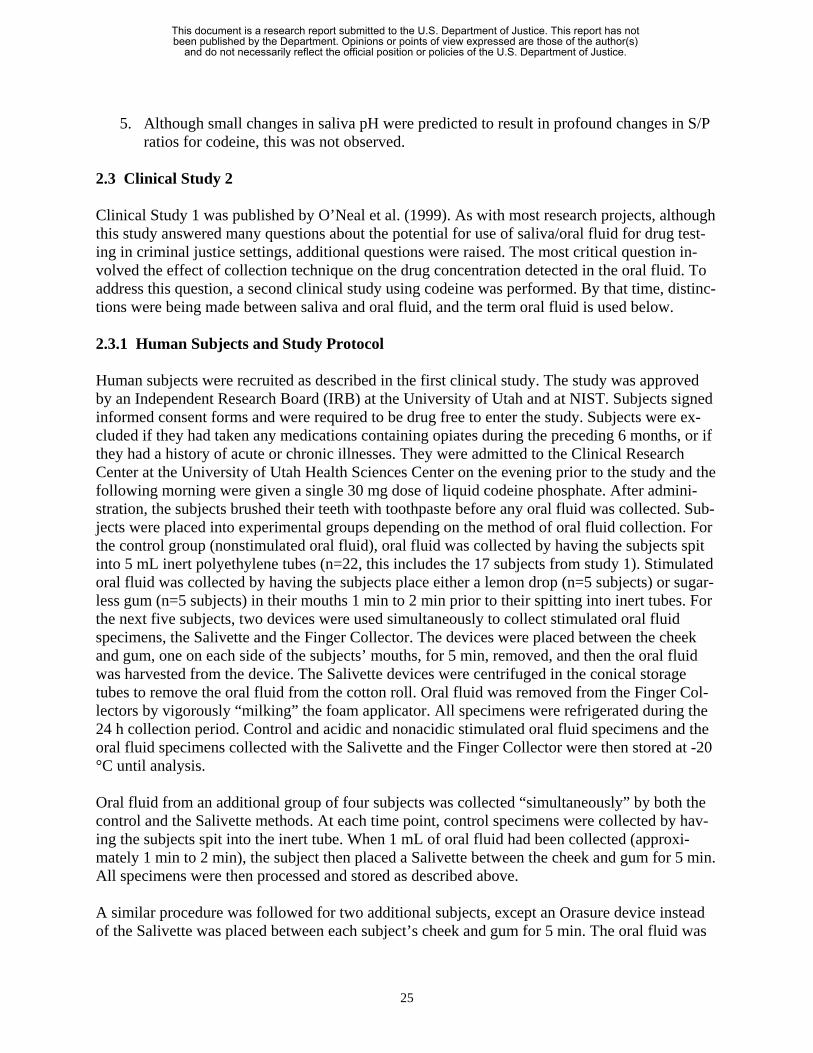
5. Although small changes in saliva pH were predicted to result in profound changes in S/P
ratios for codeine, this was not observed. 2.3 Clinical Study 2 Clinical Study 1 was published by O’Neal et al. (1999). As with most research projects, although this study answered many questions about the potential for use of saliva/oral fluid for drug test-ing in criminal justice settings, additional questions were raised. The most critical question in-volved the effect of collection technique on the drug concentration detected in the oral fluid. To address this question, a second clinical study using codeine was performed. By that time, distinc-tions were being made between saliva and oral fluid, and the term oral fluid is used below. 2.3.1 Human Subjects and Study Protocol Human subjects were recruited as described in the first clinical study. The study was approved by an Independent Research Board (IRB) at the University of Utah and at NIST. Subjects signed informed consent forms and were required to be drug free to enter the study. Subjects were ex-cluded if they had taken any medications containing opiates during the preceding 6 months, or if they had a history of acute or chronic illnesses. They were admitted to the Clinical Research Center at the University of Utah Health Sciences Center on the evening prior to the study and the following morning were given a single 30 mg dose of liquid codeine phosphate. After admini-stration, the subjects brushed their teeth with toothpaste before any oral fluid was collected. Sub-jects were placed into experimental groups depending on the method of oral fluid collection. For the control group (nonstimulated oral fluid), oral fluid was collected by having the subjects spit into 5 mL inert polyethylene tubes (n=22, this includes the 17 subjects from study 1). Stimulated oral fluid was collected by having the subjects place either a lemon drop (n=5 subjects) or sugar-less gum (n=5 subjects) in their mouths 1 min to 2 min prior to their spitting into inert tubes. For the next five subjects, two devices were used simultaneously to collect stimulated oral fluid specimens, the Salivette and the Finger Collector. The devices were placed between the cheek and gum, one on each side of the subjects’ mouths, for 5 min, removed, and then the oral fluid was harvested from the device. The Salivette devices were centrifuged in the conical storage tubes to remove the oral fluid from the cotton roll. Oral fluid was removed from the Finger Col-lectors by vigorously “milking” the foam applicator. All specimens were refrigerated during the 24 h collection period. Control and acidic and nonacidic stimulated oral fluid specimens and the oral fluid specimens collected with the Salivette and the Finger Collector were then stored at -20 °C until analysis. Oral fluid from an additional group of four subjects was collected “simultaneously” by both the control and the Salivette methods. At each time point, control specimens were collected by hav-ing the subjects spit into the inert tube. When 1 mL of oral fluid had been collected (approxi-mately 1 min to 2 min), the subject then placed a Salivette between the cheek and gum for 5 min. All specimens were then processed and stored as described above. A similar procedure was followed for two additional subjects, except an Orasure device instead of the Salivette was placed between each subject’s cheek and gum for 5 min. The oral fluid was
25
This document is a research report submitted to the U.S. Department of Justice. This report has not been published by the Department. Opinions or points of view expressed are those of the author(s)
and do not necessarily reflect the official position or policies of the U.S. Department of Justice.

removed from the Orasure device by centrifugation into the storage tube containing buffer and stored at -20 °C until analysis. In in vitro experiments, morphine and codeine were added to drug-free oral fluid in the following concentrations: 0.0 ng/mL, 10.0 ng/mL, 25.0 ng/mL, 100.0 ng/mL, and 200.0 ng/mL. Salivette and Finger Collector devices were placed in 2 mL aliquots of the fortified whole oral fluid (n=5) at each concentration. The oral fluid was allowed to completely saturate the device. The oral fluid was then removed from each device by centrifugation or milking and analyzed for codeine and morphine as described above. The recovery of codeine and morphine from each device was determined by comparison to oral fluid specimens of the same concentration. 2.3.2 Analysis The analysis procedures paralleled those of the initial clinical study. Drug-free oral fluid was col-lected from healthy volunteers and stored at -4 °C until use. The 0.5 mL aliquots of calibrators, controls, and samples were extracted by SPE, derivatized with TFAA, and analyzed on a Finni-gan Mat 4500 GC/MS using positive-ion chemical ionization. The AUCs were computed for the interval 0 h to 24 h by the trapezoidal rule. The elimination rate constant (k) was estimated by linear regression of the plasma or oral fluid concentration data points after 2 h. The terminal half-life (t1/2) was estimated from 0.693/k. 2.3.3 Results and Discussion The time course of codeine elimination from oral fluid for subjects using each of the five collec-tion methods is shown in figure 6. Because the first clinical study demonstrated that contamina-tion from the oral codeine produced elevated concentrations in the first 1 h to 2 h after administration, only mean concentrations from 2 h to 12 h are shown. Except for the 8 h time point, codeine concentrations in specimens collected by the control method (spitting) were con-sistently higher than those detected in specimens collected by the other methods. The control concentrations were, on average, 3.6 times higher than concentrations in specimens collected by acidic stimulation and 1.3 to 2.0 times higher than concentrations in specimens collected by the other three methods (fig. 6a and table 3). Because oral contamination appeared to be a significant problem for the 15 min to 30 min controlled collections, the 0.25 h time point was excluded when the average concentration ratio (alternate method/control method) was also calculated. Differences in the duration of the detection time were also observed for the five oral fluid collec-tion methods (table 4). In the control group, codeine was detected in all of the 12 h specimens and only 3 of 22 specimens had concentrations <5 ng/mL. Codeine was detected in 15 of 22 specimens (68%) at 24 h after drug administration. Using the Salivette and Finger Collector de-vices, all specimens collected at 12 h contained codeine. However, 60% of the samples contained codeine concentrations <5 ng/mL. At 24 h after administration, only two (40%) and one (20%) of the Salivette and Finger Collector samples, respectively, contained detectable codeine. Nonacidic oral fluid stimulation yielded only three (60%) positive specimens at 12 h (two of the subjects had codeine concentrations >5 ng/mL at 12 h and two (40%) positive specimens at 24 h). Using the acidic oral fluid stimulation method, no specimens collected at 24 h contained co-deine and four of five specimens collected at 12 h were also negative.
26
This document is a research report submitted to the U.S. Department of Justice. This report has not been published by the Department. Opinions or points of view expressed are those of the author(s)
and do not necessarily reflect the official position or policies of the U.S. Department of Justice.

Figure 6. Codeine time course by device
Rat
io
Time (hours)
Figure 6a. Comparison of oral fluid collection methods
27
This document is a research report submitted to the U.S. Department of Justice. This report has not been published by the Department. Opinions or points of view expressed are those of the author(s)
and do not necessarily reflect the official position or policies of the U.S. Department of Justice.

Table 3. Concentration comparisons by device used to collect oral fluid
Time (hours) Control SEM* Acidic SEM* Ratio* Nonacidic SEM* Ratio* Salivette SEM* Ratio**
Finger Collector SEM Ratio*
0.25 3,542 727 556 301 6.4 1,365 441 2.6 1,171 389 3.0 1,013 337 3.5 0.5 1,000 180 203 58 4.9 338 106 3.0 916 309 1.1 825 475 1.2
1 413 53 103 32 4.0 183 56 2.3 356 69 1.2 412 86 1.02 152 19 74 22 2.1 94 15 1.6 99 17 1.5 106 43 1.44 66 10 18 3.8 3.7 47 6.3 1.4 60 6 1.1 62 14 1.16 38 5 12 2.6 3.2 21 7.2 1.8 23 4 1.7 19 2.8 2.08 19 2 5 1.3 3.8 9 1.7 2.1 21 7 0.9 34 12.2 0.6
10 12 1.5 <5 6 1.5 2.0 7 1 1.7 7 1.4 1.712 8 1.3 ND*** <5 <5 5 2 1.624 <5 ND*** <5 <5 ND***
28
Average Ratio 3.6 2.0 1.3 1.3 *Standard error of mean. **Control concentration/method or device concentration. ***Not determined.
This document is a research report submitted to the U.S. Department of Justice. This report has not been published by the Department. Opinions or points of view expressed are those of the author(s)
and do not necessarily reflect the official position or policies of the U.S. Department of Justice.

Pharmacokinetic parameters, including estimates for the elimination rate constant, t1/2, and AUC, were calculated from the codeine concentrations detected using each collection method. These data are shown in table 5, which illustrates that substantially different pharmacokinetic parameters were obtained using the codeine concentrations from the different collection meth-ods. As illustrated in figure 6, the slope of the elimination curve for codeine using the acidic col-lections was steeper than that of the other four methods. Therefore, the calculated t1/2 for the acidic method was significantly less than the t1/2 for the control method, 1.8 h and 3.1 h, respec-tively. The t1/2 for the acidic method was also less than the t1/2 for the other methods, but the dif-ference was less dramatic. Due to the higher codeine concentrations observed for the control method, especially within the first 30 min after drug administration, the control method AUC was significantly greater than the calculated AUC for the acidic and nonacidic collection meth-ods. However, there was considerable interindividual variation in peak codeine concentrations observed among the collection methods and within each collection method group. For example, a concentration range of 82 ng/mL to 1,690 ng/mL was observed for acidic stimulation collection and 298 ng/mL to 16,500 ng/mL for the control collection method.
Table 4. Duration of positive codeine detection by device
Collection Method ≥ 1 ng/12 h ≥ 5 ng/12 h ≥ 1 ng/24 h Control 100% 86% 68% Salivette 100 40 40
Finger Collector 100 40 20 Nonacidic 60 40 40
Acidic 20 20 0
Table 5. Mean PK estimates
Collection Method k(1/h) t ½ AUC Plasma #1 0.33 2.6 183 Control #1 0.28 2.9 2,365
Control 0.26 3.0 2,167 Salivette 0.30 2.7 1,307
Finger Collector 0.26 3.3 1,011 Acidic 0.40 1.8 480
Nonacidic 0.34 2.5 940 The in vitro recovery studies suggested that there might be a difference in codeine absorption or recovery between the Salivette and the Finger Collector. The percent recovery of codeine and morphine was 8.3% and 6.8% less than the control, respectively, for the Salivette and 46.7% and 39.1% less than the control, respectively, for the Finger Collector at concentrations from 10 ng/mL to 200 ng/mL (fig. 7). An additional disadvantage of the Finger Collector was identified during the in vitro study. Typically, 75% to 90% of the oral fluid was recovered from the Sali-vette, but only approximately 50% of the oral fluid was recovered from the Finger Collector.
29
This document is a research report submitted to the U.S. Department of Justice. This report has not been published by the Department. Opinions or points of view expressed are those of the author(s)
and do not necessarily reflect the official position or policies of the U.S. Department of Justice.

Salivette
Finger Collector
Figure 7. In vitro recovery of morphine and codeine Because oral fluid specimens were collected from the same subjects at the same time with the two devices, a direct comparison of the in vivo collection with devices was possible. As illustrated in figure 8, the mean codeine concentrations using these two collection devices were similar throughout the 24 h collection interval. With the exception of the 8 h specimen, the time course of codeine elimination following collection with the devices followed a similar curve. However, during the clinical study, the authors were able to recover >500 µL of oral fluid from only 14 of 55 of the Finger Collector collections (25.5%) compared to 45 of 55 collections (81.8%) using the Salivette. Thirty-five of 55 specimens collected using the Finger Collector during the clinical study had a recovered volume of <300 µL. The authors were unable to analyze 9 of the 55 clinical specimens collected with the Finger Collector (all from the same 3 subjects) because no oral fluid could be milked from the foam applicator. In a separate group of four subjects, oral fluid was collected almost simultaneously using the control method and the Salivette. The time course of codeine elimination from oral fluid for the subjects in this experiment is shown in figure 9. Codeine concentrations in oral fluid collected by the control method were consistently higher than concentrations in oral fluid collected with the Salivette. The codeine concentrations for the control group were approximately 2.3 times higher than concentrations in the oral fluid collected with the Salivette. A decreasing trend of 4.0 to 1.6 was observed through the experimental session. The first time point (0.25 h) was excluded when the average ratio was calculated for each object group. Even though the control codeine concen-trations were typically greater than twice the Salivette concentrations, the detection time for co-deine in these subjects was similar. Codeine concentrations were <5 ng/mL in oral fluid collected by both methods at 24 h after drug administration. The calculated t1/2 for each group was similar (2.3 h and 2.5 h), but the AUC for the control group was more than three times that from the Salivette subject group.
30
This document is a research report submitted to the U.S. Department of Justice. This report has not been published by the Department. Opinions or points of view expressed are those of the author(s)
and do not necessarily reflect the official position or policies of the U.S. Department of Justice.

Figure 8. Salivette versus Finger Collector codeine concentrations
Figure 9. Control versus Salivette codeine concentrations
31
This document is a research report submitted to the U.S. Department of Justice. This report has not been published by the Department. Opinions or points of view expressed are those of the author(s)
and do not necessarily reflect the official position or policies of the U.S. Department of Justice.

Results from the experiment in which oral fluid was collected by the control method and almost simultaneously with the Orasure device are shown in table 6. Differences in codeine concentra-tions for the two collection methods were also observed in this experiment. Data for each subject are shown rather than mean values. These data should be considered preliminary because only two subjects were tested, the control codeine concentration was considerably higher than in the previous experiment, and the ratios of the control to device oral fluid concentrations were quite variable (table 6). An additional variable was encountered in the Orasure collection procedure. After collection, the device was placed in a storage tube containing approximately 700 µL of buffer. This diluted the oral fluid. However, the dilution factor was dependent on the amount of oral fluid collected that was not known.
Table 6. Codeine concentrations in saliva collected by the control method and the Orasure device with corresponding ratios of control/Orasure concentrations, n=2 subjects
Subject 1 Subject 2
Time (hours) Orasure Control Ratio* Orasure Control Ratio*
0.25 668 8,410 12.6 342 5,440 15.90.5 295 3,070 10.4 223 2,970 13.3
1 256 607 2.4 127 493 3.92 107 202 1.9 105 229 2.24 36 132 3.7 26 82 3.26 9 96 10.7 11 25 2.38 8 21 2.6 8 19 2.4
10 5 9 1.8 <5 13 12 6 9 1.5 <5 10 24 <5 <5 0 0
*Control concentration/Orasure concentration. A thorough understanding of the effects of collection methods and devices on oral fluid collec-tion and subsequent drug concentration is critical to interpreting testing results. For example, Kato et al. (1993) reported oral fluid concentrations of cocaine, BZE, and EME were substan-tially higher in nonstimulated than in stimulated oral fluid. In that study, saliva was stimulated by citric-acid-type sour candy and the ratio of the cocaine concentrations in nonstimulated versus stimulated saliva was 5.2 (3.0–9.5). The ratios for the metabolites, BZE and EME, were 6.0 and 5.5, respectively. The authors concluded that cocaine and metabolite concentrations in saliva are highly dependent on pH and the manner in which the oral fluid was collected. In the first clinical study, it was reported that a predictable relationship existed between oral fluid and plasma co-deine concentrations for 2 h to 12 h after oral administration. However, in that study, nonstimu-lated oral fluid was collected by having the subjects spit into inert polyethylene tubes and highly elevated oral fluid codeine concentrations were observed in the first 1 h to 2 h after drug admini-stration. The collection methods evaluated in this study included acidic and nonacidic (mechanical) stimulation of oral fluid production and nonstimulated oral fluid collection by spitting. Although
32
This document is a research report submitted to the U.S. Department of Justice. This report has not been published by the Department. Opinions or points of view expressed are those of the author(s)
and do not necessarily reflect the official position or policies of the U.S. Department of Justice.
the term “nonstimulated oral fluid” was used, the act of spitting is usually sufficient to produce some stimulation. A mechanical stimulus, such as chewing sugarless gum, stimulates a flow of approximately 1 mL/min to 3 mL/min. Citric acid stimulation may produce flows of from 5 mL/min to 10 mL/min. The Salivette and the Finger Collector devices collect oral fluid through use of an absorbent material. These methods also produce some stimulation of oral fluid produc-tion. It is important to note that subjects in this study were instructed not to chew either device to avoid stimulation. The codeine concentrations in nonstimulated oral fluid were greater than con-centrations in oral fluid specimens collected by the other methods. The observed differences may be a function of the oral fluid flow rate in specimens collected under passively or actively stimu-lated conditions. The Salivette and Finger Collector devices collect oral fluid by the swab method, which introduces some stimulation of oral fluid flow, and concentrations found after these collections were, on average, about 77% of the control concentrations. The codeine con-centrations in specimens actively stimulated by chewing gum were approximately one-half of the control codeine concentrations. Acidic stimulation (which stimulates oral fluid production at a faster rate than the above methods) appeared to have the greatest effect on the codeine concentra-tions. Codeine concentrations were, on average, less than 30% of those observed in the control specimens. The simultaneous collection of control specimens and Salivette specimens from four subjects allowed for a direct comparison of these two collection methods (fig. 9). The concentration dif-ferences observed in these subjects were in general agreement with the results shown in table 3. However, the mean control concentrations and the average ratio of control/Salivette concentra-tions were higher for this smaller group of subjects than in the initial collection experiments. This is partially attributable to one control subject having considerably higher codeine concentra-tions than predicted. Codeine concentrations in the first two specimens collected from this sub-ject were 14,300 ng/mL and 5,290 ng/mL. Due to the small number of subjects in the control group, results from this subject had an appreciable effect on the mean concentrations, the con-centration ratio, and the AUC. The Salivette and Finger Collector devices were compared in in vitro and in vivo experiments (fig. 8 and 9). In vitro codeine recovery from the Finger Collector device was 46.7% less than control compared to 8.3% less than control for the Salivette. In addition, 75% to 90% of the oral fluid was recovered from the Salivette, but only approximately 50% of the oral fluid was recovered from the Finger Collector. Approximately 75% of the specimens collected with the Finger Collector in the clinical study had less than the minimum volume desired for the GC/MS assay. The authors were able to recover >500 µL of oral fluid from 81.8% of the Salivette collection. The majority of the specimens collected using the Finger Collector during the clinical study had a recovered volume of <300 µL. The accuracy of the codeine determinations for the Finger Collector device was not compromised by the low volume of sample in this study, but may present a problem for routine testing using less sensitive screening and confirmation methods. The Orasure device consists of a cotton pad on the end of a plastic applicator. The pad is impregnated with buffer salts and the device is designed to collect up to 1.0 mL of oral fluid. The manufacturer reports that when placed between the cheek and gum, this device collects gingival crevicular fluid (also called oral mucosal transudate (OMT)) instead of saliva. However, if it is
33
This document is a research report submitted to the U.S. Department of Justice. This report has not been published by the Department. Opinions or points of view expressed are those of the author(s)
and do not necessarily reflect the official position or policies of the U.S. Department of Justice.

left in the mouth for the required 2 min to 5 min, the device likely absorbs saliva as well. After collection of the OMT, the cotton pad is placed in a storage tube containing approximately 700 µL of buffer. This results in the OMT specimen being diluted 1:2 or 1:3 with the buffer. Because there is no way to determine the amount of OMT collected, the dilution factor varies with each collection. This may have attributed to the variability observed in the ratios of control codeine concentrations to OMT codeine concentrations (1.5 to 15.9). 2.3.4 Conclusions
1. Of the collection methods and devices investigated, the subjects preferred the swab-type devices to spitting. The subjects found spitting into a tube unpleasant, especially if ob-served, but they considered this discomfort minor when compared to that of an observed urine specimen collection.
2. From a laboratory perspective, sample preparation was easier and less time-consuming
for specimens collected by spitting because the additional steps required to isolate the oral fluid from a device were not required. Removal of oral fluid from the Finger Collec-tor was often difficult and not readily performed by simply milking the device between the thumb and forefinger as suggested by the manufacturer. This difficulty may have con-tributed to the low sample of volume recoveries observed in this study.
3. Stimulation reduced saliva codeine concentrations. This was likely due to the dilution ef-
fect of stimulation because the previous study demonstrated that pH did not have a pro-nounced effect.
4. Spitting was the most effective collection technique. Saliva codeine concentrations were
3.6 times acidic stimulation, 2 times nonacidic stimulation, and 2.3 times to 1.3 times those that were found with the Salivette and the Finger Collector.
5. Differences in the duration of the detection time of codeine were also observed for the
collection methods. In the control group, codeine was detected in all of the 12 h speci-mens and over more than two-thirds of the 24 h specimens. With the Salivette and Finger Collector devices, all specimens collected at 12 h contained codeine; however, at 24 h af-ter administration, 40% and 20% of the Salivette and Finger Collector samples, respec-tively, contained detectable codeine. Nonacidic oral fluid stimulation yielded only 60% positive specimens at 12 h and 40% at 24 h. Using the acidic oral fluid stimulation method, only 20% of the 12 h and none of the 24 h specimens contained codeine.
34
This document is a research report submitted to the U.S. Department of Justice. This report has not been published by the Department. Opinions or points of view expressed are those of the author(s)
and do not necessarily reflect the official position or policies of the U.S. Department of Justice.
3. REPORT ON THE EFFECTS OF COLLECTION DEVICES ON DRUG CONCENTRATION
3.1 Introduction The potential effects of collection techniques on the resultant oral fluid drug concentrations have not been thoroughly evaluated or adequately recognized in the literature. For example, although repeated collections of 2 mL or more of oral fluid by spitting was readily accomplished in the au-thors’ clinical studies, they were unable to recover >500 µL of fluid from 19.2% of the clinical samples collected with the Salivette and 74.5% of the samples collected with the Finger Collector. In the clinical study discussed above, codeine concentrations in specimens collected by spitting were consistently higher than concentrations in specimens collected by the other methods. The control collection method concentrations averaged 3.6 times higher than concentrations in speci-mens collected by acidic stimulation of oral fluid and 1.3 to 2.0 times higher than concentrations in specimens collected by nonacid stimulation or collection using the Salivette or Finger Collector devices. Pharmacokinetic AUC calculations showed the same trend: control collection > nonacidic stimulation > Salivette > Finger Collector > acidic stimulation. Recovery for codeine and morphine was less than the control with the Salivette and the Finger Collector. The potential effects of different collection techniques and devices on the collection volume and concentration of drugs in oral fluid were of concern and provided the impetus for the following studies. 3.2 Study Design and Results of In Vitro Oral Fluid Volume Absorption (Part 1) Although several oral fluid collection devices are advertised as being commercially available (Accu-Sorb®, Oral-Diffusion Sink®, Saliva Sampler®, Orasure/Epitope®, Finger Collector, Hooded Collector, Intercept®, and the Salivette), some manufacturers (such as Saliva Diagnostic Systems, Inc. (Saliva Sampler)) did not return phone calls, e-mails, and other attempted commu-nications. To date, the authors have received product information for and been able to procure the following devices for evaluation: Salivette, Intercept, Hooded Collector, ORALscreen, and Finger Collector. A series of experiments were designed to determine (1) the collection time required by each device, (2) the volume of oral fluid collected by each device, and (3) the volume of oral fluid that could be recovered from each device. Culture tubes were placed on a laboratory balance and a known weight of oral fluid (2 gm) was added to each tube. A device was then placed in each culture tube and allowed to remain for the time recommended by the manufacturer. If no collec-tion time was specified by the manufacturer, devices were left for up to 5 min. This time exceeded that generally recommended by the manufacturers. The devices were then removed and the final weight of each culture tube and its remaining contents were recorded and used to calculate the amount of oral fluid absorbed by each device. In addition, the time for absorption and the volume of oral fluid that was recovered (“harvested”) from each device were recorded. In the harvesting portion of the experiments, the manufacturer’s recommended procedures were not always fol-lowed. Rather, the authors attempted to recover as much oral fluid as possible and, therefore, they usually exceeded the manufacturer’s recommendations. For example, instead of milking the Hooded Collector and the ORALscreen, each device was placed in a plastic pipette and centri-fuged to increase the volume of oral fluid harvested/recovered. An n=10 of each device was tested. Following this section are a series of tables that summarize the findings from the in vitro volume recovery experiments.
35
This document is a research report submitted to the U.S. Department of Justice. This report has not been published by the Department. Opinions or points of view expressed are those of the author(s)
and do not necessarily reflect the official position or policies of the U.S. Department of Justice.

The Salivette was tested in previous in vivo and in vitro experiments. The in vitro studies shown in table 7 demonstrated that the Salivette rapidly absorbed oral fluid. On average, the device ab-sorbed 1.85 g (mL) of oral fluid and 1.48 g (mL) (82.5%) was recovered from the device that could be used for testing. The Intercept was not tested in the authors’ previous experiments. This device is similar to the Orasure/Epitope, is made by the same company, and has replaced these devices in the market. It is designed to collect approximately 1 mL of oral fluid. The in vitro studies shown in table 8 demonstrated that the device rapidly absorbed the oral fluid. On average, the device absorbed 0.82 g (mL) of oral fluids and 0.64 g (mL) (77.6%) was recovered from the device for testing. The ORALscreen is made by Avitar and also was not tested in the authors’ previous experi-ments. The in vitro volume studies shown in table 9 demonstrated that, on average, the device absorbed 1.76 g (mL) of oral fluid and 0.58 g (mL) (33.2%) was recovered from the device. The Finger Collector was tested in the authors’ previous in vivo and in vitro experiments. Along with the ORALscreen and the Hooded Collector, this device is made by Avitar. The current in vitro studies shown in table 10 demonstrated that, on average, the device absorbed 1.62 g (mL) of oral fluid and 1.24 g (mL) (76.6%) was recovered from the device. The Hooded Collector was not tested in previous experiments. The in vitro studies shown in ta-ble 11 demonstrated that, on average, the device absorbed 1.68 g (mL) of oral fluid and 0.31 g (mL) (18.2%) was recovered from the device. In rank order, in vitro oral fluid volume recovery (%) from the devices was:
Salivette > Intercept > Finger Collector > ORALscreen > Hooded Collector 3.3 Conclusions of In Vitro Oral Fluid Absorption (Part 1)
1. The Salivette absorbed its complement oral fluid in less than 1 min. Other devices took
up to 5 min. However, anticipated collection times from donors, regardless of device, should be 5 min or less.
2. Less than 1 mL of oral fluid was collected with the Intercept. All other devices collected
>1.6 mL. Small specimen volumes create a number of challenges. The limited volume may preclude confirmation of multiple drugs suspected from the screening analysis. It might also eliminate the retest options now available to urine donors and testing agencies. Improved screening and confirmation methods are needed to achieve equivalent cutoffs.
3. “Volume extracted from the device” represents the volume/weight of oral fluid available to be used for drug testing. Less than 1 mL (gr) was recovered from the Intercept, ORAL-screen, and Hooded Collector. About 1.2 mL was recovered from the Finger Collector and 1.48 mL from the Salivette. As stated above, a limited specimen volume challenges the laboratory and may limit donor and agency options.
36
This document is a research report submitted to the U.S. Department of Justice. This report has not been published by the Department. Opinions or points of view expressed are those of the author(s)
and do not necessarily reflect the official position or policies of the U.S. Department of Justice.

Table 7. In vitro study data for Salivette from Sarstedt Company
#
Time for Absorption
(s)
Weight of Empty Tube
(g)
Weight of Tube w/2,000 uL of
Saliva (g)
Weight of Tube w/Device
Removed (g)
Weight of Saliva
Absorbed (g) %
Absorbed
Weight Extracted From
Device (g) %
Recovery 1 45 11.4395 13.3804 11.4731 1.9073 98.27% 1.1710 61.30%2 45 11.5388 13.4429 11.5799 1.8630 97.84% 1.5592 83.70%3 45 11.4873 13.3862 11.5311 1.8551 97.69% 1.1260 86.90%4 45 11.4240 13.3216 11.4960 1.8256 96.21% 1.5502 84.90%5 45 11.4075 13.2945 11.4426 1.8519 98.14% 1.5782 85.20%6 45 11.4154 13.2977 11.4702 1.8275 97.09% 1.5542 85.00%7 45 11.3357 13.2343 11.3712 1.8631 98.13% 1.5797 84.80%8 45 11.3792 13.2773 11.4304 1.8469 97.30% 1.5627 84.60%9 45 11.5905 13.5029 11.6205 1.8824 98.43% 1.6185 86.00%
10 45 11.3488 13.2356 11.3840 1.8516 98.13% 1.5375 83.00% Mean 1.85744 97.72% 1.48372 82.54%
37
Standard Deviation 0.0242 0.68% 0.1783 7.54%
This document is a research report submitted to the U.S. Department of Justice. This report has not been published by the Department. Opinions or points of view expressed are those of the author(s)
and do not necessarily reflect the official position or policies of the U.S. Department of Justice.

Table 8. In vitro study data for Intercept from STC Company
#
Time for Absorption
(s) Weight of Empty
Tube (g)
Weight of Tube w/2000 uL of
Saliva (g)
Weight of Tube w/Device Removed
(g)
Weight of Saliva
Absorbed (g) %
Absorbed
Weight Extracted
from Device (g)
% Recovery
1 180 8.7077 10.5576 9.7464 0.8112 43.85% 0.6394 78.82%2 180 8.623 10.4050 9.5783 0.8276 46.42% 0.6314 76.29%3 180 8.5991 10.3199 9.521 0.7989 46.43% 0.6110 76.48%4 180 8.7557 10.5471 9.7347 0.8124 45.35% 0.6562 80.77%5 180 8.664 10.4996 9.5562 0.9434 51.39% 0.6639 70.37%6 180 8.6676 10.3641 9.5771 0.787 46.39% 0.5935 75.41%7 180 8.5393 10.3489 9.5215 0.8274 45.72% 0.6512 78.70%8 180 8.6153 10.3835 9.6113 0.7722 43.67% 0.613 79.38%9 180 8.6126 10.3091 9.5146 0.7945 46.83% 0.6394 80.48%
10 180 8.6391 10.4155 9.5427 0.8728 49.13% 0.6946 79.58% Mean 0.82474 46.52% 0.63936 77.63% Standard Deviation 0.0500 2.31% 0.0293 3.13%
38
This document is a research report submitted to the U.S. Department of Justice. This report has not been published by the Department. Opinions or points of view expressed are those of the author(s)
and do not necessarily reflect the official position or policies of the U.S. Department of Justice.

Table 9. In vitro study data for ORALscreen from Avitar Company
#
Time for Absorption
(s) Weight of Empty
Tube (g)
Weight of Tube w/2,000 uL of
Saliva (g)
Weight of Tube w/Device Removed
(g)
Weight of Saliva
Absorbed (g) %
Absorbed
Weight Extracted
From Device (g)
% Recovery
1 300 8.6428 10.5194 8.6529 1.8665 99.46% 0.5411 28.99%2 300 8.6421 10.5008 8.6719 1.8289 98.40% 0.5912 32.33%3 300 8.7542 10.6205 8.8055 1.8150 97.25% 0.6034 33.25%4 300 8.6018 10.4084 8.7204 1.6880 93.44% 0.5988 35.47%5 300 8.5845 10.3770 8.6104 1.7666 98.56% 0.6241 35.33%6 300 8.5876 10.3560 8.6458 1.7102 96.71% 0.5813 33.99%7 300 8.5437 10.2863 8.6966 1.5897 91.23% 0.6005 37.77%8 300 8.6278 10.4188 8.6539 1.7649 98.54% 0.4974 28.18%9 300 8.6374 10.5361 8.7325 1.8036 94.99% 0.5826 32.30%
10 300 8.6753 10.5033 8.6938 1.8095 98.99% 0.6264 34.62%
39 Mean 1.76429 96.76% 0.58468 33.22%
Standard Deviation 0.0817 2.72% 0.0390 2.94%
This document is a research report submitted to the U.S. Department of Justice. This report has not been published by the Department. Opinions or points of view expressed are those of the author(s)
and do not necessarily reflect the official position or policies of the U.S. Department of Justice.

Table 10. In vitro study data for Finger Collector from Avitar Company
#
Time for Absorption
(s) Weight of Empty
Tube (g)
Weight of Tube w/2,000 uL of
Saliva (g)
Weight of Tube w/Device Removed
(g)
Weight of Saliva
Absorbed (g) %
Absorbed
Weight Extracted
From Device (g)
% Recovery
1 300 10.2982 12.0101 10.3503 1.6598 96.96% 1.1181 67.36%2 300 10.7152 12.4568 10.7755 1.6813 96.54% 1.1437 68.02%3 300 10.3024 12.0549 10.3295 1.7254 98.45% 1.2803 74.20%4 300 10.1835 11.9819 10.2295 1.7524 97.44% 1.4265 81.40%5 300 10.1814 11.8572 10.2004 1.6568 98.87% 1.3559 81.84%6 300 10.7273 12.2711 10.7749 1.4962 96.92% 1.1865 79.30%7 300 10.6618 12.2932 10.6972 1.5960 97.83% 1.2603 78.97%8 300 10.2976 11.5051 10.3262 1.1789 97.63% 0.9219 78.20%9 300 10.3555 12.1989 10.3901 1.8088 98.12% 1.4345 79.31%
10 300 10.1870 11.9870 10.3403 1.6467 91.48% 1.2699 77.12%
40
Mean 1.62023 97.02% 1.23976 76.57% Standard Deviation 0.05 2.31% 0.0293 3.13%
This document is a research report submitted to the U.S. Department of Justice. This report has not been published by the Department. Opinions or points of view expressed are those of the author(s)
and do not necessarily reflect the official position or policies of the U.S. Department of Justice.

Table 11. In vitro study data for Hooded Collector from Avitar Company
#
Time for Absorption
(s) Weight of Empty
Tube (g)
Weight of Tube w/2,000 uL of
Saliva (g)
Weight of Tube w/Device Removed
(g)
Weight of Saliva
Absorbed (g) %
Absorbed
Weight Extracted
From Device (g)
% Recovery
1 300 8.6708 10.5244 8.8292 1.6952 91.45% 0.3456 20.39%2 300 8.6839 10.5579 8.7882 1.7697 94.43% 0.3630 20.51%3 300 8.6292 10.5141 8.8269 1.6872 89.51% 0.2511 14.88%4 300 8.7432 10.5749 8.8152 1.7597 96.07% 0.3251 18.47%5 300 8.6192 10.4605 8.6729 1.7876 97.08% 0.1862 10.42%6 300 8.6894 10.5292 8.7475 1.7817 96.84% 0.3883 21.79%7 300 8.5921 10.3937 8.6245 1.7692 98.20% 0.4815 27.22%8 300 8.7548 10.564 8.8076 1.7564 97.08% 0.2857 16.27%9 300 8.5875 10.3054 8.8005 1.5049 87.60% 0.2445 16.25%
10 300 8.6329 10.2804 8.8992 1.3812 83.84% 0.2219 16.07% Mean 1.68928 93.21% 0.30929 18.23% Standard Deviation 0.1372 4.87% 0.0890 4.57%
41
This document is a research report submitted to the U.S. Department of Justice. This report has not been published by the Department. Opinions or points of view expressed are those of the author(s)
and do not necessarily reflect the official position or policies of the U.S. Department of Justice.

3.4 Study Design and Results of In Vitro Drug Recovery (Part 2) The in vitro experiments just discussed were designed to determine the volume of oral fluid col-lected by the devices. The following experiments were designed to determine the in vitro recov-ery of drugs of abuse and their metabolites from the devices. In the experiments, control drug-free oral fluid was fortified with drugs of abuse at three physiologically relevant concentrations. The samples were then “collected” by each device and assayed for their drug concentration by LC/MS (n=5 at each concentration). The drugs tested were amphetamine, methamphetamine, PCP, morphine, and codeine. The concentrations tested were as follows:
Drug Concentrations (ng/mL) Amphetamine 0, 10, 25, and 100
Methamphetamine 0, 10, 25, and 100 PCP 0, 5, 10, and 50
Morphine 0, 25, 50, and 200 Codeine 0, 25, 50, and 200
Pools of oral fluid were fortified at the drug/metabolite concentrations shown above. The pools were then aliquoted into 2 mL volumes and collected by the device. (Recall that devices seldom collected 2 full mLs and the authors were not able to harvest 2 mL from any of the devices.) Ad-ditionally, 2 mL portions of the pools were aliquoted as controls. The controls were not “col-lected” by the device, but rather were extracted and analyzed as “neat” oral fluid. Control samples were analogous to samples collected by spitting in the clinical studies. Quantitation of the drugs/metabolites was performed through concurrent extraction and analysis of a multipoint calibration curve for each analyte. Recovery was calculated by comparing the mean concentra-tion from each device to the mean concentration of controls and reported as percent recovery. The data in the tables assume that each device collected 2 mL of oral fluid. Therefore, the study design was analogous to the real-life situation of collecting an oral fluid specimen with the de-vice and shipping the sample to a laboratory for analysis. The laboratory would not know the ex-act volume of oral fluid collected by the device and the drug concentration reported would assume a volume based on the device manufacturer’s claimed volume. The tables that follow show the recovery versus control for amphetamine, methamphetamine, PCP, morphine, and codeine. Given that amphetamine is a metabolite of methamphetamine and the drugs have a similar chemical structure, one would predict similar recoveries of the two drugs from the devices. This is demonstrated in tables 12 and 13. Recoveries exceeded 50% from the Salivette and the Finger Collector for both amphetamine and methamphetamine at the tested concentrations. Recoveries at the same concentrations from Intercept and the ORALscreen ex-ceeded 30% (except at 100 ng/mL of amphetamine with ORALscreen). Recoveries from the Hooded Collector for amphetamine and methamphetamine were all approximately 25%. Only the recovery of amphetamine at 100 ng/mL exceeded 30% with the Hooded Collector. Recovery of amphetamine and methamphetamine from the devices demonstrated the following pattern:
Salivette approximately = Finger Collector > Intercept approximately = ORALscreen > Hooded Collector
42
This document is a research report submitted to the U.S. Department of Justice. This report has not been published by the Department. Opinions or points of view expressed are those of the author(s)
and do not necessarily reflect the official position or policies of the U.S. Department of Justice.

Table 14 shows that the recovery of PCP approached or exceeded 50% from the Salivette at each tested concentration. Recoveries at the same concentrations from the Intercept were 25% to 37%. The recoveries were similar to those from the Finger Collector, which ranged from (approxi-mately) 23% to 31%. Recoveries from the ORALscreen and the Hooded Collector were very poor (<25%). PCP is far more lipophilic and less basic than amphetamine and methampheta-mine. The lipophilic nature of PCP may have contributed to the reduced recovery from the de-vices. Recovery of PCP from the devices demonstrated the following pattern:
Salivette > Intercept approximately = Finger Collector > ORALscreen > Hooded Collector
Because morphine is a metabolite of codeine with similar chemical structure, one would predict similar recoveries of these drugs from the devices. Tables 15 and 16 show that recoveries approached 50% for the Finger Collector for both drugs. Recoveries from Salivette and Hooded Collector were in the 37% to 46% range. Recoveries from the Intercept and ORALscreen for morphine and codeine were slightly less at 33% to 39%. Recovery of morphine and codeine from the devices was more consistent than the other drugs and demonstrated the following pattern:
Finger Collector > Salivette approximately = Hooded Collector > ORALscreen approximately = Intercept
A discussion of the recovery of cocaine, BZE, THC, and THC-COOH from the devices follows.
3.5 Conclusions of In Vitro Drug Absorption (Part 2)
1. Recovery calculations in these experiments were not adjusted for the volume of oral flu-ids collected by the device, but rather simulated the real-world scenario of a collection and shipment of the device to a laboratory for analysis.
2. Recovery of the tested drugs from the devices tended to be in the range of approximately 30% to 60%. Typical drug recoveries in analytical methods commonly exceed 70% or 80%; occasionally recoveries exceed 90%.
3. The recovery of the lipophilic drug (PCP) was decidedly less than the more hydrophilic
drugs from all devices except the Salivette.
4. Intercept is only designed to collect 1 mL of oral fluids. Therefore, the recoveries pre-sented in the tables could be doubled to correct for the analysis volume of 2 mL.
5. Recovery from the devices was poor. The practical implications of poor drug recovery
are similar to low-volume recovery. Improved screening and confirmation methods are needed to achieve equivalent cutoffs. This may require more sophisticated methods and instruments and may increase the cost of testing.
6. The “control” shown in tables 12 through 16 simulates oral fluid collected by spitting.
This finding was consistent with the authors’ clinical study results.
43
This document is a research report submitted to the U.S. Department of Justice. This report has not been published by the Department. Opinions or points of view expressed are those of the author(s)
and do not necessarily reflect the official position or policies of the U.S. Department of Justice.

Table 12. Summary of amphetamine recovery
Control Salivette Intercept Finger Collector ORALscreen Hooded Collector
AMP 10 ng/mL 4.16 3.01 4.96 3.71 2.28 5.06 3.18 5.20 2.86 2.20 4.83 3.16 5.19 3.57 2.26 9.73 6.18 2.86 5.11 4.08 1.41 9.60 6.02 3.01 5.01 3.01 3.49
Mean 9.67 5.25 3.04 5.09 3.45 2.33SD 0.09 0.84 0.13 0.11 0.50 0.74
% Control 54.30% 31.48% 52.69% 35.64% 24.06% 25 ng/mL 13.05 8.01 12.83 8.44 7.93 12.62 8.49 13.69 7.98 4.80 14.60 8.99 14.88 8.06 3.36 25.73 16.46 8.81 14.22 6.59 5.70 23.47 13.71 8.72 13.91 7.18 8.75
Mean 24.60 14.09 8.60 13.91 7.65 6.11SD 1.60 1.52 0.38 0.75 0.75 2.22
% Control 57.28% 34.97% 56.54% 31.10% 24.84% 100 ng/mL 62.64 33.56 53.55 38.46 37.82
44
50.46 34.17 52.83 10.64 36.43 54.65 34.08 53.85 9.98 28.89 96.66 61.55 32.96 53.91 9.47 26.31 99.58 46.82 33.79 52.85 11.09 36.24
Mean 98.12 55.22 33.71 53.40 15.93 33.14SD 2.07 6.87 0.48 0.53 12.61 5.18
% Control 56.28% 34.36% 54.42% 16.23% 33.77%
This document is a research report submitted to the U.S. Department of Justice. This report has not been published by the Department. Opinions or points of view expressed are those of the author(s)
and do not necessarily reflect the official position or policies of the U.S. Department of Justice.

Table 13. Summary of methamphetamine recovery Control Salivette Intercept Finger Collector ORALscreen Hooded Collector10 ng/mL 4.41 3.03 5.37 3.82 2.42 5.11 3.32 5.47 2.91 2.35 4.67 3.48 5.41 3.58 2.44 9.98 6.54 3.12 5.39 4.20 1.52 9.76 6.25 3.12 5.31 3.12 3.62
Mean 9.82 5.40 3.21 5.39 3.53 2.47SD 0.08 0.95 0.18 0.06 0.52 0.75
% Control 54.94% 32.73% 54.88% 35.93% 25.17% 25 ng/mL 13.39 8.19 13.70 8.69 8.56 13.23 8.89 14.43 8.22 5.14 15.14 9.24 16.12 8.48 3.46 26.22 17.26 9.09 14.96 6.74 5.92 24.02 14.22 9.24 14.98 7.63 9.10
Mean 25.12 14.65 8.93 14.84 7.95 6.44SD 1.56 1.65 0.44 0.89 0.79 2.37
% Control 58.31% 35.55% 59.08% 31.65% 25.63%
45
100 ng/mL 65.53 34.29 55.58 40.46 38.78 53.85 35.10 55.65 35.05 26.94 56.63 35.37 56.32 28.30 27.15 97.01 64.83 34.44 57.66 24.90 27.19 99.14 48.42 35.10 57.59 34.30 14.74
Mean 98.07 57.85 34.86 56.56 32.60 26.96SD 1.51 7.32 0.47 1.01 6.09 8.50
% Control 58.99% 35.55% 57.67% 33.24% 27.49%
This document is a research report submitted to the U.S. Department of Justice. This report has not been published by the Department. Opinions or points of view expressed are those of the author(s)
and do not necessarily reflect the official position or policies of the U.S. Department of Justice.

Table 14. Summary of phenylcyclidene (PCP) recovery Control Salivette Intercept Finger Collector ORALscreen Hooded Collector 5 ng/mL 2.86 1.28 1.09 0.88 0.87 2.49 1.34 1.1 0.78 0.54 2.94 1.25 0.99 0.47 0.26 4.54 1.95 1.22 1.23 0.71 0.39 5.27 2.89 1.24 1.23 0.66 0.21
Mean 4.91 2.63 1.27 1.13 0.70 0.45SD 0.52 0.42 0.05 0.10 0.15 0.27
% Control 53.54% 25.81% 23.00% 14.27% 9.26% 10 ng/mL 4.19 3.07 2.7 1.3 0.89 4.44 3.41 2.98 1.57 1.09 4.94 3.14 2.62 1.6 1.25 9.31 4.64 3.14 2.6 1.88 1.32
Mean 9.15 4.49 2.85 2.52 1.6 0.93SD 9.23 4.54 3.12 2.68 1.59 1.10
% Control 0.11 0.28 0.20 0.18 0.21 0.19 49.19% 33.82% 29.08% 17.23% 11.87%
46
50 ng/mL 25.29 18.36 12.46 11.78 10.86 24.95 17.77 11.68 10.64 8.98 24.71 16.92 13.99 9.98 5.33 44.64 27.9 15.18 14.66 9.47 7.77 46.14 23.96 16.08 17.26 11.09 6.93
Mean 45.39 25.36 16.86 14.01 10.59 7.97SD 1.06 1.50 1.28 2.17 0.91 2.09
% Control 55.88% 37.15% 30.87% 23.34% 17.57%
This document is a research report submitted to the U.S. Department of Justice. This report has not been published by the Department. Opinions or points of view expressed are those of the author(s)
and do not necessarily reflect the official position or policies of the U.S. Department of Justice.

Table 15. Summary of morphine recovery
Control Salivette Intercept Finger Collector ORALscreen Hooded Collector25 ng/mL 11.76 8.55 13.50 8.53 13.19 12.65 10.05 12.91 10.98 11.35 14.21 9.59 12.84 7.18 11.45 10.33 10.16 13.31 8.54 11.11 26.42 11.80 9.69 12.56 11.84 13.83
Mean 26.42 12.15 9.61 13.02 9.41 12.19SD 0.00 1.42 0.64 0.38 1.93 1.24
% Control 45.99% 36.37% 49.30% 35.63% 46.13% 50 ng/mL 19.70 17.65 26.75 18.24 17.92 19.89 17.67 26.79 21.94 0 (error, not counted) 22.35 17.88 28.07 23.58 21.52 22.17 19.12 25.77 21.50 15.92 53.14 19.79 19.16 25.67 18.97 23.39
Mean 53.14 20.78 18.30 26.61 20.84 19.69SD 0.00 1.35 0.77 0.97 2.20 3.38
% Control 39.10% 34.43% 50.07% 39.22% 37.04% 200 ng/mL 83.63 64.97 103.18 78.64 106.08
47
74.19 64.20 94.65 81.50 89.49 79.22 66.02 101.62 62.94 90.13 80.30 73.90 96.19 80.23 74.33 203.60 74.40 68.12 95.40 61.84 70.87
Mean 203.60 78.35 67.44 98.21 73.03 86.18SD 0.00 4.04 3.90 3.90 9.77 14.12
% Control 38.48% 33.12% 48.24% 35.87% 42.33%
This document is a research report submitted to the U.S. Department of Justice. This report has not been published by the Department. Opinions or points of view expressed are those of the author(s)
and do not necessarily reflect the official position or policies of the U.S. Department of Justice.

Table 16. Summary of codeine recovery Control Salivette Intercept Finger Collector ORALscreen Hooded Collector25 ng/mL 11.88 9.05 13.0564 8.54 13.53 13.09 10.39 12.6499 11.07 11.62 14.67 9.89 12.4976 7.07 11.71 10.66 10.37 13.233 8.19 11.32 27.41 12.37 10.11 12.3354 11.29 14.63
Mean 27.41 12.53 9.96 12.75 9.23 12.56SD 0.00 1.49 0.55 0.38 1.86 1.45
% Control 45.71% 36.33% 46.52% 33.68% 45.82% 50 ng/mL 20.48 18.72 26.7147 17.46 18.58 20.79 18.50 26.5704 20.92 0 (error, not counted) 23.22 19.03 28.2516 22.33 22.19 23.11 20.02 25.9359 21.14 16.63 54.84 20.72 20.08 25.9112 18.52 24.26
Mean 54.84 21.67 19.27 26.68 20.08 20.41SD 0.00 1.38 0.74 0.95 2.01 3.44
% Control 39.51% 35.14% 48.65% 36.61% 37.23% 200 ng/mL 85.02 67.64 102.1194 76.03 103.98
48
77.34 66.75 94.8489 78.05 88.22 81.78 67.20 102.1507 60.77 87.35 83.23 76.62 97.9424 77.53 72.27 209.55 77.60 70.54 97.7931 60.77 68.08
Mean 209.55 81.00 69.75 98.97 70.63 83.98SD 0.00 3.42 4.12 3.14 9.03 14.31
% Control 38.65% 33.29% 47.23% 33.71% 40.08%
This document is a research report submitted to the U.S. Department of Justice. This report has not been published by the Department. Opinions or points of view expressed are those of the author(s)
and do not necessarily reflect the official position or policies of the U.S. Department of Justice.

3.6 Study Design and Results of In Vitro Drug Recovery (Part 3), Volume Corrected The previous experiments evaluated the devices in a simulated donor collection scenario where the volume of oral fluid collected would likely vary. Consequently, the concentration of drug re-ported from the device would vary. The experiments reported in this section were similar to those reported above except the device was allowed to collect its normal oral fluid volume, and a consistent volume (0.5 mL) of oral fluid was harvested from the device for testing. This allowed for an estimate of the actual drug recovery from each device. The Hooded Collector is no longer manufactured and was not included in all of the following evaluations. Due to the limited num-ber of these devices, cocaine and BZE recoveries were not included in Part 2, but are included below. With the exception of the constant volume collection, the procedures for analysis and data interpretation were identical to those described in Part 2. Control drug-free saliva was fortified with drugs of abuse at three concentrations, and the fortified samples were collected with each device and assayed for each drug of abuse by LC/MS (n=5 at each concentration). The drugs tested were amphetamine, methamphetamine, PCP, morphine, codeine, cocaine, BZE, THC, and THC-COOH. The concentrations tested were as follows: Drug Concentrations (ng/mL) Amphetamine 0, 10, 25, and 100 Methamphetamine 0, 10, 25, and 100 PCP 0, 5, 10, and 50 Morphine 0, 25, 50, and 200 Codeine 0, 25, 50, and 200 Cocaine 0, 5, 10, and 100 BZE 0, 5, 10, and 100 THC 0, 1, 2.5, and 10 THC-COOH 0, 2.5, 5, and 25
The drug recovery data from the devices are shown in tables 17 through 24. Recovery was calcu-lated by comparing the mean drug concentration from the devices to the mean concentration of its respective control and reported as percent recovery. As described earlier, the controls were not collected by the device, but rather were extracted and analyzed as neat oral fluid. The recoveries of amphetamine and methamphetamine and are shown in tables 17 and 18. Recoveries exceeded 85% for both drugs, at all tested concentrations and with all devices. Given that the analytical accuracy of determining the control and device concentrations was +10%, calculated recoveries of 85% should be considered good and those >90% excellent. No pattern was evident in the recovery from the devices except all were good and those from the ORALscreen were excellent.
49
This document is a research report submitted to the U.S. Department of Justice. This report has not been published by the Department. Opinions or points of view expressed are those of the author(s)
and do not necessarily reflect the official position or policies of the U.S. Department of Justice.

Table 19 shows that the recovery of PCP exceeded 80% from the Intercept at concentrations of 5 ng/mL, 10 ng/mL, and 50 ng/mL of oral fluid. Recoveries at the same concentrations from the Salivette were 76% to 82%. Recoveries from the ORALscreen and the Finger Collector were poor for PCP (44% to 54%). As with the previous study, PCP recoveries were less than the more hydrophilic drugs such as amphetamine, methamphetamine, and the opiates. Recovery of PCP from the devices demonstrated the following pattern:
Intercept > Salivette > ORALscreen > Finger Collector The recoveries of morphine and codeine are shown in tables 20 and 21. They show that recovery of the two drugs from the Intercept exceeded 80%. Recoveries at all concentrations from the Salivette were 78% to 86%. Recoveries from the ORALscreen exceeded 72% and those from the Finger Collector were approximately 60% to 63%. As with the PCP results, recovery of mor-phine and codeine from the devices demonstrated the following pattern:
Intercept > Salivette > ORALscreen > Finger Collector The recoveries of cocaine and BZE are shown in tables 22 and 23. The recoveries of these drugs were not evaluated in Part 2 because there was a limited supply of Hooded Collectors. The tables show that recovery of cocaine exceeded 61% and that of BZE drugs exceeded 87% from all de-vices. BZE is more polar than cocaine and its recovery exceeded cocaine with four of the devices at all concentrations. This supports the observation that hydrophilic drugs are more easily recov-ered from the devices. Recovery of cocaine demonstrated the following pattern:
Intercept > Salivette > ORALscreen > Hooded Collector > Finger Collector
Recovery of BZE demonstrated the following pattern: ORALscreen > Salivette approximately = Hooded Collector approximately = Finger Col-lector > Intercept
Determining the recovery of THC and THC-COOH from the devices presented significant chal-lenges. Multiple attempts were made to evaluate the recovery of these cannabinoids, but no suc-cessful data were obtained for either analyte in the in vitro recovery studies (Part 2). The initial challenge was to prepare a fortified pool of THC and THC-COOH oral fluid at the specified con-centrations. It is well documented that cannabinoids adhere to absorptive surfaces such that measured concentrations seldom reflect fortified concentrations of control materials. The authors were successful in preparing fortified pools from which the measured concentrations reflected the fortified concentrations for THC-COOH. However, they were not successful in preparing a similar THC pool. Tables were not prepared for THC because measured concentrations were about one-third of fortified concentrations. In addition, the experiments indicated that the recovery of THC from the devices was very poor (approximately 25%). Therefore, the THC concentrations approached the LOQ of the analysis where the quantitative accuracy becomes more problematic. Further, the authors were limited in the number of times that they could attempt these experiments because the Hooded Collector was no longer available.
50
This document is a research report submitted to the U.S. Department of Justice. This report has not been published by the Department. Opinions or points of view expressed are those of the author(s)
and do not necessarily reflect the official position or policies of the U.S. Department of Justice.

This is unfortunate because THC is the primary cannabinoid in the oral fluid of users. The data reported for THC-COOH from the Hooded Collector are based on n=3 collections. Table 24 shows that the recovery of THC-COOH approached 50% from the Intercept. The re-covery from the Salivette improved as a function of increasing THC-COOH concentration and approached 50% at 25 ng/mL. Regardless of THC-COOH concentration, recoveries from the Finger Collector, ORALscreen, and Hooded Collector were very poor and unacceptable by ana-lytical standards. Recovery of THC-COOH from the devices demonstrated the following pattern:
Intercept > Salivette > > > Finger Collector, ORALscreen, and Hooded Collector
3.7 Conclusions of In Vitro Drug Absorption (Part 3), Volume Corrected
1. Data from these studies reflect the actual drug recovery from the devices because the recovery percentages were volume controlled and control corrected.
2. Recovery of amphetamine, methamphetamine, morphine, and codeine from the devices was in the range of approximately 60% to nearly 90%.
3. The recovery of the lipophilic drug (PCP) was decidedly less than the hydrophilic drugs
from all devices except the Salivette and Intercept.
4. Recovery of cocaine and BZE from the devices was in the range of 60% to more than 97%. The recovery of BZE exceeded that of the other drugs tested.
5. Recovery studies are needed for THC. Like PCP, THC is lipophilic and may have poor
recovery from the devices. Studies will need to be well conceived to avoid the multiple complications encountered in this research.
6. The recovery of THC-COOH was poor from all of the devices. A 50% recovery would
have the effect of raising the analytical cutoff concentration twofold. Recoveries from the Salivette were unacceptable at lower concentrations and poor even at higher concentra-tions. THC-COOH was essentially not recovered from the Finger Collector, ORAL-screen, and the Hooded Collector.
7. Data from the Part 3 studies showed that recovery of drugs/metabolites from the devices
for the most part was acceptable. However, the accuracy of the concentrations reported from the devices suffered because the devices do not control the volume of oral fluid col-lected or available for testing (Part 2).
51
This document is a research report submitted to the U.S. Department of Justice. This report has not been published by the Department. Opinions or points of view expressed are those of the author(s)
and do not necessarily reflect the official position or policies of the U.S. Department of Justice.

Table 17. Summary of amphetamine recovery Control Salivette Intercept Finger Collector ORALscreen10 ng/mL 8.37 8.49 8.58 9.04 8.32 8.58 8.15 8.74 8.48 8.43 8.59 8.85 9.68 8.57 8.55 8.44 9.15 9.92 8.22 8.95 8.9 9.08
Mean 9.80 8.39 8.60 8.53 8.97SD 0.17 0.14 0.20 0.27 0.17
% Control 85.63% 87.76% 87.06% 91.55% 25 ng/mL 22.44 22.02 22.29 25.12 22.42 23.35 22.77 25.13 22.76 22.97 23.06 24.01 26.21 22.3 22.1 22.12 24.77 26.15 22.71 24.9 23.25 24.08
Mean 26.18 22.53 23.07 22.70 24.62SD 0.04 0.20 1.17 0.49 0.55
% Control 86.04% 88.11% 86.70% 94.05% 100 ng/mL 93.21 95.37 95.96 102.36 95.88 96.91 93.5 103.96 96.5 95.1 94.75 104.52 110.9 95.34 94.63 103.18 102.94 110.3 95.02 92.84 95.28 98.94
Mean 110.60 95.19 94.97 96.53 102.54SD 0.42 1.24 1.47 3.82 2.18
% Control 86.07% 85.87% 87.28% 92.72%
52
This document is a research report submitted to the U.S. Department of Justice. This report has not been published by the Department. Opinions or points of view expressed are those of the author(s)
and do not necessarily reflect the official position or policies of the U.S. Department of Justice.

Table 18. Summary of methamphetamine recovery Control Salivette Intercept Finger Collector ORALscreen10 ng/mL 8.54 8.77 9.08 9.8 8.89 8.94 8.69 9.38 8.76 8.9 8.94 9.37 9.94 8.74 8.74 8.83 9.85 9.93 8.77 9 8.83 9.58
Mean 9.94 8.74 8.87 8.87 9.60SD 0.01 0.13 0.11 0.15 0.23
% Control 87.97% 89.28% 89.32% 96.59% 25 ng/mL 23.72 26.33 23.51 26.18 23.84 24.24 24.46 26.6 24.2 23.93 24.41 25.6 26.93 23.18 22.71 24.35 26.63 27.02 24.1 26.12 25.11 25.66
Mean 26.98 23.81 24.67 24.37 26.13SD 0.06 0.40 1.54 0.57 0.49
% Control 88.26% 91.44% 90.34% 96.88% 100 ng/mL 97.37 92.79 100.94 109.69 97.41 95.99 100.97 105.09 101.47 96.78 100.3 109.98 112.52 100.1 94.04 108.3 108.1 110.7 99.25 98.76 100.25 102.72
Mean 111.61 99.12 95.67 102.15 107.12SD 1.29 1.77 2.34 3.45 3.13
% Control 88.81% 85.72% 91.53% 95.97%
53
This document is a research report submitted to the U.S. Department of Justice. This report has not been published by the Department. Opinions or points of view expressed are those of the author(s)
and do not necessarily reflect the official position or policies of the U.S. Department of Justice.
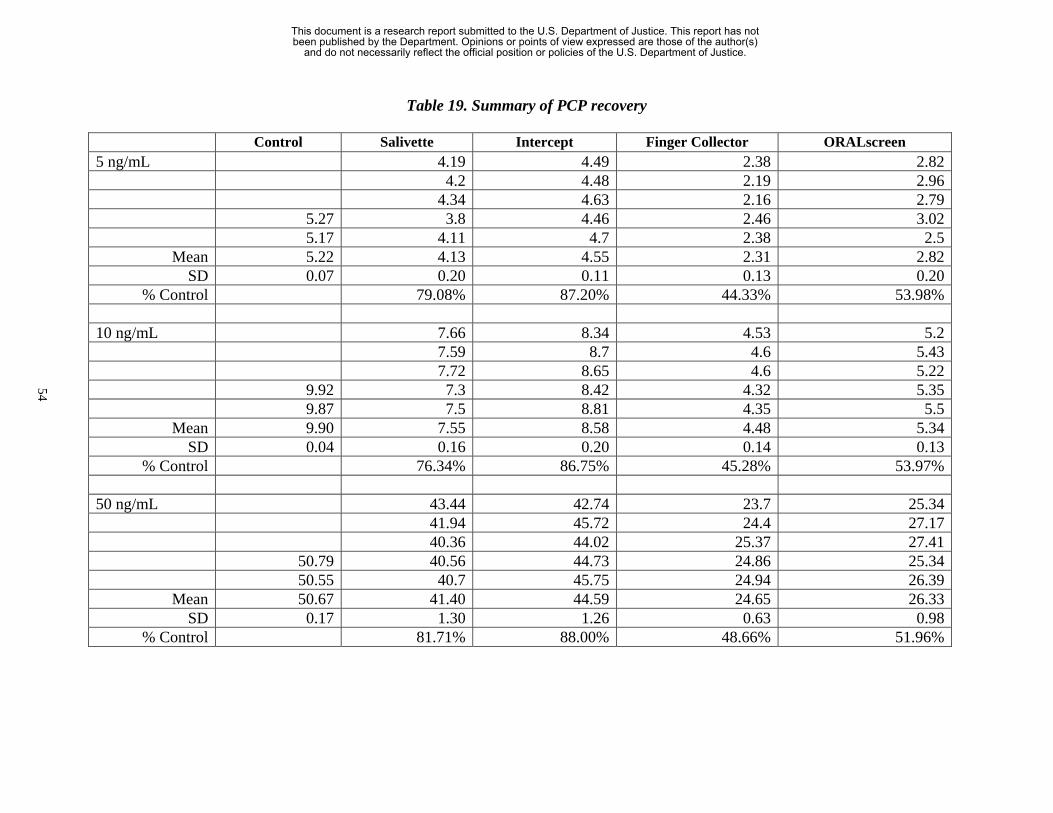
Table 19. Summary of PCP recovery Control Salivette Intercept Finger Collector ORALscreen5 ng/mL 4.19 4.49 2.38 2.82 4.2 4.48 2.19 2.96 4.34 4.63 2.16 2.79 5.27 3.8 4.46 2.46 3.02 5.17 4.11 4.7 2.38 2.5
Mean 5.22 4.13 4.55 2.31 2.82SD 0.07 0.20 0.11 0.13 0.20
% Control 79.08% 87.20% 44.33% 53.98% 10 ng/mL 7.66 8.34 4.53 5.2 7.59 8.7 4.6 5.43 7.72 8.65 4.6 5.22 9.92 7.3 8.42 4.32 5.35 9.87 7.5 8.81 4.35 5.5
Mean 9.90 7.55 8.58 4.48 5.34SD 0.04 0.16 0.20 0.14 0.13
% Control 76.34% 86.75% 45.28% 53.97% 50 ng/mL 43.44 42.74 23.7 25.34 41.94 45.72 24.4 27.17 40.36 44.02 25.37 27.41 50.79 40.56 44.73 24.86 25.34 50.55 40.7 45.75 24.94 26.39
Mean 50.67 41.40 44.59 24.65 26.33SD 0.17 1.30 1.26 0.63 0.98
% Control 81.71% 88.00% 48.66% 51.96%
54
This document is a research report submitted to the U.S. Department of Justice. This report has not been published by the Department. Opinions or points of view expressed are those of the author(s)
and do not necessarily reflect the official position or policies of the U.S. Department of Justice.

Table 20. Summary of morphine recovery Control Salivette Intercept Finger Collector ORALscreen25 ng/mL 21.36 20.82 16.18 19.38 21.15 21.31 16.21 19.34 20.62 21.17 17.09 18.83 26.46 20.68 21.98 16.09 19.28 26.62 20.3 21.28 17.14 19.69
Mean 26.54 20.82 21.31 16.54 19.30SD 0.11 0.43 0.42 0.53 0.31
% Control 78.46% 80.30% 62.33% 72.74% 50 ng/mL 46.36 48.21 38.19 44.43 48.38 49.02 35.67 43.85 46.43 49.84 35.8 43.66 60.46 47.57 50.99 38.11 45.3 60.4 48.54 50.02 36.39 44.93
Mean 60.43 47.46 49.62 36.83 44.43SD 0.04 1.04 1.05 1.23 0.70
% Control 78.53% 82.10% 60.95% 73.53% 200 ng/mL 167.07 161.97 122.44 149.02 165.26 169.18 128.94 153.3 162.03 161.86 133.69 148.59 200.25 156.69 168.63 120.61 156.47 198.98 163.68 173.05 127.27 151.78
Mean 199.62 162.95 166.94 126.59 151.83SD 0.90 3.96 4.89 5.23 3.24
% Control 81.63% 83.63% 63.42% 76.06%
55
This document is a research report submitted to the U.S. Department of Justice. This report has not been published by the Department. Opinions or points of view expressed are those of the author(s)
and do not necessarily reflect the official position or policies of the U.S. Department of Justice.

Table 21. Summary of codeine recovery Control Salivette Intercept Finger Collector ORALscreen25 ng/mL 22.92 22.75 16.36 19.33 22.98 23.49 16.49 19.47 22.26 23.5 17.28 18.79 26.92 22.44 24.38 16.29 19.24 27.89 22.21 23.39 17.45 19.83
Mean 27.41 22.56 23.50 16.77 19.33SD 0.69 0.36 0.58 0.55 0.38
% Control 82.33% 85.76% 61.21% 70.54% 50 ng/mL 50.66 53.81 38.58 43.71 52.01 54.76 36.25 43.09 50.5 55.88 35.79 44.12 62.28 51.42 55.97 38.39 46.01 62.18 52.34 54.88 36.62 45.34
Mean 62.23 51.39 55.06 37.13 44.45SD 0.07 0.81 0.89 1.28 1.20
% Control 82.57% 88.48% 59.66% 71.43% 200 ng/mL 176.58 180.73 120.67 156.17 176.53 186.78 128.17 162.85 173.37 178.92 133.82 156.3 200.78 168.78 181.5 120.8 168.64 202.1 173.37 186.66 127.22 164.26
Mean 201.44 173.73 182.92 126.14 161.64SD 0.93 3.19 3.60 5.54 5.38
% Control 86.24% 90.81% 62.62% 80.24%
56
This document is a research report submitted to the U.S. Department of Justice. This report has not been published by the Department. Opinions or points of view expressed are those of the author(s)
and do not necessarily reflect the official position or policies of the U.S. Department of Justice.

Table 22. Summary of cocaine recovery Control Salivette Intercept Finger Collector ORALscreen Hooded Collector5 ng/mL 4.23 4.69 3.02 3.41 3.23 4.42 4.37 3.06 3.47 3.22 4.3 4.37 2.99 3.26 3.34 4.73 4.22 4.62 3.05 3.31 3.26 4.62 4.33 4.28 3.11 3.33 3.06
Mean 4.68 4.30 4.47 3.05 3.36 3.22SD 0.08 0.08 0.18 0.05 0.08 0.10
% Control 91.98% 95.53% 65.16% 71.79% 68.92% 10 ng/mL 8.11 8.54 5.32 6.08 5.84 8.13 8.07 5.18 5.57 6.27 7.85 8.88 5.55 5.94 6.26 8.87 7.96 8.4 5.74 6.5 6.67 8.85 8.51 9 5.57 6.04 5.46
Mean 8.86 8.11 8.58 5.47 6.03 6.10SD 0.01 0.25 0.37 0.22 0.33 0.46
% Control 91.56% 96.82% 61.76% 68.01% 68.85% 100 ng/mL 75.57 76.95 50 55.81 55.39
57
77.99 84.02 51.63 58.88 51.78 77.4 83.47 56.8 58.56 54.78 86.95 78.29 81.71 52.25 56.6 52.51 84.08 79.18 80.98 50.28 59.97 51.99
Mean 85.52 77.69 81.43 52.19 57.96 53.29SD 2.03 1.35 2.79 2.74 1.71 1.67
% Control 90.84% 95.22% 61.03% 67.78% 62.32%
This document is a research report submitted to the U.S. Department of Justice. This report has not been published by the Department. Opinions or points of view expressed are those of the author(s)
and do not necessarily reflect the official position or policies of the U.S. Department of Justice.

Table 23. Summary of BZE recovery Control Salivette Intercept Finger Collector ORALscreen Hooded Collector5 ng/mL 5.03 4.67 4.98 4.99 4.81 4.42 4.67 5.11 5.04 5.08 5.1 4.56 4.97 5.03 5.14 5.28 4.84 4.83 4.81 5.01 4.94 5.29 4.93 4.84 4.7 4.92 4.68
Mean 5.29 4.86 4.71 4.91 5.00 4.93SD 0.01 0.27 0.12 0.16 0.05 0.19
% Control 92.03% 89.20% 92.98% 94.57% 93.28% 10 ng/mL 9.69 8.96 9.5 10.19 9.92 9.36 8.52 9.36 8.99 10.06 9.36 9.5 9.27 9.57 9.63 10.02 9.52 8.98 9.65 9.95 9.74 10.04 9.6 9.79 9.22 9.98 9.07
Mean 10.03 9.51 9.15 9.40 9.74 9.68SD 0.01 0.15 0.50 0.18 0.47 0.38
% Control 94.78% 91.23% 93.72% 97.07% 96.55% 100 ng/mL 90.65 78.83 90.22 94.48 91.68
58
90.8 88.19 86.23 98.14 88.54 91.77 83.87 91.59 92.62 89.67 97.92 91.54 85.03 87.47 95.26 79.1 98.37 90.6 83.97 91.99 94.89 79.8
Mean 98.15 91.07 83.98 89.50 95.08 85.76SD 0.32 0.54 3.37 2.54 1.99 5.87
% Control 92.79% 85.57% 91.19% 96.88% 87.38%
This document is a research report submitted to the U.S. Department of Justice. This report has not been published by the Department. Opinions or points of view expressed are those of the author(s)
and do not necessarily reflect the official position or policies of the U.S. Department of Justice.

Table 24. Summary of THC-COOH recovery
Control Salivette Intercept Finger Collector ORALscreen Hooded Collector2.5 ng/mL 0.06 0.76 0 0 0 0.31 0.86 0 0 0 0.13 0.95 0 0 0 1.89 0.39 0.90 0 0 1.89 0.26 0.96 0 0
Mean 1.89 0.23 0.89 0.00 0.00 0.00SD 0.00 0.13 0.08 0.00 0.00 0.00
% Control 12.17% 46.86% 0.00% 0.00% 0.00% 5 ng/mL 1.26 2.41 0 0.02 0 1.03 2.34 0 0.34 0 1.67 2.33 0 0.08 0 4.74 2.25 2.25 0 0.08 4.46 1.38 2.42 0.00 0.03
Mean 4.60 1.52 2.35 0.00 0.11 0.00SD 0.20 0.47 0.07 0.00 0.13 0.00
% Control 33.00% 51.09% 0.00% 2.39% 0.00% 25 ng/mL 12.91 11.44 0.37 1.08 0.471
59
12.63 14.1 0.05 0.8 0.471 12.26 13.53 0.15 0.17 0.485 25.59 10.9 14.54 0 0.44 24.7 10.9 13.69 0.05 0.44
Mean 25.15 11.92 13.46 0.12 0.59 0.48SD 0.63 0.96 1.20 0.15 0.36 0.01
% Control 47.41% 53.53% 0.49% 2.33% 1.89%
This document is a research report submitted to the U.S. Department of Justice. This report has not been published by the Department. Opinions or points of view expressed are those of the author(s)
and do not necessarily reflect the official position or policies of the U.S. Department of Justice.
4. REPORT OF SPECIMEN VALIDITY—
IMMUNOGLOBULIN G (IgG) CONCENTRATION
4.1 Introduction For oral fluid to be accepted as a viable specimen for drug testing, it must be possible to ensure that a valid and representative specimen was collected. There also must be objective methods to ensure that the specimen is valid and representative. For example, several methods can be used to ensure that urine specimens have not been diluted or substituted, such as determining sample temperature and determinations of pH, specific gravity, and creatinine. At a series of meetings (most recently held at the Department of Health and Human Services, Substance Abuse and Men-tal Health Services Administration, Drug Testing Advisory Board, Chevy Chase, MD, December 6, 2001), it was suggested that an oral fluid specimen was valid if it contained IgG at a concentra-tion ≥0.5 µg/mL. As part of this research, oral fluid samples were randomly tested for IgG con-centration. Preliminary data suggested that the IgG standard was ineffective. In a series of preliminary studies, oral fluid collected from normal human subjects was diluted at an average of 1:30 and found to still contain IgG at concentrations >0.5 µg/mL. In addition, volunteers rinsed their mouths with 5 mL to 10 mL of water just prior to oral fluid collection and the IgG concen-trations in these samples averaged approximately 2.0 µg/mL.
4.2 Study Design and Results Table 25 presents IgG concentrations from 100 oral fluid samples. These samples were randomly selected for analysis from those collected by spitting in the clinical studies. Note that the mean concentration is approximately 3 mcg/mL. If one assumes a normal distribution of IgG concen-trations, two standard deviations from the mean would only go down to a concentration of 1.82 µg/mL—far in excess of the 0.5 µg/mL standard. Therefore, a subject would have to have an IgG concentration 4.28 standard deviations below the mean to fail the proposed oral fluid specimen validity criterion. Table 26 shows the effect of in vitro dilution of oral fluid specimens on IgG concentration. These samples were randomly selected for analysis from those collected by spitting in the clinical stud-ies and were tested by immunoassay for IgG concentration. These data verify those reported ear-lier, which show that IgG concentrations decreased as the dilution increased. However, even with a 1:10 dilution of the specimens, the mean concentration was still 1.55 standard deviations above the proposed validity standard. The 1:10 dilution resulted in only two specimens having an IgG concentration of 0.5 µg/mL, and none less than that concentration. A linear decrease in IgG con-centration with corresponding increases in dilution was not observed. This was due to the lack of linearity of the immunoassay and saturation of the kit above 2 µg/mL to 2.5 µg/mL. Because the assay linearity plateaus above 2 µg/mL to 2.5 µg/mL, oral fluid IgG concentrations at, or above, that concentration are suspect and dilutions simply reduce the sample concentration into the dy-namic range of the assay.
60
This document is a research report submitted to the U.S. Department of Justice. This report has not been published by the Department. Opinions or points of view expressed are those of the author(s)
and do not necessarily reflect the official position or policies of the U.S. Department of Justice.

Table 26 shows the potential effect of in vivo dilution of oral fluid specimens on IgG concentra-tion. Five subjects provided an oral fluid specimen by spitting. They then rinsed their mouths with 50 mL of tap water and provided a second specimen, again by spitting. They performed one additional 50 mL rinse and provided a third specimen. The specimens were then tested by immu-noassay for IgG. The results verify the data presented earlier and those shown in tables 17 and 27, which indicated that concentrations decreased as a function of rinsing. However, even with 2 mL x 50 mL (total 100 mL) dilution of the oral fluids in the oral cavity, the mean concentration was still well above the 0.5 µg/mL proposed dilute specimen standard. The mean concentration after the two washes remained 2.61 standard deviations above the 0.5 µg/mL criterion.
4.3 Conclusions From the data in tables 25 through 27 and those of the earlier study, it is apparent that having an oral fluid IgG concentration of >0.5 µg/mL does not ensure that the specimen is valid (has not been diluted). Therefore, this criterion does not guard against even the most obvious mechanism of subverting a drug test—diluting the specimen and thereby diluting its drug concentration to avoid detection. Table 26 shows that in vitro dilution of the specimen by up to 1:10 resulted in a mean IgG concentration still approximately 3 times the 0.5 µg/mL criterion. Table 27 shows that in vivo dilution of the specimen with multiple tap water rinses of the oral cavity only lowered the IgG concentration 25.5% and no specimens failed the >0.5 µg/mL criterion. Additional research is needed to identify a chemical marker to ensure the validity of oral fluid specimens collected from donors. Based on the data presented, the current criterion is ineffective for use in the criminal justice system. In addition, the criterion neglects the clinical condition of the donor. For example, an immunocompromised donor might have difficulty passing the dilu-tion criterion. This would also be true of a donor taking immunosuppressant medications. Fur-ther, a donor with a medical condition that increases IgG concentration could pass the criterion even after severely diluting his or her specimen.
61
This document is a research report submitted to the U.S. Department of Justice. This report has not been published by the Department. Opinions or points of view expressed are those of the author(s)
and do not necessarily reflect the official position or policies of the U.S. Department of Justice.

Table 25. IgG concentrations (µg/mL) Sample ID Concentration Sample ID Concentration Sample ID Concentration Sample ID Concentration
100 3.16 126 3.20 152 3.09 178 2.35101 3.49 127 3.27 153 3.26 179 3.31102 2.94 128 3.10 154 3.27 180 3.48103 2.94 129 2.21 155 2.34 181 2.86104 2.89 130 2.55 156 3.02 182 3.18105 3.18 131 2.80 157 2.35 183 2.06106 2.53 132 3.23 158 2.89 184 3.08107 2.96 133 2.18 159 3.35 185 3.37108 2.85 134 2.63 160 3.16 186 3.4109 3.09 135 2.72 161 3.40 187 3.65110 3.35 136 3.47 162 3.02 188 3.62111 2.70 137 4.00 163 1.85 189 2.76112 3.87 138 2.88 164 2.77 190 2.72113 3.55 139 2.90 165 3.47 191 3.27114 2.96 140 1.52 166 3.14 192 3.59115 3.41 141 0.99 167 3.54 193 3.92116 1.96 142 1.99 168 3.09 194 2.81117 3.74 143 1.56 169 3.32 195 2.13118 2.98 144 3.19 170 3.21 196 3.06119 3.65 145 2.90 171 3.46 197 3.46120 3.18 146 2.50 172 2.75 198 3.56121 3.60 147 1.49 173 2.56 199 3.33122 3.11 148 3.17 174 2.58 200 2.59123 4.06 149 3.56 175 3.20124 1.98 150 3.34 176 2.78 Mean 2.98125 2.29 151 3.57 177 3.24 SD 0.58
62
This document is a research report submitted to the U.S. Department of Justice. This report has not been published by the Department. Opinions or points of view expressed are those of the author(s)
and do not necessarily reflect the official position or policies of the U.S. Department of Justice.

Table 26. The effect of dilution on IgG concentration
Sample ID Group A (no dilution)
OD Concentration Group B (no dilution)
OD Concentration Group C (1/5 dilution)
OD Concentration Group C (1/10 dilution)
OD Concentration 123 A 1.463 3.3 1.352 3.0 1.256 2.7 1.042 2.1121 A 1.133 2.4 1.134 2.4 0.975 1.9 0.877 1.7119 A 1.347 2.9 1.155 2.4 1.038 2.1 0.890 1.7115 A 1.472 3.3 1.255 2.7 1.035 2.1 0.817 1.5113 A 1.333 2.9 1.227 2.6 1.140 2.4 0.888 1.7110 A 1.249 2.7 0.950 1.9 0.734 1.3 0.442 0.5101 A 1.079 2.2 1.123 2.3 0.836 1.6 0.607 1.0126 A 1.155 2.4 1.114 2.3 1.078 2.2 0.989 2.0120 A 1.426 3.2 1.252 2.7 0.937 1.8 0.898 1.7105 A 1.230 2.6 0.804 1.5 0.603 0.9 0.432 0.5
Concentrations in
µg/mL
Mean 2.8 2.4 1.9 1.4
63
This document is a research report submitted to the U.S. Department of Justice. This report has not been published by the Department. Opinions or points of view expressed are those of the author(s)
and do not necessarily reflect the official position or policies of the U.S. Department of Justice.

Table 27. The effect of rinsing on IgG concentration
ID OD Concentration
001A 1.583 2.77002A 1.892 3.43003A 1.458 2.50004A 1.591 2.79005A 1.478 2.54
Pre-Rinse
006A 1.215 1.982.670.47
Mean Std Dev % Decrease
001B 1.635 2.88002B 1.778 3.19003B 0.966 1.45004B 1.664 2.94005B 1.004 1.53
50 mL Rinse
006B 1.221 1.992.330.77
Mean Std Dev % Decrease initial 12.7%
001C 1.545 2.69002C 1.708 3.04003C 1.079* 1.52004C 1.667 2.95005C 1.341* 2.11
100 mL Rinse
006C 1.36 2.291.990.57
25.5%
Mean Std Dev % Decrease Concentration in µg/mL *Analyzed on a different calibration curve.
64
This document is a research report submitted to the U.S. Department of Justice. This report has not been published by the Department. Opinions or points of view expressed are those of the author(s)
and do not necessarily reflect the official position or policies of the U.S. Department of Justice.

REFERENCES D.N. Bailey and J.J. Guba, “Measurement of Phencyclidine in Saliva,” J. Anal. Toxicol., 4, 311–313 (1980). R.C. Basalt and R.H. Cravey, Disposition of Toxic Drugs and Chemicals in Man, Fourth Edition, Chemical Toxicology Institute, Foster City, CA (1995). M.E. Bates, J. Brick, and H.R. White, “The Correspondence Between Saliva and Breath Estimates of Blood Alcohol Concentration: Advantages and Limitations of the Saliva Method,” J. Stud. Alcohol, K76, 54 (1), 17–22 (1993). M.R. Baylor and D.J. Crouch, “Sympathomimetic Amines: Pharmacology, Toxicology and Analysis,” American Association for Clinical Chemistry (AACC), Therapeutic Drug Monitoring and Toxicology, 14, 103–114 (1993). S. Benkirane, A. Nicolas, M.M. Galteau, and G. Siest, “Highly Sensitive Immunoassays for the De-termination of Cotinine in Serum and Saliva. Comparison Between RIA and an Avidin-Biotin ELISA,” Eur. J. Clin. Chem. Clin. Biochem., 29, 405–410 (1991). R. Bray and D.J. Crouch, “Drug Testing” (chapter 33), Modern Scientific Evidence: The Law and Sci-ence of Expert Testimony, West Publishing, St. Paul, MN (1997), pp. 508–578. T.A. Brettell and R. Saferstein, “Forensic Science,” Anal. Chem., 67, 273R–2794R (1995). J. Caslavska, E. Gassmann, and W. Thormann, “Modification of a Tunable UV-Visable Capillary Electrophoresis Detector for Simultaneous Absorbance and Fluorescence Detection: Profiling of Body Fluids for Drugs and Endogenous Compounds,” J. Chromatogr. A., 709, 147–156 (1995). K. Chang, “Interactions Between Drugs and Saliva-Stimulating Parafilm and Their Implications in Measurements of Saliva Drug Levels,” Commun. Chem. Pathol. Pharmacol., 13, 357–360 (1976). K.Y. Chee, D. Lee, D. Byron, D. Naidoo, and A. Bye, “A Simple Collection Method for Saliva in Children: Potential for Home Monitoring of Carbamazepine Therapy,” Br. J. Clin. Pharmac., 35, 311–313 (1993). M.L. Cheever, “Evaluation of Saliva as an Alternative Drug Testing Specimen,” Report to NIST, 1–15, August 19, 1997. M. Chicharro, A. Zapardiel, E. Bermejo, J.A. Perez-Lopez, and L. Hernandez, “Direct Determination of Ephedrine Alkaloids and Epinephrine in Human Urine by Capillary Zone Electrophoresis,” J. Liq. Chromatogr., 18, 1363–1381 (1995). K. Clauwaert, W. Lambert, and A. De Leenheer, “High Performance Liquid Chromatographic Deter-mination of Cocaine and Its Main Metabolites in Biological Samples: A Review,” J. Liq. Chroma-togr., 18, 2097–2114 (1995).
65
This document is a research report submitted to the U.S. Department of Justice. This report has not been published by the Department. Opinions or points of view expressed are those of the author(s)
and do not necessarily reflect the official position or policies of the U.S. Department of Justice.

E.J. Cone, “Saliva Testing for Drugs of Abuse,” Ann. N.Y. Acad. Sci., 694, 91–127 (1993). E.J. Cone, “Testing Human Hair for Drugs of Abuse, I. Individual Dose and Time Profiles of Mor-phine and Codeine in Plasma, Saliva, Urine, and Beard Compared to Drug-Induced Effects on Pupils and Behavior,” J. Anal. Toxicol., 14, 1–7 (1990). E.J. Cone, M.M. Hillsgrove, and W.D. Darwin, “Simultaneous Measurement of Cocaine, Cocaethyl-ene, Their Metabolites, and ‘Crack’ Pyrolysis Products by GC/MS,” Clin. Chem., 40, 1299–1305 (1994). E.J. Cone, K. Kumor, L.K. Thompson, and M. Sherer, “Correlation of Saliva Cocaine Levels with Plasma Levels and with Pharmacologic Effects After Intravenous Cocaine Administration in Human Subjects,” J. Anal. Toxicol., 12, 200–206 (1988). E.J. Cone, J. Oyler, and W.D. Darwin,” Cocaine Disposition in Saliva Following Intravenous, Intrana-sal and Smoked Administration,” J. Anal. Toxicol., 21, 465–475 (1997). J.M. Dabbs, “Salivary Testosterone Measurements: Collecting, Storing and Mailing Saliva Samples,” Physiol. Behav., 49, 815–817 (1991). C. Dawes, “Considerations in the Development of Diagnostic Tests on Saliva,” Ann. N.Y. Acad. Sci., 694, 265–269 (1993). G. Drehsen and P. Rohdewald, “Rapid High-Performance Thin-Layer Chromatography of Salicylic Acid, Salicylamide, Ethoxybenzamide and Paracetamol in Saliva,” J. Chromatogr., 223, 479–483 (1981).
R.K. Drobitch and C.K. Svensson, “Therapeutic Drug Monitoring in Saliva,” Clin. Pharmacokinet., 23, 365–379 (1992). D. Gomez, M. Gutierrez, P. Martinez-Acacio, and V. Soriano, “Evaluation of a New Saliva Collection Device for HIV Antibody Screening Purposes,” Vox Sang, 66, 244 (1994). C.W. Gorodetzky and M.P. Kullberg, “Validity of Screening Methods for Drugs of Abuse in Biologi-cal Fluids. II. Heroin in Plasma and Saliva,” Clin. Pharmacol. & Ther., 15, 579–587 (1974). S.J. Gross, T.E. Worthy, L. Nerder, E.G. Zimmermann, J.R. Soares, and P. Lomax, “Detection of Re-cent Cannabis Use by Saliva ∆9–THC Radioimmunoassay,” J. Anal. Toxicol., 9, 1–5 (1985). B.J. Hart’t and J. Wilting, “Sensitive Gas Chromatographic Method for Determining Nitrazepam in Serum and Saliva,” J. Chromatogr. Biomed. Appl., 424, 403–409 (1988). K.M. Hold, “Evaluation of Non-Invasive Techniques in Bioanalysis and Toxicology [Thesis],” Utrecht University, Utrecht, The Netherlands (1996).
66
This document is a research report submitted to the U.S. Department of Justice. This report has not been published by the Department. Opinions or points of view expressed are those of the author(s)
and do not necessarily reflect the official position or policies of the U.S. Department of Justice.

K.M. Hold, D. de Boer, J. Zuidmea, and R.A. Maes, “Saliva as an Analytical Tool in Toxicology,” International Journal of Drug Testing, 1, 1–31 (1996). M.G. Horning, L. Brown, J. Nowlin, K. Lertratanangkoon, P. Kellaway, and T.E. Zion, “Use of Saliva in Therapeutic Drug Monitoring,” Clin. Chem., 23, 157–164 (1977). M.A. Huestis, S. Dickerson, and E.J. Cone, “Can Saliva THC Levels Be Correlated to Behavior?” American Academy of Forensic Sciences (AAFS), Abstract AAFS Publication, 92–2, 190 (1992). A.D. Hutchings and P.A. Routledge, “A Single Sample Saliva Test to Determine Acetylator Phenotype,” Br. J. Clin. Pharmacol., 42, 635–637 (1996). O.R. Idowu and B. Caddy, “A Review of the Use of Saliva in the Forensic Detection of Drugs and Other Chemicals,” J. Forensic Sci. Soc., 22, 123–135 (1982). T. Inaba, D.J. Stewart, and W. Kalow, “Metabolism of Cocaine in Man,” Clin. Pharmacol. Ther., 23, 547–552 (1978). S. Iwersen and A. Schmoldt, “FRONTLINE Test Sticks for Drug Testing Saliva?” Presented to The International Association of Forensic Toxicologists (TIAFT), Interlockin, Switzerland (1996). A.J. Jenkins, J.M. Oyler, and E.J. Cone, “Comparison of Heroin and Cocaine Concentrations in Saliva with Concentrations in Blood and Plasma,” J. Anal. Toxicol., 19, 359–374 (1995). A.W. Jones, “Inter- and Intra-Individual Variations in the Saliva/Blood Alcohol Ratio During Ethanol Metabolism in Man,” Clin. Chem., 25, 1394–1398 (1979). A.W. Jones, “Measuring Ethanol in Saliva with the QED® Enzymatic Test Device: Comparison of Re-sults with Blood- and Breath-Alcohol Concentrations,” J. Anal. Toxicol., 19, 169–174 (1995). A.W. Jones, “Pharmacokinetics of Ethanol in Saliva: Comparison with Blood and Breath Alcohol Pro-files, Subjective Feelings of Intoxication, and Diminished Performance,” Clin. Chem., 39, 1837–1844 (1993). A. Kajutani, M. Kaiho, Y. Okada, and I. Ishiyama, “Immunohistochemical Study on the Excretion of a Drug (Methamphetamine) by Salivary Glands,” Jpn. J. Exp. Med., 59, 197–202 (1989). K. Kato, M. Hillsgrove, L. Weinhold, D.A. Gorelick, W.D. Darwin, and E.J. Cone, “Cocaine and Me-tabolite Excretion in Saliva Under Stimulated and Nonstimulated Conditions,” J. Anal. Toxicol., 17, 338–341 (1993). D.A. Kidwell, “Analysis of Cocaine, Heroin, and Their Metabolites in Saliva,” Naval Research Labo-ratory, Surface Chemistry Branch, Chemistry Division, Washington, DC: NRL Memorandum Report 6678 (Jul. 1990).
67
This document is a research report submitted to the U.S. Department of Justice. This report has not been published by the Department. Opinions or points of view expressed are those of the author(s)
and do not necessarily reflect the official position or policies of the U.S. Department of Justice.

L.A. Kiesow, C.T. Simons, and W.B. Long, “Quantitative Determination and Comparison of Ethanol in Saliva Samples of Unknown Volumes with Blood Ethanol Levels in Human Test Subjects Follow-ing Ethanol Ingestion,” Ann. N.Y. Acad. Sci. (5NM), 694, 293–295 (Sep. 20, 1993). P.J. Lamey and A. Nolan, “The Recovery of Human Saliva Using the Salivette System,” Eur. J. Clin. Chem. Clin. Biochem (A3C), 32 (9), 727–728 (Sep. 1994). D. Malamud, “Guidelines for Saliva Nomenclature and Collection,” Ann. N.Y. Acad. Sci., 694, xi–xii (1993). I.D. Mandel, “The Diagnostic Uses of Saliva,” J. Oral. Pathol. Med., 19, 119–125 (1990). C. Maseda, K. Hama, Y. Fukui, T.S. Matsubara, and K. Akane, “Detection of ∆9-THC in Saliva by Capillary GC/ECD After Marijuana Smoke,” Forensic Sci. Int., 32, 259–266 (1986). S.B. Matin, S.H. Wan, and J.H. Karam, “Pharmacokinetics of Tolbutamide in Man: Prediction by Tolbutamide Concentration in Saliva,” Clin. Pharmacol. Ther., 16, 1052–1058 (1974). D.B. Menkes, R.C. Howard, G.F. Spears, and E.R. Cairns, “Salivary THC Following Cannabis Smok-ing Correlates with Subjective Intoxication and Heart Rate,” Psychopharmacology (Berl) (QGI), 103 (2), 277–279 (1991). J. Moncrieff, “Determination of Theophylline in Serum and Saliva in the Presence of Caffeine and Its Metabolites,” J. Chromatogr. B.-Bio. Med. App., 568, 177–185 (1991). J.C. Mucklow, M.R. Bending, G.C. Kahn, and C.T. Dollery, “Drug Concentration in Saliva,” Clin. Pharmacol. Ther., 24, 563–570 (1978). M. Navazesh, “Methods for Collecting Saliva,” Ann. N.Y. Acad. Sci., 694, 72–77 (1993). D.M. Northrop, B.R. McCord, and J.M. Butler, “Forensic Applications of Capillary Electrophoresis,” J. Cap. Elec., 1, 158–168 (1994). C.L. O’Neal, D.J. Crouch, D.E. Rollins, and A.A. Fatah, “The Effects of Collection Methods on Oral Fluids Codeine Concentrations, J. Anal. Toxicol., 23 (6), 536–542 (2000). C.L. O’Neal, D.J. Crouch, D.E. Rollins, A. Fatah, and L. Cheever, “Correlation of Saliva Codeine Concentrations with Plasma Concentrations after Oral Codeine Administration,” Journal of Analytical Toxicology, 23 (6); 452–459 (1999). R.D. Paton and R.W. Logan, “Salivary Drug Measurement: A Cautionary Tale,” Lancet, 1340 (Dec. 6, 1986). M.A. Peat and B.S. Finkle, “Determination of Methaqualone and Its Major Metabolite in Plasma and Saliva After Single Oral Doses,” J. Anal. Toxicol., 4, 114–118 (1980).
68
This document is a research report submitted to the U.S. Department of Justice. This report has not been published by the Department. Opinions or points of view expressed are those of the author(s)
and do not necessarily reflect the official position or policies of the U.S. Department of Justice.

H.W. Peel, B.J. Perrigo, and N.Z. Mikhael, “Detection of Drugs in Saliva of Impaired Drivers,” J. Forensic Sci., 29, 185–189 (1984). D. Perrett and G.A. Ross, “Rapid Determination of Drugs in Biofluids by Capillary Electrophoresis— Measurement of Antipyrine in Saliva for Pharmacokinetic Studies,” J. Chromatogr. A., 700, 179–186 (1995). E.H. Pi, T.K. Tran-Johnson, G.E. Gray, N.R. Walker, R.F. Suckow, and T.B. Cooper, “Saliva and Plasma Despiramine Levels in Asian and Caucasian Volunteers,” Psychopharmacol. Bull., 27, 281–284 (1991). D.O. Quissell, “Steroid Hormone Analysis in Human Saliva,” Ann. N.Y. Acad. Sci. (5NM), 694, 143–145 (Sep. 20, 1993). W. Schramm, P.A. Craig, and R.H. Smith, “Cocaine and Benzoylecgonine in Saliva, Serum and Urine,” Clin. Chem., 39, 481–487 (1993b). W. Schramm, R.H. Smith, and P.A. Craig, “Methods of Simplified Saliva Collection for the Meas-urement of Drugs of Abuse, Therapeutic Drugs, and Other Molecules,” Ann. N.Y. Acad. Sci., (5NM), 694, 311–313 (Sep. 20, 1993a). W. Schramm, R.H. Smith, P.A. Craig, and D.A. Kidwell, “Drugs of Abuse in Saliva: A Review,” J. Anal. Toxicol., 16, 1–9 (1992). W. Schramm, R.H. Smith, P.A. Craig, S. Paek, and H. Kuo, “Determination of Free Progesterone in an Ultrafiltrate of Saliva Collected in situ,” Clin. Chem., 36, 1488–1493 (1990). R.H. Schwartz, H.W. Clark, and P.S. Meek, “Laboratory Tests for Rapid Screening of Drugs of Abuse in the Workplace: A Review,” J. Addictive Diseases, 12, 43–56 (1993). M.E. Sharp, S.M. Wallace, K.W. Hindmarsh, and H.W. Peel, “Monitoring Saliva Concentrations of Methaqualone, Codeine, Secobarbital (Quinalbarbitone), Diphenhydramine and Diazepam After Sin-gle Oral Doses,” J. Anal. Toxicol., 7, 11–14 (1983). J.E. Shipley, N.E. Alessi, S.E. Wade, A.D. Haegele, and B. Helmbold, “Utility of an Oral Diffusion Sink (ODS) Device for Quantification of Saliva Corticosteroids in Human Subjects,” J. of Clinical Endocrinology and Metabolism, 74, 698–700 (1992). O. Stalberg, H. Brotell, and D. Westerlund, “Capillary Electrophoretic Separation of Basic Drugs Us-ing Surface-Modified C8 Capillaries and Derivatized Cyclodextrins as Structural/Chiral Selectors,” Chromatographia, 40, 697–704 (1995). O.M. Steijger, H. Lingeman, U.A.T. Brinkman, J.J.M. Holthuis, A.K. Smilde, and D.A. Doornbos, “Liquid Chromatographic Analysis of Carboxylic Acids Using N-(4-aminobutyl)-N-Ethylisoluminol as Chemiluminescent Label - Determination of Ibuprofen in Saliva,” J. Chromatogr, 615, 97–110 (1993).
69
This document is a research report submitted to the U.S. Department of Justice. This report has not been published by the Department. Opinions or points of view expressed are those of the author(s)
and do not necessarily reflect the official position or policies of the U.S. Department of Justice.

R. Stillman, R. Jones, D. Moore, J. Walker, and S. Welm, “Improved Performance 4 Hours After Co-caine,” Psychopharmacol., 110, 415–420 (1993). S. Suzuki, T. Inoue, H. Hori, and S. Inayama, “Analysis of Methamphetamine in Hair, Nail, Sweat and Saliva by Mass Fragmentography,” J. Anal. Toxicol., 13, 176–178 (1989). L.K. Thompson and E.J. Cone, “Determination of Delta 9-Tetrahydrocannabinol in Human Blood and Saliva by High-Performance Liquid Chromatography with Amperometric Detection,” J. Chromatogr. (HQF), 421(1), 91–97 (Oct. 9, 1987). L.K. Thompson, D. Yousefnejad, K. Kumor, M. Sherer, and E.J. Cone, “Confirmation of Cocaine in Human Saliva After Intravenous Use,” J. Anal. Toxicol., 11, 36–38 (1987). A. Timrots, “Fact Sheet: Drug Testing in the Criminal Justice System,” U.S. Department of Justice, Office of Justice Programs, Bureau of Justice Assistance, March 1992. U.R. Tjaden, M.T. Meeles, C.P. Thys, and M. van der Kaay, “Determination of Some Benzodiazepines and Metabolites in Serum, Urine and Saliva by HPLC,” J. Chromatogr., 181, 227–241 (1980). J.L. Valentine, P. Psaltis, S. Sharma, and H. Moskowitz, “Simultaneous Gas Chromatographic Deter-mination of Diazepam and its Major Metabolites in Human Plasma, Urine, and Saliva,” Anal. Lett., 15, 1665–1683 (1982). H. Vapaatalo, S. Karkkainen, and K.E. Senius, “Comparison of Saliva and Urine Samples in Thin-Layer Chromatographic Detection of Central Nervous Stimulants,” Int. J. Clin. Pharmacol. Res., 4, 5–8 (1984). S.H. Wan, S.B. Matin, and D.L. Azarnoff, “Kinetics, Salivary Excretion of Amphetamine Isomers, and Effect of Urinary pH,” Clin. Pharmacol. & Ther., 23, 585–590 (1978). W.L. Wang, W.D. Darwin, and E.J. Cone, “Simultaneous Assay of Cocaine, Heroin, and Metabolites in Hair, Plasma, Saliva and Urine by Gas Chromatography-Mass Spectrometry,” J. Chromatogr. B-Bio. Med. Appl., 660, 279–290 (1994). K. Wolff and A. Hay, “Methadone in Saliva,” Clin. Chem., 37, 1297–1298 (1991).
70
This document is a research report submitted to the U.S. Department of Justice. This report has not been published by the Department. Opinions or points of view expressed are those of the author(s)
and do not necessarily reflect the official position or policies of the U.S. Department of Justice.


![Fluoride concentration in saliva and biofilm fluid ...saliva fluoride concentration that persisted for up to 6h [7] or 24h [8], respectively. A fluoride dose-response was also established](https://static.fdocuments.us/doc/165x107/5f98df6e8601611a242cc63e/fluoride-concentration-in-saliva-and-biofilm-fluid-saliva-fluoride-concentration.jpg)