Evaluation of safety nets by · PDF fileHealth and Safety Executive Evaluation of safety nets...
84
Health and Safety Executive Evaluation of safety nets by experiment Prepared by the Health and Safety Laboratory for the Health and Safety Executive 2011 RR835 Research Report
-
Upload
nguyenxuyen -
Category
Documents
-
view
225 -
download
0
Transcript of Evaluation of safety nets by · PDF fileHealth and Safety Executive Evaluation of safety nets...

Health and Safety Executive
Evaluation of safety nets by experiment
Prepared by the Health and Safety Laboratory for the Health and Safety Executive 2011
RR835 Research Report

Health and Safety Executive
Evaluation of safety nets by experiment
Paul McCann BEng Health and Safety Laboratory Harpur Hill Buxton Derbyshire SK17 9JN
Safety nets have become a common means of providing collective protection, particularly in construction, to mitigate the effects of falls where it is impractical to use temporary edge protection. The reason for carrying out the research was to explore issues where there was doubt/concern about the performance of safety nets and their attachments. This research evaluated the effectiveness of safety nets, as used in the UK, to identify the risk (if any) of premature failure, in less than idea conditions that could occur in the use. A series of non-ideal loading conditions involving a range of variables were conducted. These included:
nnet type; ndifferent impact locations (ie edge and corner); nattachment point spacing; nrepeated dynamic loading at one position in the net; nmultiple falls; neffect of sag in the net and industry practice to control sag; npresence of defects; neffect of differently shaped objects falling into net; and neffects of aging and degradation from ongoing service damage and the effectiveness of test meshes in
monitoring degradation.
The UK safety net industry supported the research by providing nets.
This report and the work it describes were funded by the Health and Safety Executive (HSE). Its contents, including any opinions and/or conclusions expressed, are those of the author alone and do not necessarily reflect HSE policy.
HSE Books

© Crown copyright 2011
First published 2011
You may reuse this information (not including logos) free of charge in any format or medium, under the terms of the Open Government Licence. To view the licence visit www.nationalarchives.gov.uk/doc/open-governmentlicence/, write to the Information Policy Team, The National Archives, Kew, London TW9 4DU, or email [email protected].
Some images and illustrations may not be owned by the Crown so cannot be reproduced without permission of the copyright owner. Enquiries should be sent to [email protected].
ACKNOWLEDGEMENTS
The author would like to thank the following organisations for their support and assistance during this project.
Fall Arrest Safety Equipment and Training (FASET), for technical advice, free provision of training and acting as liaison between the safety net industry and Health and Safety Laboratory (HSL). Boris Nets, for supplying nets free of charge and inviting HSL to demonstrations of net testing. Higher Safety, for supplying nets free of charge. Huck (UK), for supplying nets free of charge and arranging a HSL visit to the Huck factory in Dresden, Germany. Leon De Oro Safety Nets (UK), for supplying nets free of charge. Rombull (UK), for the free provision of safety net inspection training. Safety Net Services, for supplying nets free of charge and inviting HSL to demonstrations of net testing. Safety Netting (UK), for supplying nets free of charge. Sta-Safe, for supplying nets free of charge.
ii

CONTENTS
1 INTRODUCTION......................................................................................... 1
2 BACKGROUND.......................................................................................... 3 2.1 European Standards................................................................................ 3 2.2 Industry Guidance ................................................................................... 4
3 VARIABLES INVESTIGATED .................................................................... 6 3.1 Phase 1 test variables ............................................................................. 6 3.2 Phase 2 test variables ............................................................................. 6 3.3 Phase 3 Test variables ............................................................................ 7
4 NETS TESTED ........................................................................................... 8 4.1 Nets tested in Phase 1............................................................................. 8 4.2 Nets tested in Phase 2........................................................................... 10 4.3 Nets tested in Phase 3........................................................................... 10
5 TEST DETAILS......................................................................................... 11 5.1 Phase 1 and 2 Tests.............................................................................. 11 5.2 Phase 3 Tests........................................................................................ 19
6 RESULTS ................................................................................................. 21 6.1 Phase 1 ................................................................................................. 21 6.2 Phase 2 ................................................................................................. 32 6.3 Phase 3 ................................................................................................. 43
7 DISCUSSION............................................................................................ 45
8 CONCLUSIONS........................................................................................ 49
9 RECOMMENDATIONS FOR FURTHER WORK...................................... 51
10 REFERENCES ...................................................................................... 52
11 APPENDIX A – PHASE 1 - LOAD ANALYSIS ..................................... 53
12 APPENDIX B – PHASE 2 - LOAD ANALYSIS ..................................... 62
13 APPENDIX C – PHASE 3 - LOAD ANALYSIS ..................................... 68
14 APPENDIX D - MOTION ANALYSIS OF TESTING AT BORIS NETS . 70
iii

iv

EXECUTIVE SUMMARY
Objectives Falls from height are one of the most significant causes of death and major injury occurring while at work and workers in the construction industry are particularly at risk. Safety nets are a preferred solution as they offer collective passive protection. However, there is little historical information on the effectiveness of nets and an incident at Old Trafford, raised concerns about their performance in non-ideal loading situations (ie pre-existing damage, sharp or heavy material entering the net or variations in installation practices).
Given the increased emphasis on safety nets as a result of new regulations for work at height, this work aimed to evaluate the effectiveness of safety nets, as used in the UK, and identify the risk (if any) of premature failure in the less than ideal situations that could occur in the workplace. The project was developed as a sampler for these non-ideal loading situations and included a range of variables. These included:
a) Net material and manufacture (knotted or knotless nets).
b) The effect of falling onto different positions in the net such as edges and corners.
c) The spacing of the attachment points.
d) The effect of repeated dynamic loading at one position (to simulate multiple falls).
e) The effect of differently shaped items falling into the net.
f) The effect of sag in the net.
g) The use of alternative techniques to control sag in oversized nets.
h) The presence of defects.
i) The effects of ageing and degradation due to ongoing service damage and the effectiveness of test meshes in monitoring degradation
To evaluate these variables a range of tests were carried out using a purpose built drop facility at HSL, Buxton. The resulting loads were measured at various positions around the periphery of the net and damage to the net monitored.
Main Findings This work identified the following:
• The safety nets used, generally withstood multiple tests, with penetration occurring only in unusual circumstances. No serious safety concerns were identified.
• The larger the attachment spacing, the higher the load at the attachment point and the greater the displacement of the net under load.
• The highest peak loads are generally recorded adjacent to the drop point.
v
• Peak loads are generally higher for drops at centres of edges and lower for drops at corners.
• Load is transmitted along linear axes from the point of drop, which is likely to be an effect of the square mesh configuration.
• Where damage to the net occurred, it was more likely to occur at attachment points than at drop points.
• There were no significant trends in performance differences between any of the net types.
• The highest load measured on a first drop was 4.84 kN, well below the 6 kN characteristic limit. However, if the drop configuration had been changed (attachment spacing up to 2.5 m, drop height up to 6 m) higher loading may have resulted.
• Loads measured at the attachment spacings are not necessarily the same as loads on the body falling into the net.
• There was a cumulative reduction in elasticity on repeated drops into a safety net. FASET guidance is that nets which have experienced a dynamic load should be replaced.
• The calculated sag was not necessarily evident in the suspended safety net. Inducing extra sag into the net, increased the displacement of the net under load but didn’t have a significant effect on the loads at the attachment points.
• The FASET recommended technique of under-rolling excess netting did not produce significantly different results to the alternative technique of gathering. However, under-rolling is a more controllable and should remain the preferred option.
• Small defects at the drop point represented a potential source of failure on repeat dropping. However, small defects at the attachment point increased displacement under load but did not represent a source of failure.
• All retained items tended to move towards the centre of the net. The 95th percentile test dummy moved more erratically than the BS EN 1263-1 sphere.
• The test dummy induced higher loading on the net than the sphere. While this may be a more realistic test, the dummy’s erratic movement makes it less controllable.
• The safety nets were incapable of retaining the compact mass of a 100 kg, 200 mm diameter cylinder (from BS EN 364). The possibility of construction material entering the net with a falling worker remains a concern.
• Despite the poor condition of the nets which underwent tensile testing in phase 3, undamaged mesh samples retained between 67% and 97% of their estimated original strength.
• These mesh samples retained their properties even in close proximity to areas of damage. Significant deterioration in performance, only occurred when there was obvious damage to the net sample.
vi

• There was consistent agreement between tensile test results for test meshes and net samples from within the net indicating that test meshes provide a realistic predictor of net performance.
Recommendations for further work
This programme was specified to “sample” a wide range of variables and has identified several areas where further consideration and more detailed investigation may be required.
• Investigation of the loads experienced by a falling body on entering a safety net, using an instrumented test dummy. The erratic movement of the test dummy and resulting damage may indicate that workers entering a net may be at risk of injury.
• Comparison with the loads on a net resulting from a body falling into the net from greater heights. Personnel working above the recommended UK working limit of 2 m may be a foreseeable misuse.
• Investigation of the effects of damage (such as damage from hot work or abrasion) on small scale material samples. In the absence of a reliable source of samples from industry (such as was encountered during phase 3 of this programme) damage could be artificially introduced.
• Further investigation into the behaviour of “real” construction materials entering nets. The 100 kg cylinder penetrated the net on every test, retention of other construction material, which could easily enter the net with falling personnel, could prove similarly problematic.
vii

viii

1 INTRODUCTION
In 2005, new European regulations were introduced for work at height (reference 1). These regulations introduced a simple hierarchy for planning managing work at height.
1. Avoid working at height if possible.
2. Where work at height cannot be avoided, equipment or work systems should be used to prevent falls.
3. Where the possibility of a fall cannot be eliminated, equipment or work systems should be used to minimise the consequences of any fall.
Guarding the hazard is considered to be preferable (and therefore higher up the hierarchy) to guarding the worker. For example, a barrier around an edge would be preferable to using a restraint harness and lanyard. Similarly, HSE guidance (reference 2) considers collective passive protection to be better than individual protection, as this removes the reliance on each individual taking specific actions (such as remembering to clip on a safety harness lanyard) for protection themselves. Safety nets are mentioned as an example of the type of collective protection that is the preferred option.
While information on major injuries is available, there was little historical information on the number of times personnel have entered nets without suffering significant injury (ie the number of injuries prevented by the employment of nets). Without this information, it is difficult to accurately determine the effectiveness of nets.
Given the increased emphasis on safety nets as a result of these regulations, the aim of this work was to evaluate the effectiveness of safety nets, as used in the UK, and identify the risk (if any) of premature failure in the less than ideal situations that could occur in the workplace. The project was developed as a sampler for these non-ideal loading situations and included a range of variables. These included:
a) Polymeric material and method of manufacture (knotted or knotless).
b) The effect of items falling onto different positions in the net such as edges and corners.
c) The spacing of the attachment points between the net and structure.
d) The effect of repeated dynamic loading on one position in the net, simulating multiple falls.
e) The effect of differently shaped items falling into the net.
f) The effect of sag in the net.
g) The use of alternative techniques to control sag in oversized nets.
1

h) The presence of defects.
In common with other polymeric fibre based materials, safety nets are susceptible to chemical, thermal and (most significantly) ultra-violet degradation. This degradation is collectively referred to as “ageing”. Additives packages are added to the base material to inhibit this degradation but it is not possible to entirely eliminate these effects. Hence nets undergo an annual tensile test to evaluate reduction in strength, however these tests are carried out on spare test meshes attached to the net at one corner and remote from sources of potential damage. Therefore:
i) The effects of ageing and degradation due to ongoing service damage and the effectiveness of test meshes in monitoring degradation was evaluated.
To evaluate these variables a range of tests were carried out using a purpose built drop facility at HSL, Buxton. The resulting loads were measured at various positions around the periphery of the net and damage to the net monitored.
The work was carried out in three phases; phase 1 covered variables (a) to (d), phase 2 covered variables (e) to (h) and phase 3 covered variable (i) and involved small scale mesh tensile testing of meshes only.
2
2.1
2 BACKGROUND
EUROPEAN STANDARDS
The current European standard for testing and installation of safety nets is BS EN 1263 (2002). This comprises two parts: Part 1 “Safety requirements, test methods” (reference 3) and Part 2 “Safety requirements for the positioning limits” (reference 4).
This standard specifies four classes of net, based on mesh size and characteristic energy absorption. The differences between the four classes are given in Table 1. 100 mm mesh nets are most commonly used in the UK.
Table 1 BS EN 1263-1 Net classes and minimum energy absorption 60 mm Mesh 100 mm Mesh Class A1 2.3 kJ Class A2 2.3 kJ Class B1 4.4 kJ Class B2 4.4 kJ
The minimum breaking energy of a net is specified as being, at least:
Breaking energy E0 ≥ Specified Absorbed Energy EN + Safety Factor γ1 + Ageing Coefficient γ2
The minimum acceptance criteria for EN, are specified in BS EN 1263-1 and shown in Table 1. γ1 is a general safety coefficient of 1.5 and γ2 is the ageing factor, determined by the manufacturer from the results of ageing trials carried out over a 12 month period under reference conditions.
Net manufacturers must carry out development tests and compile data to correlate small scale tensile testing of meshes with the larger BS EN 1263-1 pull through test (using a 500 mm test sphere, pulled through a 3 m by 3 m square sample). The derived relationship allows the use of test meshes as an accurate prediction of net deterioration during service.
Net operators must test meshes on an annual basis and compare the results with the manufacturers specified minimum value, to confirm that the net can remain in service for the following 12 months. The standard (reference 3) states that each net must be supplied with at least one additional mesh sample, carrying the net identification number. Generally, each net is supplied with three test meshes and these are clipped to the corner of the net nearest to the net label. Testing of test meshes is carried out in accordance with BS EN ISO 1806 “Fishing nets – determination of mesh breaking strength of netting” (reference 5).
BS EN 1263-2 specifies a maximum fall height of 6 m. However, in the UK, guidance states that nets should be erected as close as possible to the working position, with a maximum of 2 m below the working position (reference 2, 6, 7, 8). For this project, HSL used the UK recommended working limit of 2 m, as the drop height.
The standard also states that attachment points should be capable of supporting a load of 6 kN at 45o to the horizontal. Where a net is supported by a continuous member, the supports adjacent to the primary loading should each be capable of supporting 4 kN.
The test procedures used during this project were based around the recommendations of the relevant standards (references 3 and 5).
3

4
2.2 INDUSTRY GUIDANCE
Suppliers and erectors of safety nets in the UK are represented by the trade body, FASET (Fall Arrest Safety, Equipment and Training). FASET provide training and certification schemes for net installation and inspection (reference 7). Before full certification, trainee installers are evaluated while working on site. At present the installer training is being redeveloped in conjunction with the Construction Industry Training Board (CITB) and, in future, all qualified installers will be issued with competence identification cards.
FASET also publish a series of brief technical bulletins, via the internet, identifying safety concerns and amendments to current recommended practices. The technical bulletins, of most interest to this work contain the following information:
• FASET technical bulletin no. 2 “Maximum Gaps” (reference 9) states that the maximum allowable wasting gap between adjacent attachment points (as illustrated in Figure 1) can be up to 225 mm in extreme circumstances. Otherwise gaps of less than 100 mm are readily attainable.
• FASET technical bulletin no. 3 “Number of workers above a safety net” (reference 8) states that the maximum fall height should be 2 m, with no more than two workers above a net.
• FASET technical bulletin no. 9 “Under-rolling to size safety nets” (reference 10) states that it is good practice to over-size safety nets. Ideally, a net should have approximately 10% sag measured at the centre of the net. FASET state that over-sizing the net by approximately 10% will result in a nominal 10% sag. The measurement of sag is illustrated in Figure 2. If there is more than 10% excess netting, the preferred method of securing the surplus is under-rolling rather than gathering. This distributes the applied load more evenly and prevents loading of individual mesh cells.
• FASET accepts a range of structural members as being suitable for supporting the characteristic load (reference 4) from a safety net, these include hot rolled structural members such as trusses and portal frames, purlin support cleats, scaffolding (suitably supported), tensioned catenary lines and special anchorage points (reference 7). Purlins, sag rods, sheeting rails, gutter supports, service supports (reference 7), scaffold handrails and edge protection (reference 11) and drilled fixings into masonry (reference 12) must not be used to support a safety net.
Waste
Figure 1 Schematic illustrating the measurement of waste

handrails and edge protection (reference 11) and drilled fixings into masonry (reference 12) must not be used to support a safety net.
Level of attachment
Level of edge of net
Level of underside
of net
% Sag = (Level of edge of net - Level of underside of net) x 100 Net width
Net width
Figure 2 Schematic illustration of the measurement of sag within the net
As polymeric materials are susceptible to thermal damage, FASET recommend (reference 7) that no hot work should be carried out in the vicinity of a safety net. Small mechanical defects such as single or double cord cuts can be repaired (including on-site repairs). There is no standard repair method and individual manufacturers are expected to specify repair techniques for their own nets.
5
3 VARIABLES INVESTIGATED
3.1 PHASE 1 TEST VARIABLES
Phase 1 covered parts (a) to (d) of the test programme. This phase built up baseline data, which could be used for comparison with the wider range of variables investigated during Phase 2.
a) Four types of net were tested for comparison. These were; knotted polypropylene, knotted nylon, knotless polypropylene and used knotless polypropylene. Net choice was based on availability in the UK. Examples of these are shown in Figure 3.
b) Seven drop positions were used. These were Centre (Ce), Long Edge Front (L(f)), Corner Front Left (C(fl)), Short Edge Left (S(l), Long Edge Back (L(b)), Corner Back Right (C(br)) and Short Edge Right (S(r)). The position of the first drop was varied between nets. (Drop positions are shown in Figure 6).
c) One of the seven drop positions on each net was repeated six times.
d) Four attachment spacings were used: 0.1 m (every cell), 0.5 m, 1 m and 2 m. FASET guidance specify a maximum attachment spacing of 2.5 m (reference 9).
Phase 1 consisted of tests 1 to 16.
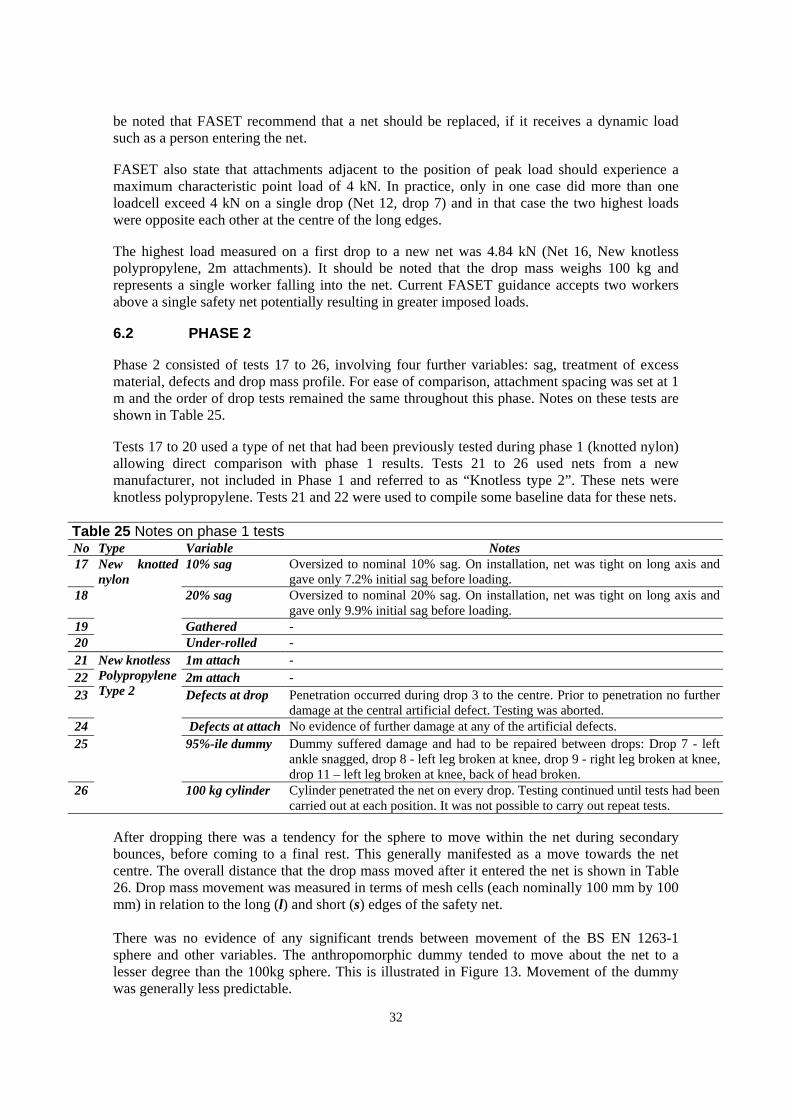
3.2 PHASE 2 TEST VARIABLES
Phase 2 covered parts (e) to (h) of the test programme. This phase covered several further variables representing the less than ideal conditions, in which nets may be operated.
e) Tests 17 and 18 investigated the effects of net sag, with 6%, 10% and 20% nominal sag respectively. FASET recommend a sag of approximately 10% (reference 10).
f) Tests 19 and 20 investigated the effects of dealing with excess netting. These tests used over-sized nets to compare the effects of gathering or under-rolling surplus net as specified by FASET (reference 10).
g) Tests 23 and 24 investigated the effects of defects. These tests used single cord cuts in both the long and short axes introduced at both the drop point for the drop mass and every second attachment point.
h) Tests 25 and 26 investigated differences in drop mass. These tests used a 95%-ile (100 kg) anthropomorphic test dummy and a 100 kg cylinder and compared then with results using the original 100 kg sphere.
Where possible, results from phase 2 were compared with baseline data from the tests undertaken during phase 1. However, tests 21 to 26 used a new manufacturer of knotless polypropylene, that was not included in Phase 1 and tests 21 and 22 were included to provide baseline data, using new undamaged nets, for comparison purposes.
6

3.3 PHASE 3 TEST VARIABLES
Phase 3 investigated the reliability of test meshes as a predictor for net deterioration. Test meshes and mesh samples were taken from nets that had been removed from service and their performance compared and tensile tests were carried out to compare their performance.
i) Tests 27 to 35 compared deterioration due to ageing. Deterioration due to mistreatment during service was not included due to difficulties in sourcing suitable test samples.
7

4 NETS TESTED
4.1 NETS TESTED IN PHASE 1
Both new and used nets were tested in phase 1. All nets tested during Phase 1 were supplied to BS EN 1263-1, system S (net with border rope), class A2 and configuration Q100 (square mesh with 100 mm cells). The nets measured nominally 15 m by 7.5 m in size. Details of the nets used are shown in Table 2.
Table 2 Details of phase 1 net tests No. Date tested Net description Serial No. Date of Attachment Order
by HSL (key word) Manufacture Spacing 1 06/07/2005 Used Knotless Polypropylene 0188622 03/07/2002 Every 0.1 m 1 2 15/07/2005 Used Knotless Polypropylene 0177923 04/02/2002 Every 0.5 m 4 3 13/07/2005 Used Knotless Polypropylene 0182604 06/06/2002 Every 1 m 3 4 13/07/2005 Used Knotless Polypropylene 0177919 04/02/2002 Every 2 m 2 5 25/07/2005 New Knotted Polypropylene 0226359 13/10/2004 Every 0.1 m 5 6 27/07/2005 New Knotted Polypropylene 0226358 13/10/2004 Every 0.5 m 6 7 09/08/2005 New Knotted Polypropylene 0226360 13/10/2004 Every 1 m 11 8 11/08/2005 New Knotted Polypropylene 02616462 21/052004 Every 2 m 12 9 08/08/2005 New Knotless Polypropylene 0226392 11/10/2004 Every 0.1 m 9
10 09/08/2005 New Knotless Polypropylene 0226393 11/10/2004 Every 0.5 m 10 11 29/07/2005 New Knotless Polypropylene 0226394 11/10/2004 Every 1 m 7 12 03/08/2005 New Knotless Polypropylene 0226395 11/10/2004 Every 2 m 8 13 06/09/2005 New Knotted Nylon B05001835 07/2005 Every 0.1 m 13 14 02/11/2005 New Knotted Nylon B05001836 07/2005 Every 0.5 m 15 15 19/10/2005 New Knotted Nylon B05001837 07/2005 Every 1 m 14 16 07/11/2005 New Knotted Nylon B05001838 07/2005 Every 2 m 16
Samples of the mesh for each type of net are shown in Figure 3. Nets manufactured from two polymeric materials, polypropylene and nylon, were used. Two net configurations were also tested, knotted nets, where woven polymer cords are linked together at mesh corners by knotting and knotless nets, where woven polymer cords are interwoven at mesh corners (ie the cords are knotted together at an constituent thread level.
The used knotless polypropylene was believed to be of the same type (and original manufacturer) as the new knotless polypropylene. The four used nets were supplied with a full service history, the details of which are summarised in Table 3.
Table 3 Summary of service history for used nets 1 to 4 No. Serial Date of Date No. of Days No. of Inspections
No. Manufacture withdrawn sites on site repairs 1 0188622 03/07/2002 21/10/2004 15 302 1 01/08/2003 25/08/2004 2 0177923 04/02/2002 21/10/2004 27 433 4 12/03/2003 05/02/2004 3 0182604 06/06/2002 21/10/2004 24 717 2 17/06/2003 12/08/2004 4 0177919 04/02/2002 21/10/2004 12 484 4 01/04/2003 15/10/2004
Installations lasted between 1 and 241 days, with a mean installation period of 25 days. In some cases a net could be returned to the same site on several different occasions. In all cases except one, repairs were carried out by the erector / hirer. The fourth (and final) repair on net 0177923 was carried out by the manufacturer.
8
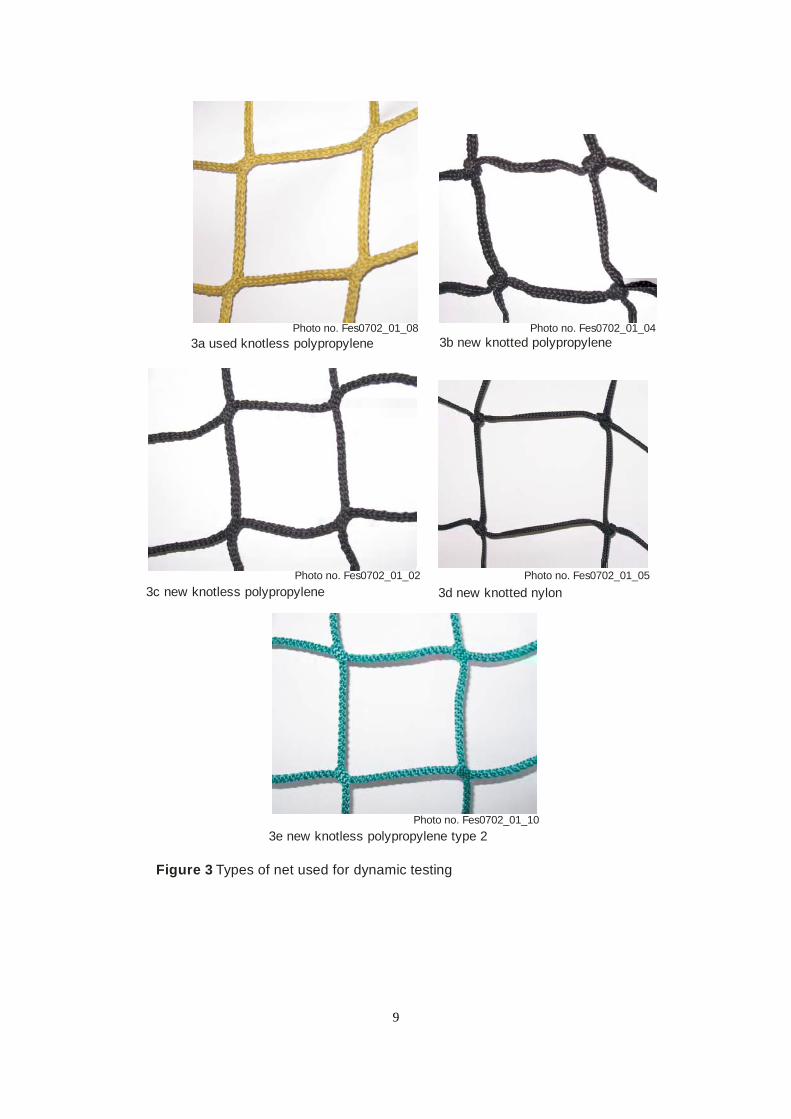
Photo no. Fes0702_01_08 Photo no. Fes0702_01_04 3a used knotless polypropylene 3b new knotted polypropylene
Photo no. Fes0702_01_02 Photo no. Fes0702_01_05 3c new knotless polypropylene 3d new knotted nylon
Photo no. Fes0702_01_10 3e new knotless polypropylene type 2
Figure 3 Types of net used for dynamic testing
9

4.2 NETS TESTED IN PHASE 2
All nets in phase 2 were unused. All nets tested during Phase 2 were supplied to BS EN 1263-1, system S (net with border rope), Class A2 and configuration Q100 (square mesh with 100 mm cells). Nets 17 to 20 were specially ordered over-sized. Nets 21 to 26 measured nominally 15 m by 7.5 m in size. Details of the nets used are shown in Table 4.
Table 4 Details of phase 2 net tests No Date tested Net description Size Serial No. Date of Attachment Order
by HSL (key word) Manufacture Spacing 17 16/11/2006 New Knotted Nylon 10% sag 15 x 7.8 A06002574 08/2006 Every 1 m 18 18 02/11/2006 New Knotted Nylon 20% sag 15 x 8.5 A06002575 08/2006 Every 1 m 17 19 05/12/2006 New Knotted Nylon under rolled 15 x 10 A06002576 08/2006 Every 1 m 19 20 12/12/2006 New Knotted Nylon bagged 15 x 10 A06002577 08/2006 Every 1 m 20 21 16/02/2007 New Knotless Polypropylene 2 15 x 7.5 059767 01/2007 Every 1 m 21 22 20/02/2007 New Knotless Polypropylene 2 15 x 7.5 059765 01/2007 Every 2 m 24 23 19/02/2007 New Knotless Polypropylene 2 Defect at drop 15 x 7.5 059766 01/2007 Every 1 m 22 24 19/02/2007 New Knotless Polypropylene 2 Defect at attach 15 x 7.5 059764 01/2007 Every 1 m 23 25 20/02/2007 New Knotless Polypropylene 2 Dummy 15 x 7.5 059763 01/2007 Every 1 m 25 26 21/02/2007 New Knotless Polypropylene 2 Cylinder 15 x 7.5 059762 01/2007 Every 1 m 26
A sample of the mesh for the second type of polypropylene net (tested only during phase 2) is shown in Figure 3e.
4.3 NETS TESTED IN PHASE 3
Phase 3 involved small scale tests on three by three mesh samples removed from larger nets and did not involve any full scale net tests. All nets tested during Phase 3 were surplus or scrap used nets. All nets were believed to have been originally supplied to BS EN 1263-1, system S (net with border rope) and configuration Q100 (square mesh with 100 mm cells).
All nets were manufactured from knotless polypropylene. Nets were believed to be a mix of both types of knotless polypropylene used during phases 1 and 2. Details of the nets used are shown in Table 5.
Table 5 Details of phase 3 net tests No. Serial No. Date of Test meshes Size / Class
Manufacture remaining 12 0226295 11/10/2004 2 15m x 7.5m 23 059766 01/2007 3 15m x 7.5m 27 001980/24504 03/10/01 2 15m x 7.5m 28 002770/26970 11/03/2002 2 12.5m x 10m 29 001390/53735 29/05/2003 3 15m x 7.5m 30 0002160/5276 26/04/2003 - 18m x 4m 31 003860/2197 22/04/2003 3 12.5m x 10m 32 24526 - 3 33 53915 - 3 -34 000540/168911 26/11/2001 2 12.5m x 10m 35 002000/168876 03/11/2001 1 15m x 7.5m
A further net (no. 36) was not tested because of a lack of both identification and spare test meshes.
10

5 TEST DETAILS
5.1 PHASE 1 AND 2 TESTS
5.1.1 The HSL dynamic test facility
For this project HSL developed a safety net test facility, unique in the UK. This facility consists of a 20 m by 12 m by 4 m steel frame enclosing a 16 m by 8 m void, for the installation of instrumentation and nets. A walkway around the circumference of the facility allowed access for installing nets. This facility is shown in Figure 4.
15 S.N.R.JPG
Figure 4 The safety net test facility and 25 m drop tower
The facility was designed and constructed by RMD Kwikform using their modular “superslim soldier” structural members. Minimal deflection under dynamic load was a critical aspect of the design. The use of modular components allowed easy modification for testing smaller sizes of nets.
The facility is situated adjacent to the Field Engineering, 25 m tall generic drop tower. A long arm jib crane attached to this tower, allowed a drop mass to be dropped at any position within the net. The jib crane can be relocated on the tower, to allow drop heights up to 20 m above the net, however in the current test configuration, drop height is limited to 4 m.
Attached to the inner edges of the void, is a HSL designed attachment system. Each attachment point consists of two “maillon rapide” fittings linked by a short wire rope strop. The attachments were free running along a 16 mm diameter, solid steel rod, which was connected to the test frame at nominally 600 mm intervals. The edge of the safety net rig showing the
11

attachments is shown in Figure 5 and a typical attachment is shown in Figure 5b. The frame contains 450 of these attachment points, allowing connection to every cell of the test net.
Bow Nut
Steel rod
Selvage
5b standard attachment Loadcell Eye
bolt
Photo no. Fes0702_01_23 5c loadcell attachment
Photo no. Fes0702_03_06 Photo no. Fes0703_02_08 5a attachments on the safety net test rig Figure 5 Safety net rig net attachments
At any position on the test frame, the attachment can be replaced by a loadcell assembly, as shown in Figure 5c. Test instrumentation was based in a temporary building adjacent to the facility.
The primary drop mass was a smooth steel sphere in accordance with BS EN 1263-1, this was shown in Figure 7a. This was given the HSL identification number JS1301954/1 This sphere had a mass of 100 kg and a diameter of 500 mm. The sphere was fitted with a removable collared eye-bolt for lifting purposes. The sphere was painted yellow to aid video tracking.
5.1.2 Instrumentation and Calibration
Attachment loads were measured using Tedea-Huntleigh type 620, 2000 kg (20 kN) “S” beam loadcells, as shown in Figure 5c. Fourteen loadcells were fitted to the test frame, these loadcells were movable to allow different measurement configurations. However, the same loadcell configuration was used for all of the HSL tests and this is illustrated in Figure 6. This particular configuration allowed the measurement of a sample of representative loads at significant positions, such as corners and edges, close to and remote from the position of drop.
Loadcell output was recorded using a Dolch ruggedised laptop with a national instruments DAQcard type AI-16E-4, serial number 183262F-01, operating at 500Hz. The tests were logged using HSL SCS DAQ studio software.
Photo no. Fes0702_01_22
Maillon Rapide
Wire strop
5d scaffold clip attachment
12

25m tall generic drop tower
Safety net test frame
A16 A8 A6 A4 A2 A0
B0 L(b) C(br)
B2 Load cell attachment
A20 S(l) Drop position Ce S(r) B4
C(fl) L(f) Test Net
A24
B24 B16 B8 Weather station
Long arm jib crane
Figure 6 Schematic illustration of the safety net test rig showing drop points and loadcell positions
Details of the loadcells used are included in Table 6. Loadcells were calibrated annually in accordance with HSL calibration procedure FE/CP20 “Load-Cells-General”.
Table 6 Details of the safety net rig load cells Load Position Serial Amp No. Cell No.
A0 Rear Long edge right corner 23225 797/717 A2 Rear Long edge 2m from corner 23227 797/712 A4 Rear Long edge 4m from corner 23260 299/182 A6 Rear Long edge 6m from corner 23263 299/183 A8 Rear Long edge centre 23265 797/716 A16 Rear Long edge left corner 23280 293/11824 A20 Left Short edge centre 23269 299/181 A24 Left Short edge front corner 23272 299/180 B0 Right Short edge rear corner 23273 797/715 B2 Right Short edge 2m from corner 23275 797/718 B4 Right Short edge centre 23276 293/11823 B8 Front Long edge right corner - 797/720
B16 Front Long edge centre 23274 293/11822 B24 Front Long edge left corner 23279 797/721
On the 3rd August 2005, the loadcells were adjusted to extend their available range from 5 kN, full scale output to 7.5 kN, full scale output. After adjustment the load cells were recalibrated. Modifications were carried out after, some unexpectedly high load measurements during earlier tests. Loadcell B8 was included as a spare and was not used during these tests. Instrumentation was calibrated and operated by Robert Richardson (Phase 1) and Alex Grimes (Phase 2), Field Engineering, HSL.
13
5.1.3 Test Procedure
Nets were installed on the previous day to testing to allow time for the net to settle. Where attachments were less frequent than every cell, the surplus attachments were simply left hanging freely.
Prior to any drops taking place the sag and waste (see Figure 1) were measured for the net. The drop mass was released from a height of 2 m above the edge of the net, using an electronic bomb release. The chosen drop height was based on HSE and FASET guidance for the maximum working height above a rigged safety net.
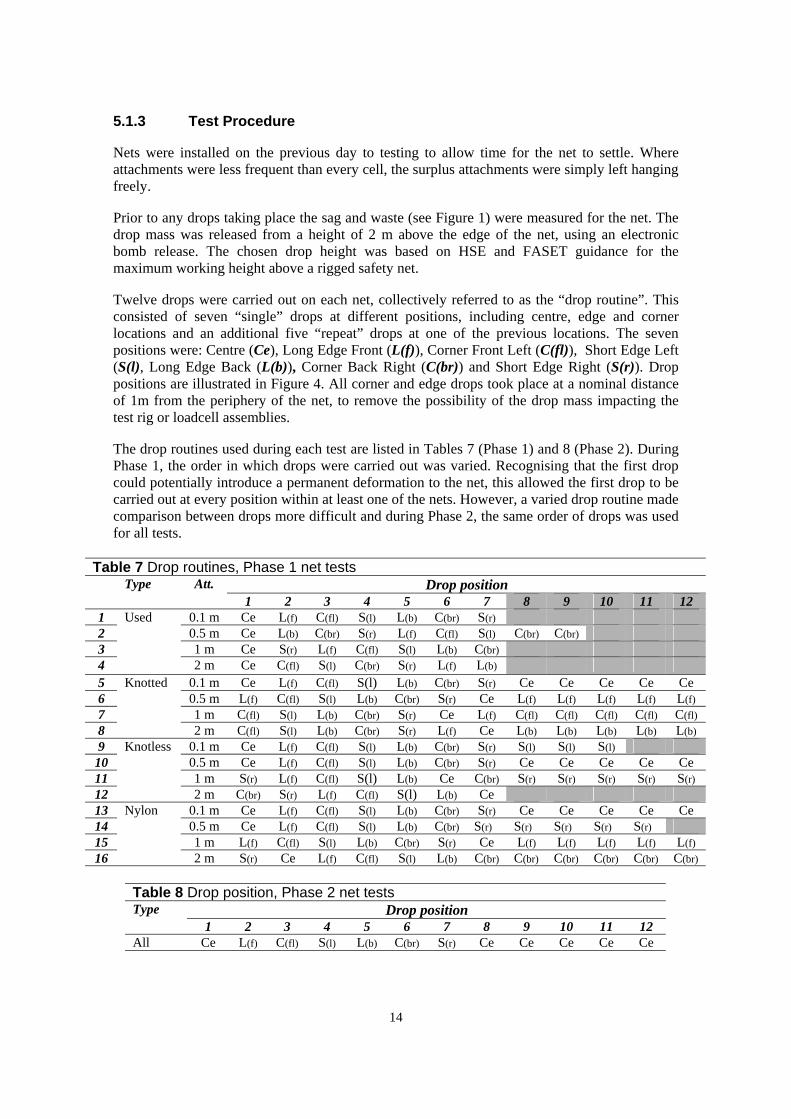
Twelve drops were carried out on each net, collectively referred to as the “drop routine”. This consisted of seven “single” drops at different positions, including centre, edge and corner locations and an additional five “repeat” drops at one of the previous locations. The seven positions were: Centre (Ce), Long Edge Front (L(f)), Corner Front Left (C(fl)), Short Edge Left (S(l), Long Edge Back (L(b)), Corner Back Right (C(br)) and Short Edge Right (S(r)). Drop positions are illustrated in Figure 4. All corner and edge drops took place at a nominal distance of 1m from the periphery of the net, to remove the possibility of the drop mass impacting the test rig or loadcell assemblies.
The drop routines used during each test are listed in Tables 7 (Phase 1) and 8 (Phase 2). During Phase 1, the order in which drops were carried out was varied. Recognising that the first drop could potentially introduce a permanent deformation to the net, this allowed the first drop to be carried out at every position within at least one of the nets. However, a varied drop routine made comparison between drops more difficult and during Phase 2, the same order of drops was used for all tests.
Table 7 Drop routines, Phase 1 net tests Type Att. Drop position
1 2 3 4 5 6 7 1 Used 0.1 m Ce L(f) C(fl) S(l) L(b) C(br) S(r)
8 9 10 11 12
2 0.5 m Ce L(b) C(br) S(r) L(f) C(fl) S(l) C(br) C(br) 3 1 m Ce S(r) L(f) C(fl) S(l) L(b) C(br) 4 2 m Ce C(fl) S(l) C(br) S(r) L(f) L(b)
5 Knotted 0.1 m Ce L(f) C(fl) S(l) L(b) C(br) S(r) Ce Ce Ce Ce Ce 6 0.5 m L(f) C(fl) S(l) L(b) C(br) S(r) Ce L(f) L(f) L(f) L(f) L(f) 7 1 m C(fl) S(l) L(b) C(br) S(r) Ce L(f) C(fl) C(fl) C(fl) C(fl) C(fl) 8 2 m C(fl) S(l) L(b) C(br) S(r) L(f) Ce L(b) L(b) L(b) L(b) L(b) 9 Knotless 0.1 m Ce L(f) C(fl) S(l) L(b) C(br) S(r) S(l) S(l) S(l)
10 0.5 m Ce L(f) C(fl) S(l) L(b) C(br) S(r) Ce Ce Ce Ce Ce 11 1 m S(r) L(f) C(fl) S(l) L(b) Ce C(br) S(r) S(r) S(r) S(r) S(r) 12 2 m C(br) S(r) L(f) C(fl) S(l) L(b) Ce 13 Nylon 0.1 m Ce L(f) C(fl) S(l) L(b) C(br) S(r) Ce Ce Ce Ce Ce 14 0.5 m Ce L(f) C(fl) S(l) L(b) C(br) S(r) S(r) S(r) S(r) S(r) 15 16
1 m L(f) C(fl) S(l) L(b) C(br) S(r) Ce L(f) L(f) L(f) L(f) L(f) 2 m S(r) Ce L(f) C(fl) S(l) L(b) C(br) C(br) C(br) C(br) C(br) C(br)
Table 8 Drop position, Phase 2 net tests Drop positionType
1 2 3 4 5 6 7 8 9 10 11 12 All Ce L(f) C(fl) S(l) L(b) C(br) S(r) Ce Ce Ce Ce Ce
14
After each drop, static measurements were taken at a number of positions around the net, including the centre of the net, the position of the drop, the position of the next drop, the final position at which the test mass came to rest (with and without the test mass) and the waste (see Figure 1). Measurements were taken between the underside of the net and ground level using a surveyors rule, calibrated in accordance with FE/CP15 “Steel Rules”. The location and nature of any damage received by the net was also recorded.
Testing continued until the full drop routine had been completed or penetration occurred. Testing was supervised by Paul McCann, Field Engineering, HSL.
5.1.4 Sag
For these tests, sag is defined as the downwards droop at the centre of the net as a function of the net dimensions. This is illustrated in Figure 2. FASET recommend that nets should be installed with an initial 10% sag and that a net nominally 10% over-sized for the void it is to fill will provide 10% sag.
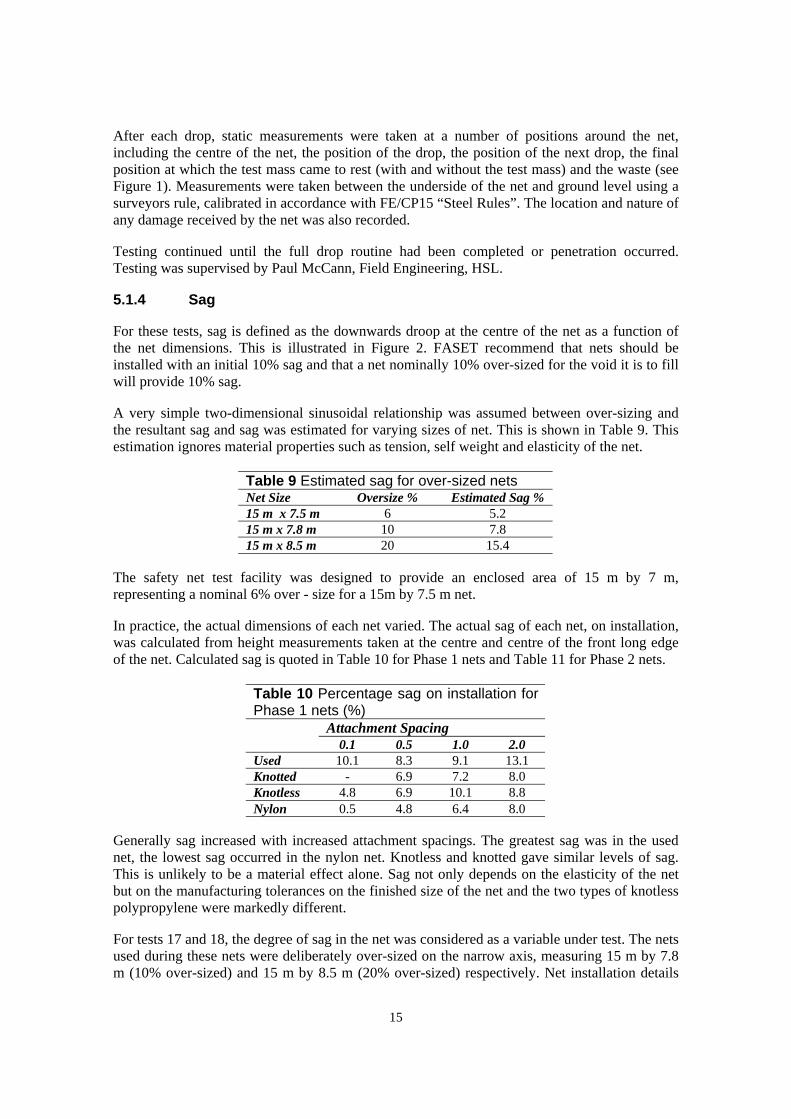
A very simple two-dimensional sinusoidal relationship was assumed between over-sizing and the resultant sag and sag was estimated for varying sizes of net. This is shown in Table 9. This estimation ignores material properties such as tension, self weight and elasticity of the net.
Table 9 Estimated sag for over-sized nets Net Size Oversize % Estimated Sag % 15 m x 7.5 m 6 5.2 15 m x 7.8 m 10 7.8 15 m x 8.5 m 20 15.4
The safety net test facility was designed to provide an enclosed area of 15 m by 7 m, representing a nominal 6% over - size for a 15m by 7.5 m net.
In practice, the actual dimensions of each net varied. The actual sag of each net, on installation, was calculated from height measurements taken at the centre and centre of the front long edge of the net. Calculated sag is quoted in Table 10 for Phase 1 nets and Table 11 for Phase 2 nets.
Table 10 Percentage sag on installation for Phase 1 nets (%)
Attachment Spacing 0.1 0.5 1.0 2.0
Used 10.1 8.3 9.1 13.1 Knotted - 6.9 7.2 8.0 Knotless 4.8 6.9 10.1 8.8 Nylon 0.5 4.8 6.4 8.0
Generally sag increased with increased attachment spacings. The greatest sag was in the used net, the lowest sag occurred in the nylon net. Knotless and knotted gave similar levels of sag. This is unlikely to be a material effect alone. Sag not only depends on the elasticity of the net but on the manufacturing tolerances on the finished size of the net and the two types of knotless polypropylene were markedly different.
For tests 17 and 18, the degree of sag in the net was considered as a variable under test. The nets used during these nets were deliberately over-sized on the narrow axis, measuring 15 m by 7.8 m (10% over-sized) and 15 m by 8.5 m (20% over-sized) respectively. Net installation details
15

remained as for previous nets. It should be noted that these nets did not provide the sag expected on initial installation and tended to be tight on the long axis.
Tests 19 and 20, used oversized nets (15 m by 10 m) to provide excess material for gathering and under-rolling. Here sag was a product of the installation technique.
Table 11 Percentage sag on installation for Phase 2 nets (%) 10% over-size 7.2 20% over-size 9.9 Under rolled 10.7 Gathered 10.7 Knotless2 3.1 Knotless2 2.4 1.0m attach 2.0m attach Knotless2 2.9 Knotless 2 1.2 Defect at Drop Defect at Attach Knotless2 1.1 Knotless2 0.9 Dummy Cylinder
The second type (manufacturer) of knotless polypropylene was very tight on both axes and gave very little sag. This resulted in these nets being very difficult to install.
5.1.5 Excess Netting
For tests 19 and 20, the treatment of excess net material was considered as a variable under test. The nets used during these nets were deliberately over-sized, measuring 15 m by 10 m and providing approximately 2.5 m of surplus netting.
Three sides of the net were installed, using the same techniques, as for previous nets. The fourth (front) side was under rolled or gathered as required. FASET technical bulletin no. 9 was used as a reference for these techniques.
Net 19 was under-rolled, which involves rolling the excess net underneath the safety net. Excess netting is tightly rolled around the border rope and the roll is secured with the attachment rope, so that any applied load is carried uniformly by the border rope.
Net 20 was gathered, which involves gathering the excess into bundles and securing. This method is less controllable and load may be carried by individual mesh cells.
To accommodate the bundles or rolls of excess netting, it was necessary to replace the maillon rapide fittings on the front face of the safety net rig with larger scaffold type clips for these tests. This did not have a significant effect on the dimensions of the net under test.
5.1.6 Defects
For tests 23 and 24, simple defects were introduced into the net. All defects were single cut cords, cut using a sharp knife. No attempt was made to overload or fray surrounding material or create secondary damage (which may be expected to occur in service).
For test 23, defects were introduced at each drop point used during previous tests (a total of seven defects). The defects at the centre, long edge (front), corner (front left) and short edge (left) involved cutting cords running along the short axis of the net. The defects at the long edge (back), corner (back right) and short edge (right) involved cutting cords running along the long axis of the net.
16

For test 24, defects were introduced at every second attachment point (2m between defects). The front right corner was used as an origin, defects alternated between short and long axis cords.
The condition of each defect was monitored after each drop, to evaluate whether further damage had occurred.
Photo no. Fes0703_01_07 7a BS EN 1263-1 100 kg sphere
Photo no. Fes0703_01_04 Photo no. Fes0703_01_14 7c BS EN 364 100 kg cylinder 7b 95%-ile test dummy
Figure 7 Drop masses used during this work
5.1.7 Test masses
For tests 25 and 26, alternative drop masses were used, these are shown in Figure 7. The alternative drop masses were a 95%-ile anthropomorphic test dummy and a 100 kg cylinder. Test masses were used in the same drop routine as previously.
17
Test 25 used the 95% -ile anthropomorphic test dummy, a jointed, flexible test dummy with a size and weight that represents the upper limit of a distribution which includes 95% of the male populace. This is shown in Figure 7b. This test dummy weighs 100 kg (approximately 16 stone). The test dummy was supported by an “eye” bolt into its head and was dropped vertically, (feet first) into the net from a height of 2 m (edge of net to sole of foot).
Test 26 used a 100 kg cylinder. This was a solid steel cylinder in accordance with BS EN 364 “Personal protective equipment against falls from a height – Test methods” (reference 13). This is shown in Figure 7c. It weighed 100 +/- 1 kg and measured nominally 200 mm in diameter. The base of this mass was protected by a flat plywood board of the same diameter as the mass.
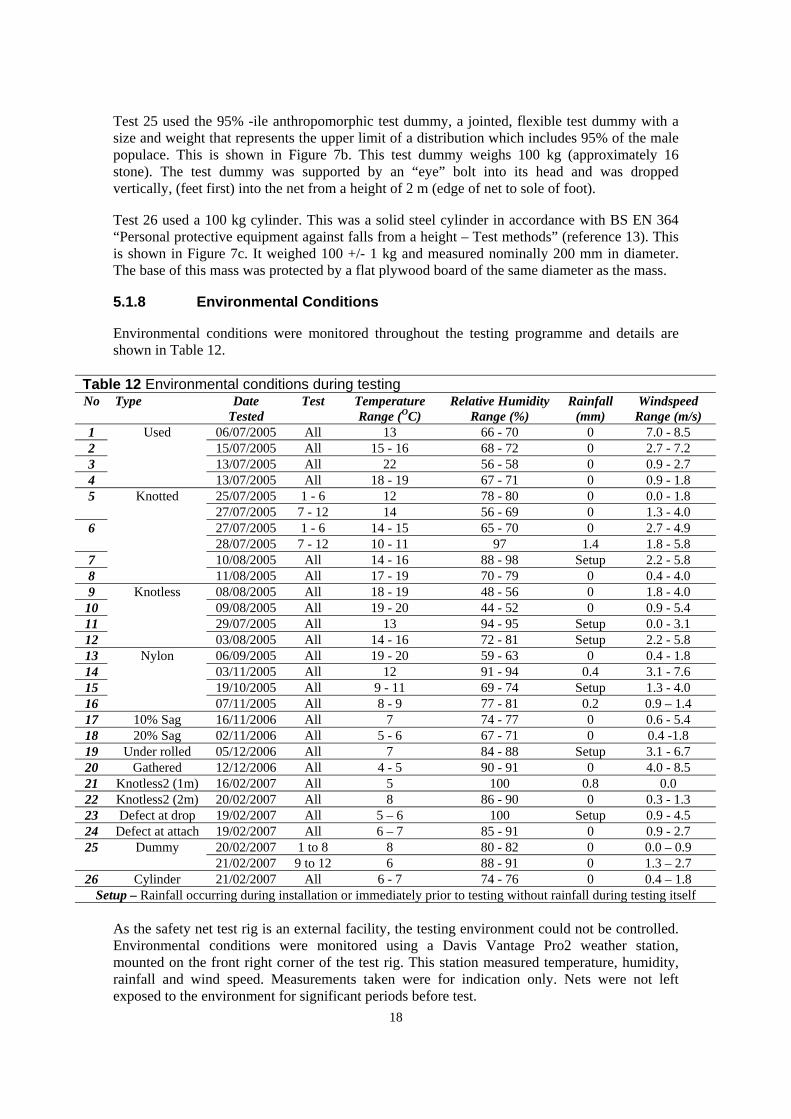
5.1.8 Environmental Conditions
Environmental conditions were monitored throughout the testing programme and details are shown in Table 12.
Table 12 Environmental conditions during testing No Type Date Test Temperature Relative Humidity Rainfall Windspeed
Tested Range (OC) Range (%) (mm) Range (m/s) 1 Used 06/07/2005 All 13 66 - 70 0 7.0 - 8.5 2 15/07/2005 All 15 - 16 68 - 72 0 2.7 - 7.2 3 13/07/2005 All 22 56 - 58 0 0.9 - 2.7 4 13/07/2005 All 18 - 19 67 - 71 0 0.9 - 1.8 5 Knotted 25/07/2005 1 - 6 12 78 - 80 0 0.0 - 1.8
27/07/2005 7 - 12 14 56 - 69 0 1.3 - 4.0 6 27/07/2005 1 - 6 14 - 15 65 - 70 0 2.7 - 4.9
28/07/2005 7 - 12 10 - 11 97 1.4 1.8 - 5.8 7 10/08/2005 All 14 - 16 88 - 98 Setup 2.2 - 5.8 8 11/08/2005 All 17 - 19 70 - 79 0 0.4 - 4.0 9 Knotless 08/08/2005 All 18 - 19 48 - 56 0 1.8 - 4.0
10 09/08/2005 All 19 - 20 44 - 52 0 0.9 - 5.4 11 29/07/2005 All 13 94 - 95 Setup 0.0 - 3.1 12 03/08/2005 All 14 - 16 72 - 81 Setup 2.2 - 5.8 13 Nylon 06/09/2005 All 19 - 20 59 - 63 0 0.4 - 1.8 14 03/11/2005 All 12 91 - 94 0.4 3.1 - 7.6 15 19/10/2005 All 9 - 11 69 - 74 Setup 1.3 - 4.0 16 07/11/2005 All 8 - 9 77 - 81 0.2 0.9 – 1.4 17 10% Sag 16/11/2006 All 7 74 - 77 0 0.6 - 5.4 18 20% Sag 02/11/2006 All 5 - 6 67 - 71 0 0.4 -1.8 19 Under rolled 05/12/2006 All 7 84 - 88 Setup 3.1 - 6.7 20 Gathered 12/12/2006 All 4 - 5 90 - 91 0 4.0 - 8.5 21 Knotless2 (1m) 16/02/2007 All 5 100 0.8 0.0 22 Knotless2 (2m) 20/02/2007 All 8 86 - 90 0 0.3 - 1.3 23 Defect at drop 19/02/2007 All 5 – 6 100 Setup 0.9 - 4.5 24 Defect at attach 19/02/2007 All 6 – 7 85 - 91 0 0.9 - 2.7 25 Dummy 20/02/2007 1 to 8 8 80 - 82 0 0.0 – 0.9
21/02/2007 9 to 12 6 88 - 91 0 1.3 – 2.7 26 Cylinder 21/02/2007 All 6 - 7 74 - 76 0 0.4 – 1.8
Setup – Rainfall occurring during installation or immediately prior to testing without rainfall during testing itself
As the safety net test rig is an external facility, the testing environment could not be controlled. Environmental conditions were monitored using a Davis Vantage Pro2 weather station, mounted on the front right corner of the test rig. This station measured temperature, humidity, rainfall and wind speed. Measurements taken were for indication only. Nets were not left exposed to the environment for significant periods before test.
18
5.2
Testing was not carried out in extreme conditions. During phase 1, the temperature range was 8 to 22 oC and during phase 2, the temperature range was 4 to 8 oC and there was no evidence of any significant effect on the performance of the net under test.
A number of tests were carried out during (or shortly after) rain. Water was clearly trapped within the weave of the net material, which may have contributed towards higher sag on nets 11, 21 and 23. There was no evidence of any continuing effect on displacement of the net when testing started.
PHASE 3 TESTS
From each of the nets listed in Table 4, three test samples (each measuring three by three cells each) were removed for tensile testing. Each sample was removed from a different location on the net and any significant features noted. Any test meshes remaining on the net were also removed for comparison. Test meshes from comparable new nets used in phases 1 and 2 were also taken.
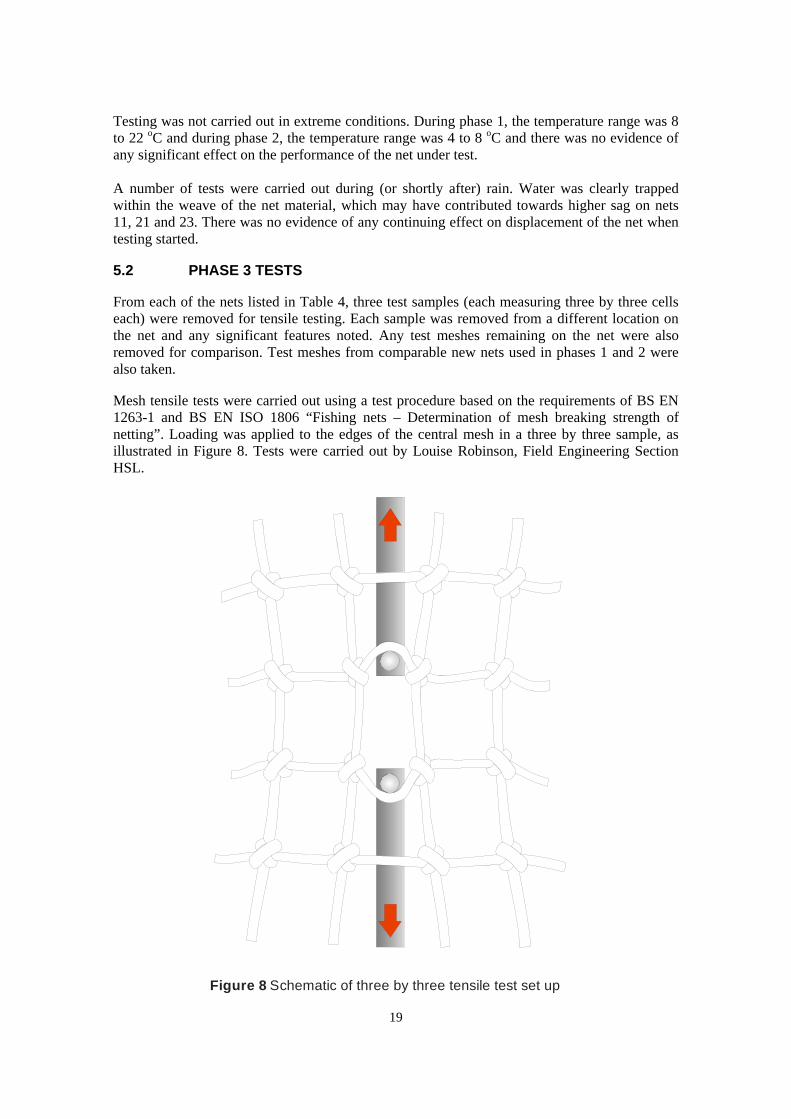
Mesh tensile tests were carried out using a test procedure based on the requirements of BS EN 1263-1 and BS EN ISO 1806 “Fishing nets – Determination of mesh breaking strength of netting”. Loading was applied to the edges of the central mesh in a three by three sample, as illustrated in Figure 8. Tests were carried out by Louise Robinson, Field Engineering Section HSL.
Figure 8 Schematic of three by three tensile test set up
19

Tests were carried out using a Mayes AH500 servo-hydraulic 500kN test machine, with a Rubicon controller, serial no. 452W/93. This machine is calibrated yearly in accordance with Metallurgy and Materials Section calibration procedure CP/02. The calibration is conducted according to BS EN ISO 7500-1:1999 by Denison Mayes Group, to a required accuracy of +/1% in, both, tension and compression.
The tests were carried out at a rate of 4.00 mm/sec, which caused failure of the samples within the required 20 second (+/- 2 s) time interval. The samples were tested at approximately 21ºC and ambient humidity.
20

6 RESULTS
6.1 PHASE 1
Phase 1 consisted of tests 1 to 16, involving four net types (knotted polypropylene, knotless polypropylene, knotted nylon and used knotless polypropylene) and four attachment spacings (0.1 m, 0.5 m, 1 m and 2 m). Notes on these tests are shown in Table 13.
Table 13 Notes on phase 1 tests No Type Spacing Notes 1 Used knotless 0.1 m The sphere penetrated (ie passed through) on drop 2 (Long edge – front). Testing
Polypropylene continued until all single (non-repeat) drops were completed and was then abandoned. 2 0.5 m From drop 3 onwards, the net suffered cumulative damage. After drop 9 (Corner – back
right), damage was severe and penetration seemed likely and testing was aborted. 3 1 m The net suffered damage during several drops. Penetration occurred on drop 7 (Corner –
back, right) and testing was abandoned. 4 2 m Significant damage occurred at attachment points. Testing was aborted after drop 7 (Long
edge – back). No penetration occurred. 5 New knotted 0.1 m During drop 6 there was an electrical fault on loadcell A20 and some data was lost. 6 Polypropylene 0.5 m Minor damage to the test rig during this test requiring minor modifications. Intermittent
electrical faults on loadcells A20 and A16 resulted in some data being lost. 7 1 m -8 2 m -9
10
New knotless Polypropylene
0.1 m
0.5 m
Incidental damage occurred during drop 8 (Short edge – left), resulting from lifting gear. During subsequent tests, there was further damage and penetration occurred on drop 10. Testing was then abandoned. -
11 1 m -12
13 New knotted
2 m
0.1 m
Penetration occurred on drop 7 (Centre). There was no previous damage at this position, however displacement was high and it is possible that that the mass contacted the ground causing failure. Testing was abandoned at this point. -
14 nylon 0.5 m Penetration occurred on drop 11 (short edge – right). Testing was abandoned. 15
16
1 m
2 m
During drop 1 (centre) there was a general instrumentation failure. Testing suspended until instrumentation was repaired. On resumption, drop 1 was excluded. -
was
The movement of the drop mass after it entered the net is shown in Table 14. Drop mass movement was measured in terms of mesh cells (each nominally 100 mm by 100 mm) in relation to the long (l) and short (s) edges of the safety net. Where the table is shaded in grey, tests were not completed due to premature failure or penetration of the net.
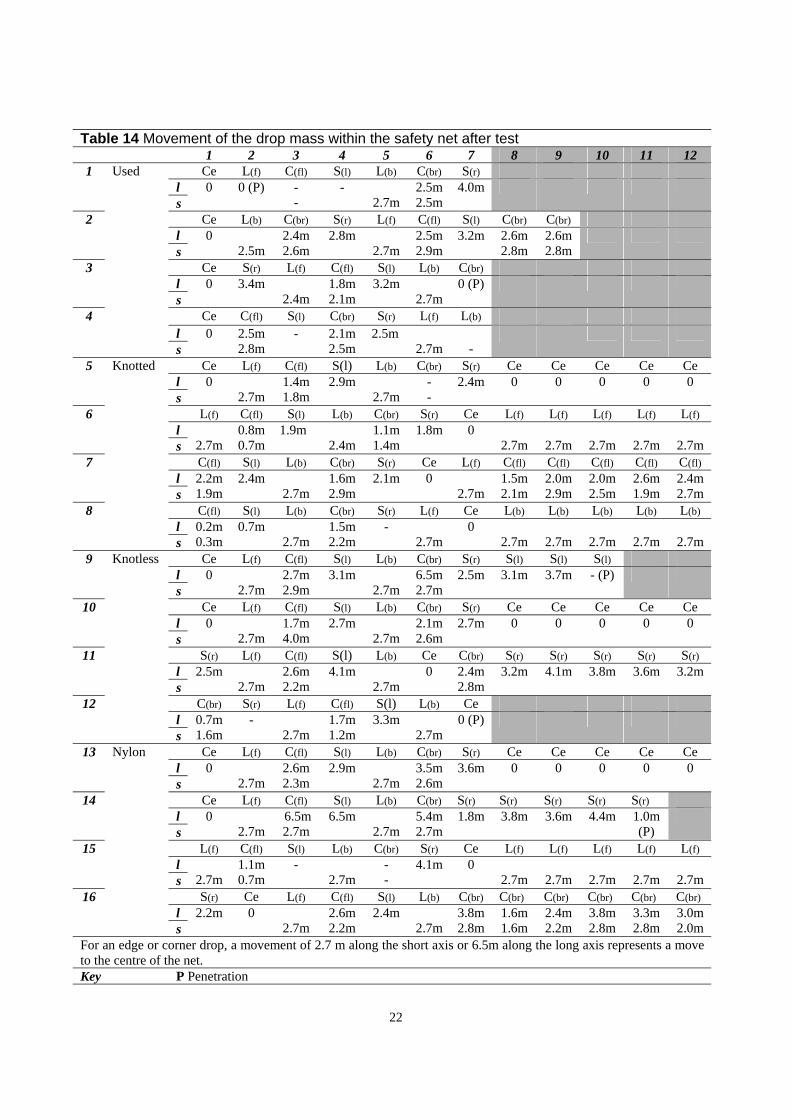
There was a tendency for the sphere to move within the net, immediately after the primary impact and during secondary bounces, before coming to a final rest. This generally manifested as a move towards the net centre, with the mass often coming to rest along the central longitudinal axis of the net. This is illustrated in Figures 9 (movement by net type) and 10 (movement by drop position).
There was less movement of the test mass within the knotted polypropylene net, but other net types were broadly comparable. There was no evidence of any significant trends between movement of the drop mass and attachment frequency.
21
14
8 9 10 11 12 Table 14 Movement of the drop mass within the safety net after test
1 2 3 4 5 6 7 1 Used Ce L(f) C(fl) S(l) L(b) C(br) S(r)
l 0 0 (P) - - 2.5m 4.0m s - 2.7m 2.5m
2 Ce L(b) C(br) S(r) L(f) C(fl) S(l) C(br) C(br) l 0 2.4m 2.8m 2.5m 3.2m 2.6m 2.6m s 2.5m 2.6m 2.7m 2.9m 2.8m 2.8m
3 Ce S(r) L(f) C(fl) S(l) L(b) C(br) l 0 3.4m 1.8m 3.2m 0 (P) s 2.4m 2.1m 2.7m
4 Ce C(fl) S(l) C(br) S(r) L(f) L(b)
l 0 2.5m - 2.1m 2.5m s 2.8m 2.5m 2.7m -
5 Knotted Ce L(f) C(fl) S(l) L(b) C(br) S(r) Ce Ce Ce Ce Ce l 0 1.4m 2.9m - 2.4m 0 0 0 0 0 s 2.7m 1.8m 2.7m -
6 L(f) C(fl) S(l) L(b) C(br) S(r) Ce L(f) L(f) L(f) L(f) L(f) l 0.8m 1.9m 1.1m 1.8m 0 s 2.7m 0.7m 2.4m 1.4m 2.7m 2.7m 2.7m 2.7m 2.7m
7 C(fl) S(l) L(b) C(br) S(r) Ce L(f) C(fl) C(fl) C(fl) C(fl) C(fl) l 2.2m 2.4m 1.6m 2.1m 0 1.5m 2.0m 2.0m 2.6m 2.4m s 1.9m 2.7m 2.9m 2.7m 2.1m 2.9m 2.5m 1.9m 2.7m
8 C(fl) S(l) L(b) C(br) S(r) L(f) Ce L(b) L(b) L(b) L(b) L(b) l 0.2m 0.7m 1.5m - 0 s 0.3m 2.7m 2.2m 2.7m 2.7m 2.7m 2.7m 2.7m 2.7m
9 Knotless Ce L(f) C(fl) S(l) L(b) C(br) S(r) S(l) S(l) S(l) l 0 2.7m 3.1m 6.5m 2.5m 3.1m 3.7m - (P) s 2.7m 2.9m 2.7m 2.7m
10 Ce L(f) C(fl) S(l) L(b) C(br) S(r) Ce Ce Ce Ce Ce l 0 1.7m 2.7m 2.1m 2.7m 0 0 0 0 0 s 2.7m 4.0m 2.7m 2.6m
11 S(r) L(f) C(fl) S(l) L(b) Ce C(br) S(r) S(r) S(r) S(r) S(r) l 2.5m 2.6m 4.1m 0 2.4m 3.2m 4.1m 3.8m 3.6m 3.2m s 2.7m 2.2m 2.7m 2.8m
12 C(br) S(r) L(f) C(fl) S(l) L(b) Ce l 0.7m - 1.7m 3.3m 0 (P) s 1.6m 2.7m 1.2m 2.7m
13 Nylon Ce L(f) C(fl) S(l) L(b) C(br) S(r) Ce Ce Ce Ce Ce l 0 2.6m 2.9m 3.5m 3.6m 0 0 0 0 0 s 2.7m 2.3m 2.7m 2.6m
Ce L(f) C(fl) S(l) L(b) C(br) S(r) S(r) S(r) S(r) S(r) l 0 6.5m 6.5m 5.4m 1.8m 3.8m 3.6m 4.4m 1.0m s 2.7m 2.7m 2.7m 2.7m (P)
L(f) C(fl) S(l) L(b) C(br) S(r) Ce L(f) L(f) L(f) L(f) L(f) l 1.1m - - 4.1m 0 s 2.7m 0.7m 2.7m - 2.7m 2.7m 2.7m 2.7m 2.7m
S(r) Ce L(f) C(fl) S(l) L(b) C(br) C(br) C(br) C(br) C(br) C(br) l 2.2m 0 2.6m 2.4m 3.8m 1.6m 2.4m 3.8m 3.3m 3.0m s 2.7m 2.2m 2.7m 2.8m 1.6m 2.2m 2.8m 2.8m 2.0m
For an edge or corner drop, a movement of 2.7 m along the short axis or 6.5m along the long axis represents a move to the centre of the net. Key P Penetration
22
15
16
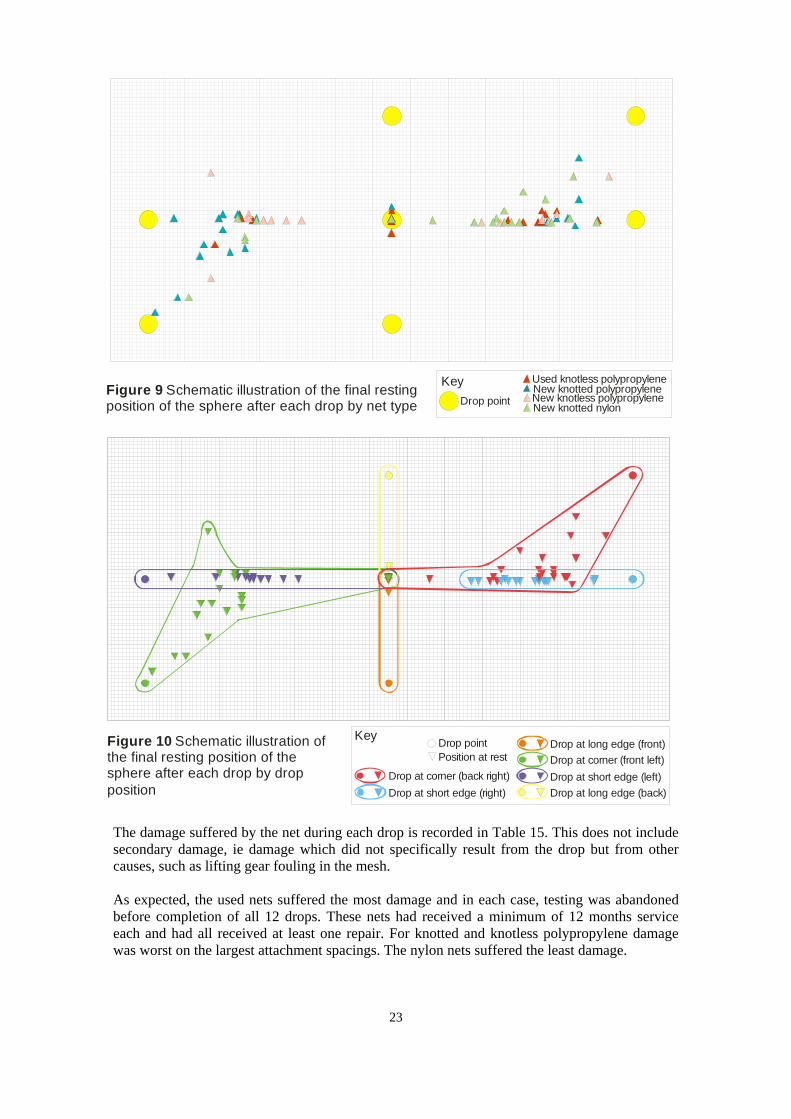
Figure 9 Schematic illustration of the final resting position of the sphere after each drop by net type
Used knotless polypropyleneNew knotted polypropyleneNew knotless polypropyleneNew knotted nylon Drop point
Key
Drop point Figure 10 Schematic illustration of the final resting position of the sphere after each drop by drop position
Drop at long edge (front) Key
Drop at corner (front left) Drop at short edge (left) Drop at long edge (back)
Drop at corner (back right) Drop at short edge (right)
Position at rest
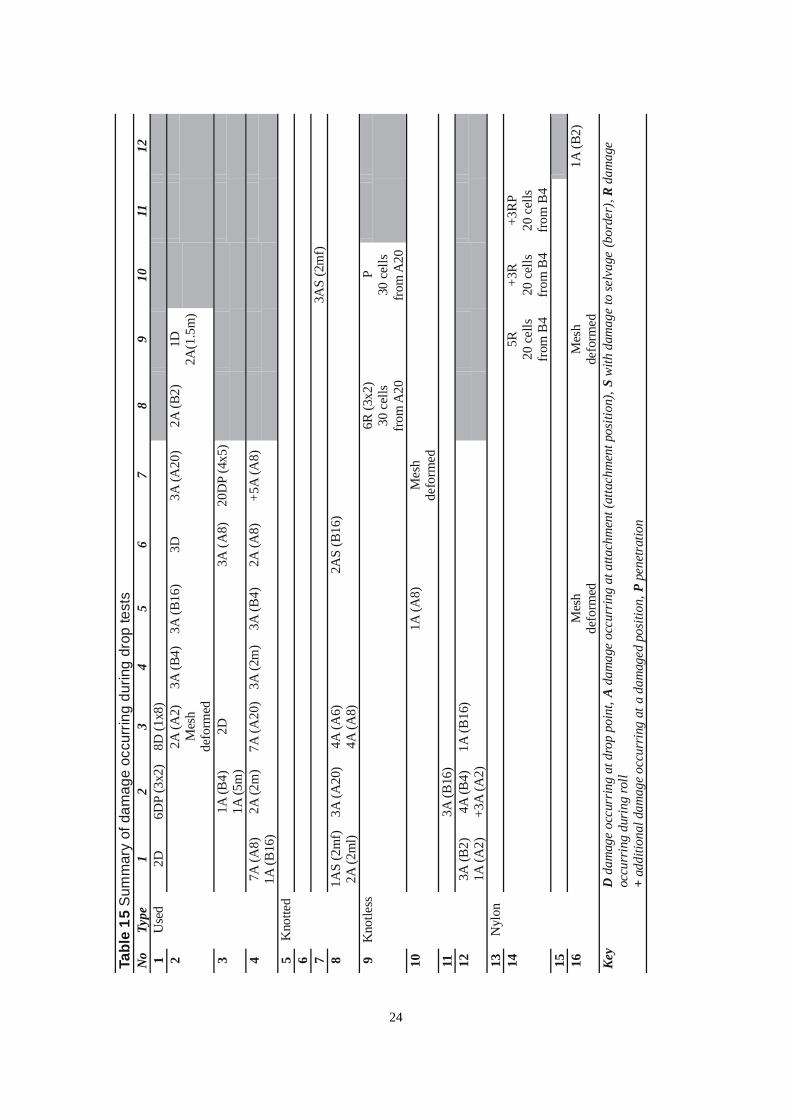
The damage suffered by the net during each drop is recorded in Table 15. This does not include secondary damage, ie damage which did not specifically result from the drop but from other causes, such as lifting gear fouling in the mesh.
As expected, the used nets suffered the most damage and in each case, testing was abandoned before completion of all 12 drops. These nets had received a minimum of 12 months service each and had all received at least one repair. For knotted and knotless polypropylene damage was worst on the largest attachment spacings. The nylon nets suffered the least damage.
23
24
Tabl
e 15
Sum
mar
y of
dam
age
occu
rrin
g du
ring
drop
test
sN
o Ty
pe
1 2
3 4
5 6
7 8
9 10
11
12
1
2D
6DP
(3x2
) 8D
(1x8
) 2
2A (A
2)M
esh
defo
rmed
3A (B
4)
3A (B
16)
3D
3A (A
20)
2A (B
2)
1D2A
(1.5
m)
3
1A (B
4)1A
(5m
) 2D
3A
(A8)
20
DP
(4x5
)
4
Use
d
7A (A
8)1A
(B16
) 2A
(2m
) 7A
(A20
) 3A
(2m
) 3A
(B4)
2A
(A8)
+5
A (A
8)
5 K
notte
d 6 7
3AS
(2m
f)
8 1A
S (2
mf)
3A
(A20
) 4A
(A6)
2AS
(B16
) 2A
(2m
l) 4A
(A8)
9
Kno
tless
6R
(3x2
) P
30 c
ells
30 c
ells
from
A20
from
A20
10
1A
(A8)
M
esh
defo
rmed
11
3A
(B16
) 12
3A (B
2)4A
(B4)
1A (B
16)
1A (A
2)
+3A
(A2)
13
Nyl
on
14
5R
+3R
+3R
P20
cel
ls20
cel
ls20
cel
lsfr
om B
4 fr
om B
4 fro
m B
4 15 16
M
esh
Mes
h1A
(B2)
de
form
ed
defo
rmed
Ke
y
D d
amag
e oc
curr
ing
at d
rop
poin
t, A
dam
age
occu
rrin
g at
atta
chm
ent (
atta
chm
ent p
ositi
on),
S w
ith d
amag
e to
selv
age
(bor
der)
, R d
amag
e oc
curr
ing
duri
ng ro
ll+
addi
tiona
l dam
age
occu
rrin
g at
a d
amag
ed p
ositi
on, P
pen
etra
tion
11a sphere retained with damage 11b penetration damage at drop
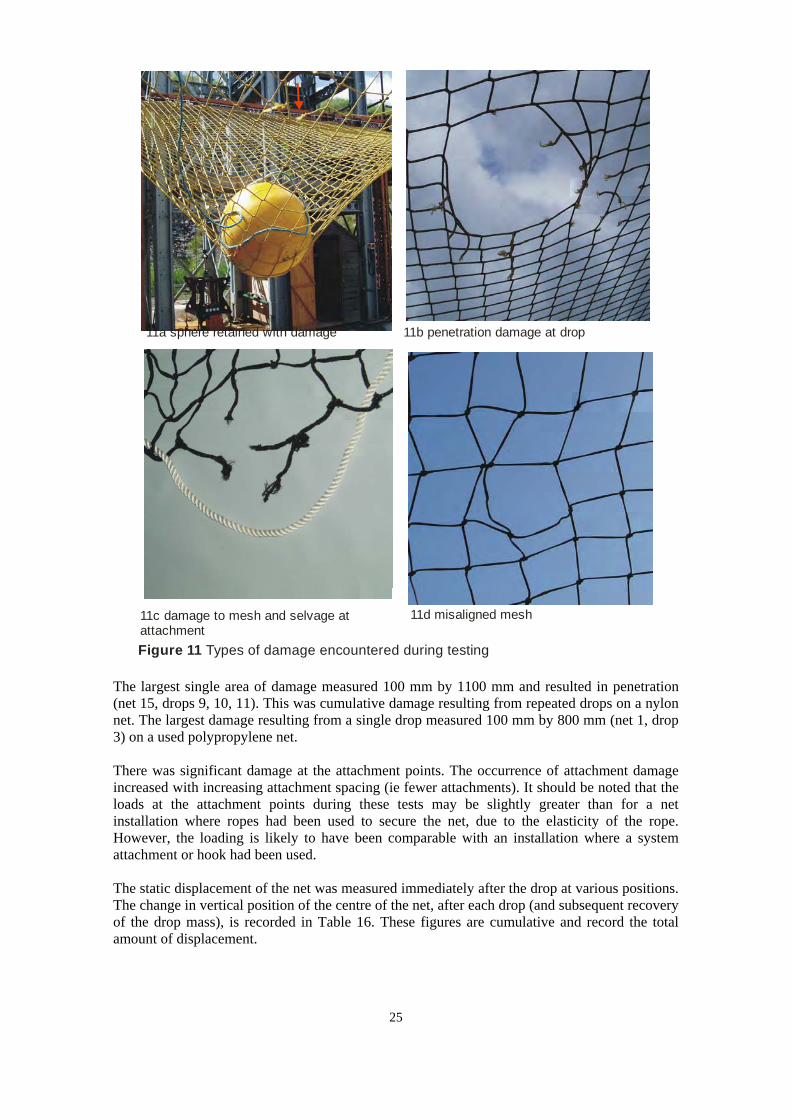
11c damage to mesh and selvage at attachment Figure 11 Types of damage encountered during testing
The largest single area of damage measured 100 mm by 1100 mm and resulted in penetration (net 15, drops 9, 10, 11). This was cumulative damage resulting from repeated drops on a nylon net. The largest damage resulting from a single drop measured 100 mm by 800 mm (net 1, drop 3) on a used polypropylene net.
There was significant damage at the attachment points. The occurrence of attachment damage increased with increasing attachment spacing (ie fewer attachments). It should be noted that the loads at the attachment points during these tests may be slightly greater than for a net installation where ropes had been used to secure the net, due to the elasticity of the rope. However, the loading is likely to have been comparable with an installation where a system attachment or hook had been used.
The static displacement of the net was measured immediately after the drop at various positions. The change in vertical position of the centre of the net, after each drop (and subsequent recovery of the drop mass), is recorded in Table 16. These figures are cumulative and record the total amount of displacement.
11d misaligned mesh
25
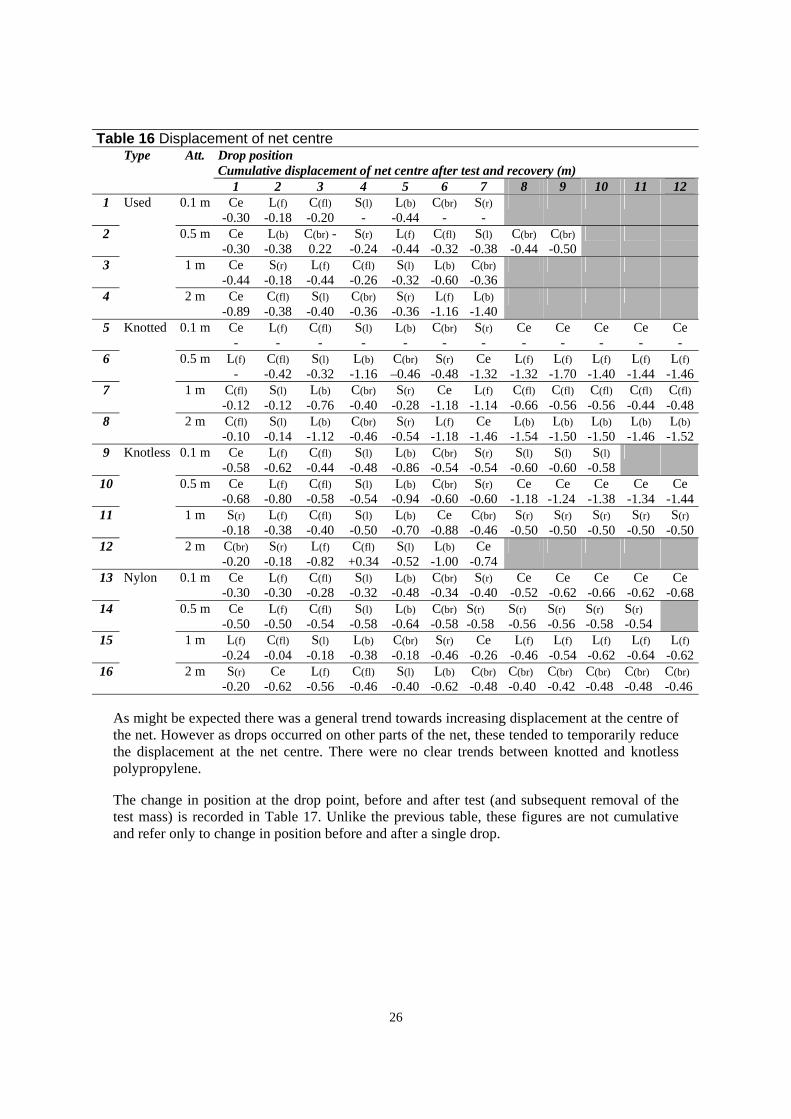
Table 16 Displacement of net centre Type Att. Drop position
Cumulative displacement of net centre after test and recovery (m) 8 91 2 3 4 5 6 7
1 Used 0.1 m Ce L(f) C(fl) S(l) L(b) C(br) S(r) -0.30 -0.18 -0.20 - -0.44 - -
2 0.5 m Ce L(b) C(br) S(r) L(f) C(fl) S(l) -0.30 -0.38 0.22 -0.24 -0.44 -0.32 -0.38
3 1 m Ce S(r) L(f) C(fl) S(l) L(b) C(br) -0.44 -0.18 -0.44 -0.26 -0.32 -0.60 -0.36
4 2 m Ce C(fl) S(l) C(br) S(r) L(f) L(b) -0.89 -0.38 -0.40 -0.36 -0.36 -1.16 -1.40
5 Knotted 0.1 m Ce L(f) C(fl) S(l) L(b) C(br) S(r) Ce Ce Ce Ce Ce - - - - - - - - - - - -
6 0.5 m L(f) C(fl) S(l) L(b) C(br) S(r) Ce L(f) L(f) L(f) L(f) L(f) - -0.42 -0.32 -1.16 –0.46 -0.48 -1.32 -1.32 -1.70 -1.40 -1.44 -1.46
7 1 m C(fl) S(l) L(b) C(br) S(r) Ce L(f) C(fl) C(fl) C(fl) C(fl) C(fl) -0.12 -0.12 -0.76 -0.40 -0.28 -1.18 -1.14 -0.66 -0.56 -0.56 -0.44 -0.48
8 2 m C(fl) S(l) L(b) C(br) S(r) L(f) Ce L(b) L(b) L(b) L(b) L(b) -0.10 -0.14 -1.12 -0.46 -0.54 -1.18 -1.46 -1.54 -1.50 -1.50 -1.46 -1.52
9 Knotless 0.1 m Ce L(f) C(fl) S(l) L(b) C(br) S(r) S(l) S(l) S(l) -0.58 -0.62 -0.44 -0.48 -0.86 -0.54 -0.54 -0.60 -0.60 -0.58
10 0.5 m Ce L(f) C(fl) S(l) L(b) C(br) S(r) Ce Ce Ce Ce Ce -0.68 -0.80 -0.58 -0.54 -0.94 -0.60 -0.60 -1.18 -1.24 -1.38 -1.34 -1.44
11 1 m S(r) L(f) C(fl) S(l) L(b) Ce C(br) S(r) S(r) S(r) S(r) S(r) -0.18 -0.38 -0.40 -0.50 -0.70 -0.88 -0.46 -0.50 -0.50 -0.50 -0.50 -0.50
12 2 m C(br) S(r) L(f) C(fl) S(l) L(b) Ce -0.20 -0.18 -0.82 +0.34 -0.52 -1.00 -0.74
13 Nylon 0.1 m Ce L(f) C(fl) S(l) L(b) C(br) S(r) Ce Ce Ce Ce Ce -0.30 -0.30 -0.28 -0.32 -0.48 -0.34 -0.40 -0.52 -0.62 -0.66 -0.62 -0.68
14 0.5 m Ce L(f) C(fl) S(l) L(b) C(br) S(r) S(r) S(r) S(r) S(r) -0.50 -0.50 -0.54 -0.58 -0.64 -0.58 -0.58 -0.56 -0.56 -0.58 -0.54
15 1 m L(f) C(fl) S(l) L(b) C(br) S(r) Ce L(f) L(f) L(f) L(f) L(f) -0.24 -0.04 -0.18 -0.38 -0.18 -0.46 -0.26 -0.46 -0.54 -0.62 -0.64 -0.62
16 2 m S(r) Ce L(f) C(fl) S(l) L(b) C(br) C(br) C(br) C(br) C(br) C(br) -0.20 -0.62 -0.56 -0.46 -0.40 -0.62 -0.48 -0.40 -0.42 -0.48 -0.48 -0.46
10 11 12
C(br) -0.44
C(br) -0.50
As might be expected there was a general trend towards increasing displacement at the centre of the net. However as drops occurred on other parts of the net, these tended to temporarily reduce the displacement at the net centre. There were no clear trends between knotted and knotless polypropylene.
The change in position at the drop point, before and after test (and subsequent removal of the test mass) is recorded in Table 17. Unlike the previous table, these figures are not cumulative and refer only to change in position before and after a single drop.
26

Table 17 Displacement of drop position Type Att. Drop position
Difference in the displacement at drop position before and after test (and recovery) (m) 8 9 10 111 2 3 4 5 6 7 12
1 Used 0.1 m Ce L(f) C(fl) S(l) L(b) C(br) S(r) -0.30 - - - - - -
2 0.5 m Ce L(b) C(br) S(r) L(f) C(fl) S(l) C(br) C(br) -0.30 +0.04 0.18 -0.04 -0.16 -0.14 -0.02 -0.18 0.16
3 1 m Ce S(r) L(f) C(fl) S(l) L(b) C(br) -0.44 -0.18 -0.18 -0.24 -0.14 -0.20 -
4 2 m Ce C(fl) S(l) C(br) S(r) L(f) L(b) -0.89 - - - - - -
5 Knotted 0.1 m Ce L(f) C(fl) S(l) L(b) C(br) S(r) Ce Ce Ce Ce Ce - -0.14 -0.18 -0.18 -0.20 -0.20 -0.22 -0.94 -0.12 -0.08 -0.08 -0.06
6 0.5 m L(f) C(fl) S(l) L(b) C(br) S(r) Ce L(f) L(f) L(f) L(f) L(f) - -0.18 -0.12 -0.24 -0.34 -0.24 -0.84 -0.10 0.02 0 -0.04 -0.04
7 1 m C(fl) S(l) L(b) C(br) S(r) Ce L(f) C(fl) C(fl) C(fl) C(fl) C(fl) -0.20 -0.28 -0.28 -0.22 -0.20 -0.70 -0.14 -0.18 -0.12 +0.10 -0.04 +0.02
8 2 m C(fl) S(l) L(b) C(br) S(r) L(f) Ce L(b) L(b) L(b) L(b) L(b) -0.66 -0.44 - -0.20 -0.22 -0.34 -0.28 -0.02 +0.02 -0.02 0 -0.08
9 Knotless 0.1 m Ce L(f) C(fl) S(l) L(b) C(br) S(r) S(l) S(l) S(l) -0.58 -0.04 0 -0.04 -0.08 -0.10 -0.10 -0.02 +0.02 +0.02
10 0.5 m Ce L(f) C(fl) S(l) L(b) C(br) S(r) Ce Ce Ce Ce Ce -0.68 -0.04 -0.12 -0.08 -0.18 -0.12 -0.08 -0.58 -0.06 -0.14 +0.04 -0.10
11 1 m S(r) L(f) C(fl) S(l) L(b) Ce C(br) S(r) S(r) S(r) S(r) S(r) -0.12 -0.24 -0.16 -0.06 -0.12 -0.18 -0.04 +0.08 0 +0.02 -0.02 -0.02
12 2 m C(br) S(r) L(f) C(fl) S(l) L(b) Ce -0.52 -0.34 -0.24 -1.10 -0.08 -0.22 -
13 Nylon 0.1 m Ce L(f) C(fl) S(l) L(b) C(br) S(r) Ce Ce Ce Ce Ce -0.30 -0.04 -0.04 -0.10 -0.04 -0.06 0 -0.12 -0.10 -0.04 +0.04 -0.06
14 0.5 m Ce L(f) C(fl) S(l) L(b) C(br) S(r) S(r) S(r) S(r) S(r) -0.50 -0.08 -0.02 -0.04 -0.08 -0.08 -0.10 -0.06 -0.04 +0.04 -0.10
15 1 m L(f) C(fl) S(l) L(b) C(br) S(r) Ce L(f) L(f) L(f) L(f) L(f) -0.18 -0.08 -0.18 -0.06 -0.08 -0.28 -0.26 -0.10 0 +0.04 -0.08 -0.02
16 2 m S(r) Ce L(f) C(fl) S(l) L(b) C(br) C(br) C(br) C(br) C(br) C(br) -0.22 -0.42 0 -0.38 -0.04 +0.04 -0.16 +0.06 -0.02 +0.06 -0.12 0
Increased displacement was most significant on centre drops, particularly initial drops. There was less effect when dropping on corners and edges. It is likely that early drops stretch the net permanently leading to a reduction in elasticity. However the tendency of the drop mass to move towards the centre of the safety net should be noted (see Table 14), this meant that the drop mass rarely came to rest at the drop position and that only the primary impact occurred here, with secondary “bounces” occurring elsewhere on the net.
There was no evidence of any significant trends between displacement at the drop position and net type or attachment frequency.
The recovery of the safety net on removal of the drop mass is recorded in Table 18. These figures were calculated from the height of the safety net, at the final position of rest of the drop mass, before and (immediately) after removal of the mass. The final position of rest of the drop mass is recorded in Table 14.
27

Table 18 Recovery on removal of test mass Type Att. Recovery of net after removal of drop mass (m)
1 2 3 4 5 6 7 8 9 10 11 12 1 Used 0.1 m 1.38 (P) 1.16 1.22 1.42 0.94 1.18 2 0.5 m 1.20 1.16 1.32 0.99 1.20 1.04 1.02 1.04 1.02 3 1 m 1.04 1.12 1.14 1.00 1.10 1.18 (P) 4 2 m 1.15 1.14 1.10 0.94 1.22 1.12 1.22 5 Knotted 0.1 m 0.60 0.76 0.76 0.64 0.86 0.66 0.70 0.70 0.70 0.66 0.66 0.64 6 0.5 m - 0.68 0.64 0.76 0.80 0.62 0.60 0.68 0.36 0.70 0.66 0.64 7 1 m 0.80 0.80 0.84 0.84 0.86 0.66 0.70 0.86 0.70 0.84 0.68 1.10 8 2 m - 0.76 0.98 1.10 0.72 1.02 0.86 0.82 0.86 0.86 0.90 0.88 9 Knotless 0.1 m 1.40 1.40 1.24 1.22 1.30 1.26 1.20 1.12 1.18 (P)
10 0.5 m 1.34 1.32 1.08 1.06 1.14 1.18 1.20 1.06 1.06 0.94 0.98 0.90 11 1 m 1.3 1.32 1.00 1.14 1.12 1.02 1.2 1.04 0.88 0.94 0.90 0.98 12 2 m 1.12 1.46 1.40 1.38 1.32 1.38 (P) 13 Nylon 0.1 m 1.20 1.26 1.00 0.98 1.08 1.04 1.06 1.12 1.06 1.02 1.08 1.04 14 0.5 m 1.04 1.12 1.06 1.02 1.02 0.92 0.86 0.78 0.84 0.86 (P) 15 1 m 1.06 0.96 1.00 0.96 1.06 0.92 0.90 0.90 0.86 0.84 0.80 0.80 16 2 m 1.12 1.02 1.14 1.10 1.02 1.12 1.04 1.04 1.04 1.04 1.02 0.96
The recovery of the net generally tended to diminish as testing progressed, indicating a reduction in elasticity on repeated dropping. The knotted polypropylene gave significantly lower recoveries, perhaps due to permanent set or tightening within the knots. No other significant trends were identified.
Variations in the waste (gaps between attachments at the edge of the nets) during testing are given in Table 19. The waste measurement is illustrated in Figure 1. The waste was measured at a single position, at the centre of the front long edge, before and after each test. Waste was not measured for the 0.1 m attachment spacing because it was considered that this was unlikely to be significant.
Table 19 Changes in waste during testing (mm) Type Att. Waste (mm)
Pre- 1 2 3 4 5 6 7 8 9 10 11 12 test
2 Used 0.5 m 60 60 65 50 55 100 70 75 75 70 3 1 m 60 80 140 200 160 180 340 340 4 2 m 220 420 360 440 380 320 520 500 6 Knotted 0.5 m - 30 80 60 80 65 60 100 100 110 110 110 110 7 1 m 85 85 80 90 85 85 110 125 - - 80 105 80 8 2 m 130 155 140 210 200 185 - 260 260 260 260 260 275
10 Knotless 0.5 m 50 75 45 40 95 60 60 45 110 70 90 90 110 11 1 m 95 80 100 80 80 130 120 - 70 70 65 90 -12 2 m 170 170 155 260 220 220 270 220 14 15
Nylon 0.5 m 1 m
25 40
45 20
40 35
30 40
30 40
35 45
30 30
30 40
25 40
40 35
35 35
30 25 -
16 2 m 90 115 125 140 135 130 140 140 130 130 130 140 120
As expected the largest attachment spacings gave the largest wastes. There was a general tendency for waste to increase after repeated drops. The used nets gave the highest wastes, the nylon nets gave the smallest wastes. FASET technical bulletin No. 2 specifies a maximum wasting gap of 225 mm, but states that gaps of 100 mm or less are readily achievable. All of the 2m attachment spacings, except the nylon net, exceeded this limit, after testing.
28

The loads measured during testing of each net are shown in Appendix A: Tables A3 to A18. These tables show the peak load measured by each of the thirteen loadcells used during each test drop. For ease of comparison, drops are recorded by position rather than in the order they were carried out.
Table 20 summarises the positions where the two highest loads occurred during each drop. With the exception of corner drops peak load generally occurred at the closest loadcell. The loads measured at corner positions tended to be comparatively small.
Table 20 Percentage distribution of position of highest peak loads for drops at different locations
Percentage of peak loads occurring at position Drop position No. of At closest Centre of Centre of Corner Adjacent Other
drops loadcell long edge short edge (A0, B0, A24, to corner (A8, B16) (B4, A20) B24, B8, A16) (A2, B2)
Centre (Ce) 31 N/A 87 3 0 0 10 Long (L(f)) 26 100 96 0 0 0 4 Long (L(b)) 21 86 79 2 0 4 14 Short (S(l) 19 95 3 94 0 3 0 Short (S(r)) 25 100 0 52 2 40 6 Corner (C (fl)) 21 38 5 43 48 2 2 Corner (C(br)) 23 0 0 0 0 98 2
Peak loads tended to occur along linear axes from the position of the drop. This is most apparent for drops along the short right hand edge which produced high loads at the A2 position (2m from the corner on the rear edge) The position of peak loads is likely to be an effect of the square mesh configuration.
The loading patterns resulting from drops at linked positions (such as the two long edges or any of the four corners) are likely to be very similar. It is likely that differences between the front left and back right corners are predominantly an effect of loadcell placement.
The small number of drops that produced peak loads at unexpected positions results can be explained in terms of the movement of the drop mass within the test net after the initial release and occasional snagging (or hooking up) of the lifting gear within the net.
Data from the tests is summarised in tables 21 and 22 (for single drops) and 23 and 24 (repeat drops). Tables 21 (single drop) and 23 (repeat drops) summarise the arithmetical mean of the peak loads recorded by all of the loadcells during a drop. Table 22 (single drop) and 24 (repeat drops) summarises the highest peak load measured by any of the loadcells during a drop. For ease of comparison, different attachment spacings have been highlighted in different colours in Tables 21 and 22.
29

Table 21 Summary of the mean of all peak loads for each single test
Peak loads (kN) Drop Position Ce L(f) C(fl) S(l) L(b) C(br) S(r)
Used Knotless 0.1 0.25 0.20 0.08 0.14 0.22 0.16 0.23 0.5 0.48 0.47 0.13 0.34 0.49 0.35 0.49 1.0 0.88 0.71 0.22 0.57 0.72 0.61 0.62
Polypropylene
2.0 1.10 0.94 0.52 0.72 1.10 0.94 0.98 New Knotted 0.1 0.14 0.14 0.06 0.08 0.14 0.10 0.18
0.5 0.56 0.34 0.11 0.32 0.40 0.37 0.52 1.0 0.66 0.68 0.28 0.66 0.41 0.82 0.79
Polypropylene
2.0 1.41 0.94 0.52 0.84 0.71 0.84 1.18 New Knotless 0.1 0.16 0.19 0.06 0.13 0.21 0.12 0.16
0.5 0.47 0.42 0.13 0.38 0.29 0.34 0.44 1.0 0.95 0.69 0.20 0.51 0.62 0.66 0.69
Polypropylene
2.0 1.24 0.92 0.36 0.66 0.95 0.85 1.00 New Knotted 0.1 0.12 0.16 0.07 0.11 0.16 0.11 0.15
0.5 0.46 0.49 0.18 0.41 0.49 0.44 0.41 1.0 0.95 0.80 0.28 0.69 0.85 0.74 0.86
Nylon
2.0 1.36 1.22 0.80 0.91 1.18 1.15 1.02
Table 22 Summary of highest peak load for each single individual tests
Peak loads (kN) Drop Position Ce L(f) C(fl) S(l) L(b) C(br) S(r)
Used Knotless 0.1 0.86 1.08 0.19 0.73 1.19 0.82 1.15 0.5 1.79 2.79 0.46 2.50 2.80 2.12 3.01 1.0 3.49 3.46 0.69 2.93 3.48 3.05 2.88
Polypropylene
2.0 4.11 3.97 3.85 3.74 3.09 3.47 3.74 New Knotted 0.1 0.46 0.48 0.14 0.19 0.63 0.40 1.04
0.5 1.99 1.96 0.26 2.11 2.14 2.19 3.50 1.0 3.85 4.82 0.73 4.48 2.24 3.61 3.81
Polypropylene
2.0 3.66 4.31 1.88 4.54 2.53 3.22 5.04 New Knotless 0.1 0.81 0.97 0.13 0.88 1.35 0.55 0.84
0.5 1.90 3.54 0.55 3.19 2.00 1.88 3.01 1.0 3.94 4.65 0.53 3.63 2.97 3.02 3.43
Polypropylene
2.0 4.84 4.10 1.44 4.17 5.36 3.41 4.25 New Knotted 0.1 0.37 0.68 0.12 0.56 0.60 0.39 0.59
0.5 1.62 2.61 0.43 2.41 2.81 1.77 2.15 1.0 2.92 3.73 0.86 3.72 4.02 2.82 3.21
Nylon
2.0 3.76 4.94 2.83 4.71 4.11 3.57 4.04
Peak loads tended to be higher for drops along the edge than for drops in the centre of the net. Peak loads were notably lower in the front left corner, probably due to the lower concentration of loadcells at this position.
As expected, peak loads tended to increase with increased attachment spacings. The maximum attachment spacing used here was 2 m, attachment spacings of up to 2.5 m are allowable which could potentially result in higher loading.
30
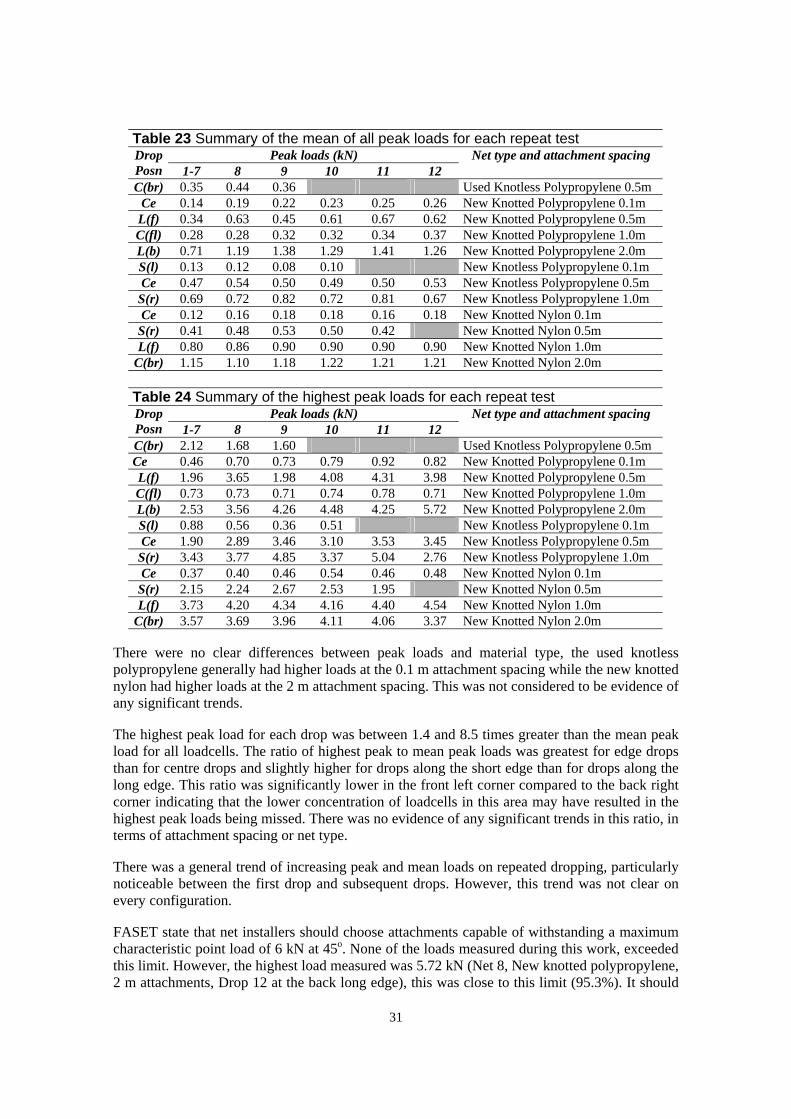
Table 23 Summary of the mean of all peak loads for each repeat test Drop Peak loads (kN) Net type and attachment spacing Posn 1-7 8 9 10 11 12 C(br) 0.35 0.44 0.36 Used Knotless Polypropylene 0.5m
Ce 0.14 0.19 0.22 0.23 0.25 0.26 New Knotted Polypropylene 0.1m L(f) 0.34 0.63 0.45 0.61 0.67 0.62 New Knotted Polypropylene 0.5m C(fl) 0.28 0.28 0.32 0.32 0.34 0.37 New Knotted Polypropylene 1.0m L(b) 0.71 1.19 1.38 1.29 1.41 1.26 New Knotted Polypropylene 2.0m S(l) 0.13 0.12 0.08 0.10 New Knotless Polypropylene 0.1m Ce 0.47 0.54 0.50 0.49 0.50 0.53 New Knotless Polypropylene 0.5m
S(r) 0.69 0.72 0.82 0.72 0.81 0.67 New Knotless Polypropylene 1.0m Ce 0.12 0.16 0.18 0.18 0.16 0.18 New Knotted Nylon 0.1m
S(r) 0.41 0.48 0.53 0.50 0.42 New Knotted Nylon 0.5m L(f) 0.80 0.86 0.90 0.90 0.90 0.90 New Knotted Nylon 1.0m
C(br) 1.15 1.10 1.18 1.22 1.21 1.21 New Knotted Nylon 2.0m
Table 24 Summary of the highest peak loads for each repeat test Drop Peak loads (kN) Net type and attachment spacing Posn 1-7 8 9 10 11 12 C(br) 2.12 1.68 1.60 Used Knotless Polypropylene 0.5m Ce 0.46 0.70 0.73 0.79 0.92 0.82 New Knotted Polypropylene 0.1m L(f) 1.96 3.65 1.98 4.08 4.31 3.98 New Knotted Polypropylene 0.5m C(fl) 0.73 0.73 0.71 0.74 0.78 0.71 New Knotted Polypropylene 1.0m L(b) 2.53 3.56 4.26 4.48 4.25 5.72 New Knotted Polypropylene 2.0m S(l) 0.88 0.56 0.36 0.51 New Knotless Polypropylene 0.1m Ce 1.90 2.89 3.46 3.10 3.53 3.45 New Knotless Polypropylene 0.5m
S(r) 3.43 3.77 4.85 3.37 5.04 2.76 New Knotless Polypropylene 1.0m Ce 0.37 0.40 0.46 0.54 0.46 0.48 New Knotted Nylon 0.1m
S(r) 2.15 2.24 2.67 2.53 1.95 New Knotted Nylon 0.5m L(f) 3.73 4.20 4.34 4.16 4.40 4.54 New Knotted Nylon 1.0m
C(br) 3.57 3.69 3.96 4.11 4.06 3.37 New Knotted Nylon 2.0m
There were no clear differences between peak loads and material type, the used knotless polypropylene generally had higher loads at the 0.1 m attachment spacing while the new knotted nylon had higher loads at the 2 m attachment spacing. This was not considered to be evidence of any significant trends.
The highest peak load for each drop was between 1.4 and 8.5 times greater than the mean peak load for all loadcells. The ratio of highest peak to mean peak loads was greatest for edge drops than for centre drops and slightly higher for drops along the short edge than for drops along the long edge. This ratio was significantly lower in the front left corner compared to the back right corner indicating that the lower concentration of loadcells in this area may have resulted in the highest peak loads being missed. There was no evidence of any significant trends in this ratio, in terms of attachment spacing or net type.
There was a general trend of increasing peak and mean loads on repeated dropping, particularly noticeable between the first drop and subsequent drops. However, this trend was not clear on every configuration.
FASET state that net installers should choose attachments capable of withstanding a maximum characteristic point load of 6 kN at 45o. None of the loads measured during this work, exceeded this limit. However, the highest load measured was 5.72 kN (Net 8, New knotted polypropylene, 2 m attachments, Drop 12 at the back long edge), this was close to this limit (95.3%). It should
31
be noted that FASET recommend that a net should be replaced, if it receives a dynamic load such as a person entering the net.
FASET also state that attachments adjacent to the position of peak load should experience a maximum characteristic point load of 4 kN. In practice, only in one case did more than one loadcell exceed 4 kN on a single drop (Net 12, drop 7) and in that case the two highest loads were opposite each other at the centre of the long edges.
The highest load measured on a first drop to a new net was 4.84 kN (Net 16, New knotless polypropylene, 2m attachments). It should be noted that the drop mass weighs 100 kg and represents a single worker falling into the net. Current FASET guidance accepts two workers above a single safety net potentially resulting in greater imposed loads.
6.2 PHASE 2
Phase 2 consisted of tests 17 to 26, involving four further variables: sag, treatment of excess material, defects and drop mass profile. For ease of comparison, attachment spacing was set at 1 m and the order of drop tests remained the same throughout this phase. Notes on these tests are shown in Table 25.
Tests 17 to 20 used a type of net that had been previously tested during phase 1 (knotted nylon) allowing direct comparison with phase 1 results. Tests 21 to 26 used nets from a new manufacturer, not included in Phase 1 and referred to as “Knotless type 2”. These nets were knotless polypropylene. Tests 21 and 22 were used to compile some baseline data for these nets.
Table 25 Notes on phase 1 tests No Type Variable Notes 17 New knotted 10% sag Oversized to nominal 10% sag. On installation, net was tight on long axis and
nylon gave only 7.2% initial sag before loading. 18 20% sag Oversized to nominal 20% sag. On installation, net was tight on long axis and
gave only 9.9% initial sag before loading. 19 Gathered -20 Under-rolled -21 New knotless 1m attach -22 Polypropylene 2m attach -
Type 223 Defects at drop Penetration occurred during drop 3 to the centre. Prior to penetration no further damage at the central artificial defect. Testing was aborted.
24 Defects at attach No evidence of further damage at any of the artificial defects. 25 95%-ile dummy Dummy suffered damage and had to be repaired between drops: Drop 7 - left
ankle snagged, drop 8 - left leg broken at knee, drop 9 - right leg broken at knee, drop 11 – left leg broken at knee, back of head broken.
26 100 kg cylinder Cylinder penetrated the net on every drop. Testing continued until tests had been carried out at each position. It was not possible to carry out repeat tests.
After dropping there was a tendency for the sphere to move within the net during secondary bounces, before coming to a final rest. This generally manifested as a move towards the net centre. The overall distance that the drop mass moved after it entered the net is shown in Table 26. Drop mass movement was measured in terms of mesh cells (each nominally 100 mm by 100 mm) in relation to the long (l) and short (s) edges of the safety net.
There was no evidence of any significant trends between movement of the BS EN 1263-1 sphere and other variables. The anthropomorphic dummy tended to move about the net to a lesser degree than the 100kg sphere. This is illustrated in Figure 13. Movement of the dummy was generally less predictable.
32

Table 26 Movement of the drop mass within the safety net after testNo. Net type 1 2 3 4 5 6 7
Ce L(f) C(fl) S(l) L(b) C(br) S(r) 17 10% sag l 0 3.2m 1.7m 1.6m 6.5m
s 2.7m 2.6m 2.7m 1.6m 18 20% sag l 0 1.3m - 6.5m 2.6m
s 2.7m 1.7m 4.3m 2.7m 19 Gathered l 0 3.5m 3.7m 3.1m 3.6m
s 2.7m 2.7m 2.7m 2.6m 20 Under - rolled l 0 1.6m 3.2m 3.2m 3.4m
s 2.7m 1.6m 2.7m 2.7m 21 Knotless2 1.0 m l 0 1.2m 4.4m 3.0m 2.6m
s 2.7m 1.1m 2.7m 2.7m 22 Knotless2 2.0 m l 0 3.0m 2.7m
s 2.7m 2.5m 3.9m 2.7m 2.7m 3.1m 23 Defect at Drop l 0 4.7m 1.7m 2.3m 3.1m
s 2.7m 2.7m 2.7m 2.3m 24 Defect at attach l 0 2.5m 2.4m 2.7m 2.8m 3.0m
s 2.7m 2.1m 3.2m 3.2m 25 Dummy l 0 1.8m 1.7m 0.5m 1.0m 0.9m
s 1.7m 0.4m 1.8m 1.1m 26 Cylinder l 0 (P) 0 (P) 0 (P) 0 (P) 0 (P) 0 (P) 0 (P)
s
Figure 13 Schematic illustration of the final resting position of the sphere and 95%-ile test dummy after each drop
BS EN 1263- 1 sphere 95%-ile test dummy
Key
After dropping feet first into the net, there was a tendency for the dummy to “cartwheel” or flip forwards or backwards, extremities tended to become trapped within the mesh. This erratic movement still resulted in a general tendency to move towards the centre of the net.
The cylinder penetrated the net on the initial impact of every drop (ie there were no secondary bounces) and there could be no movement towards the centre.
33
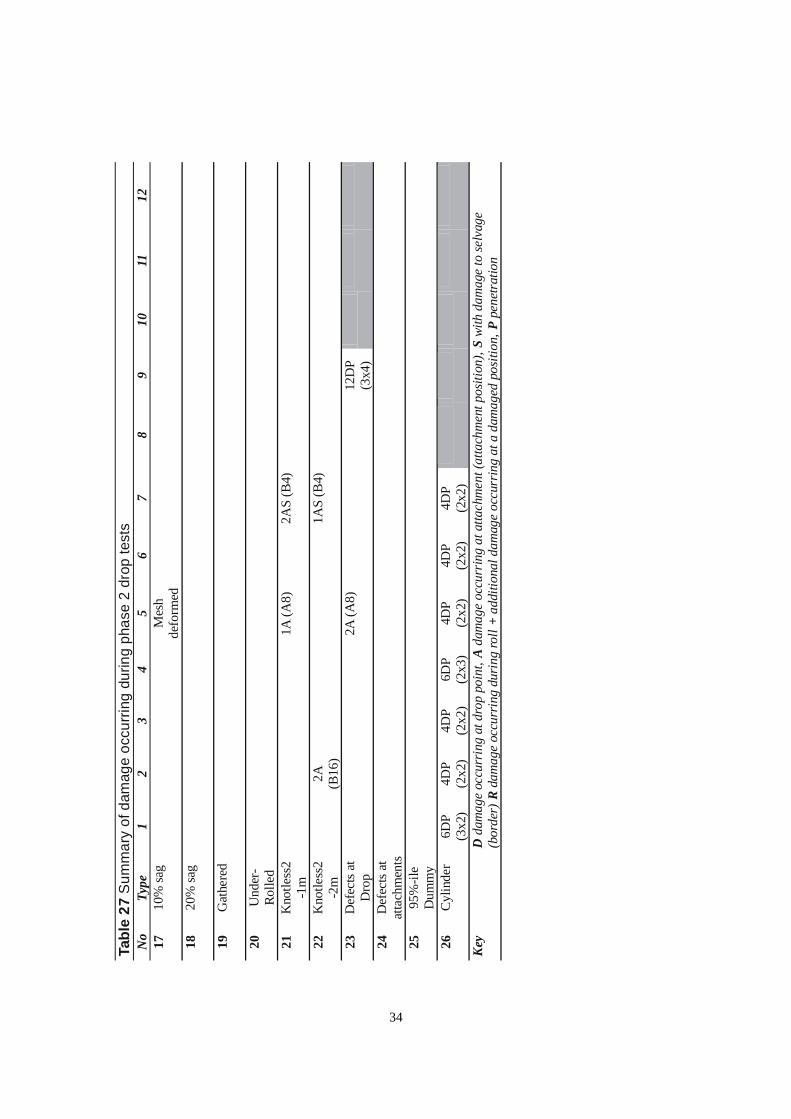
Tabl
e 27
Sum
mar
y of
dam
age
occu
rring
dur
ing
phas
e 2
drop
test
sN
o Ty
pe
1 2
3 4
5 6
7 8
9 10
11
12
34
17
10%
sag
Mes
hde
form
ed
18
20%
sag
19
Gat
here
d
20
Und
er-
Rolle
d 21
K
notle
ss2
1A (A
8)
2AS
(B4)
-1
m
22
Kno
tless
2
2A1A
S (B
4)
-2m
(B
16)
23
Def
ects
atD
rop
2A (A
8)
12D
P(3
x4)
24
Def
ects
atat
tach
men
ts
25
95%
-ile
Dum
my
26
Cyl
inde
r 6D
P4D
P4D
P6D
P4D
P4D
P4D
P(3
x2)
(2x2
) (2
x2)
(2x3
) (2
x2)
(2x2
) (2
x2)
Key
D
dam
age
occu
rrin
g at
dro
p po
int,
A da
mag
e oc
curr
ing
at a
ttach
men
t (at
tach
men
t pos
ition
), S
with
dam
age
to se
lvag
e (b
orde
r) R
dam
age
occu
rrin
g du
ring
roll
+ ad
ditio
nal d
amag
e oc
curr
ing
at a
dam
aged
pos
ition
, P p
enet
ratio
n

The damage suffered by the net during each drop is recorded in Table 27. This table does not include secondary damage, ie damage which did not specifically result from the drop but from other causes, such as lifting gear fouling in the mesh. Where the table is shaded in grey, tests were not completed due to premature failure or penetration of the net.
There was a significant occurrence of damage at the attachment points. It should be noted that the loads at the attachment points during these tests may be slightly greater than for a net installation where ropes had been used to secure the net, due to the elasticity of the rope. However, the loading is likely to have been comparable with an installation where a system attachment or hook had been used.
The static displacement of the net was measured immediately after the drop at various positions. The change in position of the centre of the net is recorded in Table 28. These figures are cumulative and record the total amount of displacement.
Table 28 Displacement of net centre No. Type Cumulative displacement of net centre after test and recovery (m)
1 2 3 4 5 6 7 8 9 10 11 12 Ce L(f) C(fl) S(l) L(b) C(br) S(r) Ce Ce Ce Ce Ce
17 10% sag -0.76 -0.78 -0.56 -0.62 -0.80 -0.62 -0.78 -1.08 -1.20 -1.22 -1.20 -1.22 18 20% sag -0.82 -0.88 -0.64 -0.80 -0.94 -0.96 -0.94 -1.26 -1.32 -1.36 -1.38 -1.40 19 Gathered -0.74 -0.76 -0.52 -0.68 -0.70 -0.64 -0.74 -1.10 -1.14 -1.22 -1.22 -1.22 20 Under - rolled -0.98 -0.94 -0.52 -0.76 -0.96 -0.76 -0.80 -1.18 -1.28 -1.34 -1.40 -1.38 21 Knotless2 1.0 m -0.56 -0.62 -0.46 -0.58 -0.88 -0.68 -0.74 -1.04 -1.28 -1.24 -1.26 -1.28 22 Knotless2 2.0 m -0.40 -0.54 -0.54 -0.58 -0.80 -0.62 -0.66 -1.02 -1.18 -1.22 -1.28 -1.36 23 Defect at drop -0.50 -0.60 -0.58 -0.56 -0.80 -0.68 -0.68 -0.96 -0.76 24 Defect at attach -0.37 -0.50 -0.44 -0.54 -0.80 -0.37 -0.67 -1.20 -1.27 -1.32 -1.34 -1.42 25 Dummy -0.31 -0.40 -0.40 -0.44 -0.62 -0.56 -0.62 -0.76 -0.99 -1.20 -1.20 -1.36 26 Cylinder -0.18 -0.06 -0.24 -0.32 -0.33 -0.34 -0.39
As expected there was a general trend towards increasing displacement at the centre of the net. However as drops occurred on other parts of the net, these tended to temporarily reduce the displacement at the net centre.
The displacement of the centre was substantially lower during Test 26, probably because the drop mass was not retained by the net.
The change in position at the drop point, before and after test (and subsequent removal of the test mass) is recorded in Table 29. Unlike the previous table, these figures are not cumulative and refer only to change in position before and after a single drop.
35
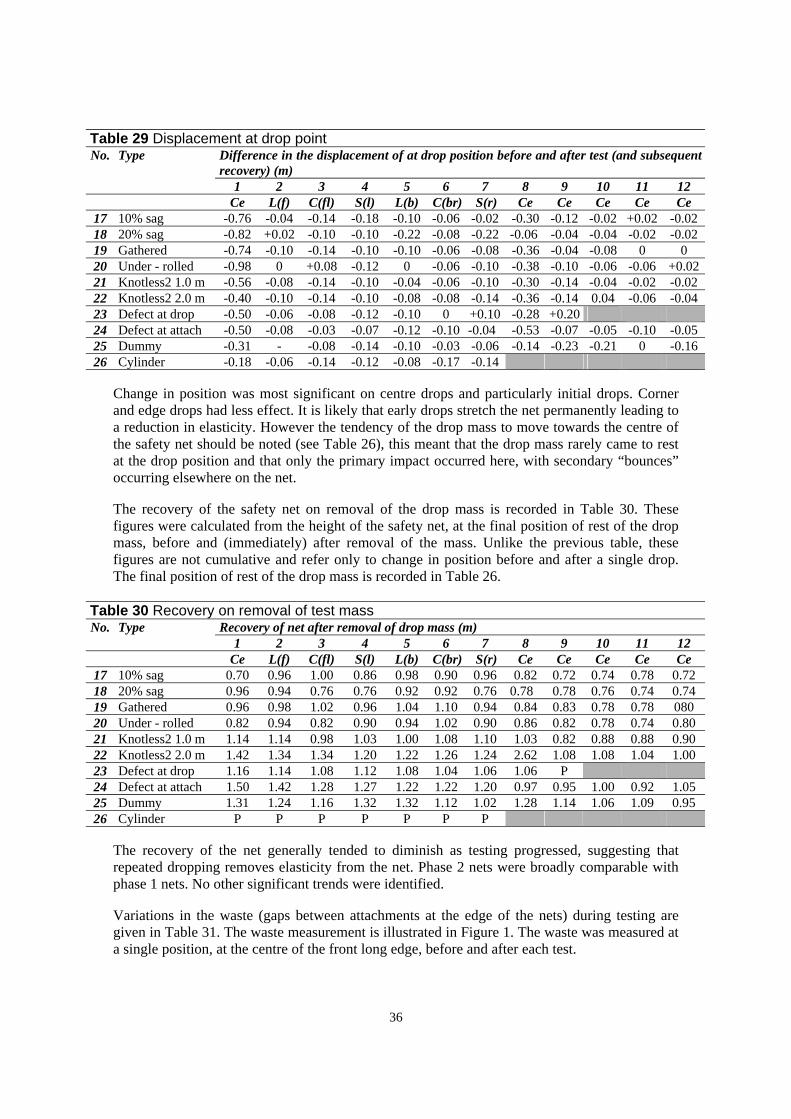
Table 29 Displacement at drop point No. Type Difference in the displacement of at drop position before and after test (and subsequent
recovery) (m) 1 2 3 4 5 6 7 8 9 10 11 12
Ce L(f) C(fl) S(l) L(b) C(br) S(r) Ce Ce Ce Ce Ce 17 10% sag -0.76 -0.04 -0.14 -0.18 -0.10 -0.06 -0.02 -0.30 -0.12 -0.02 +0.02 -0.02 18 20% sag -0.82 +0.02 -0.10 -0.10 -0.22 -0.08 -0.22 -0.06 -0.04 -0.04 -0.02 -0.02 19 Gathered -0.74 -0.10 -0.14 -0.10 -0.10 -0.06 -0.08 -0.36 -0.04 -0.08 0 0 20 Under - rolled -0.98 0 +0.08 -0.12 0 -0.06 -0.10 -0.38 -0.10 -0.06 -0.06 +0.02 21 Knotless2 1.0 m -0.56 -0.08 -0.14 -0.10 -0.04 -0.06 -0.10 -0.30 -0.14 -0.04 -0.02 -0.02 22 Knotless2 2.0 m -0.40 -0.10 -0.14 -0.10 -0.08 -0.08 -0.14 -0.36 -0.14 0.04 -0.06 -0.04 23 Defect at drop -0.50 -0.06 -0.08 -0.12 -0.10 0 +0.10 -0.28 +0.20 24 Defect at attach -0.50 -0.08 -0.03 -0.07 -0.12 -0.10 -0.04 -0.53 -0.07 -0.05 -0.10 -0.05 25 Dummy -0.31 - -0.08 -0.14 -0.10 -0.03 -0.06 -0.14 -0.23 -0.21 0 -0.16 26 Cylinder -0.18 -0.06 -0.14 -0.12 -0.08 -0.17 -0.14
Change in position was most significant on centre drops and particularly initial drops. Corner and edge drops had less effect. It is likely that early drops stretch the net permanently leading to a reduction in elasticity. However the tendency of the drop mass to move towards the centre of the safety net should be noted (see Table 26), this meant that the drop mass rarely came to rest at the drop position and that only the primary impact occurred here, with secondary “bounces” occurring elsewhere on the net.
The recovery of the safety net on removal of the drop mass is recorded in Table 30. These figures were calculated from the height of the safety net, at the final position of rest of the drop mass, before and (immediately) after removal of the mass. Unlike the previous table, these figures are not cumulative and refer only to change in position before and after a single drop. The final position of rest of the drop mass is recorded in Table 26.
Table 30 Recovery on removal of test mass No. Type Recovery of net after removal of drop mass (m)
1 2 3 4 5 6 7 8 9 10 11 12 Ce L(f) C(fl) S(l) L(b) C(br) S(r) Ce Ce Ce Ce Ce
17 10% sag 0.70 0.96 1.00 0.86 0.98 0.90 0.96 0.82 0.72 0.74 0.78 0.72 18 20% sag 0.96 0.94 0.76 0.76 0.92 0.92 0.76 0.78 0.78 0.76 0.74 0.74 19 Gathered 0.96 0.98 1.02 0.96 1.04 1.10 0.94 0.84 0.83 0.78 0.78 080 20 Under - rolled 0.82 0.94 0.82 0.90 0.94 1.02 0.90 0.86 0.82 0.78 0.74 0.80 21 Knotless2 1.0 m 1.14 1.14 0.98 1.03 1.00 1.08 1.10 1.03 0.82 0.88 0.88 0.90 22 Knotless2 2.0 m 1.42 1.34 1.34 1.20 1.22 1.26 1.24 2.62 1.08 1.08 1.04 1.00 23 Defect at drop 1.16 1.14 1.08 1.12 1.08 1.04 1.06 1.06 P 24 Defect at attach 1.50 1.42 1.28 1.27 1.22 1.22 1.20 0.97 0.95 1.00 0.92 1.05 25 Dummy 1.31 1.24 1.16 1.32 1.32 1.12 1.02 1.28 1.14 1.06 1.09 0.95 26 Cylinder P P P P P P P
The recovery of the net generally tended to diminish as testing progressed, suggesting that repeated dropping removes elasticity from the net. Phase 2 nets were broadly comparable with phase 1 nets. No other significant trends were identified.
Variations in the waste (gaps between attachments at the edge of the nets) during testing are given in Table 31. The waste measurement is illustrated in Figure 1. The waste was measured at a single position, at the centre of the front long edge, before and after each test.
36

Table 31 Changes in waste during testing No. Type Waste (mm)
Pre 1 2 3 4 5 6 7 8 9 10 11 12 test
17 10% sag 10 15 20 20 20 30 20 - 30 20 25 20 20 18 20% sag 0 20 20 15 35 30 30 25 30 35 45 45 45 19 Gathered 0 20 30 50 70 80 80 90 50 80 100 100 80 20 Under – rolled 0 10 10 - 40 50 60 60 50 50 50 50 50 21 Knotless2 1.0 m 35 15 5 10 10 10 15 10 10 10 10 10 10 22 Knotless2 2.0 m 65 35 25 45 50 - 55 55 50 55 35 35 30 23 Defect at drop 0 15 10 10 15 10 15 10 5 10 24 Defect at attach 20 20 10 25 10 10 15 20 25 25 25 25 20 25 Dummy 20 5 15 15 15 10 10 10 10 15 10 10 15 26 Cylinder 10 10 10 10 10 12 12 12
As witnessed during phase 1 there was a tendency for waste on the nylon nets to increase after repeated drops. However, this trend was less evident on the second type of knotless polypropylene nets, which maintained a similar low degree of waste throughout testing. Waste was relatively low on tests 17 and 18 probably due to a lack of tension within the net. None of the nets exceeded the FASET recommended limits.
The loads measured during phase 2 testing of each net are shown in Appendix B: Tables B3 to B12. These tables show the peak load measured by each of the thirteen loadcells used during each test drop. For ease of comparison drops are recorded by position rather than in the order they were carried out. These results are summarised in the following sections
6.2.1 The effects of sag
The safety net test rig dimensions provided an estimated sag of 6%. FASET recommends a sag on installation of approximately 10%. The effects of varying initial sag were investigated by tests 15, 17 and 18. Sag of the net centre during these tests is summarised in Table 32. Peak loads from these tests are summarised in Table 33. Drops 8 to 12 on net 15 have been excluded as these were not drops to the centre of the net and were therefore not directly comparable.
Table 32 Percentage sag at net centre with respect to net edge after drop testing for sagging nylon nets No Nominal % Sag
Oversize Initial 1 2 3 4 5 6 7 8 9 10 11 12 Ce L(f) C(fl) S(l) L(b) C(br) S(r) Ce Ce Ce Ce Ce
15 6% 6.4% 12.4% 9.6% 6.9% 8.8% 10.9% 8.8% 9.9% - - - - -17 10% 7.2% 17.3% 17.6% 14.7% 15.5% 17.9% 15.5% 17.6% 21.6% 23.2% 23.5% 23.2% 23.5% 18 20% 9.9% 20.8% 21.6% 18.4% 20.5% 22.4% 22.7% 22.4% 26.7% 27.5% 28.0% 28.3% 31.2%
As sag was increased, permanent displacement of the net centre after drop testing also increased. Although all three nets were quite similar initially, the effects of the over-sizing quickly became apparent on loading. With a nominal oversize of 10%, the static displacement reached 23.5% (1.76 m) on repeated drops and with a nominal oversize of 20%, the static displacement reached 31.2% (2.36 m). Dynamic displacement would probably have been far greater.
37

Table 33 Mean peak and highest peak loads on drop testing for sagging nylon nets No Nominal Initial Mean Peak Load (kN), Highest Peak load (kN)
Oversize Sag 1 2 3 4 5 6 7 8 9 10 11 12 Ce L(f) C(fl) S(l) L(b) C(br) S (r) Ce Ce Ce Ce Ce
15 6% 6.4% 0.95 0.80 0.28 0.69 0.85 0.74 0.86 - - - - - Mean 2.92 3.73 0.86 3.72 4.02 2.82 3.21 - - - - - Peak
17 10% 7.2% 0.92 0.85 0.29 0.62 0.85 0.70 0.72 0.99 1.06 1.08 1.09 1.09 Mean 2.28 3.81 0.92 2.80 3.23 2.72 2.19 2.75 2.89 2.93 3.02 2.92 Peak
18 20% 9.9% 0.92 0.86 0.18 0.65 0.82 0.67 0.72 1.16 1.21 1.24 1.22 1.20 Mean 2.06 2.75 0.85 3.35 3.36 1.68 4.16 2.83 3.04 3.12 3.11 3.29 Peak
Mean peak and highest peak loads for all three configurations were broadly similar and there appeared to be no significant differences between them. These tests showed no evidence of increased sag reducing deceleration or attachment loading
6.2.2 Effects of treatment of excess material
In many cases, an exact match between void and net are impossible. Gaps are not acceptable, so over sized nets must be used. FASET specify that excess netting should be under-rolled around the border rope. This allows loading to be distributed to the border rope. The alternative method of gathering is less controllable and may result in loading being applied to individual mesh cells.
The effects of techniques used to deal with excess netting material were investigated during tests 15, 19 and 20. Sag of the net centre during these tests is summarised in Table 34. Peak loads from these tests are summarised in Table 35.
Table 34 Percentage sag at net centre with respect to net edge after drop testing for sagging nylon nets No % Sag
Initial 1 2 3 4 5 6 7 8 9 10 11 12 Ce L(f) C(fl) S(l) L(b) C(br) S(r) Ce Ce Ce Ce Ce
15 No excess 6.4% 12.4% 9.6% 6.9% 8.8% 10.9% 8.8% 9.9% - - - - -19 Gathered 10.7% 20.5% 20.8% 17.6% 19.7% 20.0% 19.2% 20.5% 25.3% 25.9% 26.9% 26.9% 26.9% 20 Under roll 10.7% 23.7% 23.2% 17.6% 20.8% 23.5% 20.8% 21.3% 26.4% 27.7% 28.5% 29.3% 29.1%
The initial displacement was between that for equivalent nets over-sized by 10% and 20% respectively. No damage occurred at attachment points on either net, even though inspection revealed that, at several points, the gathered was being loaded at individual mesh cells.
Table 35 Mean peak and highest peak loads on drop testing for sagging nylon nets No Type Mean Peak Load (kN), Highest Peak load (kN)
1 2 3 4 5 6 7 8 9 10 11 12 Ce L(f) C(fl) S(l) L(b) C(br) S (r) Ce Ce Ce Ce Ce
15 No excess 0.95 0.80 0.28 0.69 0.85 0.74 0.86 - - - - - Mean 2.92 3.73 0.86 3.72 4.02 2.82 3.21 - - - - - Peak
19 Gathered 0.66 0.64 0.21 0.25 0.72 0.66 0.53 0.73 0.69 0.72 0.69 0.75 Mean 2.22 3.56 0.81 0.92 3.57 3.03 3.24 2.68 2.70 2.86 2.86 2.86 Peak
20 Under rolled 0.64 0.65 0.17 0.25 0.67 0.67 0.52 0.77 0.80 0.80 0.81 0.83 Mean 2.22 3.41 0.59 0.82 3.25 2.70 2.64 2.66 2.95 2.97 3.04 3.05 Peak
Mean peak and highest peak loads were broadly comparable between the two alternative techniques but lower than those for the basic net with no excess material.
38

6.2.3 Baseline Results for Knotless Polypropylene Type 2
This manufacturer of knotless polypropylene net was not included in Phase 1 and it was necessary to complete baseline tests to allow its inclusion in phase 2. For comparison purposes results from the type of knotless polypropylene net used in phase 1 have also been included here.
The type 2 nets were much “tighter” within the test frame than previous nets, resulting in far less initial sag. A number of cells were “snagged” together giving the appearance of a misaligned mesh. This is illustrated in Figure 14. The snag itself had little strength and they could be freed easily. They are not believed to have had a significant effect on net performance.
Photo no. Fes0702_01_14
Figure 14 example of mesh defect in knotless polypropylene net type 2
The displacement of the net centre during drop testing is quoted in Table 36. Peak loads from these tests are summarised in Table 37.
Table 36 Displacement at centre for both types of knotless polypropylene netting No Type Attach Initial Drop position
Sag Cumulative displacement of net centre (m) 1 2 3 4 5 6 7 8 9 10 11 12
11 1 1.0m 10.1% S(r) L(f) C(fl) S(l) L(b) Ce C(br) S(r) S(r) S(r) S(r) S(r) -0.18 -0.38 -0.40 -0.50 -0.70 -0.88 -0.46 -0.50 -0.50 -0.50 -0.50 -0.50
12 2.0m 8.8% C(br) S(r) L(f) C(fl) S(l) L(b) Ce -0.20 -0.18 -0.82 +0.34 -0.52 -1.00 -0.74
19 2 1.0m 3.1% Ce L(f) C(fl) S(l) L(b) C(br) S(r) Ce Ce Ce Ce Ce -0.56 -0.62 -0.46 -0.58 -0.88 -0.68 -0.74 -1.04 -1.28 -1.24 -1.26 -1.28
20 2.0m 2.4% Ce L(f) C(fl) S(l) L(b) C(br) S(r) Ce Ce Ce Ce Ce -0.40 -0.54 -0.54 -0.58 -0.80 -0.62 -0.66 -1.02 -1.18 -1.22 -1.28 -1.36
Drops were carried out in different orders for the two net types and therefore were not directly comparable. However, in broad terms there does not appear to be a significant performance difference between the two types.
39

Table 37 Mean peak and highest peak loads on drop testing for both types of new polypropylene net No Type Mean Peak Load (kN), Highest Peak load (kN)
1 2 3 4 5 6 7 8 9 10 11 12 Ce L(f) C(fl) S(l) L(b) C(br) S (r) Ce Ce Ce Ce Ce
11 1 1.0m 0.95 0.69 0.20 0.51 0.62 0.66 0.69 - - - - - Mean 3.94 4.65 0.53 3.63 2.97 3.02 3.43 - - - - - Peak 1.24 0.92 0.36 0.66 0.95 0.85 1.00 Mean 12 2.0m 4.84 4.10 1.44 4.17 5.36 3.41 4.25 Peak
21 2 1.0m 0.80 0.89 0.51 0.60 0.89 0.74 0.87 1.05 1.12 1.15 1.14 1.19 Mean 2.11 3.75 1.96 1.09 4.02 1.77 3.76 2.91 3.14 3.33 3.40 3.54 Peak
22 2.0m 1.02 1.08 0.72 0.64 1.18 1.27 0.99 1.48 1.54 1.56 1.58 1.61 Mean 2.66 3.92 2.85 1.40 4.29 3.88 3.72 4.21 4.56 4.84 4.91 4.89 Peak
Loads were comparable between the two net types and did not indicate any significant property differences.
6.2.4 Effects of defects
For this investigation simple single cord defects were introduced at drop and attachment points. FASET indicate that this type of defect can be temporarily repaired on site and would not require disposal of the net or a removal for a more permanent repair.
The displacement of the net centre during drop testing is quoted in Table 38. Peak loads from these tests are summarised in Table 39.
Table 38 Displacement at centre for drops on polypropylene nets with artificial defects No Defects Drop position
Cumulative displacement of net centre (m) 1 2 3 4 5 6 7 8 9 10 11 12
Drop position Ce L(f) C(fl) S(l) L(b) C(br) S(r) Ce Ce Ce Ce Ce 21 None -0.56 -0.62 -0.46 -0.58 -0.88 -0.68 -0.74 -1.04 -1.28 -1.24 -1.26 -1.28 23 At drop -0.50 -0.60 -0.58 -0.56 -0.80 -0.68 -0.68 -0.96 -0.76 24 At attachments -0.37 -0.50 -0.44 -0.54 -0.80 -0.37 -0.67 -1.20 -1.27 -1.32 -1.34 -1.42
On initial drops, the three nets were broadly comparable. However on repeat drops, there were significant differences in behaviour. Net 23 failed prematurely on the third drop at the central defect. Net 24 showed no further damage at the artificial defects, however there was greater displacement, probably because the artificial defects resulted in increased freedom at the closest attachments. Measured loads were comparable between the three nets regardless of the defect type.
Table 39 Mean peak and highest peak loads for drops on polypropylene nets with artificial defects No Type Mean Peak Load (kN),Highest Peak load (kN)
1 2 3 4 5 6 7 8 9 10 11 12 Ce L(f) C(fl) S(l) L(b) C(br) S (r) Ce Ce Ce Ce Ce
21 None 0.80 0.89 0.51 0.60 0.89 0.74 0.87 1.05 1.12 1.15 1.14 1.19 Mean 2.11 3.75 1.96 1.09 4.02 1.77 3.76 2.91 3.14 3.33 3.40 3.54 Peak 0.81 0.87 0.36 0.49 0.97 0.84 0.81 1.04 1.10 Mean 23 At drop 1.93 3.34 0.85 1.04 3.94 2.38 3.32 2.65 3.06 Peak
24 At 0.70 0.68 0.32 0.41 0.86 0.76 0.56 0.86 1.01 1.07 1.08 1.02 Mean attachments 1.98 2.68 0.56 1.12 3.54 3.26 2.37 2.25 3.10 3.42 3.50 3.10 Peak
40

6.2.5 Effects of drop mass profile
The spherical test weight specified in BS EN 1263-1 does not accurately replicate a real environment. Nets 25 and 26 were tested using alternative drop masses. All of the test masses had the same nominal weight of 100 kg, however their profiles were markedly different.
The BS EN 1263-1 sphere is a 100 kg smooth sphere. The benefit of this spherical shape, is the controllability of the test and, therefore, repeatability of results. However, the sphere will effectively spread the loading across its circumference resulting in a relatively gentle impact without localised damage. There was a pronounced tendency for the mass to roll across the net on subsequent bounces.
The 95%-ile anthropomorphic test dummy represented a far more realistic loading. The dummy was positioned with the soles of it’s feet at a height of 2 m above the net, this meant that the dummy’s centre of gravity would have been above 2m. The dummy entered the net feet first, with initial loading on the relatively small area of the heels, the dummy then tended to move in a semi-random manner, loading different parts of the net and potentially becoming tangled in the mesh. The body of the dummy was manufactured from polyurethane foam covered with a vinyl skin and its mass is fairly evenly distributed throughout its body, still representing a relatively gentle loading.
During an incident at Old Trafford in 2000, a worker entered a net with a quantity of material (gutter sections), subsequently penetrating the net. Visual examination discovered a mixture of failure modes in the net mesh, including secondary damage at the net attachments. The 100 kg test cylinder (based on the BS EN 364 test mass for lanyards (reference 13)) provided a test simulation more typical of this type of incident, representing a more severe loading case, with a more concentrated load than in either of the other drop masses. The 90o angle between the sides and bottom of the cylinder represented a potential cause of localised damage, but is not unrealistic in terms of the material that could enter a net in a construction environment. During these tests, this edge was protected with a 25 mm thick plywood disk in an attempt to limit the severity of the tests.
The displacement of the net centre during drop testing is quoted in Table 40. Peak loads from these tests are summarised in Table 41.
Table 40 Displacement at centre for drops of various types of test mass on polypropylene nets No Defects Drop position
Cumulative displacement of net centre (m) 1 2 3 4 5 6 7 8 9 10 11 12
Drop position Ce L(f) C(fl) S(l) L(b) C(br) S(r) Ce Ce Ce Ce Ce 21 BS EN 1263-1 Sphere -0.56 -0.62 -0.46 -0.58 -0.88 -0.68 -0.74 -1.04 -1.28 -1.24 -1.26 -1.28 25 95%-ile dummy -0.31 -0.40 -0.40 -0.44 -0.62 -0.56 -0.62 -0.76 -0.99 -1.20 -1.20 -1.36 26 100 kg cylinder -0.18 -0.06 -0.24 -0.32 -0.33 -0.34 -0.39
The sphere and dummy were retained by the net on every drop, however the cylinder penetrated the net on every drop. The displacement of the centre of the net was slightly lower for the dummy than the sphere, however the cylinder resulted in a far lower displacement probably as a result of never coming to rest within the net.
41

26
Table 41 Mean peak and highest peak loads for drops of various types of test mass on polypropylene nets No Type Mean Peak Load (kN),Highest Peak load (kN
1 2 3 4 5 6 7 8 9 10 11 12 Ce L(f) C(fl) S(l) L(b) C(br) S (r) Ce Ce Ce Ce Ce
21 None 0.80 0.89 0.51 0.60 0.89 0.74 0.87 1.05 1.12 1.15 1.14 1.19 Mean 2.11 3.75 1.96 1.09 4.02 1.77 3.76 2.91 3.14 3.33 3.40 3.54 Peak
25 At drop 1.02 1.08 0.72 0.64 1.18 1.27 0.99 1.48 1.54 1.56 1.58 1.61 Mean 2.66 3.92 2.85 1.40 4.29 3.88 3.72 4.21 4.56 4.84 4.91 4.89 Peak
At 0.61 0.57 0.32 0.42 0.68 0.60 0.54 Mean attachments 1.54 2.26 0.86 0.94 2.38 2.25 2.02 Peak
Highest peak and mean peak loads for the 95%-ile dummy drops were substantially higher than for the BS EN 1263-1 sphere, probably because of the initial loading through the heels of the dummy and the higher centre of gravity of the dummy before release. In contrast, the highest peak and mean peak loads were much lower for the cylinder than for either of the other drop masses. Damage resulting from these tests was examined and compared with tensile failures from phase 3. This comparison is illustrated in Figure 15. Failure appeared to occur primarily at cell corners (although some cords failed mid span). Failed ends had a severely frayed and “fluffy” appearance with some evidence of localised melting either at the break or in close proximity. At some locations, frayed ends appeared to be aligned, suggesting failure across an edge.
Photo no. Fes0702_01_31 Photo no. Fes0702_01_35 15a failed end from a static mesh tensile test 15b failed end from a dynamic cylinder drop
Figure 15 Comparison of failed ends from static and dynamic testing
The tensile test failure samples were generally similar, with failure usually occurring at cell corners and evidence of frayed ends and some localized melting. However, this fraying was less severe and there was no evidence of any failure across an edge.
This suggests that the sharp edges of the cylinder may have had a localised abrasion or blunt “cutting” effect on the net cords causing premature failure at lower loads. A similar effect was recorded during the investigation into the Old Trafford incident.
42
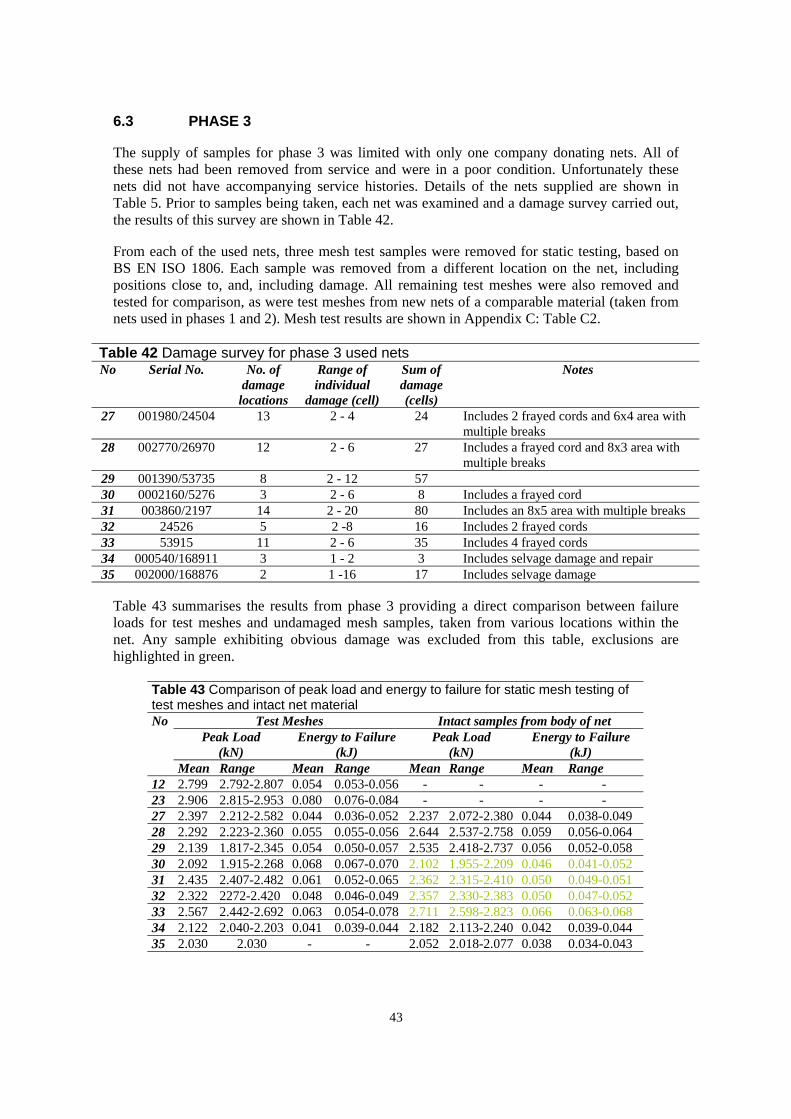
6.3 PHASE 3
The supply of samples for phase 3 was limited with only one company donating nets. All of these nets had been removed from service and were in a poor condition. Unfortunately these nets did not have accompanying service histories. Details of the nets supplied are shown in Table 5. Prior to samples being taken, each net was examined and a damage survey carried out, the results of this survey are shown in Table 42.
From each of the used nets, three mesh test samples were removed for static testing, based on BS EN ISO 1806. Each sample was removed from a different location on the net, including positions close to, and, including damage. All remaining test meshes were also removed and tested for comparison, as were test meshes from new nets of a comparable material (taken from nets used in phases 1 and 2). Mesh test results are shown in Appendix C: Table C2.
Table 42 Damage survey for phase 3 used nets No Serial No. No. of Range of Sum of Notes
damage individual damage locations damage (cell) (cells)
27 001980/24504 13 2 - 4 24 Includes 2 frayed cords and 6x4 area with multiple breaks
28 002770/26970 12 2 - 6 27 Includes a frayed cord and 8x3 area with multiple breaks
29 001390/53735 8 2 - 12 57 30 0002160/5276 3 2 - 6 8 Includes a frayed cord 31 003860/2197 14 2 - 20 80 Includes an 8x5 area with multiple breaks 32 24526 5 2 -8 16 Includes 2 frayed cords 33 53915 11 2 - 6 35 Includes 4 frayed cords 34 000540/168911 3 1 - 2 3 Includes selvage damage and repair 35 002000/168876 2 1 -16 17 Includes selvage damage
Table 43 summarises the results from phase 3 providing a direct comparison between failure loads for test meshes and undamaged mesh samples, taken from various locations within the net. Any sample exhibiting obvious damage was excluded from this table, exclusions are highlighted in green.
Table 43 Comparison of peak load and energy to failure for static mesh testing of test meshes and intact net material No Test Meshes Intact samples from body of net
Peak Load Energy to Failure Peak Load Energy to Failure (kN) (kJ) (kN) (kJ)
Mean Range Mean Range Mean Range Mean Range 12 2.799 2.792-2.807 0.054 0.053-0.056 - - - -23 2.906 2.815-2.953 0.080 0.076-0.084 - - - -27 2.397 2.212-2.582 0.044 0.036-0.052 2.237 2.072-2.380 0.044 0.038-0.049 28 2.292 2.223-2.360 0.055 0.055-0.056 2.644 2.537-2.758 0.059 0.056-0.064 29 2.139 1.817-2.345 0.054 0.050-0.057 2.535 2.418-2.737 0.056 0.052-0.058 30 2.092 1.915-2.268 0.068 0.067-0.070 2.102 1.955-2.209 0.046 0.041-0.052 31 2.435 2.407-2.482 0.061 0.052-0.065 2.362 2.315-2.410 0.050 0.049-0.051 32 2.322 2272-2.420 0.048 0.046-0.049 2.357 2.330-2.383 0.050 0.047-0.052 33 2.567 2.442-2.692 0.063 0.054-0.078 2.711 2.598-2.823 0.066 0.063-0.068 34 2.122 2.040-2.203 0.041 0.039-0.044 2.182 2.113-2.240 0.042 0.039-0.044 35 2.030 2.030 - - 2.052 2.018-2.077 0.038 0.034-0.043
43

Table 44 summarises the results from phase 3 providing a direct comparison between failure loads for undamaged and damaged mesh samples. The four damaged samples tested were not severely damaged but each showed evidence of light fraying on one cord.
Table 44 Comparison of peak load and energy to failure for static mesh testing of intact and damaged net material No Intact samples Damaged samples
Peak Load Displacement Energy to Failure Peak Displ Energy (kN) (mm) (kJ) Load (mm) to Fail
Mean Range Mean Range Mean Range (kN) (kJ) 30 2.102 1.955-2.209 0.057 0.054-0.060 0.046 0.041-0.052 1.332 0.056 0.032 31 2.362 2.315-2.410 0.064 0.062-0.065 0.050 0.049-0.051 1.748 0.052 0.034 32 2.357 2.330-2.383 0.054 0.053-0.056 0.050 0.047-0.052 1.650 0.042 0.039 33 2.711 2.598-2.823 0.060 0.059-0.062 0.066 0.063-0.068 1.673 0.043 0.035
The two new nets were chosen because of their potential correspondence with the used nets tested (Net 12 was of the same type and manufacturer as nets 34 and 35, while net 23 was of the same type and manufacturer as nets 27 to 33). These nets gave significantly higher loads and energies to failure than their used counterparts. These differences provide confirmation of the ageing effects on net material. However it should be noted that the intact net material from used nets in poor condition still retained between 67% and 97% of their estimated original strength (damaged material retained between 46% and 60% of estimated original strength).
There was a close correlation between the failure loads and energies for both test meshes and parent material and, in many cases, the parent net material gave higher loads to failure than the test meshes. In five cases, mesh samples were directly adjacent to net damage. In each of these cases, test results were fully comparable with other undamaged mesh samples and test meshes. This indicates that the test meshes provide an accurate prediction of the strength of the net itself.
As expected, where there was obvious damage on a test sample, the test results were significantly lower than their intact counterparts. Routine testing of the test meshes would fail to predict this type of localised deterioration, however, it should be identified by visual examination of the net, after removal from the installation.
44
7 DISCUSSION
Safety nets are a fall arrest system intended to protect one or two workers from major injury in a fall from height. Industry guidance (reference 7), states that after use a safety net should be removed from service and scrapped. The safety nets used during these tests, generally withstood multiple drops of the test sphere. Penetration occurred only in certain specific circumstances (such as repeat drops on an artificial defect, dropping on a scrapped net or resulting from ancillary damage caused by lifting gear) and this work did not identify any serious concerns regarding the safety of suspended nets under expected UK operating conditions (ie drops from 2 m or less).
Results from these tests identified a general trend for increased displacement and attachment loading on repeated drops into the safety net (associated with a reduction in recovery upon removal of the drop mass). This is indicative of a cumulative reduction in elasticity. Changes in the recovery of the net were most apparent on the knotted polypropylene nets, possibly as a result of tightening or permanent set in the knots. However, safety nets are intended as a single use safety system and would never be expected to receive multiple impacts in service. FASET guidance (reference 7) is that nets which have experienced a dynamic load should be replaced.
Four types of net were tested, choice of net being based upon availability in the UK. The intention of this work was not to determine whether one net manufacturer was “better” than others but to identify any differences in the way alternative material or net types, behaved under load. In practice this became a comparison between used and unused, polypropylene and nylon and knotted and knotless nets.
While some small differences were apparent such as the tendency for used nets to suffer more damage and less recovery after load removal in knotted polypropylene nets. This work, generally did not find any evidence of clear coherent trends in performance variations between the different net types.
The load at the attachment point of a net depends primarily on the frequency of these attachments. The larger the spacing between attachments, then the higher the load experienced at the attachment point and the greater the displacement of the net under load. This is illustrated in Figure 16.
The highest attachment load occurring during a first drop was 4.84 kN (knotless polypropylene with 2 m attachment spacing). This was below the 6 kN characteristic load specified by BS EN 1263-1. The highest attachment load recorded was 5.72 kN (knotted polypropylene with 2 m attachments), representing over 95% of this load. However, it should be noted that this occurred at a single loadcell, on the final drop of a group of twelve. All other loadcells measured loads that were below 4 kN.
In service, larger attachment spacings of up to 2.5 m are allowable and this could potentially result in higher loading, although evidence, from these tests, suggests that this would be unlikely to exceed the 6 kN limit on an initial drop. However, these figures are based on drops from a height of 2 m, the limit used in the UK (reference 2, 6, 7, 8). The European standard allows drops from up to 6 m above the net, and the use of nets outside their working limits may be considered as foreseeable misuse.
45

Peak Load (kN)
6
5
4
3
2
1
0
Used Knotted Knotless Knotted
0.0 0.5 1.0 1.5 2.0 2.5 Attachment Spacing (m)
Figure 16 Variation in peak load with attachment spacing (First drop on each net only)
Drops at centres of edges tended to result in higher peak loads, while drops at the corner resulted in lower peak loads. The highest peak load was generally recorded at the attachment point closest to the drop. There was clear evidence that loads were transmitted along linear axes from the point of drop, which is likely to be an effect of the square mesh configuration. This could explain the lower loads at corners (although loadcell concentration may also have contributed). A diamond mesh configuration would have been likely to result in higher loads at corners.
FASET recommend a nominal 10% sag in a suspended net. This represents an optimum compromise: Reducing sag induces higher attachment loadings. Increasing sag would increase fall distances and require increased clearances beneath the net. However, sag was difficult to control based on nominal net dimensions as there was a high degree of variability between manufacturers and the estimated sag was not necessarily evident in the suspended safety net before loading occurred. Deliberately introducing extra sag into the net increased the displacement of the net under load, but didn’t appear to have a significant effect on the resulting loads. Static displacement increased up to 2.36 m or (31.2% sag), dynamic displacement would have been far higher. This may have implications on the extent of clear space left under a net, FASET recommend that the clear space is at least 50% of the narrowest dimension (approximately 3.75 m during these tests).
Where damage to the net occurred, it tended to occur at attachment points rather than at drop points. As attachment spacing increased, the occurrence of attachment damage also increased, this is illustrated in Table 45. The attachment system used here (with its steel strops and maillon rapides) represented a less compliant loading case than if the net had been tied on, as commonly
46
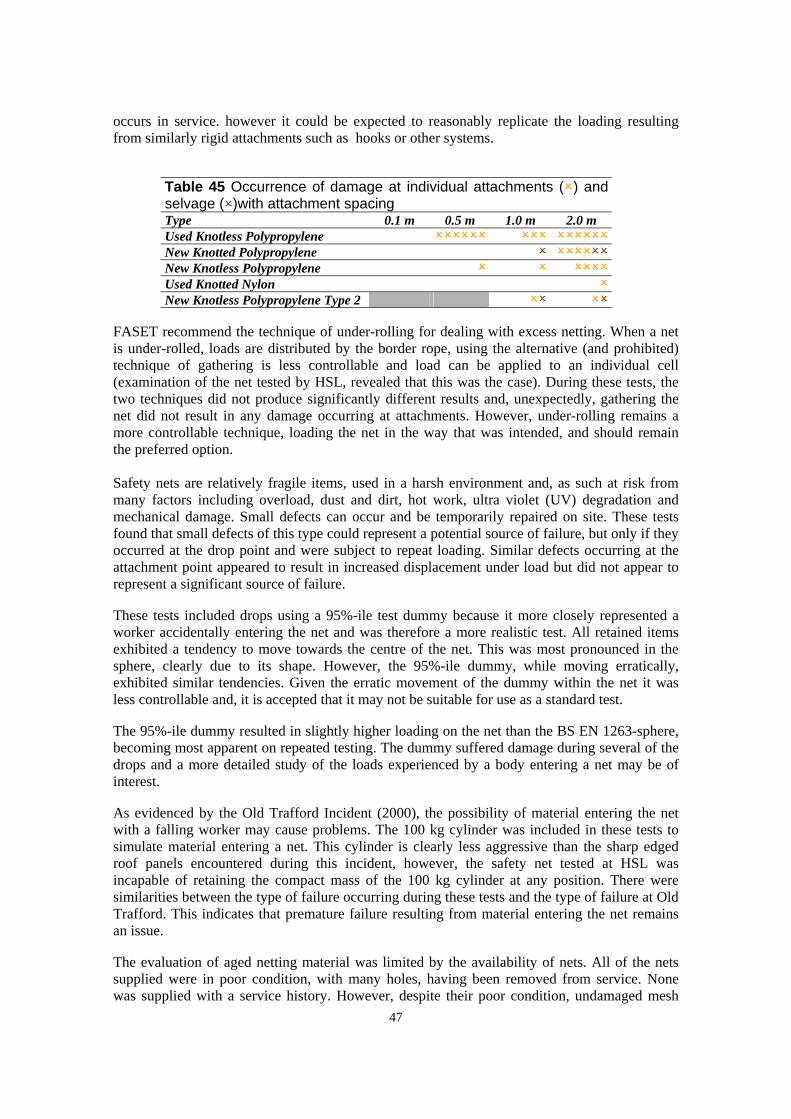
occurs in service. however it could be expected to reasonably replicate the loading resulting from similarly rigid attachments such as hooks or other systems.
Table 45 Occurrence of damage at individual attachments (2) and selvage (2)with attachment spacing Type 0.1 m 0.5 m 1.0 m 2.0 m Used Knotless Polypropylene 222222 222 222222 New Knotted Polypropylene 2 222222 New Knotless Polypropylene 2 2 2222 Used Knotted Nylon 2 New Knotless Polypropylene Type 2 22 22
FASET recommend the technique of under-rolling for dealing with excess netting. When a net is under-rolled, loads are distributed by the border rope, using the alternative (and prohibited) technique of gathering is less controllable and load can be applied to an individual cell (examination of the net tested by HSL, revealed that this was the case). During these tests, the two techniques did not produce significantly different results and, unexpectedly, gathering the net did not result in any damage occurring at attachments. However, under-rolling remains a more controllable technique, loading the net in the way that was intended, and should remain the preferred option.
Safety nets are relatively fragile items, used in a harsh environment and, as such at risk from many factors including overload, dust and dirt, hot work, ultra violet (UV) degradation and mechanical damage. Small defects can occur and be temporarily repaired on site. These tests found that small defects of this type could represent a potential source of failure, but only if they occurred at the drop point and were subject to repeat loading. Similar defects occurring at the attachment point appeared to result in increased displacement under load but did not appear to represent a significant source of failure.
These tests included drops using a 95%-ile test dummy because it more closely represented a worker accidentally entering the net and was therefore a more realistic test. All retained items exhibited a tendency to move towards the centre of the net. This was most pronounced in the sphere, clearly due to its shape. However, the 95%-ile dummy, while moving erratically, exhibited similar tendencies. Given the erratic movement of the dummy within the net it was less controllable and, it is accepted that it may not be suitable for use as a standard test.
The 95%-ile dummy resulted in slightly higher loading on the net than the BS EN 1263-sphere, becoming most apparent on repeated testing. The dummy suffered damage during several of the drops and a more detailed study of the loads experienced by a body entering a net may be of interest.
As evidenced by the Old Trafford Incident (2000), the possibility of material entering the net with a falling worker may cause problems. The 100 kg cylinder was included in these tests to simulate material entering a net. This cylinder is clearly less aggressive than the sharp edged roof panels encountered during this incident, however, the safety net tested at HSL was incapable of retaining the compact mass of the 100 kg cylinder at any position. There were similarities between the type of failure occurring during these tests and the type of failure at Old Trafford. This indicates that premature failure resulting from material entering the net remains an issue.
The evaluation of aged netting material was limited by the availability of nets. All of the nets supplied were in poor condition, with many holes, having been removed from service. None was supplied with a service history. However, despite their poor condition, undamaged mesh
47

samples retained between 67% and 97% of their estimated original strength. The mesh retained its properties even in close proximity to areas of damage and significant deterioration in performance, only occurred when there was obvious damage to the net sample.
There was consistent agreement between results for test meshes and material samples from within the net. This indicates that test meshes may provide a realistic predictor of overall net performance. Test meshes would not pick up reductions in strength due to localised damage, however this should be identified when the net is inspected after each installation.
48
8 CONCLUSIONS
8.1 The safety nets used, generally withstood multiple tests, with penetration occurring only in unusual circumstances. No serious safety concerns were identified.
8.2 The larger the attachment spacing, the higher the load at the attachment point and the greater the displacement of the net under load.
8.3 The highest peak loads are generally recorded adjacent to the drop point.
8.4 Peak loads are generally higher for drops at centres of edges and lower for drops at corners.
8.5 Load is transmitted along linear axes from the point of drop, which is likely to be an effect of the square mesh configuration.
8.6 Where damage to the net occurred, it was more likely to occur at attachment points than at drop points.
8.7 There were no significant trends in performance differences between any of net types.
8.8 The highest load on a first drop was 4.84 kN, well below the 6 kN characteristic limit.
8.9 There was a cumulative reduction in elasticity on repeated drops into a safety net. FASET guidance is that nets which have experienced a dynamic load should be replaced.
8.10 The calculated sag was not necessarily evident in the suspended safety net. Inducing extra sag into the net, increased the displacement of the net under load but didn’t have a significant effect on loading.
8.11 The FASET recommended technique of under-rolling excess netting did not produce significantly different results to the alternative technique of gathering. However, under-rolling is a more controllable and should remain the preferred option.
8.12 Small defects at the drop point represented a potential source of failure on repeat dropping. However, small defects at the attachment point increased displacement under load but did not represent a source of failure.
8.13 All retained items tended to move towards the centre of the net. The 95%-ile test dummy moved more erratically than the sphere.
8.14 The test dummy induced higher loading on the net than the BS EN 1263-1 sphere. While this may be a more realistic test, the dummy’s erratic movement makes it less controllable.
8.15 The safety nets were incapable of retaining the compact mass of the 100 kg cylinder. The possibility of aggressive material (such as heavy and compact or sharp edged objects) entering the net with a falling worker remains a concern.
49

8.16 Despite the poor condition of the nets tested in phase 3, intact mesh samples retained between 67% and 97% of their estimated original strength.
8.17 The mesh retained its properties even in close proximity to areas of damage. Significant deterioration in performance, only occurred when there was obvious damage to the net sample.
8.18 There was consistent agreement between test meshes results and net samples from within the net indicating that test meshes provide a realistic predictor of net performance.
50

9 RECOMMENDATIONS FOR FURTHER WORK
This programme was specified to include a wide range of variables, but not to cover any single variable in great depth. This work has identified several areas where further consideration and more detailed investigation would be likely to yield interesting and useful information.
9.1 An investigation into the loads experienced by a falling body on entering a safety net, using an instrumented equivalent of the test dummy used during this work. There is little available information on workers falling into nets safely and during these tests, the dropped test dummy moved erratically within the net, suffering considerable damage. This suggests that workers entering a net from height may be at risk of injury.
9.1 A comparison with the loads on a net resulting from a body falling into the net from heights greater than the current UK working limit of 2 m. BS EN 1263-2 allows work at up to 6 m above the net. Working height limits may be difficult to achieve on a steeply pitched roof and working at heights over 2 m may be considered to be foreseeable misuse.
9.2 This programme was limited by a lack of available material samples from service nets. This could be resolved by artificially introducing damage into small scale material samples using similar techniques to those used, by HSL, during the investigation of lanyard materials (reference 16). Key areas of concern would be the likely effects of “hot work” in the vicinity of a net and the effects of abrasion by grit and other particles.
9.3 This work identified a problem with retention of “aggressively shaped” items such as the 100 kg cylinder. Further investigation into the behaviour of “real” construction materials entering nets could be useful.
51
10 REFERENCES
1 Statutory instruments 735: The Work at Heights Regulations 2005
2 Height-safe HSE Books 2003
3 BS EN 1263 - Safety Net - Part 1: Safety requirements, test methods BSI 2002 ISBN 0 580 39696
4 BS EN 1263 - Safety Nets - Part 2: Safety requirements for the positioning limits BSI 2002 ISBN 0 580 40311 4
5 10BS EN ISO 1806 Fishing nets – Determination of mesh breaking strength of netting BSI 2002 ISBN 0 580 48889 6
6 Working on roofs INDG 284 HSE Books 1999
7 Safety Net Inspector Course FASET 2004
8 Technical bulletin no.3 - Number of workers above a net FASET 2006
9 Technical bulletin No. 2 - Maximum gaps FASET 2006
10 Technical bulletin no. 9 - Under-rolling to size safety nets FASET 2006
11 Technical bulletin no. 5 - Temporary edge protection used as a support for safety netting FASET 2006
12 Technical bulletin no. 6 - Drilled fixings into masonry used as support for safety netting FASET 2006
13 BS EN 364 Personal protective equipment against falls from a height – Test methods BSI 1992 ISBN 0 580 21305 6
14 McCann P. JS1300717 Old Trafford Netting Tests HSE letter report 2001
15 McCann P. JS1300717 Old Trafford Netting Damage Survey HSL letter report 2001
16 Parkin R. and Robinson Assessment of the factors that influence the tensile strength of safety harness and lanyard webbings HSL 2002/16 2002
52

11 APPENDIX A – PHASE 1 - LOAD ANALYSIS
Table A1 (reprinted from Table 2 in the main report) gives details of the nets tested during phase 1 of this work. Table A2 gives details of the individual loadcell positions.
Table A1 Details of phase 1 net tests No. Date tested Net description Serial No. Date of Attachment Order
by HSL (key word) Manufacture Spacing 1 06/07/2005 Used Knotless Polypropylene 0188622 03/07/2002 Every 0.1 m 1 2 15/07/2005 Used Knotless Polypropylene 0177923 04/02/2002 Every 0.5 m 4 3 13/07/2005 Used Knotless Polypropylene 0182604 06/06/2002 Every 1 m 3 4 13/07/2005 Used Knotless Polypropylene 0177919 04/02/2002 Every 2 m 2 5 25/07/2005 New Knotted Polypropylene 0226359 13/10/2004 Every 0.1 m 5 6 27/07/2005 New Knotted Polypropylene 0226358 13/10/2004 Every 0.5 m 6 7 09/08/2005 New Knotted Polypropylene 0226360 13/10/2004 Every 1 m 11 8 11/08/2005 New Knotted Polypropylene 02616462 21/052004 Every 2 m 12 9 08/08/2005 New Knotless Polypropylene 0226392 11/10/2004 Every 0.1 m 9
10 09/08/2005 New Knotless Polypropylene 0226393 11/10/2004 Every 0.5 m 10 11 29/07/2005 New Knotless Polypropylene 0226394 11/10/2004 Every 1 m 7 12 03/08/2005 New Knotless Polypropylene 0226395 11/10/2004 Every 2 m 8 13 06/09/2005 New Knotted Nylon B05001835 07/2005 Every 0.1 m 13 14 02/11/2005 New Knotted Nylon B05001836 07/2005 Every 0.5 m 15 15 19/10/2005 New Knotted Nylon B05001837 07/2005 Every 1 m 14 16 07/11/2005 New Knotted Nylon B05001838 07/2005 Every 2 m 16
Table A2 Positions of load cells Load Position Serial Cell No.
A0 Rear Long edge right corner 23225 A2 Rear Long edge 2m from corner 23227 A4 Rear Long edge 4m from corner 23260 A6 Rear Long edge 6m from corner 23263 A8 Rear Long edge centre 23265
A16 Rear Long edge left corner 23280 A20 Left Short edge centre 23269 A24 Left Short edge front corner 23272 B0 Right Short edge rear corner 23273 B2 Right Short edge 2m from corner 23275 B4 Right Short edge centre 23276 B8 Front Long edge right corner -
B16 Front Long edge centre 23274 B24 Front Long edge left corner 23279
Peak loads for each net are compiled in tables A3 to A18. Each table contains the peak loads recorded by each loadcell during all of the drops on a single net. In these tables, the maximum load measured by any loadcell during a drop is highlighted in red, while the second highest load is highlighted in blue. The relationship between the peak load and the mean load for all loadcells is quoted as a ratio.
53

Table A3 Peak loads recorded by each loadcell during drop testing of net 1, used knotless polypropylene secured at 0.1 m attachments Drop 1 2 3 4 5 6 7 Posn Ce L(f) C(fl) S(l) L(b) C(br) S(r)
File 060705_1 060705_2 060705_3 060705_4 060705_5 060705_6 060705_7
A0 0.0799 0.1267 0.0774 0.0697 0.0595 0.1114 0.0570 A2 0.0300 0.0743 0.0397 0.0473 0.0178 0.8152 0.4224 A4 0.0768 0.0519 0.1068 0.1017 0.1119 0.1516 0.1368 A6 0.0779 0.1502 0.0626 0.0651 0.1051 0.1200 0.0928 A8 0.7716 0.6223 0.0423 0.0525 1.1869 0.0474 0.0622
A16 0.0793 0.1291 0.1936 0.2038 0.1464 0.1021 0.1641 A20 0.1644 0.0346 0.0794 0.7302 0.0697 0.0896 0.1888 A24 0.7877 0.1466 0.0550 0.1247 0.1959 0.1542 0.5516 B0 0.0523 0.0421 0.0370 0.0350 0.0320 0.0446 0.0441 B2 0.0847 0.0270 0.0449 0.1046 0.1449 0.2292 0.0674 B4 0.1187 0.0918 0.0670 0.2227 0.0918 0.1238 1.1514
B16 0.8560 1.0803 0.1096 0.0398 0.6673 0.0520 0.0148 B24 0.0422 0.0768 0.1139 0.0717 0.0397 0.0626 0.0921
Mean 0.2478 0.20413 0.0791 0.1438 0.2207 0.1618 0.2342 Ratio 3.4 5.3 1.4 5.1 4.5 5.0 4.9
Table A4 Peak loads recorded by each loadcell during drop testing of net 2, used knotless polypropylene secured at 0.5 m attachments Drop 1 5 6 7 2 3 4 8 9 Posn Ce L(f) C(fl) S(l) L(b) C(br) S(r) C(br) C(br)
File 150705_1 150705_2 150705_3 150705_4 150705_5 150705_6 150705_7 150705_8 150705_9 A0 0.0870 0.1069 0.0794 0.1114 0.0967 0.1216 0.1069 0.1216 0.1293 A2 0.1069 0.0570 0.0422 0.0122 0.0916 2.1245 0.6854 1.6675 1.6049 A4 0.1139 0.0870 0.0722 0.0794 0.0748 0.3057 0.8989 1.0204 0.5514 A6 0.5030 0.4436 0.0574 0.2328 0.4179 0.1354 0.2431 0.1851 0.1902 A8 1.7868 1.4132 0.1519 0.0770 2.7968 0.2242 0.0821 0.2609 0.1743
A16 0.0722 0.0640 0.1093 0.1240 0.0818 0.1016 0.1093 0.1042 0.1291 A20 0.5989 0.2957 0.4646 2.4975 0.4051 0.1766 0.6386 0.0916 0.1165 A24 0.1959 0.2387 0.0921 0.1318 0.1415 0.0697 0.1369 0.0743 0.1466 B0 0.1213 0.1040 0.0568 0.1289 0.1410 0.1461 0.1334 0.1416 0.1410 B2 0.3338 0.2465 0.1245 0.4711 0.4588 0.6502 0.2491 1.6873 0.9993 B4 0.5326 0.1385 0.0994 0.4063 0.3814 0.4185 3.0119 0.1760 0.3348 B16 1.6752 2.7882 0.1616 0.0270 1.1822 0.0495 0.0372 0.1050 0.0520 B24 0.0946 0.0870 0.1938 0.1663 0.0799 0.0793 0.0870 0.0575 0.0743
Mean 0.4786 0.4669 0.1311 0.3435 0.4884 0.3541 0.4938 0.4379 0.3572 Ratio 3.7 6.0 3.5 7.3 5.7 6.0 6.1 3.8 4.6
54
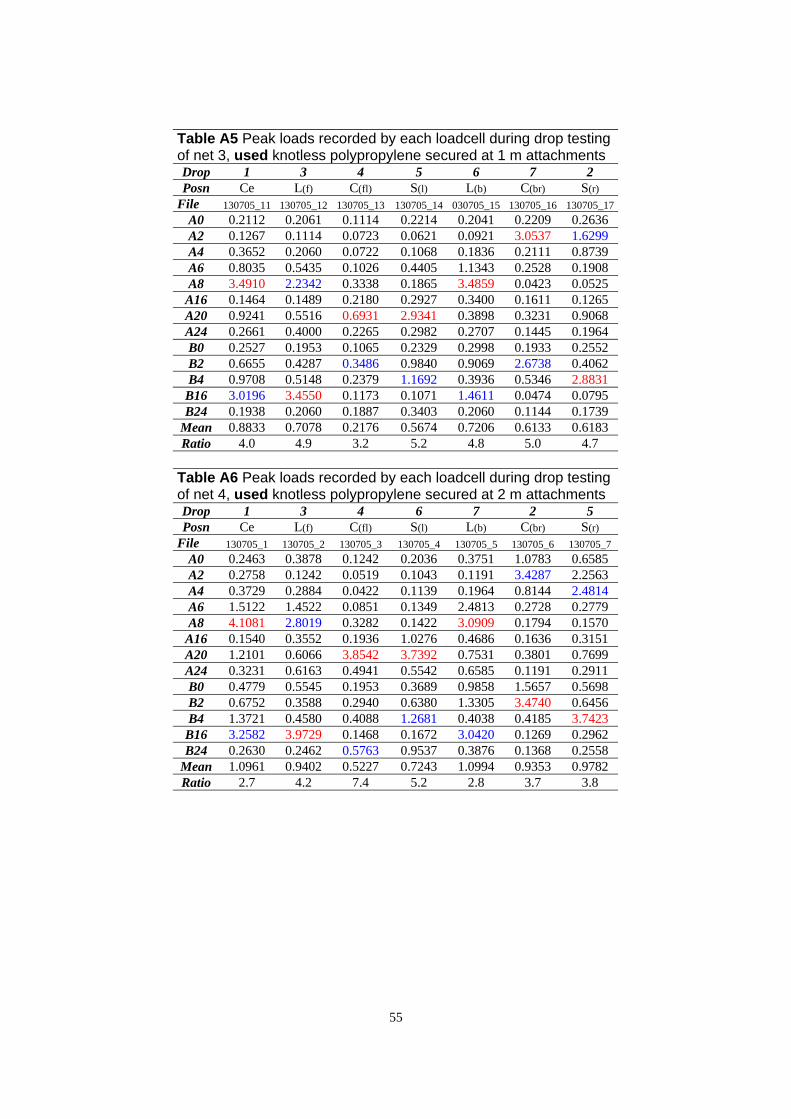
Table A5 Peak loads recorded by each loadcell during drop testing of net 3, used knotless polypropylene secured at 1 m attachments Drop 1 3 4 5 6 7 2 Posn Ce L(f) C(fl) S(l) L(b) C(br) S(r)
File 130705_11 130705_12 130705_13 130705_14 030705_15 130705_16 130705_17 A0 0.2112 0.2061 0.1114 0.2214 0.2041 0.2209 0.2636 A2 0.1267 0.1114 0.0723 0.0621 0.0921 3.0537 1.6299 A4 0.3652 0.2060 0.0722 0.1068 0.1836 0.2111 0.8739 A6 0.8035 0.5435 0.1026 0.4405 1.1343 0.2528 0.1908 A8 3.4910 2.2342 0.3338 0.1865 3.4859 0.0423 0.0525
A16 0.1464 0.1489 0.2180 0.2927 0.3400 0.1611 0.1265 A20 0.9241 0.5516 0.6931 2.9341 0.3898 0.3231 0.9068 A24 0.2661 0.4000 0.2265 0.2982 0.2707 0.1445 0.1964 B0 0.2527 0.1953 0.1065 0.2329 0.2998 0.1933 0.2552 B2 0.6655 0.4287 0.3486 0.9840 0.9069 2.6738 0.4062 B4 0.9708 0.5148 0.2379 1.1692 0.3936 0.5346 2.8831
B16 3.0196 3.4550 0.1173 0.1071 1.4611 0.0474 0.0795 B24 0.1938 0.2060 0.1887 0.3403 0.2060 0.1144 0.1739
Mean 0.8833 0.7078 0.2176 0.5674 0.7206 0.6133 0.6183 Ratio 4.0 4.9 3.2 5.2 4.8 5.0 4.7
Table A6 Peak loads recorded by each loadcell during drop testing of net 4, used knotless polypropylene secured at 2 m attachments Drop 1 3 4 6 7 2 5 Posn Ce L(f) C(fl) S(l) L(b) C(br) S(r)
File 130705_1 130705_2 130705_3 130705_4 130705_5 130705_6 130705_7 A0 0.2463 0.3878 0.1242 0.2036 0.3751 1.0783 0.6585 A2 0.2758 0.1242 0.0519 0.1043 0.1191 3.4287 2.2563 A4 0.3729 0.2884 0.0422 0.1139 0.1964 0.8144 2.4814 A6 1.5122 1.4522 0.0851 0.1349 2.4813 0.2728 0.2779 A8 4.1081 2.8019 0.3282 0.1422 3.0909 0.1794 0.1570
A16 0.1540 0.3552 0.1936 1.0276 0.4686 0.1636 0.3151 A20 1.2101 0.6066 3.8542 3.7392 0.7531 0.3801 0.7699 A24 0.3231 0.6163 0.4941 0.5542 0.6585 0.1191 0.2911 B0 0.4779 0.5545 0.1953 0.3689 0.9858 1.5657 0.5698 B2 0.6752 0.3588 0.2940 0.6380 1.3305 3.4740 0.6456 B4 1.3721 0.4580 0.4088 1.2681 0.4038 0.4185 3.7423
B16 3.2582 3.9729 0.1468 0.1672 3.0420 0.1269 0.2962 B24 0.2630 0.2462 0.5763 0.9537 0.3876 0.1368 0.2558
Mean 1.0961 0.9402 0.5227 0.7243 1.0994 0.9353 0.9782 Ratio 2.7 4.2 7.4 5.2 2.8 3.7 3.8
55

Table A7 Peak loads recorded by each loadcell during drop testing of net 5, new knotted polypropylene secured at 0.1 m attachments Drop 1 2 3 4 5 6 7 8 9 10 11 12 Posn Ce L(f) C(fl) S(l) L(b) C(br) S(r) Ce Ce Ce Ce Ce File 250705_1 250705_2 250705_3 250705_4 250705_5 250705_6 250705_7 250705_8 250705_9 250705_10 250705_11 250705_12
A0 0.0794 0.0494 0.1216 0.0646 0.0397 0.0448 0.0595 0.0794 0.0697 0.0967 0.0646 0.0865 A2 0.0743 0.0748 0.0321 0.0178 0.0448 0.3979 0.3654 0.0397 0.0575 0.1221 0.0870 0.2707 A4 0.0524 0.0967 0.0794 0.0768 0.0865 0.1587 0.2487 0.0895 0.0844 0.0743 0.1465 0.0870 A6 0.1200 0.1528 0.0472 0.0779 0.1502 0.0579 0.0426 0.4328 0.2482 0.2856 0.3533 0.2907 A8 0.4627 0.4877 0.0347 0.0423 0.6294 0.0448 0.0423 0.7018 0.7293 0.7889 0.9209 0.8236
A16 0.0920 0.0473 0.0447 0.0346 0.0447 0.0569 0.0798 0.1042 0.1016 0.0600 0.0991 0.0717 A20 0.1440 0.1466 0.1420 0.0992 0.1516 Fault 0.1593 0.1466 0.2137 0.3033 0.3282 0.3277 A24 0.0672 0.0595 0.0799 0.0672 0.0397 0.0326 0.0672 0.0473 0.0819 0.0570 0.0718 0.0916 B0 0.0548 0.0497 0.0573 0.0497 0.0523 0.0396 0.0294 0.0619 0.0568 0.0594 0.0568 0.1162 B2 0.0597 0.0449 0.0352 0.1118 0.1296 0.1546 0.0694 0.0995 0.2292 0.1521 0.1347 0.1572 B4 0.1309 0.1217 0.0771 0.1882 0.0943 0.0522 1.0403 0.2800 0.2303 0.2206 0.2054 0.2698
B16 0.3737 0.4257 0.0173 0.0474 0.2814 0.0423 0.0500 0.3110 0.6893 0.7071 0.6724 0.6449 B24 0.0748 0.0498 0.0448 0.1017 0.0371 0.0646 0.0966 0.0692 0.0575 0.0549 0.0819 0.0692
Mean 0.1374 0.1390 0.0626 0.0753 0.1370 0.0956 0.1808 0.1894 0.2192 0.2294 0.2479 0.2554 Ratio 3.4 3.5 2.3 2.5 4.6 4.2 5.7 3.7 3.3 3.4 3.7 3.2
Table A8 Peak loads recorded by each loadcell during drop testing of net 6, new knotted polypropylene secured at 0.5 m attachments Drop 7 1 2 3 4 5 6 8 9 10 11 12 Posn Ce L(f) C(fl) S(l) L(b) C(br) S(r) L(f) L(f) L(f) L(f) L(f) File 270705_1 270705_2 270705_3 270705_4 270705_5 270705_6 270705_7 270705_8 270705_9 270705_10 270705_11 270705_12
A0 0.0845 0.0672 0.0845 0.0896 0.1043 0.0865 0.0697 0.0845 0.0743 0.0519 0.0718 0.0870 A2 0.0494 0.0646 0.0422 0.0519 0.0499 2.1891 0.6956 0.0768 0.0524 0.0672 0.0773 0.0723 A4 0.1490 0.0646 0.0570 0.0890 0.1190 0.5886 0.7305 0.0544 0.0941 0.0743 0.0819 0.0972 A6 0.7507 0.2200 0.0523 0.0826 0.1877 0.1128 0.1374 0.2554 0.3179 0.3154 0.3051 0.3579 A8 1.7740 0.9158 0.0494 0.0550 2.1404 0.0398 0.0698 1.3337 1.0503 1.4259 1.6721 1.3938
A16 Fault 0.1067 0.1362 0.2134 0.1616 0.1118 Fault Fault Fault Fault Fault Fault A20 Fault 0.2880 0.2285 2.1123 0.1364 0.0941 Fault 0.9663 0.8152 0.2560 0.3353 0.3750 A24 0.3878 0.1766 0.0865 0.1893 0.1817 0.1216 0.1338 0.3898 0.2880 0.3929 0.4325 0.3506 B0 0.3146 0.0888 0.0568 0.1613 0.1684 0.1167 0.1162 0.1832 0.2425 0.2085 0.2451 0.2506 B2 0.1893 0.1271 0.1169 0.3016 0.3659 1.0391 0.0597 0.1368 0.1618 0.1021 0.2021 0.1368 B4 0.3591 0.2130 0.1933 0.5199 0.1785 0.1856 3.4999 0.1486 0.1512 0.1364 0.1309 0.1263 B16 1.9888 1.9567 0.0622 0.0347 1.2225 0.0275 0.0423 3.6543 1.9791 4.0851 4.3089 3.9806 B24 0.1490 0.1343 0.2558 0.2579 0.1363 0.0870 0.2136 0.2284 0.1887 0.2584 0.2360 0.2309
Mean 0.5633 0.3402 0.1094 0.3199 0.3964 0.3692 0.5244 0.6260 0.4513 0.6145 0.6749 0.6216 Ratio 3.5 5.8 2.3 6.6 5.4 5.9 6.7 5.8 4.4 6.6 6.4 6.4
56
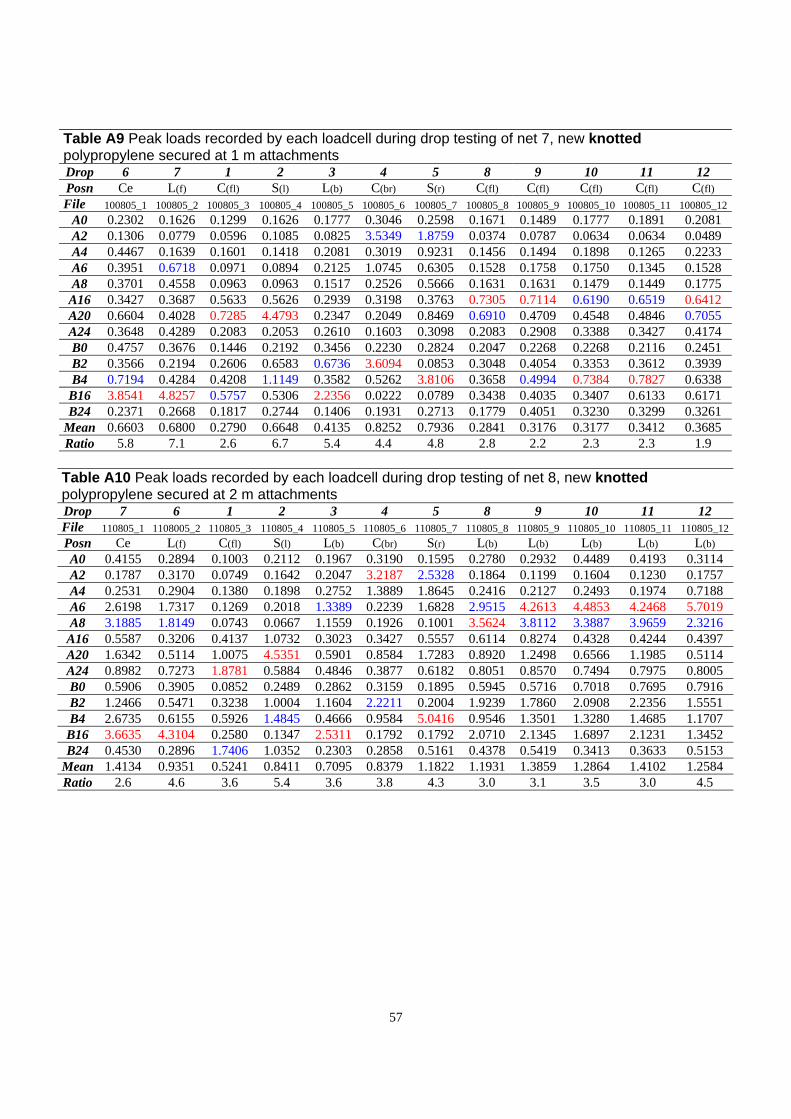
Table A9 Peak loads recorded by each loadcell during drop testing of net 7, new knotted polypropylene secured at 1 m attachments Drop 6 7 1 2 3 4 5 8 9 10 11 12 Posn Ce L(f) C(fl) S(l) L(b) C(br) S(r) C(fl) C(fl) C(fl) C(fl) C(fl) File 100805_1 100805_2 100805_3 100805_4 100805_5 100805_6 100805_7 100805_8 100805_9 100805_10 100805_11 100805_12
A0 0.2302 0.1626 0.1299 0.1626 0.1777 0.3046 0.2598 0.1671 0.1489 0.1777 0.1891 0.2081 A2 0.1306 0.0779 0.0596 0.1085 0.0825 3.5349 1.8759 0.0374 0.0787 0.0634 0.0634 0.0489 A4 0.4467 0.1639 0.1601 0.1418 0.2081 0.3019 0.9231 0.1456 0.1494 0.1898 0.1265 0.2233 A6 0.3951 0.6718 0.0971 0.0894 0.2125 1.0745 0.6305 0.1528 0.1758 0.1750 0.1345 0.1528 A8 0.3701 0.4558 0.0963 0.0963 0.1517 0.2526 0.5666 0.1631 0.1631 0.1479 0.1449 0.1775
A16 0.3427 0.3687 0.5633 0.5626 0.2939 0.3198 0.3763 0.7305 0.7114 0.6190 0.6519 0.6412 A20 0.6604 0.4028 0.7285 4.4793 0.2347 0.2049 0.8469 0.6910 0.4709 0.4548 0.4846 0.7055 A24 0.3648 0.4289 0.2083 0.2053 0.2610 0.1603 0.3098 0.2083 0.2908 0.3388 0.3427 0.4174 B0 0.4757 0.3676 0.1446 0.2192 0.3456 0.2230 0.2824 0.2047 0.2268 0.2268 0.2116 0.2451 B2 0.3566 0.2194 0.2606 0.6583 0.6736 3.6094 0.0853 0.3048 0.4054 0.3353 0.3612 0.3939 B4 0.7194 0.4284 0.4208 1.1149 0.3582 0.5262 3.8106 0.3658 0.4994 0.7384 0.7827 0.6338
B16 3.8541 4.8257 0.5757 0.5306 2.2356 0.0222 0.0789 0.3438 0.4035 0.3407 0.6133 0.6171 B24 0.2371 0.2668 0.1817 0.2744 0.1406 0.1931 0.2713 0.1779 0.4051 0.3230 0.3299 0.3261
Mean 0.6603 0.6800 0.2790 0.6648 0.4135 0.8252 0.7936 0.2841 0.3176 0.3177 0.3412 0.3685 Ratio 5.8 7.1 2.6 6.7 5.4 4.4 4.8 2.8 2.2 2.3 2.3 1.9
Table A10 Peak loads recorded by each loadcell during drop testing of net 8, new knotted polypropylene secured at 2 m attachments Drop 7 6 1 2 3 4 5 8 9 10 11 12 File 110805_1 1108005_2 110805_3 110805_4 110805_5 110805_6 110805_7 110805_8 110805_9 110805_10 110805_11 110805_12 Posn Ce L(f) C(fl) S(l) L(b) C(br) S(r) L(b) L(b) L(b) L(b) L(b) A0 0.4155 0.2894 0.1003 0.2112 0.1967 0.3190 0.1595 0.2780 0.2932 0.4489 0.4193 0.3114 A2 0.1787 0.3170 0.0749 0.1642 0.2047 3.2187 2.5328 0.1864 0.1199 0.1604 0.1230 0.1757 A4 0.2531 0.2904 0.1380 0.1898 0.2752 1.3889 1.8645 0.2416 0.2127 0.2493 0.1974 0.7188 A6 2.6198 1.7317 0.1269 0.2018 1.3389 0.2239 1.6828 2.9515 4.2613 4.4853 4.2468 5.7019 A8 3.1885 1.8149 0.0743 0.0667 1.1559 0.1926 0.1001 3.5624 3.8112 3.3887 3.9659 2.3216
A16 0.5587 0.3206 0.4137 1.0732 0.3023 0.3427 0.5557 0.6114 0.8274 0.4328 0.4244 0.4397 A20 1.6342 0.5114 1.0075 4.5351 0.5901 0.8584 1.7283 0.8920 1.2498 0.6566 1.1985 0.5114 A24 0.8982 0.7273 1.8781 0.5884 0.4846 0.3877 0.6182 0.8051 0.8570 0.7494 0.7975 0.8005 B0 0.5906 0.3905 0.0852 0.2489 0.2862 0.3159 0.1895 0.5945 0.5716 0.7018 0.7695 0.7916 B2 1.2466 0.5471 0.3238 1.0004 1.1604 2.2211 0.2004 1.9239 1.7860 2.0908 2.2356 1.5551 B4 2.6735 0.6155 0.5926 1.4845 0.4666 0.9584 5.0416 0.9546 1.3501 1.3280 1.4685 1.1707
B16 3.6635 4.3104 0.2580 0.1347 2.5311 0.1792 0.1792 2.0710 2.1345 1.6897 2.1231 1.3452 B24 0.4530 0.2896 1.7406 1.0352 0.2303 0.2858 0.5161 0.4378 0.5419 0.3413 0.3633 0.5153
Mean 1.4134 0.9351 0.5241 0.8411 0.7095 0.8379 1.1822 1.1931 1.3859 1.2864 1.4102 1.2584 Ratio 2.6 4.6 3.6 5.4 3.6 3.8 4.3 3.0 3.1 3.5 3.0 4.5
57

Table A11 Peak loads recorded by each loadcell during drop testing of net 9, used knotless polypropylene secured at 0.1 m attachments Drop 1 2 3 4 5 6 7 8 9 10 Posn Ce L(f) C(fl) S(l) L(b) C(br) S(r) S(l) S(l) S(l) File 080805_1 080805_2 080805_3 080805_4 080805_5 080805_6 080805_7 080805_8 080805_9 080805_10
A0 0.0592 0.0851 0.0744 0.0562 0.0486 0.0592 0.0668 0.0858 0.0258 0.0744 A2 0.0222 0.0298 0.0443 0.0336 0.0222 0.5522 0.3093 0.0336 0.0565 0.0374 A4 0.1075 0.0968 0.1121 0.0892 0.1303 0.1601 0.2348 0.1189 0.0968 0.0191 A6 0.0971 0.2163 0.0413 0.0749 0.0894 0.0894 0.0596 0.0711 0.0558 0.0520 A8 0.8077 0.6629 0.0114 0.0485 1.3477 0.0364 0.0364 0.0440 0.0190 0.0190
A16 0.0489 0.0565 0.0969 0.0557 0.0336 0.0527 0.0664 0.0519 0.0824 0.0702 A20 0.1835 0.0933 0.1307 0.8806 0.2171 0.0780 0.2018 0.5565 0.3623 0.5075 A24 0.0817 0.0595 0.0443 0.0519 0.0557 0.0336 0.0374 0.0519 0.0412 0.0443 B0 0.0632 0.0297 0.0373 0.0335 0.0259 0.0411 0.0411 0.0518 0.0441 0.0441 B2 0.0632 0.0411 0.0404 0.0632 0.1341 0.1745 0.1006 0.0968 0.0899 0.1707 B4 0.1489 0.0565 0.0710 0.2344 0.0893 0.1420 0.8354 0.1565 0.1863 0.1863
B16 0.4295 0.9677 0.0521 0.0635 0.4862 0.0521 0.0521 0.1570 0.0260 0.0896 B24 0.0372 0.0707 0.0372 0.0372 0.0410 0.0334 0.0593 0.0479 0.0258 0.0410
Mean 0.1654 0.1897 0.0610 0.1325 0.2093 0.1157 0.1616 0.1172 0.0855 0.1043 Ratio 4.9 5.1 2.1 6.6 6.4 4.8 5.2 4.7 4.2 4.9
Table A12 Peak loads recorded by each loadcell during drop testing of net 10, new knotless polypropylene secured at 0.5 m attachments Drop 1 2 3 4 5 6 7 8 9 10 11 12 Posn Ce L(f) C(fl) S(l) L(b) C(br) S(r) Ce Ce Ce Ce Ce File 090805_1 090805_2 090805_3 090805_4 090805_5 090805_6 090805_7 090805_8 090805_9 090805_10 090805_11 090805_12
A0 0.1815 0.1785 0.1033 0.1147 0.1193 0.0775 0.1739 0.1998 0.2043 0.1739 0.1777 0.2043 A2 0.0489 0.0855 0.0558 0.0596 0.0634 1.8797 0.6156 0.0970 0.0825 0.0672 0.0596 0.0634 A4 0.1006 0.0816 0.0778 0.1151 0.0778 0.3202 0.7036 0.3537 0.1342 0.1151 0.1456 0.2599 A6 0.3401 0.3133 0.0489 0.0856 0.1979 0.0932 0.1200 1.3695 0.5678 0.6603 0.5296 0.5930 A8 1.8999 0.2336 0.0409 0.0410 0.1669 0.0485 0.0887 0.5036 0.4073 0.4558 0.4187 0.4444
A16 0.0595 0.0595 0.0779 0.0748 0.0748 0.0557 0.0672 0.0779 0.0634 0.0702 0.0557 0.0672 A20 0.4816 0.1712 0.5481 3.1905 0.1307 0.1269 0.3547 0.3738 0.4074 0.4892 0.4403 0.4816 A24 0.0969 0.0740 0.0672 0.0595 0.0931 0.0595 0.0786 0.1038 0.1122 0.1046 0.1191 0.1084 B0 0.3159 0.2786 0.1530 0.2124 0.2497 0.1263 0.1598 0.3638 0.3121 0.3570 0.3273 0.3235 B2 0.2347 0.1714 0.1112 0.2194 0.3010 1.1871 0.1600 0.2377 0.2751 0.2713 0.2758 0.2865 B4 0.4551 0.1863 0.1306 0.5223 0.1718 0.3696 3.0088 0.3131 0.3543 0.4292 0.3620 0.5330
B16 1.8275 3.5441 0.1723 0.0896 1.9967 0.0337 0.0559 2.8940 3.4652 3.1023 3.5326 3.4468 B24 0.1262 0.1338 0.0897 0.1079 0.1338 0.0745 0.0965 0.1155 0.1155 0.1292 0.0996 0.1003
Mean 0.4745 0.4240 0.1290 0.3763 0.2905 0.3425 0.4372 0.5387 0.5001 0.4943 0.5033 0.5317 Ratio 4.0 8.4 4.2 8.5 6.9 5.5 6.9 5.4 6.9 6.3 7.0 6.5
58
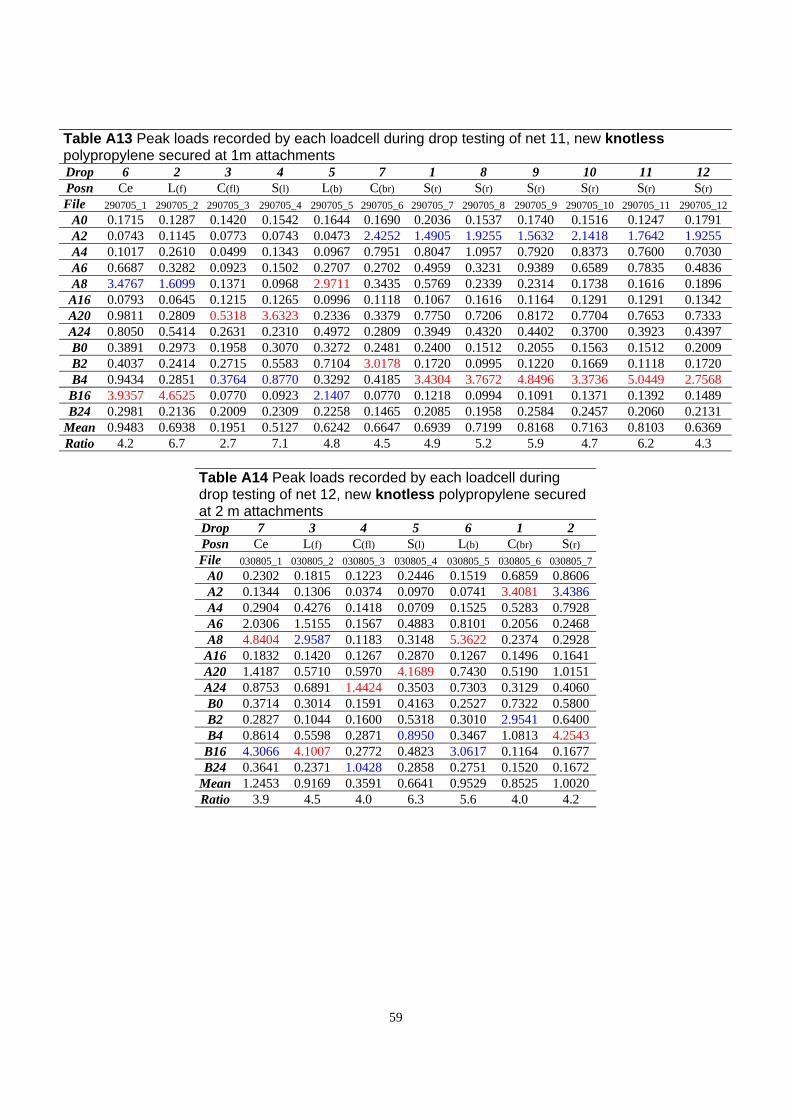
Table A13 Peak loads recorded by each loadcell during drop testing of net 11, new knotless polypropylene secured at 1m attachments Drop 6 2 3 4 5 7 1 8 9 10 11 12 Posn Ce L(f) C(fl) S(l) L(b) C(br) S(r) S(r) S(r) S(r) S(r) S(r) File 290705_1 290705_2 290705_3 290705_4 290705_5 290705_6 290705_7 290705_8 290705_9 290705_10 290705_11 290705_12
A0 0.1715 0.1287 0.1420 0.1542 0.1644 0.1690 0.2036 0.1537 0.1740 0.1516 0.1247 0.1791 A2 0.0743 0.1145 0.0773 0.0743 0.0473 2.4252 1.4905 1.9255 1.5632 2.1418 1.7642 1.9255 A4 0.1017 0.2610 0.0499 0.1343 0.0967 0.7951 0.8047 1.0957 0.7920 0.8373 0.7600 0.7030 A6 0.6687 0.3282 0.0923 0.1502 0.2707 0.2702 0.4959 0.3231 0.9389 0.6589 0.7835 0.4836 A8 3.4767 1.6099 0.1371 0.0968 2.9711 0.3435 0.5769 0.2339 0.2314 0.1738 0.1616 0.1896
A16 0.0793 0.0645 0.1215 0.1265 0.0996 0.1118 0.1067 0.1616 0.1164 0.1291 0.1291 0.1342 A20 0.9811 0.2809 0.5318 3.6323 0.2336 0.3379 0.7750 0.7206 0.8172 0.7704 0.7653 0.7333 A24 0.8050 0.5414 0.2631 0.2310 0.4972 0.2809 0.3949 0.4320 0.4402 0.3700 0.3923 0.4397 B0 0.3891 0.2973 0.1958 0.3070 0.3272 0.2481 0.2400 0.1512 0.2055 0.1563 0.1512 0.2009 B2 0.4037 0.2414 0.2715 0.5583 0.7104 3.0178 0.1720 0.0995 0.1220 0.1669 0.1118 0.1720 B4 0.9434 0.2851 0.3764 0.8770 0.3292 0.4185 3.4304 3.7672 4.8496 3.3736 5.0449 2.7568
B16 3.9357 4.6525 0.0770 0.0923 2.1407 0.0770 0.1218 0.0994 0.1091 0.1371 0.1392 0.1489 B24 0.2981 0.2136 0.2009 0.2309 0.2258 0.1465 0.2085 0.1958 0.2584 0.2457 0.2060 0.2131
Mean 0.9483 0.6938 0.1951 0.5127 0.6242 0.6647 0.6939 0.7199 0.8168 0.7163 0.8103 0.6369 Ratio 4.2 6.7 2.7 7.1 4.8 4.5 4.9 5.2 5.9 4.7 6.2 4.3
Table A14 Peak loads recorded by each loadcell during drop testing of net 12, new knotless polypropylene secured at 2 m attachments Drop 7 3 4 5 6 1 2 Posn Ce L(f) C(fl) S(l) L(b) C(br) S(r) File 030805_1 030805_2 030805_3 030805_4 030805_5 030805_6 030805_7
A0 0.2302 0.1815 0.1223 0.2446 0.1519 0.6859 0.8606 A2 0.1344 0.1306 0.0374 0.0970 0.0741 3.4081 3.4386 A4 0.2904 0.4276 0.1418 0.0709 0.1525 0.5283 0.7928 A6 2.0306 1.5155 0.1567 0.4883 0.8101 0.2056 0.2468 A8 4.8404 2.9587 0.1183 0.3148 5.3622 0.2374 0.2928
A16 0.1832 0.1420 0.1267 0.2870 0.1267 0.1496 0.1641 A20 1.4187 0.5710 0.5970 4.1689 0.7430 0.5190 1.0151 A24 0.8753 0.6891 1.4424 0.3503 0.7303 0.3129 0.4060 B0 0.3714 0.3014 0.1591 0.4163 0.2527 0.7322 0.5800 B2 0.2827 0.1044 0.1600 0.5318 0.3010 2.9541 0.6400 B4 0.8614 0.5598 0.2871 0.8950 0.3467 1.0813 4.2543
B16 4.3066 4.1007 0.2772 0.4823 3.0617 0.1164 0.1677 B24 0.3641 0.2371 1.0428 0.2858 0.2751 0.1520 0.1672
Mean 1.2453 0.9169 0.3591 0.6641 0.9529 0.8525 1.0020 Ratio 3.9 4.5 4.0 6.3 5.6 4.0 4.2
59

12
Table A15 Peak loads recorded by each loadcell during drop testing of net 13, new knotted nylon secured at 0.1 m attachments Drop 1 2 3 4 5 6 7 8 9 10 11 Posn Ce L(f) C(fl) S(l) L(b) C(br) S(r) Ce Ce Ce Ce Ce File 060905_1 060905_2 060905_3 060905_4 060905_5 060905_6 060905_7 060905_8 060905_9 060905_10 060905_11 060905_12
A0 0.0668 0.0486 0.1033 0.0517 0.1003 0.0486 0.0813 0.0668 0.0782 0.0820 0.0486 0.0486 A2 0.0336 0.0489 0.0260 0.0634 0.0634 0.3918 0.4659 0.0481 0.0443 0.0481 0.0405 0.0336 A4 0.0709 0.0526 0.0709 0.0633 0.0374 0.1121 0.1708 0.2119 0.0663 0.0297 0.1082 0.0709 A6 0.0856 0.1490 0.0481 0.0520 0.1643 0.0864 0.0894 0.2308 0.1827 0.2056 0.2056 0.2835 A8 0.3663 0.3959 0.0516 0.0364 0.5999 0.0440 0.0364 0.3959 0.4596 0.4854 0.4444 0.4854
A16 0.0565 0.0374 0.1160 0.0893 0.0595 0.0740 0.0672 0.0595 0.0557 0.0824 0.0901 0.1076 A20 0.1491 0.1643 0.1154 0.5565 0.1154 0.0856 0.1491 0.2125 0.2308 0.2278 0.1789 0.2125 A24 0.0633 0.0443 0.0259 0.0595 0.0519 0.0259 0.0412 0.0595 0.0740 0.0595 0.0702 0.0595 B0 0.0441 0.0480 0.0632 0.0259 0.0594 0.1302 0.0297 0.0297 0.0700 0.0784 0.0518 0.0297 B2 0.1074 0.1151 0.0671 0.1600 0.1867 0.2636 0.1112 0.1341 0.1638 0.1524 0.1379 0.1669 B4 0.1718 0.1680 0.1046 0.2008 0.1680 0.1229 0.5895 0.2948 0.5002 0.3582 0.2314 0.3284
B16 0.3484 0.6768 0.0329 0.0367 0.4448 0.0337 0.0329 0.3591 0.4188 0.5382 0.4555 0.4747 B24 0.0661 0.0889 0.0669 0.0190 0.0403 0.0486 0.0555 0.0486 0.0669 0.0144 0.0631 0.0479
Mean 0.1254 0.1568 0.0686 0.1088 0.1609 0.1129 0.1477 0.1655 0.1855 0.1817 0.1636 0.1807 Ratio 2.9 4.3 1.7 5.1 3.7 3.5 4.0 2.4 2.7 3.0 2.8 2.7
Table A16 Peak loads recorded by each loadcell during drop testing of net 14, new knotted nylon secured at 0.5 m attachments Drop 1 2 3 4 5 6 7 8 9 10 11 Posn Ce L(f) C(fl) S(l) L(b) C(br) S(r) S(r) S(r) S(r) S(r)
File 031105_1 031105_2 031105_3 031105_4 031105_5 031105_6 031105_7 031105_8 031105_9 031105_10 031105_11 A0 0.0782 0.0927 0.0668 0.1155 0.1185 0.0820 0.1823 0.2036 0.1815 0.1929 0.2446 A2 0.1115 0.0970 0.0527 0.0443 0.0634 1.7674 0.9509 0.7905 0.9250 0.9769 0.9731 A4 0.1303 0.0930 0.0709 0.0816 0.0450 0.5359 0.3354 0.3613 0.8858 0.6174 0.3758 A6 0.1979 0.2163 0.0451 0.0673 0.1345 0.3584 0.0971 0.7390 0.4960 0.4517 0.1192 A8 1.6215 1.1437 0.3959 0.4854 2.8070 0.0364 0.0440 0.0887 0.0516 0.0554 0.0630
A16 0.1603 0.1008 0.1977 0.1298 0.2679 0.2908 0.1824 0.1679 0.1374 0.1412 0.1153 A20 0.6528 0.3952 0.4296 2.4078 0.3172 0.2721 0.5855 0.6191 0.6566 0.6268 0.6046 A24 0.4251 0.5624 0.2686 0.3953 0.3503 0.2236 0.2717 0.2984 0.3060 0.3091 0.3427 B0 0.1705 0.1522 0.1005 0.1446 0.3159 0.1636 0.2009 0.2892 0.2375 0.2078 0.2786 B2 0.2598 0.3833 0.1953 0.3985 0.5097 1.3578 0.2012 0.2606 0.1897 0.2339 0.1562 B4 0.5559 0.3360 0.2726 0.6071 0.4070 0.4956 2.1512 2.2367 2.6697 2.5323 1.9465
B16 1.4884 2.6131 0.1830 0.3177 0.8636 0.0406 0.0367 0.0521 0.0482 0.0337 0.0406 B24 0.1079 0.1368 0.0707 0.1824 0.1193 0.1003 0.1520 0.1003 0.1003 0.1558 0.1460
Mean 0.4585 0.4863 0.1806 0.4136 0.4861 0.4404 0.4147 0.4775 0.5296 0.5027 0.4160 Ratio 3.5 5.4 2.4 5.8 5.8 4.0 5.2 4.7 5.0 5.0 4.7
60
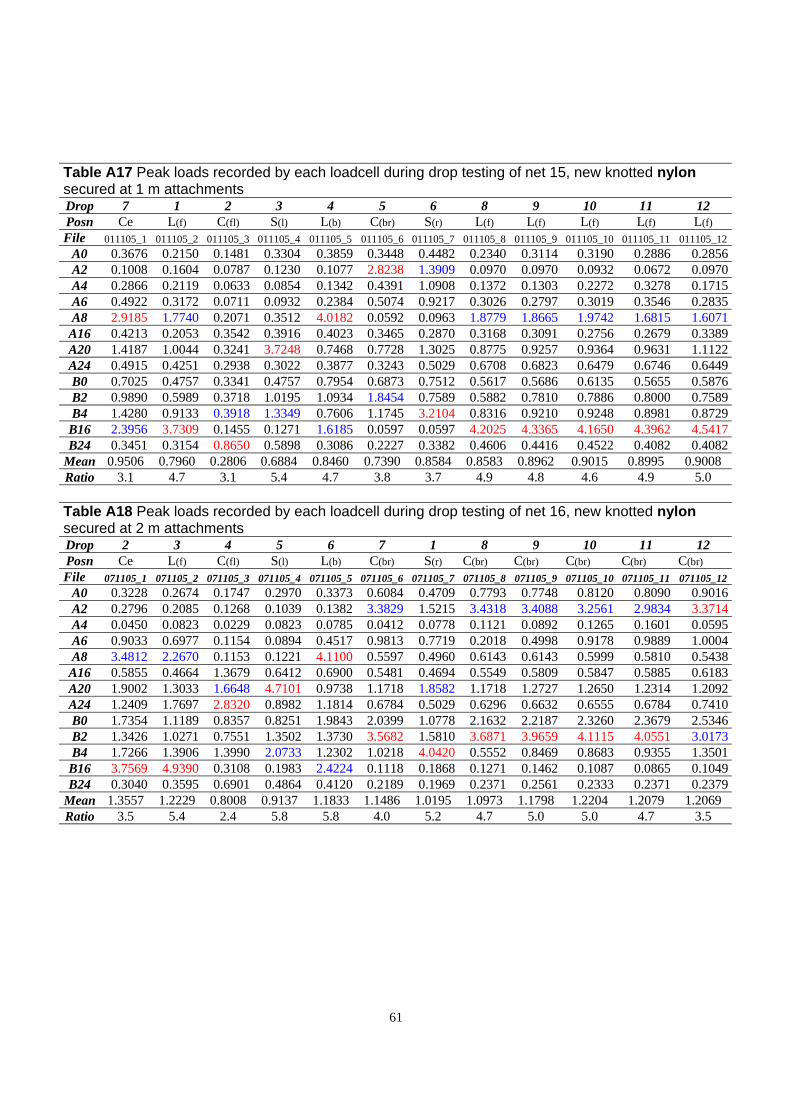
12
Table A17 Peak loads recorded by each loadcell during drop testing of net 15, new knotted nylon secured at 1 m attachments Drop 7 1 2 3 4 5 6 8 9 10 11 Posn Ce L(f) C(fl) S(l) L(b) C(br) S(r) L(f) L(f) L(f) L(f) L(f) File 011105_1 011105_2 011105_3 011105_4 011105_5 011105_6 011105_7 011105_8 011105_9 011105_10 011105_11 011105_12
A0 0.3676 0.2150 0.1481 0.3304 0.3859 0.3448 0.4482 0.2340 0.3114 0.3190 0.2886 0.2856 A2 0.1008 0.1604 0.0787 0.1230 0.1077 2.8238 1.3909 0.0970 0.0970 0.0932 0.0672 0.0970 A4 0.2866 0.2119 0.0633 0.0854 0.1342 0.4391 1.0908 0.1372 0.1303 0.2272 0.3278 0.1715 A6 0.4922 0.3172 0.0711 0.0932 0.2384 0.5074 0.9217 0.3026 0.2797 0.3019 0.3546 0.2835 A8 2.9185 1.7740 0.2071 0.3512 4.0182 0.0592 0.0963 1.8779 1.8665 1.9742 1.6815 1.6071
A16 0.4213 0.2053 0.3542 0.3916 0.4023 0.3465 0.2870 0.3168 0.3091 0.2756 0.2679 0.3389 A20 1.4187 1.0044 0.3241 3.7248 0.7468 0.7728 1.3025 0.8775 0.9257 0.9364 0.9631 1.1122 A24 0.4915 0.4251 0.2938 0.3022 0.3877 0.3243 0.5029 0.6708 0.6823 0.6479 0.6746 0.6449 B0 0.7025 0.4757 0.3341 0.4757 0.7954 0.6873 0.7512 0.5617 0.5686 0.6135 0.5655 0.5876 B2 0.9890 0.5989 0.3718 1.0195 1.0934 1.8454 0.7589 0.5882 0.7810 0.7886 0.8000 0.7589 B4 1.4280 0.9133 0.3918 1.3349 0.7606 1.1745 3.2104 0.8316 0.9210 0.9248 0.8981 0.8729
B16 2.3956 3.7309 0.1455 0.1271 1.6185 0.0597 0.0597 4.2025 4.3365 4.1650 4.3962 4.5417 B24 0.3451 0.3154 0.8650 0.5898 0.3086 0.2227 0.3382 0.4606 0.4416 0.4522 0.4082 0.4082
Mean 0.9506 0.7960 0.2806 0.6884 0.8460 0.7390 0.8584 0.8583 0.8962 0.9015 0.8995 0.9008 Ratio 3.1 4.7 3.1 5.4 4.7 3.8 3.7 4.9 4.8 4.6 4.9 5.0
Table A18 Peak loads recorded by each loadcell during drop testing of net 16, new knotted nylon secured at 2 m attachments Drop 2 3 4 5 6 7 1 8 9 10 11 12 Posn Ce L(f) C(fl) S(l) L(b) C(br) S(r) C(br) C(br) C(br) C(br) C(br) File 071105_1 071105_2 071105_3 071105_4 071105_5 071105_6 071105_7 071105_8 071105_9 071105_10 071105_11 071105_12
A0 0.3228 0.2674 0.1747 0.2970 0.3373 0.6084 0.4709 0.7793 0.7748 0.8120 0.8090 0.9016 A2 0.2796 0.2085 0.1268 0.1039 0.1382 3.3829 1.5215 3.4318 3.4088 3.2561 2.9834 3.3714 A4 0.0450 0.0823 0.0229 0.0823 0.0785 0.0412 0.0778 0.1121 0.0892 0.1265 0.1601 0.0595 A6 0.9033 0.6977 0.1154 0.0894 0.4517 0.9813 0.7719 0.2018 0.4998 0.9178 0.9889 1.0004 A8 3.4812 2.2670 0.1153 0.1221 4.1100 0.5597 0.4960 0.6143 0.6143 0.5999 0.5810 0.5438
A16 0.5855 0.4664 1.3679 0.6412 0.6900 0.5481 0.4694 0.5549 0.5809 0.5847 0.5885 0.6183 A20 1.9002 1.3033 1.6648 4.7101 0.9738 1.1718 1.8582 1.1718 1.2727 1.2650 1.2314 1.2092 A24 1.2409 1.7697 2.8320 0.8982 1.1814 0.6784 0.5029 0.6296 0.6632 0.6555 0.6784 0.7410 B0 1.7354 1.1189 0.8357 0.8251 1.9843 2.0399 1.0778 2.1632 2.2187 2.3260 2.3679 2.5346 B2 1.3426 1.0271 0.7551 1.3502 1.3730 3.5682 1.5810 3.6871 3.9659 4.1115 4.0551 3.0173 B4 1.7266 1.3906 1.3990 2.0733 1.2302 1.0218 4.0420 0.5552 0.8469 0.8683 0.9355 1.3501
B16 3.7569 4.9390 0.3108 0.1983 2.4224 0.1118 0.1868 0.1271 0.1462 0.1087 0.0865 0.1049 B24 0.3040 0.3595 0.6901 0.4864 0.4120 0.2189 0.1969 0.2371 0.2561 0.2333 0.2371 0.2379
Mean 1.3557 1.2229 0.8008 0.9137 1.1833 1.1486 1.0195 1.0973 1.1798 1.2204 1.2079 1.2069 Ratio 3.5 5.4 2.4 5.8 5.8 4.0 5.2 4.7 5.0 5.0 4.7 3.5
61

12 APPENDIX B – PHASE 2 - LOAD ANALYSIS
Table B1 gives details of the nets tested during phase 2 of this work. Further details of the nets and test procedures can be found in the main body of the report. Table B2 lists loadcell positions.
Table B1 Details of phase 2 net tests No Date tested Net description Size Serial No. Date of Attachment Order
by HSL (key word) Manufacture Spacing 17 16/11/2006 New Knotted Nylon 10% sag 15 x 7.8 A06002574 08/2006 Every 1 m 18 18 02/11/2006 New Knotted Nylon 20% sag 15 x 8.5 A06002575 08/2006 Every 1 m 17 19 05/12/2006 New Knotted Nylon under rolled 15 x 10 A06002576 08/2006 Every 1 m 19 20 12/12/2006 New Knotted Nylon bagged 15 x 10 A06002577 08/2006 Every 1 m 20 21 16/02/2007 New Knotless Polypropylene 2 15 x 7.5 059767 01/2007 Every 1 m 21 22 20/02/2007 New Knotless Polypropylene 2 15 x 7.5 059765 01/2007 Every 2 m 24 23 19/02/2007 New Knotless Polypropylene 2 Defect at drop 15 x 7.5 059766 01/2007 Every 1 m 22 24 19/02/2007 New Knotless Polypropylene 2 Defect at attach 15 x 7.5 059764 01/2007 Every 1 m 23 25 20/02/2007 New Knotless Polypropylene 2 Dummy 15 x 7.5 059763 01/2007 Every 1 m 25 26 21/02/2007 New Knotless Polypropylene 2 Cylinder 15 x 7.5 059762 01/2007 Every 1 m 26
Table B2 Positions of load cells Load Position Serial Cell No.
A0 Rear Long edge right corner 23225 A2 Rear Long edge 2m from corner 23227 A4 Rear Long edge 4m from corner 23260 A6 Rear Long edge 6m from corner 23263 A8 Rear Long edge centre 23265
A16 Rear Long edge left corner 23280 A20 Left Short edge centre 23269 A24 Left Short edge front corner 23272 B0 Right Short edge rear corner 23273 B2 Right Short edge 2m from corner 23275 B4 Right Short edge centre 23276 B8 Front Long edge right corner -
B16 Front Long edge centre 23274 B24 Front Long edge left corner 23279
Peak loads for each net are compiled in tables B3 to B12. Each table contains the peak loads recorded by each loadcell during all of the drops on a single net. In these tables, the maximum load measured by any loadcell during a drop is highlighted in red, the second highest load is highlighted in blue. The relationship between the peak load and the mean load for all loadcells is quoted as a ratio.
62
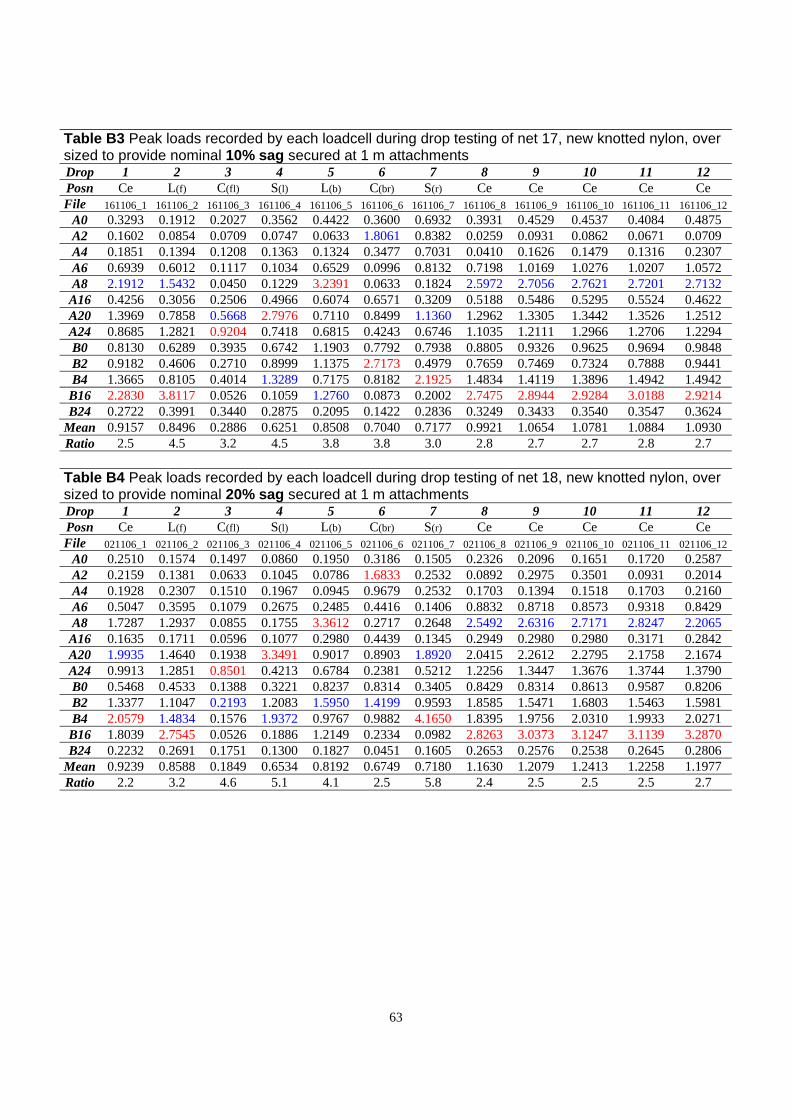
12
Table B3 Peak loads recorded by each loadcell during drop testing of net 17, new knotted nylon, over sized to provide nominal 10% sag secured at 1 m attachments Drop 1 2 3 4 5 6 7 8 9 10 11 Posn Ce L(f) C(fl) S(l) L(b) C(br) S(r) Ce Ce Ce Ce Ce File 161106_1 161106_2 161106_3 161106_4 161106_5 161106_6 161106_7 161106_8 161106_9 161106_10 161106_11 161106_12
A0 0.3293 0.1912 0.2027 0.3562 0.4422 0.3600 0.6932 0.3931 0.4529 0.4537 0.4084 0.4875 A2 0.1602 0.0854 0.0709 0.0747 0.0633 1.8061 0.8382 0.0259 0.0931 0.0862 0.0671 0.0709 A4 0.1851 0.1394 0.1208 0.1363 0.1324 0.3477 0.7031 0.0410 0.1626 0.1479 0.1316 0.2307 A6 0.6939 0.6012 0.1117 0.1034 0.6529 0.0996 0.8132 0.7198 1.0169 1.0276 1.0207 1.0572 A8 2.1912 1.5432 0.0450 0.1229 3.2391 0.0633 0.1824 2.5972 2.7056 2.7621 2.7201 2.7132
A16 0.4256 0.3056 0.2506 0.4966 0.6074 0.6571 0.3209 0.5188 0.5486 0.5295 0.5524 0.4622 A20 1.3969 0.7858 0.5668 2.7976 0.7110 0.8499 1.1360 1.2962 1.3305 1.3442 1.3526 1.2512 A24 0.8685 1.2821 0.9204 0.7418 0.6815 0.4243 0.6746 1.1035 1.2111 1.2966 1.2706 1.2294 B0 0.8130 0.6289 0.3935 0.6742 1.1903 0.7792 0.7938 0.8805 0.9326 0.9625 0.9694 0.9848 B2 0.9182 0.4606 0.2710 0.8999 1.1375 2.7173 0.4979 0.7659 0.7469 0.7324 0.7888 0.9441 B4 1.3665 0.8105 0.4014 1.3289 0.7175 0.8182 2.1925 1.4834 1.4119 1.3896 1.4942 1.4942
B16 2.2830 3.8117 0.0526 0.1059 1.2760 0.0873 0.2002 2.7475 2.8944 2.9284 3.0188 2.9214 B24 0.2722 0.3991 0.3440 0.2875 0.2095 0.1422 0.2836 0.3249 0.3433 0.3540 0.3547 0.3624
Mean 0.9157 0.8496 0.2886 0.6251 0.8508 0.7040 0.7177 0.9921 1.0654 1.0781 1.0884 1.0930 Ratio 2.5 4.5 3.2 4.5 3.8 3.8 3.0 2.8 2.7 2.7 2.8 2.7
Table B4 Peak loads recorded by each loadcell during drop testing of net 18, new knotted nylon, over sized to provide nominal 20% sag secured at 1 m attachments Drop 1 2 3 4 5 6 7 8 9 10 11 12 Posn Ce L(f) C(fl) S(l) L(b) C(br) S(r) Ce Ce Ce Ce Ce File 021106_1 021106_2 021106_3 021106_4 021106_5 021106_6 021106_7 021106_8 021106_9 021106_10 021106_11 021106_12
A0 0.2510 0.1574 0.1497 0.0860 0.1950 0.3186 0.1505 0.2326 0.2096 0.1651 0.1720 0.2587 A2 0.2159 0.1381 0.0633 0.1045 0.0786 1.6833 0.2532 0.0892 0.2975 0.3501 0.0931 0.2014 A4 0.1928 0.2307 0.1510 0.1967 0.0945 0.9679 0.2532 0.1703 0.1394 0.1518 0.1703 0.2160 A6 0.5047 0.3595 0.1079 0.2675 0.2485 0.4416 0.1406 0.8832 0.8718 0.8573 0.9318 0.8429 A8 1.7287 1.2937 0.0855 0.1755 3.3612 0.2717 0.2648 2.5492 2.6316 2.7171 2.8247 2.2065
A16 0.1635 0.1711 0.0596 0.1077 0.2980 0.4439 0.1345 0.2949 0.2980 0.2980 0.3171 0.2842 A20 1.9935 1.4640 0.1938 3.3491 0.9017 0.8903 1.8920 2.0415 2.2612 2.2795 2.1758 2.1674 A24 0.9913 1.2851 0.8501 0.4213 0.6784 0.2381 0.5212 1.2256 1.3447 1.3676 1.3744 1.3790 B0 0.5468 0.4533 0.1388 0.3221 0.8237 0.8314 0.3405 0.8429 0.8314 0.8613 0.9587 0.8206 B2 1.3377 1.1047 0.2193 1.2083 1.5950 1.4199 0.9593 1.8585 1.5471 1.6803 1.5463 1.5981 B4 2.0579 1.4834 0.1576 1.9372 0.9767 0.9882 4.1650 1.8395 1.9756 2.0310 1.9933 2.0271
B16 1.8039 2.7545 0.0526 0.1886 1.2149 0.2334 0.0982 2.8263 3.0373 3.1247 3.1139 3.2870 B24 0.2232 0.2691 0.1751 0.1300 0.1827 0.0451 0.1605 0.2653 0.2576 0.2538 0.2645 0.2806
Mean 0.9239 0.8588 0.1849 0.6534 0.8192 0.6749 0.7180 1.1630 1.2079 1.2413 1.2258 1.1977 Ratio 2.2 3.2 4.6 5.1 4.1 2.5 5.8 2.4 2.5 2.5 2.5 2.7
63
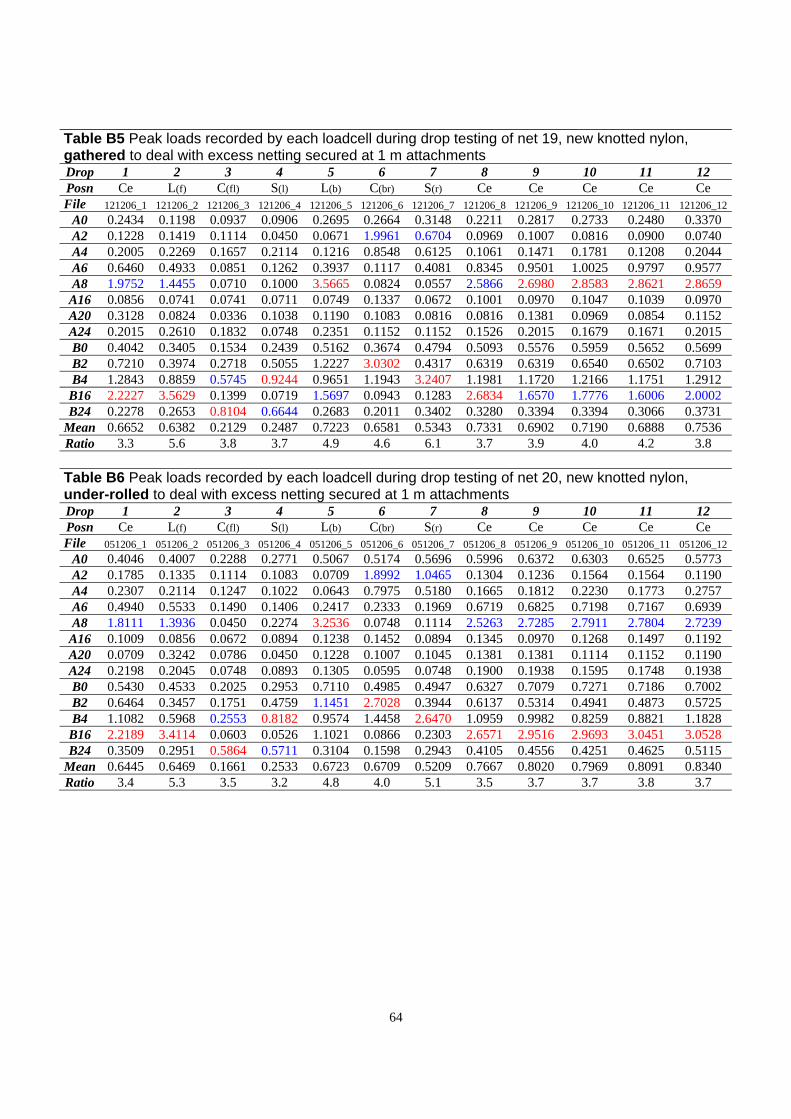
12
Table B5 Peak loads recorded by each loadcell during drop testing of net 19, new knotted nylon, gathered to deal with excess netting secured at 1 m attachments Drop 1 2 3 4 5 6 7 8 9 10 11 Posn Ce L(f) C(fl) S(l) L(b) C(br) S(r) Ce Ce Ce Ce Ce File 121206_1 121206_2 121206_3 121206_4 121206_5 121206_6 121206_7 121206_8 121206_9 121206_10 121206_11 121206_12
A0 0.2434 0.1198 0.0937 0.0906 0.2695 0.2664 0.3148 0.2211 0.2817 0.2733 0.2480 0.3370 A2 0.1228 0.1419 0.1114 0.0450 0.0671 1.9961 0.6704 0.0969 0.1007 0.0816 0.0900 0.0740 A4 0.2005 0.2269 0.1657 0.2114 0.1216 0.8548 0.6125 0.1061 0.1471 0.1781 0.1208 0.2044 A6 0.6460 0.4933 0.0851 0.1262 0.3937 0.1117 0.4081 0.8345 0.9501 1.0025 0.9797 0.9577 A8 1.9752 1.4455 0.0710 0.1000 3.5665 0.0824 0.0557 2.5866 2.6980 2.8583 2.8621 2.8659
A16 0.0856 0.0741 0.0741 0.0711 0.0749 0.1337 0.0672 0.1001 0.0970 0.1047 0.1039 0.0970 A20 0.3128 0.0824 0.0336 0.1038 0.1190 0.1083 0.0816 0.0816 0.1381 0.0969 0.0854 0.1152 A24 0.2015 0.2610 0.1832 0.0748 0.2351 0.1152 0.1152 0.1526 0.2015 0.1679 0.1671 0.2015 B0 0.4042 0.3405 0.1534 0.2439 0.5162 0.3674 0.4794 0.5093 0.5576 0.5959 0.5652 0.5699 B2 0.7210 0.3974 0.2718 0.5055 1.2227 3.0302 0.4317 0.6319 0.6319 0.6540 0.6502 0.7103 B4 1.2843 0.8859 0.5745 0.9244 0.9651 1.1943 3.2407 1.1981 1.1720 1.2166 1.1751 1.2912
B16 2.2227 3.5629 0.1399 0.0719 1.5697 0.0943 0.1283 2.6834 1.6570 1.7776 1.6006 2.0002 B24 0.2278 0.2653 0.8104 0.6644 0.2683 0.2011 0.3402 0.3280 0.3394 0.3394 0.3066 0.3731
Mean 0.6652 0.6382 0.2129 0.2487 0.7223 0.6581 0.5343 0.7331 0.6902 0.7190 0.6888 0.7536 Ratio 3.3 5.6 3.8 3.7 4.9 4.6 6.1 3.7 3.9 4.0 4.2 3.8
Table B6 Peak loads recorded by each loadcell during drop testing of net 20, new knotted nylon, under-rolled to deal with excess netting secured at 1 m attachments Drop 1 2 3 4 5 6 7 8 9 10 11 12 Posn Ce L(f) C(fl) S(l) L(b) C(br) S(r) Ce Ce Ce Ce Ce File 051206_1 051206_2 051206_3 051206_4 051206_5 051206_6 051206_7 051206_8 051206_9 051206_10 051206_11 051206_12
A0 0.4046 0.4007 0.2288 0.2771 0.5067 0.5174 0.5696 0.5996 0.6372 0.6303 0.6525 0.5773 A2 0.1785 0.1335 0.1114 0.1083 0.0709 1.8992 1.0465 0.1304 0.1236 0.1564 0.1564 0.1190 A4 0.2307 0.2114 0.1247 0.1022 0.0643 0.7975 0.5180 0.1665 0.1812 0.2230 0.1773 0.2757 A6 0.4940 0.5533 0.1490 0.1406 0.2417 0.2333 0.1969 0.6719 0.6825 0.7198 0.7167 0.6939 A8 1.8111 1.3936 0.0450 0.2274 3.2536 0.0748 0.1114 2.5263 2.7285 2.7911 2.7804 2.7239
A16 0.1009 0.0856 0.0672 0.0894 0.1238 0.1452 0.0894 0.1345 0.0970 0.1268 0.1497 0.1192 A20 0.0709 0.3242 0.0786 0.0450 0.1228 0.1007 0.1045 0.1381 0.1381 0.1114 0.1152 0.1190 A24 0.2198 0.2045 0.0748 0.0893 0.1305 0.0595 0.0748 0.1900 0.1938 0.1595 0.1748 0.1938 B0 0.5430 0.4533 0.2025 0.2953 0.7110 0.4985 0.4947 0.6327 0.7079 0.7271 0.7186 0.7002 B2 0.6464 0.3457 0.1751 0.4759 1.1451 2.7028 0.3944 0.6137 0.5314 0.4941 0.4873 0.5725 B4 1.1082 0.5968 0.2553 0.8182 0.9574 1.4458 2.6470 1.0959 0.9982 0.8259 0.8821 1.1828
B16 2.2189 3.4114 0.0603 0.0526 1.1021 0.0866 0.2303 2.6571 2.9516 2.9693 3.0451 3.0528 B24 0.3509 0.2951 0.5864 0.5711 0.3104 0.1598 0.2943 0.4105 0.4556 0.4251 0.4625 0.5115
Mean 0.6445 0.6469 0.1661 0.2533 0.6723 0.6709 0.5209 0.7667 0.8020 0.7969 0.8091 0.8340 Ratio 3.4 5.3 3.5 3.2 4.8 4.0 5.1 3.5 3.7 3.7 3.8 3.7
64

12
Table B7 Peak loads recorded by each loadcell during drop testing of net 21, new knotless polypropylene (Type 2) secured at 1.0 m attachments Drop 1 2 3 4 5 6 7 8 9 10 11 Posn Ce L(f) C(fl) S(l) L(b) C(br) S(r) Ce Ce Ce Ce Ce File 160207_1 160207_2 160207_3 160207_4 160207_5 160207_6 160207_7 160207_8 160207_9 160207_10 160207_11 160207_12
A0 0.5842 0.4952 0.4199 0.5996 0.6671 0.7155 0.7685 0.6671 0.7047 0.7385 0.6932 0.7354 A2 0.1716 0.2235 0.1899 0.1747 0.1304 1.7688 0.9755 0.1457 0.1487 0.1304 0.1785 0.1487 A4 0.3477 0.2834 0.1130 0.1402 0.2044 0.7828 0.8092 0.2532 0.2911 0.3175 0.2532 0.2989 A6 0.7540 0.7053 0.1414 0.1520 0.4750 0.2675 0.6536 1.0428 1.1021 1.1651 1.1917 1.2138 A8 2.1164 1.5280 0.1641 0.2687 4.0252 0.1343 0.1007 2.9102 3.1460 3.3353 3.4024 3.5436
A16 0.4065 0.3392 0.7839 0.7090 0.4997 0.5188 0.4554 0.5486 0.5745 0.5486 0.5631 0.5822 A20 0.4287 0.3433 0.6744 0.6408 0.4699 0.6561 0.4059 0.5508 0.5592 0.5851 0.5882 0.5554 A24 1.1737 1.6057 1.9636 1.0547 1.0287 0.8387 1.0959 1.5729 1.6583 1.6698 1.6400 1.6957 B0 0.7639 0.7378 0.8160 0.9664 1.2578 1.0822 0.8912 1.2018 1.2394 1.2770 1.2923 1.3591 B2 0.6472 0.5543 0.3906 0.8367 0.7248 1.6324 1.0187 0.8436 0.8961 0.8253 0.7880 0.8512 B4 0.9797 0.6606 0.4391 1.0889 0.5183 0.9720 3.7628 0.9159 0.9574 0.8867 0.8675 0.9082
B16 1.8147 3.7546 0.0835 0.1391 1.2304 0.1097 0.1097 2.7962 3.0605 3.1208 3.0265 3.2646 B24 0.2462 0.3211 0.4029 0.3731 0.2240 0.2164 0.2645 0.2469 0.2913 0.3104 0.3326 0.3020
Mean 0.8026 0.8886 0.5063 0.5495 0.8812 0.7458 0.8701 1.0535 1.1253 1.1470 1.1398 1.1891 Ratio 2.6 4.2 3.9 2.0 4.6 2.4 4.3 2.8 2.8 2.9 3.0 3.0
Table B8 Peak loads recorded by each loadcell during drop testing of net 22, new knotless polypropylene (Type 2) secured at 2.0 m attachments Drop 1 2 3 4 5 6 7 8 9 10 11 12 Posn Ce L(f) C(fl) S(l) L(b) C(br) S(r) Ce Ce Ce Ce Ce
File 200207_1 200207_2 200207_3 200207_4 200207_5 200207_6 200207_7 200207_8 200207_9 200207_10 200207_11 200207_12 A0 0.6042 0.5811 0.5666 0.7531 0.6971 1.6045 1.2260 0.9596 0.8429 0.7308 0.8882 0.8621 A2 0.2609 0.4881 0.1975 0.2494 0.3608 3.8838 1.3477 0.2753 0.3989 0.4363 0.3173 0.3608 A4 0.4499 0.4723 0.1928 0.2385 0.3786 0.4568 1.1762 0.5064 0.4917 0.4801 0.5707 0.5560 A6 1.0504 1.0724 0.1786 0.2523 1.0466 0.2417 0.5601 2.0225 1.6364 1.5284 1.5512 1.6364 A8 2.4408 1.9157 0.1191 0.2236 4.2893 0.0969 0.1381 3.8459 4.2519 4.2221 4.3267 4.5282
A16 0.5486 0.4890 0.8993 0.6639 0.6341 0.7571 0.5638 0.7503 0.8099 0.8022 0.7610 0.8465 A20 0.5142 0.4913 0.9689 0.6408 0.6149 0.7263 0.5180 0.7042 0.7598 0.7484 0.7675 0.7637 A24 1.4011 1.7774 2.8549 1.0806 1.5202 0.8685 1.4309 1.9483 2.0834 2.2063 2.1803 2.2284 B0 0.9771 1.0415 0.8045 1.0070 1.3483 2.7296 0.9625 1.3483 1.3813 1.4081 1.4304 1.4081 B2 0.7438 0.5687 0.5946 0.9890 1.1824 3.8517 0.5725 1.0073 1.0225 1.0149 1.0263 1.0225 B4 1.2697 0.7882 0.6606 1.4042 0.7621 0.9574 3.7213 1.1412 1.2089 1.1981 1.2166 1.2243
B16 2.6563 3.9215 0.1322 0.2033 2.1702 0.0982 0.1507 4.2074 4.5630 4.8420 4.9100 4.8945 B24 0.3662 0.4480 1.2431 0.5864 0.4037 0.2951 0.4809 0.5038 0.5825 0.5971 0.5787 0.5711
Mean 1.0218 1.0812 0.7240 0.6379 1.1852 1.2744 0.9884 1.4785 1.5410 1.5550 1.5788 1.6079 Ratio 2.6 3.6 3.9 2.2 3.6 3.0 3.8 2.8 3.0 3.1 3.1 3.0
65
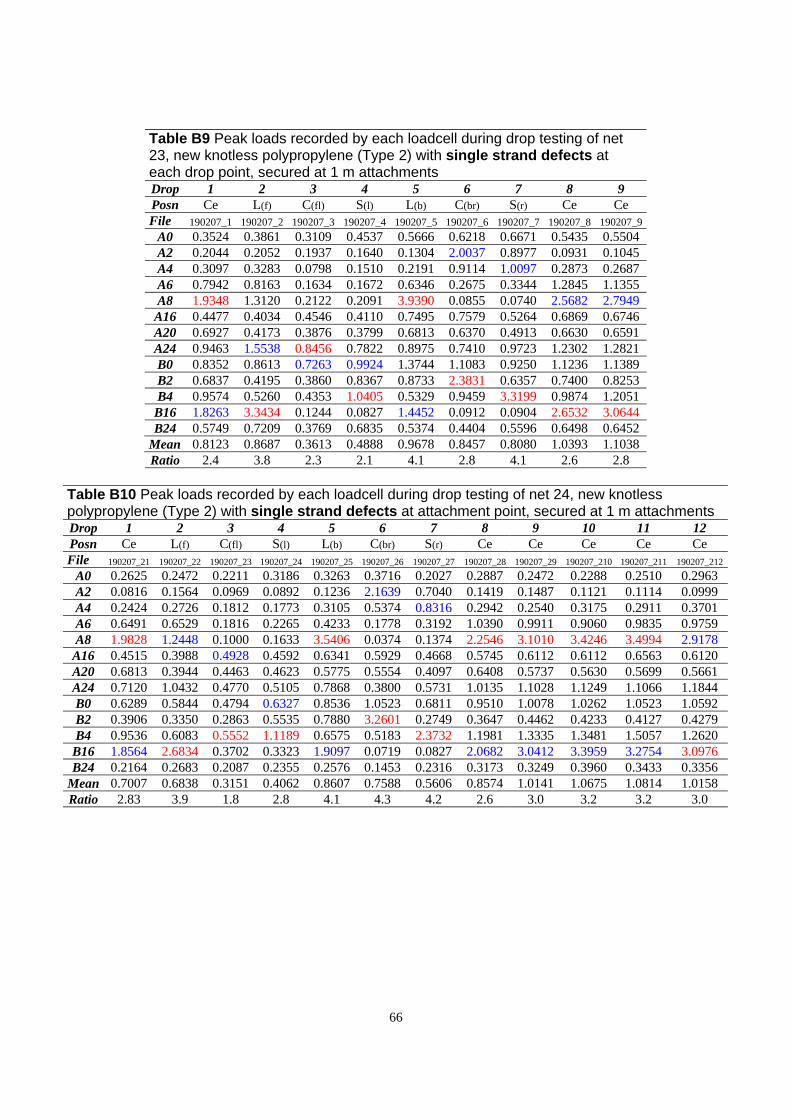
Table B9 Peak loads recorded by each loadcell during drop testing of net 23, new knotless polypropylene (Type 2) with single strand defects at each drop point, secured at 1 m attachments Drop 1 2 3 4 5 6 7 8 9 Posn Ce L(f) C(fl) S(l) L(b) C(br) S(r) Ce Ce File 190207_1 190207_2 190207_3 190207_4 190207_5 190207_6 190207_7 190207_8 190207_9
A0 0.3524 0.3861 0.3109 0.4537 0.5666 0.6218 0.6671 0.5435 0.5504 A2 0.2044 0.2052 0.1937 0.1640 0.1304 2.0037 0.8977 0.0931 0.1045 A4 0.3097 0.3283 0.0798 0.1510 0.2191 0.9114 1.0097 0.2873 0.2687 A6 0.7942 0.8163 0.1634 0.1672 0.6346 0.2675 0.3344 1.2845 1.1355 A8 1.9348 1.3120 0.2122 0.2091 3.9390 0.0855 0.0740 2.5682 2.7949
A16 0.4477 0.4034 0.4546 0.4110 0.7495 0.7579 0.5264 0.6869 0.6746 A20 0.6927 0.4173 0.3876 0.3799 0.6813 0.6370 0.4913 0.6630 0.6591 A24 0.9463 1.5538 0.8456 0.7822 0.8975 0.7410 0.9723 1.2302 1.2821 B0 0.8352 0.8613 0.7263 0.9924 1.3744 1.1083 0.9250 1.1236 1.1389 B2 0.6837 0.4195 0.3860 0.8367 0.8733 2.3831 0.6357 0.7400 0.8253 B4 0.9574 0.5260 0.4353 1.0405 0.5329 0.9459 3.3199 0.9874 1.2051
B16 1.8263 3.3434 0.1244 0.0827 1.4452 0.0912 0.0904 2.6532 3.0644 B24 0.5749 0.7209 0.3769 0.6835 0.5374 0.4404 0.5596 0.6498 0.6452
Mean 0.8123 0.8687 0.3613 0.4888 0.9678 0.8457 0.8080 1.0393 1.1038 Ratio 2.4 3.8 2.3 2.1 4.1 2.8 4.1 2.6 2.8
Table B10 Peak loads recorded by each loadcell during drop testing of net 24, new knotless polypropylene (Type 2) with single strand defects at attachment point, secured at 1 m attachments Drop 1 2 3 4 5 6 7 8 9 10 11 12 Posn Ce L(f) C(fl) S(l) L(b) C(br) S(r) Ce Ce Ce Ce Ce File 190207_21 190207_22 190207_23 190207_24 190207_25 190207_26 190207_27 190207_28 190207_29 190207_210 190207_211 190207_212
A0 0.2625 0.2472 0.2211 0.3186 0.3263 0.3716 0.2027 0.2887 0.2472 0.2288 0.2510 0.2963 A2 0.0816 0.1564 0.0969 0.0892 0.1236 2.1639 0.7040 0.1419 0.1487 0.1121 0.1114 0.0999 A4 0.2424 0.2726 0.1812 0.1773 0.3105 0.5374 0.8316 0.2942 0.2540 0.3175 0.2911 0.3701 A6 0.6491 0.6529 0.1816 0.2265 0.4233 0.1778 0.3192 1.0390 0.9911 0.9060 0.9835 0.9759 A8 1.9828 1.2448 0.1000 0.1633 3.5406 0.0374 0.1374 2.2546 3.1010 3.4246 3.4994 2.9178
A16 0.4515 0.3988 0.4928 0.4592 0.6341 0.5929 0.4668 0.5745 0.6112 0.6112 0.6563 0.6120 A20 0.6813 0.3944 0.4463 0.4623 0.5775 0.5554 0.4097 0.6408 0.5737 0.5630 0.5699 0.5661 A24 0.7120 1.0432 0.4770 0.5105 0.7868 0.3800 0.5731 1.0135 1.1028 1.1249 1.1066 1.1844 B0 0.6289 0.5844 0.4794 0.6327 0.8536 1.0523 0.6811 0.9510 1.0078 1.0262 1.0523 1.0592 B2 0.3906 0.3350 0.2863 0.5535 0.7880 3.2601 0.2749 0.3647 0.4462 0.4233 0.4127 0.4279 B4 0.9536 0.6083 0.5552 1.1189 0.6575 0.5183 2.3732 1.1981 1.3335 1.3481 1.5057 1.2620
B16 1.8564 2.6834 0.3702 0.3323 1.9097 0.0719 0.0827 2.0682 3.0412 3.3959 3.2754 3.0976 B24 0.2164 0.2683 0.2087 0.2355 0.2576 0.1453 0.2316 0.3173 0.3249 0.3960 0.3433 0.3356
Mean 0.7007 0.6838 0.3151 0.4062 0.8607 0.7588 0.5606 0.8574 1.0141 1.0675 1.0814 1.0158 Ratio 2.83 3.9 1.8 2.8 4.1 4.3 4.2 2.6 3.0 3.2 3.2 3.0
66
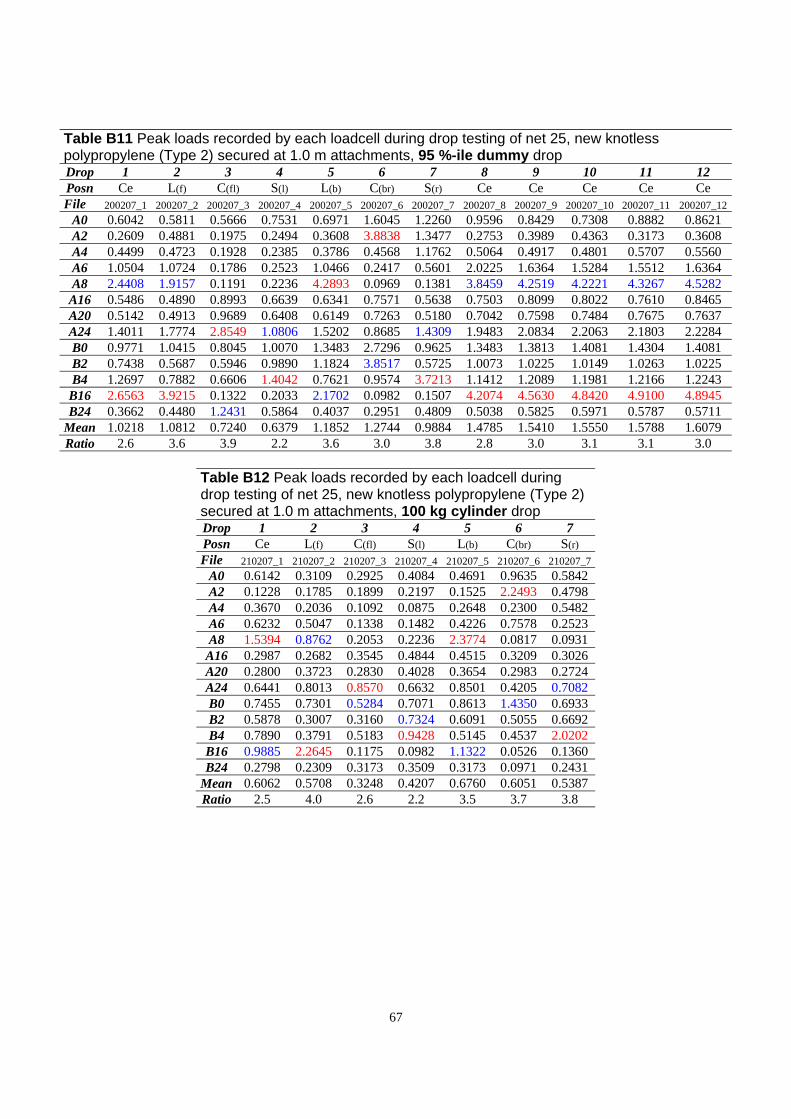
12
Table B11 Peak loads recorded by each loadcell during drop testing of net 25, new knotless polypropylene (Type 2) secured at 1.0 m attachments, 95 %-ile dummy drop Drop 1 2 3 4 5 6 7 8 9 10 11 Posn Ce L(f) C(fl) S(l) L(b) C(br) S(r) Ce Ce Ce Ce Ce File 200207_1 200207_2 200207_3 200207_4 200207_5 200207_6 200207_7 200207_8 200207_9 200207_10 200207_11 200207_12
A0 0.6042 0.5811 0.5666 0.7531 0.6971 1.6045 1.2260 0.9596 0.8429 0.7308 0.8882 0.8621 A2 0.2609 0.4881 0.1975 0.2494 0.3608 3.8838 1.3477 0.2753 0.3989 0.4363 0.3173 0.3608 A4 0.4499 0.4723 0.1928 0.2385 0.3786 0.4568 1.1762 0.5064 0.4917 0.4801 0.5707 0.5560 A6 1.0504 1.0724 0.1786 0.2523 1.0466 0.2417 0.5601 2.0225 1.6364 1.5284 1.5512 1.6364 A8 2.4408 1.9157 0.1191 0.2236 4.2893 0.0969 0.1381 3.8459 4.2519 4.2221 4.3267 4.5282
A16 0.5486 0.4890 0.8993 0.6639 0.6341 0.7571 0.5638 0.7503 0.8099 0.8022 0.7610 0.8465 A20 0.5142 0.4913 0.9689 0.6408 0.6149 0.7263 0.5180 0.7042 0.7598 0.7484 0.7675 0.7637 A24 1.4011 1.7774 2.8549 1.0806 1.5202 0.8685 1.4309 1.9483 2.0834 2.2063 2.1803 2.2284 B0 0.9771 1.0415 0.8045 1.0070 1.3483 2.7296 0.9625 1.3483 1.3813 1.4081 1.4304 1.4081 B2 0.7438 0.5687 0.5946 0.9890 1.1824 3.8517 0.5725 1.0073 1.0225 1.0149 1.0263 1.0225 B4 1.2697 0.7882 0.6606 1.4042 0.7621 0.9574 3.7213 1.1412 1.2089 1.1981 1.2166 1.2243
B16 2.6563 3.9215 0.1322 0.2033 2.1702 0.0982 0.1507 4.2074 4.5630 4.8420 4.9100 4.8945 B24 0.3662 0.4480 1.2431 0.5864 0.4037 0.2951 0.4809 0.5038 0.5825 0.5971 0.5787 0.5711
Mean 1.0218 1.0812 0.7240 0.6379 1.1852 1.2744 0.9884 1.4785 1.5410 1.5550 1.5788 1.6079 Ratio 2.6 3.6 3.9 2.2 3.6 3.0 3.8 2.8 3.0 3.1 3.1 3.0
Table B12 Peak loads recorded by each loadcell during drop testing of net 25, new knotless polypropylene (Type 2) secured at 1.0 m attachments, 100 kg cylinder drop Drop 1 2 3 4 5 6 7 Posn Ce L(f) C(fl) S(l) L(b) C(br) S(r) File 210207_1 210207_2 210207_3 210207_4 210207_5 210207_6 210207_7
A0 0.6142 0.3109 0.2925 0.4084 0.4691 0.9635 0.5842 A2 0.1228 0.1785 0.1899 0.2197 0.1525 2.2493 0.4798 A4 0.3670 0.2036 0.1092 0.0875 0.2648 0.2300 0.5482 A6 0.6232 0.5047 0.1338 0.1482 0.4226 0.7578 0.2523 A8 1.5394 0.8762 0.2053 0.2236 2.3774 0.0817 0.0931
A16 0.2987 0.2682 0.3545 0.4844 0.4515 0.3209 0.3026 A20 0.2800 0.3723 0.2830 0.4028 0.3654 0.2983 0.2724 A24 0.6441 0.8013 0.8570 0.6632 0.8501 0.4205 0.7082 B0 0.7455 0.7301 0.5284 0.7071 0.8613 1.4350 0.6933 B2 0.5878 0.3007 0.3160 0.7324 0.6091 0.5055 0.6692 B4 0.7890 0.3791 0.5183 0.9428 0.5145 0.4537 2.0202
B16 0.9885 2.2645 0.1175 0.0982 1.1322 0.0526 0.1360 B24 0.2798 0.2309 0.3173 0.3509 0.3173 0.0971 0.2431
Mean 0.6062 0.5708 0.3248 0.4207 0.6760 0.6051 0.5387 Ratio 2.5 4.0 2.6 2.2 3.5 3.7 3.8
67

13 APPENDIX C – PHASE 3 - LOAD ANALYSIS
Details of the nets tested in Phase 3 are shown in Table C1. These nets had all been removed from service and a damage survey is included with the net details.
Details of the peak load and displacement recorded and the resulting calculated energy for the Phase 3 mesh tests are shown in Table C2.
Table C1 Damage survey for phase 3 used nets No Serial No. No. of Range of Sum of Notes
damage individual damage locations damage (cell) (cells)
27 001980/24504 13 2 - 4 24 Includes 2 frayed strands and 6x4 area with multiple breaks
28 002770/26970 12 2 - 6 27 Includes a frayed strand and 8x3 area with multiple breaks
29 001390/53735 8 2 - 12 57 30 0002160/5276 3 2 - 6 8 Includes a frayed strand 31 003860/2197 14 2 - 20 80 Includes an 8x5 area with multiple breaks 32 24526 5 2 -8 16 Includes 2 frayed strands 33 53915 11 2 - 6 35 Includes 4 frayed strands 34 000540/168911 3 1 - 2 3 Includes selvage damage and repair 35 002000/168876 2 1 -16 17 Includes selvage damage
Table C2 Peak load, displacement and energy to failure for static mesh testing of used nets No Serial No. Sample Description Peak Max. disp Energy to
No. Load (m) failure (kJ) (kN)
12 0226295 0226295-1 New Test meshes 2.7917 0.0601 0.0526 0226295-2 2.8067 0.0676 0.0555
23 059766 059766-1 New Test meshes 2.9533 0.0855 0.0758 059766-2 2.8150 0.0836 0.0837 059766-3 2.9483 0.0850 0.0804
27 001980/24504 24504-1 Test meshes 2.2117 0.0430 0.0363 24504-2 2.5817 0.0534 0.0522
27/1 Centre 2.0717 0.0527 0.0381 27/2 2.3800 0.0564 0.0489 27/3 Adjacent to damage 2.2583 0.0540 0.0439
28 002770/26970 26970-1 Test meshes 2.3600 0.0545 0.0549 26970-2 2.2233 0.0647 0.0560
28/1 Centre 2.6367 0.0609 0.0575 28/2 Adjacent to damage 2.7583 0.0651 0.0639 28/3 Corner 2.5367 0.0655 0.0556
29 001390/53735 53735-1 Test meshes 2.2567 0.0546 0.0417 53735-2 1.8167 0.0501 0.0308 53735-3 2.3450 0.0570 0.0483
29/1 Centre 2.4183 0.0581 0.0521 29/2 Adjacent to damage 2.7367 0.0600 0.0582 20/3 Centre of short edge 2.4500 0.0593 0.0582
68
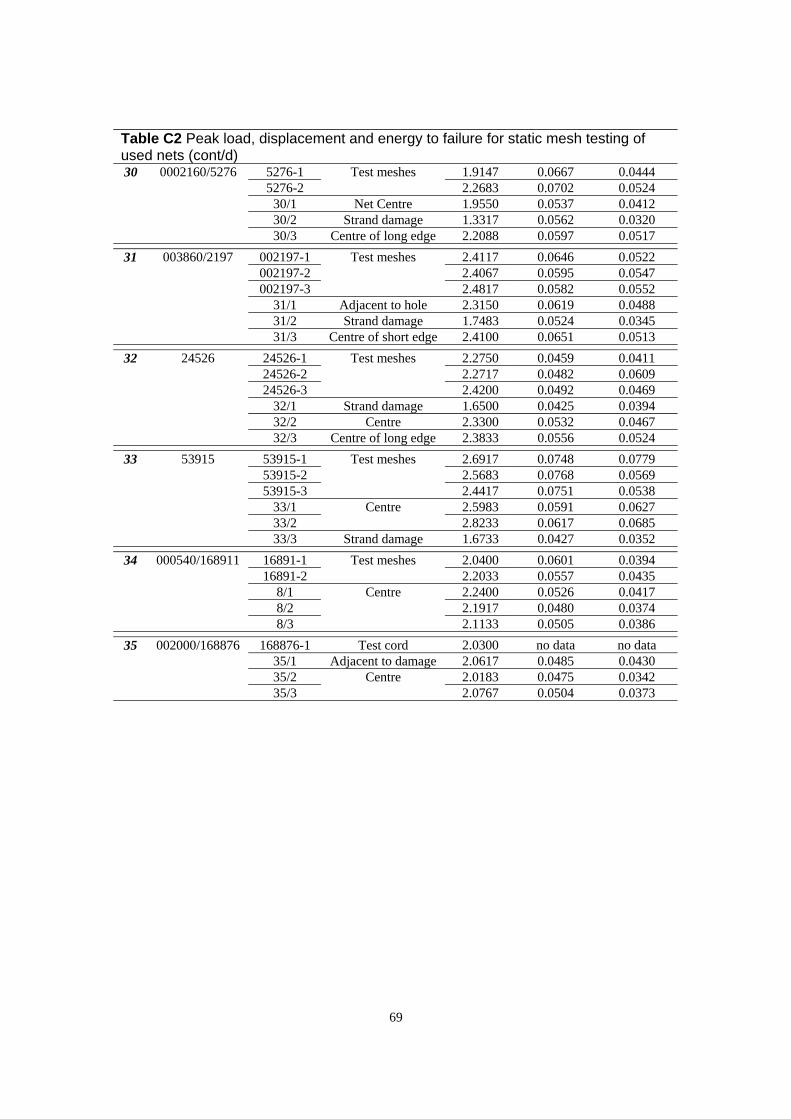
Table C2 Peak load, displacement and energy to failure for static mesh testing of used nets (cont/d) 30 0002160/5276 5276-1 Test meshes 1.9147 0.0667 0.0444
5276-2 2.2683 0.0702 0.0524 30/1 Net Centre 1.9550 0.0537 0.0412 30/2 Strand damage 1.3317 0.0562 0.0320 30/3 Centre of long edge 2.2088 0.0597 0.0517
31 003860/2197 002197-1 Test meshes 2.4117 0.0646 0.0522 002197-2 2.4067 0.0595 0.0547 002197-3 2.4817 0.0582 0.0552
31/1 Adjacent to hole 2.3150 0.0619 0.0488 31/2 Strand damage 1.7483 0.0524 0.0345 31/3 Centre of short edge 2.4100 0.0651 0.0513
32 24526 24526-1 Test meshes 2.2750 0.0459 0.0411 24526-2 2.2717 0.0482 0.0609 24526-3 2.4200 0.0492 0.0469
32/1 Strand damage 1.6500 0.0425 0.0394 32/2 Centre 2.3300 0.0532 0.0467 32/3 Centre of long edge 2.3833 0.0556 0.0524
33 53915 53915-1 Test meshes 2.6917 0.0748 0.0779 53915-2 2.5683 0.0768 0.0569 53915-3 2.4417 0.0751 0.0538
33/1 Centre 2.5983 0.0591 0.0627 33/2 2.8233 0.0617 0.0685 33/3 Strand damage 1.6733 0.0427 0.0352
34 000540/168911 16891-1 Test meshes 2.0400 0.0601 0.0394 16891-2 2.2033 0.0557 0.0435
8/1 Centre 2.2400 0.0526 0.0417 8/2 2.1917 0.0480 0.0374 8/3 2.1133 0.0505 0.0386
35 002000/168876 168876-1 Test cord 2.0300 no data no data 35/1 Adjacent to damage 2.0617 0.0485 0.0430 35/2 Centre 2.0183 0.0475 0.0342 35/3 2.0767 0.0504 0.0373
69

14 APPENDIX D - MOTION ANALYSIS OF TESTING AT BORIS NETS
On 26th November 2002, prior to commencing the work covered by this report. HSL were invited to attend a demonstration of drop testing at Boris Nets, Fleetwood, Lancashire by John Howard. Field Engineering attended with Visual Presentation Services (VPS), HSL, who provided high-speed video for these tests.
Two nets were tested and both were supplied Boris Nets. Net 1 was manufactured by Boris Nets, however, the manufacturer of net 2 was not made known to HSL. There were no details of the service history of either net and they were both assumed to be new and unused. Details of the tests are given in Table D1.
Table D1 Details of tests carried out at Boris Nets Net type Ties Drop Notes Frame
height Speed 1 Knotted Nylon B 2.7 m 3 m 4500 2 B2 specification 6 m Repeat drop 2250 3 3m Net retensioned. Repeat drop. Sphere + 2 x 100kg bags 2250 4 Knotless Polypropylene 2.7 m 3 m Net gathered at one edge 2250 5 A1 specification 6 m Repeat Drop. Penetration 2250
The test frame was a simple structure enclosing a nominal 7 m by 5 m void. The frame did not incorporate specific attachment points (or capacity for load measurement) and the test net was simply tied to the frame using the attached ropes. An overhead crane was capable of dropping a test mass on the centre of the net from heights of up to 6 m.
The test mass was a concrete filled copper sphere, based on the requirements of BS EN 1263-1. This sphere measured nominally 500 mm in diameter and weighed 106 kg. Test 3 employed two additional drop masses, these were two canvas bags filled with chain and each weighing 100 kg. Bag dimensions were not known.
High speed video was recorded for each drop and the footage was analysed using Optimas video tracking software. The diameter of the sphere was used as a reference for calculating displacement.
The motion of the sphere entering the net and during the first bounce is shown in Figure D1. After the first test, it was necessary to reduce the frame speed to enable the capture of one full bounce. For ease of comparison, all traces were manually zeroed at the point where the sphere entered the net.
Details of the motion of the sphere are summarised in Table 2. The drop test was characterised by a substantial dynamic displacement. The greatest displacement occurred when using the heaviest drop mass, there was 2.68 m displacement during test 3 when over 300 kg of test mass was dropped into the net. This provides confirmation of the FASET guidance that a clear space equal to at least half of the narrowest dimension should be present under a suspended net to allow for deformation on loading.
70

0.0 0.5 1.0 1.5 Time (s)
Figure D1 Motion of the sphere on entering the net
Dis
plac
emen
t (m
m)
-3000
-2000
-1000
0
1000
2000
3000
Test 1 Test 2 Test 3 Test 4 Test 5
Net level
Table D2 Results of video analysis Net type Estimated Estimated Estimated Estimated Estimated
Entry Max disp. time to max max ht of onset of Velocity of net disp. bounce deceleration
1 Knotted Nylon B 8.98 m/s 2.13 m 0.353 s - - 1.81 m 2 B2 specification 8.98 m/s 2.11 m 0.249 s + 0.26 m - 1.71 m 3 8.79 m/s 2.68 m 0.474 s - 1.04 m - 2.15 m 4 Knotless Polypropylene 8.00 m/s 2.48 m 0.378 s -1.00 m -2.11 m 5 A1 specification 10.06 m/s 1.62 m 0.183 s - - 1.14 m
After each initial impact there was a substantial rebound of the dropped mass. During test 2, where the test mass was dropped from 6 m it rebounded a height of 2.37 m for drop 2. Initial impacts were subsequently followed by secondary bounces of decreasing magnitude until the sphere reached an equilibrium position at a much lower static displacement. Secondary bounces were not recorded using high speed video.
All of the nets underwent substantial displacement before the sphere began to decelerate. The position of the onset of deceleration was calculated from gradient changes in the displacement against time traces shown in Figure D1. Analysis of the footage from these tests indicates that a net undergoes between 80 to 85% of its displacement before appreciable deceleration begins. The only exception to this was test 5, where the sphere penetrated the net.
The delayed onset of deceleration is further illustrated in Figure D2. This shows a series of still images taken from the high speed footage of test 2. Images were taken at 50 frame intervals and the position of the test sphere marked each time, giving a “displacement step”. Differences between the displacement step began on the eight frame and were clearly apparent on the ninth and tenth frames.
71
2.0

Figure D2 High speed video frames indicating movement of the drop mass entering the net during test 2 (images at 50 frame intervals).
72
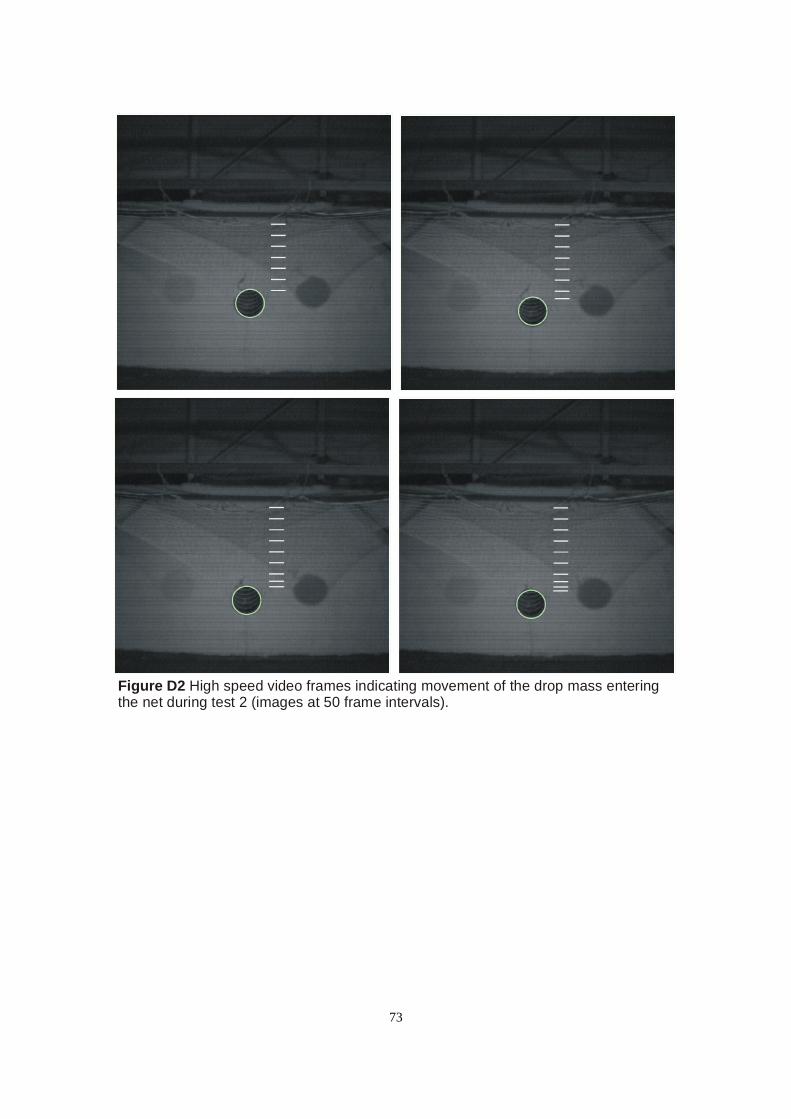
Figure D2 High speed video frames indicating movement of the drop mass entering the net during test 2 (images at 50 frame intervals).
73

Published by the Health and Safety Executive 05/11

Health and Safety Executive
Evaluation of safety nets by experiment
Safety nets have become a common means of providing collective protection, particularly in construction, to mitigate the effects of falls where it is impractical to use temporary edge protection. The reason for carrying out the research was to explore issues where there was doubt/concern about the performance of safety nets and their attachments. This research evaluated the effectiveness of safety nets, as used in the UK, to identify the risk (if any) of premature failure, in less than idea conditions that could occur in the use. A series of non-ideal loading conditions involving a range of variables were conducted. These included:
nnet type; ndifferent impact locations (ie edge and corner); nattachment point spacing; nrepeated dynamic loading at one position in the
net; nmultiple falls; neffect of sag in the net and industry practice to
control sag; npresence of defects; neffect of differently shaped objects falling into
net; and neffects of aging and degradation from ongoing
service damage and the effectiveness of test meshes in monitoring degradation.
The UK safety net industry supported the research by providing nets.
This report and the work it describes were funded by the Health and Safety Executive (HSE). Its contents, including any opinions and/or conclusions expressed, are those of the author alone and do not necessarily reflect HSE policy.
RR835
www.hse.gov.uk