Evaluation of Performance and Maximum Length of Continuous ...
130
Evaluation of Performance and Maximum Length of Continuous Decks in Bridges – Part 1 Final Report Prepared for Office of Materials and Research Georgia Department of Transportation GDOT Research Project No. 09-07 Task Order No. 02-64 by Katherine Snedeker, Donald White, and Lawrence Kahn June 2011 School of Civil and Environmental Engineering
Transcript of Evaluation of Performance and Maximum Length of Continuous ...

Evaluation of Performance and Maximum Length of Continuous Decks in Bridges – Part 1
Final Report
Prepared for
Office of Materials and Research Georgia Department of Transportation
GDOT Research Project No. 09-07
Task Order No. 02-64
by
Katherine Snedeker, Donald White, and Lawrence Kahn
June 2011
School of Civil and Environmental Engineering

i
Contract Research
GDOT Research Project No. 09-07
Task Order No. 02-64
Evaluation of Performance and Maximum Length of
Continuous Decks in Bridges
Part 1
Draft Final Report
Prepared for
Office of Materials and Research
Georgia Department of Transportation
By
Katherine Snedeker, Donald White, and Lawrence Kahn
June 2011
The contents of this report reflect the views of the authors who are responsible for the facts and
the accuracy of the data presented herein. The contents do not necessarily reflect the official
views or policies of the Georgia Department of Transportation. This report does not constitute a
standard, specification or regulation.

ii
Executive Summary
The purpose of this research was to evaluate the performance history of continuous
bridge decks in the State of Georgia, to determine why the current design detail works, to
recommend a new design detail, and to recommend the maximum and/or optimum lengths of
continuous bridge decks. The continuous bridge decks have continuous reinforcement over the
junction of two edge beams with a construction joint for crack control. The current technical
literature and current practices and design procedures were synthesized and summarized. GDOT
maintenance reports were reviewed, and preliminary field evaluations were conducted to
determine the performance of the continuous deck detail. The effects of bridge movement due to
thermal strains, shrinkage, and live loads were considered in simplified analytical studies to
better understand the demands placed on the GDOT continuous deck detail. A summary of the
preliminary design and length recommendations are provided upon completion of Part 1 of the
research.

iii
Acknowledgements
The research reported herein was sponsored by the Georgia Department of Transportation
through Research Project Number 09-07, Task Order Number 02-64. Mr. Paul Liles, Mr. Mike
Clements, Ms. Melissa Harper, Ms. Lyn Clements, and Mr. Kerry Wood of the Georgia
Department of Transportation provided invaluable assistance and information; Ms. Harper was
especially helpful in conducting site visits and discussing construction procedures. Mr. Roy H.
“Buddy” Jump of C.W. Matthews also helped in providing information and discussing his
experience in constructing continuous bridge decks. Ms. Supriya Kamatkar carefully oversaw the
research and reviewed the reports. Mr. Eric Davidson assisted with the research and is
continuing the research in Part 2 of the investigation. The opinions and conclusions expressed
herein are those of the authors and do not represent the opinions, conclusions, policies, standards
or specifications of the Georgia Department of Transportation or of other cooperating
organizations.

iv
Table of Contents
Page
Executive Summary ii
Acknowledgements iii
Table of Contents iv
List of Symbols and Abbreviations vii
Chapter
1 Introduction 1
1.1 Purpose and Objective 1
1.2 Problem Statement 1
1.3 GDOT Continuous Deck Detail, Description and History 3
2 Literature Review 13
2.1 Introduction 13
2.2 General Design Information 13
2.2.1 Russell and Gerken, 1994 13
2.2.2 Thippeswamy, GangaRao, and Franco, 2002 14
2.3 Link Slab Design 15
2.3.1 Caner and Zia, 1998 15
2.3.2 Wing and Kowalsky, 2005 20
2.3.3 Okeil and ElSafty, 2005 24
2.4 Other Designs 26
2.4.1 Bridge, Griffiths, and Bowmaker, 2005 26

v
2.4.2 Other DOT Designs 27
2.5 Thermal Behavior of Bridges 31
2.4.2 Roeder, 2002 31
2.4.2 Hulsey, 1992 34
3 Deck Evaluation 37
3.1 GDOT Maintenance Report Findings 37
3.2 Field Observations 40
3.2.1 Construction Joints 40
3.2.2 Expansion Joints 45
4 Analysis of Continuous Deck Detail 49
4.1 Beam Theory Calculations 49
4.1.1 Shrinkage Strain Calculations 54
4.1.2 Temperature Gradient Calculations 58
4.1.3 Live Load Calculations and Results 63
4.2 Rigid Body Mechanics Explanation 68
4.2.1 Rigid Body Model 68
4.2.2 Rigid Body Mechanics Discussion 75
4.2.3 Rigid Body Mechanics Conclusion 81
4.3 Flexural Strain Discussion 82
4.3.1 Uncracked Deck Section 83
4.3.2 Cracked Deck Section 89
4.3.2.1 Uniform Shrinkage Cracked Section 89
4.3.2.2 Restrained Shrinkage Cracked Section 91
4.3.2.3 Shrinkage Plus Increased Camber from Creep Section 92
4.3.2 4 Flexural Strain Conclusion 93

vi
4.4 Uniform Temperature Change Discussion 94
4.5 Conclusion 98
5 Cost Analysis 99
5.1 Cost Analysis 99
6 Preliminary Conclusions and Design Recommendations 102
6.1 Preliminary Conclusions 102
6.1.1 Performance History 102
6.1.2 Current Practices 103
6.1.3 Current Continuous Deck Detail Analysis 104
6.1.4 Length Recommendations 104
6.2 Preliminary Design Recommendations 105
6.2.1 Reinforcement Layout 105
6.2.1 Reinforcement Layout Discussion 108
7 Further Research for Part 2 110
Appendix A: Deck Reinforcement Spacing and Ratios 113
Appendix B: Recommended Standard Construction Joint Header 116
References 118

vii
List of Symbols and Abbreviations
A area
Ai area of layer i
As area of steel reinforcement
b unit width of slab, width of compression zone of concrete
d depth of concrete element, thickness of slab
di depth of element i
E elastic modulus
Ec elastic modulus of concrete
Edeck elastic modulus of bridge deck
Ei elastic modulus of layer/material i
Es elastic modulus of steel
fci’ initial compressive strength of concrete
fcon stress in concrete
fs stress in steel
fy yield stress of steel
h height to mid-thickness of the deck

viii
i layer number or material number
I second moment of area of cross section about the elastic
centroidal axis for the entire section
iI second moment of area for the element i
Lbridge total length of bridge
L girder length
m number of materials
n number of layers or material number
T tension force
Tai temperature at the element centroid
Tinstall design installation temperature
TMaxAir maximum daily air temperature from previous day
TMaxDesign maximum design temperature for region
TMinAir previous night’s minimum temperature
TMinDesign minimum design temperature for region
Total Movement Δ total design movement for expansion joints
x change in length
yi distance to neutral axis from layer i

ix
α coefficient of thermal expansion
Δ deflection
Δg design movement for elastomeric bearings
ΔL change in length
ΔTi temperature difference between the bottom and top of the
element
ε strain
ε0 initial strain
εc strain in concrete
εrd tensile rupture strain
εys yield strain of steel
εs strain in steel
εsh 10,000 day shrinkage strain
εus ultimate strain value of 0.05 used by Wang and Teng
ρ reinforcement ratio, As/bd
θ end rotation
σinit initial stress

x
σrd tensile rupture stress
σu tensile stress in concrete deck
σys yield stress of steel

1
1. Introduction
1.1 Purpose and Objectives
The purpose of this project was to evaluate the performance history of continuous
bridge decks in the State of Georgia, determine details that have proven to work best, to
understand why the current design detail works, and to recommend the maximum and/or
optimum lengths of continuous bridge decks utilizing these details.
To accomplish this purpose, a three pronged approach was used. The approach
encompassed a review of current practices and technical literature, a review of Georgia
Department of Transportation (GDOT) maintenance reports, field evaluation plus
interviews with GDOT and contractor personnel, and an analytical investigation. The
relevant current practices and technical literature were synthesized and summarized. The
maintenance reports and field evaluations were used to determine the performance
history of the continuous deck detail. For the analytical study, the effects of bridge
movement due to thermal strains, creep and shrinkage, and structural loadings were
considered to better understand the demands placed on the GDOT continuous deck detail.
A cost analysis of the construction costs for the current continuous bridge deck detail and
a one-page summary design sheet implementing the recommendations are also provided.
1.2 Problem Statement
Expansion joints are a recognized problem within the bridge engineering
community. Expansion joints are costly to install and maintain for several reasons.

2
Water leakage through the expansion joints causes deterioration of the surrounding
structure and can also lead to corrosion of reinforcement (Caner and Zia, 1998). Debris
accumulation around the expansion joints restrains movement which may damage the
bridge (Caner and Zia, 1998). The expansion joints reduce the ride quality of the bridges,
and noise reduction measures must be frequently implemented in residential areas
because of the loud noise from the cars riding over the expansion joints (Bridge, et al.
2005). The Georgia Department of Transportation (GDOT) Bridge and Structures Policy
Manual states that expansion joints “are to be kept to a minimum because they always
seem to leak or otherwise cause maintenance problems” (Liles, 2009)
In an effort to avoid the problems associated with expansion joints, the Georgia
Department of Transportation began designing and building jointless bridge decks in
about 1987. The jointless bridge deck design detail limits the number of expansion joints
needed to accommodate the movement of multiple spans of simple-span highway
bridges. Instead of using expansion joints at each of the bridge piers, the design detail
consists of using additional reinforcing bars added to the longitudinal reinforcement of
the bridge deck at these locations with a construction joint for crack control. The
construction joints provide a point over the bridge pier which attempts to localize a crack
to that location. A silicone sealant is used to seal the expected crack and to prevent water
leakage that may cause corrosion of the deck reinforcement. The silicone sealants are
inexpensive and easy to maintain. The construction joint can be resealed if the original
sealant is damaged as a normal maintenance procedure. Figure 1.2.1 shows a detail of
the standard construction joint used in continuous bridge decks by the GDOT.

3
Figure 1.2.1 – Standard construction joint for GDOT continuous deck detail
1.3 GDOT Continuous Bridge Deck Detail, Description and History
The GDOT detail evolved into its current design since it was first introduced in
1987. Mr. Mike Clements of the Bridge Maintenance Office described the history of the
GDOT continuous bridge deck design. He stated that the original design for continuous
decks was based on the design for continuous girder bridges. The design was guided by
the AASHTO provisions for longitudinal reinforcement in a concrete deck which stated
that the total cross-sectional area of the longitudinal reinforcement shall not be less than
1% of the total cross sectional area of the deck (AASHTO, 1990). The amount of
reinforcement calculated for the longitudinal reinforcement across the joint was increased
based on the design for heavily reinforced concrete beams and slabs to a reinforcement
ratio ρ = 2%. When using this 2% reinforcement ratio for designing a slab for moment
capacity, with a width b = 12 inches and thickness d = 6 inches, the 2% would give an
area of steel of 1.44 in.2/ ft width or #7 bars at 6 inches on-center spacing. One-half of
½ in.
¼ in. radius
¼ in.
1.5 in.

4
this amount would yield #7 bars at 10 inches or #6 bars at 4 inches on-center. Two-thirds
of the reinforcement would be placed in the top layer, and one-third of the reinforcement
would be placed in the bottom layer of reinforcement, as specified in the AASHTO
(1990) Section 3.24.10.
The resulting continuous deck design detail based on these decisions was two #7
bars at a length of 20 ft between the #4 bars in the top layer of reinforcement as
illustrated in Figure 1.3.1. The AASHTO (1990) Section 3.24.10 Distribution
Reinforcement was used to determine the spacing of the #4 longitudinal and transverse
deck reinforcement. AASHTO (1990) Section 3.24.10 states:
“3.24.10 To provide for the lateral distribution of the concentrated live loads,
reinforcement shall be placed transverse to the main steel reinforcement in the
bottoms of all slabs except culvert or bridge slabs where the depth of fill over the
slab exceeds 2 feet.
3.24.10.2 The amount of distribution reinforcement shall be the percentage of the
main reinforcement steel required for positive moment as given by the following
formulas:
For main reinforcement parallel to traffic,
Percentage = 100/√S, Maximum 50% (3-21)
For main reinforcement perpendicular to traffic,
Percentage = 220/√S, Maximum 67% (3-22)
where S = the effective span length in feet.
3.24.10.3 For main reinforcement perpendicular to traffic, the specified amount of
distribution reinforcement shall be used in the middle half of the slab span, and
not less than 50 percent of the specified amount shall be used in the outer quarters
of the slab span.”
In the original design, both the #4 and #7 bars were continuous over the joint. An
extra #4 bar was added in the bottom mat of longitudinal reinforcement. Based on
AASHTO (1990) Specification 3.24.10, it is assumed that the #4 bar was placed in the
middle half of the slab span. Figure 1.3.1 is a plan view of an example continuous deck

5
bridge with the #4 bars and two 20-ft long #7 bars crossing over the construction joint.
Figure 1.3.2 is a section view of an example bridge deck over an intermediate bent at a
construction joint. It shows the layout of the #7 and #4 longitudinal reinforcing bars.
The #7 bars are grey circles, and the #4 bars are black circles.
As an example for stringer spacing of the 7-ft on-center (S = 7’-0”), and an 8-inch
thick deck, the #4 bottom longitudinal bars would be spaced at 18-inches o.c. in the 50%
width between stringers while the top #4 bars would be spaced at 14-inches o.c. The
spacing in the quarter spans of the bottom layer would be 10.5-inches o.c. The
reinforcement ratio ρ for the #4 top and bottom layer longitudinal bars is 0.0031. The
resulting #7 bar average spacing would be 3.5-inches o.c. giving a total reinforcement
area per ft of 2.06 in.2/ft and a joint reinforcement ratio of ρ = 0.257. Table A.1 contains
a table of the reinforcement spacing and reinforcement ratios for the #4 and #7 bars for
span lengths ranging from 5 feet to 10 feet in 0.5 feet increments.
Complaints from the contractors regarding the time and labor needed to construct
the detail led to the first modification in the late 1980’s. The #4 bar deck reinforcement
was stopped 2 inches from the joint, and the additional #4 bar in the bottom mat of
longitudinal reinforcement was removed. The #7 bar joint reinforcement was also
replaced with #6 bars. The final modification occurred in the early 1990’s. The length of
the #6 bars was decreased to 10 ft, 5 ft on each side of the joint. This design remains the
current design detail: two #6 bars, 10-ft long at the level of the top mat spaced between
the #4 bars in the top layer of deck reinforcement; the top and bottom #4 bars terminate
two inches from each joint. The AASHTO (1990) Section 3.24.10 is still used to
determine the spacing of the reinforcement in each layer. Figure 1.3.3 is a plan view of

6
an example continuous bridge deck with the #4 bars stopped 2 inches from the
construction joint and two 10-ft long #6 bars crossing over the construction joint. Figure
1.3.4 is a section view of an example bridge deck over an intermediate bent at a
construction joint. It shows the layout of the #6 and #4 longitudinal reinforcement bars.
The #6 bars are grey circles, and the #4 bars are black circles.

7
Figure 1.3.1 - Plan view of continuous bridge deck with #7 and #4 longitudinal reinforcement bars circa 1987 (modified from
GDOT SR 46 Over Oconee R. plan)
CL
BEAM
6
REQ’D CONST.
JT. IN DECK
AT BENT
10” DIAPHRAGM
(TYP.)
EXP. JT.
IN DECK
AT BENT
REQ’D CONST.
JT. IN DECK
AT BENT CL
BEAM
1
CL
BEAM
5
CL
BEAM
3 CL
BEAM
4
CL
BEAM
2
2 #4 bars
continuous over
joint (TYP.)
10’-0”
(TYP.)
2 #7 bars x
20’-0” (TYP.)

8
Figure 1.3.2 – Section view through an intermediate bent at a construction joint
with reinforcement layout circa 1987 (modified from GDOT SR 46 Over Oconee R. plan)
#4 longitudinal
bars, bottom
layer
S
#4 longitudinal
bars, top layer
2 #7 Longitudinal Bars
between #4 Bars

9
Figure 1.3.3 - Plan view of current continuous bridge deck (modified from GDOT SR 46 Over Oconee R. plan)
CL
BEAM
6
10” DIAPHRAGM
(TYP.)
REQ’D CONST.
JT. IN DECK AT
BENT
EXP. JT.
IN DECK
AT BENT
REQ’D CONST.
JT. IN DECK
AT BENT
CL
BEAM
4
CL
BEAM
2
2 #4 bars stopped
2 in. from joint
(TYP.)
5’-0”
(TYP.)
2 #6 bars x
10’-0” (TYP.)
CL
BEAM
1
CL
BEAM
5
CL
BEAM
3

10
Figure 1.3.4 – Section view at construction joint of current design detail (modified
from GDOT SR 46 Over Oconee R. plan)
GDOT currently uses expansion joints in bridges that are approximately 400 ft
long (Liles, 2009). For bridges that are longer than 400 ft., expansion joints are
“unavoidable” and “common” (Liles, 2009). The Evazote expansion joints are preferred
by the GDOT for continuous bridge decks (Liles, 2009 and WBA, 2007). Figure 1.3.5 is
an example of the reinforcement layout in a continuous bridge deck. The two #6 bars are
between the #4 bars which stop 2 inches from the joint on each side. The transverse
reinforcement is also shown along with the joint filler placed in between the ends of the
edge beams. The bridge is located along US 27 at SR-1 Cedartown Bypass.
#4 longitudinal
bars, bottom
layer
S
#4 longitudinal
bars, top layer
2 #6 Longitudinal Bars
between #4 Bars

11
Figure 1.3.5 – Current GDOT continuous bridge deck design detail (bridge supporting
US 27 at SR-1, Cedartown Bypass)
Figure 1.3.6 is of an overall view of the continuous bridge deck reinforcement of
the bridge supporting US 27 at SR-1, Cedartown Bypass. The longitudinal reinforcement
is clearly visible with the pairs of #6 bars crossing over the joint between the edge beams.
The joint filler and transverse reinforcement are also shown. For skewed bridges, the
transverse as well as the longitudinal reinforcement must be terminated 2 inches from the
joint location.
#4 Bar Top
Mat
Longitudinal
Reinforcement
#6 Bar Joint
Reinforcement
Transverse
Reinforcement
for Edge Beam
Joint Filler,
typ. 1.5 in.
– 3 in.
thick

12
Figure 1.3.6 – Expanded view of current GDOT continuous bridge deck design detail
(bridge supporting US 27 at SR-1, Cedartown Bypass
#6 Bar Joint
Reinforcement
Transverse
Reinforcement
for Edge Beam
#4 Bar Top
Mat
Longitudinal
Reinforcement
Joint Filler,
typ. 1.5 in.
– 3 in.
thick

13
2. Literature Review
2.1 Introduction
Continuous bridge deck details are used throughout the United States of America.
Russell and Gerken summarized a 1987 Federal Highway Administration (FHWA) and a
Prestressed Concrete Institute survey completed circa 1994 (Russell and Gerken, 1994).
28 states stated that they were using jointless bridges in the FHWA report, and 32 states
reported using jointless bridges with prestressed concrete girders and integral abutments.
Hulsey surveyed states about their continuous deck use in 1992 as part of his research
into jointless bridges for the Alaska Department of Transportation (Hulsey, 1992). In
response to his survey, 72.73% of the 44 responding states stated they use continuous
bridge deck designs (Hulsey, 1992). The following literature review summarizes the
relevant research regarding general design considerations for continuous bridge decks,
different designs in use, and temperature effects.
2.2 General Design Information
2.2.1 Russell and Gerken, 1994
In addition to summarizing the 1987 FHWA report and the 1994 PCI survey,
Russell and Gerken’s work focused on the forces which need to be considered when
designing the continuous bridge deck detail for continuous span bridges. How forces
interact between a bridge structure, bearings, and foundation is important to understand
and determine. The forces Russell and Gerken believed to play the larger roles are
temperature, creep, shrinkage, and movement resistance from the bridge, bearings, and

14
the soil and rock at the abutments. Russell and Gerken recommended that the yearly
temperature change between summer and winter as well as the daily effects of the
temperature gradient through the bridge deck should be measured and considered. Creep
and shrinkage effects should be considered in the bridge deck and the girders as well as
how the creep and shrinkage interact with temperature and humidity changes. The
factors restraining the movement of the bridge to be considered are abutment stiffness,
soil pressure, pile capacity, pier stiffness, and positive moment connections in the bridge.
2.2.2 Thippeswamy, GangaRao, and Franco, 2002
Thippeswamy, GangaRao, and Franco worked on a research project focusing on
jointless bridges in West Virginia. The main focus of their project was “to synthesize and
analyze the information on the behavior of jointless bridges for different foundation types
under varying load condition and changing concrete properties with age” (Thippeswamy,
et al., 2002). Five in-service jointless bridges with different foundation types were
analyzed, including spread footings and pile foundations. The bridges had concrete decks
with steel stringers. The five bridges were idealized as 2D frame models and 3D finite
element models for analysis. The loads considered were dead load, dead load plus creep,
live load, temperature gradient, uniform temperature change, uniform shrinkage,
differential shrinkage, and earth pressure. The calculated stresses from the analyses due
to the applied loads were compared between the modeled bridges at three locations: at
mid-span, pier section, and foundation level. A continuous bridge in McKinleyville,
WVA over Buffalo Creek was instrumented and monitored. The McKinleyville bridge
was also a concrete bridge deck with steel stringers. The McKinleyville bridge deck had

15
fiber reinforced polymer rebar and a pile foundation with weak axis orientation (Franco,
1999). The results of the analytical portion were compared to the measurements obtained
from the monitored McKinleyville bridge.
Sixteen conclusions were made after examining the measurements from the
McKinleyville bridge and the five modeled bridges. Several of their conclusions follow.
The dead load, live load, shrinkage, and temperature gradient load combination should be
considered in design. The temperature gradient contributes the most to total stresses.
Summer and winter temperature gradients should be considered, and the winter gradient
induces the worse total moments. Earth pressure caused negligible stresses in the bridge.
Bridges with integral abutments have lower total stresses than those with spread footings,
and spread footings should not be used in jointless bridges. Based on the finite element
models, high tensile stresses were found to occur over piers in the bridge deck with the
highest stresses found in flexible systems rather than the stiffer systems. Pile type
foundations are the more flexible systems, and bridges with spread footing foundations
are the stiffer systems.
2.3 Link Slab Design
2.3.1 Caner and Zia, 1998
Alp Caner and Paul Zia worked on creating a link slab detail for the North
Carolina Department of Transportation’s continuous bridge deck details. They chose to
make their bridge deck continuous with simple span girders. The portion of the deck
connecting the two simple span girders’ adjacent ends is referred to as the link slab. The
link slab was debonded from each girder for a distance of 5% of the girder’s length. The

16
5% debonding length was selected because theoretical studies done by El-Safty (1994)
showed that the load-deflection behavior would remain unchanged if 5% of the girder
length was debonded from the structure. The purpose of debonding the link slab was to
minimize stress developed in the link slab by reducing the stiffness. However, none of
the bridges found in North Carolina were experiencing problems because the link slab
was the same stiffness as the rest of the deck. Experimental data and numerical methods
were used to prove the effectiveness of their link slab design.
Two test specimens were used in the experiment to test the link slab design. One
composite section consisted of a continuously reinforced concrete deck on two simple-
span steel beams, and the other section was a continuously reinforced concrete deck on
two simple-span precast reinforced concrete girders. For the steel girder composite
section, the deck was debonded from the girders by leaving out the shear connectors for
the length of the link slab. The shear connectors were used along the rest of the lengths
of the girders to develop composite action. For the concrete girder composite section, the
concrete deck was debonded from the girders by leaving out the stirrups for the length of
the link slab and by placing two layers of plastic sheets between the deck and the girder.
The testing apparatus applied a point load to the center of each beam. The point
load was increased incrementally to 40% of the estimated ultimate load. Different
support condition configurations were also tested. For the steel beams, the support
configurations were HRRH, RHRH, RRRR, and RHHR. H stands for hinge support, and
R stands for roller support. The support configurations for the concrete beams were
HRRH, RHRH, and RHHR. RRRR is not a configuration likely to be used in practice.
Figures 2.3.1.1 to 2.3.1.4 show the support configurations used in the experiment.
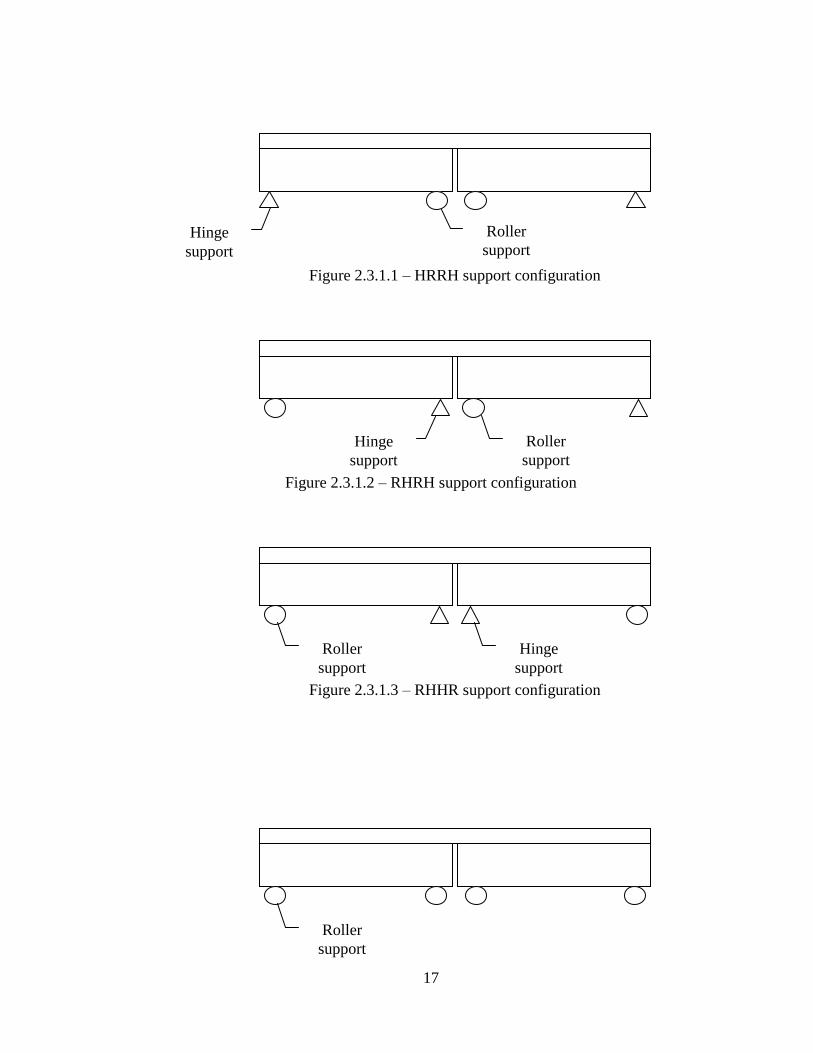
17
Figure 2.3.1.1 – HRRH support configuration
Figure 2.3.1.2 – RHRH support configuration
Figure 2.3.1.3 – RHHR support configuration
Hinge
support
Roller
support
Hinge
support
Roller
support
Roller
support
Hinge
support
Roller
support

18
Figure 2.3.1.4 – RRRR support configuration
The hinge connection was created using a 1.5 inch (38 mm) diameter steel pin
between two 1.5 inch (38 mm) thick bearing plates with V-grooves. The roller
connection was created using the same setup but without the V-grooves in the bearing
plates.
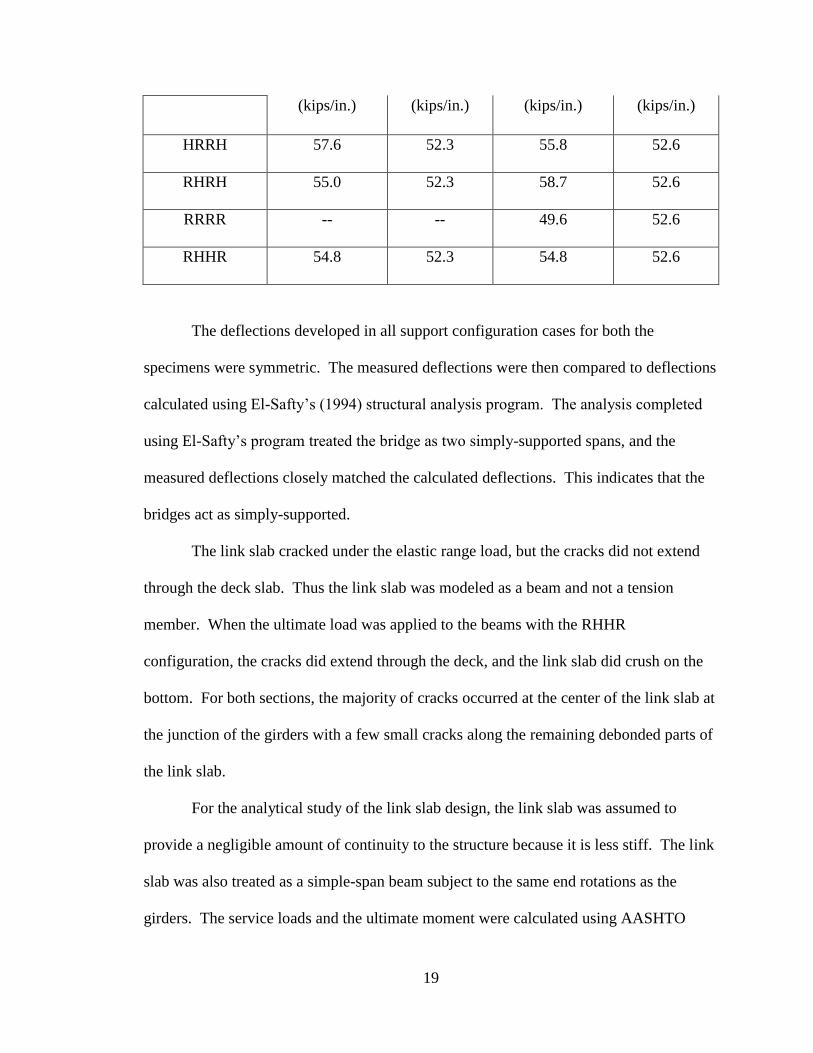
The strains, loads, crack growth, and deflections were collected during each test.
Initially the loads applied were up to 17.4 kips so that the specimens remained within an
elastic range. The resulting slopes of the load-deflection curves for each of these tests are
found in Table 2.3.1.1. For the steel bridge specimen, the theoretical values in the table
were calculated using the average of the moment of inertia for the fully composite section
and the moment of inertia of the steel beam alone. The average of these two values
accounted for the slip between the deck and the steel beam, and it reduced the section
stiffness from that of a fully composite section. Caner and Zia did not believe that the
steel and concrete section acted as fully composite sections. The concrete deck and
girder section was treated as a composite section, and its stiffness was almost the same as
the steel girder section.
Table 2.3.1.1 – Caner and Zia’s slope of load-deflection curve
Support
Configuration
Concrete Bridge Steel Bridge
Experimental Theoretical Experimental Theoretical
19
(kips/in.) (kips/in.) (kips/in.) (kips/in.)
HRRH 57.6 52.3 55.8 52.6
RHRH 55.0 52.3 58.7 52.6
RRRR -- -- 49.6 52.6
RHHR 54.8 52.3 54.8 52.6
The deflections developed in all support configuration cases for both the
specimens were symmetric. The measured deflections were then compared to deflections
calculated using El-Safty’s (1994) structural analysis program. The analysis completed
using El-Safty’s program treated the bridge as two simply-supported spans, and the
measured deflections closely matched the calculated deflections. This indicates that the
bridges act as simply-supported.
The link slab cracked under the elastic range load, but the cracks did not extend
through the deck slab. Thus the link slab was modeled as a beam and not a tension
member. When the ultimate load was applied to the beams with the RHHR
configuration, the cracks did extend through the deck, and the link slab did crush on the
bottom. For both sections, the majority of cracks occurred at the center of the link slab at
the junction of the girders with a few small cracks along the remaining debonded parts of
the link slab.
For the analytical study of the link slab design, the link slab was assumed to
provide a negligible amount of continuity to the structure because it is less stiff. The link
slab was also treated as a simple-span beam subject to the same end rotations as the
girders. The service loads and the ultimate moment were calculated using AASHTO

20
specifications. The structural analysis program used for the project was Jointless Bridge
Deck Link (JBDL) by Alp Caner, and it is a finite element based program (Caner, 1996).
The program checked for cracked sections throughout the duration of the analysis, and it
considered the effects of applied loads, creep, shrinkage, and temperature differentials.
The conclusion Caner and Zia reached was that the girders can be designed as
simple-span beams because the continuity provided by the link was negligible. Link
slabs can replace the interior expansion joints in bridges of up to four spans. The link
slabs should continue to be debonded from the deck for 5% of the length of the girder.
They also suggested that saw cuts be made at the center of each link slab to help control
cracking, and epoxy coated reinforcement or non-metallic reinforcement be used to
minimize the risk of corrosion.
2.3.2 Wing and Kowalsky, 2005
When the North Carolina DOT installed its first bridge designed with Caner and
Zia’s link slab design, Wing and Kowalsky were selected to monitor and assess the
performance of the bridge using remote instrumentation and other analysis methods. The
bridge selected has four spans with steel girders, a concrete deck, and integral abutments.
The bearing configuration and how the deck was debonded from the girders were not
provided. The bridge was split in half, and only one side was instrumented and
monitored. Thus, the first span had an integral abutment at the beginning of its span, and
the second span was free at the opposite end. The debonding length for the link slabs was
5% of the girder length, and it was designed treating each span as a simple-span. The
girder end rotations and temperature variations were recorded during the remote
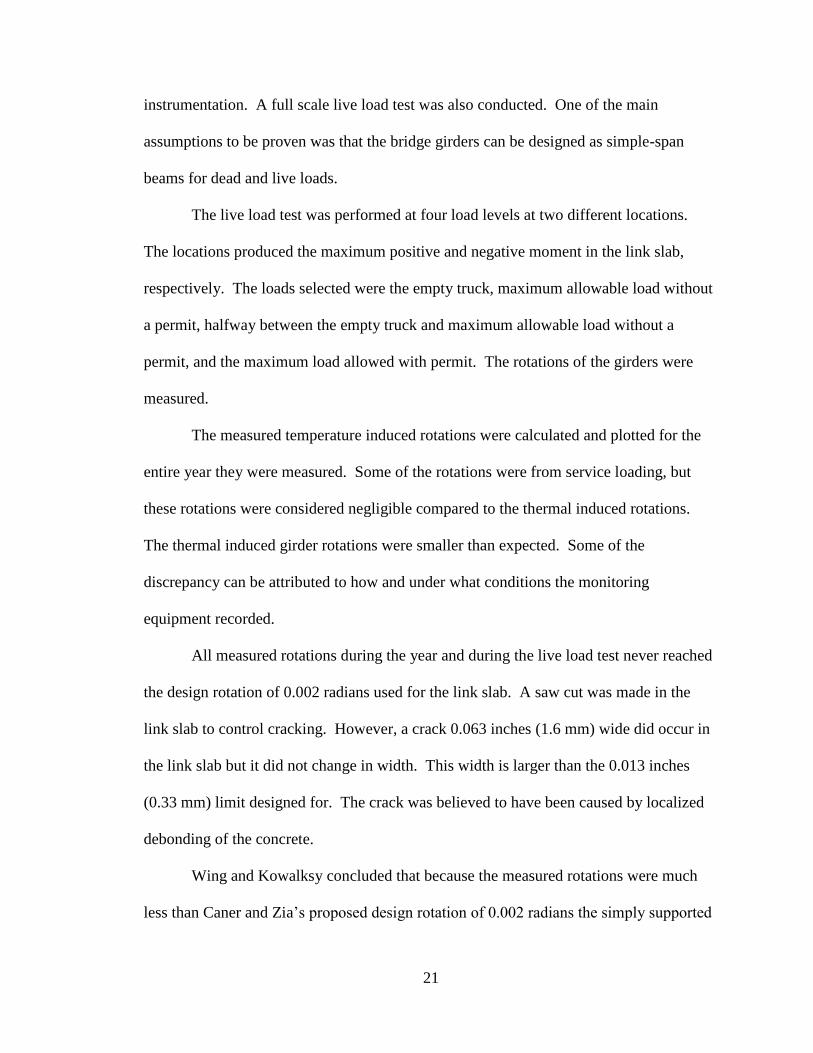
21
instrumentation. A full scale live load test was also conducted. One of the main
assumptions to be proven was that the bridge girders can be designed as simple-span
beams for dead and live loads.
The live load test was performed at four load levels at two different locations.
The locations produced the maximum positive and negative moment in the link slab,
respectively. The loads selected were the empty truck, maximum allowable load without
a permit, halfway between the empty truck and maximum allowable load without a
permit, and the maximum load allowed with permit. The rotations of the girders were
measured.
The measured temperature induced rotations were calculated and plotted for the
entire year they were measured. Some of the rotations were from service loading, but
these rotations were considered negligible compared to the thermal induced rotations.
The thermal induced girder rotations were smaller than expected. Some of the
discrepancy can be attributed to how and under what conditions the monitoring
equipment recorded.
All measured rotations during the year and during the live load test never reached
the design rotation of 0.002 radians used for the link slab. A saw cut was made in the
link slab to control cracking. However, a crack 0.063 inches (1.6 mm) wide did occur in
the link slab but it did not change in width. This width is larger than the 0.013 inches
(0.33 mm) limit designed for. The crack was believed to have been caused by localized
debonding of the concrete.
Wing and Kowalksy concluded that because the measured rotations were much
less than Caner and Zia’s proposed design rotation of 0.002 radians the simply supported

22
span assumption is conservative. They recommended a new crack control criteria be
developed for link slabs with saw cuts that localize the cracking to one location to
determine a larger limit for crack width.
Wing and Kowalsky developed a limit states design approach for the current
crack width limit of 0.013 inches (0.33 mm). Design charts are developed for different
steel ratios based on the link slab geometry. The positive and negative moments are
calculated using the link slab properties and used to determine the stress in the
reinforcement. The reinforcement stress and the estimated cracking width desired are
used to calculate the effective tension area of concrete around the main reinforcement.
The effective tension area is then used to solve for the spacing of the reinforcement. This
procedure is repeated for different link slab geometries, girder end rotations, desired
crack width, and reinforcement ratio to produce charts which provide the reinforcement
amount and spacing. The following tables, Table 2.3.2.1 and 2.3.2.2, are the design
charts produced for the instrumented bridge, in both metric and English units, as an
example. The reinforcement ratio is 0.015. The crack width, w, ranges from 0.010
inches (.25 mm) to 0.04 inches (1.00 mm), and the girder end rotations, θ, range from
0.00075 to 0.003. Designers determine what their final end rotations will be from the
thermal or service loads and the desired crack width. Where the crack width and girder
end rotations intersect provides the amount of steel needed and its spacing. If the area of
reinforcement required is missing, the results were not realistic.
Table. 2.3.2.1 – Wing and Kowalsky’s metric units design chart for instrumented
bridge
Steel ratio
= 0.015 Crack size w (mm)

23
θ 0.25 0.5 0.75 1
0.00075 No. 32 at
451
0.001 No. 22 at
190
0.00125 No. 16 at
98
0.0015 No. 13 at
56
No. 32 at
451
0.00175 No. 25 at
284
0.002 No. 22 at
190
0.00225 No. 19 at
134
No. 32 at
451
0.0025 No. 16 at
98
No. 29 at
329
0.00275 No. 13 at
73
No. 25 at
247
0.003 No. 13 at
56
No. 22 at
190
No. 32 at
451
Table. 2.3.2.2 – Wing and Kowalsky’s English units design chart for instrumented
bridge
Steel ratio
= 0.015
Crack width w (inches)
θ 0.01 0.02 0.03 0.04

24
0.00075 No. 10 at
17.8
0.001 No. 7 at
7.5
0.00125 No. 5 at
3.9
0.0015 No. 4 at
2.2
No. 10 at
17.8
0.00175 No. 8 at 11.2
0.002 No. 7 at 7.5
0.00225 No. 6 at 5.3 No. 10 at
17.8
0.0025 No. 5 at 3.9 No. 9 at 13
0.00275 No. 4 at 2.9 No. 8 at 9.7
0.003 No. 4 at 2.2 No. 7 at 7.5 No. 10 at
17.8
2.3.3 Okeil and El-Safty, 2005
Okeil and El-Safty prepared a simplified analysis method based on Caner and
Zia’s (1998) link slab for use by bridge designers. They treated bridges with link slabs as
partially continuous systems because the girder end rotations on each side of the link slab
were not equal. They used two bearing system designs in their analyses – HRRH and
RHHR. The H stands for a hinge support, and the R stands for roller support. The hinge
supports prevent longitudinal movement, and the rollers allow longitudinal movement.
The roller supports relieve some of the tension force in the link slab.
A modified three-moment equation was developed and used to analyze the
partially-continuous system for both bearing systems. The moments calculated were used
to develop expressions for the tension force and continuity moment. The results from the

25
three-moment equation were verified by the experimental work completed earlier by
Caner and Zia (1998) and by a finite element model.
The support configuration – HRRH and RHHR – determines which equations and
factors should be used. The factors considered in the expressions are the span length
ratio, link slab stiffness coefficient, axial rigidity variable, and shape factor. The
reinforcement ratio for the link slab is 1%, and it is also used to calculate the tension
force and continuity moment. The given range or values for these variables were then
used to produce the design charts and tables so that values for the equations could be
easily determined.
Okeil and El-Safty presented an example on how to use the design charts. The
example bridge section consisted of two spans with prestressed concrete girders and a 7-
inch (178-mm) deck. Each girder had a span of 70 ft (21,336 mm), and the deck was 5.2
ft (1,572 mm) wide. Both the HRRH and RHHR calculation sets were completed. A
design load of two 24.7 kips (110 kN) axles spaced 3.9 ft (1.20 m) apart was applied to
produce both the maximum positive and negative moments. The reinforcement ratio of
1% for the link slab required an area of steel equal to 4.34 in.2 (2,798 mm
2). Twenty-two
#4 reinforcing bars or 10 #6 reinforcing bars would be needed.
One of Okeil and El-Safty’s conclusions was that the bearing system design
affects the tension force and continuity moment in the link slab. The hinge support
causes the higher tension force and continuity moments to develop. However, if the
girder is allowed any lateral movement the tension force and continuity moment are
relieved “substantially” (Okeil and El-Safty, 2005). In the HRRH case, the girders are

26
allowed to move closer to each other than in the RHHR case, and the tension force and
continuity force are lower in value in the HRRH case than the RHHR case.
2.4 Other Designs
2.4.1 Bridge, Griffiths, and Bowmaker, 2005
Research has been conducted in Australia on the redesign of bridge approach
slabs to eliminate the transverse joints. The goal of the research was to make a
continuous system between the continuously reinforced concrete pavement, the approach
slab, and the bridge deck and to eliminate all transverse joints. With the elimination of
the transverse joints, maintenance and construction costs would be reduced, and the ride
quality would be increased as the differential settlement would be eliminated. The
continuous systems have been used for bridges up to 394 ft (120 m) long, and the
continuity was achieved by connecting the longitudinal reinforcement of the approach
slab directly with the bridge decks.
Additional longitudinal reinforcement was added to the approach slabs in the
transition zone which was over the area of settlement between the bridge deck and the
slab. The reinforcement was added to resist the increased stresses from the traffic load
and the settlement of the embankment in addition to temperature, creep and shrinkage
effects. The bridge decks were generally stiffer than the approach slab, and the size of
the transition zone depended partly on the difference in stiffness between the deck and
the approach slab. The additional reinforcement also provided crack control for the
longitudinal movement of the transition zone, and the crack spacing was made to be the

27
same as that of the continuously reinforced pavement away from the deck and transition
zone.
Numerical models were used to analyze the new continuous system. They were
used to study the effects of temperature, shrinkage, creep, friction between the soil and
pavement, material properties, and section properties which included the effects of
tension stiffening. The Australian standards were used for applied loads and
reinforcement needed.
The models showed the resulting stresses, forces, and movements starting at the
abutment and going through the transition zone. Different coefficients of friction were
considered. These results can be used to develop the reinforcement layouts for the
approach slab and transition zone.
The bridges and pavement along the Australian roadway WM7 were monitored
for at least six months to ensure that the continuous systems acted as predicted (Griffiths,
et al., 2005). The field results had “good correlation” to the predicted response (Griffiths,
et al., 2005). The cracks in the CRCP were spaced apart appropriately to avoid problems,
and the bridge decks did not have any noticeable change in cracking. How the cracks
were controlled on the bridge decks was not discussed. However, the overall appearance
of the system was “very good” (Griffiths, et al., 2005)
2.4.2 Other DOT Designs
The continuous deck design used by other states was researched. While several
states including Tennessee, Nebraska, North Carolina, and West Virginia, mentioned
using continuous bridge decks in their bridge design manuals, the specifics of the

28
continuous deck details could not be located. However, the continuous deck design
details for Florida and Texas were found.
The continuous deck design detail for Florida is found in section 4.2.6B of its
bridge design manual (Robertson, 2009). Florida adds additional longitudinal
reinforcement over the joint in the top mat of longitudinal reinforcement for its
continuous deck design detail. All longitudinal reinforcement in the top and bottom
layers is continuous over the joint. The Florida’s bridge design manual states that the
additional longitudinal reinforcement over the joint shall meet the following criteria:
“B. Size, space, and place reinforcing in accordance with the following
criteria:
1. No. 5 Bars placed between the continuous, longitudinal reinforcing
bars.
2. A minimum of 35 feet in length or 2/3 of the average span length
whichever is less.
3. Placed symmetrically about the centerline of the pier or bent, with
alternating bars stagger 5 feet.”
Florida also uses construction joints to control cracking in the bridge deck. The
construction joints are placed at each end of the deck spans and at intermediate locations
as required (Robertson, 2009). Figure 2.4.2.1 is the continuous deck design detail from
the Florida DOT’s bridge design manual (Robertson, 2009).

29
Figure 2.4.2.1 – FDOT continuous deck design detail (from Robertson, 2009)

30
The Texas continuous bridge deck does not add additional longitudinal
reinforcement over the joint (Simmons, 2001). The top mat of longitudinal reinforcement
consists of #4 bars at 9 inch spacing. The bottom mat of longitudinal reinforcement is #5
bars at 9 inches. The 9 inch spacing for the top and bottom longitudinal reinforcement is
the maximum spacing. Control joints formed from plastic strips are placed at the
centerline of interior bents during the concrete placement for crack control. Figure
2.4.2.2 is the design detail from the Texas Department of Transportation for its
continuous deck detail. T is the top layer of #4 longitudinal bars, and D is the bottom
layer of #5 longitudinal bars.
Figure 2.4.2.2 – Texas DOT continuous bridge deck detail (from Simmons, 2001)

31
2.5 Thermal Behavior of Bridges
2.5.1 Roeder, 2002
Charles Roeder conducted extensive research in determining the design
temperature range for bridges, and his work produced new temperature maps based on
different maximum and minimum temperatures for the different regions of the United
States. He gathered actual temperature data from around the United States, including
Alaska and Hawaii. His work showed that the 14th
Edition AASHTO Standard
Specifications for Highway Bridges and the 1st Edition AASHTO LRFD Bridge Design
Specifications which were used at the time underestimated thermal movements in
concrete girder bridges with concrete decks based on the temperature ranges used in the
code. Roeder’s new temperature maps determined the maximum expansion and
contraction of both the concrete bridges with concrete decks and steel bridges with
concrete decks. His design equations started the movement calculations at the average
temperature bridges would experience in that region and determined the maximum and
minimum movements from that location. The AASHTO provisions started the
movement at the maximum location and calculated the minimum movement from that
location. Following Roeder’s publication of his results, the AASHTO provisions were
changed to include a second method for calculating the design movements for bridges
based on Roeder’s temperature maps of the United States. The maps were split into
concrete bridges with concrete decks and steel bridges with concrete decks.
Charles Roeder’s research also considered the installation temperature of the
bridge in determining the design movements of the bridge. He proposed several revisions
to the 14th
Edition AASHTO Standard Specifications for Highway Bridges and the 1st

32
Edition AASHTO LRFD Bridge Design Specifications to account for the installation
temperature. These revisions have not been accepted. In addition to the maximum and
minimum design temperatures, a design installation temperature, Tinstall, would also be
used in the design equations. The installation temperature would be used for the design
movements of both elastomeric bearings and expansion joints. The installation
temperature is calculated based on whether it is for elastomeric bearings or expansion
joints. The two equations follow. The installation temperature for use in the design
movements for elastomeric bearings should be calculated as
Tinstall = TMinDesign + 0.65(TMaxDesign – TMinDesign) Eq. 2.5.1.1
where:
Tinstall = design installation temperature
TMinDesign = minimum design temperature for region
TMaxDesign = maximum design temperature for region
The final design movement equation for the elastomeric bearings is
Δg = 0.65 α Lbridge(TMaxDesign - TMinDesign) Eq. 2.5.1.2
where:
Δg = design movement for elastomeric bearings
α = coefficient of thermal expansion
Lbridge = total length of bridge

33
Roeder’s proposed equation for the installation temperature for expansion joints is
2
MinAirMaxAir
Install
TTT
Eq. 2.5.1.3
where:
TInstall = installation temperature for expansion joints
TMaxAir = maximum daily air temperature from previous day
TMinAir = previous night’s minimum temperature
TMaxAir is the maximum daily air temperature from the previous day, and TMinAir is the
minimum night time temperature for the morning of the day that the formwork for the
joint is installed.
The design equation for the movement of the expansion joints is
Eq. 2.5.1.4
where:
Total Movement Δ = total design movement for expansion joints
Roeder also provided proposed construction methods based on the installation
temperature for elastomeric bearings and bridge girders. The true installation
temperature is bound by an upper and lower value. If the temperature on the day of
girder installation moves outside of those bounds, the girder will be lifted off of the
elastomeric bearing to relieve the strain on the bearing. Without the girders, the
elastomeric bearings will return to their neutral position. This will reduce the maximum
34
strains in the bearing to normal values. An air temperature range for the time of girder
relifting is also given. The upper and lower bounds for the installation temperature are
TMinDesign + 0.9(TMaxDesign – TMinDesign) < TTrueInstall < TMinDesign + 0.2(TMaxDesign – TMinDesign)
Eq. 2.5.1.5
For concrete bridges, TTrueInstall is the average of the daytime high air temperature
and the previous day’s night time low temperature for the day of installation. Roeder also
stated in his commentary that concrete bridges were unlikely to be affected by this
provision because TTrueInstall is based on the average daily air temperature. The air
temperature at the time of relifting should also be within the temperature bounds
0.4(TMaxDesign – TMinDesign) < TAir – TMinDesign < 0.7(TMaxDesign – TMinDesign) Eq. 2.5.1.6
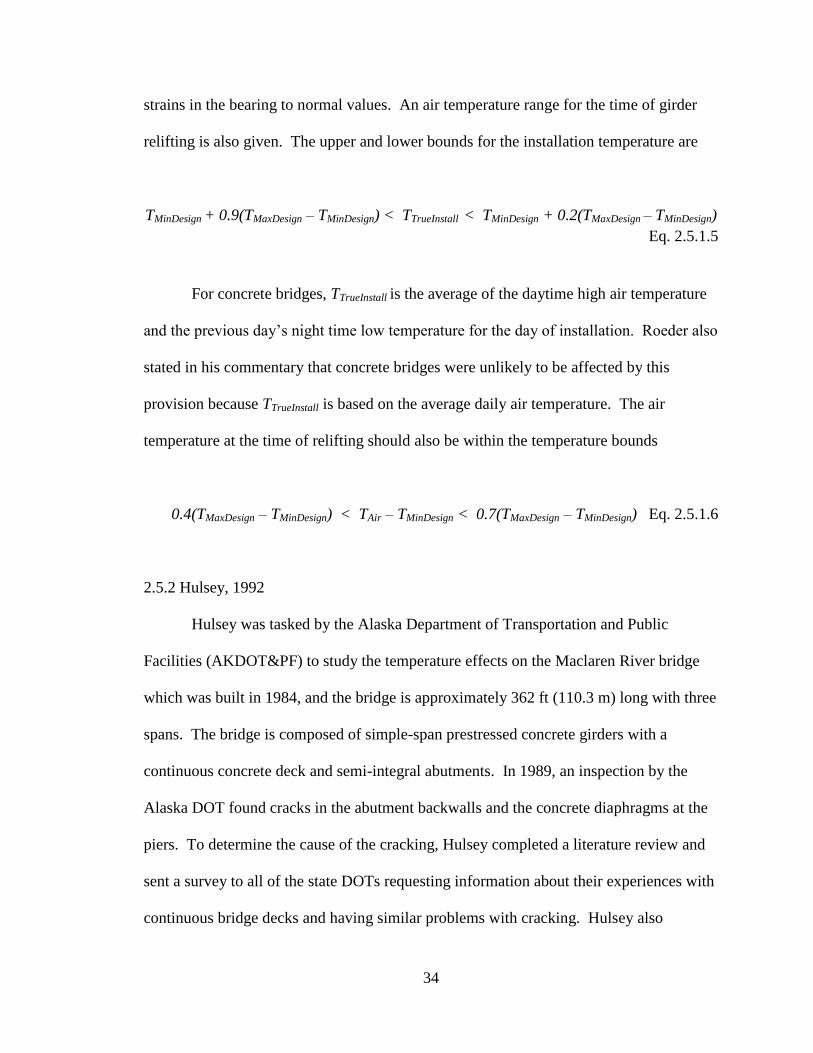
2.5.2 Hulsey, 1992
Hulsey was tasked by the Alaska Department of Transportation and Public
Facilities (AKDOT&PF) to study the temperature effects on the Maclaren River bridge
which was built in 1984, and the bridge is approximately 362 ft (110.3 m) long with three
spans. The bridge is composed of simple-span prestressed concrete girders with a
continuous concrete deck and semi-integral abutments. In 1989, an inspection by the
Alaska DOT found cracks in the abutment backwalls and the concrete diaphragms at the
piers. To determine the cause of the cracking, Hulsey completed a literature review and
sent a survey to all of the state DOTs requesting information about their experiences with
continuous bridge decks and having similar problems with cracking. Hulsey also

35
completed a thermal analysis using the temperature extremes for Fairbanks, Alaska to
help determine the cause of the cracking.
Forty-four states responded to Hulsey’s survey regarding their experiences with
continuous bridge decks. Of the responding states, 72.73% use continuous bridge decks.
Question 9 of the survey asked to give an “assessment of maintaining the jointless type of
bridge” and to note any problems and their solution, if any (Hulsey, 1992). Four states
reported that cracking at diaphragms was a problem – Oregon, Texas, Washington, and
Wyoming. The most frequently reported problem was that the approach slab panels
moved. Six states reported this issue – Colorado, Kansas, Mississippi, Missouri, Ohio,
and Oklahoma. Idaho and New Hampshire reported problems with bumps at the end of
the bridges. Connecticut, Illinois, New York, and Vermont reported problems with
cracking. Only New York reported minor cracking at the saw-cut or formed construction
joints. Georgia reported no problems at the time. Other states reported that they only had
limited history with continuous bridge decks or that they had fewer maintenance
problems with continuous bridge decks.
From the literature review, thermal stress was determined to induce the biggest
stresses in the bridges, not length between expansion joints. For the thermal analysis, the
temperature data for Fairbanks, Alaska was used. A finite element was created and an
elastic analysis was completed using the temperature loads, including a temperature
gradient through the deck. The results of the analysis showed that “the lateral resistance
of the pile supports and the resistance of the soil block behind the abutment backwall
may be caused by partially frozen or frozen soils and the resistance under these
conditions can be extremely large” (Hulsey, 1992).

36
Based on the temperature analysis results, further research into the effects frozen
soils have on piles was recommended. This research can then be used to develop a
special design detail that minimizes lateral resistance for bridges with continuous decks
in Alaska.

37
3. Deck Evaluation
3.1 GDOT Maintenance Report Findings
The GDOT maintenance reports were reviewed for bridges with prestressed,
simple-span concrete girders to find any maintenance issues or consistent problems with
the construction or durability of the continuous deck joint detail. The Maintenance
Office does not specify which bridges have continuous decks in their maintenance
reports. Therefore, bridges built with prestressed, simple-span concrete girders after the
year 2000 were assumed to have continuous bridge decks, and the maintenance reports
for those bridges were reviewed. The total number of bridges built after the year 2000
that meet these requirements are 244. During the review, the structure identification
number, the GDOT district, the maximum span length, number of spans, structure length,
leaks, leak location, deck condition and joint types were recorded for each bridge if the
information was available.
Using this information, the frequency of cracking, joint failure, or a combination
of both was tabulated. Out of the 244 bridges, 93 of the bridges have cracking, joint
leakage or joint failure reported; therefore approximately 38% of the bridges have a
reported problem. Of the 93 bridges, 64 reported cracking. Forty-six of the 64 bridges
have their cracking described as minor, very minor, or superficial which is approximately
72% of the 64 bridges with cracking. Twenty-three of the 64 bridges attribute the cracks
in part to shrinkage or settlement. Eighteen of the 64 bridges reported cracking at joints
for a percentage of approximately 28%, or for an overall percentage of about 7%.
Twelve of the 17 bridges had cracks occurring at abutments, and 1 of the 17 had cracking

38
at only one joint. With 12 of the 17 joint cracks occurring at the abutments, only about
2% of the overall bridges reported cracking at joints in the bridge deck.
Twenty-nine of the 244 bridges reported leaking at the joints or joint failures
which is about 12% of the total reviewed. Six of the 29 reported joint failure, and 1 of
the 6 was a joint failure at the abutment. Eleven of the 29 reported leaking joints
occurred at abutments. Seventeen of the 29 bridges with joint failure or leaks occurred at
joints in the bridge for approximately 7% of the total number of bridges. Three had
leaking at only one joint, and 1 had leakage at all joints. Two of the 29 bridges with joint
leaks were a pair of continuous deck bridges “built without construction joints”, and
leaking “occurred at the bottom of the deck at the joints” (Mealer, 2007). No further
information was given in the maintenance report regarding how the bridge was built.
The span lengths of the 93 of 244 bridges that reported cracking, joint leakage, or
joint failure were also reviewed to see if span lengths affected the reported problems.
The span lengths for the 244 bridges ranged from 29 ft to 150 ft. The span lengths of the
bridges reporting cracking were from 40 ft to 141 ft. The span lengths of the bridges
reporting joint failure or leakage ranged from 39 ft to 140 ft. Neither of the groups
included the shortest or longest span reported. The total lengths of the bridges were also
examined for pattern. The total bridge lengths ranged from 68 ft to 3062 ft. No evidence
was found suggesting that the lengths of the spans or the overall bridge affected the
behavior of the bridges at the junction of the edge beams. All reported issues were found
in bridges with varying span and total lengths, and no consistent pattern was evident.
The problems with cracking, joint failure, and joint leakage may not be related to
the continuous deck detail. Environmental conditions during construction, improper

39
curing, and other issues can also lead to cracking in the bridge. Maintenance bridge
inspectors attributed cracking in half of the bridges in part to shrinkage or settlement.
Maintenance inspectors also recorded only five bridges with cracking at joints
specifically, not including the abutments. The abutments of a bridge undergo a different
set of forces than the joints in the bridge deck. The earth pressure, soil/bridge interaction,
and approach slab interaction must all be considered in addition to the shrinkage, creep,
temperature, live, and dead loads on the bridge. These effects and abutment design were
outside the scope of this project. Joint failure and leakage can also be attributed to
problems during construction or improper installation. Twelve of the bridges reported
the leakage or failure at abutments, and 2 of the bridges were “built without construction
joints” which caused the deck to leak “at the bottom” (Mealer, 2007). No further
information was given regarding the two bridges built without construction joints.
Based on the GDOT maintenance report review, a small percentage of bridges
have reported problems with cracking at the joints and joint leakage and failure. Only
2% of the total 244 bridges have cracking occurring at joints. Seven percent of the total
had joint leakage or failure. All problems were found in bridges of varying span lengths
and total lengths with no evidence of length affecting any of the results. The problems
could not be guaranteed to have been caused by the continuous deck detail. Construction
conditions and installation should be considered. With such a small percentage of
problems and no guarantee they were caused by the continuous deck detail, the current
GDOT continuous deck detail appears to be working satisfactorily. The GDOT
maintenance personnel also did not report any consistent or noticeable problems with the
continuous deck detail during interviews.

40
3.2 Field Observations
3.2.1 Construction Joints
Site visits were taken to 5 bridges to see the continuous deck detail being
constructed and to see completed bridges which were built with the continuous deck
detail. The purpose of the visits was to see how the continuous deck detail is constructed
and to discuss any construction issues regarding the detail. Ms. Melissa Harper, the
GDOT Bridge Construction Engineer, accompanied the research group and coordinated
which would be the best bridges to see. Three bridges along GA SR 113 at Etawah
River, Dry Creek and Hills Creek and two bridges along US 27 at Cedertown Bypass
over SR 1and over the Norfolk Southern Railroad were visited.
Three of the bridges visited were under construction which allowed the research
group to see the work that goes into laying out the rebar and forming the header for the
joint detail. Based on discussions with contractors and Ms. Harper, the difficulties in
constructing the detail were revealed. The #4 longitudinal deck bars must be stopped 2
inches from the joint which entails cutting the #4 rebar lengths with some precision. The
extra time required to cut and layout the #4 reinforcement bars for a bridge with no skew
is not as significant as it is for skewed bridges. Figure 3.2.1.1 shows why stopping the
transverse and longitudinal reinforcement #4 bars in a skewed bridge deck is much more
time and labor intensive. Each bar must be cut to a different length to stop it 2 inches
from the joint so that only the #6 longitudinal bars cross the joint. The sorting of the
reinforcement to make sure both the transverse and longitudinal reinforcement are laid
out correctly also takes time as rebar is not sorted before delivery.

41
Figure 3.2.1.1 – Reinforcement layout for a skewed continuous bridge deck (bridge
supporting US 27 at SR-1, Cedartown Bypass)
The header required to form the construction joint with the #6 longitudinal bars
centered at the construction joint is one of the biggest reasons for the increased time and
labor in both skewed and non-skewed bridges. No standard header can be created as
longitudinal reinforcement spacing varies for each bridge, and the header must be built
for each construction joint in a bridge deck. Figures 3.2.1.2 and 3.2.1.3 are pictures
showing the complexity of the header and formwork along GA SR 113 at Etawah River.
Holes of the correct size and height must be cut into the header so that the #6 bars can
pass over the joint. Longitudinal #4 reinforcing bars have not been laid out yet for this
bridge deck. The #4 bars for transverse reinforcement have already been laid out because
they are in the bottom reinforcement mat underneath the longitudinal #4 and #6
reinforcement bars. Other boards are then used to support the header and ensure that the
#4 top mat
transverse
reinforcement
#6 Bar Joint
Reinforcement
#4 Bar Top
Mat
Longitudinal
Reinforcement
Joint Filler,
typ. 1.5 in.
– 3 in.
thick
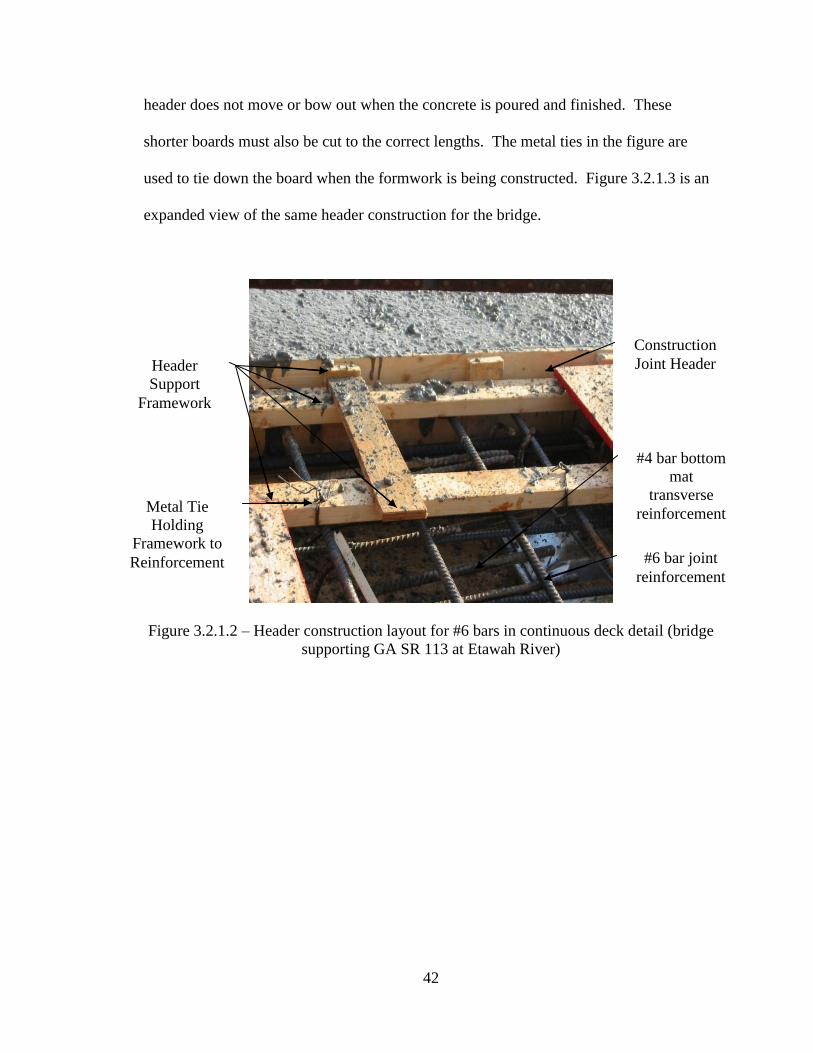
42
header does not move or bow out when the concrete is poured and finished. These
shorter boards must also be cut to the correct lengths. The metal ties in the figure are
used to tie down the board when the formwork is being constructed. Figure 3.2.1.3 is an
expanded view of the same header construction for the bridge.
Figure 3.2.1.2 – Header construction layout for #6 bars in continuous deck detail (bridge
supporting GA SR 113 at Etawah River)
#6 bar joint
reinforcement
Construction
Joint Header Header
Support
Framework
Metal Tie
Holding
Framework to
Reinforcement
#4 bar bottom
mat
transverse
reinforcement

43
Figure 3.2.1.3 – Expanded view of header construction layout for continuous deck detail
(bridge supporting GA SR 113 at Etawah River)
To lessen some of the time and labor consumed by the continuous deck detail,
some contractors have been given special permission from Mrs. Harper to saw cut or tool
in construction joints after the deck pour. When the joints are saw cut or tooled-in, no
header for the construction joint is required. The concrete is poured continuous along the
length of the deck. A typical 2 lane, 3 to 4 span bridge can be poured in 1 day instead of
the 3 or 4 days needed to pour each span separately. Larger bridges still require
construction joints to be formed where each concrete pour is terminated for the day along
the length of the deck. The joints are then created by a saw or a specific implement
which removes the required amount of concrete to create the construction joint as shown
in Figure 3.2.1.4. The construction joints must follow the line of the bridge pier over the
joint filler, also shown in Figure 3.2.1.4, which is placed between the two edge beams.
Figure 3.2.1.4 shows the details of the construction joint.
#4 bar bottom
mat
transverse
reinforcement
#6 bar joint
reinforcement
Header
Support
Framework

44
Figure 3.2.1.4 – Detail view of the construction joint
Both methods require that the joint be created within a certain time frame of the
pour. The limited time frame prevents the joints from being put in too fresh concrete
which would ravel or from being put in concrete where shrinkage cracks are already
occurring. Because of this limited time window for proper installation, the specifications
from the GDOT still require the joint to be formed with formwork. Contractors with the
permission from Ms. Harper to saw cut or tool-in the construction joints have proven that
they can install them correctly.
Each construction joint, no matter how it is created, must have its edges rounded
the appropriate 0.25 inch radius shown in Figure 3.2.1.4. Otherwise, spalling around the
joint can occur. Figure 3.2.1.5 shows spalling along a silicone sealed construction joint
on a bridge supporting GA SR 113 over Dry Creek where the edge was not rounded
0.5-in. deep construction joint
1.5-in. wide construction joint
0.25-in. radius
Bridge
deck
Bridge
girder
Joint
filler

45
enough to the correct 0.25 inch radius. The spalling occurs over time from wheel
impacts.
Figure 3.2.1.5 – Spalling along silicone sealed construction joint (bridge supporting GA
SR 113 Over Dry Creek)
3.2.2 Expansion Joints
The Evazote expansion joint is the most used expansion joint in GDOT bridges
designed with the continuous deck detail because of their good performance and low cost.
The GDOT Bridge and Structures Design Policy Manual (2009) states that designers
should “try to space [your] expansion joints so that [you] can use Evazote joints” (WBA,
2007).
Roy H. “Buddy” Jump of C.W. Matthews Contractors provided the cost
information for the Evazote joint. The Evazote joint is included as a contract line item,
and its material cost and installation cost is approximately $20.00/ft for a 0.25-inch wide
1.5-in. wide
silicone sealed
construction joint

46
and 2-inch deep section. Between 2002 and 2008, the elastomeric profile joint, the next
expansion joint a size up from the Evazote expansion joint, has been used only in ten
bridges statewide. The elastomeric profile joints were used in one bridge built in 2007 at
a cost of $12,000, and the elastomeric profile joints were used in nine bridges built in
2005 for an average cost of $15,079 per joint. Another expansion joint option, the
Silicoflex joint produced by R.J. Watson, is currently being tested by the GDOT at two
bridges in the State of Georgia. The Silicoflex joint has the same capacity as the
elastomeric profile joint for approximately half the cost.
During the site visit, Ms. Harper stated that the only problem regarding the
Evazote joints is that contractors improperly install them. The Evazote joint
specifications require that the joint material be of a certain size to undergo the predicted
contraction and expansion movements of the bridge. That size is generally a bigger
dimension than the joint opening size so that it can expand and contract appropriately as
needed. Contractors do not always want to take the time to force the Evazote material
into the joint opening for the expansion joint. Figure 3.2.2.1 shows Ms. Harper holding
up an Evazote joint which was being installed.

47
Figure 3.2.2.1 – Ms. Harper holding an Evazote expansion joint being installed (bridge
supporting GA SR 113 at Etawah River)
If the contractor does not size the Evazote joint in accordance with specifications,
the Evazote joint will tear away from the deck during the deck’s expansion and
contraction. Figure 3.2.2.2 shows an Evazote joint pulling away from the deck as well as
spalling along the edges of the joint which were not round enough. Figure 3.2.2.2 also
shows evidence of repair along the joint to seal the openings where the Evazote material
had pulled away from the deck in the bridge supporting GA SR 113 over Dry Creek.

48
Figure 3.2.2.2 – Improperly installed Evazote joint pulling away from the bridge
deck with evidence of repair (bridge supporting GA SR 113 Over Dry Creek)
Overall, the construction issues concerning the continuous deck detail revolve
around the time and labor that go into the actual construction of the detail and in the
proper installation of the construction and expansion joints. None of the four contractors
interviewed regarding the continuous bridge deck detail reported problems with the
continuous bridge deck detail in service. While discussing the current continuous deck
detail with contractors, they are very enthusiastic about a new detail which would
eliminate the #6 bars and the header required for them. They would like a detail for
which either a standard header form can be built and reused or which eliminates the need
for the header at all.
1.25-in.
wide
Evazote
joint
Evidence
of repair to
Evazote
joint

49
4. Analysis of Continuous Deck Detail
4.1 Beam Theory Calculations
As part of the analysis portion of the project, girder stress and deflection
calculations are performed using beam theory. The girders are assumed to be linear
elastic, but the cracking behavior of the deck was accounted for by a phenomenological
model including tension stiffening effects. The forces considered in the analysis are
shrinkage, temperature, and live load. Shrinkage effects are considered only in the deck
because, at the time of construction, the bridge girders are assumed to have already
shrunk while waiting in the precast concrete plant yard. The temperature, shrinkage, and
live load forces are calculated per AASHTO (2007) Section 3. The effects of the applied
loads are considered on a 100 ft span composite beam consisting of a Type III AASHTO
girder with an 8 inch concrete deck. The Type III girder has a maximum length of 100 ft.
The length of 100 ft is assumed to determine a representative upper-bound girder end
rotation. The effective width of the deck is assumed to be 7 ft and the deck concrete is
assumed to have a compressive strength of 3500 psi. The girder is simply supported and
has a compressive strength of 7000 psi. Figure 4.1.1 is a section view of the composite
girder.

50
Figure 4.1.1 – Section view of composite section used in beam theory calculations
A nonlinear tension stress-strain curve is used in the beam theory calculations to
determine the response of the deck as the shrinkage, temperature, and live load effects are
applied to the composite section. This curve includes a softening branch that accounts
for the effect of the reinforcement in the concrete bridge deck on the post-cracking
response. The nonlinear tension stress-strain curve is taken from Wang and Teng (2007).
The equations for Wang and Teng’s (2007) nonlinear tension stress-strain curve are
750
,
,
,
0,
rd
u deck rd
u rd rd ys
usu ys ys us
us ys
u us
E
e
Eq. 4.1.1
8-in. thick
concrete
bridge
deck
45-in. high
Type III
AASTHO
bridge
girder
7- ft wide
concrete
bridge deck

51
where:
Edeck = elastic modulus of bridge deck
ε = strain
εrd = tensile rupture strain
σrd = tensile rupture stress
εys = yield strain of steel
σys = yield stress of steel
εus = ultimate strain value of 0.05 used by Wang and Teng
The exponential curve from the rupture strain of the concrete to the yielding strain
of the steel is simplified into a linear curve with a slope of -179 ksi. The yield strain of
the steel is taken as 0.002 inch/inch based on the assumption that 60 ksi steel is used for
the reinforcement. The concrete rupture stress is calculated from ACI Section 9.5.2.3
(2005) using
rd = fr = 7.5√fci’ Eq. 4.1.2
where:
fci’
= initial compressive strength of concrete
fr
= modulus of rupture of concrete
Figure 4.1.2 shows the nonlinear-stress-strain curve calculated using Wang and Teng’s
(2007) equations and a modified multi-linear representation of this curve used in this
research. The graph is truncated at a strain value of 0.0025 inch/inch.

52
Figure 4.1.2 – Modified and calculated tension stress-strain curves based on Wang and
Teng’s (2007) tension stiffening equations
The shrinkage and the temperature gradient effects are first calculated and applied
to the composite section in successive linear analyses. The concrete deck is divided into
five equal layers, and the stress at the midpoint of each layer is used to determine if the
layer cracked or not from the applied shrinkage and temperature gradient forces. Figure
4.1.3 shows the bridge deck divided into the five layers.

53
Figure 4.1.3 – Deck layer numbering
The calculated effects of the shrinkage and temperature gradient loads are applied
using successive linear increments to determine which deck layers cracked from the
applied loads. The 10,000 day shrinkage strain is applied first and then the temperature
gradient is applied.
If a deck layer reaches the rupture stress or the stress corresponding to the change
in slope along the unloading curve, the increment is truncated into a part corresponding to
the equivalent modulus at the beginning of the increment, and then the subsequent
increment is applied using the elastic modulus for the new linear descent curve. The
stress at each layer of the deck is calculated by determining the initial stresses and the
corresponding resultant forces induced if the incremental shrinkage or temperature
gradient strains are fully restrained. The internal stresses induced by the strains caused by
“releasing” this artificial fixity are then added to the initial stresses.
1
3
5
2
4

54
4.1.1 Shrinkage Strain Calculations
The shrinkage strain is calculated using the AASHTO (2007) Specifications
Equation 5.4.2.3.3-1. A range of zero to ten thousand days is used for the time variable
in the equation. The relative humidity value used in the equation is assumed to be 70 for
the State of Georgia based on AASHTO Figure 5.3.2.3.3-1 (2007). The results are shown
in Figure 4.1.1.1. The 10,000 day strain value is -2.26x10⁻⁴
inch/inch.
Figure 4.1.1.1 – Shrinkage strain values up to 10,000 days
The entire 10,000 day shrinkage strain is then applied to the composite section to
determine if rupture occurred in any of the five deck layers. Cracking is found to first
occur in the bottom layer of the deck. Enough time is assumed to have passed for the
shrinkage to be uniform throughout the deck. Initially the shrinkage rate at the bottom of
the deck is less than that at the top. The water evaporates more readily at the top of the

55
deck where the deck is exposed to the air whereas metal forming systems remain in place
at the bottom of the deck.
The stress at each layer and the curvature of the beam are determined using the
composite beam integral equations from Craig (2000). The initial stress in each layer is
calculated using the equation
init sh deckE= Eq. 4.1.1.1
where:
σinit = initial stress
εsh = 10,000 day shrinkage strain
The curvature is then calculated using the initial stress
gg
i
ii
i
iiinit
IEIE
Ay
5
1
5
1
Eq. 4.1.1.2
where:
Ψ = curvature of composite beam
i = layer number
yi = distance to neutral axis from layer i
Eg = elastic modulus of the girder concrete
Ei = elastic modulus of layer i
Ig = second moment of inertia for girder

56
Ii = second moment of inertia for layer i
Ai = area of layer i
The flexural stress in each layer i, due to the curvature, is then calculated using
flexi i iE y=
Eq.
4.1.1.3
The axial force is calculated using
01
n
axial i i n ni
F ( E A ... E A )=
= + + Eq. 4.1.1.4
where:
i = material number
n = number of layers
ε0 = initial strain
Ei = elastic modulus of material i
Ai = area of material i
The stress due to the axial deformations is calculated using the equation
m
n
mmnn
axiali
i
AEAE
FE
1
...
Eq. 4.1.1.5

57
where:
i = layer number
n = material number
m = number of materials
E = elastic modulus
A = area
The summation of the initial 10,000 day strain and the flexural and axial stresses it
induces in a restrained system is shown in Figure 4.1.1.2. The initial axial stress is
positive (tensile), and the flexural and axial stresses in the deck due to the girder
deformations are negative (compressive).
Figure 4.1.1.2 – Initial stress, flexural stress, and axial stress from 10,000 day strain
None of the layers reach the rupture stress when the 10,000 day shrinkage strain is
applied. The resulting curvature of the composite section is -5.56x10⁻⁶
rad/inch. The
resulting stresses in each layer of the deck are shown Table 4.1.1.1.
Bridge
deck
Neutral
axis of
section
+ +

58
Table 4.1.1.1 – Resulting stress in each layer from the applied 10,000 day shrinkage
strain
Layer Stress (ksi)
σ1 0.116
σ2 0.146
σ3 0.176
σ4 0.206
σ5 0.236
4.1.2 Temperature Gradient Calculations
Next, the strain and curvature from the AASHTO temperature gradient are
computed and applied to the composite section to determine the total effects from the
10,000 day shrinkage strain and temperature gradient. The temperature gradient used is
from AASHTO (2007) Section 3.12.3 using Zone 3 temperature data. Figure 4.1.2.1
illustrates the AASHTO temperature gradient. The temperature T1 is 41°F, and T2 is
11°F, but T3 is assumed to be zero because no site-specific study has been performed to
determine its value. For the concrete bridges considered in this project, A is assumed
equal to 12 inches because bridge girders are typically greater than 16 inches in depth.
The thickness of the deck, t, is assumed to be the typical 8 inches.
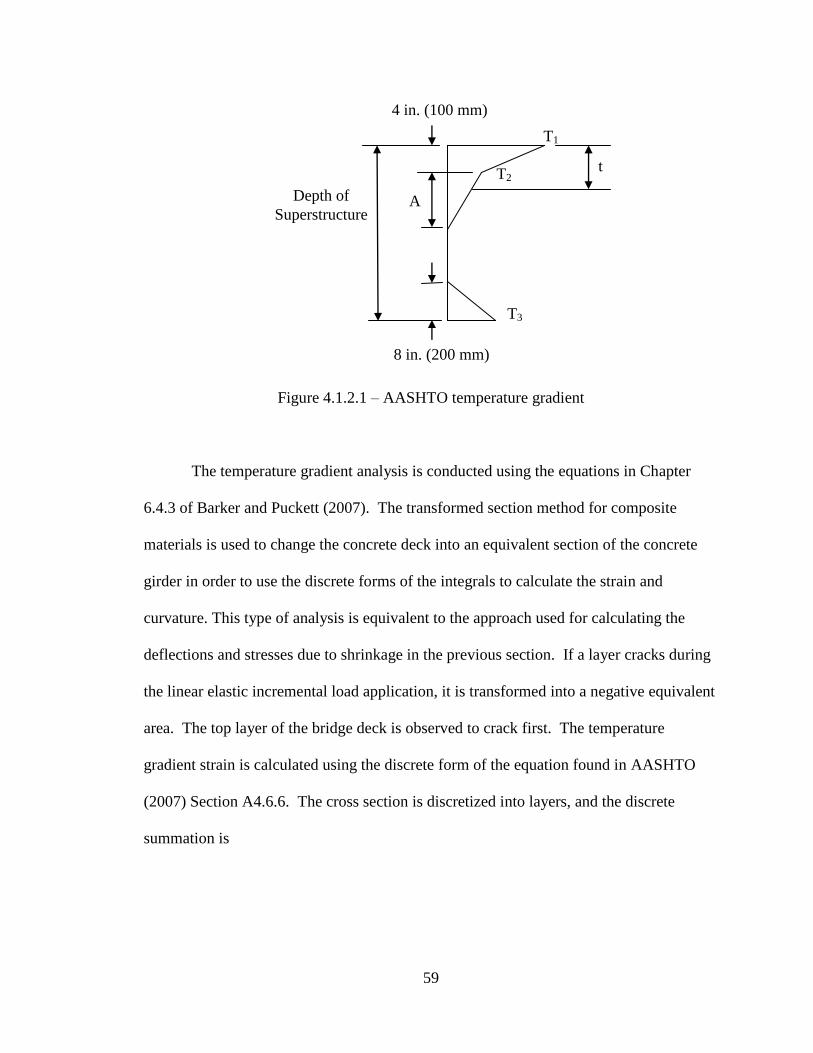
59
Figure 4.1.2.1 – AASHTO temperature gradient
The temperature gradient analysis is conducted using the equations in Chapter
6.4.3 of Barker and Puckett (2007). The transformed section method for composite
materials is used to change the concrete deck into an equivalent section of the concrete
girder in order to use the discrete forms of the integrals to calculate the strain and
curvature. This type of analysis is equivalent to the approach used for calculating the
deflections and stresses due to shrinkage in the previous section. If a layer cracks during
the linear elastic incremental load application, it is transformed into a negative equivalent
area. The top layer of the bridge deck is observed to crack first. The temperature
gradient strain is calculated using the discrete form of the equation found in AASHTO
(2007) Section A4.6.6. The cross section is discretized into layers, and the discrete
summation is
T2
T1
Depth of
Superstructure
A
t
8 in. (200 mm)
4 in. (100 mm)
T3

60
iai ATA
Eq. 4.1.2.1
where:
Tai = temperature at the element centroid
A = transformed cross-sectional area
Ai = transformed area of the element
The curvature induced by the temperature gradient is calculated the same way as
the axial strain. The cross section is discretized into elements so that the integral found in
AASHTO (2007) Section C4.6.6 can be simplified into the discrete summation.
iai i i i
i
T[T y A I ]
I d
= + Eq. 4.1.2.2
where:
Ψ = curvature of composite beam
I = second moment of area of cross section about the elastic
centroidal axis
iy
= element distance from neutral axis
di = depth of the element
ΔTi = temperature difference between the bottom and top of the element
iI
= second moment of area for the element
The top two layers of the deck crack after the temperature gradient strain is
applied to the composite section in successive linear analyses. The resulting curvature

61
from the shrinkage and temperature gradient strain applications is -8.911x10⁻⁶
rad/inch.
Table 4.1.2.1 shows the resulting stress in each layer after the successive linear elastic
incremental load analysis. The stresses are transformed back to the concrete bridge deck
properties. Figure 4.1.2.2 shows the initial temperature gradient stress and the flexural
and axial stress induced in the restrained system by the temperature gradient.
Figure 4.1.2.2 – Initial, flexural, and axial stresses from the applied temperature
gradient
Table 4.1.2.1 – Resulting stress in each deck layer after the 10,000 day shrinkage strain
and the temperature gradient strain application
Layer Stress (ksi)
σ1 0.391
σ2 0.425
σ3 0.32
σ4 0.246
σ5 0.236
Figure 4.1.2.3 shows the total resulting stress from the temperature gradient plus
the shrinkage stress on the modified tension stress-strain curve. The stress-strain curve
Bridge
Deck
Neutral
Axis + +

62
shown in Figure 4.1.2.3 truncates the graph at the strain value of 0.0005 inch/inch so that
the stresses in the layer can be more easily read.
Figure 4.1.2.3 – Total stresses in the deck after application of the temperature gradient
The curvature from the temperature gradient is both added and subtracted to the
final shrinkage curvature to represent the seasonal expansions and contractions of the
bridge deck. The contractive case is used in the final girder end rotation calculations
because the curvatures are additive which results in larger girder end rotations. Because
the girder is a simple-span section, the rotation of the girder can be calculated using
2
L= Eq. 4.1.2.3
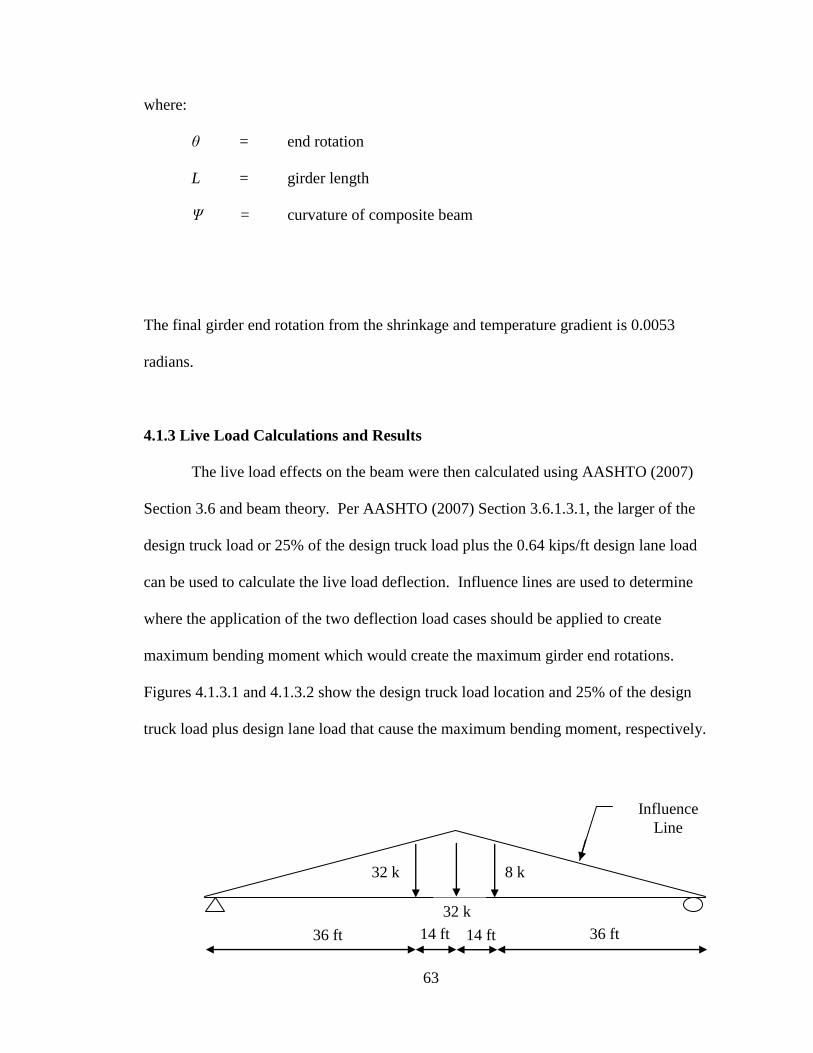
63
where:
θ = end rotation
L = girder length
Ψ = curvature of composite beam
The final girder end rotation from the shrinkage and temperature gradient is 0.0053
radians.
4.1.3 Live Load Calculations and Results
The live load effects on the beam were then calculated using AASHTO (2007)
Section 3.6 and beam theory. Per AASHTO (2007) Section 3.6.1.3.1, the larger of the
design truck load or 25% of the design truck load plus the 0.64 kips/ft design lane load
can be used to calculate the live load deflection. Influence lines are used to determine
where the application of the two deflection load cases should be applied to create
maximum bending moment which would create the maximum girder end rotations.
Figures 4.1.3.1 and 4.1.3.2 show the design truck load location and 25% of the design
truck load plus design lane load that cause the maximum bending moment, respectively.
14 ft 14 ft 36 ft
32 k
32 k
8 k
Influence
Line
36 ft

64
Figure 4.1.3.1 – AASHTO design truck live load placed for maximum bending
moment
Figure 4.1.3.2 – AASHTO design lane load plus 25% design truck load placed for
maximum bending moment
The moment distribution factor is then calculated for multiple interior lanes
loaded and a single interior lane loaded using the equations found in AASHTO (2007)
Table 4.6.2.2.2b for concrete decks with concrete girders. The multiple lanes loaded
distribution factor governs with a value of 0.595. The distribution factor for the single
loaded lane is 0.401. The moment distribution factor is applied to the loads shown in
Figures 4.1.3.1 and 4.1.3.2. The conjugate beam method is then used to calculate the end
rotations induced by the two load cases. The design truck load by itself produces the
larger end vertical reaction of 26377 kips compared to 25319 kips from the other
deflection load case; therefore, it will produce the larger girder end rotation.
The material properties for each layer of the deck are determined using the
modified tension stress-strain curve in Figure 4.1.2 (page 52). The strain of each layer
after the application of the shrinkage and temperature gradient can be determined from its
location on the modified tension stress-strain curve. Table 4.1.3.1 gives the stress and
strain for each layer on the modified tension stress-strain curve.
0.64 k/ft 8 k
8 k
2 k
14 ft 14 ft 36 ft 36 ft

65
Table. 4.1.3.1 – Stress and strain of each deck layer after the shrinkage and temperature
gradient loads were applied
Layer Stress (ksi)
Strain (in./in.)
σ1 0.391 0.000434
σ2 0.425 0.000260
σ3 0.32 0.000095
σ4 0.246 0.000073
σ5 0.236 0.000070
Two different unloading curves are used for the cracked deck concrete to bound
the solution for the response of the girder to the applied live load. Figure 4.1.3.3 is the
lower bound of the solution with the unloading curves for the cracked layers 1 and 2
taken from the location of the layer on the stress-strain curve through the origin. The
lower bound solution elastic modulus of layer 1 is 900.92 ksi, and for layer 2 it is 1700
ksi. Figure 4.1.3.4 is the upper bound of the solution where the unloading curve for
layers 1 and 2 has the same slope as the initial linear stiffness of the concrete. Thus, all
five layers have an elastic modulus of 3372 ksi.

66
Figure 4.1.3.3 – Lower bound solution for live load induced curvature
Figure 4.1.3.4 – Upper bound solution for live load induced curvature
E1
E2
E2 E1

67
The upper and lower bound girder end rotations due to the design truck load are
found to be 0.0005 and 0.0002 radian, respectively. The final end rotation from the
shrinkage and temperature loads are then added to the upper and lower bound rotations
from the live load application. The final upper bound rotation and lower bound rotation
are 0.0058 and 0.0055 radians, respectively.
The final curvature bounds are then compared to the typical maximum service
live load response for simple-span beams, assuming a uniformly distributed live load as a
simplified solution:
800384
5 4 L
EI
wL Eq. 4.1.3.1
Manipulating Equation 4.1.3.1 results in the equation shown in Equation 4.1.3.2.
Equation 4.1.3.2 provides a beam end rotation of 0.004 radians. The girder end rotations
for the upper and lower bound solutions are slightly higher than the 0.004 radians limit.
That the calculated girder end rotations are higher in value is reasonable as the calculated
girder end rotations include the shrinkage and temperature gradient loads in addition to
the live load.
004.0248005
384
24
3
xxEI
wL Eq. 4.1.3.2

68
Based on the beam theory calculations, the 10,000 day shrinkage strain induces
the largest end rotation of 0.0033 rad. The live load induces the least amount of end
rotation. The lower and upper bound end rotations due to live load are 0.0002 and 0.0005
radians, respectively. Only the top two layers of the deck crack from the application of
the shrinkage and temperature gradients strains applied in successive linear elastic
analyses.
4.2 Rigid Body Mechanics Explanation
4.2.1 Rigid Body Model
A rigid body mechanics analysis is used to further investigate what forces are
being transferred across the deck connecting two simple spans. The bridge detail at the
meeting point of the edge beams at each end of each simple span is simplified for the
rigid body mechanics analysis. The elastomeric bearing systems for bridges are
composed of both fixed and expansion elastomeric bearings. In both bearing setups in
the State of Georgia, a dowel bar is used to connect the girder to the pier cap through the
bearing as shown in Figure 4.2.1.1. The dowel bar prevents the girder from moving
laterally and from moving longitudinally too far and from incremental inelastic
displacements (walking) while it moves with the expansion and contraction of the bridge;
a dowel is shown in Figure 4.2.1.2. The standard diameter of the dowel bar is 1.25
inches, and the length is 1.5 ft.

69
Figure 4.2.1.1 – Dowel rod through pier cap, bearing pad, and girder
Figure 4.2.1.2 – Dowel bar for bearing systems
Bridge
Deck
Elastomeric
Bearing Pad
Bridge Pier
Preformed
Joint Filler
(2.5” thick)
Dowel Rod
Longitudinal
Girder
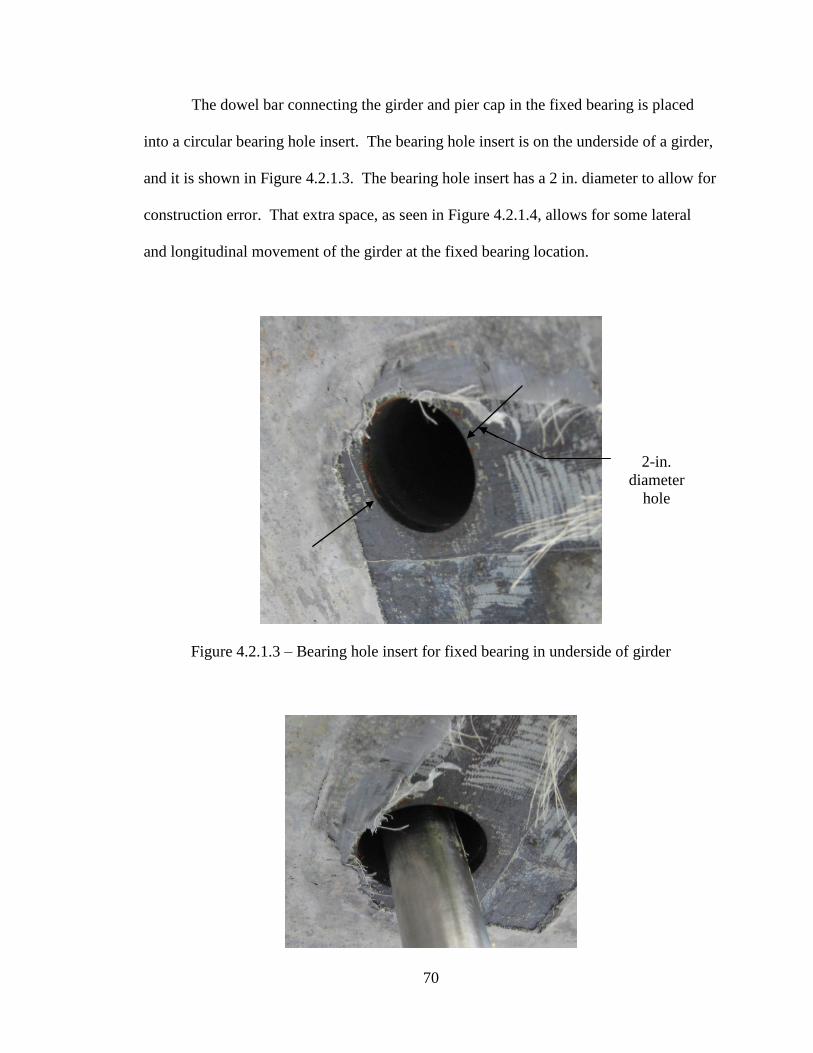
70
The dowel bar connecting the girder and pier cap in the fixed bearing is placed
into a circular bearing hole insert. The bearing hole insert is on the underside of a girder,
and it is shown in Figure 4.2.1.3. The bearing hole insert has a 2 in. diameter to allow for
construction error. That extra space, as seen in Figure 4.2.1.4, allows for some lateral
and longitudinal movement of the girder at the fixed bearing location.
Figure 4.2.1.3 – Bearing hole insert for fixed bearing in underside of girder
2-in.
diameter
hole
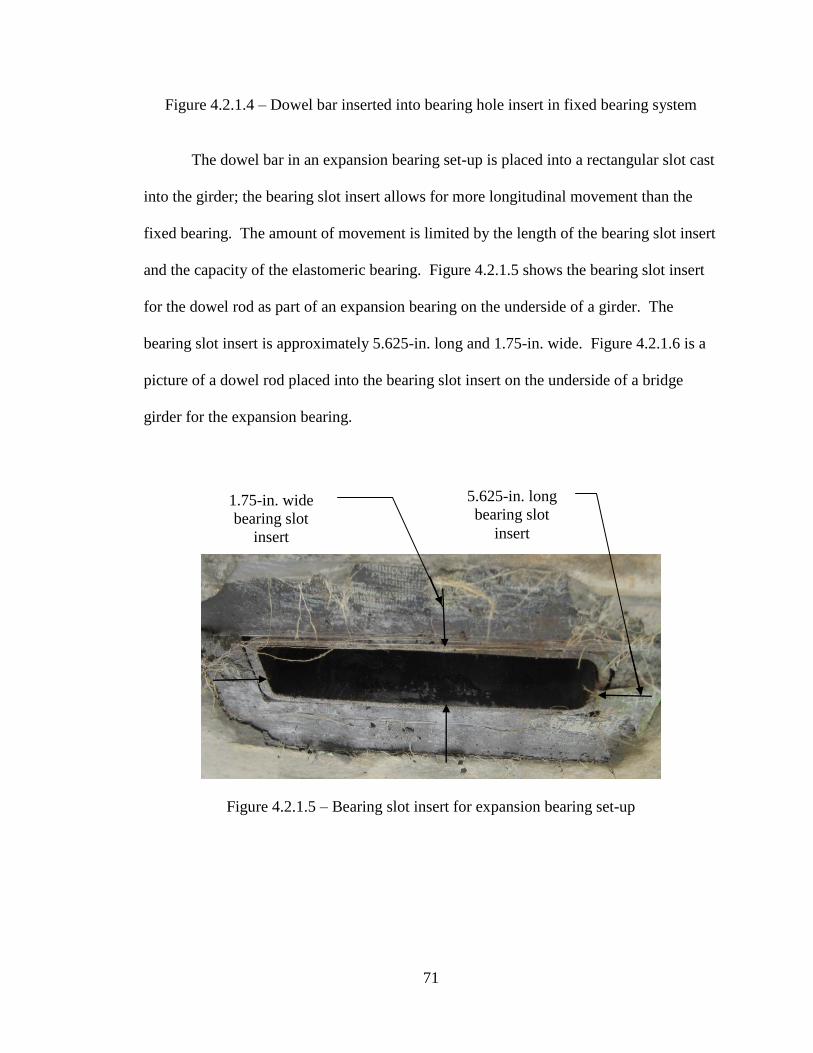
71
Figure 4.2.1.4 – Dowel bar inserted into bearing hole insert in fixed bearing system
The dowel bar in an expansion bearing set-up is placed into a rectangular slot cast
into the girder; the bearing slot insert allows for more longitudinal movement than the
fixed bearing. The amount of movement is limited by the length of the bearing slot insert
and the capacity of the elastomeric bearing. Figure 4.2.1.5 shows the bearing slot insert
for the dowel rod as part of an expansion bearing on the underside of a girder. The
bearing slot insert is approximately 5.625-in. long and 1.75-in. wide. Figure 4.2.1.6 is a
picture of a dowel rod placed into the bearing slot insert on the underside of a bridge
girder for the expansion bearing.
Figure 4.2.1.5 – Bearing slot insert for expansion bearing set-up
5.625-in. long
bearing slot
insert
1.75-in. wide
bearing slot
insert

72
Figure 4.2.1.6 – Dowel rod inserted into expansion bearing slot insert in girder
The fixed and expansion bearing pad and dowel bar setups can be modeled as
springs connecting the girder to the pier cap. The springs allow some longitudinal
movement but resist vertical and transverse movement. Figure 4.2.1.7 shows the
bearings modeled as springs. The #6 bar joint reinforcement is modeled as a link
connecting bridge deck over the two edge beams.
Figure 4.2.1.7 – Elastomeric bearings modeled as springs
The springs’ force-displacement curves are the force-displacement curves for the
elastomeric bearing pads themselves. Force-displacement curves provided by Agom

73
Metal Rubber Engineering (2009) are taken as representative curves for the elastomeric
bearings in this research. The bearing information is for the Type 1 laminated
rectangular elastomeric bearing. The force-displacement curves vary with the size of the
bearing. The smallest and largest bearings available from Agom Metal Rubber
Engineering (2009) are used to bound the force-displacement curves for the elastomeric
bearings. The smallest bearing size available is a 4 in. (100 mm) by 4 in. (100 mm) by
0.6 in. (14 mm) rectangular elastomeric bearing. Figure 4.2.1.8 is the force-displacement
curve for the 4 in. (100 mm) by 4 in. (100 mm) elastomeric bearing. The largest bearing
size available is a 35.4 in. (900 mm) by 35.4 in. (900 mm) by rectangular elastomeric
bearing. Figure 4.2.1.9 is the force-displacement curve for the 35.4 in. (900 mm) by 35.4
in. (900 mm) by 13.1 in. (332 mm) elastomeric bearing.
Figure 4.2.1.8 – Force-displacement curve for 4 in. x 4 in. x 0.6 in. laminated
rectangular elastomeric bearing

74
Figure 4.2.1.9 – Force-displacement curve for 35.4 in. x 35.4 in. x 13.1 in.
laminated rectangular elastomeric bearing
The model of the bearing system and continuous deck detail at the construction
joint can be further simplified for the rigid body mechanics model. The fixed bearing is
modeled as a pin since the longitudinal movement is more restricted. The expansion
bearing is represented by a roller since more longitudinal movement occurs. The
simplified detail for the rigid body mechanics analysis is illustrated in Figure 4.2.1.10.
The #6 bars are still modeled as a link connecting the bridge deck over the edge beams.
The bearing system is modeled as a pin and roller to represent the fixed and expansion
bearings, respectively.

75
Figure 4.2.1.10 – Rigid body mechanics model of GDOT continuous deck detail
4.2.2 Rigid Body Mechanics Discussion
The model in Figure 4.2.1.10 is the final model used to examine the effects of the
shrinkage, temperature, and live load on the girder deflection and rotations. The
expansion-fixed bearing configuration is used because the girder rotations and deck
cracking are the same for the expansion-expansion and fixed-fixed bearing
configurations. The deflection from the temperature and shrinkage effects causes rotation
at the end of the longitudinal girders about the neutral axis of their composite sections. In
addition, girder end rotations occur due to live load. The girders rotate on both sides of
the joint under consideration. The girder rotation occurs about the neutral axis of the
composite section of the bridge deck and girder. The neutral axes for these composite
sections are in the top flange of the girder close to the bottom of the deck. Figures 4.2.2.1
to Figure 4.2.2.3 are examples of the different bearing pad systems and the assumed
movements of the longitudinal girders under end rotations. Figure 4.2.2.1 shows the
assumed rigid body motion of a fixed-expansion bearing connection for the l girders.
The girder on the roller support moves longitudinally towards the fixed girder. The fixed
Fixed
Bearing
#6 Bars as Link
Expansion
Bearing

76
girder rotates about its neutral axis. Because of tolerances in the “fixed” dowel bar
connection, the fixed girder also can move longitudinally towards the other girder.
Figures 4.2.2.2 is of the expansion-expansion bearing system. Both girders move
longitudinally towards each other and compress the joint filler. Figure 4.2.2.3 is the
fixed-fixed bearing systems. Both girders rotate about their neutral axis and can move
longitudinally towards each other depending upon the loads they undergo.
Figure 4.2.2.1 – Fixed-expansion bearing system rigid body movement
Figure 4.2.2.2 – Expansion-expansion bearing system rigid body movement

77
Figure 4.2.2.3 – Fixed-fixed bearing system rigid body movement
The longitudinal movements of the girders shown in Figures 4.2.2.1 through
4.2.2.3 are suggested by how the girders react to the restraints and of the size of the
dowel openings on the underside of girders, the elastomeric bearing pads, and the dowel
rods. The elastomeric bearing pads at the base of the end beams provide a small
resistance against longitudinal movement. Any tension forces that the girder rotations
cause in the link, and for that matter, any longitudinal force transmitted by the link,
would have to be reacted by the bearing pads at the end of the girders. Figure 4.2.2.4 (a)
is the free body diagram of the tension forces in a fixed-expansion bearing system. It is
representative of the other bearing systems as well. At the expansion bearing, the roller
exerts zero lateral force at B1; thus, the lateral force, T1, must also be a zero force. If T1
is zero force, then T2 and thus B2 are also zero force.
In the case of fixed-fixed bearing condition shown in 4.2.2.4 (b), it is unknown if
B1 is zero force. Yet, as discussed, the observed cracking in the deck at fixed-fixed link
slab locations is the same as that at expansion-fixed locations. Therefore, the author
hypothesizes that the same force conditions in the bearings occur. For construction
tolerances, the hole in the bottom of the girder for the dowel allows for some longitudinal

78
as well as lateral movement. Therefore, either at B1 or at B2 there is space between the
dowel and the side of the hole in the girders. The dowel hole insert has a diameter of
approximately 2 inches, and the diameter of the dowel bar is 1.25 inches. This allows for
a longitudinal tolerance of 0.75 inches at the fixed bearing. Because of the tolerance
between the dowel and the side of the hole, it can be considered that B1 is zero force as
assumed in Figure 4.2.2.4 (a).
Figure 4.2.2.4 (a) – Free body diagram of rigid body motion with fixed-pinned
supports
Figure 4.2.2.4 (b) – Free body diagram of rigid body motion with fixed-fixed
supports
T1 T2
B1 B2
T1 T2
B1 B2

79
The force diagram and rigid body motion model are both based on the assumption
that the ends of opposing girders and the girders themselves do not come into contact
with each other in any bearing system. In deeper girders, the girder end rotations require
thicker joint filler between the girders in order for the girders to not come into contact
with each other. The thickness of the preformed joint filler ranges from 1 to 3inches
depending upon girder type and depth as well as the amount of expansion for which the
bridge is designed.
The area of steel provided by the #6 bar joint reinforcement across the joint in the
top mat of reinforcement is approximately equal to the area of steel from the #4
longitudinal reinforcement in both the bottom and top mats. This amount of steel enables
the link to potentially carry a high amount of force. However, the amount of force that
can be transmitted by the bearing pads and dowel bars is relatively small compared to the
tension capacity of the link. Thus the bearing pads and the tolerance space around the
dowel bars limit the magnitude of the longitudinal forces transmitted in the system except
as discussed below under considerations for longitudinal loads due to truck deceleration
and seismic forces.
It is expected that the amount of force that can be transmitted by the dowel bar is
relatively small compared to the tension capacity of the link even at a fixed bearing. The
area of steel the dowel bar provides is 1.23 in2 which is much less than the area of the
steel provided by the #6 bar joint reinforcement. As the girders move and if the dowel
comes into contact with the hole in the girder, the dowel bar is bent. Figure 4.2.2.5 is an
example of the assumed deformed shape of a dowel bar in a fixed bearing as the girder

80
moves longitudinally. The 1.23 in2 of steel is capable of resisting 24.6 kips and can only
withstand limited deformation.
Figure 4.2.2.5 – Dowel rod deflection
In the case of longitudinal loads due to truck deceleration and seismic forces,
those loads result in forces less than the design strength of the dowels at the fixed ends.
As the bridge moves longitudinally on the elastomeric bearings due to those longitudinal
forces, the dowels will impact the sides of the hole and transfer the longitudinal force to
the pier and hence to the foundation. When the deceleration or seismic load is over, the
bearings will return to their previous position and the construction tolerance gap will
exist between the dowel and metal sleeve at the fixed bearing.
If the links connecting the ends of the girders were transmitting large longitudinal
forces to the elastomeric bearing pads, maintenance reports and past experience would
have revealed effects from this tension force. Yet, no problems along these lines have
been identified in the GDOT maintenance reports or with the bridge design office. Caner
and Zia’s (1998) research also supports the assumption that the tension forces transmitted
Δ

81
forces across the joint are minimal. The results of their experimental work showed that
the link slabs were not under direct tension but rather bending with cracking at the top of
the section. Okeil and ElSafty (2005) also stated that the tension force in the joint would
be reduced “substantially” if any longitudinal movement was allowed by the bearings.
4.2.3 Rigid Body Mechanics Conclusion
The above description assumes that the dowel bars are engaged at a fixed bearing
at the start of any movement. However, because of the 0.75-inch tolerance in the bearing
hole insert, a finite movement may be required before the dowel bars are engaged. The
pin support actually works approximately like a roller until contact is achieved between
the dowel bar and the bearing hole insert. The force deformation curve that should be
used for the fixed bearing is shown in Figure 4.2.3.1. As long as the longitudinal
movement of the girder is within the 0.75-inch tolerance of the fixed bearing, no
deformation occurs in the dowel bar. A small force is generated in the bearing due to the
movement. How the fixed bearing deforms after the tolerance of 0.75 inches has been
exceeded is unknown and should be investigated. This curve could be used to model the
fixed bearings in simple-span bridges with continuous bridge decks.

82
Figure 4.2.3.1 – Force – deformation curve for the fixed bearing
4.3 Flexural Strain Discussion
The above analysis indicates that the dominant deformation of the bridge deck in
the length between the girders is due to girder end rotations – flexure. The link slab
Caner and Zia (1998) designed relieved the concentrated strain over the joint by
increasing the length over which the strain could be distributed by debonding the deck
from the girder. The GDOT continuous deck detail does not use debonding. However,
the flexural strain in the deck over the bridge pier may be calculated using the upper
bound end rotation of 0.0058 rad calculated in Section 4.1. Based on the above
explanation that little to no axial strain is occurring in the deck over the bridge pier, the
theoretical center of rotation for the flexural strain in this region will be at the mid-
thickness of the deck. Figure 4.3.1 shows the composite section at the end of one of the
girders rotating about the mid-thickness of the bridge deck.
Deformation
0.75 in. tolerance
Force
Deformation
Curve
Deformation
Curve

83
Figure 4.3.1 – Girder rotation about neutral axis of the deck. Note that the
bearing has deformed so that there is no axial strain in the deck.
4.3.1 Uncracked Deck Section
A deck section uncracked by early shrinkage and curing thermal contractions,
shown in Figure 4.3.1.1, is used to calculate the flexural strain in the length of the slab
between the girders. The upper bound girder end rotation of 0.0058 rad calculated in
Section 4.1 may be used to determine an elongation, x, of 0.046 inches at the top of the
deck in this region. Equation 4.3.1.1 is used to calculate the change in length induced by
the girder end rotations in the uncracked deck section. The distance h to the mid-
thickness of the deck is 4 inches.
hx 2 Eq. 4.3.1.1
where:
x = change in length
h = height to midthickness of the deck
θ = end rotation

84
Figure 4.3.1.1 – Uncracked deck section used for flexural strain calculation
From Section 4.1, the application of the end rotation of 0.0058 rad cracks the top
two layers in the deck (layers 1 and 2) in the length of the deck between the girders.
Because the deck over the bridge pier cracks, the tension force due to the flexure is now
carried by the steel reinforcement and the compression force is carried by the uncracked
concrete. Figure 4.3.1.2 shows the force diagram with the tension force in the steel and
the compression force in the uncracked portion of the concrete deck.
h
θ
x/2
θ
x/2
1.5-in. to 3-in.
wide joint filler L

85
Figure 4.3.1.2 – Tension and compression force diagram for uncracked deck
section
The length L, shown in Figure 4.3.1.1, over which the flexural strain was
calculated may be varied to examine the effects of debonding between the deck slab and
the girder top flange and top of the edge beam. Debonding lengths ranging from the
width of the joint filler to two times the girder length (100 feet) are considered,
representing the total potential debonding lengths. The joint filler widths are assumed to
range from 1.5 inches to 3 inches. The debonding lengths in addition to the joint filler
widths are taken as double the values of 1%, 5%, 10%, 20%, and 100% of the girder
length of 100 feet. A 24 inch length is approximately double 1% the length of the girder.
A 120 inch length is double 5% the length of the girder on each side of the joint. This is
the length of the link slab recommended by Caner and Zia’s link slab design (1998).
Lengths of 240 inch and 480 inch are double 10% and 20% the length of the girders,
respectively. A 2400 inch length is double the length of a single girder. The strain
C
T h
#6 bar joint
reinforcement

86
values were calculated using Equation 4.3.1.2, where x is the change in length as shown
in Figure 4.3.1.1 and L is the debonded lengths listed in Table 4.3.1.1.
L
xflexure Eq. 4.3.1.2
The tension force in the concrete per foot width and the area of steel per foot
width needed to support that tensile force are calculated using working stress design and
the flexural strains calculated using Equation 4.3.1.2. The tension force is calculated
using Equation 4.3.1.3 which is from the tensile stress block for the section. The area of
steel per foot width needed to withstand the calculated tensile force and prevent cracking
in the deck over the bridge pier is calculated using Equation 4.3.1.4. Equation 4.3.1.4 is
based on the tensile stress block as well, and the working stress value for the yield
strength of steel was 24 ksi.
1
122
flexure deckT h( inch ) E= Eq. 4.3.1.3
where:
T = tension force
Edeck = modulus of elasticity of deck
h = deck thickness
εflexure = flexural strain over debonded length L

87
y
sf
TA Eq. 4.3.1.4
where:
As = area of steel required for tension force
fy = yield stress of steel
The amount of #4 longitudinal bars needed to provide that amount of steel and at
what spacing per foot is then determined. The same is done with #6 longitudinal bars.
Table 4.3.1.1 presents the results of the flexural strain calculations and the amount of
reinforcement needed to control the cracking it could induce.
Table 4.3.1.1 – Uncracked Deck Section Results for Tension Force and Reinforcement
Spacing
L (in.)
ε (in./in.)
T (kips)
As (in2/ft)
#4 bars Spacing
(in.) #6 bars
Spacing (in.)
1.5 0.03067 2481.79 103.41 518 0.023 236 0.051
3 0.01147 927.97 38.67 194 0.062 88 0.136
24 0.00143 116.00 4.83 25 0.480 11 1.091
120 0.00029 23.20 0.97 5 2.400 3 4.000
240 0.00014 11.60 0.48 3 4.000 2 6.000
480 0.00007 5.80 0.24 2 6.000 1 12.000
2400 0.00001 1.16 0.05 1 12.000 1 12.000
Figure 4.3.1.3 shows the strain in the section versus debonding lengths for the
100-ft girders. Figure 4.3.1.4 shows the area of steel per foot width needed to control
cracking versus debonding length for the 100-ft girders.

88
Figure 4.3.1.3 – Strain versus debonding length
Figure 4.3.1.4 – Area of steel needed per foot width versus debonding length
As shown in Table 4.3.1.1 and Figures 4.3.1.3 and 4.3.1.4, the number of
reinforcement bars needed per foot width and their spacing per foot width are unrealistic
for all but the 2400 inch debonding length. The reinforcement layout is especially

89
unrealistic for the debonding lengths of 1.5 inches and 3 inches that are the debonding
lengths in the GDOT continuous deck detail. Thus, the rotations which produce the
flexural strain must be smaller than the rotations calculated for design purposes.
Alternately, something else is occurring which relieves the rotational demand in the deck
over the bridge pier. Cracking in the deck section induced by shrinkage and curing
thermal contraction could be relieving the rotational demand.
4.3.2 Cracked Deck Section
If a crack due to shrinkage or curing thermal contraction occurs through the depth
of the deck over the bridge pier, no flexural strain exists in that portion of the deck.
Three possible cracked sections are examined. The three cracked sections are the
uniform shrinkage section, the restrained shrinkage section, and the shrinkage plus
increased camber from creep effects.
4.3.2.1 Uniform Shrinkage Cracked Section
In the uniform shrinkage cracked section, the shrinkage is uniform through the
thickness of the deck. The crack created by the uniform shrinkage is of uniform width
through the thickness of the deck. Figure 4.3.2.1.1 shows the gap created over the bridge
pier by the uniform shrinkage.

90
Figure 4.3.2.1.1 – Gap opened through the deck by uniform shrinkage
The width of the gap opened by uniform shrinkage in the deck is unknown.
However, by applying the upper bound end rotation of 0.0058 calculated in Section 4.1,
the width of the gap needed to allow the deck to rotate without the decks of adjacent
spans coming in contact with each other can be determined. If the gap is larger than the
combined translation of the bottom of the deck, then the compression in the concrete
decks is equal to zero and no moment would exist in the deck. The crack would relieve
the flexural strain in the deck. Based on the rotation of 0.0058, the translation of the
decks of the adjacent spans at the bottom of the decks is 0.023 inches as shown in Figure
4.3.2.1.2, and the translation was calculated using Equation 4.3.2.1.1. The variable h is
the distance to the midthickness of the deck. For this example, the gap needs to be
greater than 0.046-inches wide for the compression force in the concrete to go to zero.
hntranslatio * Eq. 4.3.2.1.1
Where:
θ = rotation of slab at link joint
gap

91
4.3.2.1.2 Uniform Shrinkage Cracked Section
4.3.2.2 Restrained Shrinkage Cracked Section
In the restrained shrinkage cracked section, the shrinkage is restrained at the
bottom and causes the bridge deck to crack through the thickness. If the deck is cracked
through its thickness, no strain would occur in the deck over the bridge pier. The size of
the crack opening is not known, but like the uniform shrinkage section, the width of the
gap needed to allow the deck to rotate without the decks of adjacent spans coming in
contact with each other can be determined. The longitudinal movement of the bottom
deck layer is 0.023 inches as shown in Figure 4.3.2.2.1. The openings are calculated
using Equation 4.3.2.1.1. Figure 4.3.2.2.1 shows the crack opening at the construction
joint. For this example, the gap width again needs to be greater than 0.046 inches for the
compression in the concrete to go to zero.
h
0.023 in. 0.023 in.

92
Figure 4.3.2.2.1 – Restrained shrinkage cracked section
4.3.2.3 Shrinkage Plus Increased Camber from Creep Effect, Cracked Section
Another possibility for precast, prestressed concrete girders is that the increased
camber of the girders due to creep offsets the rotation of the deck over the bridge pier. In
a precast, prestressed concrete girder, the camber increases as creep and thermal loads
occur. This increased camber is shown in Figure 4.3.2.3.1. The increased camber causes
a rotation in the deck over the bridge pier which is opposite of the rotation induced by the
shrinkage, temperature, and live loads. This rotational demand on the deck over the
bridge pier is shown in Figure 4.3.2.3.2. The rotational demand opens a crack at the
bottom of the deck over the bridge pier and closes the crack at the top of the deck over
the bridge pier. The overall rotational demand on the bridge deck over the pier would
decrease. If the rotational demand on the bridge deck decreases, the moment in the deck
would also decrease. The decreased moment would then cause the tension and
compression forces to also decrease.
gap
0.023 in. 0.023 in.
8 in.

93
Figure 4.3.2.3.1 – Camber in precast, prestressed concrete girder
Figure 4.3.2.3.2 – Rotational demand from increased camber in a precast,
prestressed concrete girder
4.3.2.4 Flexural Strain Conclusion
The amount of reinforcement in the current GDOT continuous deck design detail
could not withstand that amount of flexural strain in the uncracked deck section produced
by the calculated upper bound rotation of 0.0058 rad and a debonding length of 1.5
inches to 3 inches. If the flexural strain calculated was occurring in the bridge deck,
evidence of deck cracking would have been found in the GDOT maintenance reports.
Kowalksy and Wing’s (2005) research further supports the idea that the rotations actually
occurring in the bridges are not as high as the calculated rotations. Their measurements
from the instrumented North Carolina bridge built using Caner and Zia’s (1998) link slab
detail showed that the simply-supported assumption was conservative and that the
θ θ

94
measured rotational demands were much lower than the design rotation suggested by
Caner and Zia (1998) and by Kowalsky and Wing (2005).
The rotational demand in the bridge deck over the pier must therefore be relieved
to some extent by an interaction occurring in the bridge. Cracking at the construction
joint could relieve the rotational demand on the deck over the bridge. For the uniform
shrinkage cracked section and the restrained shrinkage cracked section, a crack opening
greater than 0.046 inches will result in no moment occurring in the section. A crack
width of 0.050 inches, which is comparable to 0.046 inches, is shown in Figure 4.3.2.4.1.
A crack width of 0.046 inches is very small and could feasibly occur in the deck at the
construction joint. The crack width required to relieve the moment from the shrinkage
plus increased camber from creep is unknown.
Figure 4.3.2.4.1 – Crack width of 0.050 inches from crack width card
4.4 Uniform Temperature Change Discussion
The effects of the uniform temperature load from AASHTO (2007) Section
3.12.2.1 and 3.12.2.2 are also considered in the models. A uniform temperature change
does not introduce any stress into the deck, but it does result in a nonzero temperature
0.050-in. wide
crack

95
strain. The decrease or increase in length caused by the uniform temperature change
must be absorbed by the expansion joints at the abutments.
In a typical 4 span bridge, expansion bearings are placed at the girder ends at the
centerline of the deck. Expansion joints are only used at the abutments, and they absorb
the change in length from the expansion and contraction of the bridge due to the uniform
temperature change. The system is allowed to freely expand and remains stress free. If
the system is stress free, then no axial force due to temperature change develops. Figure
4.4.1 shows the typical 4 span bridge from the centerline to the expansion joint at the
abutment subjected to the uniform temperature change which generates the axial strain
and displacements.
Figure 4.4.1 – Typical unrestrained 4 span bridge with expansion joint at the
abutment subjected to the uniform temperature increase
If the expansion joint cannot accommodate the movement and free expansion is
restricted, an axial force develops in the system. The expansion joint now acts like a pin
support, and Figure 4.4.2 shows the axial force that will develop if the expansion is
restricted.
ΔL = αΔT
Centerline Link
Bridge pier
and bearing Abutment
Expansion
Joint

96
Figure 4.4.2 – Axial force from uniform temperature change in restrained system
The strain in the steel is equal to the strain in the concrete as shown
csL
L
Eq. 4.4.1
where:
ΔL = change in length
L = length of girder
ε = strain
εs = strain in steel
εc = strain in concrete
The yield strain of steel is 0.002 inch/inch, and the ultimate strain for concrete is
0.003 inch/inch; therefore, the steel yields before the concrete crushes. The stress from
the strain in the steel is calculated using Eq. 4.4.2:
F = αΔTEdeck
Centerline Link
Bridge pier
and bearing Abutment
Expansion
Joint

97
sss Ef Eq. 4.4.2
where:
fs = stress in steel
Es = elastic modulus of steel
The stress from the strain in the concrete is calculated using
cccon Ef Eq. 4.4.3
where:
fcon = stress in concrete
Ec = elastic modulus of concrete
The yield stress for steel is approximately 60 ksi, and the ultimate stress for
concrete with a modulus of 3372 ksi is approximately 10 ksi. In this example, because
the steel yields before the concrete crushes, the restrained systems will still be able to
carry the stress induced by the temperature because the temperature stress will not exceed
10 ksi.
Continuous bridge decks appear to be able to be adequately designed to withstand
thermal stresses without problematic deck cracking. If the cracks are large enough, water
could seep through and cause the joint reinforcement to corrode. In Hulsey’s (1992)
survey, only New York reported problems with cracking over bridge piers in their
continuous bridge decks. The McLaren River bridge in Alaska which Hulsey (1992)

98
studied had problems with cracking at the abutment and diaphragms over the bridge
piers, not the deck. If the freeze-thaw cycle of Alaska did not induce cracking in the
deck, other states in colder climates should also be able to avoid corrosion concerns in
their bridge decks if the temperature and shrinkage reinforcement is properly designed
and installed. Russell and Gerken (1994) also stated that the biggest problem with
continuous bridge decks is cracking or other limit states at the abutments or approach
slabs.
4.5 Conclusion
By considering basic rigid body mechanics, it is clear that the deformations must
be dominated by flexure in the continuous deck detail. Furthermore, it is clear that the
upper bound flexural strains in the deck at the construction joint calculated in this
research are indeed larger than the strains occurring in the field. Otherwise, problems
would have been cited in the maintenance reports. The conclusions reached by Kowalsky
and Wing (2005) further support the idea that the forces recommended by Caner and Zia
(1998) to design the link slab detail are not occurring. If little to no flexural strain or
tensile stress is occurring in the deck at the construction joint as hypothesized, the
temperature, shrinkage, and distribution reinforcement provided in the top and bottom
mats should be sufficient to control the cracking just like in the rest of the bridge deck.
No additional forces are occurring over the bridge pier that would require reinforcement
in addition to the shrinkage, temperature, and distribution reinforcement.

99
5. Cost Analysis
An informal cost analysis of the current continuous deck design detail was
completed by Mr. Roy H. “Buddy” Jump, Jr. of C.W. Matthews. C.W. Matthews has
served as contractor for many GDOT bridges. The main focus of the cost analysis was
how much time, labor, and cost go into building bridges using the current continuous
deck design detail. The bridge used for the analysis was a typical three to four span
bridge built for approximately $1,000,000. Factors included in the analysis were labor
and labor burden which encompassed payroll taxes, insurance, and equipment.
Based on past projects and current costs, Mr. Jump estimated the cost to construct
the continuous deck detail to be approximately $19,000 per joint. The cost would
increase in bridges with more than three to four spans. This cost included the forming,
wrecking, and cleaning of the construction joint header, the concrete mobilization and
concrete plant opening charges, and the batching and pumping of the concrete. The
labor, labor burden, and equipment costs were included in this total cost as well. Mr.
Jump also stated that the formed construction joints take approximately 3 days to
construct.
If the contractors were allowed to place the concrete deck in one continuous pour
with construction joints saw cut or tooled-in, the cost of each joint would be less than
$19,000, and construction time would approximately decrease from 3 days to 1 day. By
eliminating the construction of the continuous deck detail, the continuous deck pour
could lead to a potential monetary savings of $28,000 to $57,000 and a potential time
savings of several days of construction for each three to four span bridge. These time

100
and money savings do not consider any alteration to the current continuous deck detail.
The #6 bar joint reinforcement is still placed over the joint, and the #4 longitudinal
reinforcement is still stopped 2-in. from the joint on each side.
A design alternative was also considered by Mr. Jump during the interview with
him. The design alternative was to make the #4 longitudinal reinforcement continuous
across the joint and eliminate the #6 joint reinforcement. Mr. Jump stated that the cost
per joint would decrease from $19,000. If the construction joints were saw cut or
tooled-in, the time saved per joint would be approximately 2 days again. He stated that
whether or not the construction joint was formed, saw cut, or tooled-in, laying out the
rebar would take less time and that more bars could be produced each day. These time
savings would further reduce construction costs associated with the continuous deck
detail.
Mr. Jump also stated that if a standard form could be created for the continuous
#4 longitudinal reinforcement or for the #6 bar joint reinforcement, time would be saved
in the forming of the joint. A standard header for the continuous #4 longitudinal
reinforcement would be difficult to create. Ms. Harper, the GDOT Bridge Construction
Engineer, stated via email that she did not think it would be feasible to create a standard
header because:
“Usually the bars are tied in place and the header is built to fit. The Spacing is
not exact and we do have a tolerance of 1/2 inch in any direction on bar location.
We would potentially use more reinforcement than necessary in some spans if we
tried to standardize. In my opinion there would not be much savings in cost or
time associated with it. We do save, however, with allowing them to tool in a
joint.”

101
However, if the longitudinal deck reinforcement is not made continuous over the
joint, a standard spacing between the #6 bar joint reinforcement can still be determined.
This standard spacing could be used to create a standard header no matter what the
longitudinal reinforcement is spaced at. From Table A.1 in Appendix A, the 5.5-ft span
controls the spacing required for the #4 longitudinal bars in the top mat of reinforcement
with a spacing of 13 inches. The #6 bars would be placed at 3.3 inches which leaves a
spacing of approximately 6.5 inches in between the #6 bars. The 6.5-inch spacing o.c.
can be used as the standard spacing for all span lengths as it would satisfy the minimum
number of #6 bars for all the span lengths. Figure B.1 in Appendix B shows an example
of this header.

102
6. Preliminary Conclusions and Design Recommendations
6.1 Preliminary Conclusions
The current continuous deck design detail and its predecessors have served the
State of Georgia well since the late 1980’s. The current design detail has limited in-
service problems as shown by the GDOT maintenance reports and field observations.
However, the current continuous deck detail is difficult to build and use of the 10-ft long
#6 bars may not be required.
6.1.1 Performance History
The maintenance reports and interviews with several contractors and bridge
maintenance office staff revealed little evidence of in-service problems with the current
continuous deck detail. Of the 244 bridge maintenance reports reviewed, 2% of the
bridges reported cracking at the joints in the bridge deck. Approximately 7% of the
bridges from the bridge maintenance reports had experienced joint failure or joints
leakage. The bridge maintenance office and several contractors also did not report any
in-service problems or concerns regarding the continuous deck detail during the site visits
or interviews. From the maintenance reports and interviews the continuous bridge deck
design detail appears to be working.
However, the contractors did complain of the difficulty in building the continuous
deck detail, and the time and labor it consumes. The header required for the detail to
form the construction joint is time consuming and labor intensive to build. Laying out
the reinforcement is also difficult, especially in skewed bridges where the transverse
reinforcement must also be stopped 2 in. from the joint. The continuous deck detail

103
consumes so much time and labor that, according to Mr. Jump’s cost analysis, each
formed construction joint costs approximately $19,000. This price includes labor, labor
burden, and equipment.
6.1.2 Current Practices
Continuous bridge decks are used throughout the United States. Of the 44 states
that responded to Hulsey’s (1992) survey, 72.73% of those states used continuous bridge
deck designs. Most of the problems reported with the use of continuous bridge decks
concerned the approach slab and abutment (Russell and Gerken, 1994 and Hulsey, 1992).
Wing and Kowalsky (2005) proved through their monitoring of a bridge built using
Caner and Zia’s (1998) link slab design that Caner and Zia’s (1998) link slab design
worked without any major problem. Wing and Kowalsky (2005) also showed that
continuous bridge decks with link slabs can be designed as simple span bridges.
Continuous deck details were also found for Florida and Texas. Florida places additional
longitudinal reinforcement in the top mat of reinforcement. Both the top and bottom mat
reinforcement are continuous over the joint. Texas continues the longitudinal
reinforcement across the joint in both the top and bottom mats without placing any
additional reinforcement. Whatever detail is used by states for their continuous bridge
decks, the performance of continuous deck bridges nationwide appears to be satisfactory,
but with room for improvement, especially for the design at the abutments.

104
6.1.3 Current Continuous Deck Detail Analysis
An analysis of the forces the continuous deck detail must withstand was carried
out using beam theory. Shrinkage, temperature, and live load forces were considered.
The results of the beam theory showed that the upper and lower bounds of the final girder
end rotations, 0.0058 radians/inch and 0.0055 radians/inch, were close in value to the
typical live load deflection limit of L/800. The flexural strain induced in the deck link
between the girders due to these end rotations was large. Enough reinforcing bars could
not be realistically placed to prevent cracking. The flexural strain is believed to be
relieved by cracks which form in the deck from shrinkage in all bridges and from
increased camber in precast, prestressed girder bridges. If the crack is large enough in
width, the bridge decks of adjacent spans do not come into contact with one another
while they rotate; subsequently, no tension or compression force is developed in the deck.
Without tension or compression forces, no moment can form.
A rigid body mechanics analysis was also completed. In the model of the bridge
at the construction joint, the fixed bearings act as pins, and the expansion bearings act as
rollers. When the deck is subjected to axial and normal forces, the girders undergo end
rotation. The bearings allow the girders to move longitudinally. This translational and
rotation freedom at the bearings reduces the tension force across the construction joint to
zero.
6.1.4 Length Recommendations
The potential length of a bridge with a continuous bridge deck is limited by the
type of expansion joint used to absorb the movement at the bridge abutments. In the

105
State of Georgia, the Evazote expansion joint is preferred because of its low material and
installation costs and its satisfactory performance. However, the Evazote joint only has a
range of 2.25 inches. In Tennessee, a bridge approximately 2700 ft long was opened in
1981 with the only expansion joints at the end abutments. The performance of the
Kingsport Bridge in Tennessee suggests that the length of a continuous deck can be over
2700 ft (Burdette, et al., 2003). The main problem for the bridge in-service was leakage
at the original finger joints installed at the abutments. The finger joints were replaced by
modular expansion joints in 1997. Russell Bridge has built continuous bridge decks
without expansion joints at all (Bridge, et. al., 2005). The continuous bridge deck is built
in combination with continuously reinforced concrete pavement and approach slabs. The
movements are absorbed by the entire continuous system (Bridge, et. al., 2005).
6.2 Preliminary Design Recommendations
6.2.1 Reinforcement Layout
A preliminary recommendation for design consideration is that the detail be
modified. In the new recommended continuous deck detail, the existing longitudinal
reinforcement consisting of #4 bars in the top and bottom layers of the deck
reinforcement should be extended across the joint. The #4 bars should not be stopped 2
inches from the joint. They can be lap spliced as needed. The combined area of the top
and bottom #4 bars crossing the joint is about the same as the area of the #6 bars that
would cross the joint in the current detail. This amount of steel appears to be sufficient in
controlling cracks based on the maintenance reports and interviews with GDOT
maintenance personnel and contractors. Therefore, if little to no tensile or flexural strain

106
is occurring in the bridge deck over the bridge pier, temperature and shrinkage
reinforcement should be adequate to control cracking in that region. Figures 6.2.1.1 and
6.2.1.2 are the plan and section views, respectively, of the recommended continuous deck
detail. Table A.2 in Appendix A provides example reinforcement layouts for the #4 bars
to be made continuous over the joint based on the AASHTO (1990) Section 3.24.10
discussed in Chapter 1.

107
Figure 6.2.1.1 – Plan view of recommended continuous deck detail with #4 bar longitudinal reinforcement continuous over
joint (modified from GDOT SR 46 Over Oconee R. plan)
#4 bar top and
bottom mat
longitudinal
reinforcement
continuous over
joint
CL
BEAM
6
10” DIAPHRAGM
(TYP.)
REQ’D CONST.
JT. IN DECK AT
BENT
EXP. JT. IN
DECK AT
BENT
REQ’D CONST.
JT. IN DECK
AT BENT
CL
BEAM
4
CL
BEAM
2
CL
BEAM
1
CL
BEAM
5
CL
BEAM
3

108
Figure 6.2.1.2 – Section view of recommended continuous deck detail with #4 bar
longitudinal reinforcement continuous over joint (modified from GDOT SR 46 Over
Oconee R. plan)
6.2.2 Reinforcement Layout Discussion
One of two conditions must exist to make the new continuous deck design detail a
better alternative. If contractors have proven they can successfully install saw cut or
tooled-in construction joints, one continuous concrete pour should be allowed as long as
the joints are still inspected.
The other condition is that the reinforcement layout should be easier to construct.
Mr. Jump stated that making the #4 longitudinal reinforcement continuous over the joint
in both the top and bottom mats would be easier to layout and that more bars could be
produced in a day. Also, if the #4 longitudinal reinforcement is not made continuous
over the joint, the #6 bar joint reinforcement should be placed at a standard spacing of 6.5
inches o.c., no matter the longitudinal reinforcement spacing, as shown in Figure B.1 in
Appendix B. By standardizing the #6 bar joint reinforcement, a standard header can be
created, and time and labor costs can be reduced. In the interview with Mr. Jump, he
S
#4
longitudinal
bars, top
and bottom
layers

109
stated that reusable, standard headers would eliminate much of the time needed to form,
wreck, and clean-up the header.
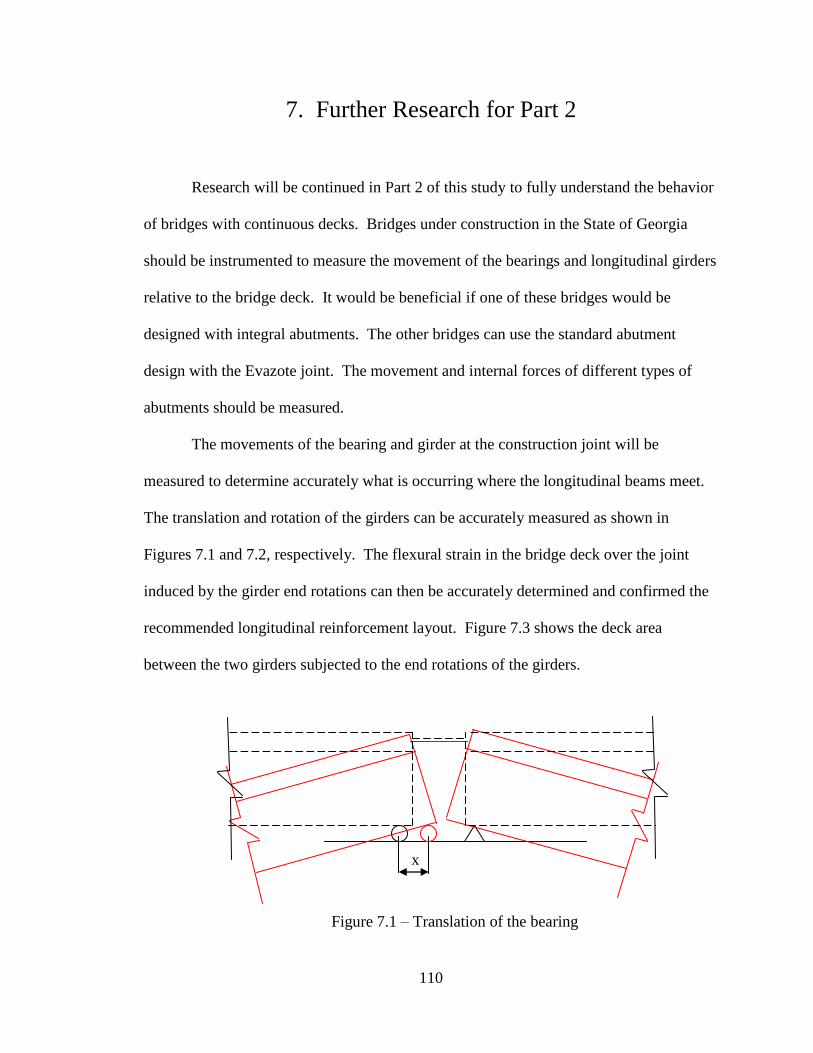
110
7. Further Research for Part 2
Research will be continued in Part 2 of this study to fully understand the behavior
of bridges with continuous decks. Bridges under construction in the State of Georgia
should be instrumented to measure the movement of the bearings and longitudinal girders
relative to the bridge deck. It would be beneficial if one of these bridges would be
designed with integral abutments. The other bridges can use the standard abutment
design with the Evazote joint. The movement and internal forces of different types of
abutments should be measured.
The movements of the bearing and girder at the construction joint will be
measured to determine accurately what is occurring where the longitudinal beams meet.
The translation and rotation of the girders can be accurately measured as shown in
Figures 7.1 and 7.2, respectively. The flexural strain in the bridge deck over the joint
induced by the girder end rotations can then be accurately determined and confirmed the
recommended longitudinal reinforcement layout. Figure 7.3 shows the deck area
between the two girders subjected to the end rotations of the girders.
Figure 7.1 – Translation of the bearing
x

111
Figure 7.2 – Rotation of the girder about the mid-thickness of the bridge deck
Figure 7.3 – Flexural strain in the link slab
The measurements from the experimental bridges can confirm the finding that
little to no tension force exists in the bridge deck connecting the girders. The
measurements determining the flexural strain would be instrumental because the flexural
strain calculations completed for this research are very high. As no significant problems
θ
θ θ

112
are being reported regarding the construction joints, these flexural strains may not be
occurring. Information regarding the bearing translation and girder rotation would be
used to create accurate boundary conditions for analysis models and would help in the
design of new bridges.
Skewed bridges have also been left out of this Part 1 of the project as more
information is needed to conduct an accurate analysis. In skewed bridges, the transverse
deck reinforcement is also stopped 2 in. from the construction joint. The effects of
continuing both the transverse and longitudinal existing deck reinforcement across the
joint are unknown and difficult to estimate accurately. How the reinforcement interacts
with the torsion effects introduced into the bridge deck from the transverse thermal
expansion is unknown.
The transverse thermal expansion in bridges has largely been ignored, and its
effects are frequently not considered in design of the bridges. However, past bridges with
large width to span length ratios have been affected adversely by the restrained transverse
movements. Torsion forces introduced into the deck caused deck cracking.
The durability of the existing reinforcement across the joint is not considered a
problem. No corrosion problems with the #6 epoxy coated bars across the joint have
been reported in continuous bridge decks on skewed bridges. Therefore, crossing the top
mat of #4 longitudinal and transverse deck reinforcement across the joint is not expected
to introduce corrosion unless more cracking occurs due to the increased amount of
transverse reinforcement crossing the joint and resulting restraint.

113
Appendix A
Deck Reinforcement Spacing and Ratios

114
Table A.1 – Reinforcement spacing and ratios for #4 and #7 bars in the circa 1987 continuous deck detail
S
(ft)
As
required
(in.2)
Adeck
(in.2)
No.
of #4
top
layer
bars
#4 bar
spacing
top
layer
(in.)
No. of
#4
bottom
layer
bars
#4
spacing
bottom
(half-
span)
(in.)
Spacing
allowed
(in.)
#4
spacing
bottom
(quarter-
span)
(in.)
As #4
bars/ft
(in.2/ft)
ρ (#4
bars top
and
bottom
layers)
#7 bar
spacing
(in.)
#7 bar
As/ft
(in.2/ft)
ρ (#7
bars)
5 1.12 480 4 15 2 30 18 15 0.27 0.0028 3.75 1.92 0.240
5.5 1.24 528 5 13.2 3 16.5 16.5 8.25 0.33 0.0034 3.3 2.18 0.273
6 1.35 576 5 14.4 3 18 18 9 0.30 0.0031 3.6 2.00 0.250
6.5 1.46 624 5 15.6 3 19.5 18 9.75 0.28 0.0029 3.9 1.85 0.231
7 1.57 672 6 14 3 21 18 10.5 0.30 0.0031 3.5 2.06 0.257
7.5 1.69 720 6 15 3 22.5 18 11.25 0.28 0.0029 3.75 1.92 0.240
8 1.80 768 6 16 3 24 18 12 0.27 0.0028 4 1.80 0.225
8.5 1.91 816 7 14.6 4 25.5 18 12.75 0.278 0.0029 3.6 1.98 0.25
9 2.02 864 7 15.4 4 27 18 13.5 0.267 0.0028 3.9 1.87 0.23
9.5 2.13 912 8 14.3 4 28.5 18 14.25 0.277 0.0029 3.6 2.02 0.25
10 2.25 960 8 15 4 30 18 15 0.267 0.0028 3.8 1.92 0.24

115
Table A.2 – Reinforcement Spacing and ratio for recommended continuous deck detail
S
(ft)
As
required
(in.2)
Adeck
(in.2)
No. of
#4 top
layer
bars
#4 bar
spacing
top
layer
(in.)
No. of
#4
bottom
layer
bars
#4
spacing
bottom
(half-
span)
(in.)
Spacing
allowed
(in.)
#4
spacing
bottom
(quarter-
span)
(in.)
As #4
bars/ft
(in.2/ft)
ρ (#4
bars top
and
bottom
layers)
5 1.12 480 4 15 2 30 18 15 0.27 0.0028
5.5 1.24 528 5 13.2 3 16.5 16.5 8.25 0.33 0.0034
6 1.35 576 5 14.4 3 18 18 9 0.30 0.0031
6.5 1.46 624 5 15.6 3 19.5 18 9.75 0.28 0.0029
7 1.57 672 6 14 3 21 18 10.5 0.30 0.0031
7.5 1.69 720 6 15 3 22.5 18 11.25 0.28 0.0029
8 1.80 768 6 16 3 24 18 12 0.27 0.0028
8.5 1.91 816 7 14.6 4 25.5 18 12.75 0.278 0.0029
9 2.02 864 7 15.4 4 27 18 13.5 0.267 0.0028
9.5 2.13 912 8 14.3 4 28.5 18 14.25 0.277 0.0029
10 2.25 960 8 15 4 30 18 15 0.267 0.0028

116
Appendix B
Recommended Standard Construction Joint Header

117
Figure B.1 – Recommended #6 bar joint reinforcement spacing for standard
header design
6.5-in. o.c. spacing in
top layer (typ.)
S

118
References
Agom Metal Rubber Engineering (2009). “Laminated Bearings” Retrieved March 31, 2009, from
http://www.agom.it/index.aspx?m=53&did=154.
AASHTO (2007). AASHTO LRFD Bridge Design Specifications 4th Edition, American
Association of State Highway and Transportation Officials.
ACI Committee 318 (2008). “Building Code Requirements for Structural Concrete (ACI 318-08)
and Commentary” American Concrete Institute. Farmington Hills, Michigan, 2008.
Barker, R. M., and Puckett, J.A. (2007). Design of Highway Bridges: An LRFD Approach 2nd
Edition. New Jersey, John Wiley and Sons, Inc.
Bridge, R.Q., Griffiths, S.J. and Bowmaker, G.J. (2005) “The Concept of a Seamless
Concrete Pavement and Bridge Deck.” Proceedings, Australian Structural
Engineering Conference, IE Aust, Newcastle, Australia.
Burdette, E. G., Goodpasture, D.W., and Deatherage, J.H. (2003). "A Half-Mile of Bridge
Without a Joint." ACI Concrete International v 25, n 2, Feb. 2003, pp 47-51
Caner, Alp (1996), “Analysis and Design of Jointless Bridge Decks Supported by Simple-Span
Girders,” Ph.D. Dissertation, North Carolina State University, Raleigh, NC
Caner, A., and Zia, P. (1998). "Behavior and Design of Link Slabs for Jointless Bridge Decks."
PCI Journal May-June: 68-80.
Craig, R. R. (2000). Mechanics of Materials. New York City, John Wiley and Sons.
El-Safty, A.K. (1994), “Analysis of Jointless Bridge Decks with Partially Debonded Simple Span
Beams,” Ph.D. Dissertation, North Carolina State University, Raleigh, NC
Franco, J. M. (1999). Design and Field Testing of Jointless Bridges, West Virginia University.
MS: 209. http://wvuscholar.wvu.edu (Accessed March 31, 2009)
Griffiths, S.J., et al. (2005) “Design and Construction of Seamless Pavement onWestlink M7,
Sydney, Australia” Proceedings, 8th International Conference on Concrete Pavements
Colorado Springs, Colorado.
Hulsey, J. Leroy (1992), “Bridge Lengths: Jointless Prestressed Girder Bridges,” Transprotation
Research Center, Institute of Northern Engineering, University of Alaska, Fairbanks, AK
pp. 51

119
Liles, P. (2005, Revised 2009). GDOT Bridge and Structures Design Policy Manual, Georgia
Department of Transportation. http://www.dot.state.ga.us/doingbusiness/PoliciesManuals
(Accessed March 31, 2009)
Mealer, Danny. (2007). Bridge Maintenance Report - Bridge ID. 295-5095, Georgia Department
of Transportation: Atlanta, GA.
Okeil, Ayman M. and ElSafty, Adel (2005), “Partial continuity in Bridge Girders with Jointless
Decks,” Practice Periodical on Structural Design and Construction, ASCE, vol. 10, n. 4
Nov. 2005, pp. 229-238
Robertson, R. (2009). Structures Manual. S. Division, Florida Department of Transportation.
Volume 1 Design Guidelines. http://www.dot.state.fl.us/structures/StructuresManual
(Accessed March, 31, 2009)
Roeder, Charles W. (2002), “Thermal Movement Design Procedure for Steel and Concrete
Bridges,” Report to NCHRP 20-07/106, Dept. of Civil Engineering, University of
Washington, Seattle, WA April 2002, pp. 80
Russell, H. G., and Gerken, L. J. (1994). "Jointless bridges - the knowns and the unknowns."
ACI Concrete International v 16 n 4 April 1994, pp. 44-48
Simmons, S. E. (2001). Bridge Design Manual, Texas Department of Transportation.
http://onlinemanuals.txdot.gov/txdotmanuals/des/index.htm (Accessed March 31, 2009)
Thippeswamy, H. K., et al. (2005). "Performance Evaluation of Jointless Bridges,"
Journal of Bridge Engineering ASCE v. 7 n. 5 May 2005, pp. 276-289
Wang, W., and Teng, S. (2007). "Modeling Cracking in Shell-Type Reinforced Concrete
Structures." Journal of Engineering Mechanics ASCE,June: 677-687
Watson Bowman Acme, Corp. (2007). "Wabo Evazote UV" Retrieved March 31, 2009,
from http://www.wbacorp.com/Products/.
Wing, K. M. and Kowalsky, M.J. (2005). "Behavior, Analysis, and Design of an Instrumented
Link Slab Bridge." Journal of Bridge Engineering ASCE v. 10 n. 3, March pp. 331-344