Evaluation of Ontario’s Cap and Trade Regulation
105
Evaluation of Ontario’s Cap and Trade Regulation Student’s name: Judy But Supervisor’s name: Professor Mark Winfield Date of submission: July 29, 2016 A Major Project submitted to the Faculty of Environmental Studies in partial fulfillment of the requirements for the degree of Master in Environmental Studies, York University, Toronto Ontario, Canada. Student’s signature: _____________________________________ Supervisor’s signature: _____________________________________
Transcript of Evaluation of Ontario’s Cap and Trade Regulation

Evaluation of Ontario’s Cap and Trade Regulation
Student’s name: Judy But
Supervisor’s name: Professor Mark Winfield
Date of submission: July 29, 2016
A Major Project submitted to the Faculty of Environmental Studies in partial
fulfillment of the requirements for the degree of Master in Environmental Studies,
York University, Toronto Ontario, Canada.
Student’s signature:
_____________________________________
Supervisor’s signature:
_____________________________________

ii

iii
Acknowledgements
The author would like to acknowledge and thank Professor Mark Winfield’s contribution in
developing the analytical framework used in this report. The author thanks Professor Patricia
Perkins for the ongoing advisory support and guidance throughout the course of the MES
program.
Disclaimer
This report does not represent the views of any organization and are solely the views of the
author.

iv
Foreword
The study on Energy Policy and Sustainable Energy Transitions has been a special area of
research for me, as it involved studying past regimes, discourses and policies that developed
Ontario’s energy sector. The Green Energy Green Economy Act, 2009 rapidly evolved Ontario’s
renewable energy and conservation policies. In less than a decade, Ontario’s energy sector is
undergoing a new reform in support of a low-carbon energy transition. In the context of
studying Ontario’s progress towards a sustainable low-carbon path, it will be important to
understand the context of the Climate Change Mitigation and Low-carbon Economy Act, 2016
on the developments in the energy sector. This understanding will be achieved through a policy
evaluation of Ontario’s cap and trade program to assess the progress towards a sustainable
energy transition. This evaluation will examine the approach that Ontario plans to use to reduce
emissions significantly with carbon pricing established in the cap and trade program. An
evaluation of Ontario’s cap and trade regulation coming into force in 2017 will be a centerpiece
of my research and an important evaluation of Ontario’s progress towards sustainability.
With this evaluation, it has strengthened my understanding on the interactions of climate policy
on the energy sector. The needs of the future energy system, with consideration of climate
change, will impact the development of energy policies, energy planning and infrastructure
development. This paper relates to my plan of study in many respects: understanding the
rationale of emerging provincial climate policy to uncover discourses in the development of the
policy design (objective 1-1); assessing carbon reduction policy, their impact and the design of
cap and trade systems (objective 2-2); exploring the potential changes to regulatory frameworks
to enable achievement of climate policy goals (objective 2-3); understanding the changes to
energy infrastructure that forms a central part of a sustainable energy transition (objective 3-2);
and conducting a policy evaluation of the cap and trade program to inform progress on the
sustainable energy transition (objective 3-3).

v
Abstract
Using an interdisciplinary framework, this paper evaluates the effectiveness of Ontario’s cap and
trade regulation to achieve sustained emission reductions. This framework is shaped by six
evaluation criteria to assess the program’s effectiveness: (1) comprehensiveness in scope and
coverage of emissions; (2) distributional fairness in the allocation of allowances; (3)
effectiveness of the market design; (4) transparency of accommodations and flexibility
arrangements; (5) measurability of emission reductions; and (6) the program’s integration
potential with broader political, economic and environmental policy initiatives.
First, all greenhouse gas emissions (GHG) emissions consistent with the Kyoto Protocol are
covered using upstream and downstream points of regulation. The allowance decline cap will be
sufficient to meet provincial emission targets of 15% by 2020. Second, based on a mix of
auctioned allowances and transitional assistance, the analysis indicates that the value of
allowances distributed can potentially accrue to industries for at least the first compliance period.
Third, the effectiveness of the program will depend on enforceability, monitoring and oversight
of the market rules to facilitate price discovery. There will be transparency in the criteria for
eligibility of free allowances, circumstances allowing for flexibility arrangements, and the
reporting of the action plan evaluations every year. Forth, accommodations and flexibility
arrangements will be provided to industries to mitigate the risk of carbon leakage and in
maintaining competitiveness. Fifth, until the carbon price reaches levels that could prompt
significant technological progression by industry, the measurability of emission reductions by
2020 will depend on the implementation of complementary policies set out in the climate change
action plan to support sustainable reductions in all sectors of the economy. The measurability of
emissions will depend on the enforceability of the submission requirement to confirm facility
and provincial level emission reductions. Sixth, Ontario’s design of the cap and trade program
will be aligned with broader policy goals at the provincial and federal levels.
To inform future program development, key themes are outlined. Monitor the performance of
the market rules in creating an efficient, transparent, enforceable and effective market for many
years to come, as well as the provision for accommodations and flexibility arrangements.
Enhance the measurability and sustainability of emission reductions by ensuring successful
implementation of the climate change action plan and assessing the cost-effectiveness of the

vi
initiatives funded by cap and trade proceeds. Continue reviewing the implementation of the cap
and trade program, progress of the climate change action plan, long-term goals and alignment of
the program with forthcoming federal climate policy.
Keywords: climate change; effectiveness; accommodations; flexibility; measurability;
sustainability; integration
vii
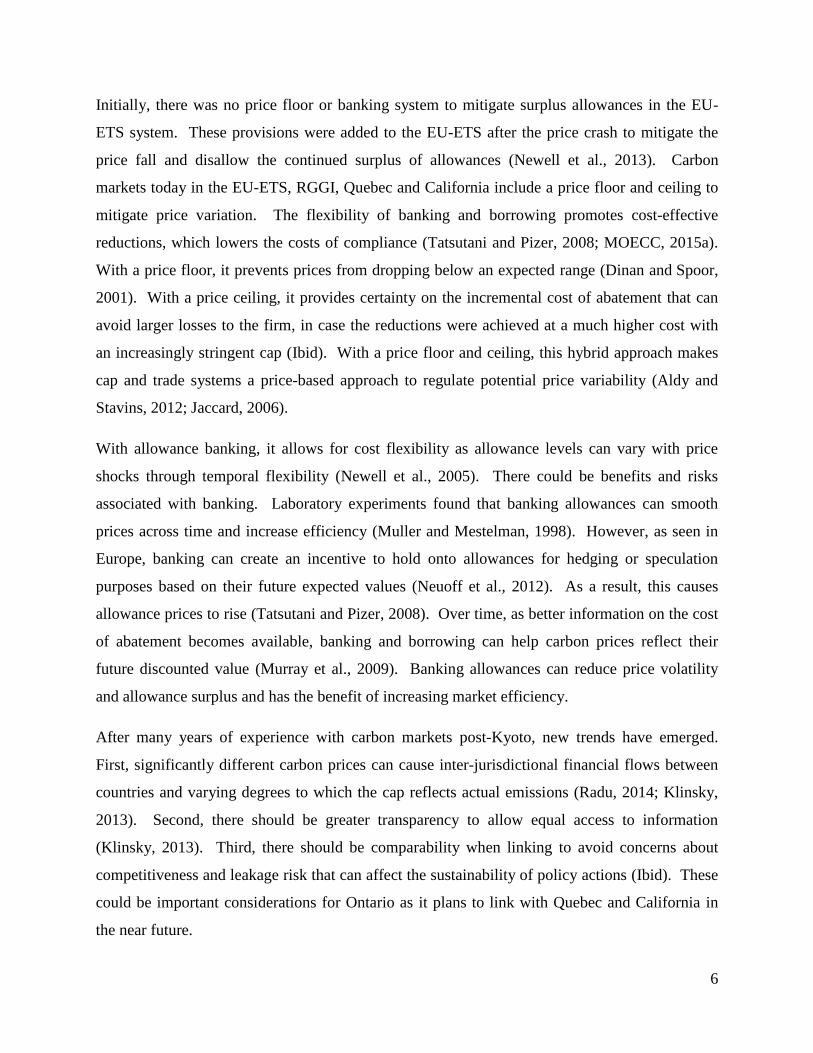
Acronyms and Definitions 1
CO2. Carbon dioxide emissions from fuel combustion that depend on fuel properties such as
carbon content, density, heating value and combustion technology.
CH4. Methane emissions from fuel combustion are technology-dependent.
HFC. Hydrofluorocarbons are used as alternatives for ozone-depleting substances in
refrigeration, air conditioning, building insulation, fire extinguishing systems and aerosols.
GWP. Global Warming Potential allows for the comparison of greenhouse gases relative to
their carbon dioxide equivalent. The GWP referenced in this report is based on a 100-year time
horizon based on the Second Assessment Report of the Intergovernmental Panel on Climate
Change (IPCC).
NF3. Nitrogen trifluoride is used in the electronics industry as replacements for PFC and SF6
including the manufacture of semiconductors, liquid crystal display panels and photovoltaics.
N2O. Nitrous oxide emissions are generally emitted from industry as a by-product of fossil fuel
combustion.
PFC. Perfluorocarbons are used as alternatives for ozone-depleting substances in
manufacturing semiconductors, refrigerants and solvents in the electronics industry.
SF6. Sulphur hexafluoride is a synthetic gas that is used in the electricity sector for insulating
high-voltage equipment.
1 2015 National Inventory Report, Environment and Climate Change Canada, and U.S. Environmental Protection
Agency (2016)

viii
Table of Contents
1. Introduction ............................................................................................................................. 1
2. Background of Climate Change Policy Context...................................................................... 1
2.1 Market-Based Carbon Pricing Options ................................................................................ 1
2.2 Post-Kyoto and Emerging Context ...................................................................................... 3
2.3 History of Climate Policy in Ontario ................................................................................... 4
2.4 Lessons Learned from Other Jurisdictions ........................................................................... 5
3. Overview of Climate Policy in Ontario ................................................................................... 7
3.1 Climate Change Mitigation and Low-carbon Act, 2016 (Bill 172) ..................................... 7
3.2 Cap and Trade Program Regulation (O. Reg. 144/16) ......................................................... 9
3.3 Methodology for Free Allowance Distribution .................................................................. 10
3.4 Reporting Regulation and Guideline for Quantification, Reporting and Verification of
Emissions (O. Reg. 143/16) ...................................................................................................... 10
3.5 Climate Change Action Plan (2016-2020) ......................................................................... 11
4. Research Design and Methodology ......................................................................................... 12
4.1 Research Question .............................................................................................................. 12
4.2 Research Design ................................................................................................................. 12
4.3 Study Methodology ............................................................................................................ 14
5. Scope of Ontario’s Cap and Trade Program ............................................................................ 15
5.1 Scope of Emissions Coverage ........................................................................................... 15
5.2 Scale of Coverage Through Points of Regulation .............................................................. 16
5.3 Treatment of Emissions from Existing and New Facilities................................................ 19
5.4 Stringency of the Cap Decline ........................................................................................... 20
5.5 Assessment ......................................................................................................................... 20
6. Distribution of Benefits and Costs from Allowance Allocations ............................................ 23
6.1 Allocation Approaches: Risks and Benefits ....................................................................... 23
6.2 Distributional Outcome of Allowance Allocations ............................................................ 23
6.3 Distributional Effects of Free Allowances to Industry....................................................... 24
6.4 Distribution Effects of Allowances to Consumers ............................................................. 28
6.5 Assessment ......................................................................................................................... 30
7. Effectiveness of Market Design ............................................................................................ 32
7.1 Market Design and Administration .................................................................................... 32
7.2 Efficiency ........................................................................................................................... 33

ix
7.3 Transparency ...................................................................................................................... 35
7.4 Market Enforcement ........................................................................................................... 36
7.5 Effectiveness ...................................................................................................................... 37
7.6 Assessment ......................................................................................................................... 38
8. Transparency of Accommodations and Flexibility Arrangements .......................................... 40
8.1 Accommodations ................................................................................................................ 40
8.2 Flexibility Arrangements.................................................................................................... 46
8.3 Other Accommodations and Flexibility Arrangements ..................................................... 48
8.4 Assessment ......................................................................................................................... 50
9. Measurability of Emissions and Impact ................................................................................ 53
9.1 Measurement of Emissions ................................................................................................ 53
9.2 Reporting Requirements ..................................................................................................... 54
9.3 Verification of Emissions ................................................................................................... 56
9.4 Climate Change Action Plan Supporting GHG Reductions............................................... 56
9.5 Assessment ......................................................................................................................... 58
10. Integration with Other Measures ........................................................................................... 60
10.1 Politics of Ontario’s Climate Policy................................................................................. 60
10.2 Economic Policy Considerations ..................................................................................... 62
10.3 Environmental Policy Considerations .............................................................................. 66
10.4 Assessment ....................................................................................................................... 67
11. Risk Analysis ......................................................................................................................... 68
12. Conclusion and Recommendations ........................................................................................ 69
References ..................................................................................................................................... 74

x
Appendices
Appendix 1: Emissions in Ontario by Sector and Source (2013 Actuals) ................................... 83
Appendix 2: Product-Output Benchmark and Historical Absolute Allocations .......................... 84
Appendix 3: Potential Distribution of Free Allowances by Allocation Method (a simplified
approach using 2013 emissions) ................................................................................................... 86
Appendix 4: Regression Methodology to Estimate Competitiveness Effects on EITE Industries
in Ontario ...................................................................................................................................... 87
Appendix 5: Market Power of Canadian Industries (2010) ......................................................... 89
Appendix 6: Climate Change Action Plan Initiatives .................................................................. 90
Appendix 7: Auction Results for Joint Cap and Trade Program in Quebec and California (2012
to Present) ..................................................................................................................................... 91
Appendix 8: Pooling of Allowances and Banking Provision, Linking with Ontario .................. 92
Appendix 9: Ontario’s EITE Sector Risk Ranking ...................................................................... 93
Appendix 10: California’s Industry Assistance Factors from 2013-2020 ................................... 94
Appendix 11: General Guidance for Practitioners on Climate Change Considerations in
Environmental Assessments ......................................................................................................... 95

1
1. Introduction
Climate change is one of the most urgent issues we are facing today and in the coming decades
due to the dangerous risks that global warming can cause on the environment and natural
ecosystems. Due to this risk, it has justified collective action from the global community to
mitigate climate change through participation in the United Nations Framework Convention on
Climate Change (UNFCCC). Canada has made a major pivot to propose a national carbon price
with the provinces and has been developing forthcoming climate policy with the U.S. and
Mexico. Canada’s international commitment to fight climate change has been strengthened by
Ontario’s leadership on climate change mitigation, including the closure of coal-fired generation
and the development of renewable energy and conservation policies supported by the Green
Energy Green Economy Act, 2009. Ontario’s commitment to fighting climate change is further
strengthened by the Climate Change Mitigation and Low-carbon Economy Act, 2016 that
enables deep decarbonisation.
2. Background of Climate Policy Context
2.1 Market-Based Carbon Pricing Options
Since the 1920s and 1960s, carbon taxes and cap and trade have been introduced as market
driven policies to internalize the price of carbon in order to mitigate GHG emissions. Both
approaches have different risks and implications. Carbon taxes fix the price of carbon, allowing
the market to determine the optimal level of emission reductions. This contrasts with a cap and
trade system that controls emissions, leaving the market to determine the price. As a result,
while there is certainty with the cost of reducing greenhouse gases with carbon taxes, there is
certainty on the quantity of emissions reduced with a cap and trade program. Due to the
diversity of emissions in most economies and different abatements costs for emission sources,
the conventional approaches of using a command and control system and performance standards
have likely not been sufficient, which brought increasing attention to market-based carbon
pricing options (Aldy and Stavins, 2012).
In Canada, both a carbon tax and a cap and trade system have been used for the past two
decades. A $30 per tonne carbon tax was implemented in British Columbia in 2008. This was

2
followed by an emissions tax on coal and petroleum coke implemented in Manitoba in 2014.
Since Alberta’s 2007 Specified Gas Emitters Regulation that placed intensity-based limits on
industrial emissions, a carbon tax on its large industrial emitters is planned to come into force in
2017. Quebec started its cap and trade program earlier in 2013 and joined California’s cap and
trade program in five joint auctions to date. Ontario will be administering a joint cap and trade
program in 2017, with plans to join Quebec and California in a linked cap and trade system in
the near future. Ontario, Quebec and British Columbia have aggressive targets in the near and
long term, while Alberta and Saskatchewan with the most carbon intensive economies will need
to reverse the emissions growth that came with their booming oil industries and fast-growing
populations (McCarthy, 2016a). Ontario, Alberta, Quebec and British Columbia representing
80% of Canada’s GHG emissions will use some form of broad carbon price to shift the economy
away from its dependence on fossil fuels (Ibid).
In a carbon tax system, a levy is charged on each unit of carbon dioxide emitted. Carbon taxes
can achieve emissions reductions efficiently as firms optimize carbon reductions such that the
cost of an incremental emission is equal to the carbon tax (Hearing before the Committee on the
Budget House of Representative, 2007). From a climate perspective, the same cumulative
reductions can occur at a lower cost with a carbon tax that shifts reductions in the year that are
cheapest to undertake (Hearing before the Committee on the Budget House of Representative,
2007). As a result, carbon taxes can encourage cost-effective, market-driven reductions in a
year. Carbon taxes can be perceived to double tax the firms for both abatement and tax
payments to the government (Stavins, 2008) but the fiscal revenues could be used for
employment or other tax benefits that improve economic growth, thereby creating a double
dividend (Baranzini et al., 2000; Jaccard, 2006). From a consumer’s perspective, the carbon
price for Ontario was estimated to be in the range of $70 per tonne to fund tax reductions, which
could impose an additional cost of $50 per month on households (Sawyer et al., 2016). The
political acceptance of a carbon tax introduces the consideration of alternatives to guide cost-
effective emission reductions, technology choices and behavioural changes to achieve significant
emission reductions.
In a cap and trade program, the government sets a cap on emissions to achieve provincial
emissions targets and divides the cap into allowances. Program participants buy allowances

3
from the government to cover their expected emissions, while some may require transitional
assistance. Through the trading of allowances on the carbon market, it allows the most cost-
effective emission reductions to happen first and minimizes the total cost of attaining an
emissions target (Pew Centre on Global Climate Change, 2008; 2011). Firms that reduce their
emissions sooner will lower their cost of compliance and benefit from making fewer allowance
purchases over time. With international trading, it also lowers the costs compared to a domestic
unlinked system (Hearing before the Committee on Energy and Natural Resources US Senate,
1999). This is confirmed in Ontario as international linking can lower the carbon price from
$157 to $18 per tonne in 2017 (Sawyer et al., 2016). A potential drawback with cap and trade
systems is that government intervention is required in allocating the cap, which can result in
distributional issues among program participants.
Although the carbon prices have ranged from $1 US to $130 per tonne 2, 85% of global
emissions priced below $10 per tonne including the European Union Emission Trading Scheme
(EU-ETS), Chinese pilot trading systems and U.S. Regional Greenhouse Gas Initiative (RGGI)
are considered to be lower than the theoretical prices estimated in models to meet the 2°C
climate stabilization goal recommended by scientists (EcoFys, 2015). These findings support the
fact that cap and trade systems can lead to lower cost compliance to attain an emissions target.
As well, participating in a cap and trade program has the benefit of enabling harmonization with
other countries, as more than 35 countries are regulating two-thirds of global emissions with a
cap and trade program (Stavins, 2008; EcoFys, 2015; Littell and Farnsworth, 2016). Regardless
of the method used, revenues from carbon pricing lead to interesting debate on how best to use
the proceeds. This may include investing in low-carbon technology and infrastructure projects,
while reducing income taxes, government debt and providing transitional assistance to industry
(Canada’s EcoFiscal Commission, 2016).
2.2 Post-Kyoto and Emerging Context
Since 1992, the signing of the United Nations Framework Convention on Climate Change
(UNFCCC) by 154 nations led to the agreement in stabilizing emissions to a level that would
prevent dangerous anthropogenic interference with climate change (McCarthy Tétrault LLP,
2 Carbon taxes have ranged from $1 US per tonne in Mexico and Poland to more than $60 per tonne in Switzerland
and Finland, and $130 per tonne in Sweden (EcoFys, 2015). In a cap and trade system, prices have ranged from $5
US per tonne in New Zealand to $36 per tonne in Tokyo (Ibid).

4
2015). The UNFCCC came into effect in 1994 and subsequent negotiations led to the signing of
the Kyoto Protocol in 1997. The Kyoto negotiations established market-based mechanisms such
as an emissions trading program, the Clean Development Mechanism and Joint
Implementation.3, 4
Now, 20 years after Kyoto, the earlier prospect of a global emission trading
market created national and sub-national trading schemes in the EU-ETS, New Zealand and
Norway, regional level trading schemes in the RGGI, and joint cap and trade systems in Quebec
and California in 2014.
Canada ratified but withdrew from the Kyoto Protocol in 2011. It has instead committed to the
Copenhagen climate change target of 17% below 2005 levels by 2020 (Canada Emission Trends,
2014). Previously, there has been political risk for the federal government to push for carbon
taxes, as was experienced by the defeat of former Liberal leader Stephen Dion’s carbon tax plan
in 2008. The prospect of carbon prices has been politically challenging, but the urgency with
climate change has convinced Canadians to support mitigation actions (Coulson and Roberton,
2016). The 2009 Copenhagen Accord brought countries together to the 21st session of the
Conference of the Parties to the UNFCCC (COP 21) in December 2015 urged by the need to
agree to a plan to address climate change. This led to the adoption of the Paris Agreement by
195 countries to partake in initiatives in mitigation, adaptation, technology development and
transfer, capacity building initiatives, global stocktaking, implementation and compliance.5 With
the emergence of a national carbon price in Canada and forthcoming agreement from the North
American Climate Summit, it supports the alignment in climate change strategy between all
levels of government to achieve significant, long-term emission reductions.
2.3 History of Climate Policy in Ontario
Since the Green Energy Green Economy Act, 2009, Ontario was the first jurisdiction in North
America to commit to phasing out coal-fired generation and achieving a conservation first and
aggressive renewable energy mandate. Ontario was a member of the Western Climate Initiative
(WCI) and was interested in pursuing cap and trade with Quebec and California. Following the
3 The Clean Development Mechanism (CDM) is a market consisting of certified emission reductions undertaken by
developing countries that could be used as offsets elsewhere. A portion the proceeds in the CDM were used to
finance adaptation projects vis-à-vis an Adaptation Fund for developing country parties to the Kyoto Protocol. The
European Union trading scheme has been one of the largest purchasers of CDM offsets. 4 Joint Implementation is similar to the CDM but was created for emission reduction projects in the former Soviet
Union and Eastern Europe (Newell et al., 2013). 5 See draft decision on the Adoption of the Paris Agreement.

5
2008 economic crisis, many U.S. states withdrew from the WCI due to the initial economic and
political costs of unemployment that were experienced in California, but Ontario stayed and
helped with the development of design principles of the WCI (Klinsky, 2013). Ontario’s
participation in the WCI remained politically sensitive in a time when the viability of a
renewable feed-in-tariff program was debated during the provincial election (Ibid).
With the election of a new Liberal majority led by Premier Kathleen Wynne in 2013, cap and
trade was re-introduced as good environmental policy that fuelled a good economy (Ontario,
2015). The climate change challenge presented an opportunity to transform the Ontario
economy and lead to better public transit, more electric vehicles, greener building standards and
net zero technologies to reduce energy costs (MOECC, 2015b). In April 2015, Ontario
announced its intention to join the WCI cap and trade system. Ontario hosted the Climate
Summit of the Americas in July 2015 and signed a Pan-American action statement with 23
signatories. This covered support for carbon pricing, public reporting, taking action in key
sectors and committing to meet GHG reduction targets (Ontario, 2015b). In November 2015,
Ontario and Quebec signed a Memorandum of Understanding to confirm their intent to link the
cap and trade programs under the WCI (Town of Richmond Hill, 2016). By then, Ontario
released the Cap and Trade Design Options and Climate Change Strategy. This was followed by
the release of the draft regulation in February 2016 for public consultation. The Climate Change
Mitigation and Low-carbon Economy Act, 2016 received Royal Assent in May 2016.
2.4 Lessons Learned from Other Jurisdictions
Past experiences from the EU-ETS and RGGI highlighted the need to manage costs and volatility
with cost containment measures (Klinsky, 2013). The price crash in the EU-ETS was caused by
multiple factors including the 2008 economic recession, lowered electricity demand and reduced
output. Due to the reduction in output in the economy, the under-estimation of abatement was
found to have an equal effect on the fall in carbon prices as the over-allocation of allowances
(Ellerman and Buchner, 2006). The EU’s cumulative oversupply led to reduced auction volumes
and established a stability reserve of surplus allowances to regulate the liquidity of allowances
(European Commission, 2014). The combined effect of the economic recession and low natural
gas prices relative to coal was also experienced in the RGGI, where emission targets are likely
not binding unless further revised (Aldy and Stavins, 2012).
6
Initially, there was no price floor or banking system to mitigate surplus allowances in the EU-
ETS system. These provisions were added to the EU-ETS after the price crash to mitigate the
price fall and disallow the continued surplus of allowances (Newell et al., 2013). Carbon
markets today in the EU-ETS, RGGI, Quebec and California include a price floor and ceiling to
mitigate price variation. The flexibility of banking and borrowing promotes cost-effective
reductions, which lowers the costs of compliance (Tatsutani and Pizer, 2008; MOECC, 2015a).
With a price floor, it prevents prices from dropping below an expected range (Dinan and Spoor,
2001). With a price ceiling, it provides certainty on the incremental cost of abatement that can
avoid larger losses to the firm, in case the reductions were achieved at a much higher cost with
an increasingly stringent cap (Ibid). With a price floor and ceiling, this hybrid approach makes
cap and trade systems a price-based approach to regulate potential price variability (Aldy and
Stavins, 2012; Jaccard, 2006).
With allowance banking, it allows for cost flexibility as allowance levels can vary with price
shocks through temporal flexibility (Newell et al., 2005). There could be benefits and risks
associated with banking. Laboratory experiments found that banking allowances can smooth
prices across time and increase efficiency (Muller and Mestelman, 1998). However, as seen in
Europe, banking can create an incentive to hold onto allowances for hedging or speculation
purposes based on their future expected values (Neuoff et al., 2012). As a result, this causes
allowance prices to rise (Tatsutani and Pizer, 2008). Over time, as better information on the cost
of abatement becomes available, banking and borrowing can help carbon prices reflect their
future discounted value (Murray et al., 2009). Banking allowances can reduce price volatility
and allowance surplus and has the benefit of increasing market efficiency.
After many years of experience with carbon markets post-Kyoto, new trends have emerged.
First, significantly different carbon prices can cause inter-jurisdictional financial flows between
countries and varying degrees to which the cap reflects actual emissions (Radu, 2014; Klinsky,
2013). Second, there should be greater transparency to allow equal access to information
(Klinsky, 2013). Third, there should be comparability when linking to avoid concerns about
competitiveness and leakage risk that can affect the sustainability of policy actions (Ibid). These
could be important considerations for Ontario as it plans to link with Quebec and California in
the near future.

7
3. Overview of Climate Policy in Ontario
After the Climate Change Mitigation and Low-carbon Economy Act, 2016 was passed in May
2016, the MOECC published key policy documents, including the Cap and Trade Program
Regulation, Allocation Methodology, Reporting Regulation and Guidelines that govern the
quantification, reporting and verification of greenhouse gas emissions, and the 2016-2020
climate change action plan. The climate change legislation, regulation, supporting guidelines
and action plan collectively shape the foundation of Ontario’s climate policy.
3.1 Climate Change Mitigation and Low-carbon Act, 2016
The climate change legislation creates a regulatory and legal foundation for cap and trade in
Ontario. The purpose of the Act is three-fold (Climate Change Mitigation and Low-carbon
Economy Act, 2016, s. 2):
1. To reduce greenhouse gases in order to respond to climate change, protect the
environment and assist Ontarians through the transition to a low-carbon economy;
2. To enable Ontario to collaborate and coordinate its actions with other jurisdictions to
ensure efficacy of its regulatory scheme in the context of broader international efforts to
respond to climate change; and
3. […] to encourage Ontarians to change their behaviour by influencing their economic
decisions that directly, and indirectly, contribute to the emission of greenhouse gases.
The climate change legislation sets the components of Ontario’s climate policy (MOECC,
2016a):
The provincial long-term emission targets are -15% (2020), -37% (2030) and -80%
(2050) relative to the 1990 baseline;
The climate change action plan sets out the actions to modify behaviour and enable
achievement of greenhouse gas reduction targets;
There will be provision for the distribution of allowances, creation of early retirement
credits, offsets registration, enforcement, and public notices in the cap and trade
program;
Investments and initiatives will be funded by the Greenhouse Gas Reduction Account
(GGRA) to support emission reductions; and

8
Reporting and review processes will ensure transparency and accountability in the
actions taken.
The legislation sets out the timelines, disclosure of information in the climate change action plan
and review processes for the initiatives funded by the GGRA. The climate change action plan
will be reviewed at least every five years. To be transparent and accountable, the status of the
actions funded by the GGRA will be reported at least once every year. The action plan will at a
minimum include details on the greenhouse gas reductions by action, the cost per tonne reduced
and the amount of funding received from the GGRA to initiate the action (supra, s. 7). Low-
income consumers will be assisted to manage higher home heating costs.
The GGRA will be a new account established to receive proceeds from the distribution of
Ontario emission allowances, administrative penalties and fees payable to the Crown under the
Act (supra, 71). Authorized expenditures from the GGRA include the costs of administering and
enforcing the Act and regulations, costs to fund the action plan initiatives and other initiatives
that are reasonably likely to reduce greenhouse gases, and the costs incurred by the Crown to
support emission reductions (Ibid). The Minister will review and evaluate the initiatives before
they are undertaken (Ibid). To ensure transparency in the evaluation process, a report will be
published at least once every year on the evaluations conducted and funded by the GGRA (Ibid).
In terms of eligible initiatives funded from the GGRA, these include activities in Schedule 1 of
the Act that informed the climate change action plan (MOECC, 2016a):
Schedule 1 of the Act
Initiative 1: Energy sources and uses (production of renewable energy)
Initiative 2: Land use and buildings (retrofitting buildings)
Initiative 3: Transportation (alternative and low carbon forms of transportation compared
to traditional gasoline and diesel vehicles such as electric vehicles)
Initiative 4: Industry (energy conservation programs)
Initiative 5: Agriculture, forestry and natural systems (afforestation initiatives)
Initiative 6: Waste management (organic waste composting systems)

9
Initiative 7: Initiatives that support organizations in developing and delivering
financing tools, project aggregation and professional services to consumers to
reduce greenhouse gas emissions
3.2 Cap and Trade Program Regulation (O. Reg. 144/16)
Ontario’s cap and trade program runs from January 1, 2017 to December 31, 2020 for the first
compliance period. The regulation establishes subsequent compliance periods for each three-
year period thereafter. Facilities that emit greater than 25,000 tonnes of CO2e are mandatory
participants of the program, if emissions are attributable to activities related to natural gas
distribution, petroleum product supply, electricity importation or any activity specified in
Schedule 2 of the Reporting Regulation. Voluntary participants emitting 10,000 and 25,000
tonnes of CO2e per year can opt into the program. Market participants are allowed to trade
allowances in the carbon market, but do not have a compliance obligation.
Ontario will use a hybrid approach to regulate emissions upstream and downstream to cover
combustion and process emissions from capped participants. To meet the 2020 provincial
emission targets, the government will issue allowances each year that fall by an average rate of
4.1% from 2017 to 2020. 6 Some of the allowances will be auctioned while the remainder are
distributed for free. The facilities that are required to purchase allowances to cover emissions
include distributors and suppliers of fuels and electricity importers. Eligible facilities that apply
for free allowances are those engaged in the production of specified GHG activities in the
Reporting Regulation.
To support a well-functioning market, there will be rules on effecting trade transactions,
timelines to provide notices on auctions and sales, and enforcement provisions. The cap and
trade program allows for flexibility in achieving reductions over multiple periods and using
allowances and credits to cover emissions. By the end of the compliance period, participants
demonstrate compliance by submitting the allowances and/or credits purchased to cover the
emissions produced.
The cap and trade regulation comes into force on July 1, 2016, but further regulations are
expected. The Ontario cap and trade regulation is planned to allow participation of indirect
6 One allowance is equal to one tonne of CO2e.
10
steam emissions emitting less than 10,000 tonnes of CO2e per year. The eligibility requirements
and number of early reduction credits to be issued are yet to be finalized. Further requirements
to create, verify and register offsets and the management of allowances for shut-downs,
bankruptcies or ownership changes will be consulted on. Complementary regulations on
administrative monetary penalties for specific contraventions and impact mitigation for First
Nations will be made separately in 2016.
3.3 Methodology for Free Allowance Distribution
The total amount of free allowances distributed is the sum of allowances distributed using five
approaches, including production adjustments for changes in output. The methodology for
distributing free allowances identifies the facilities that are eligible for free allowances and the
methodology for allocating allowances based on the facility’s combustion and process emissions.
Allowance distributions will be supported by verified production data to justify the free
allowance allocations. The allocation methodology for free allowances will be discussed in
Section 8.1 of this report.
3.4 Reporting Regulation and Guideline for Quantification, Reporting and Verification of
Emissions (O. Reg. 143/16)
In 2009, Ontario established a reporting regulation (O. Reg. 452/09) and guideline for the
quantification, reporting and verification of greenhouse gas emissions under the Environmental
Protection Act. Amendments were made to lower the reporting threshold to 10,000 tonnes of
CO2e and require verification on emissions greater than 25,000 tonnes of CO2e per year. In
2016, reporting was required for petroleum product producers, natural gas distributors,
magnesium producers, and equipment used for both electricity and natural gas transmission and
distribution.
Under the Climate Change Mitigation and Low-carbon Economy Act, 2016, the new Reporting
Regulation (O. Reg. 143/16) superseded the prior reporting regulation to support the
implementation of the cap and trade program. The Reporting Guideline outlines the methods to
quantify emissions for an activity engaged in by 2017 and the rules for reporting emissions by
mandatory and voluntary participants. It describes the contents of GHG reports for facilities
engaged in specified GHG activities, the rules for verification and continuing duties for
verification, and the general duties of the verification firms. The following changes to the

11
Reporting Regulation and Guidelines were made in support of the cap and trade program
(MOECC, 2016a, 2016b):
1. Requirement to report production and process related information to support the
calculations for free allowance allocations;
2. Reporting requirements for voluntary participants;
3. Alignment with Quebec on the measurement requirements for emissions to be accurate
within 5% and for production data to be within 0.1%;
4. New default emission factors for calculating emissions from electricity imports; and
5. Greater detail on the reporting of biomass used in a facility.
These changes represent improvement to the process to ensure greater accuracy in the
measurement and reporting of greenhouse gas emissions in support of the cap and trade program.
3.5 Climate Change Action Plan for 2016 to 2020
Following the release of the climate change legislation in May 2016, the MOECC released the
climate change action plan in June 2016 to establish the Ontario government’s five-year plan on
how to invest the cap and trade proceeds. The purpose of the action plan is to create the
conditions to provide greater consumer choice, both to consumers and businesses to reduce their
carbon footprint and accelerate the adoption of low-carbon technologies. Key areas of the action
plan include (MOECC, 2016c):
1. Establishing a green bank to increase access to financing for energy efficient
technologies;
2. Electrifying the transportation system by increasing the availability of zero-emission
vehicles, cleaner trucks and making transit more available;
3. Reducing emissions from buildings by providing better information to make more
informed decisions on energy use and making new buildings more energy efficient over
time;
4. Making Ontario one of the easiest and most affordable jurisdictions to install or retrofit
clean energy systems including solar, battery storage, advanced insulation and heat
pumps, while protecting low-income and vulnerable communities;

12
5. Supporting a carbon market that achieves reductions at the lowest cost, driven by
businesses and industry making investments to reduce greenhouse gas emissions;
6. Working with First Nations and Metis communities to address climate change and build
capacity with actions guided by Traditional Ecological Knowledge;
7. Building on progress by making government operations carbon neutral that include
government facilities, operations and procurement; and
8. Ensuring natural, agricultural and forest lands are used efficiently and sustainably to
enhance the removal and storage of carbon, and enhancing the capture to CO2e from
waste.
With anticipated annual cap and trade proceeds of $1.8-1.9 billion totalling a maximum of $8.3
billion by 2020, the funds are expected to fund 28 climate mitigation actions to achieve 9.8
million tonnes of GHG emission reductions by 2020.
4. Research Design and Methodology
4.1 Research Question
Will the Ontario cap and trade regulation achieve sustained emission reductions?
4.2 Research Design
The methodology to address this research question involved using a six evaluation criteria
framework informed by the Pew Centre on Global Climate Change, Canadian Institute of
Resources Law, U.S. Congressional Budget Office and Resources of the Future:
1. To what extent will the cap and trade program achieve emission reductions? On what
scale? Will it capture the key emission sources?
2. To what extent will the allocation of allowances in the cap and trade program produce a
fair distribution of costs and benefits?
3. To what extent will the carbon market be efficient, transparent and effective? Will the
rules be enforceable?
4. To what extent will accommodations and flexibility arrangements be transparent?
5. To what extent will the emission reductions be measurable and sustainable?

13
6. To what extent will the cap and trade program align with political, economic and
environmental policy considerations?
These questions will inform the progression of the report as follows.
Scope of Ontario’s Cap and Trade Program (Section 5). In designing the scope of a cap and
trade program, policymakers will choose which GHGs to regulate and how to regulate the
emission sources. This policy choice determines the sectors that will comply with the program.
While maximum coverage of emissions is possible, it is often more expensive to meet an
environmental objective as smaller sources are harder to measure and more expensive to
regulate. Section 5 of this report reviews the scope and scale of the emissions coverage in
Ontario’s cap and trade program.
Distribution of Benefits and Costs from Allowance Allocations (Section 6). In designing a
cap and trade program, policymakers face the challenge of determining how the allowances will
be allocated, primarily who receives free allowances and who pays for the allowances (Dinan
and Spoor, 2001). To assess the extent to which the allowance allocation produces a fair
distribution of cost and benefits to consumers and industry, Section 6 of this report assesses the
distributional impacts from the allowance allocations.
Effectiveness of Market Design (Section 7). A well-functioning market is a key feature to
manage price stability while achieving emissions certainty (Murray et al., 2009; Newell et al.,
2005). To incent behavioural change, it relies on the effectiveness of the market to facilitate
price discovery that drives appropriate investments to signal the long-run cost of carbon
abatement (supra, ibid). Section 7 of this report assesses the effectiveness of market design by
reviewing whether the market is efficient, transparent, enforceable and effective to support the
discovery of the carbon price.
Transparency of Accommodations and Flexibility Arrangements (Section 8). Being
transparent with accommodations and flexibility arrangements are critical as it indicates the
effectiveness of program rules, given the leeway provided to participants that allow them to
remain in compliance with the program. For Ontario, it will be important to assess the
transparency of accommodations and flexibility arrangements permitted in the cap and trade
program, which will be explored in Section 8 of this report.

14
Measurability of Emissions and Sustainable Impact (Section 9). The measurement of
emissions supports the assessment of emission reductions, the cost of abatement and the
industry’s overall cost of compliance to reduce emissions. To assess the extent to which the
emission reductions from the cap and trade program are measurable, Section 9 of this report
assesses the measurability of emission reductions through a review of the measurement,
verification and reporting processes.
Integration with Other Measures (Section 10). In addition to the design foundations of the
cap and trade program explored in earlier sections, Section 10 of this report will focus on
assessing how the Ontario’s climate change action plan forming the vision of the province’s
climate change strategy will integrate with political, economic and environmental policy
considerations.
4.3 Study Methodology
Analysis of Ontario’s cap and trade regulation will involve a review of government publications
and policy documents related to the climate change policy, including: Climate Change
Mitigation and Low-carbon Economy Act, 2016; Cap and Trade Program Regulation;
Methodology for Free Allowances Distribution; Reporting Regulation and Guideline for the
Quantification, Reporting and Verification of Greenhouse Gas Emissions; climate change action
plan; draft regulation and design options; stakeholder submissions; climate change discussion
paper; and Quebec and California cap and trade regulations and updates.
This paper presents an evaluation and independent estimates of the distribution of allowance
allocations, leakage risk for Ontario’s manufacturing industries, and potential distribution of free
allowances by NAICS industries. Data was used from Statistics Canada, Trade Data Online,
facility data reported under O. Reg. 452/09 (Greenhouse Gas Emissions Reporting), and
MOECC and ICF reports. The impacts of similar policies from the EU-ETS and U.S. in
literature reviews were used to infer the potential impacts of Ontario’s approach to cap and trade.
Recommendations will be made to inform future program development.

15
5. Scope of Ontario’s Cap and Trade Program
5.1 Scope of Emissions Coverage
The cap and trade program will support an economy-wide coverage that regulates 82% of 2020
emissions (see Table 1). Mandatory participants include emission sources from natural gas
distribution, petroleum product supply, electricity importation or any GHG activity in Schedule 2
of the Reporting Guideline. The coverage affects 75% of the people in Ontario (Ministry of
Finance, 2016; MOECC, 2015e).
Table 1. Emission Reduction Targets in Ontario
Source: Data collected from MOECC’s 2014 Climate Change Update Report; carbon price projections from Point
Carbon at <http://energyinsider.ca/index.php/ontarios-cap-and-trade-some-early-impact-estimates/>
The cap and trade program will cover the seven greenhouse gases included in the Kyoto
Protocol. These are carbon dioxide, methane, nitrous oxide, hydrofluorocarbons, sulphur
hexafluoride, perfluorocarbons and nitrogen trifluoride. Carbon dioxide, methane and nitrous
oxide, making up the majority of GHG emissions in the economy, will be covered. Sectors
include transportation emissions from passenger, freight and rail (33% of forecast 2020
emissions), industrial processes and emissions from product use (34% of 2020 emissions),
emissions from residential, commercial and institutional buildings (18% of 2020 emissions) and
from electricity generation (3% of 2020 emissions). 7
Ontario’s exclusion of emissions is
consistent with the emissions coverage in Quebec and California. Ontario’s emissions profile by
sector and expected emissions growth is displayed below (see Table 2).
7 This is the forecast of emissions without emission reductions by sector to reconcile the figures to the 82%
emissions coverage under the cap and trade program.
Anticipated Impacts for Ontario 2020 2030 2050
Ontario's Cap on GHG Emissions (MT) 150 112 35
Coverage of Ontario's Emissions
Emissions Reduction from 1990 levels -15% -37% -80%
Expected Emission Reductions (MT) ~19 >60 >160
Projected Carbon Price ($CAD/tonne) ~$22 ~$95 >$100
82% (2017-2020)

16
Table 2. Ontario’s Emissions Profile by Sector from 1990 to 2030
Sources: Data collected from emission forecasts in MOECC’s 2014 Climate Change Update Report; 2013 data from National Inventory Report
5.2 Scale of Coverage Through Points of Regulation
There will be a compliance obligation on mandatory and voluntary sources at the point of
distribution (upstream approach) and at the point of emission (downstream approach). In
Ontario, a hybrid approach will be used: upstream for natural gas distributors, petroleum product
supply and electricity importation; and downstream for large final emitters including industry
and institutions. Through these points of regulation, both process and combustion emissions are
covered. Process emissions come from chemical reactions as part of production processes,
where the primary purpose of the process is not energy production (MOECC, 2015b; 2015c).
Combustion emissions come from the burning of fuel for heating and can be reduced through
energy efficiency or fuel switching (Ibid).
Natural Gas Distribution
For natural gas distribution, emissions from Ontario’s natural gas utilities will be regulated
through the distribution of natural gas to retail customers. This includes the upstream coverage
in the distribution process and downstream coverage of the emissions reported between 10,000
and 25,000 tonnes of CO2e per year from the gas utilities’ residential, commercial and small
industrial customers. The cost of purchasing allowances to cover emissions from the distribution
of natural gas will be recovered from customers as a cost pass-through in rates.
1990 2013 2017 2020 2030% change
(2013-2020)
% change
(1990-2030)
Transportation 46 61 60 60 57 -2% 24%
Industry 64 47 57 58 60 23% -6%
Buildings 26 32 29 30 34 -6% 29%
Electricity 26 11 4 5 8 -55% -69%
Agriculture 10 10 10 10 9.9 -4% -1%
Waste 6 9 7 7 7 -22% 17%
Total Emissions (MT) 177 171 167 169 176
2020 Emissions Goal
(-15% of 1990 emissions) 150
2030 Emissions Goal
(-37% of 1990 emissions) 112
Expected GHG Reductions 19 64
Actual Emissions
(Mt CO2e)Sector
Forecast Emissions (Mt CO2e)

17
Large final emitters that are customers of natural gas distributors and natural gas fired electricity
generators emitting more than 25,000 tonnes of CO2e will instead be responsible for their own
allowance purchases. The downstream regulation of emissions associated with the use of fuel at
industries and institutions, including natural gas use for general stationary purposes, will be
regulated at the point of consumption at the facility (MOECC, 2015c).
Petroleum Product Supply
The regulation of petroleum product supply includes persons that supply 200 litres of more of
petroleum products, such as fuel oil and propane, from a petroleum refinery or is imported into
Ontario. Upstream regulation applies when the petroleum product is first placed onto the
Ontario market, after the petroleum product was moved from petroleum refineries or
fractionation facilities (O. Reg. 143/16, s. 12). This ensures that domestic sales or transfers of
petroleum products from wholesale or retail points in Ontario will capture for GHG emissions
from fuel distribution in Ontario (MOECC, 2015c). The cost of carbon upstream in the
distribution process will result in a fixed charge per litre of gas consumed by all Ontarians.
Electricity Generation and Importation
Electricity Generators. Emissions from domestic electricity generation that use fossil fuels,
primarily relating to natural gas fired electricity generation in Ontario, will be covered by the
natural gas distributor. There is an exception to electricity generating facilities that connect
directly to an international or inter-provincial natural gas pipeline, which will have the emissions
regulated at the point of generation.
Electricity Imports. An electricity importer is a person authorized by the IESO market rules to
cause or permit electricity to be conveyed into, through or out of the IESO-controlled grid
(Electricity Act, 1998, s. 2). Importers are required to buy allowances at the border (a “first
jurisdictional deliverer” approach) in an amount that is equal to the estimated emissions from the
sources of imported power. Default emission factors were considered from marginal power
plants within Ontario’s interconnections to estimate the carbon content of electricity imports. It
is expected that emission factors will be updated annually from select jurisdictions in Canada and
the U.S. (IESO, 2016; Ontario Ministry of Energy, 2016).

18
Ontario’s five interconnections include the ISO New England (ISO-NE), New York Independent
System Operator (NYISO), Pennsylvania, New Jersey and Maryland (PJM), Midcontinent
Independent System Operator (MISO) and Manitoba. The electricity emission factors will
depend on the marginal resource used by these jurisdictions during the on-peak and off-peak
periods.8 Higher emissions from fossil-fuel based electricity generation would be produced at
the margin. When linkage is considered, how Ontario’s emission factors may align with the
emission factors applied to electricity imports in Quebec and California will ensure consistent
treatment of electricity imports in the WCI. The measurability of emissions from electricity
imports is discussed in Section 9.2 of this report.
Electricity Exports. The default emissions factor does not apply to electricity exports. Exports
will pay the market clearing price for electricity without the embedded carbon cost when natural
gas is on the margin. This approach is consistent with the approach taken by California, Quebec
and RGGI (Ontario Ministry of Energy, 2016). Ontario exports could be less competitive over
time if the emissions exported outside the province are not regulated (IESO, 2016).
Cogeneration, including Behind the Meter Generation. Cogeneration facilities produce
electricity and by-product heat or steam to run an industrial process. The emissions from
cogeneration facilities are proposed to be treated consistently with electricity generators whose
emission allowances would be covered by the fuel distributor. The exception is when the
cogeneration facility is connected to an inter-provincial pipeline. In this case, allowances are
purchased at the point of generation. Cogeneration facilities will also be provided free
allowances to cover its emissions from the combustion of natural gas to generate electricity
and/or thermal energy (heat or steam).
Non-Emitting Generators. Renewable energy generators including solar, wind, hydroelectricity
and nuclear facilities are not regulated under the cap and trade program.
Similar to downstream industrial emitters, the emissions from energy-from-waste facilities will
be covered at the facility. Energy-from-waste facilities are regulated, but receive free allowances
to cover emissions in the first compliance period (see Section 8 of this report). Energy-from-
8 A marginal resource is defined as the next available unit of production required to meet the next unit of demand.
In the context of an electricity system it is managed in a least cost dispatch approach (Ontario Ministry of Energy,
2016).

19
waste facilities that use biomass as a source of fuel to produce electricity, heat or other useful
energy will be regulated under the cap. Biomass is defined as an organic matter that is
renewable and derived from a plant, animal or micro-organism or product made out of organic
matter (O. Reg. 143/16). Biomass must be agricultural waste, organic waste material, waste
from food processing, distribution and preparation operations, landfill gas, biodiesel, biofuel or
biogas (Ibid). The measurability of biomass production in support of carbon neutrality benefits
is discussed in Section 9.4.2 of this report.
Industries and Institutions
Large final emitters that engage in any of the specified GHG activities9 in Schedule 2 of the
Reporting Regulation will be regulated at the facility. Both combustion and process emissions
will be regulated from large final emitters in support of meeting provincial emission reductions.
Industries and institutions will be provided free allowances to cover their emissions over the first
compliance period (see Sections 6 and 8 of this report). The effectiveness of transitional
assistance provided will depend on the ability of large facilities to engage in significant low-
carbon activities to achieve long-term emission reductions. It is expected that incremental
reduction opportunities for large final emitters will be timely as industrial emissions could be
higher than the emissions from the transportation sector by 2030 (see Table 2 above).
5.3 Treatment of Emissions from Existing and New Facilities
Absent restriction on the treatment of new facilities in the cap and trade program, it is assumed
that new entrants that begin operations in January 1, 2016 with annual emissions greater than
25,000 tonnes of CO2e are mandatory participants of the program. Starting in 2017, this will
ensure stringent regulation of carbon emissions from new and existing facilities. These sources
will be assessed on the ability to reduce combustion and process emissions significantly based on
the stringency of the cap decline from 2017 to 2020. Depending on the eligibility of the GHG
activities from the industrial activity of the existing or new facility, the emissions from existing
and new facilities can be covered with free allowances for the first compliance period.
9 Schedule 2 activities (O. Reg. 143/16) that preclude electricity generation, operation of electricity or natural gas
equipment, coal storage and general stationary combustion include the following production activities: adipic acid,
ammonia, carbonate use, cement, copper and nickel, ferroalloy, glass, HCFC-22 and HFC-23 destruction, hydrogen,
iron and steel, lead, lime, magnesium, nitric acid, petrochemical, petroleum refining, phosphoric acid, aluminum,
pulp and paper, refinery fuel, soda ash and zinc.

20
5.4 Stringency of the Cap Decline
To ensure that reductions are sustained, the cap should be made more stringent through deeper
emission cuts in order to send a strong price signal to incent technological innovation (Tatsutani
and Pizer, 2008). Based on Ontario’s emissions forecast in 2020, an 11% reduction is needed to
fall from the forecast to achieve 150 Mt in emissions, which is equivalent to a 15% reduction
from 1990 levels. According to the Ontario allowance budget, the emission allowances decline
by an average rate of 4.1% per year by 2020. The decline factor is sufficient to meet the 2020
provincial target, as it is limited by the program cap of 124.7 million allowances in 2020 to cover
82% of the economy’s emissions. Ontario’s cap includes emissions from the fuel and electricity
distributors similar to Quebec and California. In addition, Ontario will cover emissions from
energy-from-waste facilities that are not included in Quebec’s and California’s cap and trade
programs (Purdon et al., 2014).
To support the provincial emissions targets, it is expected the transportation and natural gas
sectors will be impacted by annual cap declines, while the sector-specific cap for electricity
generation remains unchanged (Ministry of Finance, 2016). This recognizes the significant
reduction of emissions from the closure of coal-fired generation that will contribute a 32.5 MT
reduction in emissions by 2020 (Ministry of Finance, 2016; MOECC, 2015d).
5.5 Assessment
Ontario’s cap and trade program has an economy-wide coverage of emissions in the key sectors
to ensure cost-effective reductions in the next four years. From 2017 to 2020, the emissions of
all the seven GHGs will be regulated, covering 82% of Ontario’s emissions by 2020 that is
consistent with the emissions coverage with Quebec and California. The cap decline rate falls at
an average rate of 4.1% to achieve a 15% emissions reduction by 2020. Through the upstream
regulation of fuel distributors for petroleum products, natural gas and electricity, 54% of
Ontario’s forecast emissions are covered by 2020. Upstream regulation of fuel distribution is
expected to enhance the program’s administrative feasibility and implementation. It has been
argued that the upstream regulation of emissions has the most leverage on total emissions
(Bushnell et al., 2014). Through the downstream approach, 34% of the forecast emissions are
covered from industrial activity by 2020. Ontario’s exclusion of smaller sources includes
agricultural, waste emissions, and aviation and marine fuels.

21
The exclusion of agricultural and waste sectors could be administratively simpler and reduce
program costs, as emissions from smaller sources could be harder and more expensive to
measure if regulated under the cap. Given the broad coverage of emission sources, the overall
monitoring costs for emissions could potentially be high. The exclusion of emissions from
aviation and marine shipping fuels from the provincial cap is consistent with Quebec and
California. The Environmental Commissioner of Ontario (ECO) has noted that Ontario’s
concessions to aviation fuel and its tax exemptions to coloured fuel undermine the intended
purpose and operation of the cap and trade program (Environmental Commissioner of Ontario,
2016). In response to the ECO’s comments, Ontario has initiated a review of the initiatives
supporting fossil fuel use in its Climate Change Strategy (Ibid). Further reductions to supply
subsidies could also increase the cost-effectiveness of conservation when carbon pricing takes
effect (Love, 2014).
To meet the emissions cap each year, upstream regulated sources will pay for the cost of their
emissions whereas downstream regulated sources are eligible for transitional assistance to cover
their process and combustion emissions until at least 2020. For sources that are not regulated
under the cap, there are future developments in using agriculture, forestry and lands as offsets for
Ontario’s cap and trade program (MOECC, 2016c). Although these emission sources are not
directly capped, these sectors will be funded by cap and trade proceeds to build greater
productivity for the environment as carbon sinks that provide Ontario specific compliance
options (Ibid).
Based on the coverage of emissions, there is a level playing field established for domestic
electricity generation and imports based on a first jurisdictional delivery approach. The carbon
content of imported electricity will be regulated at the border with application of a default
emissions factor. The amount of carbon from electricity imports would depend on where the
imported electricity originates. The emissions of electricity exports are not subject to the cap and
trade program, which could affect Ontario’s competitiveness of electricity exports. On the one
hand, nuclear refurbishments increase the strategic importance of natural gas as a peaking
resource, which could increase the carbon intensity of Ontario’s exports. On the other, the
generation fleet is becoming cleaner with increasing capacity fueled by renewable energy that
makes up 50% of the supply mix by 2025. As a result, there could be potential developments

22
supporting the increased deployment of low-carbon technologies in the energy system, but
natural gas fired generation is expected to play an important role in Ontario’s supply mix.
The emissions from combined heat and power facilities (generating electricity and heat) are
covered under the cap and trade program, as are facilities generating thermal energy directly (at
the facility) and indirectly (via steam imports). Cogeneration facilities that primarily produce
electricity output, with heat as a by-product, will be eligible to cover emissions using free
allowances. The free allowances will allow cogeneration facilities to be competitive with other
facilities producing heat or steam for production purposes.
The program’s allowance cap will be sufficient to meet provincial emission targets. A direct
implication of participating in the program is the cost to achieve significant emission reductions
by 2030 and 2050. In assessing Ontario’s energy use, 76% of homes are heated with natural gas
(as opposed to 3% in Quebec), 29% of Ontario’s installed electricity capacity relies on natural
gas (as opposed to 59% in California) and 15% of Ontario electricity generation is fuelled by
natural gas (as opposed to 59% in California) (ICF International, 2016). As Ontario has made
few investments in low-carbon technologies in Ontario to date (The Conference Board of
Canada, 2016) and started cap and trade at a later time than Quebec and California, Ontario’s
marginal cost to abate could be higher. This challenge supports the economic gains to be made
for Ontario by linking with the WCI to leverage a larger pool of allowances and/or offset credits
to lower the overall cost of compliance. For Ontario to develop resilience to climate change, it is
a good start for the province to be committed to an upstream regulation of fuels to attain the most
leverage on emission reductions.
Based on this assessment, there is comprehensive coverage of emissions that supports low-cost
compliance, fair treatment of emissions in the cap and trade program, and sufficient annual
declines in the program allowance cap to meet the 2020 emission targets. In order to enable
cost-effective emission reductions, this endeavour could be achieved through linkage with
Quebec and California and the use of complementary policies to support broad emission
reductions in all sectors of the economy.

23
6. Distribution of Benefits and Costs from Allowance Allocations
6.1 Allocation Approaches: Risks and Benefits
Based on WCI design recommendations, the distribution of allowances is at the discretion of the
jurisdiction (Western Climate Initiative, 2010). This introduces the consideration of benefits and
risks associated with auctioning allowances, as opposed to allocating the allowances for free.
The allocation of allowances made by policymakers can affect the social cost of the policy and
create distributional impacts from the allocation of allowances.
There are reasons to support free allowance distribution. Free allowances will compensate firms
with a production subsidy and implicitly lower the marginal cost to abate (Haites, 2003). It
provides transitional assistance to Emissions Intensive Trade Exposed (EITE) industries to
mitigate against the risk of carbon leakage, as has been done in other emissions trading
programs. However, the allocation of free allowances will forego revenues that can be recycled
into additional relief programs or emission reduction initiatives. Environmental groups have
raised the concern that the motivation to reduce emissions is delayed with free allowances
(Wilson and Grochalova, 2016). Allocating fewer allowances can send a stronger price signal
and create more demand for low-carbon innovation (Clean Economy Alliance, 2015).
Auctioning incents the use of low-carbon technologies and rewards firms that can reduce
emissions (Pew Centre on Global Climate Change, 2007). The spirit of auctioning aligns with
the cost causality principle as emitters internalise the externality. The government also
eliminates the risks created by distributing free allowances to the EITE industries as there are
often information asymmetries on how much cost can be passed onto different sectors (Ibid).
6.2 Distributional Outcome of Allowance Allocations
Ontario’s cap and trade program will auction 25% of outstanding emission allowances for sale
and distribute a portion of the allowances for free to reduce the risk of carbon leakage (O. Reg.
144/16, s. 57). With a mixed use of auction and free allowances, $1.8-1.9 billion from annual
allowances is expected to be earned each year, with 60% of the proceeds paid by petroleum
product suppliers and 40% of the proceeds paid by natural gas distributors (Sawyer, 2015). A
maximum of $8.3 billion could be earned at auction (Appendix 6 of this report) consistent with
the findings in Table 3, whose proceeds are planned to be used in various areas of the economy.

24
Allowances will be distributed for free to large emitters that could potentially cost $0.7-0.9
billion each year. The amount of free allowances provided would be distributed to about 100
industrial emitters.
Table 3. Aggregate Distribution of Allowances (Estimated for 2017 to 2020)
Source: O. Reg. 144/16 for allowance caps and expected carbon prices. Notes: Auctioned revenues are estimated based on a carbon price of $18/tonne that increases at a rate of $1.48/tonne each year to $22.50/tonne by 2020. These estimates are based on projected emissions that increase linearly between 2017 and 2020.
The distribution of free allowances representing roughly 30% of the total revenues will benefit
large final emitters. The extent of the benefits received will depend on many factors including
the industry’s marginal cost to abate, market structure, or degree of cost pass-through of the
carbon cost. The value of allowances accruing to consumers or the industry will be based on the
implementation of climate change action plan initiatives funded by cap and trade proceeds.
6.3 Distributional Effects of Free Allowances to Industry
6.3.1 Benefits to Ontario’s Large Emitters
Based on the distribution of free allowances, the allocation is assumed to be proportional to the
emissions intensity of the product, process or activity (Appendix 2 of this report). Higher shares
of free allowances will benefit firms under the product-output approach. Using 2013 facility
emissions data, preliminary estimates of the portion of distributed allowances show that 90% of
the large industrial emitters will benefit from allocations made under the product-output
benchmark and historical allocation approaches (Appendix 3).
Free allowances will be awarded to individual companies, rather than to the sector that is
practiced in Quebec’s allocation approach. For analysis purposes, the following results are
summarized by sector. If the benchmark allowances for process and fixed emissions are
YearOntario
Allowances
Total Revenues:
if 100% auctioned
Auction Revenues
(estimate)
Percent of Revenues
Earned at Auction
Cost of Free
Allowances
(estimate)
Cost of Allowances
as Percent of Total
2017 142,332,000 $ 2,569,883,333 $ 1,849,466,667 72% $ 720,416,667 28%
2018 136,440,000 $ 2,665,633,333 $ 1,881,546,914 71% $ 784,086,420 29%
2019 130,556,000 $ 2,744,093,704 $ 1,895,646,173 69% $ 848,447,531 31%
2020 124,668,000 $ 2,805,030,000 $ 1,891,530,000 67% $ 913,500,000 33%
Total 533,996,000 $ 10,784,640,370 $ 7,518,189,753 70% $ 3,266,450,617 30%
25
combined to approximate total allowances received per tonne of output, assuming an average of
600,000 tonnes of output was produced10
, the following results emerge:
Hydrogen production receives the most allowances at 9.65 allowances per tonne of
hydrogen per year (~5.79 million allowances; ~15% of the cost of 2017 free allowances);
Iron and steel manufacturing receives 3.1 tonnes for various types of iron11
produced per
year (~1.85 million allowances; ~5% of the cost of free allowances);
Grey cement production receives 0.803 allowances per tonne of cement per year (~0.48
million allowances; ~1% of the cost of free allowances);
It is expected that petroleum refineries that produce oil in Sarnia, Ontario will be eligible
to receive 0.0047 allowances per Complexity-Weighted Barrel, and beer manufacturers
will be eligible for 0.007 allowances per hundreds of litres of beer produced.
Under the historical absolute allocation approach, pulp and paper manufacturing industries will
receive in total ~0.99 million allowances a year before applying the cap adjustment factor (~3%
of the cost of free allowances). General stationary combustion eligible for historical absolute
allowances receive ~0.09 million allowances a year (~0.22% of the cost). Additional industries
eligible for historical emissions include glass production, petrochemical manufacturers, smelting
and synthetics manufacturing among others.12
Due to the declining cap adjustment factor
between 2017 and 2020, the government has noted that the issuance of free allowances does not
indicate that these facilities will receive 100% assistance (MOECC, 2016b). This rationale is
further explored in the declining allowance cap for certain industries (see Section 8.1.3.3 for
details). The analysis above further demonstrates that the distribution of benefits from free
allowances amongst industries is not all equal. The intra-distributional inequities between the
manufacturing industries that receive free allowances are discussed.
10
This is the average output of 25 facilities categorized in the product output allocation category using 2013 data
from the facility data reported under O. Reg. 452/09. 11
This includes fixed process and combustion emissions for iron products, BOF steel, EAF steel, limestone used,
coke and dolomite. 12
For energy-use allocations applicable to direct/indirect thermal energy production and historical emissions
intensity allocations, more specific information on the emissions intensity of products or the amount of energy used
in a process would be needed to generate an accurate estimate.

26
6.3.2 Cost of Mitigating Leakage
In the event a domestic economic activity relocates to another jurisdiction and produces
emissions that are identical to what existed at home, there could be lost production that lowers
the nation’s competitiveness with no net change in GHG emissions (Beale et al., 2015). If
emissions can be shifted outside domestic boundaries due to the imposition of carbon pricing
policies, the notion of carbon leakage undermines the policy’s effectiveness, integrity and
political attractiveness.
An estimate of leakage risk for Ontario was assessed to enable comparability of leakage results
found in other studies. Table 4 shows the impact of a 1% increase in the electricity price on
exports (proxy for total “production”) and GDP (proxy for total “consumption” in Ontario). The
percentage difference (e.g. production minus consumption) is an indicator of production leakage
from Ontario. If electricity prices were increased by 10% over the last ten years, it could imply a
-1.2% of lost production based on the six industries tested. This is attributed to industries in pulp
and paper (-0.6%), chemical (-0.2%), aluminum (-0.15%), cement (-0.1%), glass (-0.07%) and
iron (-0.06%). The leakage rate is small, but the analysis reveals relatively higher leakage risk in
chemicals, basic metals and pulp and paper industries. The results in this study are consistent
with EnviroEconomics’ analysis stating that about -1.5% of emissions could be leaked, resulting
in a fall in GDP by -0.03% in 2020 (Sawyer et al., 2016). The potential losses to Ontario’s
manufacturing production could be small in terms of overall lost economic output. It is
reasonable to expect a mix of transitional assistance and auction proceeds, as this policy option
maximizes net GHG reductions after leakage is considered.13
13
See “Summary of Impacts Across Policy Alternatives in 2020” in Ontario’s 2016-2020 Climate Change Action
Plan.

27
Table 4: Estimated Net Production Impacts as Proxy for Leakage
Sources: Data from Ontario’s exports (proxy for production) in iron, chemical, paper, aluminum, cement and glass industries from 2006-2015 were collected from Trade Data Online; and Ontario’s GDP (proxy for domestic consumption) in the above sectors were collected from Table 379-0030, Statistics Canada. Notes: See Appendix 4 of this report for estimation methodology based on the approach used by Aldy and Pizer of Resources of the Future. Net production is a proxy for production leakage (Aldy and Pizer, 2009; Aldy, 2016). Results are illustrative for Ontario due to the extremely small sample size used to illustrate the impacts.
In comparison to the U.S. study by Aldy and Pizer, a $15 per tonne carbon price on U.S. energy-
intensive industries estimated that the cement, glass, aluminum and chemicals industries had
stronger leakage effects of greater than 1%. The paper and iron/steel industries had lower
leakage risks of less than 1%. The net effect on leakage was modest, as there was only a 0.2%
decline in net imports (Aldy and Pizer, 2009). The study also found a 0.4-2.2% decline on
employment levels (Ibid).
Canada’s EcoFiscal Commission found that 2-5% of Ontario’s GDP would be exposed to
competitiveness pressures under a range of carbon prices from $10-100 per tonne (Beale et al.,
2015). Only a few specific manufacturing sectors representing less than 1% of Ontario’s GDP
including steel, chemicals, petrochemicals, fertilizer and refining demonstrated notable exposure
to competitiveness pressures (Ibid). These results are consistent with the fact that significant
competitiveness and leakage risks have not yet emerged (Newell et al., 2013).
In a multi-industry cap and trade program, the market power of the industry affects the pass-
through costs to consumers (Haites, 2003; Laing et al., 2013). As Appendix 5 of this report
indicates, Ontario’s chemical products have relatively low market power (index of 0.19)
followed by basic metals and fabricated metal products (index of 0.21). This contrasts with the
pulp and paper industry that has higher market power (index of 0.4). As hydrogen, iron and
steel products are price takers, they pass on a smaller portion of their marginal costs to
Production
a.
Consumption
b.
Net production
(a) - (b)
Iron -0.12% -0.06% -0.06% 0% to -0.7%
Chemical -0.3% -0.1% -0.2% -0.2% to -1.2%
Paper -0.4% 0.2% -0.6% -0.1% to -0.6%
Aluminum -0.2% -0.05% -0.15% -0.5% to -1.3%
Cement -0.1% 0.0% -0.1% -0.3% to -1.3%
Glass -0.13% -0.06% -0.07% -0.3% to -0.5%
Ontario's Competitiveness Effects with 10%
increase in cost of energy (estimated)Industry
U.S. Competitiveness Effects with
$15/tonne (Aldy-Pizer, 2015)

28
consumers, despite high degrees of exposure to carbon prices. This shows that some industries
in Ontario can benefit less from the free allowances received. Some reasons for the differences
in the distribution of benefits among manufacturing industries could be due to differences in
market power, emission intensities, cost structures and demand elasticities (Haites, 2003).
As the Ecofiscal Commission notes, the interconnectedness between the structural economy and
impacts on competitiveness with carbon prices supports evidence-based analysis to assess the
sector-by-sector competitiveness pressures from carbon pricing (Beale et al., 2015). This could
be a useful area of analysis, as providing free allowances are a major cost to the policy. It would
be important for policymakers to assess how sensitive different sectors are to carbon pricing over
time and the extent to which transitional assistance would be most helpful to the industries.
6.4 Distribution Effects of Allowances to Consumers
6.4.1 Benefits to Consumers
Depending on how cap and trade proceeds are used, it affects the value of the allowances
distributed to consumers and private entities (Stavins, n.d.). In the past, Stavins’ analysis of the
American Clean Energy and Security Act (Waxman-Markey Bill, 2009) concluded that 20%
benefits accruing to industry can fully compensate for the equity losses due to the policy’s
implementation (Ibid). Based on the division of initiatives undertaken in the Kerry-Lieberman
Bill, Stavins found that 82% of the benefits from the value of allowances had accrued to
consumers while the remaining 18% accrued to industry.
The distribution of the value of allowances can be assessed from projected allocations of GGRA
funding in the climate change action plan (Appendix 6 of this report). Based on the projected
allocation of cap and trade proceeds, it was found that about 80% of Ontario’s cap and trade
proceeds may benefit consumers. 14
This amounts to over $6 billion in the value of the proceeds
that may accrue to consumers. These benefits could be realized if the majority of greenhouse
14
Initiatives benefitting consumers include six of the seven categories mentioned in Schedule 1: investments to
deploy renewable technology (initiative 1); support for increasing consumer demand in using zero emission fuels
that enhance land use and reduce building emissions (initiative 2); investments to support increasing consumer
demand for zero emission vehicles and public transit infrastructure (initiative 3); investments in reducing
greenhouse gas emissions in agricultural and waste industries (initiatives 5 and 6); and initiatives that will support
organizations in developing and delivering financing tools, project aggregation and professional services to
consumers to reduce greenhouse gas emissions (initiative 7). The benefits distributed to industry include allocations
to new technologies (carbon capture, sequestration and storage) and changes to processes or inputs into the
processes to reduce emissions (initiative 4).

29
emission reductions are achieved by 2020, but it may not if the expected cap and trade proceeds
are not collected in full.15
From a revenue perspective, there is risk that the maximum revenues
from cap and trade may not be earned to realize the benefits from additional greenhouse gas
reduction activities. From a distributional fairness perspective, the benefits received by
consumers who effectively pay for the distributor’s allowances could be lessoned.
6.4.2 Costs to Consumers
The direct cost to consumers, owing to the distribution of allowances, is the cost of free
allowances paid to the industry, amounting to about $3.27 billion for 2017-2020 period (see
Table 3). The indirect cost to consumers, as described below, is the immediate cost that
consumers pay for the cost of allowances used by fuel distributors, amounting to about $7.52
billion for approximately 4.5 million Ontario households16
from 2017 to 2020 that will pay an
additional $158 per year for the cost of compliance by 2020. Table 5 below provides estimates
of the income distribution effects of home heating and gas transportation costs to consumers.
In 2017, it is estimated that gasoline prices will rise by 4.3 cents/litre and natural gas heating
costs by 3.3 cents/m3 for residential customers based on a carbon price of $18/tonne.
17
Assuming 1,400 litres of gasoline and 2,400 m3 of natural gas are used by the average household
in Ontario every year, the cost of carbon that ranges from $18 to $100 per tonne could
incrementally increase the bill for low-income consumers from 0.5% and 2.5% of after-tax
income. For low-income consumers, the total bill impact including incremental carbon costs
could range between 8% and 10% of after-tax income. Due to the substantial impacts on low-
income consumers, it supports the need for targeted assistance to low-income families. This can
be particularly challenging as residential tenants have been identified to be unable to make
energy efficiency upgrades, but will pay the price of carbon (Ibid). This also includes
exemptions on fuels used on First Nation reserves to mitigate the cost impacts, which will be
specified through complementary regulation.
15
A discussion of the risk of market illiquidity described in Section 7 of this report, demonstrated that the
oversupply of allowances contributed to a loss of revenues earned at auction May 2016 joint auction between
Quebec and California. 16
This is 75% of 6 million households in Ontario affected by cap and trade. 17
The cost estimates for gasoline and home heating costs were published by the Ministry of Finance in the 2016
Ontario Budget in March.

30
Table 5. Cost Impacts to Consumers by Income Bracket (Estimated from 2017 to 2030)
Sources: Table 203-0022 Survey of Household Spending, by income quintile; Table 405-0002 for sales of fuel used for road motor vehicles; Table 405-0004 for motor vehicle registrations; EB-2015-0114 for 2016 natural gas rates approved in Toronto.
6.5 Assessment
Based on the distribution of allowances, this analysis attempts to estimate potential gains and
losses experienced in the program’s first compliance period. This analysis was based on the
quantifiable benefits known at the time related to the distribution of allowances.18
Industries are
expected to benefit significantly in terms of the value of allowances received from the
allocations. Based on the policy options assessed by the Ontario government, however, a
combination of auction and free allowance distribution is expected to mitigate carbon leakage
and achieve the highest GHG reductions at the lowest cost. The distributional impacts between
producers and consumers are summarized as follows.
For producers, there could be a potential gain of about $4.7 billion received from the distribution
of allowances. These benefits could be comprised of the cost of free allowances received and
portion of cap and trade proceeds accruing to industry. About 90% of free allowances are
expected to come from allowances distributed from the production-output benchmark and
historical allocation approaches. The EITE industries benefit from free allowances being a
production subsidy on their operations. The economy benefits by keeping jobs and investments
in Ontario. When carbon leakage is mitigated, it is expected to last for the period in which
transitional assistance is provided. In the near term, the costs of the benefits are socialized
among all consumers.
18
This analysis does not account for capital investments or mitigation strategies incurred by large emitters, potential
cost savings from energy retrofit programs funded by action plan initiatives, and the potential employment impacts
associated with the implementation of the cap and trade program.
Incremental
(+$158/year)
Total
(+$2,760/year)
Incremental
(+$880/year)
Total
(+$3,480/year)
Lowest Quintile $ 34,895 0.5% 7.9% 2.5% 10.0%
Second Quintile $ 44,155 0.4% 6.2% 2.0% 7.9%
Third Quintile $ 63,569 0.2% 4.3% 1.4% 5.5%
Fourth Quintile $ 82,821 0.2% 3.3% 1.1% 4.2%
Highest Quintile $ 118,729 0.1% 2.3% 0.7% 2.9%
Carbon Price: $18/tonne Carbon Price: $100/tonne
Income BracketTotal Consumption
(after income taxes)
31
Despite the potential benefits received, this analysis has shown that manufacturing industries
receiving free allowances can experience varying levels of risk exposure to carbon pricing. This
justifies higher proportions of allowances to some industries over others. The basis of free
allowance allocations will benefit those who are more carbon intensive and have less ability to
pass on carbon costs to their customers. In the long term, even after the free allowances are
phased out, price-taking industries may suffer from the lower level of cost pass-through of
product costs to customers. This could support the need to evaluate the sector impacts from
carbon prices to assess how carbon leakage can be addressed, without the provision of free
allowances. Although it remains uncertain when the free allowances will be phased out, price
taking firms with less pricing power will need to prepare for major changes soon. This will be
beneficial for firms to reduce their future costs of compliance without free allowances availed. It
could therefore be reasonable to expect that carbon pricing will incentivize competitive
behaviour in the industry due to varying degrees of cost pass through of the carbon cost to its
customers.
For consumers, it is projected that the potential benefits in GHG reductions distributed to
consumers from the action plan initiatives may be countered by the costs paid to fund free
allowances to the EITE industries and the cost of allowances purchased by fuel distributors.
However, as transitional assistance will be phased out over time, the distribution of benefits to
consumers through the re-investment of cap and trade proceeds is expected to increase, as
targeted action plan activities will reduce the energy costs for households and businesses.
Recent events in the May 2016 auction in Quebec and California raise concern on the viability of
the market to indicate the marginal costs to abate. This introduces risk to the funding model for
the action plan to implement initiatives and complementary policies and create benefits to
consumers. Further, as many complementary policies have not been implemented, it weakens
the expectation of meeting provincial targets, unless the emission reductions will be enforced
through more stringent means (Winfield, 2016). This places importance on the enforcement of
the cap and trade program to achieve meaningful and significant reductions. As more
information becomes available on the results of the auction and action plan initiatives, it will be
useful to continue monitoring the costs and benefits associated with the distribution of
allowances beyond 2020.

32
7. Effectiveness of Market Design
The effectiveness of the cap and trade system will be influenced by the performance and
enforcement of the market rules to facilitate discovery of the carbon price. The carbon price
should signal the marginal cost of abatement and incent real behavioural change to achieve
significant emission reductions. This is a critical outcome as a low carbon price in the EU-ETS
could not incent long term technological investments (Laing et al., 2013). Ontario’s market
design will be assessed for its ability to be efficient, transparent, enforceable and effective.
7.1 Market Design and Administration
Due to the potential harmonization of Ontario’s cap and trade program with Quebec and
California, Ontario’s market design framework is consistent with the WCI. Once linking occurs,
amendments to the Ontario cap and trade program will pertain to enforcing congruency in the
market design with Quebec and California. By using the Compliance Instrument Tracking
System Service (CITSS) to support the implementation of Ontario’s cap and trade program, the
following market rules have been established for Ontario:
Quarterly auctions with sealed bids of 1,000 lot purchases
A minimum (floor) price that is pegged to the Quebec and California auctions,
increasing with the rate of inflation each year; and maximum (reserve) prices at fixed,
tiered, prices representing 5% of total allowances auctioned
Purchase limits of up to 25% of total allowances sold for capped participants, or 4% of
total allowances sold for non-capped participants
Holding (or banking) limits of no more than 4% of the participant’s allowances for
current and future vintage allowances
Offset credit limited to 8% of a participant’s total compliance obligation each year
Same disposition of allowances as WCI that are unsold or exhausted at auction
Similar enforcement provisions as WCI at the time of submission to enforce rigidity in
the compliance process
In Ontario’s cap and trade program, the Minister administers the program by establishing the
compliance and holding accounts for capped participants. Participants will use the compliance
account to track their purchases in meeting compliance obligations and use the holding account

33
to bank current vintage allowances and/or credits for the future. At the end of the first
compliance period, the Minister removes the allowances and credits from the participant’s
accounts. Capped participants will demonstrate compliance by submitting allowances and/or
credits that reflect total emissions produced from 2017 to 2020.
Figure 2. Illustration of Ontario’s Cap and Trade Market
7.2 Efficiency
There could be various measures used to make the carbon market efficient. Such measures
include imposing purchase restrictions, cost containment measures that smooth out price
variability, a strategic reserve to add liquidity in the market, and intervention measures during
the bidding process to enforce the purchase and holding limits. These are measures used in
Ontario’s cap and trade program.
Purchase limit. Efficiency in the market is controlled by how much each bidder can purchase in
the market. To ensure that the carbon market is efficient, restrictions on the purchase limit will
prevent market dominance by one participant. Once bidding into the market is permitted for a
participant, the rules on purchase limits will apply to the compliance and holding accounts.
In joint auctions in Quebec and California, the measure of the concentration of allowances
purchased by participants is measured by the Herfindahl-Hirschman Index (HHI). In a past
auction (November 2014 to August 2015), 100% of allowances auctioned were sold (Appendix 7
of this report). The HHI ranged between 478 and 627, indicating that each participant held about

34
5-6% of the allowances in the market.19
As the market becomes more efficient, the share of each
participant’s bid in the market is reduced. This indicates that a competitive market creates
efficiency as market outcomes are not controlled by one participant.
Banking limit. The banking provision enables temporal flexibility and adds efficiency to the
market, as it can mitigate potential price shocks if there are expected shortages in the following
period. The market rules allow for 4% of the participant’s annual current and future vintages
allowances and/or credits to be held for future use (Appendix 8 of this report). To ensure that the
banking limit is followed, allowances and/or credits that exceed the holding limit can be
removed and reserved for sale at auction (O. Reg. 144/16, s. 43).
Strategic reserve. Starting in 2017, 5% of the total allowances in each compliance year will be
put into a strategic reserve that are priced at $51.23, $57.63 and $64.04 per tonne, increasing by
5% each year with the rate of inflation (supra, ss. 55 and 80).
The strategic reserve adds liquidity to the market by limiting price shocks that could occur in the
event of an allowance shortage in the market. Prior to bidding for reserve allowances held for
sale, the applicant is required to meet certain conditions before bidding into the reserve
allowances. This includes not exceeding the holding and purchase limits and the amount of the
financial assurance. Only capped entities can make purchases from the strategic reserve.
Based on past results, the amount reserved for sale should be adequate, as less than 5% of
strategic reserve allowances have been accessed by Quebec and California. This was estimated
from the Quebec and California joint auction report from January 2016, as a total of 141.8
million reserve allowances were recorded out of 2.9 billion allowances and/or credits in all the
accounts combined.
Interventions in bidding to increase efficiencies. There are various points in time where
additional oversight is exercised during the bidding process to enforce compliance of the
purchase and holding limits for each participant. These are important measures to maintain
efficiency in the market.
19
If the HHI is controlled by a single participant holding 100% of the allowances in the market, the HHI would be
10,000.
35
At time of the auction, the minimum price to be bid by each participant will be the higher of the
allowance prices in Quebec or California on the day of the auction (supra, s. 71). Prior to
accepting the bids, there is a screening process to prevent bids that exceed the holding and
purchase limits, and whose bid value may exceed the value of the financial assurance (supra, ss.
72 and 74). There is oversight at the time of bidding to enforce program compliance and
monitoring of purchases and holding limits to prevent the accumulation of market power by a
participant. Further, to prevent the risk of default, the bid value is to be less than the value of the
financial assurance.
The acceptance of bids starts at the highest bid price and continues in decreasing order by bid
price until no more bids remain (supra, s. 75). This order appears to ensure that the lowest bid
price will prevail. Before reserve allowances are available for sale to participants, the auctioned
allowances in the market must be used up. In times of an allowance shortage, the remaining
allowances will be distributed proportionately to the participant’s share of allowances in the
market. However, the market rules do not indicate explicit mechanisms to deal with allowance
surpluses.
With market oversight to enforce purchase and holding rules, it makes the program
administratively feasible when there are smoother allowance prices over time. Due to the
monitoring and oversight activities enforced in the bidding process, it is likely that higher
program costs will be needed to create efficiencies in the market.
7.3 Transparency
Transparency in the market rules will be discussed in terms of the submission requirements,
participant disclosure requirements, availability of notices and opportunities to appeal. These
rules ensure responsible conduct from participants and accountability from the government to
report on the progress of the auctions.
Submission requirement. At the end of the first compliance period, only the following
allowances can be submitted for compliance: Ontario allowances reserved for sale, emission
allowances with a current or earlier year vintage, and emission allowances distributed free of
charge (supra, s. 13). Until linking with Quebec and California is established, only Ontario
allowances and credits are submitted by capped participants by the end of the first compliance

36
period. To prevent theft, the submission of allowances and credits will be confirmed by two of
the participant’s account representatives (supra, s. 15).
Disclosure of information. At the time of registration, all registered program participants will
disclose the identity, corporate structure and ownership of the applicant. Specifically, ownership
details include business associations with greater than 20% control. Related persons are defined
as having greater than 50% control of the business. Market participants do not have a
compliance obligation, but can register by disclosing information in Schedule 1. Participants
who are related persons will allot the purchase and holding limits between the persons.
There will be one primary account representative or designated representative who can perform
actions on behalf of the participant. The registrant’s designation of account representatives will
be declared at the time of registration. Altogether, the requirement to disclose the relationships
of the participant will enhance the participant screening process, disclose the potential allotment
of allowances between related parties, and indicate relationships between the participant and
account representative(s) who administers the accounts on the participant’s behalf.
Availability of notices. Over the course of the year, information on the auction or summary of
auction sales will be made available to the public (supra, ss. 60 and 64). Similar to the notices on
auction results issued for the Quebec and California, the availability of auction results will
ensure that the bidding process was transparent on market activities.
Opportunities to appeal. For decisions or orders related to the conditions of registration,
cancellation of registration, closing of cap and trade accounts, administrative penalties and
review of compliance order, the participant can request a hearing by the Environmental Review
Tribunal (Climate Change Mitigation and Low-carbon Economy Act, 2016, ss. 2 and 60).
Although the scope of appeal is defined, this process can simplify the adjudicative process and
create process efficiencies.
7.4 Market Enforcement
Ontario’s cap and trade regulation has enforcement provisions to incentivize compliance. This is
necessary to ensure that the allowances submitted represent the emissions produced by 2020.

37
Similar to Quebec and California, Ontario participants can be penalized with additional
allowances to be submitted in an amount equal to three times the shortfall, known (3 to 1 rule).
If the participant continues to fail to surrender all the allowances used to meet its compliance
obligation, the obligation is converted to debt (O. Reg. 144/16, s. 20). The holding account will
be restricted to transferring allowances or credits to the compliance account. The account
representative’s authority to deal with the accounts is further restricted to the compliance account
(supra, s. 17). These enforcements ensure that the participant does not submit fewer allowances
than the amounts reported. The 3 to 1 rule, account restrictions and compliance penalty are
expected to incentive compliance and ensure accuracy of the emissions produced.
Further to these rules, Ontario intends to develop and publish rules on the application of
administrative monetary penalties in 2016 to deal with non-compliance of the program and
reporting regulations (MOECC, 2015c; 2016b). It will be difficult to comment on the
enforceability of the submission requirement, as the administrative penalties have not been
finalized. With the provision of timelines in the program regulation, it can ensure payment of the
debt to help enforce the submission requirement.
7.5 Effectiveness
An important market outcome is the discovery of the carbon price that reflects the marginal cost
to abate and incents behavioural changes to achieve a low-carbon transition. Considering the
socio-economic impacts and damage costs to the environment, potential damages were estimated
to cost $5 billion a year (Canada, 2011). For Canada, there are estimates of $100 per tonne by
2020 and $300 per tonne by 2050 to achieve deep decarbonisation (Canada, 2013). As
environmentalists have cautioned, it can be problematic if carbon prices are not high enough to
incent the immediate deployment of low-carbon technologies (Winfield, 2016). At the same
time, the price of $18 per tonne in Ontario is relatively higher than many global economies and
will continue to rise to indicate higher marginal costs to abate over time.
This will be a challenge for policymakers to balance the pace of change by instituting higher
carbon prices today to signal immediate behavioural and technological change from society or
allowing carbon reductions to be driven cost-effectively. The extent of a higher carbon price at
signalling technological change could be tempered by the implementation of complementary
policies, which may lower carbon prices when fewer allowances are demanded (Canada, 2013;

38
Newell et al., 2013; Peeters et al., 2013). The prospect of linking will also attain the emissions
target at a lowest cost by leveraging a greater pool of allowances and/or credits to be used for
compliance purposes.
7.6 Assessment
Based on the assessment of the efficiency, transparency, enforceable and effectiveness of
Ontario’s cap and trade program, there is administrative capacity built in the system to support
an efficient and transparent market. Ontario’s market design will be guided by a set of
harmonized rules to enable linking in the WCI. The use of WCI infrastructure is expected to
save implementation and transactional costs. There will be limited flexibility for Ontario to
change the market design, as any potential changes will need to be reflected in Quebec’s and
California’s market design. However, use of shared infrastructure for market operations is a
necessary path for Ontario to achieve low-cost compliance and linking of its cap and trade
systems within the WCI.
Market oversight has been built into the design to enforce the conditions to participate in the
market. The market rules will enforce the purchase and holding limits to increase efficiencies
and compliance with the program. These are cost containment measures including a price floor,
price ceiling and strategic reserve to ensure that the market does not fail. The monitoring and
oversight of the program to enforce the market rules are expected to result in higher program
costs. Through market oversight and transactional efficiencies, it is expected to facilitate price
discovery that enables low-cost emission reductions.
Transparency in the market design has been achieved with the disclosure of participant
information that clarifies business relationships, potential allotment of holding limits and access
to the accounts. The market rules will be enforced throughout the bidding process. Prior to the
submission of allowances, the risk of fraudulent activity will be mitigated by having the bids
confirmed by two account representatives. By the end of the compliance period, participants
must demonstrate compliance by submitting allowances equal to emissions produced. The
consequences could be serious as the EU-ETS’s provincial emission caps were met, but not all
firms were compliant and surrendered allowances on time (Laing et al., 2013). In case of a
shortfall of emission allowances in Ontario, the 3:1 rule, account restrictions and compliance
penalty will carry through. Penalties will otherwise apply, if this condition is not met. For

39
Ontario, instituting specific timelines with the requirement to pay the financial penalties could
strengthen the enforceability of the submission requirement. It will be important to review the
administrative penalties when subsequent regulations become available in 2016.
With the harmonization of the market with the WCI, Ontario’s allowance price will be aligned
with the carbon price in Quebec and California. The price increases by the rate of inflation to
create consistent a floor price with Quebec and California. Despite the gradual price increases,
the interaction of complementary policies can have negating effects of lowering the cost of
carbon regulation (Canada, 2013). If lower carbon prices are accelerated with aggressive
policies towards renewables, it may reduce the reliance on fossil fuels and free up allowances,
but also dampen the price signal (Newell et al., 2013; Peeters et al., 2013). Due to potential
interactions from renewable and other complementary policies that can reduce natural gas usage
and the demand for allowances, it questions whether the carbon price path needs to rise to very
high levels to achieve sustained behavioural changes. Policymakers therefore face the challenge
of balancing the pace of change by allowing carbon reductions to be driven cost-effectively in
the marketplace as compared to instituting higher carbon prices to signal immediate behavioural
changes in the society.
Evidence from marginal abatement cost curves have shown that a carbon cost of over $100 per
tonne would be needed for Canada to achieve a 50% emissions reduction (Rose and Wei, 2008).
The risk of keeping carbon prices lower is the potential that it may dampen the adoption rate of
new technologies (Scott et al., 2004). Policy experiences show that the impact of a low carbon
price in prompting technological change was experienced by the U.S. SO2 trading program, as
more than half of the sources did not switch to low-sulphur coal when economical (Hahn and
Stavins, 2011). The EU-ETS also experienced low carbon prices which stimulated short-term
investments rather than longer term, high abatement technologies (Laing et al., 2013). In the
near term, monitoring the market will be important to ensure that market liquidity facilitates
price discovery. With a market-driven carbon price, it is expected that an efficient market leads
to a carbon price that reflects the marginal cost to abate and the gradual progression of
meaningful technological changes when it becomes viable to do so.
In Ontario, the CITSS supports market oversight, compliance verification, the recording of
transfers and account information in the WCI. Although there will be limited flexibility on

40
market rules, the use of CITSS can be seen to raise efficiencies for trading activities and lower
infrastructure costs to support the implementation of the cap and trade program. The CITSS is
similar to the U.S. EPA’s Allowance Tracking System used for the Acid Rain Program. The
Allowance Tracking System was adopted by the EU-ETS to record allowance transfers used for
compliance purposes and to ensure that the submission of allowances at the end of the term will
correspond to the emissions produced. Decisions about the CITSS are made by the WCI Board
of Directors with representation from Ontario.
8. Transparency of Accommodations and Flexibility Arrangements
8.1 Accommodations
Accommodations were first introduced in the U.S. cap and trade program under the Clean Air
Act in 1990 that distributed free allowances to regulate SO2 emissions. Following the U.S. SO2
cap and trade model, the EU-ETS distributed free allocations based on production-based
emissions (Peeters et al., 2013). Based on the production-based approach, the estimation of
emissions without a good measurement of baseline emissions made the EU market prone to an
over-allocation of allowances (Laing et al., 2013). Following the 2008 economic recession, the
oversupply of EU allowances persisted with 77% of the EU firms holding surplus allowances in
2011 (Ibid). This led to the price crash and profits for many firms that passed on the costs to
consumers (Pew, 2011). The inability of the carbon price to signal investments in low-carbon
technologies was criticized. Today, the EU-ETS has evolved its emissions trading program to
using industry benchmarks (Radu, 2014). The result of using performance benchmarks has
reduced free allocations to the EU countries (Lecourt et al., 2013). As described in Section 2.4
earlier, there are automatic stability mechanisms in the EU-ETS to ensure an appropriate level of
supply based on cumulative allowances injected and banked.
Studies that have examined the impact of different allocation approaches provide insight on the
implications of the allocation method that Ontario proposes to use. Output-based allocations
provide incentives to firms to maintain their current production levels as compared to historical
allocations (Haites, 2003). Results show that output-based allocation can reduce leakage
substantially, which is a benefit to the industries receiving allocations using the production-
output method (Bushnell and Chen, 2012). While historical allocations are cheaper to maintain,

41
the cost of maintaining production in an output-based allocation approach will be reflected in
higher allowance prices (Haites, 2003).
Due to the potential for carbon leakage in EITE industries, Ontario has made provision for the
distribution of free allowances in the first compliance period. The determination of transitional
assistance was based on the emissions intensity and trade exposure of Ontario’s EITE industries
(Appendix 8 of this report). The first part of this section assesses the transparency of free
allowances provided to the EITE sectors. The second part of this section then assesses the
flexibility arrangements included in Ontario cap and trade program to meet their compliance
obligations. The discussion on early reduction credits and offsets will be limited, as these areas
were not finalized in the program regulation.
8.1.1 Eligibility for Free Allowances
A facility that is a capped participant involved in the GHG activities listed in Schedule 2 of the
Reporting Regulation is eligible to apply for free allowances. The established allocation
methods in the Methodology for Free Allowances Distribution will apply to all eligible
participants. The basis of free allowance distributions will be informed by a standard
measurement and verification process to validate the reported emissions consistent with the
Reporting Regulation. Similar to capped participants, voluntary participants can apply for free
allowances based on verified data.
8.1.2 Review Process for Distribution of Free Allowances
The cap and trade regulation outlines a process for applicants to apply for free allowances and
how these applications will be considered. By September 1 every year, eligible participants
submit an application for free allowances, which is certified by a third party, based on the
specified GHG activities engaged in at the facility (O. Reg. 144/16, s. 86). The Minister will
determine the amount of free allowances based on the proposed methodologies (supra, s. 88).
The Minister may also decline the application, if the information submitted was incorrect or the
GHG activity has ceased (Ibid).
8.1.3 Transparency of Allocation Methodology for Free Allowances
The distribution of free allowances in Ontario follows the approach used in California’s cap and
trade program. A facility’s allocation is determined by a formulaic approach which is the

42
product of (a) an industry assistance factor, (b) the base amount of emissions and (c) the cap
adjustment factor (Methodology for Free Allowances Distribution, Tables 5 and 6). The total
amount of free allowances distributed is the total of allocations by method and of the production
adjustment. Each component of the allocation methodology is discussed.
8.1.3.1 Industry Assistance Factor
All industries receiving free allowances are subject to the same industry assistance factor of
100% that treats all industries equally in terms of the leakage rate assumed for all sectors.
However, Ontario’s approach of using a 100% industry assistance factor is consistent with
California’s approach of providing transitory support to all industries in the initial years of the
program (Appendix 10 of this report).
If transitional assistance continues after the first compliance period, the decline in the industry
assistance factor will be a key indicator to assess the industry’s risk of leakage. The approach to
provide transitional assistance should be targeted and evidence-based using data from the firm’s
experiences in the program. Once Ontario links with Quebec and California, there should be
consideration in aligning industry-specific assistance factors based on consistent methods to
define EITE sectors. This would create greater comparability in the amount of transitional
assistance provided and inform the cost of the emission reductions achieved with free
allowances.
8.1.3.2 Determination of Base Emissions
Product-output benchmark allocation (Method A)
Under the product-output benchmark approach, free allowances are distributed to five industries:
cement manufacturing, beer production, hydrogen production, iron and steel, and petroleum
refining. Base allowances are determined by multiplying the industry’s benchmark emissions for
the product by that facility’s output. As a result, the more energy-efficient the facility is, the
more allowances the facility receives against the benchmark. The product-output approach
constitutes the majority of free allowances provided in the program. The products receiving
allowances under this approach have also been identified with higher leakage risk (Appendix 9
of this report). They include grey cement manufacturing, beer production, hydrogen

43
manufacturing, iron and steel production (liquid iron, BOF steel, EAF steel, coke, limestone and
dolomite) and petroleum refining.
There are a significant amount of free allowances distributed with this approach, which totals
about 60% of the free allowances provided (Appendix 3 of this report). This also equates to 20%
of the cost of 2017 allowances or 5% of the 2017 provincial allowance cap. It continues to be
important to ensure that the distribution of free allocations is accurate based on appropriate
benchmarks used for eligible products under this approach.
Energy-use allocation (Method B)
Under the energy-use allocation approach, emission allowances are allocated based on the
amount of fuel used at the facility. This allocation approach can be generalized for facilities that
generate useful thermal energy for an industrial process. Energy use allocations could amount to
30% of the free allowances provided (Appendix 3 of this report). By allowing cogeneration
facilities on-site to receive allowances attributable to both electricity generation and steam
generation, it removes the disincentive for cogeneration development if electricity generation
were ineligible (MOECC, 2016b). It therefore treats combined heat and power facilities that
produce heat and electricity in the same way as thermal energy generated from a boiler, a third
party or thermal energy from a cogeneration unit (IESO, 2016). This change will simplify
program implementation and compensate those cogeneration facilities that cannot pass on the
carbon cost to customers. The allowances for thermal energy imports are determined in Method
E.
The allocation of allowances based on fuel input will generate more allowances for facilities that
are more carbon intensive. This approach could be perceived to postpone investments in
facilities that are more fuel intensive, as fuel-based allowances will increase in proportion to the
amount of fuel used. 20
Given these risks, it appears to be reasonable that there was a re-
allocation of industries including pulp and paper products, petrochemical production and steam
20
Eligible energy inputs are defined as other fuels that are excluded from the fuel inputs qualifying under the
product-output benchmark approach, historical absolute, direct allocations and historical emission intensity, other
than a few exceptions permitted for two facilities that produce nitrogen and steel (Methodology for Free Allowances
Distribution, s. 2.2.2). Base allocations can be determined estimating the total amount of energy used in a facility
that had access to natural gas or another fuel, less the amount of electricity transferred to the IESO or to a
distributor, plus the amount of electricity purchased or generated from the combustion of fuel (supra, s. 2.2.1).

44
supply from the energy use approach to the historical allocation or product-output benchmark
approaches to encourage energy efficiency.
Historical allocation (Method C)
Under the historical allocation approach, emission allowances can be based on historical average
emissions intensity or absolute emissions. For historical emissions intensity, the base allowances
allocated are determined by multiplying the product’s emission intensity by the facility’s output.
For historical absolute emissions, the amount of free allowances does not change based on output
produced or energy inputs used.
Historical allocations are estimated to benefit at least 10 industries or 20 products. These
products include base metal smelting, brick-making, carbon black, ethylene, magnesium
production, mineral wool insulation, lubricants and styrene (Methodology for Free Allowances
Distribution, Tables 2a, 2b and 3). Based on estimates of historical absolute emissions, this
approach could represent about 30% of the free allowances provided, 3% of the cost of 2017
allowances, and 1% of the provincial allowance cap (Appendix 3 of this report).
Despite the benefits of the historical allocation, fixating allowances to a certain quota can
penalize industries that are growing (MOECC, 2015c). The historical allocation approach can be
seen to limit emission reduction targets for the next three years based on the emissions produced
in the past. The historical approach rewards carbon-intensive industries by matching the
allowances with higher historical emissions, but penalizes growing industries or industries that
have taken early actions. This contrasts with the product-output benchmark approach that
measures the energy efficiency of firms relative to the emissions standard of the industry
benchmark. Historical allocations can ease administrative burdens as there are no annual
adjustments to the free allocations provided.
Direct allocation (Method D)
Under the direct allocation approach, the allocations appear to be made based on the emissions
reported and verified two years prior to 2015. Direct allocations are applied to six different
facilities: combustion emissions at institutions/universities, waste treatment and energy-from-
waste facilities; process emissions at a nitrogen production facility; and fixed process emissions

45
for a facility producing lime (Methodology for Free Allowances Distribution, Tables 4a to 4c).
Similar to the historical absolute allocations, direct allocations could reward facilities if the
allocation levels are high, while penalizing cleaner plants. Preliminary estimates in this report
indicate that the direct allocations approach can represent about 2% of the amount of free
allowances provided.
Indirect useful thermal energy (Method E)
The base allowance allocations for imported thermal energy is determined by multiplying the
imported heat reported by the non-biomass portion of the energy input used to generate thermal
energy, and the emissions factor of a boiler operating at 80% thermal efficiency. The eligibility
requirement for the indirect useful thermal energy approach is that a facility must not have
received allowances from another allocation method for the same energy source (supra, s. 2.5.3).
The MOECC proposed that smaller emissions from indirect steam purchases (less than 10,000
tonnes of CO2e per year) could be eligible to opt-in to maintain a level playing field between
regulated facilities (MOECC, 2016b). This appears to be reasonable as broadened emissions
coverage with indirect steam sources can lower the cost of compliance in the cap and trade
program.
8.1.3.3 Applicability of Cap Adjustment Factor
The inclusion of process emissions provides broader coverage to achieve economy-wide
reductions, but the cap adjustment factor for process emissions does not decline until at least
2020. This approach recognizes the difficulty that facilities face in implementing process
changes in the next four years. It buys additional time for firms to prepare for significant
production changes thereafter. Generally speaking, however, it could potentially forego the
opportunity of achieving cheaper emissions reductions in the long run, if technological changes
could occur earlier in the process.
Without accounting for biomass use at a facility, the cap adjustment factor for combustion
emissions will decline by an average rate of 4.57% per year from 2017 to 2020. This target is as
stringent as the average cap decline rate to achieve province-wide reductions. However, if
biomass is used at a facility, it can reduce the rate of decline for combustion emissions in

46
recognition of the carbon neutrality of biomass.21
The cap adjustment decline rate for
combustion emissions is allowed to vary by facility in proportion to the amount of biomass used.
In addition, the cap adjustment factor for biomass fuels does not decline under the energy-use
allocation approach (supra, s. 2.2.3). This allows for the continued levels of energy usage at
cogeneration facilities. Further, the combustion emissions from an institution and energy-from-
waste facility are exempt from a declining cap adjustment factor for at least the first compliance
period (supra, s. 2.4.2).
A consequence of this policy change is that it could be harder to compare the reductions in
combustion emissions between industries, as industries may or may not use biomass. The cap
adjustment factor for combustion emissions will vary on a case by case basis. To assess the
effectiveness of the cap adjustment factor, it could be beneficial to correlate the emission decline
rates by industry to the cap adjustment decline rate, and monitor the cost of actions undertaken
by facilities to achieve emission reductions.
8.1.4 Reporting of Free Allowances
To be transparent with the allocation of free allowances, the participants who received free
allowances and the amount of allowances distributed to each participant will be made public,
subject to confidentiality constraints (Climate Change Mitigation and Low-carbon Economy Act,
2016, s. 31).
8.2 Flexibility Arrangements
There are provisions in the climate change legislation and program regulation that allow
participants to have some flexibility in meeting their compliance obligations. The flexibility
arrangements include the following:
Facilities can be eligible for free allowances under different approaches
Provision for allowances due to increases in production
Emissions from direct and indirect links
Exemptions from holding limit
21
In the biofuels industry, carbon neutrality (or zero net emissions) is claimed on the basis that the carbon removed
from biofuel source approximates the amount of carbon released when it is burned.

47
8.2.1 Facilities can be eligible for free allowances under different approaches
Some facilities with more than one eligible GHG activity may apply for free allowances. This
provision is allowed for certain circumstances as defined by regulation. Two examples are
described. First, Terra International’s Courtright Nitrogen Complex is eligible for allowances
under different approaches for different products produced: (1) the historical emissions intensity
approach to cover combustion emissions for ammonia and nitric acid produced; (2) the energy-
use approach, if different fuels other than natural gas are used for ammonia and nitric acid
production; and (3) direct allocations for process emissions in nitric acid manufacturing.
Second, Imperial Oil and Carmeuse Lime are both eligible for allowances attributable to
different processes. Despite the flexibility arrangements provided, it is not expected to be
overused, as these exceptions are allowed under prescribed circumstances. Given that facilities
can be eligible for free allowances under different approaches, facilities should maintain a good
record on the attribution of emissions from different products and processes that receive free
allowances for the activities.
8.2.2 Provision for allowances due to increases in production
Through the production adjustment mechanism, it allows for the updating of allowances based
on actual emissions produced. The production adjustment is applicable to allowances distributed
under the product-output benchmark, energy-use allocation and historical emissions intensity
approach. It does not apply to the historical absolute emissions approach.
The production adjustment will match the current year’s allocation to production that happened
in the same year.22
On the one hand, if the adjustment results in a reduction in emissions, it
reduces the risk of over-allocation. On the other, additional allowances granted through the
production adjustment process will be a future vintage that can be submitted for compliance
purposes (O. Reg. 144/16, s. 13). Although future allowances can be accepted in the current
year, the additional allowances from the projection adjustment simply reflect the emissions
increase that occurred in the prior year.
22
Free allowances for 2017 will be allocated based on the past two years of production or energy use data from
2015. This was expected as 2016 data will not be available by September 1 every year, which would be the
application deadline for free allowances (O. Reg. 144/16, s. 86). Once the 2017 data becomes available in 2018, the
production adjustment will be calculated by subtracting the allocations using 2015 data from the allocations to be
made using 2017 data.

48
8.2.3 Emissions from direct and indirect links
The GHG emissions associated with a person’s prescribed activity can be emitted by the facility
and include the emissions of a related party, only if two conditions are satisfied: (1) there is a
direct or indirect link between the person and third party; and (2) there is a direct link between
the prescribed activity and GHG emissions of the third party (Climate Change Mitigation and
Low-carbon Economy Act, 2016, s. 9). This provision accommodates affiliates that are directly
or indirectly associated with the corporate entity, so that all emission reductions can be attributed
to the corporate entity for the purposes of estimating total emissions and free allowances.
8.2.4 Exemptions from holding limit
A registered participant is allowed to hold (or bank) up to 4% of total emission allowances
and/or credits in a year. This can include a combination of current vintage allowances, strategic
reserve allowances and early reduction credits banked for a future period (Appendix 8 of this
report). The same rule applies to the holding limit for future vintage allowances.
There are two exemptions to the holding limit for current vintages. First, the holding limit can
increase if the participant’s activities produced emissions that were at least 250,000 tonnes of
CO2e more than the previous year (O. Reg. 144/16, s. 41). Second, the holding limit does not
apply to the free allowances received. These exemptions are unique to Ontario’s cap and trade
program and reflect the needs of large industrial facilities that may require flexibility to increase
production output.
8.3 Other Accommodations and Flexibility Arrangements
The Climate Change Mitigation and Low-carbon Economy Act, 2016 created provision for
credits and can impose monitoring, reporting and verification on the person who applies for the
creation of offsets (ss. 34(4) and 35(4) of the Act). In California, the criteria for using offsets in
the AB 32 Regulation created by the California Global Warming Solutions Act of 2006 include
the requirement that actual emissions are credited from activities that would not have otherwise
occurred (CARB, 2014).23
When establishing the criteria in Ontario, it will be important that the
23
“Real” refers to crediting only actual reductions using conservative quantification methods; “Quantifiable”
represents accurate and measurable calculation; “Additional” emissions are those that would not have otherwise
occurred; “Enforceability” of an offset is demonstrated by submitting attestations to the California Air Resources
Board; “Verifiable” emissions should be documented and transparent; “Permanent” are irreversible reductions or
mechanisms for 100-year sequestration.

49
credits represent real, quantifiable, additional, enforceable, verifiable and permanent emission
reductions.
Early reduction credits. According to Ontario’s draft regulation, it was proposed that two
million early reduction credits would be available between 2017 and 2020 (Draft Regulation,
2016, A.4.1). Ontario’s approach is similar to Quebec’s rules in providing a one-time allowance
for these credits. Ontario’s early reduction credits would be provided for permanent and
irreversible reductions between 2012 and 2015 compared to a 2009-2011 base year, but would
not be provided to industries that received free allowances under the product-output benchmark
approach (supra, A.4.4). The average eligible emissions and emissions intensity of the facility
each year must be lower than the reference period (supra, A.4.5). Based on these rules, there will
not be over-compensation to firms receiving free allowances that increase with production.
Early reduction credits will truly be useful for facilities that have a stringent target based on
earlier action.
Offsets. The WCI rules allow offsets to cover no more than 49% of a facility’s total emissions.
Both Quebec and California use ozone depleting substances as common offset projects. In
addition, Quebec’s offsets include methane capture projects from manure storage facilities and
waste disposal sites. California’s offsets include projects in urban forests, livestock substances,
rice cultivation and mine methane capture. Among the offset programs, there are different buyer
liability rules whereby California’s purchasing entities are responsible for the credibility of the
offset. Quebec’s offset registry system includes an Environmental Integrity Account that
includes a buffer of additional offsets in case some offsets are less credible (Purdon et al., 2014).
California is considering additional principles on environmental and social safeguards from the
Cancun Agreement (UNFCCC COP 16) to strengthen its existing offset protocols.
Environmental safeguards are standards, principles or criteria included in the design and
implementation of a sector-based crediting program to protect the environment and the rights of
individuals and communities (California Air Resources Board, 2016). Including environmental
safeguards in the development of offset protocols and mitigation against environmental
degradation can prevent conversion of biodiversity and ecosystem (Ibid). Social safeguards can
ensure the sharing of program benefits from the use of the offset (such as forests) by developers,
government and communities to the local peoples who have traditionally used the lands.

50
Through safeguards, equitable benefits-sharing could be achieved by providing tenure rights to
the local peoples, improving stakeholder participation and apportioning benefits to the local
peoples (Ibid). Given the potential linkage with Quebec and California, Ontario could consider
harmonized protocols and stakeholder engagement in the development of its offsets protocols.
This can ensure standardization in the baseline of offsets, comparability of offsets and
acceptability of projects in all jurisdictions. This further supports greater integration of a
common offset protocol and an offset registry system within the WCI.
8.4 Assessment
Based on this assessment, large industrial facilities will be receiving accommodations and have
flexibility within the market rules to maintain its production needs while complying with the cap
and trade program. Although Ontario’s approach to allocate free allowances is transitory, it is
not known with certainty by when the free allowances will be phased out. Given this context, it
creates the need to understand the benefits and trade-offs with accommodations and flexibility
arrangements provided to participants of the cap and trade program. A key goal for
policymakers is to ensure that industries are accountable for the cost of their emissions provided
through free allowances.
The allocation methods for free allowances cover a broad range of eligible products and
processes in the manufacturing industries. The distribution of free allowances will be based on
verified data from existing and new facilities. For the first compliance period, there is a 100%
industry assistance factor, treating all industries equally to mitigate carbon leakage. This
approach is consistent with the practice used in California for the initial years of its cap and trade
program. In the future, it may be beneficial to consider alignment of industry assistance factors
within the WCI using consistent methods to define the EITE sectors. This could ensure greater
comparability in the amount of transitional assistance provided and the amount of emissions
reduced in the jurisdictions.
In Ontario, process emissions are not required to be reduced by all facilities over the first
compliance period. This recognizes the significant challenges that large industrial firms face in
reducing process emissions. This benefits capital-intensive firms by mitigating the risk of
leakage and avoiding uneconomic investments by 2017. There could be potential risk of
delaying low-carbon investments until 2020, but the use of multi-compliance periods in a cap

51
and trade program enables flexibility to reduce emissions in the year it is most cost-effective to
do so. For the facilities that have reduced emissions in the past, they could be eligible for early
reduction credits in recognition of the investments undertaken in the past five years to reduce
emissions permanently. The use of early reduction credits would not double penalize the
facilities with more stringent targets caused by earlier action.
The cap adjustment factor for combustion emissions declines at an average rate of 4.57% per
year, with exception to institutions and energy-from-waste facilities. With the consideration of
biomass, the cap adjustment factor affecting the rate of decline for combustion emissions is
relaxed.24
This recognizes the carbon-neutrality of biomass by rewarding industries with more
allowances that use biomass at the facility. If transitional assistance continues after 2020, the
industry decline rates for process and combustion should align with the provincial allowance cap
decline to achieve sustained emission reductions.
The cap adjustment factors, with the consideration of biomass, will make it harder to compare
the decline rates for combustion emissions in different sectors. Consequently, it may be
beneficial to monitor the rates of emission decline by industry and GHG activity to identify
where the reductions are occurring and the cost of emission reductions by facility.
As the EcoFiscal Commission stated, there could be a small degree of leakage due to carbon
pricing in Ontario. This is consistent with the findings in Section 6.3.2 of this report.
Nevertheless, the extent of accommodations provided to Ontario’s industries can mitigate the
potential risk of leakage, which enhances the effectiveness of the policy during this transitional
period. As noted, the consideration of targeted approaches to address leakage could be useful to
inform the extent of transitional assistance provided.
Based on the allocation approaches for free allowances, it is likely that energy-use allocations
will allow for continued levels of energy use. Industries that engage in energy efficiency are
penalized by receiving fewer free allowances under the energy-use allocation. This resulted in a
policy change requiring certain industries to increase energy efficiency by having free
allowances allocated based on historical emissions or product-output benchmark approaches.
24
A potential concern with the carbon balances of biomass may raise debates on its carbon neutrality. This is
discussed in Section 9.4.2 of this report.

52
The basis of allocations will be determined on past emissions or industry standard. Going
forward, industries are anticipated to be capable of reducing emissions much more significantly
relative to the baseline, without transitional assistance.
Based on the flexibility arrangements made under the program’s first compliance period, a broad
range of options are available to accommodate exceptional situations. A few were explored
earlier, but the provision related to exemptions to the holding (or banking) limit is discussed
below. Under the circumstance where there are significant increases in production of more than
250,000 tonnes of CO2e a year, the participant’s holding limit on allowances and/or offsets of up
to 4% a year is withheld. Additional free allowances will be provided for the increase in
emissions and the production adjustment will also apply. With the production adjustment
provided to participants in the following year, it creates the possibility that future vintage
allowances, related to the past year’s emissions increase, can be submitted for compliance
purposes in the current year. To ensure accuracy in the measurement of reductions in the current
period, any future vintage allowance related to the production adjustment should not be used for
other purposes. The accommodations to industry participants create the need to evaluate the
performance of the flexibility arrangements to inform future program development.
In the context of meeting provincial emissions targets, it is clear that significant reductions will
need to occur in the industry to meet long-term goals, even with some degree of transitional
assistance to achieve more cost-effective reductions. As forecast emissions in the industry will
be 20% higher in 2020 from 2013 levels (Section 5 of this report), it suggests the need for some
flexibility in the program rules to create more time for more significant changes to occur after
2020. For businesses, a challenge will be securing financing to engage in more expensive
mitigation options, while finding incremental savings opportunities with energy efficiency
programs to reduce combustion related emissions cost-effectively in the short-term. This
emphasizes the significance of re-investing cap and trade proceeds to help fund these
opportunities. Given the cost of transitional assistance provided to large industrial facilities,
accommodations should be transitory, as planned, and be provided to facilities in the interim to
mitigate leakage and other risks. It will continue to be a challenge for policymakers to balance
the costs and extent of accommodations and flexibility arrangements provided, while
encouraging significant behavioural change through the industry’s participation in the program.

53
In the future, it may be useful to explore the impact of flexibility arrangements on the pace of
change and stringency of the emissions cap.
9. Measurability of Emissions and Impact
Measurable emissions are critical to informing program coverage, the rate of cap decline and
distribution of free allowances. The measurability of emissions should be quantifiable,
reportable and verifiable. This enables accurate measurement of the baseline to benchmark
progress and assesses the potential to meet targets. This section will assess the measurability of
emissions by reviewing the measurement, reporting and verification processes. The impact of
emission reductions from a societal level is further assessed based on the potential emission
reduction impacts achieved through the climate change action plan activities.
9.1 Measurement of Emissions
To support the implementation of the program, Ontario’s reporting regulation aligns with the
reporting requirements in Quebec and California. This includes measurement of emissions to be
within a 5% error range and production data to be within a 0.1% error range in 2017 (O. Reg.
143/ 16, s. 26). To support the collection of data and measurement of emissions to inform the
allocation of free allowances, both process and combustion emissions are collected and verified
in GHG reports. Also, greater detail on the measurement requirements and reporting of biomass
types will be required (MOECC, 2016a). Relative to the last reporting regulation, the reporting
refinements support the implementation of the cap and trade program and ensure a higher margin
of accuracy in the quantification and verification of emissions.
Quantification methods. Based on the Reporting Regulation, there is a requirement to use
standard quantification methods to quantify the amount of greenhouse gases from the specified
GHG activity (O. Reg. 143/16, s. 4). Alternative quantification approaches including the use of
U.S. Environmental Protection Agency, Intergovernmental Panel on Climate Change and
Environment Canada quantification methods in measuring GHG emissions are permitted, if the
emissions are the lesser of 20,000 tonnes and 3% of total emissions in the facility in a year (Ibid).
To facilitate the measurement of emissions, most GHG activities will be measured from the
Continuous Emission Monitoring System (CEMS) which obtains a continuous measurement of
gas concentrations or emission rate from the combustion or industrial process with the use of

54
continuous monitors (Guideline for Greenhouse Gas Emissions Reporting, 2016). For
measurement-based quantification, there is assurance that data is monitored at all emission
points. The quantification of emissions will be reported in accordance with standard
quantification methods for specified GHG activities to enable standardization in the
quantification of emissions across Ontario industries and jurisdictions.
9.2 Reporting Requirement
In 2008, Ontario joined The Climate Registry to work on a common GHG emissions reporting
system with other states and provinces (MOECC, 2009). To be consistent in threshold and
emissions coverage in Quebec and California, Ontario lowered its reporting threshold from
25,000 tonnes to 10,000 tonnes (MOECC, 2015b). The reporting requirement may cease after
2020 if facilities emit 40% of a facility that produces 25,000 tonnes of CO2e for the last three
years of the compliance period (O. Reg. 143/16, s. 8).
There are different reporting thresholds for mandatory participants. A person who imports
electricity will report and have verified all the emissions imported into Ontario. The same
applies to a person who supplies petroleum products for consumption in Ontario, whereby 200
litres or more of petroleum product supplied during the year is reported and verified. For natural
gas distributors, the reporting threshold applies to emissions of at least 10,000 tonnes of CO2e or
more. The verification requirement applies to emissions greater than 25,000 tonnes of CO2e.
Petroleum product supply.25
For petroleum product suppliers, the supplier reports the annual
quantity of emissions that is first placed into the Ontario market, and the volume of biomass-
based fuel that may be blended with each petroleum product. An attestation form is required to
confirm the quantity of petroleum products received at the facility.
Industrial activity. Generally, the process and combustion emissions from CO2, CH4 and N2O,
and relevant inputs are collected to support the calculation of greenhouse gas emissions. The
quantification of emissions supports the preparation of annual GHG reports that undergo third
party verification. Other product emissions that are reported include adipic acid, ammonia,
carbonate use, cement, copper and nickel, ferroalloy, glass, hydrogen, iron and steel, lead, lime,
25
See ON.390 of the Guideline for Greenhouse Gas Emissions Reporting

55
magnesium, nitric acid, petrochemical, petroleum refining, phosphoric acid, aluminum, pulp and
paper, refinery fuel, soda ash and zinc products.
Electricity imports.26
The reporting of electricity imports includes the annual amounts of
specified imports and any imported amounts from unspecified imports. Based on California’s
cap and trade program, the effectiveness of the reporting rules to regulate the carbon content of
electricity imports have not been that effective at mitigating leakage. Despite the use of
emissions factors, leakage is not always mitigated if reshuffling and laundering takes place.
Reshuffling, in the context of electricity imports, could occur if low-emitting or non-emitting
resources that used to serve out-of-state energy were instead reassigned to serve Ontario; and
higher-emitting, out-of-state resources that used to serve Ontario were instead reassigned to
serve out-of-state power needs (Bushnell and Chen, 2012). Since electricity exports are not
subject to the default emissions factor, reshuffling may incentivize the flow of carbon-intensive
exports to jurisdictions that do not have carbon prices.
Laundering can take place if high-emitting, out-of-state power sources do not report the
emissions content of their resources, and label the imported power as unspecified to take
advantage of a lower emissions rate (Ibid). To address reshuffling and laundering, the California
Air Resources Board required each compliance entity to sign an attestation form claiming that
the importer did not claim GHG reductions that were not real (Ibid). No attestation form is
required for Ontario electricity imports in Ontario.
Electricity generation.27
Electricity generators report carbon emissions by fuel type, and
methane and nitrous oxide emissions for all fuels combined. The carbon content and heating
value of each fuel are reported to calculate the carbon emissions. To support the energy-use
allocations for cogeneration facilities, the amount of thermal output including (and excluding)
energy used for electricity generation, and the steam or heat imported from another facility, if
applicable, are reported. Process and fugitive emissions are reported, which include HFCs from
cooling units that support power generation. An attestation form is required to confirm the
quantity of petroleum products received at the facility for natural gas fired generation.
26
See ON.60 of the Guideline for Greenhouse Gas Emissions Reporting 27
See ON.40 of the Guideline for Greenhouse Gas Emissions Reporting

56
9.3 Verification of Emissions
Facilities emitting greater than 25,000 tonnes of CO2e a year will be verified. Emissions from
biomass do not require verification (O. Reg. 143/16, s. 30). The purpose of third party
verification is to ensure there is a reasonable level of assurance that the GHG report does not
contain any material discrepancy with the amount of emissions reported (supra, s. 32). This
involves reviewing whether the errors are less than 5% of the emissions reported or 0.1% of the
production data. This also includes a site visit for new facilities that are preparing their GHG
reports for the first time. The verification process supports collecting more accurate baseline
data in 2017 and facilitates allowance purchase decisions to pace out future investments.
Prior to submitting the GHG reports, the report must be accredited by a third party that is a
member of the International Accreditation Forum (ISO 14065) and meets international standards
(ISO 14064-3).28
This is to ensure that the accredited verification bodies providing the
verification statement did not verify the GHG report (supra, s. 31). The duty to verify only
ceases for voluntary participants, whose facilities that emit less than 25,000 tonnes of CO2e in
the last three years between 2018 and 2020 (supra, s. 11).
9.4 Climate Change Action Plan Supporting GHG Reductions
9.4.1 Measurability of Emissions Reductions
To achieve significant greenhouse gas reductions in the coming decades, it relies on the
conditions to support the reductions. The re-investment of cap and trade proceeds in GHG
reduction activities creates enabling conditions to reduce emissions significantly. Although
emission reductions of 9.8 million tonnes are planned to be achieved by 2020, not all emission
reduction opportunities have been quantified. Some of the benefits could be realized after 2020,
support reductions in other sectors, or sequester carbon in the future. Further, the cost of
achieving reductions in non-capped sectors of the economy is unknown. To ensure that emission
reductions persist, the climate change action plan emphasizes the need for monitoring and
evaluation of the action plan activities. These objectives support greater transparency in
emissions reporting to understand how the GHG reductions are driven and the costs to achieve
them.
28
Eligible accredited verification firms may be associated with the Standards Council of Canada and the American
National Standards Institute and must demonstrate duties of impartiality by complying with ISO 14065.

57
9.4.2 Use of Complementary Sustainability Metrics
Monitoring and evaluation of the initiatives can help inform the province’s long-term energy
plan and climate policy direction to achieve sustainability. Complementary metrics could be
used to supplement the evaluation of activities in the climate change action plan in the future.
Some proposed approaches are discussed.
Mitigate adverse impact with adaptive management plan. In California, it uses adaptive
management plan to assess whether environmental changes including localized air quality
impacts, forest impacts, or other direct and indirect changes are caused by its cap and trade
program or U.S. Forest Protocol. California’s adaptive management plan provides oversight on
the program, ensuring the realization of emission reductions and keeping the public and the
regulatory board informed of the impacts attributable to the cap and trade regulation (Air
Ressources Board, 2015). For Ontario, a potential way to monitor and protect the environment
from adverse changes could include consideration of social and environment safeguards to
mitigate adverse impacts, which is an initiative that California is exploring.
Assess potential with exergy analysis. Exergy is a thermodynamic analysis that assesses the
quality of the energy input (or the work potential) to the output produced. This approach can
identify efficiency improvements, reductions in thermodynamic losses attributable to sustainable
technologies, and the environmental and economic benefits of green technologies to increase
their utilization (Rosen et al., 2008). The use of exergy analysis is known to be effective at
finding opportunities and has potential to increase the penetration of renewable energy
technologies, evaluating hydrogen production technologies, and measuring emission reductions
(Rosen et al., 2008; Jalalzadeh-Azar, 2008). Using exergy analysis to evaluate the feasibility of
new action plan initiatives can support the growth and penetration of renewable energy and
energy storage technologies.
Model carbon flows to measure the emissions from biomass production. In the climate change
action plan, there is a focus on sustainable forestry management, tree planting, soil and grass
production, and the development of a land-use carbon inventory to track data on carbon flows.
Due to the significance of biomass to mitigate climate change, it has warranted greater
understanding of the cycling of carbon from biomass production to assess how efficient and
effective carbon can be stored on land. It is anticipated that deeper understanding in this area

58
will take place to learn how to achieve true carbon neutrality, prompting the need to monitor the
production and consumption of biomass.
Various factors need to be considered in managing land-use and biomass development. An
example is provided to illustrate the considerations (Cushman, Marland and Schlamadinger,
n.d.). If there is high quality soil, the land will be more productive to support the growth of new
trees. Fast growing trees can displace more fossil fuels for each harvest in each cycle, but it
could be slower for a mature tree depending on previously absorbed emissions. When biomass is
burned, the release of carbon will harvest growth of new trees. If the rate of new tree growth is
slower than the rate of carbon emitted from the burning of biomass, the net carbon emissions can
increase and negate the fact that biomass is indeed carbon neutral. Carbon cycling is also
affected by whether or not the biomass product displaces short or long lived products.
Therefore, the net carbon balance depends on the amount of biomass on the land, how fast the
trees can grow, and how efficiently it is harvested and converted to useful energy. These factors
should be considered in land-use management practices to support the production and
consumption of biomass.
9.5 Assessment
Due to the harmonization of systems with the WCI, Ontario’s quantification, reporting and
verification methods have been revised to be similar to the reporting regulation in Quebec and
California. The emissions reported must be accurate within 5% and 0.1% of the measurement
and production of greenhouse gas emissions. The reporting threshold in Ontario has been
lowered from 25,000 tonnes to 10,000 tonnes of CO2e per year, which includes mandatory
reporting from voluntary facilities. A robust measurement, reporting and verification process for
greenhouse gas emissions will promote consistency and standardization across the WCI.
The requirement to report greater detail on biomass types in Ontario appears to be necessary, as
the use of biomass can affect the amount of free allowances provided to the industry. Emissions
from the combustion of biomass at facilities will not require verification. However, the use of
biomass will be significant as it allows carbon-neutral facilities to retain more free allowances as
permitted by the moderate decline in the cap adjustment decline factor.

59
The accuracy in the measurement of process emissions can prevent the risk of over-allocation of
free allowances. From a measurement perspective, the persistence of facility emissions can be
achieved with continuous monitoring of emissions and a better understanding how GHG
emission reductions are driven from different processes. To ensure sustained emission
reductions, it will depend on the measurability of emission sources from GHG reduction
activities. The measurability of emissions will pertain to the reductions in a facility’s
combustion emissions that are subject to an annual decline factor by 2020.
From a reporting perspective, only emissions greater than 25,000 tonnes of CO2e at facilities
require mandatory verification. Emissions between 10,000 and 25,000 tonnes of CO2e are
reported. Emissions below 10,000 tonnes of CO2e and the use of biomass do not require
reporting. The reporting process ensures that larger emitters producing a larger share of the
emissions will be verified. The emissions from smaller sources could be expected to grow at a
faster pace, as voluntary facilities may participate and trade excess allowances with mandatory
participants.
The opportunities available to reduce emissions will be policy-driven to enforce significant
changes to the built environment. As the cap and trade system will generate proceeds to support
further emission reduction activities, it will be critical to ensure enforceability and
implementation of the climate change action plan activities. Although the conditions for a low-
carbon economy are created in the action plan, some initiatives beyond building retrofits and
electric vehicle implementation may be more complex and require longer implementation
timelines to realize the greenhouse gas benefits. Successful implementation of the action plan
will be dependent on timing, program uptake and the cost of achieving the emission reductions.
California uses complementary policies to achieve 85% of its emission reductions with 15% of
emission reductions achieved with carbon prices at less than $18 per tonne. This compares with
British Columbia that has achieved 5-15% emission reductions and reduction in fuel
consumption with its $30 per tonne carbon tax (Murray and Rivers, 2015). To ensure impact in
Ontario, it will continue to be important to clearly attribute emissions reductions from policy
initiatives, codes and standards, and emissions trading to assess the drivers of emission
reductions and the costs to achieve the reductions. As Ontario is in its early years of the 2050
deep decarbonisation pathway, it could be useful to enhance measurability of emissions by

60
assessing how the industry is responding to the increased cost of production, how allowances are
used, and how emission reduction opportunities are identified.
As the demand for energy is generally inelastic and carbon prices will be relatively contained in
the next few years, it enhances the attractiveness of complementary policies to support the cap
and trade program and encourage economy-wide change. As a result, achieving significant
economy-wide emission reductions are likely to be achieved with the scale and scope of
complementary policy measures. However, significant emission reductions will be realized after
the measure’s implementation.
A forthcoming consideration is the potential role and scale of offsets from agriculture, forestry
and lands. Offsets should yield reductions that are real, quantifiable, additional, enforceable,
verifiable and permanent. As discussed earlier, Ontario could consider the costs and benefits of
enforcing harmonized protocols within the WCI and increasing stakeholder engagement in the
development of its offsets protocols. This can ensure standardization in the baseline of offsets,
comparability and acceptability of projects in all jurisdictions. A common offset protocol and
offset registry system in the WCI could support the measurability of emission reductions from
offsets.
To complement the climate change action plan initiatives, the consideration of sustainability
indicators to evaluate future mitigation activities is anticipated to improve the social-economic
and environmental relationships of implementing climate policy on the environment.
10. Integration with Other Measures
The low-carbon transition set out in the climate change action plan establishes the climate policy
context in Ontario. This analysis focuses on the integration of the climate change action plan
initiatives with broader political, economic and environmental policy objectives.
10.1 Politics of Ontario’s Climate Policy
The political effort to re-introduce cap and trade after 2008 was led by the provincial Liberal
government and resulted in Ontario’s first major climate policy announced in 2016. This
announcement came at time when the new federal Liberal government came to power in 2015
and supported putting a price on carbon. The decision to use a cap and trade program in Ontario

61
owes to the flexibility of using multi-year compliance periods, providing businesses with the
option to choose their compliance path to meet climate change goals (MOECC, 2016c). The
basis of the climate change action plan initiatives were informed by the Ontario Climate
Strategy, which was developed on the feedback from consultations with the public on an
Ontario-made strategy to fight climate change.
The analysis that follows will provide an overview of the expectations that Ontario’s climate
policy can have on the politics within government, relationships with stakeholders, and its
alignment with provincial and federal climate policy goals.
Politics within government. With the climate change action plan, it laid out near-term changes
that will be affected by climate change mitigation strategies. With changes to legislation to
come, policymakers will need to coordinate within the government and manage the policy and
approvals processes. There are plans to amend a broad range of frameworks that include
changes in the municipal land-use process, energy planning process, provincial environmental
assessments, Ontario Building Code, renewable fuel standards, renewable content requirement
for natural gas, and tax changes for zero emission vehicles and low-carbon technologies.
Because of the time required to institutionalize changes to the built environment, it will be
challenging to achieve significant emission reductions across the economy until after the policies
are implemented.
It is expected that the provincial government will work with the federal government to secure
funding and ensure that federal infrastructure support aligns with provincial climate change
objectives (MOECC, 2016c). These collaborations are expected to develop inter-governmental
climate mitigation initiatives. To ensure that enabling policies in the action plan are
implemented, the government will need to manage potential barriers affecting the policy’s
implementation.
Politics between government and stakeholders. Following the 2015 Fall Economic Statement,
$325 million was made through the Green Investment Fund as a down-payment to the cap and
trade program to fund potential emission reduction initiatives. With cap and trade, there will be
differential impacts among industries. To maintain competitiveness and sustained GHG
reductions that are not leaked outside of Ontario, the EITE sectors will receive transitional

62
assistance and accommodations until at least 2020. To ensure the cost of free allowances is
accounted for, the government has confirmed through legislation that transitional assistance will
be phased out with announcements to be made by 2021.
Alignment with provincial and federal climate policy goals. Based on the goals of the 2016-
2020 climate change action plan, Ontario’s climate policy direction is consistent with the spirit
of decarbonizing the energy system and global trend to build a sustainable energy transition. By
the end of the first compliance period, Ontario’s cap and trade program is expected to meet
provincial greenhouse gas targets in support of national emission goals. With a forthcoming
national carbon pricing regime for Canada, there may be impacts on Ontario’s minimum prices,
if the national floor price were above $18 per tonne. Canada’s forthcoming federal carbon policy
is expected to send a strong signal for behavioural change from citizens, businesses and
provincial governments.
10.2 Economic Policy Considerations
With the implementation of the Ontario’s cap and trade program, there are implications on the
economy including the prospect for jobs, exports, investment opportunities and trade impacts
with Alberta.
Creation of clean jobs. To achieve emission reductions, this will need to be achieved by
deploying low-carbon technologies and electrifying the energy system. Although pre-mature, it
is expected that the climate policy will create new jobs in Ontario to build the low-carbon
economy. Along with implementing infrastructure changes to the transportation and buildings
sector to electrify the economy, the expectation for new jobs ought to come from the work
needed in exploring R&D projects aimed at commercializing clean technologies (McCarthy,
2016b). As aging baby boomers also retire in the next few decades, the ability to build the low-
carbon future creates an urgent need for skilled labour and expertise in the energy sector.
Development of a clean electricity exports market. Increased demand for electricity from the
electrification of the economy is expected to require significant transmission infrastructure
growth. This will depend on the approval of transmission infrastructure to transport power to the
south (Yakabusiki, 2016). It is also anticipated that Ontario will support the U.S. and Mexico in
reaching the 50% clean energy target by 2025 with Canadian electricity exports to meet the

63
Clean Power Plan goals (McCarthy, 2016b). For the next ten years, Ontario’s clean energy
exports to the U.S. could have implications on the role of natural gas, biomass and energy
storage or other means, as the Darlington and Bruce nuclear stations complete refurbishment in
2025 and 2031.
Support for investment opportunities. The requirement to participate in the cap and trade
program will increase the regulatory costs to investors that own carbon-intensive facilities in
Ontario. The Ontario government plans to increase the adoption of clean energy technologies
with incentives, tax credits for R&D, and favourable depreciation rates for low-carbon
technologies to promote Ontario’s investment climate (MOECC, 2016c). Climate change
presents a $5 trillion global business opportunity in clean energy investments funded by private
investors who need to understand the risks of climate change (Parkinson, 2016). From an
investor’s perspective, the cap and trade program should include transparent, consistent and
reliable reporting of GHG emissions to help businesses price the value of carbon in their
investments (Ibid).
The Ontario climate change action plan will create a Green Bank to provide low-interest
financing for projects and aggregate larger commercial and industrial projects to reduce risk
(Ibid). The Green Bank initiative was modelled from Vermont and New York to fund low-
carbon technology growth. As access to financing has been a challenge experienced by
homeowners and businesses to undertake deeper retrofits, the Green Bank is expected to serve
the needs of Ontario consumers and save costs by aggregating the financing services of
commercial banks. In Ontario, for example, heat pump technologies are prohibitively expensive
to include as measures in residential natural gas demand-side management programs. These
projects will not be economic for customers to pursue, even after the utility incentives are
provided.29
Now, with an independent entity that provides additional financing services to
customers to encourage the adoption of clean technologies, the Green Bank will be critical in
enabling the low-carbon transition.
29
See technical conference materials in 2015-2020 DSM Proceeding for Ontario’s DSM Plans.
64
Impacts on Trade. With a cap and trade program in 2017, petroleum products and electricity
imports entering the Ontario market will be required to comply with the program. The carbon
content of other traded goods and services are not subject to the regulation.
In terms of domestic trade impacts, it questions how the trade relationship between Ontario and
Alberta may be affected. Alberta will be phasing out coal by 2030 and is moving towards a
carbon tax by 2017. In Ontario, there are policies towards electrification, using renewable
content in natural gas, and implementing greener codes and standards in buildings. In May 2016,
Ontario and Alberta signed a Memorandum of Understanding to examine the opportunities to
reduce GHG emissions in the production, transportation and use of natural resources, to
accelerate renewable energy and storage development and to foster uses of carbon emissions
(MOECC, 2016). Innovation in trade of cleaner energy and technological development
continues to be expected from the strategic alliance.
In terms of international trade impacts, hypothetical situations are discussed below regarding the
potential impacts that Ontario’s climate legislation may have on trade. The free trade
agreements that Ontario are engaged in include the North American Free Trade Agreement
(NAFTA), the proposed Trans-Pacific Partnership (TPP) and Comprehensive Economic and
Trade Agreement (CETA).
Trade with U.S. and Mexico in NAFTA (in force). Since 1994, the NAFTA came into effect and
has doubled the GDP of North America to $20 trillion in 2014 (Global Affairs Canada, 2016).
The North American Agreement on Environmental Cooperation was created as a side treaty to
NAFTA to collectively conserve, protect and enhance the environment for the well-being of
present and future generations (North American Agreement on Environmental Cooperation,
n.d.).
It has been questioned whether lax environmental regulations in Mexico within the NAFTA
incentivized U.S. firms to relocate, which increased U.S. job losses, reduced competitiveness in
U.S. products, and increased border-area pollution (Tiemann, 2000). The impact of Ontario’s
cap and trade regulation on the reshuffling of products and relocations to other jurisdictions
within the NAFTA has not been examined extensively. Although the potential for carbon
leakage has been assessed to be insignificant, the interest in a federally-administered border

65
adjustment appears to be reasonable to mitigate the risk of reshuffling goods to jurisdictions
without a carbon price.
Trade with Asia-Pacific Countries in TPP (in consultation). If the TPP comes into effect, it
replaces NAFTA and forms the largest free trade zone in the world comprised of 12 countries30
making up 40% of the world’s GDP ($28.5 trillion) (Curry, 2016). In the TPP agreement, there
are environmental stipulations that demonstrate support for climate change mitigation. This
shows that cooperation in the transition to the low carbon economy was stipulated to prevent
investor-state disputes:
“The Parties recognise that each Party’s actions to transition to a low emissions
economy should reflect domestic circumstances and capabilities and, consistent
with Article 20.12 (Cooperation Frameworks), Parties shall cooperate to address
matters of joint or common interest.
Areas of cooperation may include, but are not limited to: energy efficiency;
development of cost-effective, low emissions technologies and alternative, clean
and renewable energy sources; sustainable transport and sustainable urban
infrastructure development; addressing deforestation and forest degradation;
emissions monitoring; market and non-market mechanisms; low emissions,
resilient development and sharing of information and experiences in addressing
this issue. Further, the Parties shall, as appropriate, engage in cooperative and
capacity-building activities related to transitioning to a low emissions economy.”
31
Trade with the European Union in CETA (not yet in force). The Canada and European Union
free trade agreement will provide Canada with access to the world’s largest market, totalling $20
trillion in GDP (Global Affairs Canada, 2016a). The CETA contains parallel provisions with
Canada’s North American Agreement on Environmental Cooperation that includes a
commitment that parties must enforce domestic environmental laws (Global Affairs Canada,
2016b).
30
The 12 countries in the TPP include Australia, Brunei, Canada, Chile, Japan, Malaysia, Mexico, New Zealand,
Peru, Singapore, U.S. and Vietnam. 31
See Article 20.15 of the Trans-Pacific Partnership Agreement (Global Affairs Canada, 2016).
66
Prospect for Border Carbon Adjustments. As discussed earlier, Ontario indicated an interest to
have a federally-administered border carbon adjustment (MOECC, 2016c). Border adjustments
can ensure that there is no cost advantage to produce goods in non-regulated jurisdiction.
The urgency with border carbon adjustments can also be seen by the fact that Ontario’s record of
GHG emissions with imported GHG emissions could go up by 50% (Dolter and Victor, 2016).
This measure may be useful for managing carbon leakage, as transitional assistance is planned to
be phased out.
Along with the political and legal challenges, there could be complications to trade agreements
regarding the goods and services entering Canadian borders, especially when other trade partners
do not use border adjustments. With border adjustments, the issue of re-shuffling may not be
resolved and there could be administrative costs associated with using and regulating the border
adjustment (Whitmore, 2012).
10.3 Environmental Policy Considerations
In terms of environmental policy considerations arising from Ontario’s cap and trade program,
the vision towards climate change mitigation broadly affects two areas: updates to
Environmental Assessments to account for climate change and sustainable use of agriculture,
forests and lands to store carbon.
Impact of Climate Change on Environmental Assessment. Environmental assessments (EA) are
a process to ensure that governments and public bodies consider the potential environmental
effects before an infrastructure project begins (MOECC, 2016d). For federally-administered
EAs, the inclusion of climate change impacts in the EA process is consistent with broader
climate change policy. As the Canadian Environmental Assessment Agency (CEAA) notes, EAs
should consider where a project can contribute to greenhouse gases and where climate change
may affect a project at all stages of the EA process (Appendix 11 of this report). To manage the
risks associated with climate change on projects, the CEEA argues for consistent consideration
of climate change in the EA process across federal and provincial jurisdictions (Canadian
Environmental Assessment Agency, 2016).
For provincially-administered EAs in Ontario, changes to the current EA process to consider
climate change mitigation and adaptation could be significant. However, the draft changes to

67
Ontario’s EAs to account for climate change impacts were not publicly available, so the changes
and scope of the impacts are not known. It is expected that the incorporation of climate change
mitigation in provincial-led environmental assessment will be similar to federal considerations.
Sustainable Resource Development of Agriculture, Forests and Lands. As noted in Ontario’s
action plan, maintaining productive and sustainable agriculture, nature and lands can set the
pathway for creating offsets for the Ontario cap and trade program. There are major plans to
strengthen these sectors, particularly to maximize carbon storage from agriculture, develop a
forest carbon policy framework, expand the Greenbelt to enable sequestration potential, and
protect grasslands to store carbon (MOECC, 2016d). These initiatives are not known at the
implementation stage. It reinforces the need to develop a strategy to monitor the development
and the use of carbon sinks to support the cap and trade program in Ontario.
10.4 Assessment
Ontario’s environmental policy shift towards decarbonizing the energy system supports Canada’s
commitment on climate change mitigation. This section explored the potential implications of
the Ontario climate policy for political, economic and environmental policy considerations.
In terms of political considerations, there will be major energy use changes from switching fossil
fuels to renewable energy and electricity. This policy shift affects how transportation will be
fuelled and how heat and power are sourced for heating and cooling needs in residential,
commercial and industrial buildings. The Ontario Building Code is planned to include long-term
GHG targets to align with provincial emission goals, and the renewable fuel content for
petroleum products and natural gas are expected to increase. In addition, there are planned
changes to municipal land-use planning and environmental assessment, consumer protection
measures for low-income consumers affected by carbon prices, and the need for community
empowerment. Besides the challenge that many of these policies are at a formative stage, the
changes are complex and require time to implement and enforce. The climate change challenge
on the political process strengthens the need for collaboration between all levels of government.
There is an ongoing need for alignment in provincial long-term goals and objectives with
forthcoming federal climate policy to ensure effective execution of climate policy.

68
In terms of economic policy considerations, there are major economic opportunities from
increasing the deployment of low-carbon technologies to accelerate the low-carbon transition.
Clean jobs and investment opportunities are expected to come with the implementation of the
climate change action plan. Low-interest financing opportunities will be accelerated with the
Green Bank, provided that its implementation is successful in accelerating low-carbon
technological growth. In the future, it could be useful to study how sustainable technologies
accelerated through Ontario’s climate policy, particularly from cap and trade, are contributing to
behavioural transitions in the economy that can guide the future of technological development.
In terms of environmental policy considerations, the inclusion of climate change in the EA
process has the potential to identify project risks earlier and lower future costs of compliance.
With considerable interest in leveraging the natural environment as carbon sinks, it supports
continued monitoring of the environment and how it will be used to displace emissions from
fossil fuels. To build greater resiliency and adaptive capacity to climate change, it would be
beneficial to review the implementation of the cap and trade program, progress on the climate
change action plan, long-term goals and alignment with forthcoming federal climate policy.
11. Risk Analysis
The Ontario market design has closely mirrored the market design of Quebec and California to
facilitate the transition process once Ontario links within the WCI. As allowances are traded in
the market, it is expected to facilitate price discovery of the marginal cost to abate. Liquidity in
the market is expected in the Ontario market as the price relies on the same carbon price in the
joint Quebec and California auctions. The market design features promote cost containment (e.g.
price floor, price ceiling and strategic reserve) but allow for flexibility within the rules that can
increase program costs.
As for the re-investment of cap and trade proceeds into activities that reduce greenhouse gases,
the measurability and sustainability of the emission reductions are largely expected to come from
the projects invested. There will be a significant cost to implement the climate change action
plan. The policy design assumes $1.8-1.9 billion in revenues to be collected each year, but
expected revenues may fall if fuel distributors purchase fewer emission allowances than
expected. Additionally, as 20% of the action plan activities do not yield greenhouse benefits

69
until after 2020, some action plan initiatives may impose higher costs for monitoring and
evaluation. Generally, emissions that cannot be measured easily are less feasible to administer
(Pew Centre on Global Climate Change, 2008).
Other issues associated with the policy implementation are the significant upgrades to the
transmission and distribution system to accommodate electrification of transportation (Pollitt,
2008). To enable integration of low-carbon technologies with the energy system, there may be
potential costs of recovery of long-term stranded assets that could be replaced with shorter-life
distributed generation technologies. This will be fuelled by the adoption of sustainable
technologies with incentives and low-interest financing that is expected to increase the
technology’s achievable potential in the marketplace. With the accelerated pace to the low-
carbon transition, there may be further consideration on future energy system planning to
optimize GHG emissions, which may be considered along with the current challenges of
reforming the distribution network to enable greater participation of distributed technologies on
the electricity network.
12. Conclusion and Recommendations
In summary, the findings from this evaluation indicate that complementary policies funded by
the cap and trade program will be an important aspect of enhancing emission reductions and
achieving low-cost compliance through the carbon market. The scope of Ontario’s climate
policy set out a preliminary action plan describing the potential impact of the $8.3 billion in cap
and trade proceeds in forthcoming initiatives and policies to reduce greenhouse gases
significantly. If the action plan is implemented successfully, it will create the conditions to help
Ontario achieve long term, sustainable emission reductions.
There are areas of the cap and trade regulation that are not finalized, including the criteria for
offsets and early reduction credits, administrative penalties, and complementary policies for
reserve fuels used on First Nations lands. Due to potential concern on the carbon neutrality of
biomass, expected progression of the price path, enforceability of the submission requirement
and required time to implement the action plan, it can be perceived to weaken the success of the
cap and trade program. Nevertheless, the design of the cap and trade program is accommodating
and flexible to industry participants, whose design adheres to WCI design principles. With

70
multi-year compliance periods to achieve emission reductions in a cost-effective manner, it
creates the opportunity to assess how program participants will best respond to carbon prices,
either through investments in long-term abatement technologies or purchases of allowances or
credits. Finally, it is difficult to assess the effectiveness of the carbon price in isolation of
complementary policies as the mechanisms should work hand-in-hand. This evaluation of the
cap and trade regulation has offered some insight on the program’s effectiveness using the six
criteria framework.
First, there is comprehensive coverage of emissions that supports low-cost compliance, fair
treatment of emissions in the cap and trade program, and sufficient annual declines to meet the
2020 targets. During the first compliance period, 82% of the province’s emissions will be
regulated under the cap that declines annually at an average rate of 4.1% to achieve a 15%
emissions reduction target by 2020. There is a level playing field established for domestic
electricity generation and imports, regulation of emissions from combined heat and power
facilities, as well as facilities generating thermal energy directly and indirectly.
Second, based on quantifiable costs and benefits, there could be greater gains from the allocation
of allowances accruing to the industry than to consumers in the first compliance period. This is
initially owing to the cost of free allowances and the allowances for the fuel distributors paid by
consumers. Over time, it is expected that the cap and trade proceeds will be re-invested in
activities that significantly reduce the energy costs for households and contribute to greater
societal benefits that persist after 2020. This is also supported by an estimate that 80% of the
benefits from cap and trade proceeds will accrue to consumers. However, many action plan
initiatives beyond building retrofit and electric vehicle implementation are formative at this time,
and may require more time to be implemented to realize the emissions reduction benefits.
Although it is not known with certainty when free allowances will cease, transitional assistance
is planned to be phased out.
Third, Ontario’s market design is consistent with Quebec and California to enhance linkage
opportunities in the future. The evaluation of the market design shows that Ontario’s program
meets the criteria of being efficient and transparent, but it requires further studies to determine
effectiveness of the carbon price in achieving significant emission reductions. In expectation of
a carbon price that reaches $100 per tonne in Ontario by 2030, the starting prices today may not

71
be a large enough opportunity cost to signal immediate behavioural change. This places
emphasis on the re-investment of cap and trade proceeds to finance complementary measures
that transform the market and reduce emissions across the economy. Over the course of the next
couple of decades from 2030 to 2050, the baselines for greenhouse gas reductions would have
risen with the deployment of low-carbon technologies in homes and businesses, market
transformation from renewable fuel content standards and electrification, and increasing cost-
effectiveness of new technologies that become deployed to lower the demand for natural gas and
emission allowances in Ontario. Given the potential negating impact that low-carbon and
renewable policies can have on carbon pricing, it is unclear whether the future carbon price
trajectory needs to remain between $100 and $300 per tonne in 2030 and 2050. It is also pre-
mature to comment on the enforceability of the submission requirement, pending finalization of
the administrative penalties. However, stipulating timelines for the 3 to 1 submission
requirement could enhance enforceability of the submission requirement. Ontario’s cap and
trade market is expected to use the CITSS to save infrastructure costs once linking occurs. Due
to the checks in the bid and auction processes that enforce the purchase and holding rules, higher
monitoring and oversight costs could be expected.
Fourth, in terms of accommodations, the cost of free allowances represents a total of $3.27
billion by the end the first compliance period. The basis for allocations will be supported by
verified emissions prepared in accordance with the requirements of the Reporting Regulation.
The accommodations to industry are generous, but should be reasonable in the context of
expected emissions growth in the coming years, and appropriate to provide for transitory
assistance to mitigate uneconomic investments to reduce process and combustion emissions.
The use of auction and transitional assistance also attains the highest net GHG reductions at the
lowest cost. The extent of transitional assistance provided is expected to help the industries that
need it the most.
In terms of flexibility arrangements, there will be exemptions primarily for large increases in
production for large emitters and a more moderate decline of free allowances for facilities using
biofuels. Transitory assistance appears to be provided to help large emitters prepare for
significant actions after 2020. With free allowances and flexibility arrangements that relaxes
certain program rules, it will be important to ensure accurate reporting of the emissions produced

72
and true-up of the allowances. For those receiving transitory assistance, this ensures that
program participants are accountable for the cost of producing emissions that are covered with
free allowances.
Fifth, in terms of the measurability of emissions, a robust measurement, reporting and
verification process is in place in Ontario to enable effective and consistent quantification and
reporting of emissions with Quebec and California. To ensure sustainable reductions in the long
run, it requires successful enforcement of action plan initiatives, monitoring of the initiatives
funded by cap and trade proceeds, and consideration of complementary metrics to evaluate
prospective climate change action plan initiatives.
Sixth, Ontario’s climate policy will integrate well with broader provincial and federal
government objectives. Some actions have immediate implication to make changes to current
legislation that will affect the built environment. The creation of the cap and trade program is
expected to integrate with economic policy, as climate policy is expected to build economic
prosperity from clean jobs, a clean exports market and investment opportunities. Due to the
expanded function of the environment in their potential capacity as offsets, it indicates a
significant need to protect and maintain the environment. The following recommendations are
provided to inform near-term development of the cap and trade program regulation.
Recommendations
1. Continue to monitor the performance of the market rules to create an efficient, transparent,
enforceable and effective market for many years to come.
2. Monitor the rates of emission decline by industry and GHG activity to identify where
emission reductions are occurring and the cost of reductions at the facility level.
3. Assess the performance of Ontario’s flexibility arrangements provided over time, along with
the potential impact of accommodations and flexibility arrangements on the pace of change
and stringency of the emissions cap.
4. Ensure that the action plan initiatives are implemented in a cost-effective and sustainable
manner. This should be considered with sustainability metrics to evaluate the potential and
impact of emission reductions in future policy actions.
73
5. Continue to engage in understanding the flow of carbon in the environment and ways to
achieve true carbon neutrality from the production and consumption of biomass.
6. Monitor the purpose of the offsets, how they will be used and maintained. There could be
standardization in the baseline of offsets to enhance comparability and the acceptability of
projects through harmonized offset protocols within the WCI, where feasible.
7. Review the implementation of the cap and trade program, progress of the action plan, long-
term goals of the program, and alignment with forthcoming federal climate policy.
74
Work Cited
Aldy, J. (2016). Frameworks for Evaluating Policy Approaches to Address the Competitiveness
Concerns of Mitigating Greenhouse Gas Emissions. Washington, D.C.: Resources for the
Future.
Aldy, J. and Pizer, W. (2009). The Competitiveness Impacts of Climate Change Mitigation
Policies. Virgina, U.S.: Pew Centre on Global Climate Change.
Aldy, J. and Stavins, R. (2012). The Promise and Problems of Pricing Carbon: Theory and
Experience. Journal of Environment & Development, 21(2) 152–180.
Air Resources Board. (2015). Cap-and-Trade Adaptive Management Discussion Guide. Draft
Process to Monitor Emissions from California Cap-and-Trade Facilities.
Baranzini, A., Goldemberg, J., and Speck, S. (2000). A future for carbon taxes, Ecological
Economics, 32(3), 395-412, ISSN 0921-8009, http://dx.doi.org/10.1016/S0921-
8009(99)00122-6. (http://www.sciencedirect.com/science/article/pii/S0921800999001226)
Beale, E., Beugin, D., Dahlby, B., Drummond, D., Olewiler, N., and Ragan, R. (2015).
Guidelines for Business and Policymakers: Provincial carbon pricing and competitiveness
pressures. Canada’s EcoFiscal Commission.
Bushnell, J. and Chen, Y. (2012). Allocation and leakage in regional cap-and-trade markets for
CO2. Resource and Energy Economics, 34(4), 647-668.
doi:10.1016/j.reseneeco.2012.05.008
Bushnell, J., Chen, Y. and Zaragoza-Watkins, M. (2014). Downstream regulation of CO2
emissions in California's electricity sector, Energy Policy, 64, 313-323, ISSN 0301-4215,
http://dx.doi.org/10.1016/j.enpol.2013.08.065.
(http://www.sciencedirect.com/science/article/pii/S0301421513008690)
California Air Resources Board. (2016, April 28). Discussion on Social and Environmental
Safeguard Requirements for Potential Linked Sector-Based Offset Programs.
Canada. (2011). National Round Table on the Environment and the Economy. Paying the Price:
The Economic Impacts of Climate Change for Canada,
https://www.fcm.ca/Documents/reports/PCP/paying_the_price_EN.pdf
Canada. (2013). National Round Table on the Environment and the Economy. Achieving 2050:
A Carbon Pricing Policy for Canada, http://neia.org/wp-content/uploads/2013/04/carbon-
pricing-advisory-note-eng.pdf

75
Canada's EcoFiscal Commission. (2016). Revenue Recycling: Six Position Papers on the
Options for Recycling Carbon Pricing Revenue. Canada's EcoFiscal Commission.
Canadian Environmental Assessment Agency. (2016). Incorporating Climate Change
Considerations in Environmental Assessment: General Guidance for Practitioners.
Retrieved from Canadian Environmental Assessment Agency:
http://www.ceaa.gc.ca/default.asp?lang=En&n=A41F45C5-1&offset=3&toc=show
Clean Economy Alliance. (2015, December 16). EBR Registry Number 012-5666, Cap-and-
Trade Program Design Options.
Coulson, T. and Roberton, S. (2016, April 2). Do we support Liberal carbon policy? Broadly,
but the devil’s in the details. Retrieved from Globe and Mail:
http://www.theglobeandmail.com/report-on-business/rob-commentary/do-we-support-
liberal-carbon-policy-broadly-but-the-devils-in-the-details/article29498758/
Counting the Change: Accounting for the Fiscal Impacts of Controlling Carbon Emissions:
Hearing before the Committee on the budget House of Representatives, One Hundred
Tenth Congress, first session, Hearing held first session in Washington, DC November 1,
2007
Crépeau, S. and Peter, J. The robustness of international benchmarks of competition intensity:
the case of mark-ups. Industry Canada. Working Paper Series, Working Paper 2008-10.
Curry, B. (2016, January 26). THE ABCS OF TPP. Retrieved from Globe and Mail:
http://www.theglobeandmail.com/report-on-business/international-business/what-is-tpp-
understanding-the-new-pacific-tradedeal/article26648948/
Cushman, J., Marland, G., and Schlamadinger, B. (n.d.). Biomass Fuels, Energy, Carbon, and
Global Climate Change. Retrieved from
http://web.ornl.gov/info/ornlreview/rev28_2/text/bio.htm
Dinan, T. and Spoor, C. (2001). The Implications of Design Decisions for the Performance of
Cap-and-Trade Programs: Chapter 2. Congressional Budget Office.
Dolter, B. and Victor, P. (2016) Casting a long shadow: Demand-based accounting of Canada's
greenhouse gas emissions responsibility, Ecological Economics, 127, 156-164, ISSN 0921-
8009, http://dx.doi.org/10.1016/j.ecolecon.2016.04.013.
76
(http://www.sciencedirect.com/science/article/pii/S0921800916304281)
Economic Impacts of the Kyoto Protocol: Conference before the Committee on Energy and
Natural Resources, United States Senate, One Hundred Sixth Congress, First Session, To
Receive Testimony on the Economic Impacts of the Kyoto Protocol to the Framework
Convention on Climate Change, March 25, 1999
EcoFys. (2015). State and Trends of Carbon Pricing. Washington, D.C.: World Bank Group.
Ellerman, A. and Buchner, B. (2006). Over-Allocation or Abatement? A Preliminary Analysis of
the EU Emissions Trading Scheme Based on the 2006 Emissions Data. Cambridge,
European Commission. (2016, July 22). Structural reform of the EU ETS. Massachusetts: MIT
Joint Program on the Science and Policy of Global Change. Retrieved from European
Commission Climate Action: http://ec.europa.eu/clima/policies/ets/reform/index_en.htm.
Environment Canada. (2014). Canada’s Emissions Trends 2014. Gatineau, Q.C.
Global Affairs Canada. (2016, April). Consolidated TPP Text, Chapter 20 – Environment.
Retrieved from Global Affairs Canada: http://www.international.gc.ca/trade-agreements-
accords-commerciaux/agr-acc/tpp-ptp/text-texte/20.aspx?lang=eng
Global Affairs Canada. (2016, July). NAFTA - Fast Facts. Retrieved from Global Affairs
Canada: http://www.international.gc.ca/trade-agreements-accords-commerciaux/agr-
acc/nafta-alena/facts.aspx?lang=eng
Global Affairs Canada. (2016a, July). Canada-European Union: Comprehensive Economic and
Trade Agreement (CETA). Retrieved from Global Affairs Canada:
http://www.international.gc.ca/trade-agreements-accords-commerciaux/agr-acc/ceta-
aecg/index.aspx?lang=eng
Global Affairs Canada. (2016b, July). Technical Summary of the Final Negotiated Outcomes
(October 2013). Retrieved from Canada-European Union: Comprehensive Economic and
Trade Agreement (CETA): http://international.gc.ca/trade-agreements-accords-
commerciaux/agr-acc/ceta-aecg/understanding-comprendre/technical-
technique.aspx?lang=eng

77
Haites, E. (2003). Output-based allocation as a form of protection for internationally competitive
industries. Climate Policy (Taylor & Francis Ltd), 3S29-S41.
doi:10.1016/j.clipol.2003.09.009
Hahn, R. and Stavins, R. The Effect of Allowance Allocations on Cap-and-Trade System
Performance. Journal of Law and Economics, Vol. 54, No. 4, Markets, Firms, and
Property Rights: A Celebration of the Research of Ronald Coase (November 2011), pp.
S267-S294
ICF International. (2016, February 25). Ontario Cap and Trade: Overview and Scope of the
Challenge. Retrieved from Aird & Berlis LLP, Energy Insider Newsletter:
http://energyinsider.ca/index.php/ontarios-cap-and-trade-some-early-impact-estimates/
IESO. (2016). Cap-and-Trade Overview: Discussion with IESO Contracted Natural Gas-Fired
Generators. Toronto: Independent Electricity System Operator.
Jaccard, M. (2006). Sustainable energy policy: How do we get there, Sustainable Fossil Fuels,
New York: Cambridge University Press, 259-314.
Jalalzadeh-Azar, A. Potential role of exergy in analysis of hydrogen infrastructure. Presented at
the 2008 NHA Annual Hydrogen Conference March 30 – April 3, 2008, Sacramento,
California. NREL/CP-560-43064
Klinsky, S. (2013). Bottom-up policy lessons emerging from the Western Climate Initiative's
development challenges. Climate Policy (Earthscan), 13(2), 143-169.
doi:10.1080/14693062.2012.712457
Laing, T., Sato, M., Grubb, M. and Comberti, C. (2013). Assessing the effectiveness of the EU
Emissions Trading System. Oxford, U.K.: Grantham Research Institute on Climate Change
and the Environment.
Lecourt, S., Palliere, C. and Sartor, O. (2013). EUI Working Papers. The impact of emissions-
performance benchmarking on free allocations in EU ETS Phase 3. Badia Fiesolana, Italy:
European University Institute.
Littell, D. and Farnsworth, D. (2016). Carbon Markets 101: “How-To” Considerations for
Regulatory Practitioners. Montpelier, VT: Regulatory Assistance Project.
Love, P. (2014). The Past, Present and Future of Energy Conservation in Ontario. Energy
Regulation Quarterly, pp. 11-16.

78
McCarthy Tétrault LLP. (2015). Navigating Carbon Pricing Mechanisms and Guide to Canadian
Federal and Provincial Regulatory Framework.
McCarthy, Shawn. (2016a). Carbon challenge: the economic cost. The Globe and Mail.
January 23, 2016.
McCarthy, Shawn. (2016b). Leaders agree to new energy plan at summitt. The Globe and Mail.
June 30, 2016.
Ministry of Finance. (2016). 2016 Ontario Budget. Retrieved from
http://www.fin.gov.on.ca/en/budget/ontariobudgets/2016/ch1a.html#t1-2
MOECC, 2009. 010-5484 Discussion Paper: A Greenhouse Gas Cap-and-Trade System For
Ontario.
MOECC, 2015a. Climate Change Discussion Paper 2015.
MOECC, 2015b. Presentation to Ontario Energy Association Conference, September 2015.
MOECC, 2015c. Design Options on Cap and Trade Program. November 2015.
MOECC, 2015d. 2014 Climate Change Update Report.
MOECC, 2015e. Ontario Climate Change Strategy.
MOECC, 2016a. March 2016 Update Presentation to Stakeholders: Bill 172 and Cap and Trade
Regulatory Proposal.
MOECC, 2016b. Notice to O. Reg. 144/16.
MOECC, 2016c. Ontario’s Five Year Climate Change Action Plan 2016-2020.
Monjon, S. and Quirion, P. (2011). Addressing leakage in the EU ETS: Border adjustment or
output-based allocation?, Ecological Economics, 70(11), 1957-1971, ISSN 0921-8009,
http://dx.doi.org/10.1016/j.ecolecon.2011.04.020.
(http://www.sciencedirect.com/science/article/pii/S0921800911001893)
Morrison, R. (2005). Energy Policy and Sustainable Development, in Doern, B. Canadian
Energy Policy and the Struggle for Sustainable Development. Toronto: University of
Toronto Press, 96-117.

79
Muller, R. and Mestelman, S. (1998). What have we learned from emissions trading
experiments? Managerial and Decision Economics, 19(4-5), 225-238.
doi:10.1002/(SICI)1099-1468(199806/08)19:4/5<225::AID-MDE888>3.0.CO;2-V
Murray, B. and Rivers, N. (2015). British Columbia’s Revenue-Neutral Carbon Tax: A Review of
the Latest “Grand Experiment” in Environmental Policy". Working Paper NI WP 15-04.
Ottawa, Canada: Duke Nicholas Institute.
Murray, B., Newell, R. and Pizer, W. (2009). Balancing Cost and Emissions Certainty: An
Allowance Reserve for Cap-and-Trade. Review of Environmental Economics and Policy,
3(1), 84–103. doi:10.1093/reep/ren016
Newell, R., Pizer, W. A. and Raimi, D. (2013). Carbon Markets 15 Years after Kyoto: Lessons
Learned, New Challenges. Journal Of Economic Perspectives, 27(1), 123-146.
doi:10.1257/jep.27.1.123
Newell, R., Pizer, W. and Zhang, J. (2005). Managing Permit Markets to Stabilize Prices.
Environmental & Resource Economics, 31: 133–157. DOI 10.1007/s10640-005-1761-y
NORTH AMERICAN AGREEMENT ON ENVIRONMENTAL COOPERATION. (n.d.). Retrieved
from Commission for Environmental Cooperation: http://www.cec.org/about-us/NAAEC
Neuhoff, K., Schopp, A., Boyd, R., Stelmakh, K., and Vasa, A. (2012). Banking of surplus
emissions allowances – does the volume matter? Berlin, Germany: German Institute for
Economic Research.
Office of the Premier. (2015, April). News Release: Cap and Trade System to Limit Greenhouse
Gas Pollution in Ontario. Toronto. Retrieved from
https://news.ontario.ca/opo/en/2015/04/cap-and-trade-system-to-limit-greenhouse-gas-
pollution-in-ontario.html
Ontario Ministry of Energy. (2016, February). Proposed Default Emissions Factors for Ontario's
Cap & Trade Program. Retrieved from MOE, Climate Change:
http://www.energy.gov.on.ca/en/ontarios-electricity-system/climate-change/proposed-
default-emission-factors-for-ontarios-cap-trade-program/
Peeters, M., Stallworthy, M., and Larragán, J. (2012). Climate Law in EU Member States:
Towards National Legislation for Climate Protection. Madrid, Spain: Edward Elgar
Publishing.

80
Pew Centre on Global Climate Change. (2007). Greenhouse Gas Emissions Allowances
Allocations. Virginia, U.S.: Congressional Policy Brief.
Pew Centre on Global Climate Change. (2008). Scope of a Greenhouse Gas Cap-and-Trade
Program. Virigina, U.S.: Pew Centre on Global Climate Change.
Pew Centre on Global Climate Change. (2011). Climate Change 101: Understanding and
Responding to Global Climate Change. Virgina, U.S.: Pew Centre on Global Climate
Change.
Purdon, M., Houle, D. and Lachapelle, E. (2014). The Political Economy of California and
Quebec's Cap-and-Trade Systems. Ottawa: University of Ottawa.
Pollitt, M. G. (2008). The Future of Electricity (and Gas) Regulation in a Low-carbon Policy
World. Energy Journal, 63-94.
Radu, A. (2014). Alberta's CO2 Reduction Strategy. Calgary, Alberta: Canadian Institute of
Resources Law.
Rose, A., Wei, D. and Prager, F. (2012). Distributional impacts of greenhouse gas emissions
trading: alternative allocation and recycling strategies in California. Contemporary
Economic Policy, 30(4), 603-617. doi:10.1111/j.1465-7287.2011.00296.x
Rose, A. and Wei, D. (2008). Greenhouse gas emissions trading among Pacific Rim countries:
An analysis of policies to bring developing countries to the bargaining table, Energy
Policy, 36(4) 1420-1429, ISSN 0301-4215, http://dx.doi.org/10.1016/j.enpol.2007.12.008.
(http://www.sciencedirect.com/science/article/pii/S0301421507005381)
Rosen, M., Dincer, I. and Kanoglu, M. (2008). Role of exergy in increasing efficiency and
sustainability and reducing environmental impact, Energy Policy, 36(1), 128-137, ISSN
0301-4215, http://dx.doi.org/10.1016/j.enpol.2007.09.006.
(http://www.sciencedirect.com/science/article/pii/S0301421507003886)
Sawyer, D. (2015, April 13). The Cost and GHG Implications of WCI Cap and Trade in Ontario.
(http://www.enviroeconomics.org/#!The-Cost-and-GHG-Implications-of-WCI-Cap-and-
Trade-in-Ontario/c1uze/552bd8930cf21933cd596d58)
Sawyer, D., Peters, J. and Stiebert, S. (2016, May 17). Impact Modelling and Analysis of Ontario
Cap and Trade Program. Retrieved from Ontario MOECC.

81
Scott, M., Edmonds, J., Mahasenan, N., Roop, J., Brunello, A. and Haites, E. (2004).
International emission trading and the cost of greenhouse gas emissions mitigation and
sequestration. Climatic Change, 64(3), 257-287.
doi:10.1023/B:CLIM.0000025747.12101.37
Stavins, R. (2008). Addressing climate change with a comprehensive US cap-and-trade
system. Oxford Review of Economic Policy, 24(2), 298-321. doi:10.1093/oxrep/grn017
Stokes, L. (2013). The politics of renewable energy policies: The case of feed-in tariffs in
Ontario, Canada. Energy Policy 56, 490-500.
Tatsutani, M. and Pizer, W. (2008). Managing Costs in a U.S. Greenhouse Gas Trading
Program. Washington, D.C.: Resources for the Future.
Tiemann, M. (2000, March 1). NAFTA: Related Environmental Issues and Initiatives. Retrieved
from U.S. Department of State: http://fpc.state.gov/6143.htm
The Conference Board of Canada. (2016). Investing in GHG Emissions-Reduction Technology.
Assessing the Economic Impact. The Conference Board of Canada: The Conference Board
of Canada.
Stavins, R. (n.d.). Is the Kerry -Lieberman Allowance Allocation a Corporate Giveaway?
Retrieved from http://www.robertstavinsblog.org/tag/output-based-updating-allocation/
Town of Richmond Hill. (2015). Town comments regarding the Province of Ontario's Cap and
Trade. Richmond Hill, Ontario: Town of Richmond Hill. Retrieved from
https://richmondhill.ca/documents/meetings/cow/2_16_2016_16_30/Item%2002%20-
%20SREIS.16.006%20-
%20Town%20Comments%20regarding%20the%20Province%20of%20Ontario's%20Ca
p%20and%20Trade%20Program%20Design%20Options%20Paper%20November%2020
15.pdf
Western Climate Initiative. (2010). Guidance for Developing WCI Partner Jurisdiction
Allowance Budgets. Western Climate Initiative.
Wilson, J. and Grochalova, B. (2016). CELA Submission on Cap and Trade Regulation (EBR
012-6837). Toronto: Canadian Environmental Law Association.

82
Winfield, M. (2016, June 20). ONTARIO’S CLIMATE CHANGE ACTION PLAN: A
PRELIMINARY ASSESSMENT. Retrieved from Mark Winfield York U Blog:
http://marksw.blog.yorku.ca/2016/06/10/ontarios-climate-change-action-plan-a-
preliminary-assessment-june-20-2016/
Whitmore, A. (2013, July). 7. Border Carbon Adjustments. Retrieved from On Climate Change
Policy: Commentary on all aspects of climate change policy:
https://onclimatechangepolicydotorg.wordpress.com/carbon-pricing/7-border-carbon-
adjustments/
Whitmore, A. (2016, March). OPINION: More trading does not always mean a better market.
Retrieved from California Carbon: http://californiacarbon.info/2016/03/07/opinion-
trading-always-mean-better-market/
Regulations Cited
Climate Change Mitigation and Low-carbon Economy Act, 2016
California AB 32 Regulation
Electricity Act, 1998
Green Energy Green Economy Act, 2009
Ontario Cap and Trade Program Regulation, O. Reg. 144/16
Ontario Reporting Regulation, O. Reg. 143/16
Quebec Cap and Trade Regulation

83
Appendix 1: Emissions in Ontario by Sector and Source (2013 Actuals)
Source: Re-organization of Table A10–13 of the National Inventory Report for Ontario’s 2013 GHG emissions in the Part 3 submission to United Nations Framework Convention on Climate Change (UNFCCC) by sector. Notes: CO2 accounted for 84% of 2013 emissions. CH4 accounted for 10% of 2013 emissions (GWP of 21). N2O accounted for 5% of 2013 emissions (GWP of 310). HFC accounted for 1% of 2013 emissions. SF6 emissions from electrical equipment are accounted for in “Production and Consumption of Halocarbons” and represented 1% of 2013 emissions (GWP of 23,900).
2013 GHG Emissions (MT of CO2e) in
OntarioCO2 CH4 N20 HFC SF6 PFC NF3 Total
% of Total:
By Sector
Transport 59 0.2 2 - - - - 61 36%
Road Transportation 45 0.1 1 46
Other Transportation 9 0.1 1 10
Railways 2 0.002 0.1 2
Domestic Aviation 2 0.002 0.02 2
Domestic Navigation 1 0.003 0.03 1
Industry 43 1 0.2 2.3 0.3 - - 47 27%
Petroleum Refining Industries 6 0.0011 0.009 6
Mining and Upstream Oil and Gas
Production0.6 0.0003 0.008 1
Manufacturing industries 16 0.02 0.1 16
Construction 0.4 0.0002 0.004 0.4
Agriculture and Forestry 2 0.001 0.01 1.6
Fugitive Sources (e.g. coal mining and
natural gas and oil) 0.3 1 0.01 1
Mineral Products (e.g. cement, lime and
mineral products use) 4 4
Metal Production 8 0.2 8
Production and Consumption of Halocarbons 2 0.1 2
Non-Energy Products from Fuels and Solvent
Use 7 7
Other Product Manufacture and Use 0.01 0.1 0.1
Buildings 31 1 0.4 - - - - 32 19%
Residential 19 1 0.3 20
Commercial and Institutional 12 0.01 0.1 12
Electricity 11 0.1 0.1 - - - - 11 6%
Agriculture 0.2 5 6 - - - - 10 6%
Waste 0.2 9 0.3 - - - - 9 5%
Total Emissions by Source (MT of CO2e) 144 17 8 2 0.3 - - 171
% of Total: By Emission Source 84% 10% 5% 1% 0.1% 100%

84
Appendix 2: Product-Output Benchmark and Historical Absolute Allocations
Source: Methodology for Free Allowances Distribution (Ontario’s Cap and Trade Program)
Source: Reporting Guidelines Notes: Example showing emission factors used for limestone and dolomite in the
product-output method above (Items 1 and 2 of Table 1b)
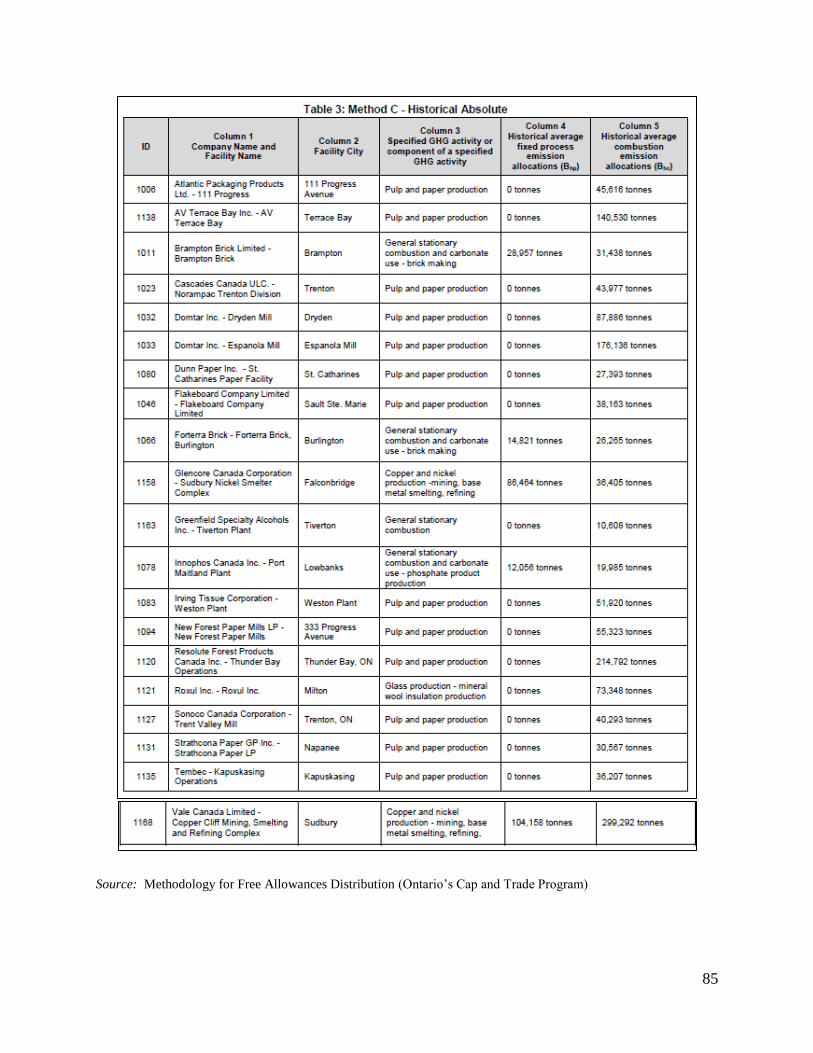
85
Source: Methodology for Free Allowances Distribution (Ontario’s Cap and Trade Program)

86
Appendix 3: Potential Distribution of Free Allowances by Allocation Method (a simplified
approach using 2013 emissions)
Source: 2013 greenhouse gas emissions reporting by facility. Note: This chart shows estimated allocation
proportions by method that assumes for simplicity one allowance per emission produced undifferentiated by
emission type, and may have discrepancies with the final allocations in the Methodology for Free Allowances
Distribution released on May 16, 2016.
Allocation Methodology for
Free Allowances
2013 GHG
(MT) 2013 GHG (tonnes)
Percentage
Allocation of
Total
Product Output Benchmark 17 15,058,265 58% 58%=100
Iron & Steel Mfg. 10 10,428,497 36% 62%
Cement Mfg. 4 4,396,389 15% 26%
Petroleum Refineries 1.4 1,350,373 5% 8%
Hydrogen 1 508,641 2% 3%
Beer Mfg. 0.1 92,932 0% 1%
Energy Use Allocations 3 7,412,303 9% 9%=100
Chemical Fertilizer (except Potash) Mfg. 1 798,641 3% 31%
Automobile & Light-Duty Motor Vehicle Mfg. 1 535,038 2% 21%
Food Mfg. 1 511,869 2% 20%
Other Basic Organic Chemical Mfg. 0.5 478,053 2% 19%
Particle Board & Fibreboard Mills 0.1 89,460 0% 3%
Chemical 0.1 68,878 0% 3%
Pharmaceutical & Medicine Mfg. 0.05 46,456 0% 2%
Gold & Silver Ore Mining 0.03 32,661 0% 1%
Historical Allocations 9 7,074,244 31% 31%=100
Pulp and paper 2 1,572,907 5% 18%
Chemical Pulp Mills 4 3,534,787 12% 40%
Petrochemical Mfg. 2 1,624,010 6% 18%
Non-Ferrous (except Al) Smelting & Refining 0.5 491,717 2% 6%
All Other Basic Inorganic Chemical Mfg. 0.4 430,655 1% 5%
Other Petroleum & Coal Products Mfg. 0.4 373,605 1% 4%
Artificial & Synthetic Fibres & Filaments Mfg 0.3 319,449 1% 4%
Steam & Air-Conditioning Supply 0.2 196,878 1% 2%
All Other Non-Metallic Mineral Product Mfg. 0.1 131,343 0% 1%
Resin & Synthetic Rubber Mfg. 0.1 92,779 0% 1%
Glass Mfg. 0.1 65,487 0% 1%
Clay Building Material & Refractory Mfg. 0.1 56,104 0% 1%
Direct Allocations 0.6 224,199 2% 2%=100
Universities 0.3 345,316 1% 5%
Energy from Waste 0.2 150,607 1% 67%
Waste Treatment & Disposal 0.1 73,592 0% 33%
Indirect Useful Thermal Energy (Imported) n/a n/a n/a Method E n/a
Grand Total 29 29,769,011 100%
Potential Allocation by NAICs
Method A
Method D
Method C
Method B

87
Appendix 4: Regression Methodology to Estimate Competitiveness Effects on EITE
Industries in Ontario
Methodology
The regression methodology used in testing the Ontario’s competitiveness effects follows the
economic theory used in Aldy and Pizer of Resources of the Future in 2009 to assess the
competitiveness impacts of climate change mitigation policies in the U.S.
For Ontario, it is analyzed for six EITE industries using data from 2005-2015 that could be
compared with the results of the U.S. study. Production is measured by total exports leaving
Ontario and domestic consumption is measured by the gross domestic product. The percent
difference between production and consumption is the net production effect outside of the
province that could assess the degree of leakage, or a lost competitiveness, due to the
internalization of the price of carbon. In the U.S. study, the impacts of competitiveness of the
manufacturing firms were estimated with a $15/tonne carbon price. The carbon price of
$18/tonne for Ontario is modelled through a 10% increase in wholesale electricity price to be
used as a proxy for industrial electricity prices and were regressed on exports (for production)
and GDP (for consumption) while controlling for other economic factors.
Variables
In the production and consumption models, a consistent set of variables were used in most cases
in formulating a demand model for various EITE sectors. The impacts of exports and
consumption as dependent variables were modelled separately as a function of increased
industrial electricity prices and other economic factors.
Within each sector that was assessed, the explanatory variables included manufacturing level
multifactor productivity levels, industry specific GDP or the value of manufacturing in the
industry as a proxy for demand and production. The expected sign on these variables were to be
positive. In the production model, the impact of positive demand estimated through GDP (as an
explanatory variable) could result in higher exports (dependent variable). In the consumption
model, the impact of positive demand modelled through multifactor productivity levels (as an
explanatory variable) could result in higher domestic consumption of goods.

88
In some cases, the US-CAD exchange rate was included as an explanatory variable for certain
industries that were particularly trade exposed. A negative relationship is expected as a lower
Canadian dollar can increase exports and trade competitiveness.
The electricity price was increased by 10% as a proxy to capture the increasing costs of inputs
with carbon pricing. A negative relationship is expected as higher electricity prices can result in
reduced competitiveness of exports and domestic consumption.
The percentages below show the elasticities from the regressions, as the dependent variable and
electricity prices were in logs. Through this modelling exercise using Ontario data, it confirms
industry findings that the leakage risk is small to date with relatively low carbon prices.
Estimated Competitiveness Effects for Ontario, Net Production as Proxy for Production
Leakage.
Source: author calculations using data noted in Table 4 of this report

89
Appendix 5: Market Power of Canadian Industries (2010)
Source: The robustness of international benchmarks of competition intensity: the case of mark-ups, Working Paper 2008-10 (Crépeau and Peter, 2008)

90
Appendix 6: Climate Change Action Plan Initiatives
Source: Ontario’s Climate Change Action Plan, 2016
No. Action Cost of GGRA Funding% of total proceeds
(max. estimate)
Estimated GHG
Reduction in 2020
Cost of reduction
($/tonne)
Action area 1 Increase availability and use of lower-carbon fuel $115-175 million 2% 2 million tonnes $20/tonne
Action area 2 Increase the use of electric vehicles $247-277 million 3% 50,000 tonnes $75/tonne
Action area 3 Support cycling and walking $150-225 million 3%Reductions occur post-
2020$500/tonne
Action area 4 Increase use of low-carbon trucks and buses $215-290 million 3% 400,000 tonnes $100/tonne
Action area 5Support accelerated construction of GO Regional
Express Rail$355-675 million 8%
Reductions occur post-
2020$525/tonne
Action area 6Improve energy efficiency in multi-tenant residential
buildings$680-900 million 11% 99,000 tonnes $425/tonne
Action area 7 Improve energy efficiency in schools and hospitals $400-800 million 10% 113,000 tonnes $270/tonne
Action area 8 Reduce emissions from heritage buildings $40-80 million 1%Reductions occur post-
2020n/a
Action area 9 Help homeowners reduce carbon footprint $681-824 million 10% 180,000 tonnes $225/tonne
Action area 10 Set lower-carbon standards for new buildings n/a n/a n/a n/a
Action area 11 Promote low-carbon energy supply and products $60-100 million 1% 1 million tonnes $5/tonne
Action area 12 Help consumers manage energy use and save money $200-250 million 3%Reductions to occur in
building sectorn/a
Action area 13 Training, workforce and technical capacity $45-70 million 1%Reductions to occur in
building sectorn/a
Action area 14Strengthen climate change policies in the municipal
land-use planning processn/a n/a n/a n/a
Action area 15 Support municipal and stakeholder climate action $270-325 million 4% 100,000 tonnes $165/tonne
Action area 16Reduce congestion and improve economic
productivity$10-20 million 0% n/a n/a
Action area 17 Help industries adopt low-carbon technologies $875-1,100 million 13% 2.5 million tonnes $30/tonne
Action area 18 Help agri-food sector adopt low-carbon technologies $50-115 million 1% 150,000 tonnes $60/tonne
Action area 19 Collaboration activities $85-96 million 1% n/a n/a
Action area 20Support innovation and commercialization of new
low-carbon technologies$140-235 million 3%
Reductions occur post-
2020$75/tonne
Action area 21 Set tax and regulatory policy to encourage innovation Up to $1 milllion 0%Reductions to occur in
all sectorsn/a
Action area 22Support research and development through Global
Centre for Low-Carbon Mobility$100-140 million 2%
Reductions to occur in
transportationn/a
Action area 23 Reduce emissions and energy costs $165-175 million 2% 200,000 tonnes $70/tonne
Action area 24 Reduce emissions from waste $20-30 million 0% 40,000 tonnes $50/tonne
Action area 25Increasing understanding of how agricultural and
natural lands emit and store carbon$2-3 million 0%
Supports
sequestrationn/a
Action area 26 Maximize carbon storage from agriculture $30 million 0%Supports
sequestrationn/a
Action area 27Understand and enhance carbon storage in natural
systems$0.5-1.5 million 0%
Supports
sequestrationn/a
Action area 28Update Environmental Assessments to account for
climate changen/a n/a
Supports reductions in
sectors where EA
applies
n/a
$5.96-8.30 billion 9,832,000 tonnes
Government
Agriculture, Forests and Lands
Total investments
Transportation Sector
Buildings and Homes
Land Use Planning
Industry and Business
Collaboration with Indigenous Communities
Research and Development

91
Appendix 7: Auction Results for Joint Cap and Trade Program in Quebec and California
(2012 to Present)
Sources: Results aggregated from California Air Resources Board, 2016; Quebec Ministry of Sustainable
Development, Environment and the Fight against Climate Change
Fiscal Year Auction ResultsQuebec
(CDN$)
California
(US$)
Current Vintage
Settlement Price (average) $12.48
Total Purchases 64,438,402
Future Vintage
Settlement Price (average) $10.63
Total Purchases 27,091,000
Total Allowances Purchased 91,529,402
Total Proceeds (weighted by auction period) $1,072,036,704
Holding Limit /participant5,945,000 (4% of total
allowances)
Current Vintage
Settlement Price (average) $11.23 $11.49
Total Purchases 3,803,111 75,573,344
Future Vintage
Settlement Price (average) $11.23 $11.29
Total Purchases 5,750,000 29,326,000
Total Allowances Purchased 9,553,111 104,899,344
Total Proceeds (weighted by auction period) $107,060,814 $1,199,003,232
Holding Limit /participant2,455,000 (11% of
total allowances)
5,867,500 (4% of total
allowances)
Current Vintage - Joint Auction
Settlement Price (average) $15.06 $12.28
Total Purchases 36,510,731 247,042,502
Future Vintage - Joint Auction
Settlement Price (average) $14.83 $12.09
Total Purchases 5,861,463 41,462,000
Total Allowances Purchased 42,372,194 288,504,502
Total Proceeds (weighted by auction period) $650,259,016 $3,543,956,393
Holding Limit /participant
Current Vintage - Joint Auction
Settlement Price (average) $17.32 $12.73
Total Purchases 22,321,365 143,139,008
Future Vintage - Joint Auction
Settlement Price (average) $16.89 $12.69
Total Purchases 2,794,037 19,792,500
Total Allowances Purchased 25,115,402 162,931,508
Total Proceeds (weighted by auction period) $434,156,630 $2,073,283,577
Holding Limit /participant
Total Proceeds - To Date $ 1,191,476,460 $ 7,888,279,905
Nov. 2015 - Aug. 2016
(results up to Feb. 2016)
n/aNov. 2012- Aug. 2013
Nov. 2013 - Aug. 2014
Nov. 2014 - Aug. 2015
13,370,000 (3% of total allowances)
13,014,750 (3% of total allowances)

92
Appendix 8: Pooling of Allowances and Banking Provision, Linking with Ontario
Sources: Quebec and California Cap Regulations for the determination of caps and holding limit formula * potential timeframe for Ontario to link with Quebec and California
Year QuebecQC Market
Share California
CA Market
ShareOntario
ON Market
Share
Allowance
Budget from
Linking
Holding
(banking)
limit
% of banked
allowances
of total
2014 23,200,000 159,700,000 n/a 182,900,000 6,447,500 4%
2015 65,300,000 394,500,000 n/a 459,800,000 13,370,000 3%
2016 63,190,000 382,400,000 n/a 445,590,000 13,014,750 3%
2017 61,080,000 370,400,000 142,332,000 431,480,000 12,662,000 3%
2018* 58,960,000 358,300,000 136,440,000 553,700,000 15,717,500 4%
2019* 56,850,000 346,300,000 130,556,000 533,706,000 15,217,650 4%
2020* 54,740,000 334,200,000 124,668,000 513,608,000 14,715,200 4%
2018-2020 170,550,000 11% 1,038,800,000 65% 391,664,000 24% 1,601,014,000
11% 65% 24%
14% 86% n/a

93
Appendix 9: Ontario’s EITE Sector Risk Ranking
Source: (Sawyer et al., 2016) Note: The risk ratings were developed by the MOECC with support from EnviroEconomics

94
Appendix 10: California’s Industry Assistance Factors from 2013-2020
Source: California cap and trade regulation, sub-article 8

95
Appendix 11: General Guidance for Practitioners on Climate Change Considerations in
Environmental Assessments
Source: (Canadian Environmental Assessment Agency, 2016)