Evaluation of next generation sequencing platforms for ...biology.hunter.cuny.edu/molecularbio/Class...
13
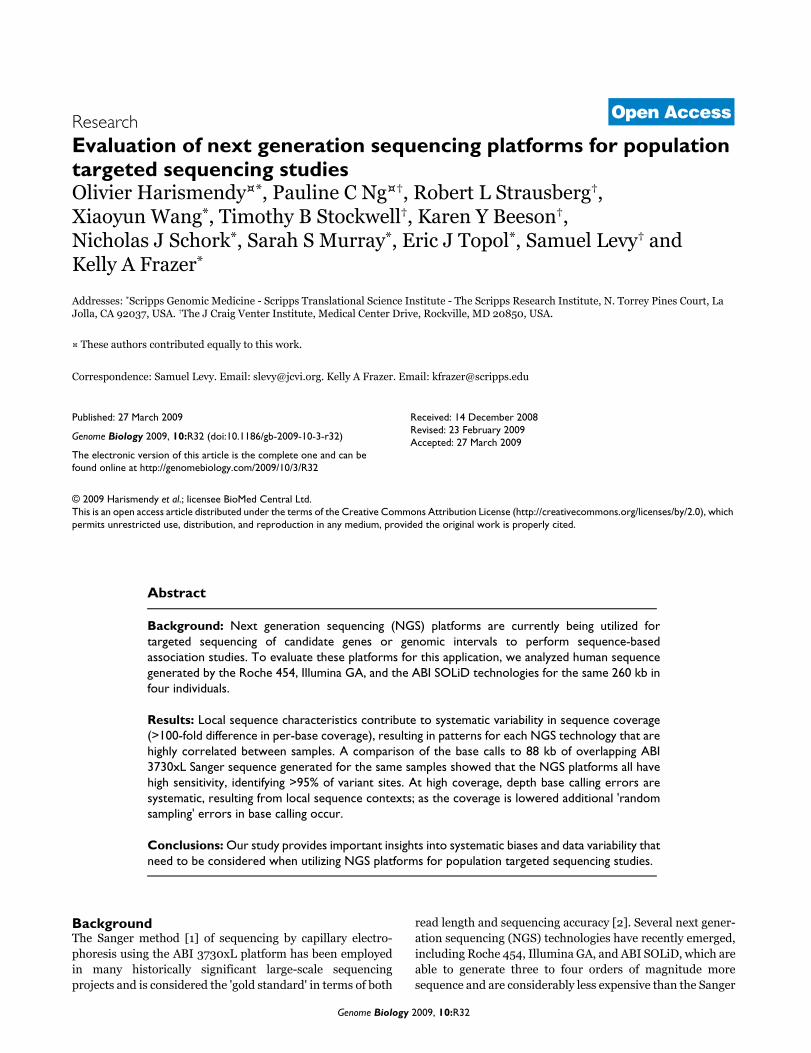
Genome Biology 2009, 10:R32 Open Access 2009 Harismendy et al. Volume 10, Issue 3, Article R32 Research Evaluation of next generation sequencing platforms for population targeted sequencing studies Olivier Harismendy ¤* , Pauline C Ng ¤† , Robert L Strausberg † , Xiaoyun Wang * , Timothy B Stockwell † , Karen Y Beeson † , Nicholas J Schork * , Sarah S Murray * , Eric J Topol * , Samuel Levy † and Kelly A Frazer * Addresses: * Scripps Genomic Medicine - Scripps Translational Science Institute - The Scripps Research Institute, N. Torrey Pines Court, La Jolla, CA 92037, USA. † The J Craig Venter Institute, Medical Center Drive, Rockville, MD 20850, USA. ¤ These authors contributed equally to this work. Correspondence: Samuel Levy. Email: [email protected]. Kelly A Frazer. Email: [email protected] © 2009 Harismendy et al.; licensee BioMed Central Ltd. This is an open access article distributed under the terms of the Creative Commons Attribution License (http://creativecommons.org/licenses/by/2.0), which permits unrestricted use, distribution, and reproduction in any medium, provided the original work is properly cited. Next generation sequencing and association studies <p>Human sequence generated from three next-generation sequencing platforms reveals systematic variability in sequence coverage due to local sequence characteristics.</p> Abstract Background: Next generation sequencing (NGS) platforms are currently being utilized for targeted sequencing of candidate genes or genomic intervals to perform sequence-based association studies. To evaluate these platforms for this application, we analyzed human sequence generated by the Roche 454, Illumina GA, and the ABI SOLiD technologies for the same 260 kb in four individuals. Results: Local sequence characteristics contribute to systematic variability in sequence coverage (>100-fold difference in per-base coverage), resulting in patterns for each NGS technology that are highly correlated between samples. A comparison of the base calls to 88 kb of overlapping ABI 3730xL Sanger sequence generated for the same samples showed that the NGS platforms all have high sensitivity, identifying >95% of variant sites. At high coverage, depth base calling errors are systematic, resulting from local sequence contexts; as the coverage is lowered additional 'random sampling' errors in base calling occur. Conclusions: Our study provides important insights into systematic biases and data variability that need to be considered when utilizing NGS platforms for population targeted sequencing studies. Background The Sanger method [1] of sequencing by capillary electro- phoresis using the ABI 3730xL platform has been employed in many historically significant large-scale sequencing projects and is considered the 'gold standard' in terms of both read length and sequencing accuracy [2]. Several next gener- ation sequencing (NGS) technologies have recently emerged, including Roche 454, Illumina GA, and ABI SOLiD, which are able to generate three to four orders of magnitude more sequence and are considerably less expensive than the Sanger Published: 27 March 2009 Genome Biology 2009, 10:R32 (doi:10.1186/gb-2009-10-3-r32) Received: 14 December 2008 Revised: 23 February 2009 Accepted: 27 March 2009 The electronic version of this article is the complete one and can be found online at http://genomebiology.com/2009/10/3/R32
Transcript of Evaluation of next generation sequencing platforms for ...biology.hunter.cuny.edu/molecularbio/Class...
Open Access2009Harismendyet al.Volume 10, Issue 3, Article R32ResearchEvaluation of next generation sequencing platforms for population targeted sequencing studiesOlivier Harismendy¤*, Pauline C Ng¤†, Robert L Strausberg†, Xiaoyun Wang*, Timothy B Stockwell†, Karen Y Beeson†, Nicholas J Schork*, Sarah S Murray*, Eric J Topol*, Samuel Levy† and Kelly A Frazer*
Addresses: *Scripps Genomic Medicine - Scripps Translational Science Institute - The Scripps Research Institute, N. Torrey Pines Court, La Jolla, CA 92037, USA. †The J Craig Venter Institute, Medical Center Drive, Rockville, MD 20850, USA.
¤ These authors contributed equally to this work.
Correspondence: Samuel Levy. Email: [email protected]. Kelly A Frazer. Email: [email protected]
© 2009 Harismendy et al.; licensee BioMed Central Ltd. This is an open access article distributed under the terms of the Creative Commons Attribution License (http://creativecommons.org/licenses/by/2.0), which permits unrestricted use, distribution, and reproduction in any medium, provided the original work is properly cited.Next generation sequencing and association studies<p>Human sequence generated from three next-generation sequencing platforms reveals systematic variability in sequence coverage due to local sequence characteristics.</p>
Abstract
Background: Next generation sequencing (NGS) platforms are currently being utilized fortargeted sequencing of candidate genes or genomic intervals to perform sequence-basedassociation studies. To evaluate these platforms for this application, we analyzed human sequencegenerated by the Roche 454, Illumina GA, and the ABI SOLiD technologies for the same 260 kb infour individuals.
Results: Local sequence characteristics contribute to systematic variability in sequence coverage(>100-fold difference in per-base coverage), resulting in patterns for each NGS technology that arehighly correlated between samples. A comparison of the base calls to 88 kb of overlapping ABI3730xL Sanger sequence generated for the same samples showed that the NGS platforms all havehigh sensitivity, identifying >95% of variant sites. At high coverage, depth base calling errors aresystematic, resulting from local sequence contexts; as the coverage is lowered additional 'randomsampling' errors in base calling occur.
Conclusions: Our study provides important insights into systematic biases and data variability thatneed to be considered when utilizing NGS platforms for population targeted sequencing studies.
BackgroundThe Sanger method [1] of sequencing by capillary electro-phoresis using the ABI 3730xL platform has been employedin many historically significant large-scale sequencingprojects and is considered the 'gold standard' in terms of both
read length and sequencing accuracy [2]. Several next gener-ation sequencing (NGS) technologies have recently emerged,including Roche 454, Illumina GA, and ABI SOLiD, which areable to generate three to four orders of magnitude moresequence and are considerably less expensive than the Sanger
Published: 27 March 2009
Genome Biology 2009, 10:R32 (doi:10.1186/gb-2009-10-3-r32)
Received: 14 December 2008Revised: 23 February 2009Accepted: 27 March 2009
The electronic version of this article is the complete one and can be found online at http://genomebiology.com/2009/10/3/R32
Genome Biology 2009, 10:R32

http://genomebiology.com/2009/10/3/R32 Genome Biology 2009, Volume 10, Issue 3, Article R32 Harismendy et al. R32.2
method on the ABI 3730xL platform (hereafter referred to asABI Sanger) [2-4]. To date these new technologies have beensuccessfully applied toward ChIP-sequencing to identifybinding sites of DNA-associated proteins [5,6], RNA-sequencing to profile the mammalian transcriptome [7,8], aswell as whole human genome sequencing [9-11]. Currentlythere is much interest in applying NGS platforms for targetedsequencing of specific candidate genes, intervals identifiedthrough single nucleotide polymorphism (SNP)-based associ-ation studies, or the entire human exome [12-15] in largenumbers of individuals.
As population targeted sequencing studies are initiated, it isimportant to determine the issues that will be encountered ingenerating and analyzing data produced by NGS platformsfor this application. Here, we generate 260 kb of targetedsequence in four samples using the manufacturer recom-mended and/or supplied sample library preparation meth-ods, sequence generation, alignment tools, and base callingalgorithms for the Roche 454, Illumina GA, and ABI SOLiDplatforms (Figure 1). For each NGS technology we generateda saturating level of redundant sequence coverage, meaningthat increased coverage is likely to have minimal, if any, effecton data quality and variant calling accuracies. We analyzedthe sequences produced by each platform for per-base
Overview of experimental designFigure 1Overview of experimental design. Six genomic intervals, each encoding genes for K+/Na+ voltage-gated channel proteins, were amplified using DNA from four individuals and LR-PCR reactions to generate 260 kb of target sequence per sample. Amplicons from each individual were pooled in equimolar amounts and then sequenced using the three NGS platforms. The 260 kb examined in this study is representative of human sequences containing 38% repeats and 4% coding sequence compared with 47% and 1%, respectively, genome-wide. For each sample 88 kb was amplified using short range PCR (SR-PCR) reactions targeting the exons and evolutionarily conserved intronic regions. Each SR-PCR amplicon was individually sequenced in the forward and reverse directions using the ABI-3730xL platform (Additional data file 2). Data generated from the NGS platforms were analyzed to identify bases variants from the reference sequence (build 36) and the quality of the variant calls was assessed using platform specific methodologies. A comparative analysis of the sequence data from the NGS platforms and ABI Sanger was then performed to determine accuracy, and false positive and false negative rates.
KCNE1 (21q) KCNE2 (21q) KCNE3 (11q) KCNE4 (2q) KCNH2 (7q) SCN5A (3p)
Individual SR-PCR amplicons
LR-PCRSR-PCR
Pooled LR-PCR amplicons
Comparative AnalysisComparative AnalysisComparative Analysis
Roche 454 Illumina GA ABI SOLiD ABI Sanger
Newbler NewblerNewbler MAQ MAQMAQ Corona-LiteCorona-LiteCorona-Lite
•alternate allele reads frequency•Minimum coverage•Minimum quality
•alternate allele reads frerr quency•Minimum coverage•Minimum quality
•Alternate allele reads frequency•Minimum coverage•Minimum quality
Custom filter area and height minor/major peak ratio
Custom filter area andheight minor/rr maja or peakratio
Custom filter area and height minor/major peak ratio
TraceTunerTraceTunerTraceTunerReads
processing
Variant calling
Genome Biology 2009, 10:R32

http://genomebiology.com/2009/10/3/R32 Genome Biology 2009, Volume 10, Issue 3, Article R32 Harismendy et al. R32.3
sequence coverage and for systematic biases giving rise to lowcoverage. We show that each NGS platform generates its ownunique pattern of biased sequence coverage that is consistentbetween samples. For the short-read platforms, low coverageintervals tend to be in AT-rich repetitive sequences. We alsoperformed a comparative analysis with sequence generatedby the well-established ABI Sanger platform (Figure 1) todetermine base calling accuracies and how average foldsequence coverage impacts base calling errors. Although thethree NGS technologies correctly identify >95% of variantalleles, the average sequence coverage required to achievethis performance is greater than the targeted levels of mostcurrent studies.
ResultsGeneration and alignment of sequence reads to targeted intervalsThe targeted sequence was amplified in the four DNA sam-ples using long-range PCR (LR-PCR) reactions that werecombined in equimolar amounts and sequenced using thethree NGS technologies (Figure 1). For the Roche 454 plat-form we obtained an average of 49,000 reads per sample withan average length of 245 bp (Supplemental Table 1 in Addi-tional data file 1), using Illumina GA we generated an averageof 5.9 million reads each 36 bases in length per sample, andusing ABI SOLiD we obtained an average of 19.7 million readseach 35 bases in length per sample. Thus, the amount ofsequence data generated and analyzed was dependent on theNGS platform and the fraction of the run that was utilized.
The NGS technologies generate a large amount of sequencebut, for the platforms that produce short-sequence reads,greater than half of this sequence is not usable. On average,55% of the Illumina GA reads pass quality filters, of whichapproximately 77% align to the reference sequence (Supple-mental Table 1 in Additional data file 1; Additional data file 2).For ABI SOLiD, approximately 35% of the reads pass qualityfilters, and subsequently 96% of the filtered reads align to thereference sequence. Thus, only 43% and 34% of the IlluminaGA and ABI SOLiD raw reads, respectively, are usable. In con-trast to the platforms generating short-read lengths, approxi-mately 95% of the Roche 454 reads uniquely align to thetarget sequence. When designing experiments and calculat-ing the target coverage for a region, one must consider thefraction of alignable sequence.
Overrepresentation of amplicon end sequencesIn examining the distribution of mapped reads, we observedthat the sequences corresponding to the 50 bp at the ends andthe overlapping intervals of the amplicons have extremelyhigh coverage (Figure 2; Additional data file 2). Theseregions, representing about 2.3% (approximately 6 kb) of thetargeted intervals, account for up to 56% of the sequencedbase pairs for Illumina GA technology. This extreme sequencecoverage bias results from overrepresentation of the ampli-
con ends in the DNA samples after fragmentation prior tolibrary generation. For the ABI SOLiD platform an ampliconend depletion protocol was employed to remove the overrep-resented amplicon ends; this was partially successful andresulted in the ends accounting for up to 11% of the sequencedbase pairs. For the Roche 454 technology, overrepresentationof amplicon ends versus internal bases is substantially less,with the ends composing only 5% of the total sequencedbases; this is likely due to library preparation process differ-ences between Roche 454 and the short-read length plat-forms. The overrepresentation of amplicon end sequences isnot only wasteful for the sequencing yield but also decreasesthe expected average coverage depth across the targetedintervals. Therefore, to accurately assess the consequences ofsequence coverage on data quality, we removed the 50 bp atthe ends of the amplicons from subsequent analyses.
Sequence coverage of targeted intervalsFor each platform we generated a saturating level of redun-dant sequence coverage, meaning that increased coverage islikely to have minimal, if any, effect on data quality. For thefour samples the average sequence coverage depth across theanalyzed base pairs is 43×, 188×, and 841× for Roche 454,Illumina GA, and ABI SOLiD, respectively (SupplementalTable 2 in Additional data file 1). For all three NGS technolo-gies there is greater than a hundred-fold variation in the per-base sequence coverage depth (Figure 2). We performed sev-eral analyses to determine if the sample preparation methodand/or a specific class of sequence elements were responsiblefor the observed variability (Additional data file 2). We firsttested whether the large variability resulted from pooling ofthe amplicons. For 90% of the amplicons the fold differencein average coverage of unique sequences is less than 2.46,2.72, and 2.99 on the Roche 454, Illumina GA and ABI SOLiDplatforms, respectively (Supplemental Table 3 in Additionaldata file 1), showing that the error in equimolar pooling oramplicon specific bias (sequence, length) explains only asmall fraction of the observed coverage variability. Next weexamined how the sequence coverage differs within the indi-vidual amplicons. For Roche 454, Illumina GA, and ABISOLiD the average coefficient of variance was 0.33, 0.9, and0.73, respectively, for all base pairs, and 0.35, 0.84 and 0.76,respectively, when restricted to unique non-repetitivesequence, defined here as not present in the RepBase data-base [16]. These results indicate that unique sequencespresent at equimolar amounts in the library generation stepend up being covered at vastly different read depths.
It is important to consider how well the NGS technologies areable to generate sequence reads containing repetitive ele-ments as these sequences comprise approximately 45% of thehuman genome and may potentially impact genome function.Compared to unique sequences, the Roche 454 technologyhas a 1.25-fold overrepresentation of LINE elements, Illu-mina GA has greater than 2-fold higher coverage of SINEs,Alus and simple repeats, while for ABI SOLiD all repetitive
Genome Biology 2009, 10:R32

http://genomebiology.com/2009/10/3/R32 Genome Biology 2009, Volume 10, Issue 3, Article R32 Harismendy et al. R32.4
Genome Biology 2009, 10:R32
Non-uniform per-base sequence coverageFigure 2Non-uniform per-base sequence coverage. The 100-kb interval on chromosome 3 encoding the SCN5A gene (blue rectangles and joining lines) was amplified using eight LR-PCR amplicons (red filled rectangles in upper panel). On the y-axis, the fold sequence coverage scale is shown for each platform. The upper panel shows that amplicon end sequences are highly overrepresented. The y-axis was set to show the relative fold coverage of the sequences in the interval and therefore does not accurately represent the maximum fold coverage of the amplicon ends, which was 311, 195,473, and 15,041 for Roche 454, Illumina GA, and ABI SOLiD, respectively, in the sample shown. The lower panel shows the non-uniformity of sequence coverage across an approximately 17-kb region encompassing four exons of SCN5A. The locations of the repetitive elements (lower black/gray rectangles) in the interval are shown.

http://genomebiology.com/2009/10/3/R32 Genome Biology 2009, Volume 10, Issue 3, Article R32 Harismendy et al. R32.5
elements are covered at approximately half the fold coverageof unique sequences (Supplemental Table 4 in Additionaldata file 1). Thus, considering all three NGS platforms, Roche454 generates the most even coverage across both unique andrepetitive sequences, Illumina GA shows the most variabilityin coverage, and ABI SOLiD demonstrates a strong biasagainst coverage of repetitive elements.
Interestingly, each NGS technology has a unique reproduci-ble pattern of non-uniform sequence coverage: sequenceswith high or low coverage in one sample typically had high orlow coverage in the other three samples (Figure 3). The coef-ficient of correlation (r) of per-base sequence coverage depthwas 0.62, 0.90, and 0.88 between samples on Roche 454,Illumina GA, and ABI SOLiD, respectively. On the otherhand, per-base sequence coverage depth for the same sampleon different platforms was not well correlated (r < 0.19).These data indicate that for all three NGS technologies localsequence characteristics substantially contribute to theobserved variability in coverage unique to each technology.
To gain insight into systematic biases of each NGS technol-ogy, we examined the sequence composition of intervals withno or low coverage (defined as less than 5% of the averagecoverage depth; Additional data file 2). Despite having con-siderably higher average sequence coverage, the ABI SOLiDdata have the largest number of no and low coverage intervals(spanning 464 bp and 3,415 bp respectively), the majority of
which are AT-rich repetitive sequences (Supplemental Tables5 and 6 in Additional data file 1). The Illumina GA low cover-age regions (spanning 272 bp) also tend to be AT-rich repeti-tive sequences. Overall, for the short read platforms readdepth coverage decreases with increasing AT content, whichis consistent with previous studies [17,18] (Supplemental Fig-ure 1 in Additional data file 3). Roche 454 had one no and onelow coverage interval (spanning 4 bp and 59 bp, respectively).
Detection of single nucleotide base variantsWe established parameters for calling variant bases in thesequence generated by the NGS technologies based on opti-mized concordance with the variant calls in the ABI Sangerdata. As previously observed, PCR sample preparation canproduce imbalanced amplification of the two alleles for someamplicons, resulting in incorrect genotype calls at variantbases by specifically calling heterozygous sites ashomozygous sites [19]. Imbalanced amplification is usuallysuspected to result from polymorphisms in or near the oligo-nucleotide priming sites that result in greater efficiency ofamplification for one of the alleles. To measure this phenom-enon in our sample preparation method, we looked at thealternate allele read frequency (AARF; Additional data file 2)at ABI Sanger identified heterozygous positions in thesequence data for the three NGS platforms. Out of the 28amplicons in this study, four demonstrated allelic imbalancesin amplification for one or more samples (SupplementalTable 7 in Additional data file 1). We removed the sequence
Each NGS technology generates a consistent pattern of non-uniform sequence coverageFigure 3Each NGS technology generates a consistent pattern of non-uniform sequence coverage. (a) Sequence coverage depth is displayed as a gray-scale (0-100× for Roche 454; 0-500× for Illumina GA and ABI SOLiD) along an approximately 25-kb region of chromosome 11 amplified by three long-range PCR products (red rectangles). (b) A heat-map colored matrix displays the coefficient of correlation of coverage across the entire 260 kb of analyzed sequence between each of the 72 possible pair-wise comparisons (four samples by three technologies). The apparent lower correlation of the Roche-454 sequence coverage is more reflective of the smaller amplitude in the coverage variability (lower average coefficient of variance) than a lack of coverage correlation from sample to sample. The correlation of NA17460 with the other three samples on the ABI SOLiD platform is slightly lower due to technological issues (Additional data file 2) and was therefore excluded from the coefficient of correlation calculation reported in the text.
Genome Biology 2009, 10:R32

http://genomebiology.com/2009/10/3/R32 Genome Biology 2009, Volume 10, Issue 3, Article R32 Harismendy et al. R32.6
data for these four amplicons from the variant quality analy-sis so as to focus on errors caused by the NGS platforms andthereby not have the analysis confounded by sample prepara-tion issues.
Accuracy of sequence variant calls compared to microarray genotype callsAccuracy of the variant calls in the NGS and ABI Sanger datafor the four samples was initially assessed by comparison togenotype calls for approximately 80 SNPs located in thesequenced intervals and assayed by the Illumina Hap550BeadChip. The genotype accuracy of the four platforms is97.4%, 100%, 99.7%, and 98% for Roche 454, Illumina GA,ABI SOLiD and ABI Sanger, respectively (SupplementalTables 8 and 9 in Additional data file 1). These data show agreater number of discordant genotypes for Roche 454. It isimportant to note that comparison between sequence andSNPs genotyped on commercial arrays is not expected to befully indicative of NGS platform variant base calling accuracyin genomic sequences at large. First, false positive rates can-not be considered by SNP microarray technologies becausenovel variants are not detected. Second, SNP microarraystypically query a subset of 'well behaved' bases; hence, falsenegative rates based on microarray technology can be under-estimated.
Variant detection comparing NGS to ABI SangerTo further assess sequence quality, we next performed a four-way comparison of the base calls generated from the threeNGS technologies and ABI Sanger. The identification of het-erozygous and homozygous alternate loci was performed in258,879 base pairs analyzed from all four samples (Supple-mental Table 10 in Additional data file 1). There were twentyloci for which the three NGS technologies were concordant intheir base calls but discordant with the ABI Sanger calls. Vis-ual inspection of the ABI Sanger traces revealed that eight ofthese loci represented base calling errors in the original data,thereby resolving the discrepancy. However, for 12 loci (9false positive and 3 false negative calls) the discrepancieswere not resolved (Figure 4g,h). Two of the discrepant callswere assayed by the Illumina Hap550 array (SupplementalTable 9 in Additional data file 1) and their calls were concord-ant with the NGS platforms. We examined the genotypes ofthe remaining discrepant calls by independent Sangersequencing. As previously established [19,20], errors inSanger sequencing of human diploid DNA are approximately7% and result from: PCR primers sometimes overlappingunknown DNA variants leading to imbalanced amplificationof the two alleles; and difficulty of automated software to cor-rectly call heterozygous sites. Thus, replicating the Sangersequencing with different PCR and sequencing primers andmanual inspection of the traces can be considered an inde-pendent measurement. We successfully examined eight of thediscrepant calls using this approach, of which seven agreedwith the calls made by the NGS platforms (Supplemental Fig-ure 3 in Additional data file 3). In total, nine of the ten dis-
crepant calls investigated (two by genotyping and seven bySanger sequencing) were confirmed as being incorrect in theoriginal ABI-Sanger sequencing. As a result of this analysisfor the first time by comparison with NGS technologies, theABI Sanger false positive and false negative rates for humandiploid DNA are estimated to be approximately 0.9% andapproximately 3.1%, respectively. These 12 loci identified asABI Sanger errors were removed from consideration whenassessing the NGS technologies' performance.
We next calculated five different performance metrics(sequencing accuracy, variant accuracy, false positive rate,false negative rate, and variant discrepancy rate) for the NGSplatforms (Supplemental Table 11 in Additional data file 1).Sequencing accuracy, which measures the concordance of allcalls including homozygous reference, was greater than99.99% for all NGS technologies (Figure 4a). On the otherhand, variant accuracy, which measures the ability of NGStechnologies to make a correct call at known variant positionsidentified by ABI Sanger, was lower, averaging over the fourindividuals for each technology at 95%, 100%, and 96% forRoche 454, Illumina GA, ABI SOLiD, respectively (Figure 4b).The false positive rate of Roche 454, Illumina GA and ABISOLiD is approximately 2.5%, approximately 6.3%, andapproximately 7.8%, respectively; the false negative rates areapproximately 3.1%, approximately 0%, and 0.9% (Figure4d,e). We also examined the variant discrepancy rates, whichreflect the number of positions that have been correctly iden-tified as variant, but assigned incorrect zygosity. For Roche454, Illumina GA, and ABI SOLiD the variant discrepancyrates were 2%, 0%, and 3%, respectively. These five perform-ance metrics indicate that at saturating sequence coverageand the methodologies employed to call variants, the short-read platforms have greater sensitivity but lower specificitythan Roche 454.
In examining the sequences underlying false positive andfalse negative calls in the NGS technologies, we determinedthat these errors were unexpectedly not associated with lowsequence coverage but rather are the result of systematicbiases (Figure 4g,h,i). For each NGS platform, 47% of thebases with an error in one sample had an error in at least oneother sample (Supplemental Table 12 in Additional data file1). Greater than 72% of these false positive and negative callsare associated with at least one and >33% with two of the fol-lowing sequence contexts: repetitive elements; a homopoly-mer stretch ≥6 bases; simple repeats; the presence of an indelwithin 30 bp. These sequence contexts likely present signifi-cant challenges during read alignment, especially for theshort-read technologies, resulting in variant detection errors.Two out of the three false negatives specific for the ABI SOLiDplatform were due to the inability to detect adjacent SNPswith existing variant calling software applied to color-spacesequencing technology (Additional data file 2).
Genome Biology 2009, 10:R32

http://genomebiology.com/2009/10/3/R32 Genome Biology 2009, Volume 10, Issue 3, Article R32 Harismendy et al. R32.7
Genome Biology 2009, 10:R32
Performance metrics of NGS technologiesFigure 4Performance metrics of NGS technologies. (a-f) Error bars represent minimum and maximum values obtained from the four samples. (g-i) Venn diagram representation of false positive calls (g), false negative calls (h) and discrepant variants calls (i). The inset caption displays the color-coding of each NGS technology and overlaps: for Roche 454 (red), Illumina GA (yellow) and ABI SOLiD (blue). For each NGS platform the number of base calls with errors associated with specific sequence contexts is given (repeat = repetitive element). When two sequence contexts are present they are both listed.

http://genomebiology.com/2009/10/3/R32 Genome Biology 2009, Volume 10, Issue 3, Article R32 Harismendy et al. R32.8
Detection of indelsDetection of heterozygous indels remains a technologicalchallenge using the ABI Sanger platform [21]. Here the ABISanger sequencing detected 11 heterozygous indels in the 88kb of sequence analyzed. The Roche 454 technology success-fully identified five of these indels, all of which ranged from 3-16 bp in length (Supplemental Table 13 in Additional data file1). Of the six indels missed by Roche 454, five were single basein length in homopolymer sequences, and one was a 15 bpinsertion that was not completely resolved due to low cover-age. Interestingly, Roche 454 identified 43 additional indelsin the 88 kb of overlapping ABI Sanger sequences (Supple-mental Table 14 in Additional data file 1). Bearing in mindthat the false positive rate for these data cannot be estimated,this suggests that the Roche 454 platform may be more usefulfor identifying indels than the ABI Sanger technology. TheIllumina GA and ABI SOLiD platforms at the time of thisanalysis were unable to identify indels automatically.
Assessing performance metrics at lower coverageTo efficiently perform population-based targeted sequencingstudies using NGS technologies, it is important to determinethe lowest average sequence coverage required to achieve aspecified sensitivity and specificity. To estimate this coveragerequirement, we simulated varying coverage depths for allthree technologies, recalled genotypes, and calculated falsepositive and false negative rates for each coverage depth(Additional data file 2). The maximum simulated averagecoverage was 40-fold for Roche 454 and 140-fold for bothIllumina GA and ABI SOLiD. The false positive error rates aremore impacted by low coverage compared with false negativerates; thus, we focused our analysis on the former. The aver-age coverage depth for 50% false positive error rate degrada-tion (percentage of the minimum simulated error rate; see
Materials and methods) is achieved at 25-fold, 68-fold, and39-fold and for 10% degradation at 34-fold, 110-fold and 101-fold for Roche 454, Illumina GA, and ABI SOLiD, respectively(Figure 5). These results indicate that the short-read technol-ogies have a two- to three-fold greater sequence coveragedepth requirement relative to Roche 454. Thus, errors at highcoverage are systematic and typically associated with specificsequence contexts; at lower coverage errors result from ran-dom sampling in base calling. Consistent with this observa-tion, the performance of the NGS technologies at lowsequence coverage is correlated with per-base sequence cov-erage uniformity; the Illumina GA, which has the highest cov-erage variability, performs the worst at lower coverage,whereas Roche 454, with the most uniform coverage, per-forms the best. This observation suggests that for all the NGStechnologies, achieving more uniform sequence coveragewould result in considerably higher performance at lowercoverage.
DiscussionOur study highlights many issues encountered as NGS plat-forms are utilized for population-based targeted sequencingstudies, including biases in sample library generation, diffi-culties mapping short reads, variation in sequence coveragedepth of unique and repetitive elements, difficulties detectingindels with short reads, the systematic errors of the NGS tech-nologies and the impact of all these features on variant callingaccuracy. We note that the results of our analyses reported foreach NGS platform are the combined effects of the manufac-turer recommended laboratory methods, sequence readalignment tools, and base calling algorithms utilized.
False positive rates (FPRs) and false negative rates for the three NGS technologies at simulated varying coverage depthsFigure 5False positive rates (FPRs) and false negative rates for the three NGS technologies at simulated varying coverage depths. Performances of (a) Roche 454, (b) Illumina GA, and (c) ABI SOLiD at lower coverage depths were simulated by random subsampling of the reads. Error bars represent the standard deviation over the four samples for ten iterations. The thresholds for a 10% and 50% error rate degradation of the minimum false positive rate are indicated by dashed and dotted lines, respectively, and the corresponding coverage depth reported in dashed and dotted boxes, respectively.
Genome Biology 2009, 10:R32

http://genomebiology.com/2009/10/3/R32 Genome Biology 2009, Volume 10, Issue 3, Article R32 Harismendy et al. R32.9
At high sequence coverage all NGS platforms have excellentvariant calling accuracy (>95%) as assessed by the detectionof known SNP variants. However, this accuracy is lower thanthe values typically stated for the NGS platforms [22-25].NGS-reported accuracies are typically being measured, inhuman sequences, by comparison to commercial SNP geno-typing arrays, which we demonstrate are inadequate forascertaining false positive and false negative rates. Therefore,the sequence-based accuracies reported here are likely to bemore indicative of the real performance of NGS platforms forde novo detection of variants in human sequences.
Interestingly, our analysis indicates that ABI Sanger has afalse negative rate of approximately 3%, which is comparableto the three NGS technologies at saturating coverage. Thus,there are likely many more DNA polymorphisms yet to bedetected in human samples [26]. Indeed, heterozygous indeldetection, which is difficult using PCR-based sample prepara-tion methods and ABI Sanger sequencing [27], may be easierto achieve using NGS platforms because each allele issequenced and detected independently. This is especiallyimportant since indel variants constitute approximately 25%of the reported mutations implicated in human disease [28]and their identification would precede a more completeunderstanding of how they determine human phenotypes.
The saturating sequencing coverage we exploited enabled thedetermination of the sequence coverage threshold belowwhich false discovery rates of variants were unacceptablyhigh. This revealed that for accurate detection of biallelicsites, the average depth of sequence coverage required for allthree NGS platforms but especially for the short-read tech-nologies is considerably higher than the empirically deter-mined coverage of 20-fold utilizing random Sangersequencing [29]. This coverage requirement for NGS technol-ogies is further supported by a recent multiplexed targetedresequencing study that showed that accurate detection ofvariant loci necessitates a 20-fold read depth per base, and ahigher average depth due to coverage variability [30], and arecent yeast mutational profiling study that showed 10-15-fold coverage is required to detect variants in haploid organ-isms [31]. Importantly, these required average sequence cov-erages are much higher than what is typically employed intargeted sequencing studies utilizing NGS technologies.
ConclusionsOur results suggest that to effectively balance cost and dataquality for population targeted sequencing studies, there aretwo key aspects of NGS technologies that need optimization:the uniformity of per-base sequence coverage must beimproved to reduce the total amount of sequence generationrequired; and the systematic errors that impact variant call-ing accuracy need to be reduced so that the false positive andfalse negative rates are acceptable for sequence-based associ-ation studies. Although recent improvements in the NGS
platforms, such as paired end and longer reads, will mitigatethese issues, all aspects of the NGS platforms, laboratorymethods, sequence alignment tools, and base calling algo-rithms partially contribute to the problems and, therefore,need to be simultaneously optimized.
Materials and methodsSample preparationTwenty-eight LR-PCR reactions were performed to amplifysix genomic intervals spanning a total of 266 kb in each offour DNA samples (NA17275, NA17460, NA17156, andNA17773) obtained from the Coriell Institute [32] (Additionaldata file 2). Following LR-PCR, the 28 amplicons generatedusing a single DNA sample template, ranging in size from3,088 bp to 14,477 bp, were quantified, combined in equimo-lar amounts, and used to create libraries for Roche 454, Illu-mina GA and ABI SOLiD sequencing.
Roche 454The Roche 454 laboratory methods and protocols used wereas described by Rothberg and coworkers [23]. The reads pro-duced by the Roche 454 FLX platform were mapped to thereference sequence using the algorithm Newbler version1.1.03.19 (provided by Roche), unless stated otherwise.
Illumina GAThe Illumina GA libraries were prepared according to themanufacturer's instructions from the 28 equimolar pooledPCR products except for the fragmentation step (Additionaldata file 2). The Illumina GA reads were aligned with MAQ0.6.2 [33], unless stated otherwise.
ABI SOLiDLong mate pair (LMP) libraries DNA libraries were generatedfrom the four 28 equimolar pooled amplicon samples and endsequenced using standard ABI SOLiD protocols at AppliedBiosystems in Beverly, MA. For each sample, ABI aligned thesequence reads to the reference sequence and mate-pairinginformation was not employed in this project. The alignedreads and the number of calls per base for each position wereused for data analysis (Additional data file 2).
The LMP library construction process requires more DNAamplification and manipulation and is useful for the detec-tion of indels and structural variants. Therefore, as opposedto the library construction processes for Roche-454 and Illu-mina GA, which were focused on read fragment preparationalone, discarding mate-pair information from the LMP proto-col reads and using them as unpaired reads may have intro-duced mapping biases when used to detect SNPs. Indeed, thegeneration of these libraries creates variable tag lengths thatrequire different mapping techniques to ensure proper repre-sentation of the genome. Shorter tags will not map with a 35bp and 3 mismatches schema and as a result substantial por-
Genome Biology 2009, 10:R32

http://genomebiology.com/2009/10/3/R32 Genome Biology 2009, Volume 10, Issue 3, Article R32 Harismendy et al. R32.10
tions of the genome can be differentially sampled due to fixedmapping criteria.
These differences in the library techniques emphasize theneed for the use of quality score information in the ABI SOLiDreads to properly trim the data before mapping and allow forproper comparison to a Roche 454 and Illumina GA data thatcurrently perform Keypass, Chastity and Purity filtering ofthe data before SNP calling.
Calling genotypes in the NGS sequence dataWe define the alternate allele as the most commonly calledbase (which is not the reference base) for a given position inthe reference sequence. Then, the AARF is the fraction ofreads corresponding to the alternate allele.
Positions called as reference homozygote by ABI Sanger haveAARFs close to 0% by the NGS technologies (SupplementalFigure 2 in Additional data file 3). Also, positions called asalternate homozygous by ABI Sanger have AARFs near or at100% by the NGS technologies. The AARFs for heterozygouscalls by ABI Sanger is centered at 50% for Roche 454 and Illu-mina GA; for ABI SOLiD it is centered at 42% (Additionaldata file 2). Upon independent inspection of the three tech-nologies, most ABI Sanger-called heterozygotes fell in therange 20-80%. Thus, for the NGS technologies, utilizing onlyhigh quality bases we call positions with AARFs between 20%and 80% as heterozygous, positions with AARFs >80% ashomozygous alternate, and positions with AARFs <20% ashomozygous reference (Additional data file 2).
Short-range PCR and Sanger sequencingWe used an existing data set deposited by JCVI and per-formed under the auspices of the National Heart, Lung andBlood Re-sequencing and Genotyping program [34]. The dataset included 88 kb of non-contiguous sequence encompassingthe exons and the intronic sequence conserved with mouseand rat in the K+/Na+ channel proteins produced by employ-ing 273 short-range PCR reactions generating ampliconsaveraging 418 bp in length.
Definitions of performance metricsIn order to assess the performance of the sequencing technol-ogies, we define several metrics.
Comparing a genotyping microarray to a sequencing technologyGenotype accuracyWe genotyped the four samples on the Illumina Hap550microarray according to specifications of the manufacturer.We compared the genotype calls of the SNPs on the Hap550microarray with the genotypes observed from sequencing(Supplemental Table 8 in Additional data file 1). Genotypeaccuracy is defined as: (Number of genotypes matchingexactly between Illumina Hap550 and a sequencing technol-ogy)/(Number of compared positions).
Metrics for comparing a NGS sequencing technology with ABI SangerWe initially assumed the ABI Sanger sequence data are cor-rect because it is an established method with the longest his-tory [2]. Upon further analysis, we found that this assumptionwas not always true; there were some positions incorrectlycalled by ABI Sanger, but correctly called by the NGS technol-ogies (see Results). We refer to Table 1 annotations to clarifythese definitions.
Sequencing accuracyThis is defined as the number of concordant calls betweenABI Sanger and a NGS technology. Following the diagramabove, this is calculated as (A1 + B2 + C3)/Total, where Totalis defined as the number of positions with genotype calls byboth technologies, or (A1 + A2 + A3 + B1 + B2 + B3 + C1 + C2+ C3). Because the sequencing accuracy metric is dominatedby the concordance of a large number of homozygous refer-ence calls (A1), this metric tends to be very near 1.
Variant accuracyBecause 'sequencing accuracy' tends to be dominated by thelarge number of homozygous reference calls, we defineanother metric called 'variant accuracy'. Variant accuracy isrestricted to the variant positions called by ABI Sanger and isdefined as: (B2 + C3)/(A2 +A3 + B2 + B3 + C2 + C3).
Table 1
Annotations of the genotypes differences to illustrate the definition of the metrics used to compare ABI Sanger and NGS Technologies
Sanger
NGS technology Homozygous reference Heterozygous Homozygous alternate N/N
Homozygous reference A1 A2 A3 A4
Heterozygous B1 B2 B3 B4
Homozygous alternate C1 C2 C3 C4
N/N D1 D2 D3 D4
N/N: positions at which genotype was not called.
Genome Biology 2009, 10:R32

http://genomebiology.com/2009/10/3/R32 Genome Biology 2009, Volume 10, Issue 3, Article R32 Harismendy et al. R32.11
False positive rate of variants (false positive rate)We define a false positive when the NGS technology calls avariant where ABI Sanger calls a homozygous reference. Thefalse positive rate is calculated as (B1 + C1)/(B1 + B2 + B3 +C1 + C2+ C3).
False negative rate of variants (false negative rate)We define a false negative when ABI Sanger detects a variant,but the NGS method calls this locus as a homozygous refer-ence. The false negative rate is calculated as (A2 + A3)/(A2 +A3 + B2 + B3 + C2 + C3).
Variant discrepancy rateWe define the variant discrepancy rate as (B3 + C2)/(B2 + B3+ C2 + C3). This metric reflects ABI Sanger variant positionsthat are also detected by the NGS technology, but where thegenotype calls disagree.
Coverage rateThe fraction of positions with genotype calls is defined as 1-(D1 + D2 + D3)/(A1 + A2 + A3 + B1 + B2 + B3 + C1 + C2 + C3+ D1 + D2 + D3).
ABI Sanger false positive rateWe define a ABI Sanger false positive when ABI Sanger callsa variant but all three NGS technologies call the locus ashomozygous reference. We assume the NGS technologies tobe correct, and this was confirmed by re-inspection of the ABISanger traces. The ABI Sanger false positive rate is calculatedas follows. The numerator is the number of loci that are calledas homozygous reference by all three NGS technologies, butas a variant in ABI Sanger. In the denominator, we considerall positions that were called as variant by Sanger and alsohad a genotype call by all three NGS technologies.
ABI Sanger false negative rateWe define a ABI Sanger false negative as a locus where the ini-tial call by ABI Sanger is homozygous reference but all threeNGS technologies detect a variant at this locus. In the numer-ator of the ABI Sanger false negative rate, we count thenumber of variant loci that are identified by all three NGStechnologies but called as homozygous reference by ABISanger. We note that zygosity may not agree among the threeNGS technologies, but if all three technologies identify a var-iant at the position, the locus is included (Supplemental Table12 in Additional data file 1). The denominator represents thenumber of loci called as variant by all three NGS technologies(although the zygosity may differ).
Validation of genotypes discordant between ABI Sanger and the three NGS platformsPCR reactions were performed in 50 μl platinum buffer (Inv-itrogen, Carlsbad, CA, USA) using 5 pM of primers (Supple-mental Table 15 in Additional data file 1) and 0.2 μl ofplatinum Taq DNA polymerase, incubated 2 minutes at 94°Cfollowed by 35 cycles at 30 s at 94°C, 30 s at 60°C and 30 s at
72°C, followed by 5 minutes at 72°C for final elongation. PCRproducts were purified using QIAquick PCR purification col-umns (Qiagen, Hilden, Germany)) and sequenced in bothdirections using the same primers as in the PCR and Big Dyeterminator sequencing chemistry (Applied Biosystems, Fos-ter City, CA USA).
SimulationsSimulations were performed in order to assess performanceof each NGS platform at lower coverage depths. For each sim-ulation, we randomly sampled a subset of the reads andrecalled genotypes. The size of the subset was determined bythe desired coverage depth.
Inferring coverage at various error rate degradationsTo obtain the coverage depths in Figure 5, we first examinedthe error rate at the maximal simulated coverage. For 50%error rate degradation, we multiplied the error rate at themaximal coverage by 1.5 to get the desired error rate. For 10%error rate degradation, we multiplied the error rate at themaximal coverage by 1.1 to get the desired error rate. We thenexamined the error rates from the simulations at differentcoverage depths, and interpolated what coverage depth corre-sponds to the desired error rate. For example, the false posi-tive error rate for Illumina GA at 140× from the simulationsis 0.073. At 50% error rate degradation, the false positive rateis 0.110. The false positive rates at coverage depths of 60× and80× are 0.118 and 0.099, respectively, so we know that a cov-erage depth within the range of 60× to 80× will give a falsepositive rate of 0.110. Using linear interpolation, we deducethat a coverage depth of 68× gives a false positive rate of0.110, and this is reported in Figure 5.
The error rates for Illumina GA and ABI SOLiD at maximumsimulated coverage are slightly higher than what was experi-mentally observed. The additional errors observed in the sim-ulations are largely associated with low coverage regions andare different between iterations, whereas the systematicerrors present in the experimental data set at full coverage areshared between iterations. This shows that the simulationproduces random sampling errors, directly associated withlow coverage regions.
AbbreviationsAARF: alternate allele read frequency; LR-PCR: long-rangePCR; NGS: next generation sequencing; SNP: single nucle-otide polymorphism.
Competing interestsPCN and SS Murray currently hold stock in Illumina, Inc.
Genome Biology 2009, 10:R32

http://genomebiology.com/2009/10/3/R32 Genome Biology 2009, Volume 10, Issue 3, Article R32 Harismendy et al. R32.12
Authors' contributionsOH, PN, and SL performed next gen sequencing analysis; SL,and TS performed Sanger sequencing analysis; XW, and KBperformed next gen sequencing experiments; KF, ET, NS, RS,SL, and SM facilitated the study; KF, SL, PN, and OHdesigned the study and wrote the manuscript.
Additional data filesThe following additional data are available with the onlineversion of this paper: a PDF including 15 supplemental tables(Additional data file 1); supplemental Materials and methods(Additional data file 2); a PDF including three supplementalfigures (Additional data file 3).Additional data file 1Supplemental Tables 1-15Supplemental Table 1: result of the NGS pipeline analysis. Supple-mental Table 2: coverage information of all the samples in each NGS. Supplemental Table 3: coverage variability between ampli-cons. Supplemental Table 4: coverage variability between different repeat elements. Supplemental Table 5: amount of sequence with no or low coverage. Supplemental Table 6: list of regions with no or low coverage for each NGS. Supplemental Table 7: analysis of the allelic imbalance amplification of the LR-PCR amplicons. Supple-mental Table 8: result of the comparison between sequencing and genotyping on Illumina Hap550. Supplemental Table 9: loci with discrepant calls between genotyping and sequencing. Supplemen-tal Table 10: genotype calls comparison between ABI Sanger and each NGS. Supplemental Table 11: quality metrics of the compari-son of the genotype calls between ABI Sanger and NGS technolo-gies. Supplemental Table 12: all the loci with discordant genotype calls between ABI Sanger and NGS Technologies. Supplemental Table 13: all indel loci identified by ABI Sanger and their calls in Roche 454. Supplemental Table 14: all indels identified by Roche 454 and missed by ABI Sanger. Supplemental Table 15: all the primers and oligonucleotides used in the study.Click here for fileAdditional data file 2Supplementary Materials and methodsAdditional information to the methods used and calculations per-formed for this study.Click here for fileAdditional data file 3Supplemental Figures 1-3Supplemental Figure 1: coverage distribution as a function of GC content for the 3 NGS. Supplemental Figure 2: distribution of alter-nate allele read frequency obtained for each NGS. Supplemental Figure 3: Sanger Traces of eight loci found to have discrepant calls between Sanger and NGS.Click here for file
AcknowledgementsWe thank Drs. Kevin McKernan and Stephen McLaughlin for providingassistance in the amplicon library preparation and initial data analysis forABI SOLiD sequence data, and Dr Dan Roden for permission to use ABISanger trace data that were previously generated by the JCVI under thesupport of the National Heart, Lung and Blood Re-sequencing and Geno-typing program [34]. This work was partly funded by NIH CTSA grant NIH1U54RR025204-01.
References1. Sanger F, Nicklen S, Coulson AR: DNA sequencing with chain-
terminating inhibitors. Proc Natl Acad Sci USA 1977,74:5463-5467.
2. Bonetta L: Genome sequencing in the fast lane. Nat Methods2006, 3:141-147.
3. von Bubnoff A: Next-generation sequencing: the race is on. Cell2008, 132:721-723.
4. Schuster SC: Next-generation sequencing transforms today'sbiology. Nat Methods 2008, 5:16-18.
5. Johnson DS, Mortazavi A, Myers RM, Wold B: Genome-wide map-ping of in vivo protein-DNA interactions. Science 2007,316:1497-1502.
6. Bhinge AA, Kim J, Euskirchen GM, Snyder M, Iyer VR: Mapping thechromosomal targets of STAT1 by sequence tag analysis ofgenomic enrichment (STAGE). Genome Res 2007, 17:910-916.
7. Mortazavi A, Williams BA, McCue K, Schaeffer L, Wold B: Mappingand quantifying mammalian transcriptomes by RNA-Seq.Nat Methods 2008, 5:621-628.
8. Wang ET, Sandberg R, Luo S, Khrebtukova I, Zhang L, Mayr C,Kingsmore SF, Schroth GP, Burge CB: Alternative isoform regu-lation in human tissue transcriptomes. Nature 2008,456:470-476.
9. Wheeler DA, Srinivasan M, Egholm M, Shen Y, Chen L, McGuire A,He W, Chen YJ, Makhijani V, Roth GT, Gomes X, Tartaro K, Niazi F,Turcotte CL, Irzyk GP, Lupski JR, Chinault C, Song XZ, Liu Y, YuanY, Nazareth L, Qin X, Muzny DM, Margulies M, Weinstock GM, GibbsRA, Rothberg JM: The complete genome of an individual bymassively parallel DNA sequencing. Nature 2008, 452:872-876.
10. Bentley DR, Balasubramanian S, Swerdlow HP, Smith GP, Milton J,Brown CG, Hall KP, Evers DJ, Barnes CL, Bignell HR, Boutell JM, Bry-ant J, Carter RJ, Keira Cheetham R, Cox AJ, Ellis DJ, Flatbush MR,Gormley NA, Humphray SJ, Irving LJ, Karbelashvili MS, Kirk SM, Li H,Liu X, Maisinger KS, Murray LJ, Obradovic B, Ost T, Parkinson ML,Pratt MR, et al.: Accurate whole human genome sequencingusing reversible terminator chemistry. Nature 2008,456:53-59.
11. Wang J, Wang W, Li R, Li Y, Tian G, Goodman L, Fan W, Zhang J, LiJ, Guo Y, Feng B, Li H, Lu Y, Fang X, Liang H, Du Z, Li D, Zhao Y, HuY, Yang Z, Zheng H, Hellmann I, Inouye M, Pool J, Yi X, Zhao J, DuanJ, Zhou Y, Qin J, et al.: The diploid genome sequence of an Asianindividual. Nature 2008, 456:60-65.
12. Hodges E, Xuan Z, Balija V, Kramer M, Molla MN, Smith SW, MiddleCM, Rodesch MJ, Albert TJ, Hannon GJ, McCombie WR: Genome-
wide in situ exon capture for selective resequencing. NatGenet 2007, 39:1522-1527.
13. Albert TJ, Molla MN, Muzny DM, Nazareth L, Wheeler D, Song X,Richmond TA, Middle CM, Rodesch MJ, Packard CJ, Weinstock GM,Gibbs RA: Direct selection of human genomic loci by micro-array hybridization. Nat Methods 2007, 4:903-905.
14. Okou DT, Steinberg KM, Middle C, Cutler DJ, Albert TJ, Zwick ME:Microarray-based genomic selection for high-throughputresequencing. Nat Methods 2007, 4:907-909.
15. Porreca GJ, Zhang K, Li JB, Xie B, Austin D, Vassallo SL, LeProust EM,Peck BJ, Emig CJ, Dahl F, Gao Y, Church GM, Shendure J: Multiplexamplification of large sets of human exons. Nat Methods 2007,4:931-936.
16. Jurka J: Repbase Update: a database and an electronic journalof repetitive elements. Trends Genet 2000, 16:418-420.
17. Dohm JC, Lottaz C, Borodina T, Himmelbauer H: Substantialbiases in ultra-short read data sets from high-throughputDNA sequencing. Nucleic Acids Res 2008, 36:e105.
18. Hillier LW, Marth GT, Quinlan AR, Dooling D, Fewell G, Barnett D,Fox P, Glasscock JI, Hickenbotham M, Huang W, Magrini VJ, Richt RJ,Sander SN, Stewart DA, Stromberg M, Tsung EF, Wylie T, Schedl T,Wilson RK, Mardis ER: Whole-genome sequencing and variantdiscovery in C. elegans. Nat Methods 2008, 5:183-188.
19. Quinlan AR, Marth GT: Primer-site SNPs mask mutations. NatMethods 2007, 4:192.
20. Stephens M, Sloan JS, Robertson PD, Scheet P, Nickerson DA: Auto-mating sequence-based detection and genotyping of SNPsfrom diploid samples. Nat Genet 2006, 38:375-381.
21. Bhangale TR, Rieder MJ, Livingston RJ, Nickerson DA: Comprehen-sive identification and characterization of diallelic insertion-deletion polymorphisms in 330 human candidate genes. HumMol Genet 2005, 14:59-69.
22. Cronn R, Liston A, Parks M, Gernandt DS, Shen R, Mockler T: Mul-tiplex sequencing of plant chloroplast genomes using Solexasequencing-by-synthesis technology. Nucleic Acids Res 2008,36:e122.
23. Margulies M, Egholm M, Altman WE, Attiya S, Bader JS, Bemben LA,Berka J, Braverman MS, Chen YJ, Chen Z, Dewell SB, Du L, Fierro JM,Gomes XV, Godwin BC, He W, Helgesen S, Ho CH, Irzyk GP, JandoSC, Alenquer ML, Jarvie TP, Jirage KB, Kim JB, Knight JR, Lanza JR,Leamon JH, Lefkowitz SM, Lei M, Li J, et al.: Genome sequencing inmicrofabricated high-density picolitre reactors. Nature 2005,437:376-380.
24. ABI-SOLID_specifications [http://www3.appliedbiosystems.com/cms/groups/mcb_marketing/documents/generaldocuments/cms_057562.pdf]
25. Illumina-GA_specifications [http://www.illumina.com/downloads/GenomeAnalyzer_SpecSheet.pdf]
26. Bhangale TR, Rieder MJ, Nickerson DA: Estimating coverage andpower for genetic association studies using near-completevariation data. Nat Genet 2008, 40:841-843.
27. Bhangale TR, Stephens M, Nickerson DA: Automating resequenc-ing-based detection of insertion-deletion polymorphisms.Nat Genet 2006, 38:1457-1462.
28. Ball EV, Stenson PD, Abeysinghe SS, Krawczak M, Cooper DN,Chuzhanova NA: Microdeletions and microinsertions causinghuman genetic disease: common mechanisms of mutagene-sis and the role of local DNA sequence complexity. HumMutat 2005, 26:205-213.
29. Levy S, Sutton G, Ng PC, Feuk L, Halpern AL, Walenz BP, Axelrod N,Huang J, Kirkness EF, Denisov G, Lin Y, MacDonald JR, Pang AW,Shago M, Stockwell TB, Tsiamouri A, Bafna V, Bansal V, Kravitz SA,Busam DA, Beeson KY, McIntosh TC, Remington KA, Abril JF, Gill J,Borman J, Rogers YH, Frazier ME, Scherer SW, Strausberg RL, et al.:The diploid genome sequence of an individual human. PLoSBiol 2007, 5:e254.
30. Craig DW, Pearson JV, Szelinger S, Sekar A, Redman M, CorneveauxJJ, Pawlowski TL, Laub T, Nunn G, Stephan DA, Homer N, Huentel-man MJ: Identification of genetic variants using bar-codedmultiplexed sequencing. Nat Methods 2008, 5:887-893.
31. Smith DR, Quinlan AR, Peckham HE, Makowsky K, Tao W, Woolf B,Shen L, Donahue WF, Tusneem N, Stromberg MP, Stewart DA,Zhang L, Ranade SS, Warner JB, Lee CC, Coleman BE, Zhang Z,McLaughlin SF, Malek JA, Sorenson JM, Blanchard AP, Chapman J, Hill-man D, Chen F, Rokhsar DS, McKernan KJ, Jeffries TW, Marth GT,Richardson PM: Rapid whole-genome mutational profilingusing next-generation sequencing technologies. Genome Res2008, 18:1638-1642.
Genome Biology 2009, 10:R32
http://www3.appliedbiosystems.com/cms/groups/mcb_marketing/documents/generaldocuments/cms_057562.pdf
http://genomebiology.com/2009/10/3/R32 Genome Biology 2009, Volume 10, Issue 3, Article R32 Harismendy et al. R32.13
32. Coriell Institute [http://www.coriell.org]33. Li H, Ruan J, Durbin R: Mapping short DNA sequencing reads
and calling variants using mapping quality scores. Genome Res2008, 18:1851-1858.
34. National Heart, Lung and Blood Re-sequencing and Geno-typing program [http://rsng.nhlbi.nih.gov/]
Genome Biology 2009, 10:R32