
Greenhouse Effect Mechanisms Impacting Greenhouse Evidence ...

EVALUATION OF MOLECULAR MECHANISMS IMPACTING BEEF QUALITY
AND CARCASS CHARACTERISTICS
by
Sarah Anne Blatter
A thesis submitted in partial fulfillment
of the requirements for the degree
of
Master of Science
in
Animal and Range Sciences
MONTANA STATE UNIVERSITY
Bozeman, Montana
January 2018

©COPYRIGHT
by
Sarah Anne Blatter
2018
All Rights Reserved

ii
ACKNOWLEDGEMENTS
I would like to thank all of those who helped make this thesis possible. I would
like to thank Dr. Jennifer Thomson for offering me this opportunity, for her mentorship,
support and guidance throughout this study, and for being someone I could talk dairy
with. I would also like to Dr. Jane Ann Boles for her advice and support while working
on the meat science side, as well as Dr. James Berardinelli for being on my committee.
I would also like to thank my fellow graduate student, Jordan Heiber, for always
being there when I needed help working the steers, and Kate Perz, for always being
willing to feed the steers when I needed a break. Others I need to thank are Amanda
Williams, Oliva Fernandez, Danielle Peterson, Ashton Hubbard, Chad Page and Ashley
Smith, for being the friends I needed during this experience and for supporting me
through this.
I must thank my parents, who have supported me more than anyone else during
the past two years, for all of their love and for them listening when I needed to rant or
vent. I appreciated that more than they will ever know.
I would like to thank the BAIR Ranch Foundation for the funding of this project,
making it possible for me to have this opportunity.
Lastly, I need to thank Baylee, who has kept me sane during this entire process.
She kept me company during all hours of writing and was always willing to go on a hike
when I needed to get out and clear my head. I could not have done this without her.

iii
TABLE OF CONTENTS
1. INTRODUCTION ...........................................................................................................1
2. LITERATURE REVIEW ................................................................................................4
Muscle Structure ..............................................................................................................4
Z-line ........................................................................................................................4
Thin and Thick Filament ..........................................................................................4
Titin ..........................................................................................................................5
Nebulin .....................................................................................................................5
Desmin .....................................................................................................................6
Troponin-T ...............................................................................................................7
Filamin .....................................................................................................................7
Conversion of Muscle to Meat .........................................................................................8
Tenderness .......................................................................................................................9
Temperature .............................................................................................................9
pH ...........................................................................................................................10
Stress ......................................................................................................................11
Calpain and Calpastatin .................................................................................................12
Adipose Tissue ...............................................................................................................13
Breed ......................................................................................................................15
Sex..........................................................................................................................16
Diet .........................................................................................................................16
Lipogenesis ............................................................................................................16
Nutritional ....................................................................................................18
Hormonal .....................................................................................................18
Transcriptional Regulation...........................................................................19
Lipolysis .................................................................................................................20
Marbling .................................................................................................................21
3. MATERIALS AND METHODS ...................................................................................22
Cattle Selection and Management .................................................................................22
Carcass Data Collection .................................................................................................25
pH Decline .............................................................................................................26
Shear Force .............................................................................................................26
Gene Expression ............................................................................................................27
Quantification and Qualification............................................................................28
Library Preparation ................................................................................................28
Clustering and Sequencing ....................................................................................29
Quality Control ......................................................................................................30
Read Mapping to the Reference Genome ..............................................................30

iv
TABLE OF CONTENTS CONTINUED
Quantification ........................................................................................................30
Differential Expression Analysis ...........................................................................30
GO and KEGG Enrichment Analysis ....................................................................31
PPI Analysis of Differentially Expressed Genes ...................................................31
Novel Transcripts Prediction and Splicing Analysis .............................................32
SNP Analysis .........................................................................................................32
4. RESULTS AND DISCUSSION ....................................................................................33
Average Daily Gain .......................................................................................................33
Shear Force ....................................................................................................................34
Gene Expression ............................................................................................................35
Alternative Splicing ...............................................................................................36
Single Nucleotide Polymorphism and InDel .........................................................38
Novel Transcripts ...................................................................................................39
Expression Quantification ......................................................................................39
RNA-Seq Correlation.............................................................................................40
Differentially Expressed Genes (DEG) .................................................................41
GO Enrichment Analysis .......................................................................................48
KEGG Pathway Enrichment ..................................................................................54
Protein-protein Interaction .....................................................................................83
Transcription Factor Analysis ................................................................................83
5. CONCLUSION ..............................................................................................................86
REFERENCES CITED ......................................................................................................88
APPENDICES .................................................................................................................102
APPENDIX A: Differentially Expressed Genes..................................................103

v
LIST OF TABLES
Table Page
1. Shelled corn composition ...................................................................................23
2. Hay composition ................................................................................................24
3. Concentrate pellet composition..........................................................................25
4. Animal ID, live weight, ADG and quality grading ............................................33
5. Average shear force values based on age of steak .............................................34
6. Gene expression reads, quality of reads,
G and C content in reads ....................................................................................35
7a. Adipose mapping overview..............................................................................37
7b. Muscle mapping overview ...............................................................................37
8. Statistics of AS events .......................................................................................38
9. Average number of SNP and InDel ...................................................................38
10. Select to Standard significantly down
regulated adipose tissue DEGs ..........................................................................44
11. Select to Standard significantly up
regulated adipose tissue DEGs ..........................................................................44
12. Select to Choice significantly down
regulated adipose tissue DEGs ..........................................................................44
13. Choice to Standard significantly down
regulated adipose tissue DEGs ..........................................................................45
14. Choice to Standard significantly up
regulated adipose tissue DEGs ..........................................................................46

vi
LIST OF TABLES CONTINUED
Table Page
15. Standard to Choice significantly down
regulated muscle tissue DEGs ...........................................................................46
16. Standard to Choice significantly up
regulated muscle tissue DEGs ...........................................................................47
17. GO enrichment of Select to Standard
adipose tissue .....................................................................................................50
18. GO enrichment of Select to Choice
adipose tissue .....................................................................................................51
19. GO enrichment of Choice to Standard
adipose tissue .....................................................................................................52
20. GO enrichment of Standard to Choice
muscle tissue ......................................................................................................53
21. Protein-protein interactions ...............................................................................83
22. Transcription factors ..........................................................................................85

vii
LIST OF FIGURES
Figure Page
1. Diagram of alternative splicing events ..............................................................37
2. FPKM density ....................................................................................................40
3. Pearson correlation between samples ................................................................41
4. KEGG equation ..................................................................................................54
5. Select to Standard adipose tissue
AMPK signaling pathway ..................................................................................60
6. Select to Standard adipose tissue
adipocytokine signaling pathway .......................................................................61
7. Select to Standard adipose tissue
insulin signaling pathway ..................................................................................62
8. Select to Standard adipose tissue
cAMP signaling pathway ...................................................................................63
9. Select to Standard adipose tissue
PPAR signaling pathway ...................................................................................64
10. Select to Choice adipose tissue
adipocytokine signaling pathway ......................................................................65
11. Select to Choice adipose tissue
AMPK signaling pathway .................................................................................66
12. Select to Choice adipose tissue
JAK-STAT signaling pathway ..........................................................................67
13. Select to Choice adipose tissue
cAMP signaling pathway ..................................................................................67
14. Select to Choice adipose tissue
Rap1 pathway ....................................................................................................68
viii
LIST OF FIGURES CONTINUED
Figure Page
15. Choice to Standard adipose tissue
adipocytokine signaling pathway .....................................................................69
16. Choice to Standard adipose tissue
AMPK signaling pathway ................................................................................70
17. Choice to Standard adipose tissue
cAMP signaling pathway .................................................................................71
18. Choice to Standard adipose tissue
fatty acid biosynthesis ......................................................................................72
19. Choice to Standard adipose tissue
fatty acid elongation .........................................................................................73
20. Choice to Standard adipose tissue
glycolysis and gluconeogenesis pathway.........................................................74
21. Choice to Standard adipose tissue
insulin signaling pathway ................................................................................75
22. Choice to Standard adipose tissue
JAK-STAT signaling pathway .........................................................................75
23. Choice to Standard adipose tissue
PI3K-Akt signaling pathway............................................................................76
24. Choice to Standard adipose tissue
PPAR signaling pathway .................................................................................76
25. Choice to Standard adipose tissue
Rap1 pathway...................................................................................................77
26. Standard to Choice muscle tissue
AMPK signaling pathway ................................................................................78
27. Standard to Choice muscle tissue
FOXO signaling pathway ................................................................................79

ix
LIST OF FIGURES CONTINUED
Figure Page
28. Standard to Choice muscle tissue
mTOR signaling pathway ................................................................................79
29. Standard to Choice muscle tissue
PI3K-Akt signaling pathway............................................................................80
30. Asthma pathway...............................................................................................81
31. Tuberculosis pathway ......................................................................................81

x
ABSTRACT
Tenderness has been stated as being one of the most important traits for
consumers with regards to purchasing steak. However, too often there is much variation
in tenderness in steaks that grade the same quality. Research in the past has done little to
expand on the impact that genetics has on meat tenderness. This study was designed to
attempt to illuminate this question by looking at the genes being differentially expressed
between quality grades, and the pathways they impact. Angus crossbred steers (15) were
fed to the end points of Standard, Select and Choice. Intermuscular and subcutaneous
adipose tissue and muscle samples were snap frozen for gene expression analysis, as well
as a loin kept from each animal for shear force analysis. Shear force analysis showed a
significant difference between Choice and Standard graded animals (P<0.05), showing
that the Choice animals in this study were more tender than Standard. RNA extracted
from the adipose and muscle samples were sent to Novogene for RNAseq analysis. The
results of the gene expression analysis showed 4 genes down regulated and 29 up
regulated in the comparison of Select to Standard adipose tissue, with 8 genes down
regulated and 15 up regulated with Select to Choice adipose tissue. The largest difference
occurred between Standard to Choice adipose tissue with 49 genes down regulated and
113 up regulated. With regards to the muscle, 15 genes were down regulated while 20
were up regulated in the Standard to Choice. In the Select to Choice, 1 gene was down
regulated with 4 up regulated. When comparing Select to Standard, there was not a large
enough difference in genes being expressed. This study emphasized the need for
additional functional studies on the impacts of gene expression on marbling deposition.
1
INTRODUCTION
The livestock industry is one of the largest industries in the world. Agriculture is
said to occupy roughly 30% of the planets livable surface area (Thornton, 2010), while
employing at least 1.3 billion people globally (Thornton et al., 2006). The world
population is estimated to be 9.15 billion in the year 2050 (UNPD, 2008) and as a
person’s income grows so does the spending on livestock products (Steinfeld et al.,
2006), specifically with regards to meat products. Tenderness has been stated as the most
important factor affecting palatability, or a consumer’s perception of palatability, of meat
(Dikeman, 1987; Savell et al., 1987; Morgan et al., 1991; Koohmaraie, 1994; Miller et
al., 1995; Huffman et al., 1996). The issue however, is that it is unknown who all is
satisfied with their meat product, as only 0.1% of those who are unsatisfied with their
steak return the product or complain (Wilkes, 1992). Not surprisingly, Morgan (1992)
reported an instance when a supermarket chain asked customers to return all meat they
deemed unsatisfactory. Over a three year period they received $364,000 worth of meat,
with 78% of returned product being due to tenderness issues.
Platter et al. (2003) found that when consumers evaluated strip loin steaks from
different USDA Quality grade categories, variation in tenderness was observed within a
category. This suggests that quality grade alone will not guarantee tenderness. Improved
tenderness and reduction in tenderness variation are very important to maintaining or
increasing demand for beef. Consumers have stated that they are willing to spend more
money on meat that is known to be more tender (Boleman et al., 1995; Acebron and
Dopico, 2000; Miller et al., 2001; Shackelford et al., 2001).

2
One of the main issues with meat and tenderness is that the tenderness of a
particular cut of meat will not be known until it is being consumed (Koohmaraie et al.,
1994). In addition, an increase in marbling has been shown in some studies to decrease
shear force (Park et al., 2000; Kim and Lee, 2003; Li et al., 2006), while others have
shown marbling to have no impact on tenderness and the consumer’s perception of it
(Brooks et al., 2000). Improvements have been made with regards to tenderness in beef
(Guelker et al., 2013), but there is still progress to be made in producing consistent,
uniformly tender meat products, as well as determining all factors that impact tenderness.
One area that can be used to improve overall meat quality is genetics. While much
research has been completed to determine specific genes that code for tender meat, a
single gene has yet to be found that explains more than 50% of the observed variation in
the tenderness of aged beef (Koohmaraie et al., 1995). Due to this, a method needs to be
determined that will give producers a way to select for cattle that will produce
consistently more tender meat.
While advances have been made with regards to genetics and the influence they
have with regards to meat tenderness, the question of which and how specific genes
determine meat quality remains. Previous work at MSU (Engle et al., 2015) utilized a
cohort of Hereford steers from Ft. Keogh Agricultural Research station that produced
carcasses that graded Standard, Select and Choice. Longissimus lumborum muscle was
sampled at slaughter and used for gene expression analysis. Upon analysis of
differentially expressed genes, a significant number of differences were observed
between Choice and Standard carcass pools (1258 genes <0.01). A functional analysis

3
was run using DAVID bioinformatics software, which revealed differences in the
underlying pathways regulating muscle cell growth and proliferation. Biological
processes such as growth, muscle hypertrophy, protein kinase activity, and lipid
biosynthetic pathway were found to be enriched in the differentially expressed gene set.
The purpose of this study was to expand upon and confirm previous results. The
objective of this work was to provide new insight into the molecular and genetic basis of
meat quality grade.

4
LITERATURE REVIEW
Muscle Structure
The muscle is made up of many parts, primarily myofilaments, which contain
thousands of myofibrils (Greaser, 1991). These myofibrils are made up of repeating
sarcomeres (Bailey, 1972), which is considered the basic contractile unit of myofibrils
(Clark et al., 2002); the myofibril is made up of many different parts: the Z-line, I-band,
A-band, M-line, titin, nebulin, myosin, actin, alpha actinin, and the thin and thick
filaments.
Z-line
The Z-line is the lateral edge of the sarcomere, and is also where titin, nebulin,
and the thin filaments are attached (Clark et al., 2002). Due to the Z-line being an
“anchor”, they are the primary channels of force generated by a contraction.
Thin and Thick Filament
Thin filaments are made up of an actin double helix (Marston and Smith, 1985),
with nebulin, tropomyosin and the troponin complex along its length and capped at the
end by tropomyosin and CapZ. They are attached in the Z-line, extends past the I-band
and on towards the middle of the sarcomere. Once it reaches the A-band, the thin
filaments interdigitate with the thick filaments (Clark et al., 2002). Troponin, which is
connected to tropomyosin, blocks the myosin head binding site on the actin. When it is
activated by calcium, tropomyosin moves, allowing myosin to bind to actin. In order for
the myosin head to release actin, ATP needs to bind to the myosin head, causing the

5
reduction in the binding constant between myosin and actin and thus its release. The ATP
is then hydrolyzed to ADP and inorganic phosphate (Geeves and Holmes, 1999).
Titin
While titin is the largest protein currently known in mammals and is the third
most abundant (Lonergan et al., 2010), it was one of the last to be discovered. It wasn’t
until Wang et al. (1979) and Maruyama et al. (1977) looked at the insoluble residue that
was often discarded. It was then discovered, along with nebulin, and has a major role in
the muscle. Titin extends from the Z-line to the M-band, and is highly modular, with
90% of its mass consisting of repeating immunoglobulins and fibronectin-III domains
(Kontrogianni-Konstantopoulos et al., 2009). The ends of titin have opposing polarity,
overlapping in both the Z-lines and M-bands, forming a continuous system
(Kontrogianni-Konstantopoulos et al., 2009). Titin has many structural properties that are
responsible for making it so important in muscle- 1) titin in the I-band region have elastic
properties, allowing the “spring” to move the sarcomere to its resting size; 2) the
repeating nature of titin, as well as its early assembly during myofibrillogenesis and the
way it interacts with other components make it a candidate as a sarcomeric template and
stabilizer; 3) the C-terminal region on titin has a Ser/Thr kinase domain, suggesting that
titin may play a part in signaling pathways (Clark et al., 2002).
Nebulin
Another giant protein, nebulin was discovered about the same time by Wang et al.
(1979). It binds along the length of the thin filaments (Kontrogianni-Konstantopoulos et
al., 2009), and is made up of a C-terminal that is moderately bound to the Z-lines, as well

6
as an N-terminal that extends towards the capped end of the thin filament (Clark et al.,
2002). It comes in contact with the capping proteins on the thin filaments, as well as
having its C-terminal bind to titin. Due to nebulin’s rigid structure, it has been suggested
as a candidate as a molecular ruler for determining the length of the thin filaments (Clark
et al., 2002). Titin is also thought to help bind nebulin to the z-line (Kontrogianni-
Konstantopoulos et al., 2009).
Desmin
Desmin is a part of the intermediate filaments, and is thought to surround the Z-line
and connect adjacent myofibrils at the level of the Z-line (Huff-Lonergan and Lonergan,
1999). It also is thought to connect the peripheral myofibrils to the sarcolemma
(Richardson et al., 1981). Desmin is known to be degraded early postmortem (Hwan and
Bandman, 1989; Huff-Lonergan et al., 1996; Huff-Lonergan and Lonergan, 1999), with
studies showing a quicker degradation of desmin in samples with low shear force and a
higher water holding capacity, than in samples with a higher shear force and lower water
holding capacity (Huff-Lonergan et al., 1996; Huff-Lonergan and Lonergan, 1999; Zhang
et al, 2006). Researchers have reported that at least half of desmin has undergone
proteolysis by 72 hours postmortem (Taylor et al., 1995), with others reporting up to 94%
of desmin being degraded by 15 days postmortem (Veiseth et al., 2004). Due to desmin
connecting adjacent myofibrils together as well as connecting myofibrils to the
sarcolemma, the degradation of desmin could compromise the structure of the muscle
fiber (Robson, 1995; Huff-Lonergan and Lonergan, 1999).

7
Troponin-T
Troponin-T is the subunit of Troponin that connects the complex to tropomyosin,
one of the many thin filament components which has been linked to regulation of striated
muscle contraction (Pearlstone and Smillie, 1982; Huff-Lonergan et al., 1996). It has
been shown to be prone to postmortem degradation (Penny and Dransfield, 1979; Huff-
Lonergan et al.,1996). Troponin-T has been shown to degrade more rapidly in beef that is
more tender than in beef that is less tender (Koohmaraie et al., 1984; Ho et al., 1994;
Huff-Lonergan et al.,1996).
Filamin
Filamin is thought to be located around the outer portion of the Z-line (Price et al.,
1994). During in vivo conditions, it exists as a dimer with two identical 250 kDa
subunits, which attach at the C terminal, forming a V-shaped molecule. The V-shape
structure of filamin makes it ideal to cross-link actin filaments (Huff-Lonergan et al.,
1999). During postmortem aging, calpains have been shown to break down filamin
resulting in the 250 kDa subunit being broken into a 240 kDa and 10 kDa subunits
(Davies et al., 1978). This cleavage occurs near the C-terminal domain, this breakdown
hinders the ability of filamin to cross-link actin filaments, but not its ability to bind to
actin (Huff-Lonergan et al., 1999). It has been shown to be degraded postmortem, as
early as three days in tender samples, and as late as fourteen days postmortem in less
tender samples (Huff-Lonergan et al., 1996). It also appears to degrade slower than titin
and nebulin (Huff-Lonergan and Lonergan, 1999).
8
Conversion of Muscle to Meat
The time between death and rigor mortis varies between animals, and is
determined by two considerations- 1) the pH of the muscle at the moment of death
(which is determined by activity immediately preceding death), and 2) the glycogen
reserve of the muscle (Bate-Smith and Bendall, 1947). After exsanguination, metabolism
switches from aerobic to anaerobic due to a lack of oxygen, causing lactic acid to be
produced. The lack of blood flow to carry lactic acid away results in a drop in muscle pH
(Savell et al., 2005). During this period, few rigor bonds form, resulting in the muscle
being extensible due to glycogen being readily available to produce ATP (Przybylski and
Hopkins, 2015). As long as there is sufficient glycogen present for the synthesis of ATP
the muscle does not pass into rigor (Whitaker, 1960). A study by Bodwell et al. (1965)
showed glycogen decreased up to 54% within the first 12 hours post mortem, to less than
3% 48 hours post mortem. Furthermore, lactic acid increased almost 3.5 times in the
initial 6 hours post mortem. Creatine phosphate is a rapid method of restoring ATP by
phosphorylating ADP to ATP. The presence of ATP in the muscle causes the myosin
head to release actin and prevents permanent cross-bridge formation. After creatine
phosphate has been depleted, the levels of ATP decline rapidly, resulting in the loss of
ability of myosin to separate from actin. This causes permanent bonds to form between
myosin and actin, leading to the shortening of the sarcomere.

9
Tenderness
As was stated previously, tenderness has been rated as the most important
characteristic of meat consumers eat (Dikeman, 1987; Savell et al., 1987; Morgan et al.,
1991; Koohmaraie, 1994; Miller et al., 1995; Huffman et al., 1996). With that being said,
there are many factors that can influence the tenderness of meat. Of those factors, the
ones that tend to have the biggest influence are temperature, pH levels, and the amount of
stress at the time of slaughter.
Temperature
It has long been established that temperature can play an important part in the
tenderization of meat (Locker and Hagyard, 1963; Moeller et al., 1976; Parrish et al.,
1973; Pierson and Fox, 1976). Temperature can have 3 main outcomes of the meat: cold
shortening, thaw rigor, and heat rigor. Cold shortening occurs when a carcass goes
through a rapid decrease in temperature prior to the onset of rigor, reaching temperatures
below and above 0°C. When this occurs, the sarcoplasmic reticulum is incapable to
function correctly and is unable to bind calcium as it should, resulting in an over-
abundance of calcium in the sarcoplasm (Savell et al., 2005). Because ATP is still
available, the muscle continues to contract resulting in shortening of rigor beyond what
would normally occur, for all intents and purposes eliminating the I-band (Locker and
Daines, 1976). This can result in the sarcomeres being shortened up to 35% of their
normal length (Locker and Hagyard, 1963). This phenomenon is referred to as cold
shortening and results in the meat being tough.

10
When a carcass is frozen pre-rigor, it too has an impact on the quality of the meat.
This is referred to as thaw rigor. When the frozen muscle thaws, the fibers in the muscle
contract due to a sudden release of calcium into the sarcoplasm. The outcome is the
muscle fibers shortening 60-80% of its original length, as well as resulting in the muscle
being tough (Aberle, 2001). The last way temperature can influence tenderness is heat
rigor. This is arises when a muscle is maintained at high temperatures, above 35°C and as
high as 50°C. The high temperatures result in a rapid depletion of ATP, causing the
muscle fibers to shorten and for rigor to set in early (Warner et al., 2014). When heat
rigor occurs, the sarcomeres shorten up to 30% of their normal length (Lonergan et al.,
2010).
pH
It has been shown that, similar to temperature, early post-mortem pH plays an
important role in the rate of meat tenderization (OHalloran, Troy, & Buckley, 1997). The
overall rate of pH fall is determined by the rate of ATP-turnover (Bendall, 1978;
OHalloran et al., 1997). Due to this, there is much variation in pH decline due to the
amount of free calcium available at the time of slaughter.
In a normal animal that has not been abnormally stressed, the pH in the muscle
decreases from 7.0 upon slaughter to approximately 5.3-5.8 (Smulders et al., 1992).
However, Silva et al. (1999) found that meat with a normal pH was significantly (p<0.05)
tougher than moderate dark, firm and dry meat (5.8-6.2), as well as dark, firm and dry
(DFD) meat (6.2-6.7). Meat that is often referred to as dark, firm and dry tends to be
darker in color, is more susceptible to bacterial spoilage, and has reduced flavor. This

11
occurs due to the glycogen stores being depleted prior to harvest, which will result in less
lactic acid building up post-mortem, making it not possible for the pH to drop as it should
(Lonergan et al., 2010).
Stress
Whenever an animal perceives something as not normal or unsafe, that animal is
stressed. Stott (1981) defined stress as an environmental condition that is detrimental to
the well-being of an animals. When stress occurs, it shifts the body away from
homeostasis and the degree of the perceived threat will determine how far away from the
steady state the body will go (Lee, 1965). When being taken from feedlot to the plant,
animals undergo many different stresses: deprivation of food and water, noises,
unfamiliar odors, vibration and changes to acceleration, extremes of temperature and
humidity, close confinement, overcrowding and the biggest one, the breakdown of social
groupings (P. D. Warriss, 1990; Immonen et al., 2000). When stress occurs, epinephrine
is released, which acts to accelerate glycogen metabolism (Ashmore et al., 1973). This
results in there being less glycogen available for the body to break down post-mortem,
causing the carcass to have a higher ultimate pH than non-stressed animals (Grandin,
1980). The end result is an animal that is referred to as a dark cutter, which results in a
carcass that tends to have a reduced shelf life (Grandin, 1980; Mcveigh et al., 1980;
Lacourt and Tarrant, 1985), increased spoilage (Gill & Newton, 1981; Nicol, Shaw, &
Ledward, 1970; P. D. Warriss, 1990), altered color (Lawrie, 1958; Bartos et al., 1993;
Kreikemeier et al., 1998; Mounier et al., 2006), higher ultimate pH (Ashmore et al.,
12
1973), increased water-holding capacity (Apple et al., 2005; Zhang et al., 2005), and is
less palatable (Dransfield, 1981; Viljoen et al., 2002; Wulf et al., 2002).
Calpain and Calpastatin
A key element in the transitioning of muscle to tender meat is the weakening of
myofibers (Ouali et al., 2006). When considering the system responsible for the
tenderization of meat, three characteristics must be met before the system is considered a
candidate: 1.) be located within the skeletal muscle; 2.) have access to the substrate; 3.)
have the ability to degrade the same proteins that are degraded during post mortem
storage. The proteolytic systems that have the possibility of being involved in post-
mortem degradation are: 1.) the lysosomal, cathepsins; 2.) the multicatalytic proteinase
proteosomes; and 3.) the calpains (Koohmaraie, 1994). Out of the three suggested, the
system generally accepted as the cause of this weakening is the calpain proteolytic
system (Veiseth and Koohmaraie, 2005). The calpain system is made up of three main
parts: µ-calpain, m-calpain, and calpastatin which is the endogenous inhibitor of the
calpains (Croall and Demartino, 1991; Shackelford et al., 1994). Whipple et al. (1990)
measured calcium-dependent protease (CDP)-I, -II, and CDP inhibitor (INH), as well as
Warner-Bratzler shear force and other tenderness-related factors in Bos taurus and Bos
indicus crossbred cattle. They reported that, out of the factors they measured, INH
activity was the only trait to have a significant residual correlation with the 14 day WBS
and myofibril fragmentation indices. There have also been studies that indicate the CDP
mechanism being activated by infusing CaCl² improved tenderness (Koohmaraie et al.,
13
1989; Koohmaraie et al., 1990), while inhibiting CDP by infusing ZnCl² caused no
change (Koohmaraie, 1990). Together, these studies give support to the belief of the CDP
system’s involvement in postmortem tenderization (Whipple et al., 1990). However,
Shackelford et al. (1991) performed a similar study and the results were contrary to that
of Whipple et al. (1990), showing none of the traits correlating significantly with the 14
day Warner-Bratzler shear force. Though there is evidence and most accept that the
calpain proteolytic system is responsible for improvement in meat tenderness, the exact
process is unknown.
Adipose Tissue
Adipocytes, which are also known as fat cells, are one of many ways energy is
stored in the body. When an animal reaches market weight, roughly 80-90% of total body
energy is stored as adipose tissue (Walton and Etherton, 1986), while the adipose tissue
itself is made up of 70-90% fat, 5-20% water and roughly 5% connective tissue
(Nurnberg et al., 1998). Adipocytes originate from mesenchymal stem cells (Scanes,
2003; Du et al., 2010) that reside in the vascular stroma of adipose tissue, as well as in
the bone marrow (Tang and Lane, 2012). The exact pathway that causes adipocytes to
differentiate from mesenchymal cells to preadipocytes is not fully understood. However,
it is believed that transcription factors Wnt and hedgehog ligands play a part.
When preadipocytes arrive at the growth arrest step of the cell cycle,
differentiation to adipocytes begins with a “cocktail” of inducers, including a high level
of insulin (Macdougald and Lane, 1995) and dexamethasone. These inducers activate the

14
IGF1-, glucocorticoid- and cAMP-signaling pathways. After a delay of ~16 to 20 hours
after induction, preadipocytes reenter the cell cycle (Student et al., 1980; Davis and Zur
Nieden, 2008) and go through many rounds of mitosis, after which the cells exit the
cycle, lose their fibroblastic morphology, accrue cytoplasmic triglyceride and acquire the
appearance and metabolic features of adipocytes (Green and Kehinde, 1974; Student et
al., 1980).
In cattle, the fat cell diameter of subcutaneous fat tissue grows rapidly up to 12
months. After this growth is continued but at a reduced rate up to 2 years of age (Wegner
et al., 1998). Cianzio et al. (1985) saw that, as age increased in crossbred steers fed the
same growing-finishing diet, the number of adipocytes/gram of adipose tissue decreased
up to 15 months of age in six different adipose depots. From 15 to 19 months, the rate of
decrease slowed or remained constant. However, the diameter of adipocytes increased up
to 15 months of age in the steers, with a slower increase from 15 to 17 months of age.
Adipose tissue has been recognized as a major regulator of systemic metabolism,
extending beyond energy buffering (Ouchi et al., 2011). This is done by secreting
specialized proteins that exert autocrine, paracrine and endocrine functions. These
proteins, known as adipokines, are produced by cellular components of adipose tissue,
such as adipocytes and cells of the stromal vascular fraction, including immune, vascular
and adipocyte progenitor cells (Jacobi et al., 2006; Contreras et al., 2017). There are
currently over 300 secretory products, though the list is constantly expanding (Lehr et al.,
2012). Two of the main proteins are adiponectin and leptin which are produced almost
exclusively by adipose tissue; while others, such as resistin and retinol binding protein 4,

15
are produced by adipose tissue and the liver. Similarly, other secretory products, such as
interleukin-6 (IL-6) and tumor necrosis factor alpha (TNFα) are produced by adipocytes,
as well as resident immune cells in adipose tissue (Contreras et al., 2017).
Adiponectin is known as ACRP30, and is primarily secreted by adipocytes, but is
also produced by cardiomyocytes and skeletal muscle (Jortay et al., 2012). It is known to
improves insulin sensitivity and promote lipogenesis in adipocytes, and fatty acid β-
oxidation in myocytes and hepatocytes (Stern et al., 2016).
Leptin, which was one of the first adipokines characterized in mammals, is
expressed not only by adipose tissue, but also by myocytes, mammary gland and gastric
mucosa epithelial cells (La Cava and Matarese, 2004), and is known to decrease
lipogenesis while increasing lipolysis and fatty acid oxidation (William et al., 2002).
Regulated by genetic, nutritional and environmental factors (Harper and Pethick, 2004),
adipose tissue development and deposition can be influenced by breed, sex and diet.
Breed
Genetic-based differences in intramuscular fatty acid composition of longissimus
muscle have been noted by many researchers (Robelin, 1986; Enser, 1991; Ender et al.,
1997). A study by Huerta-Leidenz et al. (1993) reported differences in fatty acid
composition of subcutaneous adipose tissue between Hereford and Brahman cows.
Average fat thickness was 1.7 and 1.3 cm, respectively. Herefords had a higher amount of
saturated fatty acids and a lower percentage of mono- and polyunsaturated fatty acids in
subcutaneous adipose tissue when compared to Brahman. Zembayashi and Nishimura

16
(1996) proposed, based off of their studies with different Japanese Black breeds, that
leaner steers had more saturated fatty acids in subcutaneous and intramuscular fat.
Sex
When animals have been harvested at equal slaughter weights, intact males are
typically leaner than females. A study done in pigs showed that intact males tend to be
leaner than gilts which in turn are leaner than male castrates (Enser, 1991), while the
relative concentration of polyunsaturated fatty acids and linoleic acid decreases in the
order of intact males > females > male castrates, whereas the saturated fatty acid
percentage increases (Nurnberg and Ender, 1989). These differences in fatty acids have
been seen in cattle (Enser, 1991; Malau-Aduli et al., 1998), pigs (Cameron and Enser,
1991), and lambs (Nurnberg et al., 1996) and are caused by the negative relationship
between concentrations of fate and polyunsaturated fatty acids in the carcass.
Diet
The level and the chemical composition of feed can affect fat deposition in
animals (Nurnberg et al., 1998). A study by Wegner and Matthes (1994) showed that
when Herefords and Black Pied steers were managed under extensive conditions to
achieve almost linear growth from 140 to 500 days of age, carcasses from Herefords had
lower muscle fibers diameters and smaller adipocytes than Black Pied animals.
Lipogenesis
Lipogenesis refers to the synthesis of fat. In cattle, this mainly occurs in adipose
tissue, though some does also occur in the liver. It occurs due to the synthesis of fatty

17
acids which leads to the synthesis of triglycerides. This process occurs differently in
ruminants than it does in other species. It is short chain fatty acids that are the source of
energy for ruminants, rather than glucose which is commonly the energy source in other
mammals. Lipogenesis can also refer to both the hypertrophy and hyperplasia of adipose
tissue.
Fatty acid synthesis takes places in the cytoplasm with the help of ATP, NADPH,
biotin, bicarbonate, and Mn++. The main sites for this pathway are the liver, kidneys,
brain, lungs, mammary glands, and adipose tissue. Acetyl-CoA is the two-carbon
building block molecule which is added to malonyl-CoA, formed via carboxylation of
acetyl-CoA. The enzyme catalyzing this reaction is acetyl-CoA carboxylase.
The first step is transfer of acetyl-CoA to the cysteine-SH group by acetyl
transacylase and malonyl-CoA on 4'-phosphopantetheine of ACP by malonyl
transacylase. These two sites belong to different units of the dimer enzyme complex
called fatty acid synthase.
In the second step, the acetyl group joins the malonyl residue by 3-ketoacyl
synthase and CO2 is released, yielding 3-ketoacyl. 3-Ketoacyl is reduced in third step
utilizing NADPH and 3-ketoacyl reductase, forming 3-hydroxyacyl. The fourth step is
dehydration catalyzed by hydratase. This step creates a double bond between C2 and C3.
This bond is reduced by enoyl reductase enzyme. The second reduction also needs
NADPH. Finally acyl-S enzyme is formed. This acyl residue is then shifted to the empty
cysteine-SH group and a new malonyl residue arrives at –SH of 4'-phosphopantetheine.

18
The reactions are repeated until the desired length is achieved. Thioesterase releases the
completed fatty acid by hydration.
Three main factors affect lipogenesis: nutrition, hormones, and genetics.
Nutritional. Lipogenesis is extremely responsive to the diet of an animal and the
changes that occur in the diet. A diet that has a large amount of carbohydrates stimulates
lipogenesis in both the liver as well as adipose tissue. This results in high levels of
triglycerides in the plasma postprandial (Kersten, 2001). However, a diet that contains
many polyunsaturated fatty acids causes a decrease in lipogenesis by suppressing gene
expression in the liver, including fatty acid synthase, stearoyl-CoA desaturase, and S14, a
protein that is known to be under thyroid hormone control (Jump et al., 1994). Fasting
can also cause a decrease in lipogenesis in adipose tissue as well as an increase in
lipolysis. However, in the liver fasting results in a large increase in the number of fatty
acids arriving and an increase in triglyceride synthesis occurring to provide energy for the
body. This can result in a mild case of fatty liver (hepatosteatosis) (Kersten et al., 1999).
Hormonal. Insulin is widely acknowledged as having the most impactful role on
lipogenesis with regards to a hormonal factor (Kersten, 2001). When the amount of
glucose the animal intakes is increased, this results in an increase in glucose taken up by
the adipose cell via recruitment of the glucose transporters to the plasma membrane,
along with activating lipogenic and glycolytic enzymes via covalent modification
(Kersten, 2001). The result of this is insulin powerfully stimulating lipogenesis. It does so
by the binding of insulin to its receptor at the surface of the cell, resulting in the

19
activation of tyrosine kinase, triggering a large downstream effect due to tyrosine
phosphorylation (Lane et al., 1990; Nakae and Accili, 1999; Kersten, 2001).
Growth hormone (GH) is another hormone that has a large impact on lipogenesis.
It reduces lipogenesis, specifically in adipose tissue. In swine, porcine somatotropin
(pST) has been shown to increase muscle growth by roughly 50%, while simultaneously
decreasing adipose tissue accumulation up to 70% (Etherton, 2000). This decrease in
lipogenesis occurs through two main methods. The first being the decrease of insulin
sensitivity, resulting in the down regulation of fatty acid synthase expression in adipose
tissue (Yin et al., 1998), though the details of the mechanism of this is unknown. The
second possible way that GH decreases lipogenesis is by phosphorylating the
transcription factors Stat5a and 5b, which have been shown to be essential for growth
hormone function (Teglund et al., 1998). This has been shown to decrease fat
accumulation in adipose tissue in a knock out model (Teglund et al., 1998).
Lastly, another hormone that has an unfavorable impact on lipogenesis is leptin. It
stimulates the release of glycerol from adipocytes (Siegrist-Kaiser et al., 1997) by
stimulating fatty acid oxidation as well as by inhibiting lipogenesis (Bai et al., 1996;
Wang et al., 1999). The inhibiting of lipogenesis occurs due to the down regulation of the
genes associated with fatty acid and triglyceride synthesis (Soukas et al., 2000). It has
been shown that rats infused with leptin into the mediobasal hypothalamus have a
reduction in white adipose tissue lipogenesis (Buettner et al., 2008).
Transcriptional Regulation. Many studies have shown that the effects nutrition
and hormones have on the expression of lipogenic genes are mostly mediated by sterol

20
regulatory element-binding proteins (SREBPs), which are transcription factors that
regulated the expression of genes related to fatty acid and cholesterol metabolism (Hua et
al., 1993; Tontonoz et al., 1993; Yokoyama et al., 1993). SREBPs belong to a group of
basic helix-loop-helix leucine zipper (bHLH-Zip) transcription factors, of which there are
three types: SREBP-1a, SREBP-1c, and SREBP-2. Research has shown that SREBPs
directly activate the expression of more than 30 genes dedicated to the synthesis and
uptake of cholesterol, fatty acids, triglycerides and phospholipids, as well as the NADPH
cofactor required to synthesize these molecules (Brown and Goldstein, 1997; Horton and
Shimomura, 1999; Edwards et al., 2000; Sakakura et al., 2001; Horton, Goldstein and
Brown, 2002). At normal levels of expression, SREBP-1c favors fatty acid synthesis
while SREBP-2 favors cholesterol synthesis (Brown and Goldstein, 1997; Horton,
Goldstein and Brown, 2002).
Lipolysis
Lipolysis, or the breakdown of fat, can be divided into two main categories –
basal and demand lipolysis. In humans and rodents, basal lipolysis is determined by
adipocyte size and dietary triacylglycerol (Kosteli et al., 2010; Magkos et al., 2016),
while demand lipolysis is regulated hormonally in response to energy demands
(Contreras et al., 2017). However, independent of the type of lipolysis, triacylglycerol
(TAG) in the adipocyte lipid droplet are broken down by the action of three different
lipases – adipose triglyceride lipase (ATGL), hormone sensitive lipase (HSL), and
monoglyceride lipase (MGL). ATGL is the primary regulator of basal lipolysis in
monogastric animals, acting exclusively on TAG (Contreras et al., 2017). HSL, which is

21
considered the rate-limiting factor for demand lipolysis (Miyoshi et al., 2008; Lass et al.,
2011) hydrolyzes several lipid substrates, including TAG, diglycerides, monoglycerides
and cholesterol esters (Lafontan and Langin, 2009). When it is activated by protein
kinase A (PKA), HSL associates with fatty acid binding protein 4 (FABP4) to form a
complex that localizes on the lipid droplet. MGL is what completes the lipolytic
pathway, acting exclusively on monoglycerides.
Complete activation of the lipolytic process requires not only the activation of
ATGL and HSL, but also the phosphorylation of perilipin-1 (PLIN1), a protein that
protects the lipid droplet from the lipolytic activity of HSL. PLIN1 is phosphorylated by
PKA to allow HSL interaction with TAG (Contreras et al., 2017).
Marbling
As an animal grows, it transitions from depositing muscle to depositing fat,
starting with kidney, pelvic, heart (KPH) fat. This transition begins partly due to a
decrease in growth hormone, which promotes protein synthesis. After a predetermined
amount of KPH fat has been deposited, subcutaneous fat will begin to be deposited in
larger amounts. This will eventually transition to intermuscular fat, and lastly
intramuscular fat, what is commonly known as marbling. Marbling is important as it can
play a part in tenderness, as well as palatability (Blumer, 1963; Pearson, 1966; Smith et
al., 1985; Wheeler, Cundiff, and Koch, 1994).

22
MATERIALS AND METHODS
Data collected was in compliance with the Montana State University Agriculture Animal
Care and Use Committee, number 2015-AA17.
Cattle Selection and Management
Fifteen steers from the Red Bluff Research Ranch were selected at weaning
based on weight and date of calving, the parameters being ±22.7 kgs, with birthdates
within a 14 day window. They were then relocated to the Montana State University
Bozeman Area Research and Teaching Farm and placed in one pen together in a feedlot.
At the start of the study, the steers weighed an average of 314.79 kgs. They were
implanted once with Synovex One Feedlot in the back of the ear per Standard feedlot
protocol and were weighed every 14 days once on full feed. They were fed an ad libitum
diet of hay for 2 weeks to acclimate steers to pens, and were then started on a 6 week step
up program to build up to the full ration, which was a diet of 75% shelled corn (table 1),
18% hay (table 2), and 7% of finisher pellet, produced by CHS (table 3), fed in a bunk
daily. Bunks were checked twice daily to determine if more feed was needed based on the
amount of feed left in the bunk since the last feeding. The pen was scraped and bedded as
needed with straw, with feed and water checked twice daily. Steers had ad libitum access
to feed and water.

23
Table 1. Shelled corn composition
Dry Weight Units Reporting Limit
Protein (Crude) 9.55 % 0.20
Fat (Crude) 3.6 % 0.10
Fiber( acid detergent) 2.2 % 0.5
Ash 1.98 % 0.10
Total digestible nutrients 91.4 % 0.1
Net Energy (Lactation) 0.96 Mcal/lbs 0.01
Net Energy (Maint.) 1.01 Mcal/lbs 0.01
Net Energy (Gain) 0.67 Mcal/lbs 0.01
Digestible Energy 1.83 Mcal/lbs 0.01
Metabolizable Energy 1.72 Mcal/lbs 0.01
Sulfur (total) 0.1 % 0.01
Phosphorus 0.41 % 0.01
Potassium 0.46 % 0.01
Magnesium 0.16 % 0.01
Calcium 0.03 % 0.01
Sodium n.d. % 0.01
Iron 22 ppm 5.0
Manganese 6.7 ppm 1.0
Copper 2.8 ppm 1.0
Zinc 24.3 ppm 1.0

24
Table 2. Hay composition
Dry Weight Units Reporting Limit
Protein (Crude) 17 % 0.20
Fat (Crude) 1.8 % 0.10
Fiber( acid detergent) 36.4 % 0.5
Ash 10.1 % 0.10
Total digestible nutrients 61.8 % 0.1
Net Energy (Lactation) 0.63 Mcal/lbs 0.01
Net Energy (Maint.) 0.62 Mcal/lbs 0.01
Net Energy (Gain) 0.35 Mcal/lbs 0.01
Digestible Energy 1.24 Mcal/lbs 0.01
Metabolizable Energy 1.14 Mcal/lbs 0.01
Sulfur (total) 0.24 % 0.01
Phosphorus 0.36 % 0.01
Potassium 2.17 % 0.01
Magnesium 0.25 % 0.01
Calcium 1.91 % 0.01
Sodium 0.07 % 0.01
Iron 476 ppm 5.0
Manganese 61.2 ppm 1.0
Copper 6.4 ppm 1.0
Zinc 92.5 ppm 1.0

25
Table 3. Concentrate pellet composition
Dry Weight Units Reporting Limit
Protein (Crude) 42.2 % 0.20
Fat (Crude) 3.13 % 0.10
Fiber( acid detergent) 9.4 % 0.5
Ash 29.6 % 0.10
Total digestible nutrients 56.6 % 0.1
Net Energy (Lactation) 0.57 Mcal/lbs 0.01
Net Energy (Maint.) 0.56 Mcal/lbs 0.01
Net Energy (Gain) 0.32 Mcal/lbs 0.01
Digestible Energy 1.13 Mcal/lbs 0.01
Metabolizable Energy 0.99 Mcal/lbs 0.01
Sulfur (total) 0.64 % 0.01
Phosphorus 1.26 % 0.01
Potassium 2.31 % 0.01
Magnesium 0.33 % 0.01
Calcium 9.29 % 0.01
Sodium 1.19 % 0.01
Iron 214 ppm 5.0
Manganese 551 ppm 1.0
Copper 325 ppm 1.0
Zinc 1580 ppm 1.0
Carcass Data Collection
The steers were randomly allocated to one of three endpoints based off of growth
rate and body weight, the endpoints being 431kg, 522kg, and 612kg. The aim of these
weight-based endpoints was to produce carcasses grading Standard, Select, and Choice.
The animals were harvested at Pioneer Meats in Big Timber, Montana. Carcasses were
stored for 24hrs in a 40°C cooler prior to loin removal for use in determination of shear
force. A stab probe was used to collect pH decline measurements at 1, 2, 3, 6, 12, and 24
hours postmortem. Intermuscular and subcutaneous adipose tissue samples were taken at
time of harvest and were homogenized while longissimus thoracis muscle samples were

26
taken and were snap frozen for later gene expression analysis. Twenty-four hours after
slaughter, loin samples were collected, cut into 2.54 centimeter steaks that were aged 1,
4, 7, 14, and 21 days postmortem. The steaks were used to evaluate shear force.
pH Decline
The decline of pH was measured in the longissimus thoracis, approximately 6cm
from the hip bone, using an Accumet Portable AP110 and AP61 meter, Fisher Scientific
Orion 8163BNWP electrode. The meter was standardized with buffers at pH 7 and 4.
Measurements were taken hourly up to 8 hours, then at 12, and 24 hours postmortem.
Shear Force
Steaks were taken from a -20° C freezer and placed in a 2°C cooler approximately
24 hours prior to cooking. They were blotted, tagged, weighed, then had a single copper
constantan thermocouple (OMEGA Engineering, INC, P.O. Box 4047, Stamford,
Connecticut) placed in the center. They were then placed on an aluminum-covered broiler
pan and placed in a conventional oven 10.16 cm below the heating element. Steaks were
then cooked on broil until reaching an internal temperature of 35°C, at which point they
were removed from the oven, rotated then returned to the oven and cooked on the other
side until reaching an internal temperature of 70°C. They were then removed from the
oven and set on a tray to cool and then placed into labeled Ziploc® bags to cool in a 2°C
fridge. After cooling for a minimum of 45 minutes, steaks were taken from the cooler,
blotted with towels and weighed. A minimum of 5 samples were taken parallel to the
muscle fiber, resulting in square samples that 1.27 x 1.27cm. The samples were then

27
sheared using a TMS 30 Food Texturometer fitted with a Warner-Bratzler shear
attachment. The average of the samples sheared was used for statistical analysis.
Gene Expression
Frozen muscle samples and homogenized intramuscular and intermuscular
adipose tissue samples underwent RNA extraction using a Qiagen RNeasy Plus Universal
Midi kit. Three grams of tissue were placed into 5mL of Qiazol Lysis Reagent in a 15mL
tube. Samples were then homogenized using a Polytron tissue homogenizer for 20
seconds. After each sample, the polytron probe was cleaned with a three-step washing
using detergent, water and RNase away. After adding 500µL of gDNA Eliminator, the
samples were shaken for 15 seconds, 1 mL of chloroform was added and samples were
shaken for an additional 15 seconds and then were allowed to rest for 3 minutes. The
samples were then centrifuged at 3250 rotations per minute (rpm) at 4°C for 30 minutes.
Approximately 3 mL of the clear aqueous solution was added into a new tube, which then
had one volume of 70% ethanol added, and was then vortexed for 5 seconds. Four mL
was then transferred into a spin column, and was then centrifuged for 5 minutes at 3250
rpms and 18°C, and the flow through was disposed of. The other 3-4 mL of sample was
then placed in the spin column and was centrifuged for 5 minutes at 3250 rpms and 18°C,
with the flow through being disposed of. Then the sample was washed by adding 4 mL of
buffer RWT to the spin column, which was then centrifuged for 5 minutes at 3250 rpms
at 18°C. The resulting flow through was disposed of, with 3 mL of RPE buffer being
added to the spin column. The tube was then centrifuged again for 5 minutes at 3250 rpm
at 18°C. Flow through was disposed of, and 2 mL of buffer was added to the spin
28
column. Tubes were spun for 5 minutes at 3250 rpm at 19° C. The spin column was then
moved to a new tube, with 250mL of RNase free water added to the spin column. It was
left to sit for 1 minute to elute before being placed back into the centrifuge for 5 minutes
at 3250 rpm at 21°C. The flow-through was pipetted into an Eppendorf tubes and was
stored in a -80°C freezer until pulled for quality analysis before being sent to Novogene,
located in Sacramento, CA, for gene expression analysis.
Due to RNA degradation in some samples, we were unable to utilize samples
from each adipose depot from each animal. The highest quality RNA sample from each
animal was sent for further analysis, as well as sending random samples from each depot
for 3 samples to verify that the adipose samples, regardless of depot, had a sample
correlation of great than 0.8.
Quantification and Qualification
After arriving at Novogene, RNA degradation and contamination of the samples
was monitored on 1% agarose gels. The purity was checked using the NanoPhotometer
spectrophotometer (IMPLEN, CA, USA). Concentration of the RNA was measured using
Qubit® RNA Assay Kit in Qubit® 2.0 Flurometer (Life Technologies, CA, USA).
Integrity of the RNA was assessed using the RNA Nano 6000 Assay Kit of the
Bioanalyzer 2100 system (Agilent Technologies, CA, USA).
Library Preparation
A total of 3 µg of RNA per sample was taken from total sample as input material
for RNA sample preparation. Sequencing libraries were generated using NEBNext®

29
Ultra™ RNA Library Prep Kit for Illumina® (NEB, USA) following the manufacturer’s
recommendations and index codes were added to attribute sequences to each sample.
Summarized briefly, mRNA was purified from total RNA with the use of poly-T oligo-
attached magnetic beads. Fragmentation was done using divalent cations under elevated
temperature in NEBNext First Strand Synthesis Reaction Buffer (5X). First strand cDNA
was synthesized with the use of random hexamer primer and M-MuLV Reverse
Transcriptase (RNase H ̄ ). Second strand cDNA synthesis was performed with the use of
DNA Polymerase I and RNase H. Any remaining overhangs were altered to blunt ends
using exonuclease/polymerase activities. After adenylation of 3’ ends of DNA fragments,
NEBNext Adaptor with hairpin loop structure were ligated to prepare for hybridization.
Library fragments were purified with AMPure XP system (Beckman Coulter, Beverly,
USA) to select cDNA fragments preferentially 150~200 bp in length. Next, 3 µl USER
Enzyme (NEB, USA) was added with size-selected, adaptor-ligated cDNA at 37 °C for
15 minutes followed by 5 minutes at 95 °C before PCR. PCR was then performed with
Phusion High-Fidelity DNA polymerase, Universal PCR primers and Index (X) Primer.
Lastly, PCR products were purified (AMPure XP system) and library quality was
assessed on the Agilent Bioanalyzer 2100 system.
Clustering and Sequencing
Clustering of the index-coded samples was performed on a cBot Cluster
Generation System with the use of HiSeq PE Cluster Kit cBot-HS (Illumina) according to
the instructions from the manufacturer. After cluster generation, the library preparations

30
were sequenced on an Illumina Hiseq platform and 125 bp/150 bp paired-end reads were
generated.
Quality Control
Raw data of fastq format were first processed through in-house perl scripts.
During this step, clean data were obtained by removing reads that contained adapter,
poly-N and low quality reads from the raw data. Simultaneously, Q20, Q30 and GC
content with regards to the clean data were calculated. All downstream analyses were
based on the clean data with high quality.
Read Mapping to the Reference Genome
Reference genome and gene model annotation files were downloaded directly
from the genome website. Reference genome UMD 3.1 was utilized. An index of the
reference genome was built using Bowtie v2.2.3 and paired-end clean reads were aligned
to the reference genome using TopHat v2.0.12.
Quantification
The use of HTSeq v0.6.1 was employed to count the read numbers mapped to
each gene. The FPKM, expected number of fragments per kilobase of transcript sequence
per millions base pairs sequenced, of each gene was then calculated based on the length
of the gene and the reads count mapped to said gene.
Differential Expression Analysis
Prior to differential gene expression analysis, for each sequenced library the read
counts were adjusted by edgeR program package through one scaling normalized factor.
31
Differential expression analysis of two conditions was performed using the DEGSeq R
package (1.20.0). The p-values were adjusted using the Benjamini-Hochberg method. A
corrected p-value of 0.005 and log₂ (fold change) of 1 were set as the threshold for
significantly differential expression.
GO and KEGG Enrichment Analysis
Gene Ontology (GO) enrichment analysis of differentially expressed genes was
implemented by the GOseq R package, in which gene length bias was corrected. GO
terms with FDR corrected P-value of less than 0.05 were considered significantly
enriched by differentially expressed genes. KEGG, a database resource for understanding
high-level functions and utilities of the biological system, was used, along with KOBAS
software, to test the statistical enrichment of differentially expressed genes in KEGG
pathways.
PPI Analysis of Differentially Expressed Genes
Protein-Protein Interaction (PPI) analysis of differentially expressed genes was
based on the STRING database, which contains known and predicted PPI values. For the
species existing in the database, a network was constructed by extracting the target genes
on the list from the database. If genes were not listed in the STRING database, Blastx
(v2.2.28) was used to align the target gene sequences to the selected reference protein
sequences, and the network was then built according to the known interaction of the
selected reference species.

32
Novel Transcripts Prediction and Splicing Analysis
The Cufflinks v2.1.1 Reference Annotation Based Transcript (RABT) assembly
method was used to construct and identify both known and novel transcripts from TopHat
alignment results. Alternative splicing events were classified to 12 basic types by the
software Asprofile v1.0. The number of alternative splicing events in each sample was
estimated.
SNP Analysis
Picard-tools v1.96 and samtools v0.1.18 were used to sort, mark duplicated reads
and reorder the bam alignment results of each sample. GATK2 (v3.2) software was used
to perform SNP calling.

33
RESULTS AND DISCUSSION
Average Daily Gain
As is shown in table 4, animals that graded Choice and Select tended to have a
higher average daily gain (ADG) compared to those that graded Standard. The ADG of
Choice, Select and Standard were 1.85 kg, 1.81 kg and 1.52 kg respectively. There was
significant differences in gain between Choice and Standard (P=0.02874), and Select and
Standard (P=0.006161), but not significant between Choice and Select (P=0.656).
Table 4. Animal ID, live weight, ADG and quality grading
Animal ID Start (kg) End (kg) ADG (kg) Quality
40 293.85 427.50 1.59 Choice
43 349.20 618.30 1.73 Choice
44 304.20 641.93 2.16 Choice
53 312.75 590.63 1.78 Choice
54 296.10 481.05 1.76 Select
55 301.50 438.30 1.63 Standard
64 299.25 439.20 1.67 Standard
69 310.50 505.80 1.86 Select
74 333.00 615.38 1.81 Choice
77 314.55 506.25 1.83 Select
81 308.70 625.05 2.03 Choice
86 319.95 430.65 1.32 Standard
89 318.15 504.45 1.77 Select
94 313.20 503.55 1.81 Select
95 314.55 436.95 1.46 Standard

34
Shear Force
Carcasses that graded Choice tended to have a lower shear force value than
carcasses that graded Select and Standard (table 5). It is important to note that Choice
steaks aged 24 hours and 7 days were less tender than Select steaks. This could be due to
error when samples were cut, placement on the TMS 30 Food Texturometer, or due to
difference in aging process between the cohorts. Our results support studies done
previously by others (Hiner and Hankins, 1950; Simone, Carroll & Clegg 1958; Zinn,
Durham and Hedrick, 1970). Shear force values between Choice and Select were only
significant when steaks were aged 24 hours (P=0.02196). When comparing Choice to
Standard steaks, shear force values were significant at fourteen days only (P=0.0009601),
though this difference seems unnaturally large. This could be due to having a large
variation in shear force values in the Choice as well as the Standard steaks. When Select
and Standard shear force values were compared, there were significant differences at 24
hours (P=0.03168) and seven days (P=0.0457) of age.
Table 5. Average shear force values based on age of steak
Age Choice (N) Select (N) Standard (N)
24hr 114.68 85.81 124.52
3 Day 81.49 88.95 114.31
7 Day 80.94 77.45 105.50
14 Day 64.77 73.84 92.06
21 Day 61.57 63.91 87.69
N= 9.81 kg

35
Gene expression
Four adipose samples required re-extraction and were resent to Novogene for
analysis. As is evident in table 6, there was a decrease in the number of read counts
between raw and clean data, a lower Q30 than Q20, as well as a higher percent GC
content across all cohorts, in both adipose and muscle tissue.
Table 6. Gene expression reads, quality of reads, G and C content in reads.
Adipose
Raw Clean Q20 (%) Q30 (%) GC Content (%)
Standard 52994544 51102307.5 96.59 91.53 54.05
Select 53655296 52008329.33 96.61 91.50 54.26
Choice 68918968.33 66800801.33 97.10 92.70 54.63
Muscle
Raw Clean Q20 (%) Q30 (%) GC Content (%)
Standard 51324601.5 49558730 96.19 90.55 52.86
Select 57170688.8 55292644.4 96.46 91.12 54.16
Choice 48957502.33 46709699 96.62 91.41 54.79 Raw Reads: the original sequencing reads counts
Clean Reads: number of reads after filtering Clean Bases: clean reads number multiply read length, saved in G unit
Q20: percentages of bases whose correct base recognition rates are greater than 99% in total bases
Q30: percentages of bases whose correct base recognition rates are greater than 99.9% in total bases GC content: percentages of G and C in total base
The percent of reads mapped was well above the recommended 70%, as is seen in tables
7a and 7b. Few of the genes mapped were able to be mapped to multiple sites on the
reference genome, there was almost equal number of reads that were mapped to the ‘+’,
or sense strand, as there were mapped to the ‘-’, or antisense, strand. When looking at
spliced reads, which is the reads that can be segmented and mapped to two exons, versus

36
non-spliced reads, reads mapped to a single exon, it is evident that there are more non-
spliced reads in all instances.
Alternative Splicing
Alternative splicing (AS) is considered a universal gene regulation mechanism
that occurs in most eukaryotes. In eukaryotic animals, DNA has exonic and intronic
regions: the exonic encodes a part of the final mRNA product while the intronic regions
do not code for protein synthesis and thereby are removed by spliceosomes during RNA
synthesis. There are five major AS events (see figure 1): skipped exon (SE) which results
in the exon being removed from the transcript along with the flanking introns; alternative
5’ splice site (A5SS) and alternative 3’ splice site (A3SS) which both result with the
recognition of two or more splice sites at one end of an exon; mutually exclusive exons
(MXE), when one of two exons is retained in mRNAs after splicing, but not both;
retained intron (RI), which occurs when an intron has failed to be removed from the
sequence. Of the types of AS listed above, the skipping of exons is the most common,
making up roughly ~30% of AS events (Wang et al., 2015). This was evident in this
study, with 87.6% of all AS events being SE, as well as having more significant AS
events (table 8).

37
Table 7a. Adipose mapping overview
Standard Select Choice
Total mapped 42957972.00 44594760.00 56630927.83
Total mapped (%) 84.34 85.78 84.85
Multiple mapped 527412.50 458310.33 652230.83
Multiple mapped (%) 1.03 0.88 0.96
Reads map to '+' 21187480.50 22040259.00 27936887.33
Reads map to '-' 21243079.00 22096190.67 28041809.67
Non-splice reads 24896146.75 25234077.33 31658393.00
Splice reads 17534412.75 18902372.33 24320304.00
Table 7b. Muscle mapping overview
Standard Select Choice
Total mapped 42160277.00 46898632.40 39590712.17
Total mapped (%) 85.05 84.71 84.63
Multiple mapped 666079.75 602578.40 697594.17
Multiple mapped (%) 1.33 1.08 1.47
Reads map to '+' 20768332.00 23176354.00 19472306.83
Reads map to '-' 20725865.25 23119700.00 19420811.17
Non-splice reads 22823698.50 25348294.20 19971267.67
Splice reads 18670498.75 20947759.80 18921850.33
Figure 1. Diagram of alternative splicing events

38
Table 8. Statistics of AS events
AS type
NumEvents.JC
.only
SigEvents.JC.
only
NumEvents.JC
+readsOnTarget
SigEvents.JC
+readsOnTarget
SE 19346 13 (8:5) 19354 11 (7:4)
MXE 2616 4 (1:3) 2617 2 (1:1)
A5SS 24 0 (0:0) 24 0 (0:0)
A3SS 55 0 (0:0) 55 0 (0:0)
RI 44 0 (0:0) 44 0 (0:0) NumEvents.JC.only: the total number of AS events, with only reads span splicing junctions taken into account.
SigEvents.JC.only: the total number of differential AS events, with only reads span splicing junctions taken into
account(up:down).
NumEvents.JC+readsOnTarget: the total number of AS events, with both reads span splicing junctions and reads on target
exons taken into account.
SigEvents.JC+readsOnTarget: the total number of differential AS events, with both reads span splicing junctions and reads on target exons taken into account.
Single Nucleotide Polymorphism and InDel
A single nucleotide polymorphism (SNP) is a variation in the sequence of DNA
that is commonly occurring within a population where a single nucleotide has been
changed, resulting in it to differ between members of a species or paired chromosomes.
InDel on the other hand are small fragments, one or more nucleotide, that have been
inserted or deleted. There were more instances of SNP variants than there were of InDels,
though the percent of occurrence was similar between both adipose and muscle tissues
with regards to SNPs and InDels (table 9). These values are consistent with previous
observations in the bovine (Pruitt et al., 2014).
Table 9. Average number of SNP and InDel
Adipose Tissue Muscle Tissue
Standard Select Choice Standard Select Choice
SNP 147159.25 164464.67 162881.83 135262 117548.8 104262.67
SNP% 85.6% 85.9% 85.9% 85.9% 85.4% 85.7%
InDel 24742.5 26954.333 26774.833 22258 20071.8 17463
InDel% 14.4% 14.1% 14.1% 14.1% 14.6% 14.3%

39
Novel Transcripts
A novel transcript is a transcript that is either newly discovered or its function is
unknown. Between all cohorts in this study, there were a total of 22,624 novel transcripts
recorded. Of those genes, all were located on the exon. A total of 589,747 novel gene
isoforms were found between all cohorts. A novel gene isoform are genes that form due
to mRNAs that are produced from the same site on a chromosome but that differ in
transcription state sites, protein coding DNA sequences, or untranslated regions. These
changes potentially alter the function of the gene. There were 12,828 genes found that
varied in location in the transcriptome submitted versus the reference genome. A possible
explanation for the high amount of novel transcripts could be due to the annotation of the
bovine genome being incomplete.
Expression Quantification
The level of gene expression is measured by transcript abundance – the greater
the abundance, the higher the gene expression level. This is estimated using the expected
number of fragments per kilobase of transcript sequenced per million base pairs
sequenced (FPKM). This method takes into account the effects of both sequencing depth
and gene length of fragments (Trapnell et al., 2010). Adipose tissue from carcasses
grading Standard, Select and Choice had comparable FPKM distribution. Similarly,
muscle tissue from carcasses grading Standard, Select and Choice had similar distribution
patterns. This was to be expected due to the nature of the samples (figure 2).

40
Figure 2. FPKM density
Density is depicted on the x-axis
RNA-Seq Correlation
Pearson correlation shows the similarity between samples, as well as the
repeatability of the experiment. The closer the correlation coefficient is to 1, the higher
the resemblance between samples. The Encyclopedia of DNA Elements recommends the
square of the Pearson correlation coefficient be larger than 0.92 under ideal conditions,
though for this study, the correlation should be higher than 0.8 which is the threshold for
replicates to be used in a multiple comparison experiment. As is evident in the Pearson
correlation for this study (figure 3), there was high correlation within muscle samples, as
well as within adipose samples. There was little correlation between adipose and muscle
samples.

41
Figure 3. Pearson correlation between samples
Differentially Expressed Genes (DEG)
With animals grading different qualities, it is to be expected that genes would be
expressed differently between quality grades. This is exactly what was seen. When
comparing Select to Standard adipose tissue samples, four genes were down regulated
while 29 genes were up regulated. Of those genes, only one down regulated gene was
significantly differentially expressed, which was the major histocompatibility complex,
class II, DM beta (table 10). We did not expect to see any major histocompatibility
complexes being expressed in adipose tissue as these genes are typically found in antigen
presenting tissue. However, our samples were whole tissue which includes the resident
and transient immune cells present in that tissue. Of the genes being up regulated, only
two were significantly differentially expressed that were related to adipose tissue:

42
peroxisome proliferator activated receptor alpha (PPARα) and protein kinase AMP-
activated non-catalytic subunit beta 2 (PRKAB2) (table 11).
When comparing the Select to Choice adipose tissue samples, eight genes were
seen to be down regulated, while 15 were being up regulated. Of these genes, only two
were being significantly differentially expressed as they were down regulated: adenylate
cyclase type 5 (ADCY5) and leptin (LEP) (table 12).
The comparison of Choice to Standard adipose tissue samples contained the most
differentially expressed genes, with 49 genes down regulated and 113 genes up regulated.
Of the genes being down regulated, seven were significantly altered in their gene
expression levels: eukaryotic translation initiation factor 4E binding protein 1
(EIF4EBP1); hedgehog interacting protein (HHIP); reelin precursor (RELN), nerve
growth factor (NGF); major histocompatibility complex, class II, DQA2 (BOLA-DQA2);
major histocompatibility complex, class II, DQ beta (BOLA-DQB); major
histocompatibility complex, class II, DQ alpha 5 (BOLA-DQA5) (table 13). Concerning
the genes being significantly up regulated in the Choice to Standard adipose tissue, there
was a total of nine: calcium binding protein 39 like (CAB39L); fibroblast growth factor 1
(FGF1); glutamate ionotropic receptor NMDA type subunit 1 (GRIN1); leptin;
hexokinase 2 (HK2); tyrosine 3-monooxygenase/tryptophan 5-monooxygenase activation
protein gamma (YWHAG); Stearoyl-CoA desaturase (SCD1); ELOVL fatty acid
elongase 5 (ELVOL5) (table 14).
Of the Standard to Choice muscle tissue samples, a total of 15 genes were down
regulated, while 20 were up regulated. Of the genes that were down regulated, only

43
insulin receptor substrate 1 (IRS1) seemed to have an impact on the development of the
muscle (table 15), while BOLA-DMB and BOLA-DQA2 were significantly up regulated
(table 16). There were differentially expressed genes between muscle from carcasses that
graded Standard and those grading Select. When comparing the Select and Choice
muscle groups, a total of four genes were being up regulated, with only one being down
regulated, none of which had an impact on muscle development or deposition.

44
Table 11. Select to Standard significantly up regulated adipose tissue DEGs
Gene code Read count Read count P-value Gene
abbreviation Gene name
ENSBTAG00000008063 466.1987041 193.6748103 2.47E-05 PPARA peroxisome proliferator
activated receptor alpha
ENSBTAG00000014387 52.33053568 13.48899581 2.19E-05 PRKAB2
protein kinase AMP-
activated non-catalytic
subunit beta 2
Table 12. Select to Choice significantly down regulated adipose tissue DEGs
Gene code Read count Read count P-value Gene
abbreviation Gene name
ENSBTAG00000018777 818.9029568 2158.209098 6.08E-07 ADCY5 adenylate cyclase type 5
ENSBTAG00000014911 2371.16379 8660.135631 2.46E-05 LEP leptin
Table 10. Select to Standard significantly down regulated adipose tissue DEGs
Gene code Read
count Read count P-value
Gene
abbreviation Gene name
ENSBTAG00000021077 0 446.4814534 3.70E-08 BOLA-DMB Major histocompatibility
complex, class II, DM beta

45
Table 13. Choice to Standard significantly down regulated adipose tissue DEGs
Gene code Read count Read count P-value Gene
abbreviation Gene name
ENSBTAG00000027654 2192.044386 5928.113361 7.97E-05 EIF4EBP1
eukaryotic translation
initiation factor 4E
binding protein 1
ENSBTAG00000016071 17.35247576 52.08435641 1.95E-04 HHIP hedgehog interacting
protein
ENSBTAG00000003658 70.73350439 166.1783114 4.50E-05 RELN reelin precursor
ENSBTAG00000007446 25.43454316 71.64164715 8.45E-05 NGF nerve growth factor
ENSBTAG00000009656 45.94515343 133.4541166 5.51E-06 BOLA-
DQA2
Major histocompatibility
complex, class II, DQ
alpha 2
ENSBTAG00000021077 0.146795505 480.3474362 1.40E-08 BOLA-DQB Major histocompatibility
complex, class II, DQ beta
ENSBTAG00000038128 101.0001041 519.8998552 1.36E-06 BOLA-
DQA5
Major histocompatibility
complex, class II, DQ
alpha 5
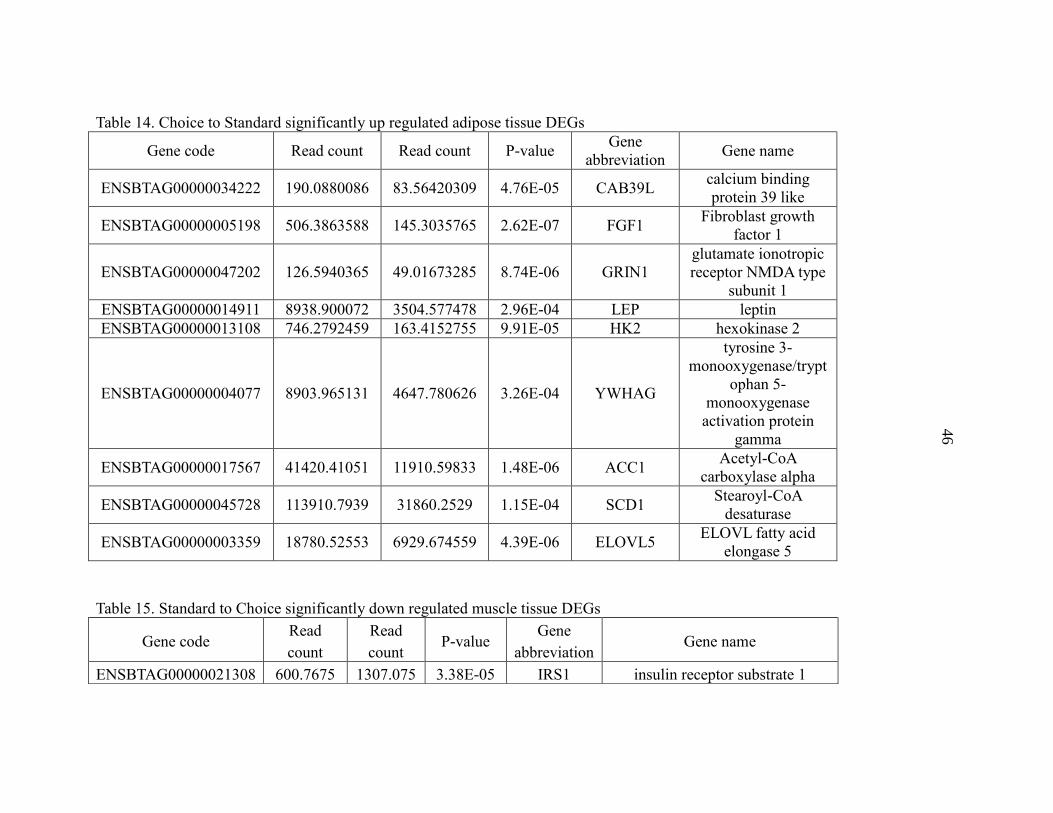
46
Table 14. Choice to Standard significantly up regulated adipose tissue DEGs
Gene code Read count Read count P-value Gene
abbreviation Gene name
ENSBTAG00000034222 190.0880086 83.56420309 4.76E-05 CAB39L calcium binding
protein 39 like
ENSBTAG00000005198 506.3863588 145.3035765 2.62E-07 FGF1 Fibroblast growth
factor 1
ENSBTAG00000047202 126.5940365 49.01673285 8.74E-06 GRIN1
glutamate ionotropic
receptor NMDA type
subunit 1
ENSBTAG00000014911 8938.900072 3504.577478 2.96E-04 LEP leptin
ENSBTAG00000013108 746.2792459 163.4152755 9.91E-05 HK2 hexokinase 2
ENSBTAG00000004077 8903.965131 4647.780626 3.26E-04 YWHAG
tyrosine 3-
monooxygenase/trypt
ophan 5-
monooxygenase
activation protein
gamma
ENSBTAG00000017567 41420.41051 11910.59833 1.48E-06 ACC1 Acetyl-CoA
carboxylase alpha
ENSBTAG00000045728 113910.7939 31860.2529 1.15E-04 SCD1 Stearoyl-CoA
desaturase
ENSBTAG00000003359 18780.52553 6929.674559 4.39E-06 ELOVL5 ELOVL fatty acid
elongase 5
Table 15. Standard to Choice significantly down regulated muscle tissue DEGs
Gene code Read
count
Read
count P-value
Gene
abbreviation Gene name
ENSBTAG00000021308 600.7675 1307.075 3.38E-05 IRS1 insulin receptor substrate 1

47
Table 16. Standard to Choice significantly up regulated muscle tissue DEGs
Gene code Read
count
Read
count P-value
Gene
abbreviation Gene name
ENSBTAG00000009656 25.03987 3.93732 7.16E-07 BOLA-DQA2 Major histocompatibility
complex, class II, DQ alpha 2
ENSBTAG00000012451 186.654 72.58464 5.64E-05 BOLA-DMB Major histocompatibility
complex, class II, DM beta

48
GO Enrichment Analysis
Gene Ontology (GO) is a technique for interpreting sets of genes making use of
the Gene Ontology system of classification, in which genes are assigned to a set of
predefined bins depending on their functional characteristics. GO provides a system for
hierarchically classifying genes or gene products to terms organized in a graph structure
called an ontology. The terms are grouped into three categories: molecular function,
which describes the molecular activity of a gene; biological process, describing the larger
cellular or physiological role carried out by the gene which are coordinated with other
genes; and cellular component, which describes the location in the cell where the gene
product executes its function.
When analyzing GO results, there were no lipid related genes being down
regulated when comparing adipose tissue samples from carcasses that graded Select and
Standard. This is to be expected as the select carcasses are higher quality with more lipid
deposition. However, there were multiple adipose-related genes being up regulated (table
17), such as the negative regulation of JAK-STAT cascade, the negative regulation of
lipid storage, and the negative regulation of sequestering of triglyceride. These three
processes have a negative impact on adipose tissue development as well as deposition.
Conversely, there was a large number of lipid related genes being down regulated
when comparing adipose tissue samples from Select and Choice carcasses (table 18).
Interestingly, the processes that are being down regulated in Select adipose tissue
carcasses are ones that promote lipogenesis such as – adipose tissue development,
positive regulation of JAK-STAT cascade, positive regulation of fatty acid biosynthetic

49
process, positive regulation of fatty acid metabolic process, positive regulation of lipid
biosynthetic process. This would suggest that less adipose deposition is taking place in
Select animals when compared to Choice animals.
With the comparison of adipose tissue from carcasses that graded Choice and
Standard, a larger number of genes were seen being significantly up regulated in the
Choice carcasses (table 19), all of which assist with the deposition of adipose tissue. The
processes of importance are fatty acid biosynthetic process, fatty acid elongation,
monounsaturated fatty acid, fatty acid metabolic process, adipose tissue development,
positive regulation of fatty acid biosynthetic process, and the positive regulation of fatty
acid metabolic process. Interestingly, there was one process of importance that had one
gene in the process being down regulated, fatty-acyl-CoA synthase activity, which is
essential to the production of fatty acids.
When analyzing muscle samples from carcasses that graded Standard and Select,
there were not enough difference in the genes to utilize GO enrichment. When comparing
Select to Choice muscle samples, there were a few enriched up regulated processes, but
none directly related to muscle development. However, this was not the case when
comparing Standard and Choice muscle samples (table 20), where there were processes
being both up and down regulated, though only one was being significantly altered. This
could be due to the fact that Standard carcasses are still growing and have not yet
deposited much adipose tissue, whereas Choice carcasses are more developed and are
focused on depositing adipose tissue, resulting in more adipose tissue pathways being
active than muscle.

50
Table 17. GO enrichment of Select to Standard adipose tissue
GO
accession Description Term type
Over represented
P-value
Corrected
P-value
DEG
item
DEG
list
Bg
item Up Down
GO:0006629 lipid metabolic
process biological 0.042408 1 4 27 956 4 0
GO:0010887 negative regulation
of cholesterol storage biological 0.005227 1 1 27 4 1 0
GO:0046426
negative regulation
of JAK-STAT
cascade
biological 0.056617 1 1 27 45 1 0
GO:0010888 negative regulation
of lipid storage biological 0.016879 1 1 27 12 1 0
GO:0010891
negative regulation
of sequestering of
triglyceride
biological 0.006795 1 1 27 5 1 0

51
Table 18. GO enrichment of Select to Choice adipose tissue
GO
accession Description Term type
Over represented
P-value
Corrected
P-value
DEG
item
DEG
list
Bg
item Up Down
GO:0060612 adipose tissue
development biological 0.031208 1 1 20 28 0 1
GO:0046427
positive regulation
of JAK-STAT
cascade
biological 0.044895 1 1 20 48 0 1
GO:0045723
positive regulation
of fatty acid
biosynthetic
process
biological 0.012979 1 1 20 14 0 1
GO:0045923
positive regulation
of fatty acid
metabolic process
biological 0.025569 1 1 20 26 0 1
GO:0046889
positive regulation
of lipid
biosynthetic
process
biological 0.042763 1 1 20 44 0 1

52
Table 19. GO enrichment of Choice to Standard adipose tissue
GO
accession Description
Term
type
Over represented
P-Value
Corrected
P-Value
DEG
item
DEG
list
Bg
item Up Down
GO:0006633 fatty acid biosynthetic
process biological 0.000142 0.39674 6 143 104 5 1
GO:0034625 fatty acid elongation,
monounsaturated fatty acid biological 0.047926 1 1 143 7 1 0
GO:0006631 fatty acid metabolic process biological 0.014188 1 6 143 254 5 1
GO:0060612 adipose tissue development biological 0.023793 1 2 143 28 2 0
GO:0045723 positive regulation of fatty
acid biosynthetic process biological 0.004313 1 2 143 14 2 0
GO:0045923 positive regulation of fatty
acid metabolic process biological 0.016167 1 2 143 26 2 0
GO:0004321 fatty-acyl-CoA synthase
activity molecular 0.032504 1 1 143 4 0 1

53
Table 20. GO enrichment of Standard to Choice muscle tissue
GO
accession Description Term type
Over represented
P-value
Corrected
P-value
DEG
item
DEG
list
Bg
item Up Down
GO:0007015 actin filament
organization biological 0.35551 1 1 26 305 1 0
GO:0030029 actin filament-based
process biological 0.563 1 1 26 556 1 0
GO:0001578 microtubule bundle
formation biological 0.005679 1 2 26 75 1 1
GO:0000226 microtubule cytoskeleton
organization biological 0.13508 1 2 26 433 1 1
GO:0046785 microtubule
polymerization biological 0.072982 1 1 26 51 0 1

54
KEGG Pathway Enrichment
KEGG (Kyoto Encyclopedia of Genes and Genomes) is a collection of manually
curated databases dealing with genomes, biological pathways, diseases, drugs and
chemical substances. It is used for bioinformatics research and education, including but
not limited to data analysis in genomics, metagenomics, and metabolomics. Pathway
enrichment analysis identifies significantly enriched metabolic pathways of signals
transduction pathways associated with DEGs compared with the whole genome
background. The formula used is below (figure 4), where N is the number of all genes
with a KEGG annotation, n is the number of DEGs in N, M is the number of all genes
annotated to specific pathways, and m is the number of DEGs in M.
Figure 4. KEGG equation
Of the pathways highlighted via KEGG, ones of importance when comparing
adipose tissue samples from Select and Standard carcasses were the AMPK signaling
pathway (figure 5) due to the up regulation of PRKAB2, which can lead to the inhibition
of fatty acid biosynthesis, the biosynthesis of unsaturated fatty acids, the mTOR signaling
pathway, starch and sucrose metabolism, protein synthesis, the regulation of autophagy,
and cell cycle DNA replication, while potentially promoting glycolysis and
gluconeogenesis. The adipocytokine signaling pathway (figure 6) was relevant due to the
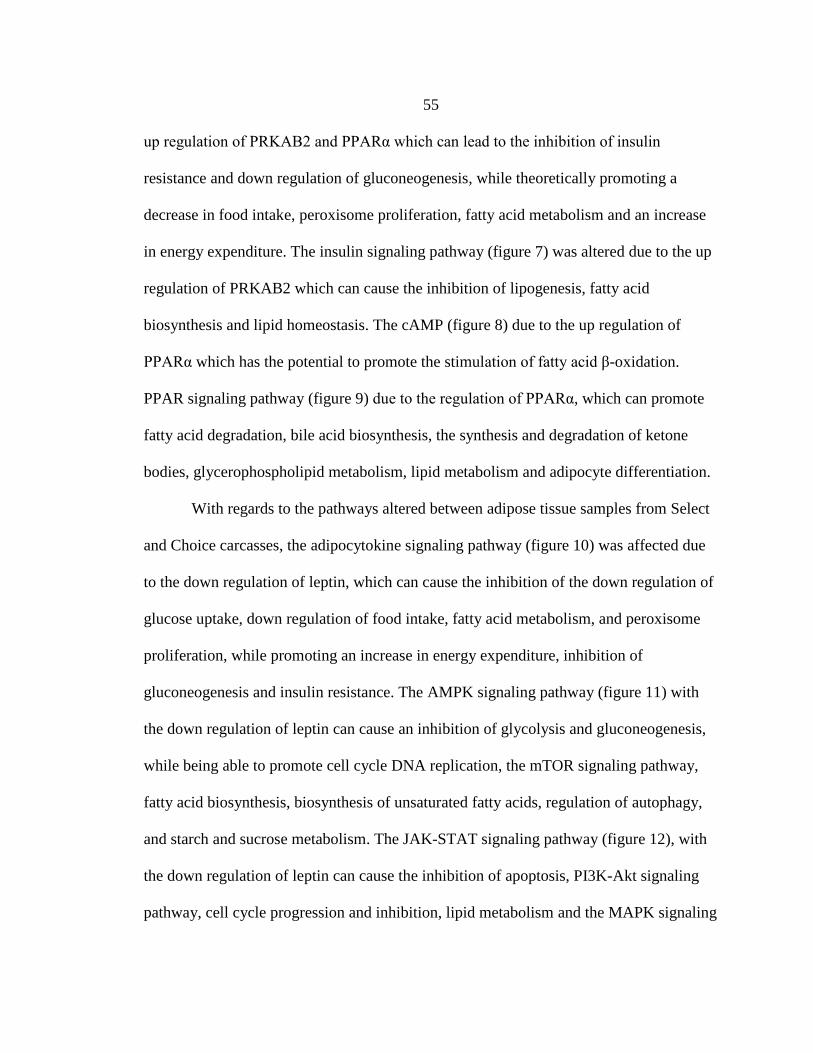
55
up regulation of PRKAB2 and PPARα which can lead to the inhibition of insulin
resistance and down regulation of gluconeogenesis, while theoretically promoting a
decrease in food intake, peroxisome proliferation, fatty acid metabolism and an increase
in energy expenditure. The insulin signaling pathway (figure 7) was altered due to the up
regulation of PRKAB2 which can cause the inhibition of lipogenesis, fatty acid
biosynthesis and lipid homeostasis. The cAMP (figure 8) due to the up regulation of
PPARα which has the potential to promote the stimulation of fatty acid β-oxidation.
PPAR signaling pathway (figure 9) due to the regulation of PPARα, which can promote
fatty acid degradation, bile acid biosynthesis, the synthesis and degradation of ketone
bodies, glycerophospholipid metabolism, lipid metabolism and adipocyte differentiation.
With regards to the pathways altered between adipose tissue samples from Select
and Choice carcasses, the adipocytokine signaling pathway (figure 10) was affected due
to the down regulation of leptin, which can cause the inhibition of the down regulation of
glucose uptake, down regulation of food intake, fatty acid metabolism, and peroxisome
proliferation, while promoting an increase in energy expenditure, inhibition of
gluconeogenesis and insulin resistance. The AMPK signaling pathway (figure 11) with
the down regulation of leptin can cause an inhibition of glycolysis and gluconeogenesis,
while being able to promote cell cycle DNA replication, the mTOR signaling pathway,
fatty acid biosynthesis, biosynthesis of unsaturated fatty acids, regulation of autophagy,
and starch and sucrose metabolism. The JAK-STAT signaling pathway (figure 12), with
the down regulation of leptin can cause the inhibition of apoptosis, PI3K-Akt signaling
pathway, cell cycle progression and inhibition, lipid metabolism and the MAPK signaling

56
pathway. The cAMP signaling pathway (figure 13), by having ADCY5 being down
regulated, can stimulate the inhibition of fatty acid degradation, pancreatic secretion, bile
secretion, long-term potentiation, cardiac muscle, the PI3K-Akt signaling pathway as
well as the Rap1 signaling pathway, with the potential to promote apoptosis;. The Rap1
signaling pathway (figure 14) was altered due to the down regulation of ADCY5, which
can inhibit the MAPK and PI3K-Akt signaling pathways, as well as causing cell
adhesion, migration and polarity to be inhibited, in contrast, the regulation of the actin
cytoskeleton, adherens junction, focal adhesion and defective angiogenesis can be
promoted.
Of the adipose groups, there were the most differences with regards to adipose
tissue samples from Choice and Standard carcasses, which was not surprising as they
were the farthest apart with regards to maturity. Specific pathways of importance were
the adipocytokine signaling pathway (figure15), which due to the up regulation of leptin
can cause the inhibition of insulin resistance and the down regulation of gluconeogenesis,
and with the ability to promote a decrease in food intake, inhibition of glucose uptake,
and increase in energy expenditure, peroxisome proliferation and fatty acid metabolism.
The AMPK signaling pathway (figure 16) had an up regulation of leptin, CAB39L,
ACC1 and SCD1, with a down regulation of EIF4EBP1, resulting in the possibility of
cell cycle DNA replication, starch and sucrose metabolism, fatty acid biosynthesis,
biosynthesis of unsaturated fatty acids and the mTOR pathway being inhibited while
glycolysis and gluconeogenesis, fatty acid biosynthesis and the biosynthesis of
unsaturated fatty acids could be promoted. The cAMP pathway (figure 17) was altered

57
due to the up regulation of GRIN1 and the down regulation of HHIP, which resulted in
the inhibition of the down regulation of the Hedgehog signaling pathway. The fatty acid
biosynthesis pathway (figure 18), which due to the up regulation of ACC1 makes it
possible for pyruvate metabolism, β-alanine metabolism, lipoic acid metabolism, fatty
acid degradation, glycerolipid metabolism, glycerophospholipid metabolism and fatty
acid elongation to be promoted. There was an up regulation of ELOVL5 in fatty acid
elongation cycle (figure 19), which is known to cause a potential promotion of cutin,
suberine and wax biosynthesis but as this role is unlikely in the bovine, it may have
another function. Both glycolysis and gluconeogenesis (figure 20) were altered due to the
up regulation of HK2 can cause a promotion of the pentose phosphate pathway, citrate
cycle, pyruvate metabolism and propanoate metabolism. The insulin signaling pathway
(figure 21) had an up regulation of ACC1, HK2, and EIF4E, and a down regulation of
EIF4EBP1, which can cause the inhibition of protein synthesis and the promotion of
lipogenesis and glycolysis. The down regulation of leptin in the JAK-STAT signaling
pathway (figure 22) can cause apoptosis, the PI3K-Akt signaling pathway, cell cycle
progression and inhibition, lipid metabolism and MAPK signaling pathway to be
promoted. PI3K-Akt signaling pathway (figure 23) had a down regulation of NGF,
RELN, and EIF4EBP1, while EIF4E, YWHAG and FGF1 were up regulated, which can
cause protein synthesis, cell cycle progression and survival and apoptosis to be inhibited,
with actin reorganization, glucose uptake, glycolysis, angiogenesis, and cell proliferation
being potentially promoted. SCD1 was up regulated in the PPARα signaling pathway
(figure 24), which can cause a promotion of fatty acid degradation, bile acid biosynthesis,

58
the synthesis and degradation of ketone bodies, lipid metabolism and
glycerophospholipid metabolism. The Rap1 signaling pathway (figure 25) showed a
down regulation of NGF, while GRIN1 and FGF1 were up regulated. This can cause an
inhibition of defective angiogenesis, focal adhesion and the regulation of actin
cytoskeleton, while potentially promoting adherens junction, cell adhesion, migration and
polarity, as well as the MAPK and PI3K-Akt signaling pathways.
When looking at muscle tissue samples from Select and Standard carcasses,
similar to the GO analysis, there were not enough differences to be able to compute an
accurate KEGG analysis. While muscle tissue samples from Select to Choice carcasses
contained pathways that were expressed differently, none were relevant to muscle
development, such as β-alanine metabolism. When relating muscle tissue samples from
Standard to Choice carcasses however, quite a few pathways were being impacted by
differentially expressed genes. The first is the AMPK signaling pathway (figure 26).
IRS1 was down regulated, causing the potential inhibition of cell growth and protein
synthesis, autophagy and the mTOR signaling pathway can also be promoted. The IRS1
gene was also down regulated in the FOXO signaling pathway (figure 27), resulting in
possible promotion of cell cycle regulation, apoptosis, regulation of autophagy,
glycolysis and gluconeogenesis, muscle atrophy, and immune-regulation. Similarly, the
mTOR pathway (figure 28) also had IRS1 down regulated, potentially causing the
regulation of actin cytoskeleton and autophagy to be inhibited, with lipolysis, lipid
biosynthesis, microtubule and protein synthesis to be promoted. Lastly, the PI3K-Akt
signaling pathway (figure 29) was also potentially impacted by the down regulation of

59
IRS1, making it possible for glycolysis, gluconeogenesis, and cell cycle survival and
progression to be inhibited while a possibility of apoptosis, protein synthesis and actin
reorganization to be promoted.
Major histocompatibility complexes (MHC) were seen to be altered in the Select
to Standard adipose tissue with the down regulation of BOLA-DQB, in Choice to
Standard adipose tissue with the down regulation of BOLA-DQA2, BOLA-DQA5, and
BOLA-DQB, while BOLA-DQA2 and BOLA-DQM were up regulated in the Standard to
Choice muscle tissue, specifically with regards to the asthma (figure 30) and tuberculosis
(figure 31) pathways being examples of where these genes play a potential role if not in
the bovine in these tissues. The exact reason for this is unknown, as MHC’s are not
expected to be seen in adipose or muscle tissue cell types. They are known to be
expressed by immune cells such as macrophages. A possible explanation for this could be
that, for a reason yet unknown, macrophages are migrating from adipose tissue to muscle
tissue. A study by Khan et al., (2015) showed instances where, in obese humans, MHC’s
were found to be increased in skeletal muscle of obese humans when compared to lean
controls. It could be that MHC’s are passing though adipose tissue to reach the muscle.
Why this is occurring, however, is unknown and is worthy of future research.

60
Figure 5. Select to Standard adipose tissue AMPK signaling pathway

61
Figure 6. Select to Standard adipose tissue adipocytokine signaling pathway

62
Figure 7. Select to Standard adipose tissue insulin signaling pathway

63
Figure 8. Select to Standard adipose tissue cAMP signaling pathway

64
Figure 9. Select to Standard adipose tissue PPAR signaling pathway

65
Figure 10. Select to Choice adipose tissue adipocytokine signaling pathway

66
Figure 11. Select to Choice adipose tissue AMPK signaling pathway

67
Figure 12. Select to Choice adipose tissue JAK-STAT signaling pathway
Figure 13. Select to Choice adipose tissue cAMP signaling pathway

68
Figure 14. Select to Choice adipose tissue Rap1 pathway
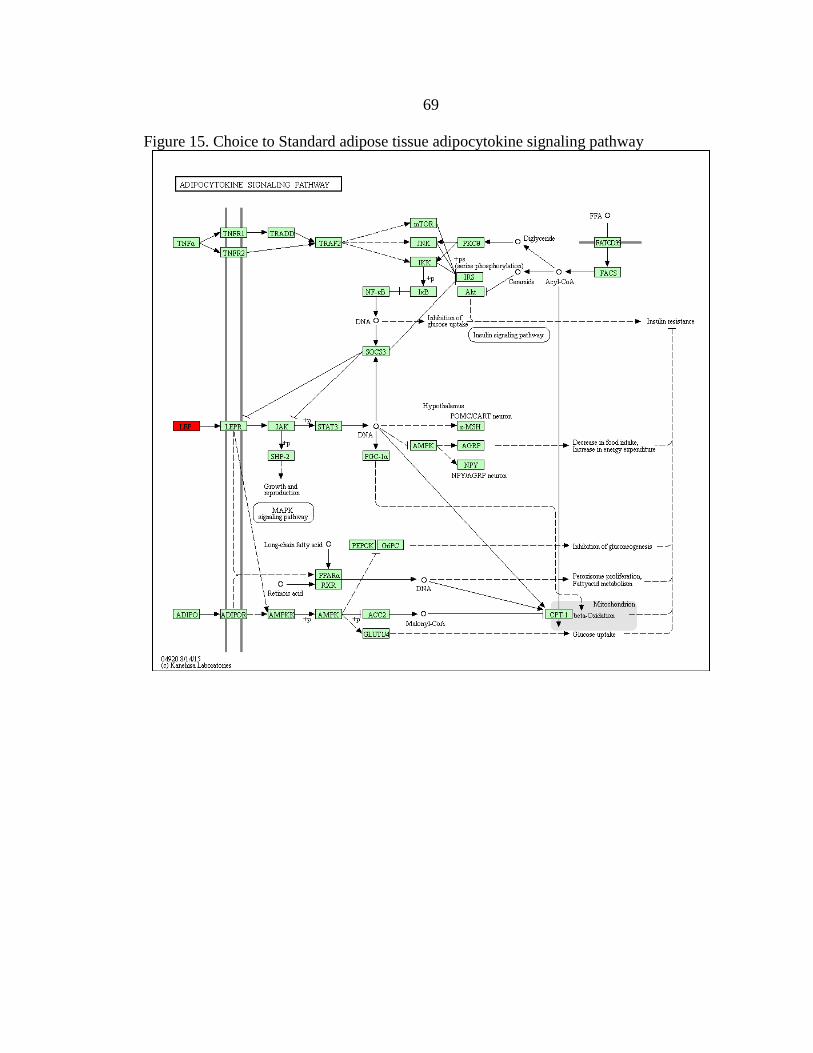
69
Figure 15. Choice to Standard adipose tissue adipocytokine signaling pathway

70
Figure 16. Choice to Standard adipose tissue AMPK signaling pathway

71
Figure 17. Choice to Standard adipose tissue cAMP signaling pathway
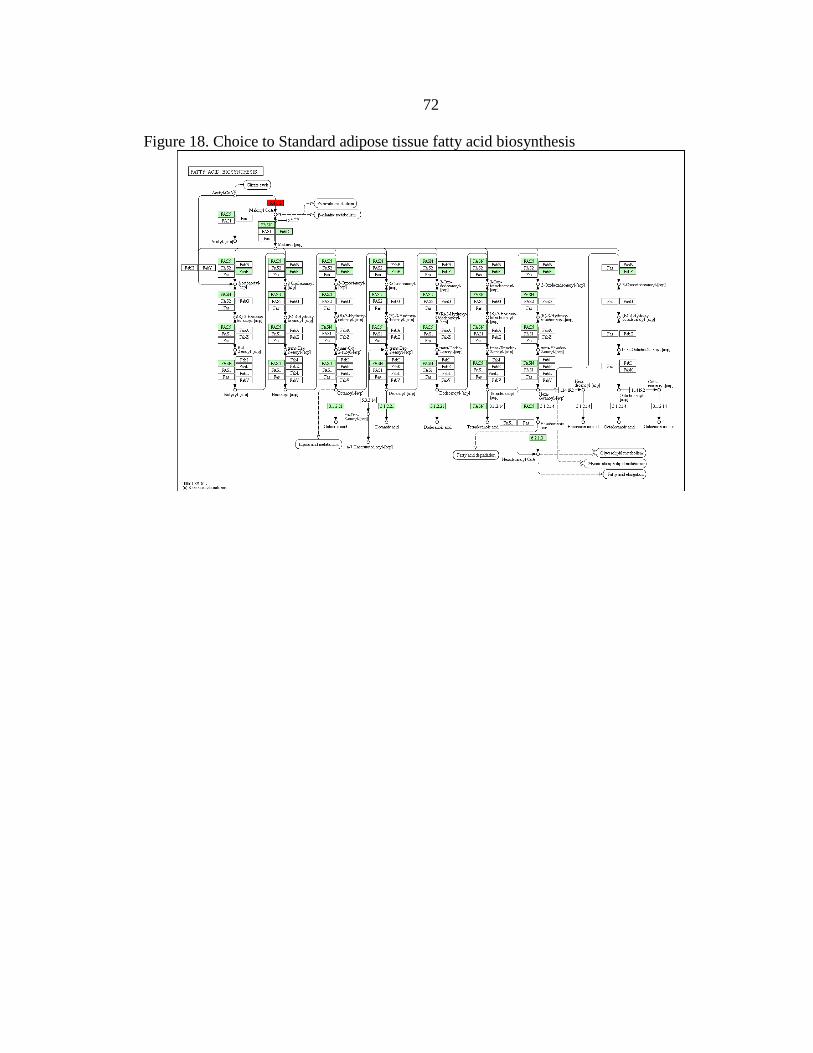
72
Figure 18. Choice to Standard adipose tissue fatty acid biosynthesis

73
Figure 19. Choice to Standard adipose tissue fatty acid elongation

74
Figure 20. Choice to Standard adipose tissue glycolysis and gluconeogenesis pathway

75
Figure 21. Choice to Standard adipose tissue insulin signaling pathway
Figure 22. Choice to Standard adipose tissue JAK-STAT signaling pathway
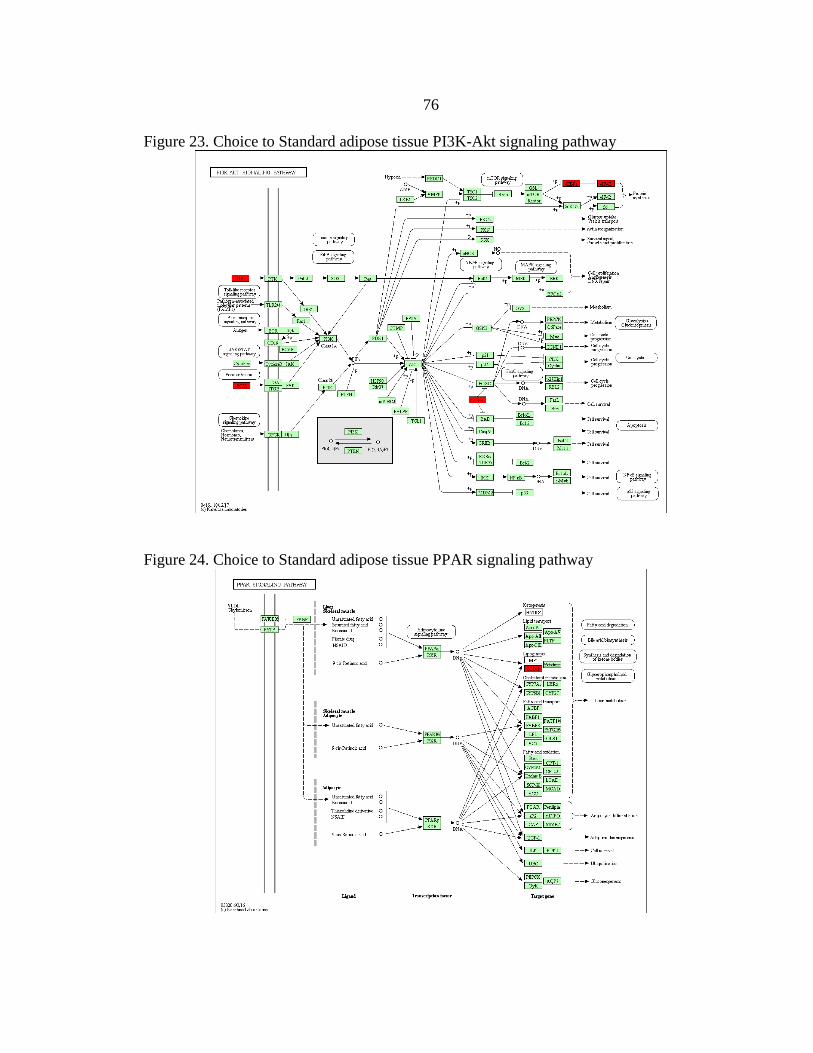
76
Figure 23. Choice to Standard adipose tissue PI3K-Akt signaling pathway
Figure 24. Choice to Standard adipose tissue PPAR signaling pathway

77
Figure 25. Choice to Standard adipose tissue Rap1 pathway
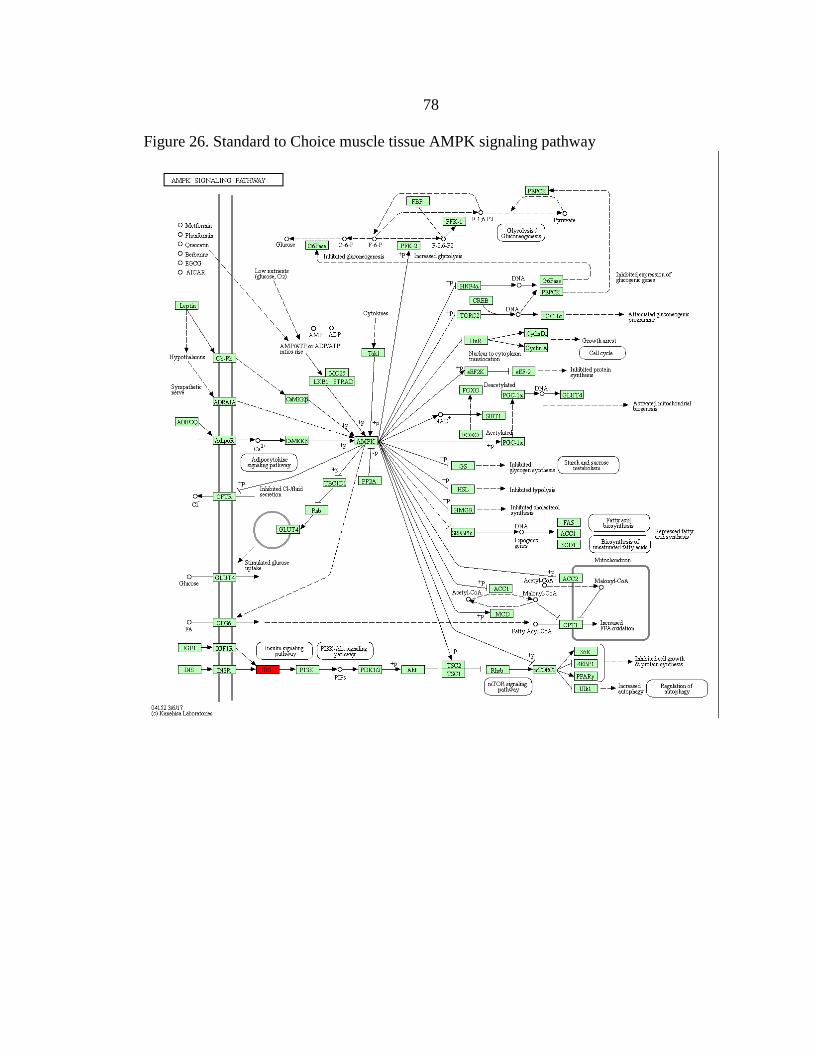
78
Figure 26. Standard to Choice muscle tissue AMPK signaling pathway

79
Figure 27. Standard to Choice muscle tissue FOXO signaling pathway
Figure 28. Standard to Choice muscle tissue mTOR signaling pathway

80
Figure 29. Standard to Choice muscle tissue PI3K-Akt signaling pathway
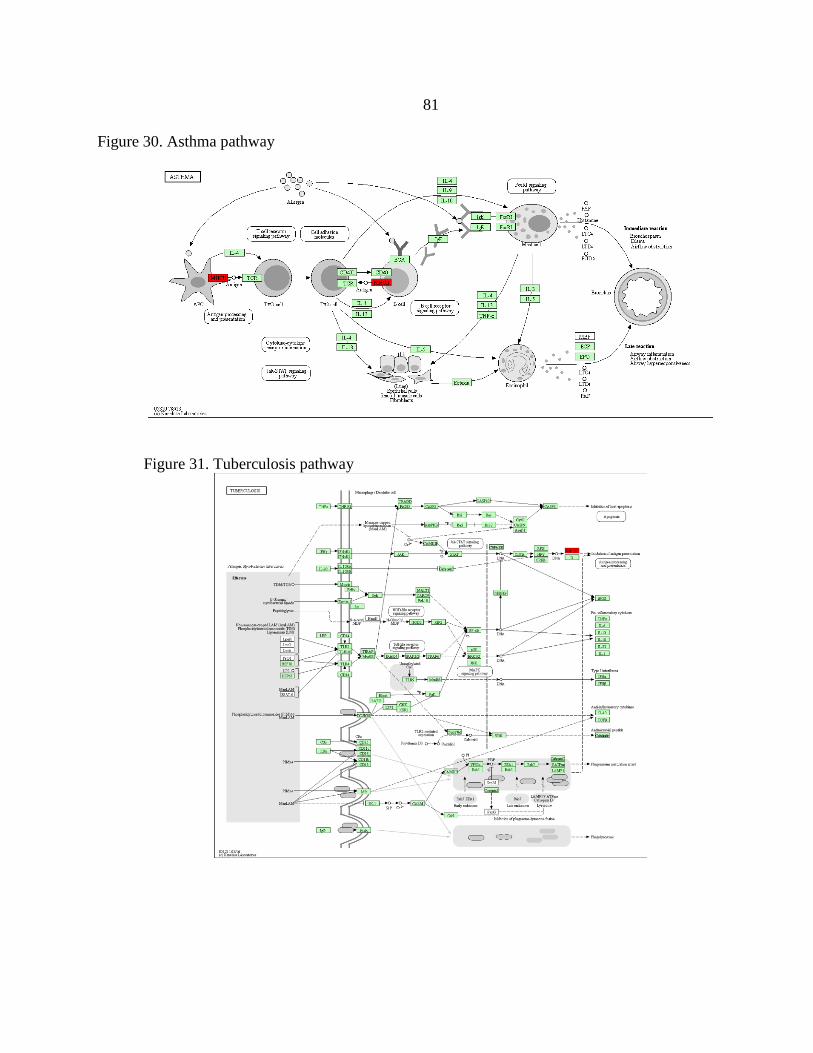
81
Figure 30. Asthma pathway
Figure 31. Tuberculosis pathway
82
As seen above, the comparison that showed the greatest alteration in the
expression of genes and pathways occurred between the Choice to Standard adipose
tissue. While there were differences between Select to Choice and Select to Standard,
these differences seem to be related to the deposition and regulation of normal adipose
tissue and did not seem relevant to deposition of intramuscular fat or marbling.
Of the differences between Choice to Standard adipose tissue, ones that could
have a large impact are the inhibition of the mTOR signaling pathway, apoptosis, and the
regulation of actin cytoskeleton. Of the pathways potentially promoted, lipid metabolism,
apoptosis, actin reorganization could play a large part.
As adipose tissue is deposited intramuscularly, it displaces muscle tissue. This
could potentially cause apoptosis, which is programmed cell death, in order to make
room for the developing and depositing adipose tissue. This might promote the muscle
fibers, even sarcomeres themselves, to weaken as the adipose tissue is deposited. There
is also a potential of actin reorganization, which could also play a part in the weakening
of muscle to allow for the deposit of adipose tissue.
With regards to Standard to Choice muscle tissue samples there was potential for
the protein synthesis in Standard, while lipolysis had the possibility to be upregulated in
the Standard compared to Choice. This would agree with what is often seen, less
intramuscular adipose tissue deposited in Standard when compared to Choice, as the
Standard animal is still developing muscle as well as other depots of adipose tissue, such
as KPH, subcutaneous, and intermuscular. There is also a potential for the reorganization

83
of muscle as adipose tissue is being deposited, specifically with regards to actin
reorganization, microtubule organization, and protein synthesis.
Protein-protein Interaction
Protein-protein interaction is when physical contacts of high specificity between
two or more protein molecules as a result of biochemical events steered by electrostatic
forces. In this study there was a total of three instances of this recorded, all occurring
between the Choice and Standard adipose samples (table 21). In order to be considered
having high specificity, the STRING score must be above 700, which in all three
interactions it was. Due to a lack of information with regards to bovine protein-protein
interaction, it is unsure at this time the impact they could have.
Table 21. Protein-protein interactions
Down regulation
Protein 1 Protein 2 STRING score
ENSBTAP00000012530 ENSBTAP00000039615 964
ENSBTAP00000019800 ENSBTAG00000021077 800
Up regulation
Protein 1 Protein 2 STRING score
ENSBTAG00000013108 ENSBTAG00000020127 800
Transcription Factor Analysis
Transcription factors are proteins that control the rate of transcription of genetic
information from DNA to messenger RNA, by binding to a specific DNA sequence. Their
function is to regulate genes in order to assure that they are expressed at the correct time,
in the correct amount, throughout the life of the cell and the organism. There were a total

84
of 1,320 transcription factors that were expressed in the tissues evaluated in this study,
comprised of 69 families (table 22).
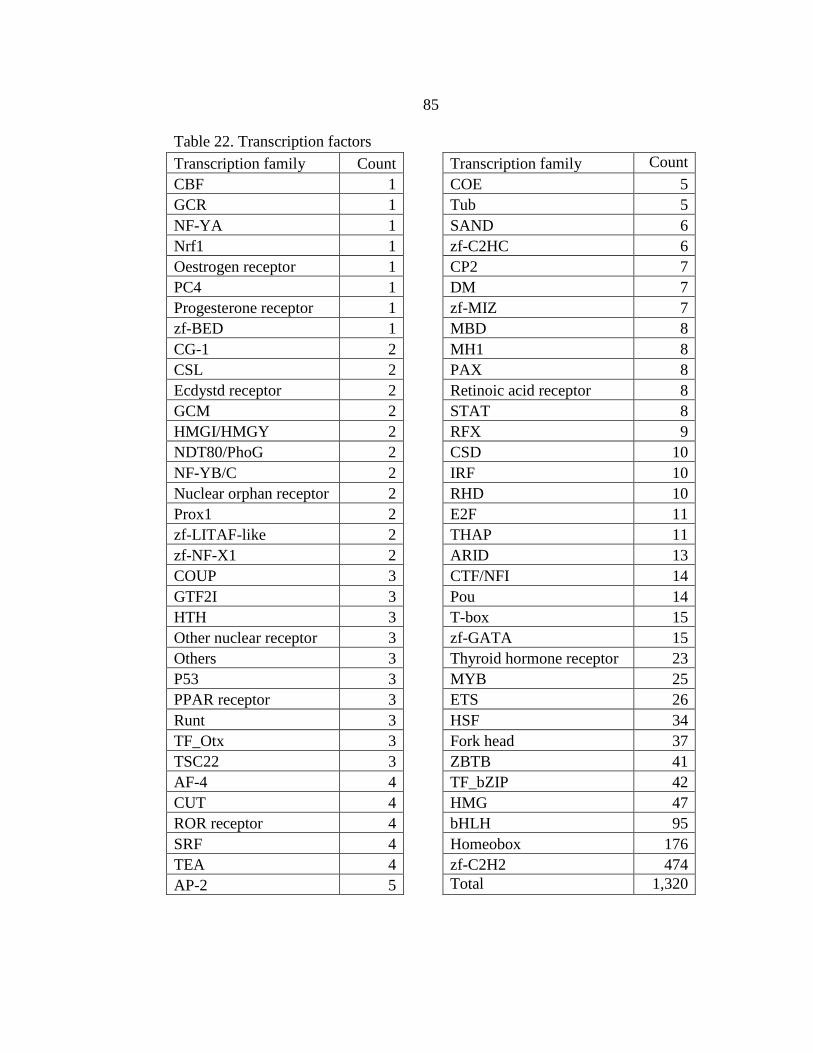
85
Table 22. Transcription factors
Transcription family Count Transcription family Count
CBF 1 COE 5
GCR 1 Tub 5
NF-YA 1 SAND 6
Nrf1 1 zf-C2HC 6
Oestrogen receptor 1 CP2 7
PC4 1 DM 7
Progesterone receptor 1 zf-MIZ 7
zf-BED 1 MBD 8
CG-1 2 MH1 8
CSL 2 PAX 8
Ecdystd receptor 2 Retinoic acid receptor 8
GCM 2 STAT 8
HMGI/HMGY 2 RFX 9
NDT80/PhoG 2 CSD 10
NF-YB/C 2 IRF 10
Nuclear orphan receptor 2 RHD 10
Prox1 2 E2F 11
zf-LITAF-like 2 THAP 11
zf-NF-X1 2 ARID 13
COUP 3 CTF/NFI 14
GTF2I 3 Pou 14
HTH 3 T-box 15
Other nuclear receptor 3 zf-GATA 15
Others 3 Thyroid hormone receptor 23
P53 3 MYB 25
PPAR receptor 3 ETS 26
Runt 3 HSF 34
TF_Otx 3 Fork head 37
TSC22 3 ZBTB 41
AF-4 4 TF_bZIP 42
CUT 4 HMG 47
ROR receptor 4 bHLH 95
SRF 4 Homeobox 176
TEA 4 zf-C2H2 474
AP-2 5 Total 1,320

86
CONCLUSION
The expected gene expression changes related to muscle growth, fat deposition,
fatty acid synthesis and regulation were observed in this study. However, organisms are
complex systems, with metabolic processes under multiple levels of regulation. This can
cause some of the conflicting results that were seen with genes being regulated to
opposite effects. Overall there was evidence of many genes being differentially
expressed, particularly between the Choice and Standard adipose tissue. There were few
genes being differentially expressed between muscle tissue groups. This can potentially
be interpreted to demonstrate that the adipose tissue and surrounding muscle can play a
bigger role in meat quality and tenderness levels than currently known, and that the
muscle tissue itself plays a minor role.
This study emphasized many genes and pathways related to adipose tissue in
particular that need to be investigated further. In particular, the pathways of fatty acid
biosynthesis pathway; PI3-Akt signaling pathway due to its impact on apoptosis and actin
reorganization,; AMPK signaling pathway because of its potential impact on fatty acid
biosynthesis; and JAK-STAT signaling pathway due to its impact on apoptosis, lipid
metabolism and the PI3K-Akt signaling pathway. The pathways related to muscle tissue
needing additional research are the mTOR signaling pathway due to its impact on
microtubule organization, protein synthesis and the regulation of actin cytoskeleton, as
well as the PI3K-Akt signaling pathway due to its impact on apoptosis, protein synthesis
and actin reorganization.

87
Genes of particular importance that also need further research with regards to
adipose tissue are leptin, due to its impact on both the JAK-STAT and AMPK signaling
pathway; CAB39L, ACC1, SCD1 and EIF4EBP1 due to their impact on the AMPK
signaling pathway; and NGF, RELN, EIF4EBP1, EIF4E, YWHAG and FGF1 because of
their impact on the PI3K-Akt signaling pathway. The muscle-related gene needing
additional research is IRS1, which influenced both the mTOR and PI3K-Akt signaling
pathways.
It does appear from this study that the role of adipose tissue plays in meat quality
and tenderness may provide more potential selection targets and variables that can be
used to improve meat quality than muscle tissue. This is logical as at these points, muscle
is already fairly developed and the body is transitioning to the deposition of adipose
instead.

88
REFERENCES CITED

89
Aberle, E.D., 2001. Principles of meat science. Kendall Hunt Publishing.
Acebron, L.B., and D.C. Dopico. 2000. The importance of intrinsic and extrinsic cues to
expected and experiences quality: an empirical application for beef. Food Quality and
Preference. 11: 229-238.
Apple, J.K., E.B. Kegley, D.L. Galloway, T.J. Wistuba, and L.K. Rakes. 2005. Duration
of restraint and isolation stress as a model to study the dark-cutting condition in cattle. J.
Anim. Sci. 83:1202-1214.
Ashmore, C.R., F. Carroll, L. Doerr, G. Tompkins, H. Stokes, and W. Parker. 1973.
Experimental prevention of dark cutting. 36:33-36.
Bai, Y., S. Zhang, K.S. Kim, J.K. Lee, and K.H. Kim. 1996. Obese gene expression alters
the ability of 30A5 preadipocytes to respond to lipogenic hormones. Journal of Biological
Chemistry. 271:13939-13942.
Bailey, A.J., 1972. The basis of meat texture. J. Sci. Food and Agriculture. 23:995-1007
Bartos, L., C. Franc, and D. Rehak. 1993. A practical method to prevent dark-cutting
(DFD) in beef. Meat Sci. 34:275-282.
Bate-Smith, E.C., and J.R. Bendall. 1947. Rigor mortis and adenosine-triphosphate. J.
Physiology. 106:177-185.
Bendall, J.R. 1978. Variability in rates of pH fall and of lactate production in the muscles
on cooling beef carcasses. Meat Sci. 2:91-104.
Blumer, T. N. 1963. Relationship of marbling to the palatability of beef. Journal of
animal science. 22:771-778.
Bodewell, C.E., A.M. Pearson, and M.E. Spooner. 1965. Post-mortem changes in
muscle. I. Chemical Changes in Beef. J. Food Sci. 30:766-772.
Boleman, S. J., S.L. Boleman, J.W. Savell, R.K. Miller, H.R. Cross, T.L. Wheeler, M.
Koohmaraie, S.D. Shackelford, M.F. Miller, and R.L. West. 1995. Consumer evaluation
of beef of known tenderness levels. In: Proceedings 41st international congress of meat
science and technology, San Antonio, Texas, USA. p. 594–595.
Brooks, J.C., J.B. Belew, D.B. Griffin, B.L. Gwartney, D.S. Hale, W.R. Henning, D.D
Johnson, J.B. Morgan, F.C. Parrish, J.O. Reagan, and J.W. Savell, .2000. National beef
tenderness survey-1998. Journal of Animal Science. 78:1852-1860.
Brown, M.S., and J.L. Goldstein. 1997. The SREBP pathway: regulation of cholesterol
metabolism by proteolysis of a membrane-bound transcription factor. Cell. 89:331-340.

90
Cameron, N.D., and M.B. Enser. 1991. Fatty-acid composition of lipid in longissimus-
dorsi muscle of Duroc and British landrace pigs and its relationship with eating quality.
Meat Sci. 29:295-307.
Chystall, B.B., and C. Hagyard. 1976. Electrical stimulation and lamb tenderness. New
Zealand Journal of Agriculture Research. 19:7-11.
Cianzio, D.S., D.G. Topel, G.B. Whitehurst, D.C. Beitz, and H.L. Self. 1985. Adipose-
tissue growth and cellularity- changes in bovine adipocyte size and number. J. Anim. Sci.
60:970-976.
Clark, K.A., A.S. McElhinny, M.C. Beckerle, and C.C. Gregorio. 2002. Striated muscle
cytoarchitecture: an intricate web of form and function. Annual Review of Cell and
Developmental Biology. 18:637-706.
Contreras, G.A., C. Strieder-Barboza, and W. Raphael. 2017. Adipose tissue lipolysis and
remodeling during the transition period of dairy cows. Journal of Animal Science and
Biotechnology. 8:41.
Croall, D.E., and G.N. DeMartino. 1991. Calsium-activated neutral protease (calpain)
system: structure, function, and regulation. Physiological Reviews. 71:813-847.
Davey, C.L., K.V. Gilbert, and W.A. Carse. 1976. Carcass electrical stimulation to
prevent cold shortening toughness in beef. New Zealand Journal of Agriculture Research.
19:13-18.
Davies, P.J., D. Wallach, M.C. Willingham, I. Pastan, M. Yamaguchi, and R.M. Robson.
1978. Filamin-actin interaction. Dissociation of binding from gelation by Ca2+-activated
proteolysis. J. Biological Chemistry. 253:4036-4042.
Davis, L.A., and N.I. Zur Nieden. 2008. Mesodermal fate decisions of a stem cell: the
Wnt switch. Cellular and Colecular Life Sciences. 65:2658-2674.
Dikeman, M. 1987. Fat reduction in animals and the effects on palatability and consumer
acceptance of meat products. In: Proceedings 40th
Reciprocal Meat Conf., Chicago, IL. p.
93−103.
Dransfield, E. 1981. Eating quality of DFD beef. In: The problem of dark-cutting in beef.
Springer Press. p. 344-361.
Du, M., J.D. Yin, and M.J. Zhu. 2010. Cellular signaling pathways regulating the initial
stage of adipogenesis and marbling of skeletal muscle. Meat Sci. 86:103-109.
Edwards, P.A., D. Tabor, H.R. Kast, and A. Venkateswaran. 2000. Regulation of gene
expression by SREBP and SCAP. Biochimica et Biophysica Acta (BBA)-Molecular and
Cell Biology of Lipids. 1529:103–113.

91
Ender, K., H.J. Papstein, K. Nurnberg, and J. Wegner. 1997. Muscle and fat related
characteristics of grazing steers and lambs in extensive systems. In: Effects of
extensification on animal performance, carcass composition and product quality,
Proceedings of a workshop. p. 16-17.
Engle, B., M. Hammond, J. A. Boles, & J.M. Thomson. 2015. Gene expression of
skeletal muscle of red-faced hereford steers.
Enser, M., 1991. Animal carcass fats and fish oils. In: Analysis of oilseeds, fats and fatty
foods. Elsevier Science Publishers Ltd. p. 329-394.
Etherton, T. D. 2000. The biology of somatotropin in adipose tissue growth and nutrient
partitioning. The Journal of Nutrition. 130:2623-2625.
Geeves, M.A., and K.C. Holmes. 1999. Structural mechanism of muscle contractions.
Annual Review of Biochemistry. 68:687-728.
Gill, C.O., and K.G. Newton. 1981. Microbiology of DFD beef. In: The problem of dark-
cutting in beef. Springer Press. p. 305-327.
Grandin, T. 1980. The effect of stress on livestock and meat quality prior to and during
slaughter. International Journal for the Study of Animal Problems. 1:313-337.
Greaser, M.L., 1991. An overview of the muscle cell cytoskeleton. In: Proceedings 44th
Reciprocal Meat Conf., Savoy, IL. P. 1-5.
Green, H., and O. Kehinde. 1974. Sublines of mouse 3T3 cells that accumulate lipid.
Cell. 1:113-116.
Guelker, M.R., A.N., Haneklaus, J.C. Brooks, C.C. Carr, R.J. Delmore, D.B. Griffin, D.S.
Hale, K.B. Harris, G.G. Mafi, D.D. Johnson, C.L. Lorenzen, R.J. Maddock, J.N. Martin,
R.K. Miller, C.R. Raines, D.L. VanOverbeke, L.L. Vedral, B.E. Wasser, and J.W. Savell.
2013. National beef tenderness survey-2010: Warner-Bratzler shear force values and
sensory panel ratings for beef steaks from United States retail and food service
establishments. J. Anim. Sci. 91: 1005-1014.
Harper, G.S., and D.W. Pethick. 2004. How might marbling begin? Australian Journal of
Experimental Agriculture. 44:653-662.
Hiner, R. L. and O.G. Hankins. 1950. The tenderness of beef in relation to different
muscles and age in the animal. Journal of animal science, 9:347-353.
Ho, C.Y., M.H. Stromer, and R.M. Robson. 1994. Identification of the 30 kDa
polypeptide in post mortem skeletal muscle as a degradation product of troponin-T.
Biochimie. 76:369-375.
92
Horton, J.D., J.L. Goldstein, and M.S. Brown. 2002. SREBPs: activators of the complete
program of cholesterol and fatty acid synthesis in the liver. The Journal of clinical
investigation. 109:1125.
Horton, J.D., and I. Shimomura. 1999. Sterol regulatory element-binding proteins:
activators of cholesterol and fatty acid biosynthesis. Current Opinion in Lipidology.
10:143–150.
Hua, X., C. Yokoyama, J. Wu, M.R. Briggs, M.S. Brown, J.L. Goldstein, and X. Wang.
1993. SREBP-2, a second basic-helix-loop-helix-leucine zipper protein that stimulates
transcription by binding to a sterol regulatory element. Proceedings of the National
Academy of Sciences. 90:11603-11607.
Huerta-Leidenz, N.O., H.R. Cross, J.W. Savell, D.K. Lunt, J.F. Baker, L.S. Pelton, and
S.B. Smith. 1993. Comparison of the fatty-acid composition of subcutaneous adipose-
tissue from mature Brahman and Hereford cows. J. Anim. Sci. 71:625-630.
Huff-Lonergan, E., and S.M. Lonergan. 1999. Postmortem mechanisms of meat
tenderization. In: Quality attributes of muscle foods. Springer US. New York. p. 229-251.
Huff-Lonergan, E., T. Mitsuhashi, D.D. Beekman, F.C. Parrish, D.G. Olson, and R.M
Robson. 1996. Proteolysis of specific muscle structural proteins by mu-calpain at low pH
and temperature is similar to degradation in postmortem bovine muscle. J. Anim. Sci.
74:993-1008.
Huffman, K.L., M.F. Miller, L.C. Hoover, C.K. Wu, H.C. Brittin, and C.B. Ramsey.
1996. Effect of beef tenderness on consumer satisfaction with steaks consumed in the
home and restaurant. J. Anim. Sci. 74: 91-97.
Hwan, S.F., and E. Bandman. 1989. Studies of desmin and α-actinin degradation in
bovine semitendinosus muscle. J. Food Sci. 54:1426-1430.
Immonen, K., M. Ruusunen, K. Hissa, and E. Puolanne. 2000. Bovine muscle glycogen
concentration in relation to finishing diet, slaughter and ultimate pH. Meat Sci. 55:25-31.
Jacobi, S.K., N.K. Gabler, K.M. Ajuwon, J.E. Davis, and M.E. Spurlock. 2006.
Adipocyte, myofibers, and cytokine biology: new horizons in the regulation of growth
and body composition. J. Anim. Sci. 84:140-149.
Jortay, J., M. Senou, M. Abou-Samra, L. Noel, A. Robert, M.C. Many, and S.M.
Brichard. 2012. Adiponectin and skeletal muscle pathophysiological implications in
metabolic stress. American Journal of Pathology. 181:245-256.
Jump, D. B., Clarke, S. D., Thelen, A., & Liimatta, M. (1994). Coordinate regulation of
glycolytic and lipogenic gene expression by polyunsaturated fatty acids. Journal of lipid
research. 35:1076-1084.
93
Kersten, S., J. Seydoux, J.M. Peters, F.J. Gonzalez, B. Desvergne, and W. Wahli. 1999.
Peroxisome proliferator–activated receptor α mediates the adaptive response to
fasting. Journal of clinical investigation. 103:1489.
Kersten, S. 2001. Mechanisms of nutritional and hormonal regulation of
lipogenesis. EMBO reports. 2:282-286.
Khan, I.M., X.Y. Perrard, G. Brunner, H. Lui, L.M., Sparks, S.R. Smith, X. Wang, Z.Z.
Shi, D.E. Lewis, H. Wu and C.M. Ballantyne. 2015. Intermuscular and perimuscular fat
expansion in obesity correlates with skeletal muscle T cell and macrophage infiltration
and insulin resistance. International Journal of Obesity. 39:1607-1618.
Kim, C. J., and E. S. Lee. 2003. Effects of quality grade on the chemical, physical and
sensory characteristics of Hanwoo (Korean native cattle) beef. Meat Science 63: 397-405.
Kontrogianni-Konstantopoulos, A., M.A. Ackermann, A.L. Brown, S.V. Yap, and R.J.
Bloch. 2009. Muscle giants: molecular scaffolds in sarcomerogenesis. Physiological
Reviews. 89:1217-1267.
Koohmaraie, M. 1990. Inhibitino of postmortem tenderization in ovine carcasses through
infusion of zinc. J. Anim. Sci. 68:1476-1483.
Koohmaraie, M. 1994. Muscle proteinases and meat aging. Meat Sci. 36: 93-104.
Koohmaraie, M., J.D. Crouse, and H.J. Mersmann. 1989. Acceleration of postmortem
tenderization in ovine carcasses through infusion of calcium choride: effect of
concentration and ionic strength. J. Anim. Sci. 67:934-942.
Koohmaraie, M., W.H. Kennick, A.F. Anglemier, E.A. Elgasim, and T.K. Jones. 1984.
Effect of postmortem storage on cold‐shortened bovine muscle: analysis by SDS‐
Polyacrylamide Gel Electrophoresis. J. Food Sci. 49:290-291.
Koohmaraie, M., T.L. Wheeler, and S.D. Shackelford. 1995. Beef tenderness: regulation
and prediction. In: Meat ’95, CSIRO Meat Ind. Res. Conf. Session, Australia, Cannon
Hill, Queensland. p. 1−10.
Koohmaraie, M., G. Whipple, and J.D. Crouse. 1990. Acceleration of postmortem
tenderization in lamb and Brahman-cross beef carcasses through infusion of calcium
chloride. J. Anim. Sci. 68:1278-1283.
Kosteli, A., E. Sugaru, G. Haemmerle, J.F. Martin, J. Lei, R. Zechner, and A.W. Ferrante.
2010. Weight loss and lipolysis promote a dynamic immune response in murine adipose
tissue. Journal of Clinical Investigation. 120:3466-34-79.

94
Kreikemeier, K.K., J.A. Unruh, and T.P. Eck. 1998. Factors affecting the occurrence of
dark-cutting beef and selected carcass traits in finished beef cattle. J. Anim. Sci. 76:388-
395.
La Cava, A., and G. matarese. 2004. The weight of leptin in immunity. Nature Reviews
Immunology. 4:371-379.
Lacourt, A., and P.V. Tarrant. 1985. Glycogen depletion patterns in myofibres of cattle
during stress. Meat Sci. 15:85-110.
Lafontan, M., and D. Langin. 2009. Lipolysis and lipid mobilization in human adipose
tissue. Progress in Lipid Research. 48:275-297.
Lane, M.D., J.R. Flores-Riveros, R.C. Hresko, K.H. Kaestner, K. Liao, M. Janicot, R.D.
Hoffman, J.C. McLenithan, T. Kastelic. and R.J. Christy. 1990. Insulin-receptor tyrosine
kinase and glucose transport. Diabetes Care. 13:565-575.
Lass, A., R. Zimmermann, M. Oberer, and R. Zechner. 2011. Lipolysis- a highly
regulated multi-enzyme complex mediates the catabolism of cellular fat stores. Progress
in Lipid Research. 50:14-27.
Lawrie, R.A. 1958. Physiological stress in relation to dark-cutting beef. J. Sci. Food and
Agriculture. 9:721-727.
Lee, D. 1965. Climatic stress indices for domestic animals. International Journal of
Biometeorology. 9:29-35.
Lehr, S., S. Hartwig, and H. Sell. 2012. Adipokines: a treasure trove for the discovery of
biomarkers for metabolic disorders. Proteomics Clinical Applications. 6:91-101.
Li, C., G. Zhou, X. Xu, J. Zhang, S. Xu, and Y. Ji. 2006. Effects of marbling on meat
quality characteristics and intramuscular connective tissue of beef longissimus muscle.
Asian Australian Journal of Animal Sciences. 19:1799-1808.
Locker, R.H., and J.G. Daines. 1976. Tenderness in relation to the temperature of rigor
onset in cold shortened beef. Journal of the Science of Food and Agriculture. 27:193-196.
Locker, R.H., and C.J. Hagyard. 1963. A cold shortening effect in beef muscles. J. Sci.
Food and Agriculture. 14:787-793.
Lonergan, E.H, W. Zhang, and S.M. Lonergan. 2010. Biochemistry of postmortem
muscle-lessons on mechanisms of meat tenderization. Meat Sci. 86:184-195.
MacDougal, O.A., and M.D. Lane. 1995. Transcriptional regulation of gene-expression
during adipocyte differentiation. Annual Review of Biochemistry. 64:345-373.
95
Magkos, F., G. Fraterrigo, J. Yoshino, C. Luecking, K. Kirbach, S.C. Kelly, L. de las
Fuentes, S.B. He, A.L. Okunade, B.W. Patterson, and S. Klein. 2016. Effects of moderate
and subsequent progressive weight loss on metabolic function and adipose tissue biology
in humans with obesity. Cell Metabolism. 23:591-601.
Malau-Aduli, A.E.O., B.D. Siebert, C.D.K. Bottema, and W.S. Pitchford. 1998. Breed
comparison of the fatty acid composition of muscle phospholipids in Jersey and Limousin
cattle. J. Anim. Sci. 76:766-773.
Martson, S.B., and C.W.J. Smith. 1985. The thin filaments of smooth muscle. J. Muscle
Research and Cell Motility. 6:669-708.
Maruyama, K., S. Matsubara, R. Natori, Y. Nonomura, S. Kimura, K. Ohashi, F.
Murakami, S. Handa, and G. Eguchi. 1977. Connectin, an elastic protein of muscle. The
Journal of Biochemistry. 82:317-337.
McKeith, F.K., J.W. Savell, and G.C. Smith. 1981. Tenderness improvement of the major
muscles of the beef carcass by electrical-stimulation. J. Food. Sci. 46:1774-1776.
Miller, M.F., M.A., Carr, C.B. Ramsey, K.L. Crockett, and L.C. Hoover. 2001. Consumer
thresholds for establishing the value of beef tenderness. J. Anim. Sci. 79:3062-3068.
Miller, M.F., L.C. Hoover, K.D. Cook, A.L. Guerra, K.L. Huffman, K.S. Tinney, C.B.
Ramsey, H.C. Brittin, and L.M. Huffman. 1995. Consumer acceptability of beef steak
tenderness in the home and restaurant. J. Food Sci. 60: 963-965.
Miyoshi, H., J.W. Perfield, M.S. Obin, and A.S. Greenberg. 2008. Adipose triglyceride
lipase regulates basal lipolysis and lipid droplet size in adipocytes. Journal of Cellular
biochemistry. 105:1430-1436.
Moeller, P.W., P.A. Fields, T.R. Dutson, W.A. Landmann, and Z.L. Carpenter. 1976.
Effect of high temperature conditioning on subcellular distribution and levels of
lysosomal enzymes. J. Food Sci. 41:261-217.
Morgan, J.B. 1992. The final report of the national beef quality audit - 1991. Colorado
State University.
Morgan, J.B, J.W. Savell, D.S. Hale, R.K. Miller, D.B. Griffin, H.R. Cross, and S.D.
Shackelford. 1991. National beef tenderness survey. J. Anim. Sci. 69: 3274-3283.
Mounier, L., H. Dubroeucq, S. Andanson, and I. Veissier. 2006. Variations in meat pH of
beef bulls in relation to conditions of transfer to slaughter and previous history of the
animals. J. Anim. Sci. 84:1567-1576.
Nakae, J., and D. Accili. 1999. The mechanism of insulin action. Journal of Pediatric
Endocrinology & Metabolism. 12:721.

96
Nicol, D.J., M.K. Shaw, and D.A. Ledward. 1970. Hydrogen sulfide production by
bacteria and sulfmyoglobin formation in prepacked chilled beef. Applied Microbiology.
19:937-939.
Nurnberg, K., and K. Ender. 1989. Fatty-acid composition in back fat of barrows, female
fattening pigs and young boars. Archiv Fur Tierzucht – Archives of Animal Breeding.
32:455-464.
Nurnberg, K., S. Grumback, H.J. Papstein, H.D. Matthew, K. Ender, and G. Nurnberg.
1996. Fat composition of lamb. Fett/Lipid (Germany). 98:77-80.
Nurnberg, K., J. Wegner, and K. Ender. 1998. Factors influencing fat composition in
muscle and adipose tissue of farm animals. Livestock production Science. 56:145-156.
OHalloran, G.R., D.J. Troy, and D.J. Buckley. 1997. The relationship between early post-
mortem pH and the tenderisation of beef muscles. Meat Sci. 45:239-251.
Ouali, A., C.H. Herrera-Mendez, G. Coulis, S. Becila, A. Boudjellal, L. Aubry, and M.A.
Sentandreu. 2006. Revisiting the conversion of muscle into meat and the underlying
mechanisms. Meat Sci. 74:44-58.
Ouchi, N., J.L. Parker, J.J. Lugus, and K. Walsh. 2011. Adipokines in inflammation and
metabolic disease. Nature Reviews Immunology. 11:85-97.
Park, B.Y., S.H. Cho, Y.M. Yoo, J.H. Kim, J.M. Lee, S.K. Joung, and Y.K. Kim. 2000.
Effect of intramuscular fat contents on the physicochemical properties of beef
longissimus dorsi from Hanwoo. Korean Journal of Animal Sciences. 42:189-194.
Parrish, F.C., R.B. Young, B.E. Miner, and L.D. Andersen. 1973. Effect of postmortem
conditions on certain chemical, morphological and organoleptic properties of bovine
muscle. J. Food Sci. 38:690-695.
Pearlstone, J.R., and L.B. Smillie. 1982. Binding of troponin-T fragments to several types
of tropomyosin. Sensitivity to Ca2+ in the presence of troponin-C. J. of Biological
Chemistry, 257:10587-10592.
Pearson, A. M. 1966. Desirability of beef—its characteristics and their measurement.
Journal of animal science. 25:843-854.
Penny, I.F., and E. Dransfield. 1979. Relationship between toughness and troponin T in
conditioned beef. Meat Sci. 3:135-141.
Pierson, C.J., and J.D. Fox. 1976. Effect of postmortem aging time and temperature on
pH, tenderness and soluble collagen fractions in bovine muscle. J. Anim. Sci. 43:1206-
1210.
97
Platter, W. J., J.D. Tatum, K.E. Belk, P.L. Chapman, J.A. Scanga, and G.C. Smith. 2003.
Relationships of consumer sensory ratings, marbling score, and shear force value to
consumer acceptance of beef strip loin steaks. J. Anim. Sci. 81: 2741-2750.
Price, M.G., D.R. Caprette, and R.H. Gomer. 1994. Different temporal patterns of
expression result in the same type, amount and distribution of filamin (ABP) in cardiac
and skeletal myofibrils. Cytoskeleton, 27:248-261.
Pruitt, K.D., G.R. Brown, S.M. Hiatt, F. Thibaud-Nissen, A. Astashyn, O. Ermolaeva,
C.M. Farrell, J. Hart, M.J. Landrum, K.M. McGarvey, and M.R. Murphy. 2013. RefSeq:
an update on mammalian reference sequences. Nucleic acids research, 42:D756-D763.
Richardson, F.L., M.H. Stromer, T.W. Huiatt, and R.M Robson. 1981.Immunoelectron
and immunofluorescence localization of desmin in mature avian muscles. European
Journal of Cell Biology. 26:91-101.
Robelin, J. 1986. Growth of adipose tissues in cattle- partitioning between depots,
chemical-composition and cellularity- a review. Livestock Production Science. 14:349-
364.
Robson, R.M. 1995. Myofibrillar and cytoskeletal structures and proteins in mature
skeletal muscle cells. Expression of Tissue Proteinases and regulation of Protein
Degradation as Related to Meat Quality. 267-288.
Sakakura, Y., H. Shimano, H. Sone, A. Takahashi, K. Inoue, H. Toyoshima, S. Suzuki,
and N. Yamada. 2001. Sterol regulatory element-binding proteins induce an entire
pathway of cholesterol synthesis. Biochemical and Biophysical Research
Communications. 286:176-183.
Savell, J.W. 1979. Update: industry acceptance of electrical stimulation [beef processing
plants; USA]. In: Proceedings 32nd
Reciprocal meat Conf. p. 113-117
Savell, J.W., R.E. Branson, H.R. Cross, D.M. Stiffler, J.W. Wise, D.B. Griffin, and G.C.
Smith. 1987. National consumer retail beef study - palatability evaluations of beef loin
steaks that differed in marbling. J. Food Sci. 52:517-519, 532.
Savell, J.W., F.K. McKeith, and G.C. Smith. 1981. Reducing postmortem aging time of
beef with electrical-stimulation. J. Food Sci. 46:1777-1781.
Savell, J.W., S.L Mueller, and B.E. Baird. 2005. The chilling of carcasses. Meat Sci.
70:449-459.
Savell, J.W., G.C. Smith, and Z.L. Carpenter. 1978. Beef quality and palatability as
affected by electrical stimulation and cooler aging. J. Food Sci. 43:1666-1668.

98
Savell, J.W., G.C. Smith, Z.L. Carpenter, and F.C. Parrish. 1979. Influence of electrical
stimulation on certain characteristics of heavy-weight beef carcasses. J. Food Sci. 44:911-
913.
Scanes, C.G. 2003. Adipose growth. In: C.G. Scanes, editor, Biology of growth of
domestic animals. Iowa State Press, Ames, IA. p. 186-213.
Sentandreu, M.A., G. Coulis, and A. Ouali. 2002. Role of muscle endopeptidases and
their inhibitors in meat tenderness. Trends in Food and Science Technology. 13:400-421.
Shackelford, S.D., M. Koohmaraie, L.V. Cundiff, K.E. Gregory, G.A. Rohrer, and J.W.
Savell. 1994. Heritabilities and phenotypic and genetic correlations for bovine postrigor
calpastatin activity, intramuscular fat content, Warner-Bratzler shear force, retail product
yield, and growth rate. J. Anim. Sci. 72:857-863.
Shackelford, S.D., M. Koohmaraie, G. Whipple, T.L. Wheeler, M.F. Miller, J.D. Crouse,
and J.O. Reagan. 1991. Predictors of beef tenderness- development and verification. J.
Food Sci. 56:1130-1135.
Shackelford, S.D., T.L, Wheeler, M.K. Meade, J.O. Reagan, B.L. Byrnes, and
Koohmaraie, M. 2001. J. Anim. Sci. 79: 2605-2614.
Shen, Q.W., and Du, M. 2015. Conversion of muscle to meat. In: W. Przybylski and D.
Hopkins, editors, Meat quality; genetic and environmental factors. CRC Press. p. 81-100.
Siegrist-Kaiser, C.A., V. Pauli, C.E. Juge-Aubry, O. Boss, A. Pernin, W.W. Chin, I.
Cusin, F. Rohner-Jeanrenaud, A.G. Burger, J. Zapf, and C.A. Meier. 1997. Direct effects
of leptin on brown and white adipose tissue. Journal of Clinical Investigation. 100:2858-
2864.
Silva, J.A., L. Patarata, and C. Martins. 1999. Influence of ultimate pH on bovine meat
tenderness during aging. Meat Sci. 52:453-459.
Simone, M., F. Carroll, and M.T. Clegg. 1958. Effect of degree of finish on differences in
quality factors of beef. Journal of Food Science, 23(1), 32-40.
Smith, G. C., Z. L. Carpenter, H. R. Cross, C. E. Murphey, H. C. Abraham, J. W. Savell,
G. W. Davis, B. W. Berry, and F. C. Parrish. 1985. Relationship of USDA marbling
groups to palatability of cooked beef. Journal of Food Quality. 7: 289-308.
Smulders, F.J.M., F. Toldrá, J. Flores, and M. Prieto. 1992. New technologies for meat
and meat products. Utrecht, The Netherlands: AUDE Tijdschriften. 182:186-188.
Soukas, A., P. Cohen, N.D. Socci, and J.M. Friedman. 2000. Leptin-specific patterns of
gene expression in white adipose tissue. Genes & Development. 14:963-980.
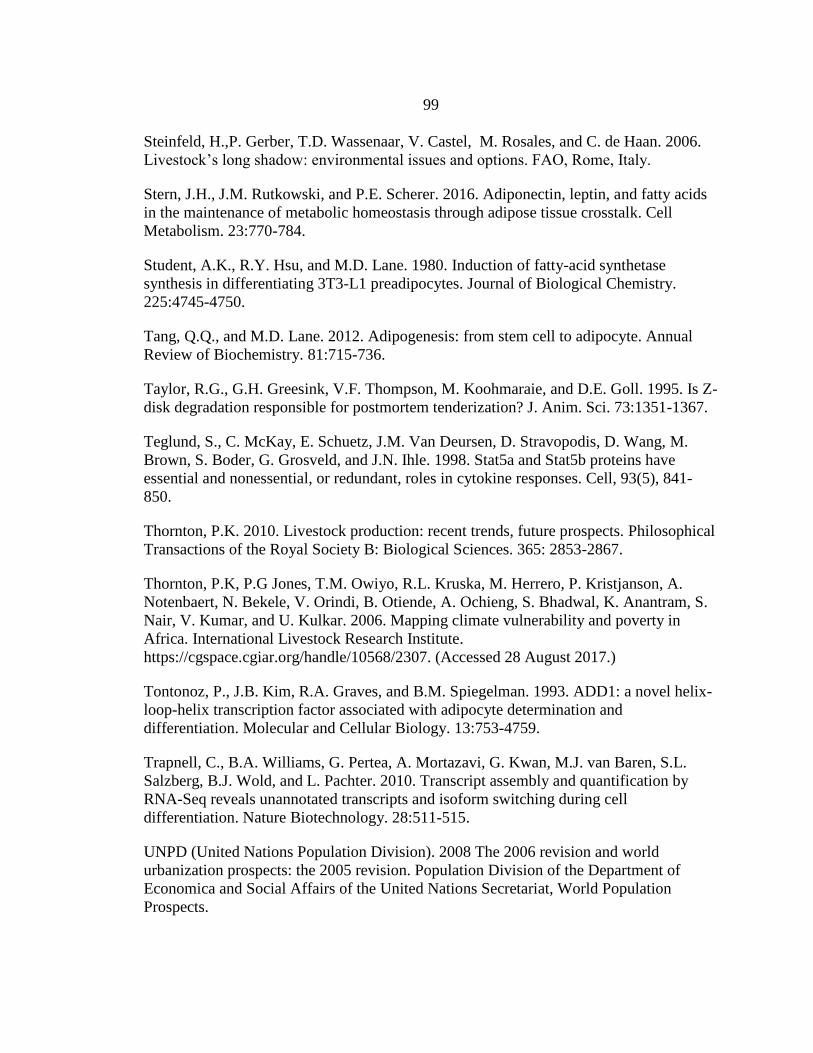
99
Steinfeld, H.,P. Gerber, T.D. Wassenaar, V. Castel, M. Rosales, and C. de Haan. 2006.
Livestock’s long shadow: environmental issues and options. FAO, Rome, Italy.
Stern, J.H., J.M. Rutkowski, and P.E. Scherer. 2016. Adiponectin, leptin, and fatty acids
in the maintenance of metabolic homeostasis through adipose tissue crosstalk. Cell
Metabolism. 23:770-784.
Student, A.K., R.Y. Hsu, and M.D. Lane. 1980. Induction of fatty-acid synthetase
synthesis in differentiating 3T3-L1 preadipocytes. Journal of Biological Chemistry.
225:4745-4750.
Tang, Q.Q., and M.D. Lane. 2012. Adipogenesis: from stem cell to adipocyte. Annual
Review of Biochemistry. 81:715-736.
Taylor, R.G., G.H. Greesink, V.F. Thompson, M. Koohmaraie, and D.E. Goll. 1995. Is Z-
disk degradation responsible for postmortem tenderization? J. Anim. Sci. 73:1351-1367.
Teglund, S., C. McKay, E. Schuetz, J.M. Van Deursen, D. Stravopodis, D. Wang, M.
Brown, S. Boder, G. Grosveld, and J.N. Ihle. 1998. Stat5a and Stat5b proteins have
essential and nonessential, or redundant, roles in cytokine responses. Cell, 93(5), 841-
850.
Thornton, P.K. 2010. Livestock production: recent trends, future prospects. Philosophical
Transactions of the Royal Society B: Biological Sciences. 365: 2853-2867.
Thornton, P.K, P.G Jones, T.M. Owiyo, R.L. Kruska, M. Herrero, P. Kristjanson, A.
Notenbaert, N. Bekele, V. Orindi, B. Otiende, A. Ochieng, S. Bhadwal, K. Anantram, S.
Nair, V. Kumar, and U. Kulkar. 2006. Mapping climate vulnerability and poverty in
Africa. International Livestock Research Institute.
https://cgspace.cgiar.org/handle/10568/2307. (Accessed 28 August 2017.)
Tontonoz, P., J.B. Kim, R.A. Graves, and B.M. Spiegelman. 1993. ADD1: a novel helix-
loop-helix transcription factor associated with adipocyte determination and
differentiation. Molecular and Cellular Biology. 13:753-4759.
Trapnell, C., B.A. Williams, G. Pertea, A. Mortazavi, G. Kwan, M.J. van Baren, S.L.
Salzberg, B.J. Wold, and L. Pachter. 2010. Transcript assembly and quantification by
RNA-Seq reveals unannotated transcripts and isoform switching during cell
differentiation. Nature Biotechnology. 28:511-515.
UNPD (United Nations Population Division). 2008 The 2006 revision and world
urbanization prospects: the 2005 revision. Population Division of the Department of
Economica and Social Affairs of the United Nations Secretariat, World Population
Prospects.

100
Veiseth, E., and M. Koohmaraie. 1994. Beef tenderness: significance of the calpain
proteolytic system. In: J.F. Hocquette and S. Gigli editors, Indicators of milk and beef
quality. Wageningen Academic Publishers, The Netherlands. p. 111-126.
Veiseth, E., S.D. Shackelford, T.L. Wheeler, and M. Koohmaraie. 2004. Indicators of
tenderization are detectable by 12 hours postmortem in ovine longissimus. J. Anim. Sci.
82:1428-1436.
Viljoen, H.F., H.L. de Kock, and E.C. Webb. 2002. Consumer acceptability of dark, firm
and dry (DFD) and normal pH beef steaks. Meat Sci. 61:181-185.
Walton, P.E., and T.D. Etherton. 1986. Stimulation of lipogenesis by insulin in swine
adipose-tissue-antagonism by porcine growth-hormone. J. Anim. Sci. 62:1584-1595.
Wang, M. Y., Y. Lee, and R.H. Unger. 1999. Novel form of lipolysis induced by leptin.
Journal of Biological Chemistry, 274:17541-17544.
Wang, K., J. McClure, and A.N.N. Tu. 1979. Titin: major myofibrillar components of
striated muscle. Proceedings of the National Academy of Sciences. 76:3698-3702.
Wang, Y., J. Liu, B.O. Huang, Y.M. Xu, J. Li, L.F. Huang, J. Lin, J. Zhang, Q.H. Min,
W.M. Yang, and X.Z. Wang. 2015. Mechanism of alternative splicing and its regulation.
Biomedical Reports. 3:152-158.
Warner, R. D., F. R. Dunshea, D. Gutzke, J. Lau, and G. Kearney. 2014. Factors
influencing the incidence of high rigor temperature in beef carcasses in Australia. Animal
Production Science. 54:363-374.
Warriss, P.D. 1990. The handling of cattle pre-slaughter and its effects on carcass and
meat quality. Applied Animal Behaviour Science. 28:171-186.
Wegner, J., E. Albrecht, and K. Ender. 1998. Morphological aspects of growth in
subcutaneous and intramuscular adipocytes in cattle. Archiv Fur Tierzucht – Archives of
Animal Breeding. 41:313-320.
Wegner, J.E., and H.D. Matthes. 1994. Cellular growth of muscle-fiber and fat-cells from
Hereford steers under extensive methods of management. Archiv Fur Tierzucht –
Archives of Animal Breeding. 37:599-604.
Wheeler, T. L., L.V. Cundiff, and R.M. Koch. 1994. Effect of marbling degree on beef
palatability in Bos taurus and Bos indicus cattle. Journal of animal Science. 72:3145-
3151.
Whipple, G., M. Koohmaraie, M.E. Dikeman, and J.D. Crouse. 1990. Predicting beef-
longissimus tenderness from various biochemical and histological muscle traits. J. Anim.
Sci. 68:4193-4199.

101
Whitaker, J.R. 1960. Chemical changes associated with aging of meat with emphasis on
the proteins. Advances in Food Research. 9:1-60.
Wilkes, D. 1992. The final report of the national beef quality audit - 1991. Colorado State
University.
William, W.N., R.B. Ceddia, and R. Curi. 2002. Leptin controls the fate of fatty acids in
isolated rate white adipocytes. Journal of Endocrinology. 175:735-744.
Wulf, D.M., R.S. Emnett, J.M. Leheska, and S.J. Moeller. 2002. Relationships among
glycolytic potential, dark cutting (dark, firm and dry) beef, and cooked beef palatability.
J. Anim. Sci. 80:1895-1903.
Yin, D., S.D. Clarke, J.L. Peters, and T.D. Etherton. 1998. Somatotropin-dependent
decrease in fatty acid synthase mRNA abundance in 3T3-F442A adipocytes is the result
of a decrease in both gene transcription and mRNA stability. Biochemical journal,
331(3), 815-820.
Yokoyama, C., X. Wang, M.R. Briggs, A. Admon, J. Wu, X. Hua, J.L. Goldstein, and
M.S. Brown. 1993. SREBP-1, a basic-helix-loop-helix-leucine zipper protein that
controls transcription of the low density lipoprotein receptor gene. Cell. 75:187-197.
Zhand, S.X., M.M. Farouk, O.A. Young, K.J. Wieliczko, and C. Podmore. 2005.
Functional stability of frozen normal and high pH beef. Meat Sci. 69:765-722.
Zinn, D. W., R.M. Durham, and H.B. Hedrick. 1970. Feedlot and carcass grade
characteristics of steers and heifers as influenced by days on feed. Journal of Animal
Science, 31(2), 302-306.

102
APPENDICES

103
APPENDIX A
DIFFERENTIALLY EXPRESSED GENES
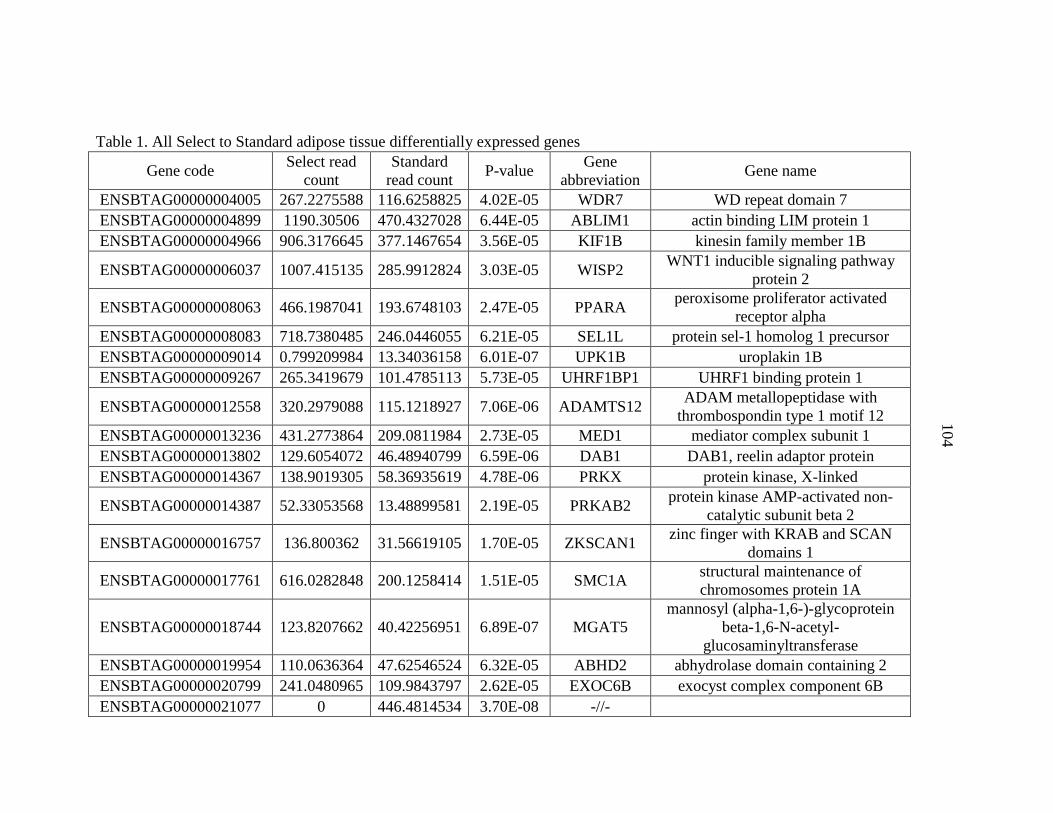
104
Table 1. All Select to Standard adipose tissue differentially expressed genes
Gene code Select read
count
Standard
read count P-value
Gene
abbreviation Gene name
ENSBTAG00000004005 267.2275588 116.6258825 4.02E-05 WDR7 WD repeat domain 7
ENSBTAG00000004899 1190.30506 470.4327028 6.44E-05 ABLIM1 actin binding LIM protein 1
ENSBTAG00000004966 906.3176645 377.1467654 3.56E-05 KIF1B kinesin family member 1B
ENSBTAG00000006037 1007.415135 285.9912824 3.03E-05 WISP2 WNT1 inducible signaling pathway
protein 2
ENSBTAG00000008063 466.1987041 193.6748103 2.47E-05 PPARA peroxisome proliferator activated
receptor alpha
ENSBTAG00000008083 718.7380485 246.0446055 6.21E-05 SEL1L protein sel-1 homolog 1 precursor
ENSBTAG00000009014 0.799209984 13.34036158 6.01E-07 UPK1B uroplakin 1B
ENSBTAG00000009267 265.3419679 101.4785113 5.73E-05 UHRF1BP1 UHRF1 binding protein 1
ENSBTAG00000012558 320.2979088 115.1218927 7.06E-06 ADAMTS12 ADAM metallopeptidase with
thrombospondin type 1 motif 12
ENSBTAG00000013236 431.2773864 209.0811984 2.73E-05 MED1 mediator complex subunit 1
ENSBTAG00000013802 129.6054072 46.48940799 6.59E-06 DAB1 DAB1, reelin adaptor protein
ENSBTAG00000014367 138.9019305 58.36935619 4.78E-06 PRKX protein kinase, X-linked
ENSBTAG00000014387 52.33053568 13.48899581 2.19E-05 PRKAB2 protein kinase AMP-activated non-
catalytic subunit beta 2
ENSBTAG00000016757 136.800362 31.56619105 1.70E-05 ZKSCAN1 zinc finger with KRAB and SCAN
domains 1
ENSBTAG00000017761 616.0282848 200.1258414 1.51E-05 SMC1A structural maintenance of
chromosomes protein 1A
ENSBTAG00000018744 123.8207662 40.42256951 6.89E-07 MGAT5
mannosyl (alpha-1,6-)-glycoprotein
beta-1,6-N-acetyl-
glucosaminyltransferase
ENSBTAG00000019954 110.0636364 47.62546524 6.32E-05 ABHD2 abhydrolase domain containing 2
ENSBTAG00000020799 241.0480965 109.9843797 2.62E-05 EXOC6B exocyst complex component 6B
ENSBTAG00000021077 0 446.4814534 3.70E-08 -//-
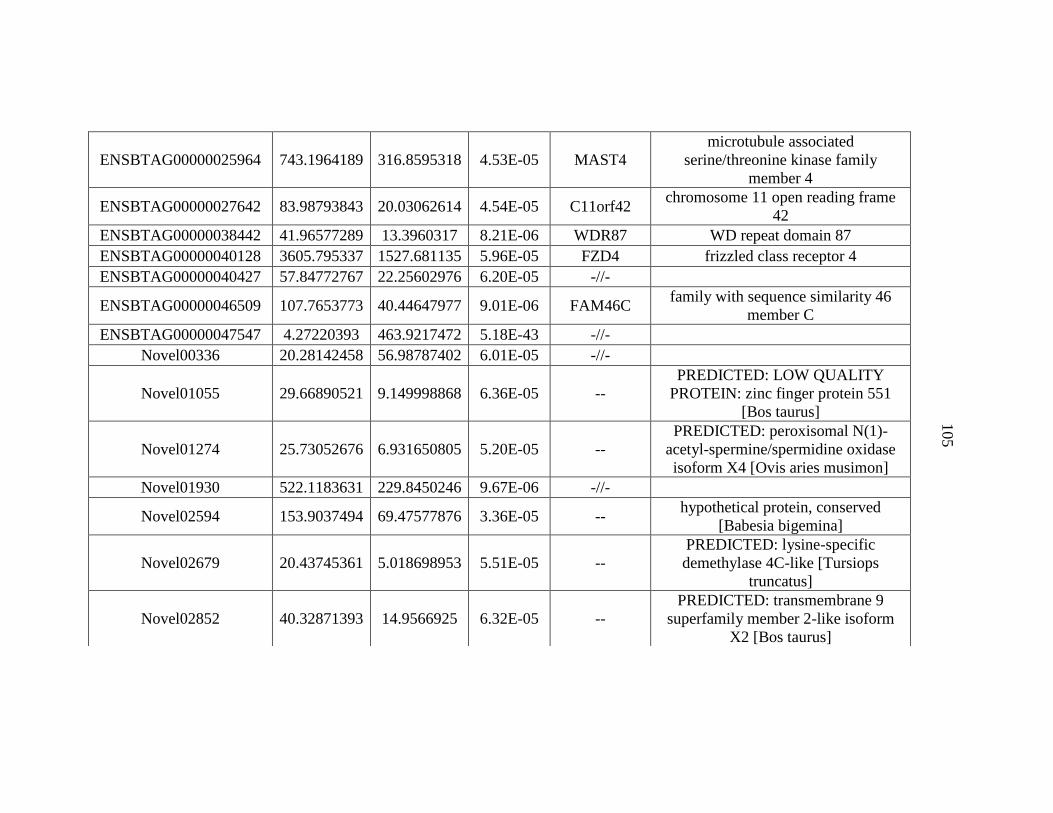
105
ENSBTAG00000025964 743.1964189 316.8595318 4.53E-05 MAST4
microtubule associated
serine/threonine kinase family
member 4
ENSBTAG00000027642 83.98793843 20.03062614 4.54E-05 C11orf42 chromosome 11 open reading frame
42
ENSBTAG00000038442 41.96577289 13.3960317 8.21E-06 WDR87 WD repeat domain 87
ENSBTAG00000040128 3605.795337 1527.681135 5.96E-05 FZD4 frizzled class receptor 4
ENSBTAG00000040427 57.84772767 22.25602976 6.20E-05 -//-
ENSBTAG00000046509 107.7653773 40.44647977 9.01E-06 FAM46C family with sequence similarity 46
member C
ENSBTAG00000047547 4.27220393 463.9217472 5.18E-43 -//-
Novel00336 20.28142458 56.98787402 6.01E-05 -//-
Novel01055 29.66890521 9.149998868 6.36E-05 --
PREDICTED: LOW QUALITY
PROTEIN: zinc finger protein 551
[Bos taurus]
Novel01274 25.73052676 6.931650805 5.20E-05 --
PREDICTED: peroxisomal N(1)-
acetyl-spermine/spermidine oxidase
isoform X4 [Ovis aries musimon]
Novel01930 522.1183631 229.8450246 9.67E-06 -//-
Novel02594 153.9037494 69.47577876 3.36E-05 -- hypothetical protein, conserved
[Babesia bigemina]
Novel02679 20.43745361 5.018698953 5.51E-05 --
PREDICTED: lysine-specific
demethylase 4C-like [Tursiops
truncatus]
Novel02852 40.32871393 14.9566925 6.32E-05 --
PREDICTED: transmembrane 9
superfamily member 2-like isoform
X2 [Bos taurus]

106
Table 2. All Select to Choice adipose tissue differentially expressed genes
Gene code Select reads Choice reads P-value Gene
abbreviation Gene name
ENSBTAG00000000246 93.57279 242.8505 4.72E-06 ME3 malic enzyme 3
ENSBTAG00000002046 1622.573 747.691 3.29E-05 -//-
ENSBTAG00000004836 35.63447 11.64995 3.63E-05 - nik-related protein kinase
ENSBTAG00000007860 54.59434 19.44777 1.50E-05 ASPM abnormal spindle microtubule
assembly
ENSBTAG00000010682 2522.631 8199.678 3.34E-07 DDR1 epithelial discoidin domain-
containing receptor 1 precursor
ENSBTAG00000010774 72.09664 24.89427 5.29E-06 NUSAP1 nucleolar and spindle associated
protein 1
ENSBTAG00000012638 73.03628 190.5465 5.60E-06 S100A12 S100 calcium binding protein A12
ENSBTAG00000013107 103.7719 281.0858 1.10E-05 SHANK1 SH3 and multiple ankyrin repeat
domains 1
ENSBTAG00000014340 914.4057 322.5862 1.60E-06 KERA keratocan
ENSBTAG00000014911 2371.164 8660.136 2.46E-05 LEP leptin
ENSBTAG00000015606 776.855 1673.526 3.64E-05 KAZN kazrin, periplakin interacting protein
ENSBTAG00000018777 818.903 2158.209 6.08E-07 ADCY5 adenylate cyclase type 5
ENSBTAG00000019262 164.7217 55.94236 9.34E-06 TOP2A topoisomerase (DNA) II alpha
ENSBTAG00000020510 7.363604 33.47247 2.69E-05 EPHA10 EPH receptor A10
ENSBTAG00000024449 100.5042 36.31176 1.13E-05 CENPF centromere protein F
ENSBTAG00000025071 98.78828 40.90729 3.44E-05 TENM2 teneurin transmembrane protein 2
ENSBTAG00000047569 45.98635 11.67487 2.52E-06 -//-
Novel00469 63.13649 18.90977 2.17E-05 -- PREDICTED: taste receptor type 2
member 42-like, partial [Bos mutus]
Novel00632 190.0347 86.7887 2.80E-05 --
PREDICTED: carbonyl reductase
[NADPH] 1-like isoform X2 [Ovis
aries musimon]

107
Novel00720 85.55824 28.22112 1.55E-05 --
PREDICTED: extracellular calcium-
sensing receptor-like [Equus
caballus]
Novel01757 266.9865 58.33762 4.92E-09 --
PREDICTED: EF-hand calcium-
binding domain-containing protein 1
isoform X5 [Ovis aries musimon]
Novel02471 90.95808 25.75499 4.06E-08 -- hypothetical protein, conserved
[Babesia bigemina]
Novel03001 56.70565 20.14489 2.77E-05 -- PREDICTED: protein FAM209A-
like [Capra hircus]
Table 3. All Choice to Standard adipose tissue differentially expressed genes
Gene code Choice reads Standard reads P-value Gene
abbreviation Gene name
ENSBTAG00000000246 250.7052991 73.68379006 1.89E-09 ME3 malic enzyme 3
ENSBTAG00000000434 7784.499258 3431.10319 0.00012813 CRYAB Alpha-crystallin B chain
ENSBTAG00000000590 226.9117871 86.6078087 6.78E-06 POLE DNA polymerase epsilon catalytic
subunit A
ENSBTAG00000000795 390.8553402 205.3570194 0.00023351 NMNAT2 nicotinamide nucleotide
adenylyltransferase 2
ENSBTAG00000001165 1162.853956 2374.914417 0.00032838 AIFM2
Bos taurus apoptosis-inducing factor,
mitochondrion-associated, 2
(AIFM2), mRNA.
mRNA;Acc:NM_001314031]
ENSBTAG00000001639 64.58725422 19.94262221 0.00017681 TRPM1 transient receptor potential cation
channel subfamily M member 1
ENSBTAG00000002046 770.8317745 2351.932618 9.89E-05 -//-
ENSBTAG00000002129 45.907215 168.8853594 4.22E-05 KLF5 Kruppel like factor 5
ENSBTAG00000002356 403.832636 64.55735831 8.60E-08 RBM47 RNA binding motif protein 47

108
ENSBTAG00000002915 99.52090129 20.93112191 3.52E-05 GPR63 G protein-coupled receptor 63
ENSBTAG00000003113 361.6009376 82.66910702 7.97E-06 RNF125 ring finger protein 125
ENSBTAG00000003192 1984.509382 896.6898214 1.85E-05 TBC1D16 TBC1 domain family member 16
ENSBTAG00000003196 579.101913 256.863223 0.0001318 PAPSS2 bifunctional 3'-phosphoadenosine 5'-
phosphosulfate synthase 2
ENSBTAG00000003359 18780.52553 6929.674559 4.39E-06 ELOVL5 ELOVL fatty acid elongase 5
ENSBTAG00000003650 142.1944924 291.1420581 0.00025272 NR4A2 nuclear receptor subfamily 4 group A
member 2
ENSBTAG00000003658 70.73350439 166.1783114 4.50E-05 RELN reelin precursor
ENSBTAG00000004005 261.4677221 125.5170888 0.00030617 WDR7 WD repeat domain 7
ENSBTAG00000004034 504.963705 146.939931 0.00018661 SESN3 sestrin 3
ENSBTAG00000004077 8903.965131 4647.780626 0.00032637 YWHAG
tyrosine 3-monooxygenase/tryptophan
5-monooxygenase activation protein
gamma Symbol;Acc:HGNC:12852]
ENSBTAG00000004204 510.303486 213.0706758 7.43E-05 GPR107 protein GPR107
ENSBTAG00000004300 84.50046528 34.40160517 0.00022617 LRRC8E leucine rich repeat containing 8 family
member E
ENSBTAG00000004720 1140.145198 587.6405401 0.00019042 SULF1 sulfatase 1
ENSBTAG00000005198 506.3863588 145.3035765 2.62E-07 FGF1 Fibroblast growth factor 1
ENSBTAG00000005586 417.1646124 1039.848698 0.00015378 GATM glycine amidinotransferase
ENSBTAG00000005882 227.5664387 108.572303 0.00022702 ZNF333 zinc finger protein 333
ENSBTAG00000006673 14.60536802 3.186135254 0.00013682 TMEM179 transmembrane protein 179
ENSBTAG00000007100 720.9799428 317.5857976 0.00017407 TRAPPC10 trafficking protein particle complex
subunit 10
ENSBTAG00000007273 4331.143363 660.5063872 1.84E-05 TF transferrin
ENSBTAG00000007348 3.924234092 22.8124883 0.00011414 STRA6 stimulated by retinoic acid 6
ENSBTAG00000007446 25.43454316 71.64164715 8.45E-05 NGF nerve growth factor
ENSBTAG00000007554 286.7050558 687.7824501 7.10E-05 IFI6 interferon alpha inducible protein 6
ENSBTAG00000007883 20.87941763 64.52713453 3.80E-06 -//-

109
ENSBTAG00000007962 2508.336262 950.7036823 1.08E-05 ATP9A ATPase phospholipid transporting 9A
(putative)
ENSBTAG00000008083 770.9016596 264.6692662 0.00027007 SEL1L protein sel-1 homolog 1 precursor
ENSBTAG00000008102 449.5864342 88.51469632 1.47E-10 CRTAC1 cartilage acidic protein 1 isoform 2
precursor
ENSBTAG00000008153 1208.256742 592.0753436 0.00015581 CAMSAP2 calmodulin regulated spectrin
associated protein family member 2
ENSBTAG00000008718 22.09564616 119.4963014 0.0003164 GALNT17 polypeptide N-
acetylgalactosaminyltransferase 17
ENSBTAG00000008731 3936.465232 1787.835603 7.13E-05 PRDX3 peroxiredoxin 3
ENSBTAG00000008793 115.5175062 318.0525096 9.59E-05 - Ribonuclease pancreatic
ENSBTAG00000008839 104.2225857 43.1304875 0.00030046 AMER1 APC membrane recruitment protein 1
ENSBTAG00000008953 839.7005392 1724.658702 0.00015085 TAP1 transporter 1, ATP binding cassette
subfamily B member
ENSBTAG00000009020 1588.852392 795.759823 0.00011775 CRIM1 cysteine rich transmembrane BMP
regulator 1
ENSBTAG00000009124 60.94627799 196.8139265 0.0001342 FEZ1 fasciculation and elongation protein
zeta 1
ENSBTAG00000009656 45.94515343 133.4541166 5.51E-06 -//-
ENSBTAG00000010129 6.85947537 27.0226973 0.00027094 SLITRK5 SLIT and NTRK like family member
5
ENSBTAG00000010245 38.66500396 7.990488784 6.04E-05 SPRY3 sprouty RTK signaling antagonist 3
ENSBTAG00000010371 132.4182819 20.52099345 1.00E-05 CHAC1 ChaC glutathione specific gamma-
glutamylcyclotransferase 1
ENSBTAG00000010457 307.3723061 144.8618899 0.00027081 NUAK1 NUAK family kinase 1
ENSBTAG00000010507 17.70476936 48.03666074 0.00019058 SLC22A16 solute carrier family 22 member 16
ENSBTAG00000010522 154.8755121 449.4070021 3.72E-06 SCART1 scavenger receptor family member
expressed on T-cells 1
ENSBTAG00000010682 8465.071608 3207.930816 4.65E-07 DDR1 epithelial discoidin domain-containing
receptor 1 precursor

110
ENSBTAG00000010719 604.9856401 1380.066199 0.00026176 ANGPTL1 angiopoietin like 1
ENSBTAG00000010793 42311.01119 22217.85077 0.00018533 CCDC80 coiled-coil domain containing 80
ENSBTAG00000010913 985.9225344 175.8777303 6.39E-06 SRXN1 sulfiredoxin 1
ENSBTAG00000011056 478.924219 168.1632382 3.52E-05 IDS iduronate 2-sulfatase precursor
ENSBTAG00000011337 361.9663297 109.841627 3.38E-06 ANKRD33B ankyrin repeat domain 33B
ENSBTAG00000011490 48.00169943 12.45635203 0.0001305 TLCD2 TLC domain containing 2
ENSBTAG00000012164 305.387429 71.06761959 2.63E-05 CP ceruloplasmin precursor
ENSBTAG00000012307 54.53535778 137.1799179 1.69E-05 DTNA dystrobrevin alpha
ENSBTAG00000012626 645.456104 274.8901731 1.45E-05 B4GALT5 beta-1,4-galactosyltransferase 5
ENSBTAG00000012991 813.1968235 277.6099451 0.00016775 PRUNE2 prune homolog 2
ENSBTAG00000013090 6.211781881 50.22041473 1.32E-05 NODAL nodal growth differentiation factor
ENSBTAG00000013107 290.0689623 66.51991687 5.95E-10 SHANK1 SH3 and multiple ankyrin repeat
domains 1
ENSBTAG00000013108 746.2792459 163.4152755 9.91E-05 HK2 hexokinase 2
ENSBTAG00000013899 1611.001045 741.2207175 3.86E-05 LARP4B La ribonucleoprotein domain family
member 4B
ENSBTAG00000013919 2226.193097 5980.916793 1.23E-06 -//-
ENSBTAG00000014005 6906.8681 3350.216416 0.00023478 PPIP5K1 diphosphoinositol pentakisphosphate
kinase 1
ENSBTAG00000014367 140.2823913 62.80375718 0.00021687 PRKX protein kinase, X-linked
ENSBTAG00000014422 2111.332999 1013.460598 0.00021424 MTMR10 myotubularin related protein 10
ENSBTAG00000014529 26.26729629 68.49631413 4.98E-05 -//-
ENSBTAG00000014536 558.6575698 198.4927234 2.51E-05 SFXN1 sideroflexin 1
ENSBTAG00000014615 107.2811422 17.79968995 2.12E-06 SLC26A2 solute carrier family 26 member 2
ENSBTAG00000014889 375.4091982 164.7915838 0.00015132 DCBLD2 discoidin, CUB and LCCL domain-
containing protein 2
ENSBTAG00000014911 8938.900072 3504.577478 0.00029652 LEP leptin
ENSBTAG00000015043 8114.583989 20064.49132 0.00033064 MFNG MFNG O-fucosylpeptide 3-beta-N-
acetylglucosaminyltransferase

111
ENSBTAG00000015177 4671.933098 1648.160975 1.09E-05 PRSS23 protease, serine 23
ENSBTAG00000015182 11.30698712 33.80167158 0.00017709 STARD10 StAR related lipid transfer domain
containing 10
ENSBTAG00000015307 15.95464182 60.20747405 9.17E-05 FBN2 fibrillin 2
ENSBTAG00000015351 39.45406143 8.093726686 2.79E-05 STYK1 Bos taurus serine/threonine/tyrosine
kinase 1 (STYK1), mRNA
ENSBTAG00000015419 1827.790243 687.3639809 1.85E-05 ARHGEF37 Rho guanine nucleotide exchange
factor 37
ENSBTAG00000015536 876.5298816 320.6710168 7.94E-05 CPNE3 copine 3
ENSBTAG00000015571 622.8985834 267.8919456 0.00030916 GCLC glutamate-cysteine ligase catalytic
subunit
ENSBTAG00000015606 1728.286076 535.9301528 2.23E-09 KAZN kazrin, periplakin interacting protein
ENSBTAG00000015607 452.8107606 143.9460943 1.32E-05 ERMP1 endoplasmic reticulum
metallopeptidase 1
ENSBTAG00000015690 50574.71056 24792.09741 1.88E-05 PLIN4 perilipin 4
ENSBTAG00000015829 128.6740147 48.45479203 7.06E-05 ENPP5
ectonucleotide
pyrophosphatase/phosphodiesterase 5
(putative)
ENSBTAG00000015844 1091.165284 2286.016647 0.00012817 TFPI2 tissue factor pathway inhibitor 2
ENSBTAG00000016071 17.35247576 52.08435641 0.00019537 HHIP hedgehog interacting protein
ENSBTAG00000016185 635.226806 249.9922756 9.26E-05 ENAH ENAH, actin regulator
ENSBTAG00000016612 1668.534121 757.5781036 0.00014287 NEK9 serine/threonine-protein kinase Nek9
ENSBTAG00000017069 449.7335938 150.098185 3.06E-06 FAM198B family with sequence similarity 198
member B
ENSBTAG00000017183 481.9889959 1076.093889 0.0002451 PDLIM3 PDZ and LIM domain 3
ENSBTAG00000017567 41420.41051 11910.59833 1.48E-06 -//-
ENSBTAG00000017811 973.620562 458.9769891 0.00026215 SLC39A9 solute carrier family 39 member 9
ENSBTAG00000017814 375.4529733 861.642656 3.18E-05 LGI4 leucine rich repeat LGI family
member 4

112
ENSBTAG00000017860 1204.821143 349.3857997 8.23E-05 HIPK2 homeodomain interacting protein
kinase 2
ENSBTAG00000018473 19.58660002 1.502643079 0.00021725 MARCO macrophage receptor with collagenous
structure
ENSBTAG00000018596 4114.720514 1809.355907 0.00029697 PTPN21 protein tyrosine phosphatase, non-
receptor type 21
ENSBTAG00000018936 4874.427411 2245.589364 0.00025442 LSS lanosterol synthase
ENSBTAG00000019146 49.78958759 189.1543759 0.00021501 OSBP2 oxysterol binding protein 2
ENSBTAG00000019181 292.8281455 78.18017565 0.00026904 BAIAP2L1 BAI1 associated protein 2 like 1
ENSBTAG00000019423 0.81944714 10.40662587 1.74E-05 -//-
ENSBTAG00000019792 40.13390616 10.54248153 1.79E-06 SLC16A9 solute carrier family 16 member 9
ENSBTAG00000020127 19.73092644 2.106505282 0.0001708 TKTL1 transketolase like 1
ENSBTAG00000020510 34.60591613 5.150384738 2.46E-08 EPHA10 EPH receptor A10
ENSBTAG00000021077 0.146795505 480.3474362 1.40E-08 -//-
ENSBTAG00000021201 118.5020032 39.05161595 7.59E-05 FAM126B family with sequence similarity 126
member B
ENSBTAG00000021272 191.7908079 59.80583548 1.64E-05 ABCG1 ATP-binding cassette sub-family G
member 1
ENSBTAG00000021846 14.74420116 2.844730792 0.00014296 CELSR3 cadherin EGF LAG seven-pass G-
type receptor 3 precursor
ENSBTAG00000021879 6675.435059 3242.223013 9.04E-05 VCL vinculin
ENSBTAG00000024272 57.34609064 202.6382997 3.87E-05 -//-
ENSBTAG00000026156 73.40221686 23.67674309 0.00012993 VGLL3 transcription cofactor vestigial-like
protein 3
ENSBTAG00000026586 19.93731473 59.43686 0.00012022 PPP1R14C
Bos taurus protein phosphatase 1,
regulatory (inhibitor) subunit 14C
(PPP1R14C), mRNA
ENSBTAG00000027477 114.7434722 238.1988715 0.00028404 B3GAT1 galactosylgalactosylxylosylprotein 3-
beta-glucuronosyltransferase 1
113
ENSBTAG00000027654 2192.044386 5928.113361 7.97E-05 EIF4EBP1 eukaryotic translation initiation factor
4E binding protein 1
ENSBTAG00000027727 0.307444632 10.96070206 1.03E-05 -//-
ENSBTAG00000031014 157.5461527 68.81413347 0.00011314 LDAH lipid droplet associated hydrolase
ENSBTAG00000033222 36.35171756 11.39967699 7.91E-05 CALR3 calreticulin 3
ENSBTAG00000034185 5757.145843 11502.16639 1.37E-05 -//-
ENSBTAG00000034222 190.0880086 83.56420309 4.76E-05 CAB39L calcium binding protein 39 like
ENSBTAG00000035959 894.8049265 2485.362411 8.74E-05 -//-
ENSBTAG00000038116 2088.388599 978.8673035 4.61E-05 TGOLN2 trans-golgi network protein 2
ENSBTAG00000038128 101.0001041 519.8998552 1.36E-06 -//-
ENSBTAG00000038865 87.09306416 406.6140231 7.39E-06 TCEA3 transcription elongation factor A
protein 3
ENSBTAG00000039231 11122.08267 4669.785231 0.00028924 MTURN maturin, neural progenitor
differentiation regulator homolog
ENSBTAG00000039520 96.46826651 473.6272009 0.00025263 -//-
ENSBTAG00000039817 1069.271446 75.9976309 0.00014606 -//-
ENSBTAG00000039935 111.0402338 39.44186874 1.66E-05 KCNC3 potassium voltage-gated channel
subfamily C member 3
ENSBTAG00000040128 3974.305284 1644.647695 5.79E-06 FZD4 frizzled class receptor 4
ENSBTAG00000043969 23.88666748 2.293306998 7.85E-05 CALN1 calcium-binding protein 8
ENSBTAG00000045728 113910.7939 31860.2529 0.00011489 - acyl-CoA desaturase
ENSBTAG00000046026 16.86312941 3.244113821 2.98E-05 SLC39A4 solute carrier family 39 member 4
ENSBTAG00000046671 5150.242679 2248.832526 2.30E-06 WFS1 wolframin ER transmembrane
glycoprotein
ENSBTAG00000046753 1682.520522 673.1060365 0.00018151 -//-
ENSBTAG00000047129 374.6071213 172.3349006 0.00020174 B3GNT6 UDP-GlcNAc:betaGal beta-1,3-N-
acetylglucosaminyltransferase 6
ENSBTAG00000047202 126.5940365 49.01673285 8.74E-06 GRIN1 glutamate ionotropic receptor NMDA
type subunit 1

114
ENSBTAG00000047547 63.7939157 499.0909109 3.26E-10 -//-
ENSBTAG00000047664 198.6901685 77.48955824 3.29E-05 GNAZ G protein subunit alpha z
ENSBTAG00000047957 39888.46882 10364.76124 4.15E-05 -//-
Novel00106 125.50364 53.69306147 5.84E-05 -- hypothetical protein,,conserved
[Babesia bigemina]
Novel00310 515.3340076 40.37445809 4.92E-06 --
PREDICTED: mitogen-activated
protein kinase 7-like isoform X2
[Ovis aries musimon]
Novel00311 64.06872708 7.426433227 5.04E-07 --
PREDICTED: DNA repair protein
complementing XP-C cells isoform
X1 [Ovis aries]
Novel00315 258.4548246 101.1330095 0.00013823 --
PREDICTED: uncharacterized protein
LOC101123602 isoform X1 [Ovis
aries]
Novel00370 50.92050676 9.59530524 0.00027891 -- PREDICTED: protein FAM47E
isoform X9 [Ovis aries musimon]
Novel00465 218.1937502 16.58386705 0.00023285 --
PREDICTED: protoheme IX
farnesyltransferase, mitochondrial-
like [Bos mutus]
Novel00589 67.85807695 18.5634269 1.28E-05 -- syncytin-Rum1 precursor [Bos taurus]
Novel00611 66.40055527 26.59275255 9.39E-05 --
PREDICTED: putative
uncharacterized protein FLJ22184
[Bos taurus]
Novel00662 46.30600986 103.7545322 0.0003035 --
PREDICTED: fibrocystin-L isoform
X3 [Bos taurus] TPA: novel gene
vertebrate polycystic kidney and
hepatic disease 1 (autosomal
recessive)-like 1 (PKHD1L1)-like
protein [Bos taurus]
Novel00803 897.3970069 1850.714789 9.41E-05 -- PREDICTED: uncharacterized protein
LOC102395992 [Bubalus bubalis]

115
Novel01179 233.5112005 77.89174265 2.16E-06 -- hypothetical protein M91_10594,
partial [Bos mutus]
Novel01199 68.25399124 15.2735876 5.96E-09 -- TPA: transmembrane 9 superfamily
member 2 [Bos taurus]
Novel01269 55.30672969 127.8568747 0.00013063 -- TPA: ring finger protein 213-like [Bos
taurus]
Novel01461 88.02558727 632.2555556 4.30E-06 --
PREDICTED: putative
uncharacterized protein FLJ22184
[Bos taurus]
Novel01525 18.60714702 4.441029387 0.00015045 --
PREDICTED: EF-hand calcium-
binding domain-containing protein 1
isoform X5 [Ovis aries musimon]
Novel01923 32.22964516 105.4103234 3.63E-07 -- hypothetical protein M91_02473,
partial [Bos mutus]
Novel01999 19.55536118 4.641204659 0.00017314 -//-
Novel02234 140.4474547 66.11668422 0.00014913 -- TPA: cyclin-dependent kinase 14
[Bos taurus]
Novel02316 72.66487907 20.54470245 4.64E-05 -- hypothetical protein, conserved
[Babesia bigemina]
Novel02346 168.3267559 74.99438722 4.69E-05 -- endonuclease/reverse transcriptase
[Sus scrofa]
Novel02474 37.75122363 12.80167563 5.61E-05 -- bitter taste receptor Bota-T2R65A
[Bos taurus]
Novel02718 173.4143411 64.12296984 1.13E-05 -- hypothetical protein, conserved
[Babesia bigemina]
Novel02809 107.9620241 45.63412071 5.48E-05 -- hypothetical protein, conserved
[Babesia bigemina]

116
Table 4. All Standard to Choice muscle tissue differentially expressed genes
Gene code Standard
reads
Choice
reads P-value
Gene
abbreviation Gene name
ENSBTAG00000000670 30.88305 246.4221 1.80E-07 RRP9 ribosomal RNA processing 9, U3 small
nucleolar RNA binding protein
ENSBTAG00000000706 677.3053 290.5012 3.38E-05 ADAMTS1 ADAM metallopeptidase with
thrombospondin type 1 motif 1
ENSBTAG00000002191 117.7992 1902.022 2.91E-10 RRP12 ribosomal RNA processing 12 homolog
ENSBTAG00000002362 503.0079 156.3534 2.52E-07 APOLD1 apolipoprotein L domain containing 1
ENSBTAG00000003981 55.35508 344.0517 8.49E-07 RRP1 ribosomal RNA processing 1
ENSBTAG00000005146 417.5045 120.3775 1.79E-05 -//-
ENSBTAG00000008993 105.2256 32.21649 4.91E-05 INTS6L integrator complex subunit 6 like
ENSBTAG00000009656 25.03987 3.93732 7.16E-07 -//-
ENSBTAG00000009838 13.50673 205.7908 1.28E-07 - RRP15-like protein
ENSBTAG00000012451 186.654 72.58464 5.64E-05 -//-
ENSBTAG00000015735 1.99076 138.0085 1.02E-09 -//-
ENSBTAG00000015844 625.1162 252.1213 7.12E-05 TFPI2 tissue factor pathway inhibitor 2
ENSBTAG00000016656 147.7579 32.84557 3.46E-05 PARP14 poly(ADP-ribose) polymerase family
member 14
ENSBTAG00000017412 91.89222 215.9969 1.50E-05 SOCS6 suppressor of cytokine signaling 6
ENSBTAG00000017418 57.82568 213.2538 5.76E-05 RRP1B ribosomal RNA processing 1B
ENSBTAG00000017527 91.55428 31.19422 6.73E-06 CRYBG1 crystallin beta-gamma domain
containing 1
ENSBTAG00000018638 35.41229 11.35007 5.69E-05 CC2D2A coiled-coil and C2 domain containing
2A
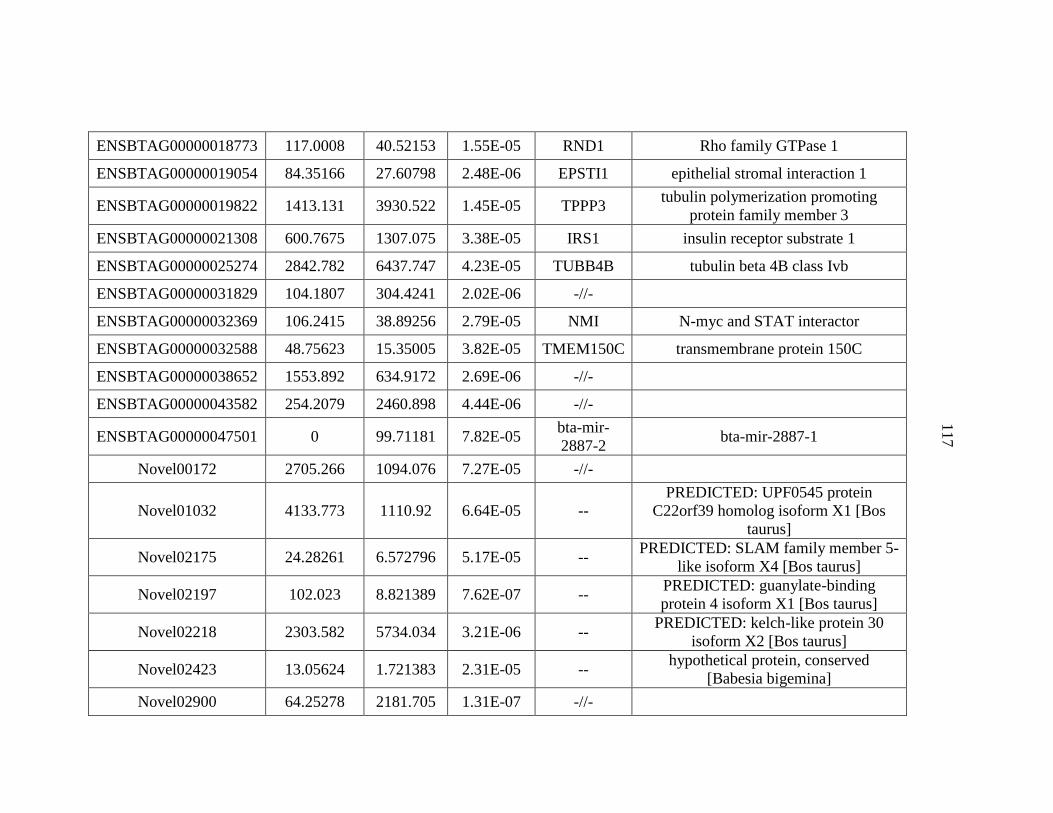
117
ENSBTAG00000018773 117.0008 40.52153 1.55E-05 RND1 Rho family GTPase 1
ENSBTAG00000019054 84.35166 27.60798 2.48E-06 EPSTI1 epithelial stromal interaction 1
ENSBTAG00000019822 1413.131 3930.522 1.45E-05 TPPP3 tubulin polymerization promoting
protein family member 3
ENSBTAG00000021308 600.7675 1307.075 3.38E-05 IRS1 insulin receptor substrate 1
ENSBTAG00000025274 2842.782 6437.747 4.23E-05 TUBB4B tubulin beta 4B class Ivb
ENSBTAG00000031829 104.1807 304.4241 2.02E-06 -//-
ENSBTAG00000032369 106.2415 38.89256 2.79E-05 NMI N-myc and STAT interactor
ENSBTAG00000032588 48.75623 15.35005 3.82E-05 TMEM150C transmembrane protein 150C
ENSBTAG00000038652 1553.892 634.9172 2.69E-06 -//-
ENSBTAG00000043582 254.2079 2460.898 4.44E-06 -//-
ENSBTAG00000047501 0 99.71181 7.82E-05 bta-mir-
2887-2 bta-mir-2887-1
Novel00172 2705.266 1094.076 7.27E-05 -//-
Novel01032 4133.773 1110.92 6.64E-05 --
PREDICTED: UPF0545 protein
C22orf39 homolog isoform X1 [Bos
taurus]
Novel02175 24.28261 6.572796 5.17E-05 -- PREDICTED: SLAM family member 5-
like isoform X4 [Bos taurus]
Novel02197 102.023 8.821389 7.62E-07 -- PREDICTED: guanylate-binding
protein 4 isoform X1 [Bos taurus]
Novel02218 2303.582 5734.034 3.21E-06 -- PREDICTED: kelch-like protein 30
isoform X2 [Bos taurus]
Novel02423 13.05624 1.721383 2.31E-05 -- hypothetical protein, conserved
[Babesia bigemina]
Novel02900 64.25278 2181.705 1.31E-07 -//-
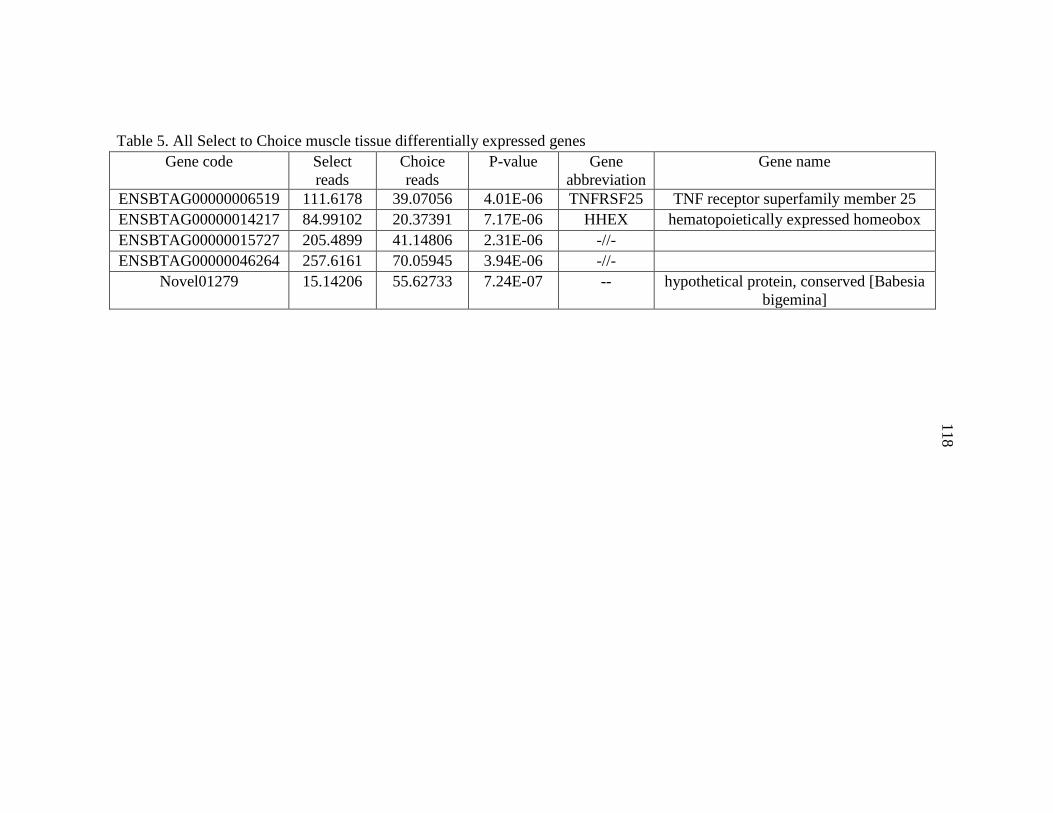
118
Table 5. All Select to Choice muscle tissue differentially expressed genes
Gene code Select
reads
Choice
reads
P-value Gene
abbreviation
Gene name
ENSBTAG00000006519 111.6178 39.07056 4.01E-06 TNFRSF25 TNF receptor superfamily member 25
ENSBTAG00000014217 84.99102 20.37391 7.17E-06 HHEX hematopoietically expressed homeobox
ENSBTAG00000015727 205.4899 41.14806 2.31E-06 -//-
ENSBTAG00000046264 257.6161 70.05945 3.94E-06 -//-
Novel01279 15.14206 55.62733 7.24E-07 -- hypothetical protein, conserved [Babesia
bigemina]