Evaluation of LNG Production Technologies. Outline LNG Background Objective Simulation...
42
Evaluation of LNG Production Technologie
-
Upload
jacob-harrison -
Category
Documents
-
view
223 -
download
1
Transcript of Evaluation of LNG Production Technologies. Outline LNG Background Objective Simulation...

Evaluation of LNG Production Technologies

Outline LNG Background Objective Simulation Specifications Liquefaction Techniques Heat Exchanger Types Simulation Method Results

Flow Diagram for a Typical LNG Plant

LNG (Liquefied Natural Gas) Basics
Combustible mixture of hydrocarbonsDry VS. Wet
NGL Extraction Dehydration/Scrubbing Liquefied Natural Gas
Target temperature for Natural gas:-260°FReduces volume by a factor 600

Objective
Main Objectives Simulate Processes Optimize Processes
Minimize compressor work Compare Processes based on
Capital cost Energy cost Total cost per capacity(Ton)

* Italicized processes signify Patent searched processes.* Bolded processes signify processes not included in scope of project.
Liquefaction Processes
Mixed Refrigerants Pure Refrigerants Both Other
Linde Process CoP Simple Cascade APCI C3 MRBP Self refrigerated
process
Axens Liquefin ProcessCoP Enhanced
CascadeAPCI AP-X
ABB Randall Turbo-Expander
Dual Mixed Refrigerant Linde 2006Williams Field
Services co.
Technip-TEALARCMustang Group
ExxonMobilDual Multi-component
Black and Veatch Prico Process
Technip- Snamprogetti

Flow diagrams

Black and Veatch’s PRICO Process
Axens Liquefin Process
ExxonMobil Dual Multi-Component Cycle
C3MR: Air Products and Chemical Inc

AP-X: Air Products and Chemical Inc.
DMR- Dual Mixed Refrigerant
Technip- TEALARC System
BP- Self Refrigerated Process

Linde/Statoil -Mixed Fluid Cascade Process Linde- CO2 MFCP
ConocoPhilips Simple Cascade

Simulation Specifications Natural Gas composition
Methane: 0.98 Ethane: 0.01 Propane: 0.01
Inlet conditions Pressure: 750 psia Temperature: 1000F
Outlet conditions Pressure: 14.7 psia Temperature: -260oF
Capacity: Common min. to max. capacity of process Common min. Capacity: 200,000 lbs/hr
Beihai City, China

Liquefaction Techniques Different Liquefaction techniques include:
Single Refrigeration cycle Multiple Refrigeration cycles Self Refrigerated cycles Cascade Processes
The cooling of natural gas involves the use of refrigerants which could either be pure component refrigerants or mixed component refrigerants.

Liquefaction TechniquesSchematic of a Simple Refrigeration Cycle
Compressor
Heat Exchanger
Expander

Liquefaction Techniques
Mixed refrigerants are mainly composed of hydrocarbons ranging from methane to pentane, Nitrogen and CO2.
Pure component Refrigerants Specific operating ranges for each component
Mixed Refrigerants Modified to meet specific cooling demands. Helps improve the process efficiency
Liquefaction Techniques
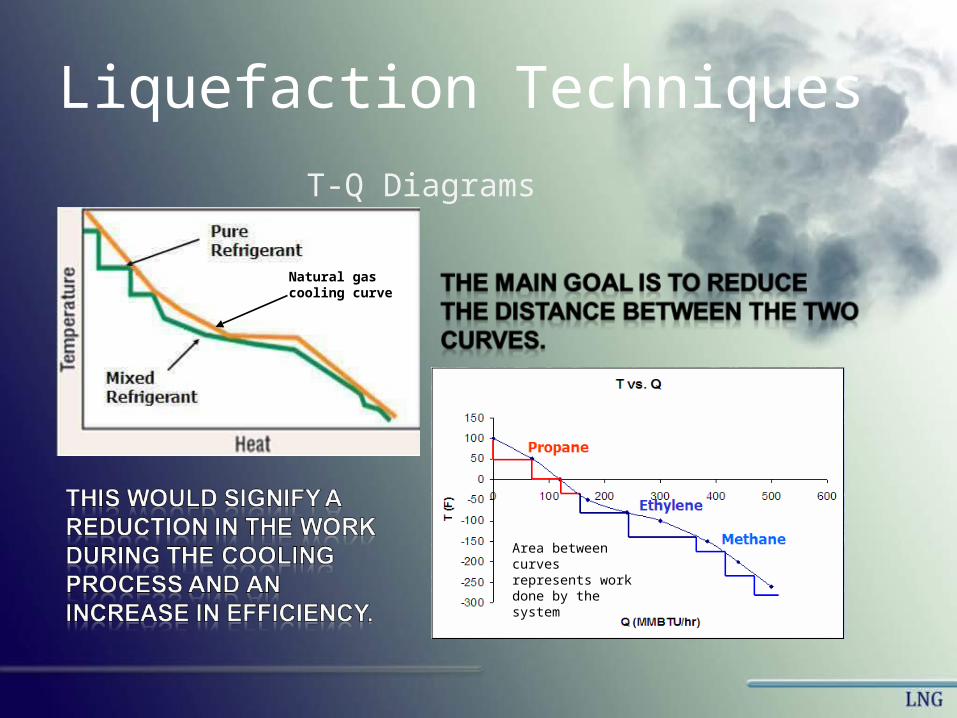
Natural gas cooling curve
Area between curves represents work done by the system
T-Q Diagrams

Liquefaction TechniquesSingle Refrigeration Cycle
One refrigeration loop that cools the natural gas to its required temperature range.
Usually requires fewer equipment and can only handle small base loads.
Lower capital costs and a higher operating efficiency

Black and Veatch:PRICO Process
Single mixed refrigerant loop and single compression system
Limited capacity (1.3 MTPA)
Low capital cost Great Pilot Process
Inlet Gas
LNG
Cold Box
Compressor Condenser
Expander
Residue
100oC
-260oC

Inlet Gas
LNG
Cold Box
Compressor
Simple Refrigeration Cycle
Refrigeration Cycles and Natural Gas Liquefaction
Black and Veatch- PRICO Process
Liquefaction Techniques Multiple Refrigeration cycles
Contains two or more refrigeration cycles. Refrigerants involved could be a combination of mixed or pure component refrigerants.
Some cycles are setup primarily to supplement cooling of the other refrigerants before cooling the natural gas.
More equipment usually involved to handle larger base loads.

Air Products and Chemical Inc: C3-MR
APCI processes are used in almost 90% of the industry
Good standard by which to judge the other processes
Capacity of about 5 MTPA Utilizes Propane (C3) and
Mixed Refrigerants (MR)
Inlet Gas
LNG
Mixed Refrigerant

Liquefaction TechniquesSelf Refrigerated Cycles
Takes advantage of the cooling ability of hydrocarbons available in the natural gas to help in the liquefaction process.
Numerous expansion stages are required to achieve desired temperatures.
Considered as a safer method because there are no external refrigerants needing storage.

BP Self Refrigerated Process
Neither refrigerants, compressor, nor expanders present in setup.
Cost include mainly capital costs and electricity.
Low Production rate (51%) Capacities of over 1.3MTPA
attainable .
Inlet gasLNG
Residue Gas

Liquefaction TechniquesCascade Processes
A series of heat exchangers with each stage using a different refrigerant.
Tailored to take advantage of different thermodynamic properties of the refrigerants to be used.
Usually have high capital costs and can handle very large base loads.
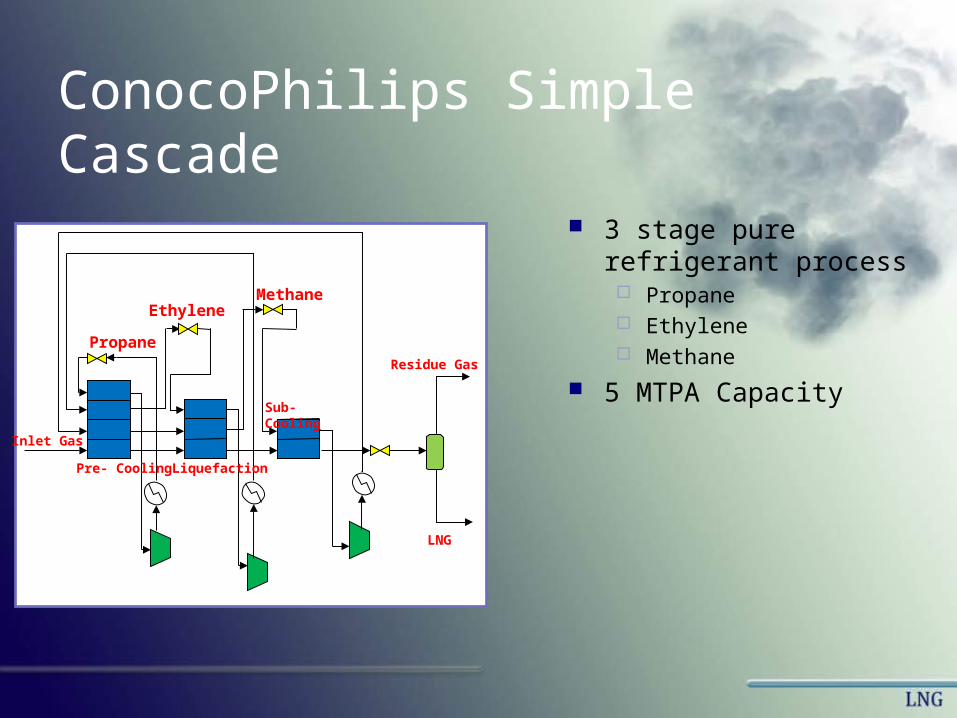
ConocoPhilips Simple Cascade
3 stage pure refrigerant process Propane Ethylene Methane
5 MTPA Capacity
Pre- Cooling
Sub-Cooling
Liquefaction
Inlet Gas
LNG
Residue Gas
Propane
EthyleneMethane

Equipment

Plate Fin Heat Exchanger

Spiral Wound Heat Exchanger

Spiral Wound Heat Exchanger

Equipment Comparison Plate-Fin-Heat-Exchangers Coil-Wound-Heat-Exchangers
Characteristics Extremely compact Compact
Multiple streams Multiple streams
Single and two-phase streams Single and two-phase streams
Fluid Very clean Clean
Flow-types Counter-flow Cross counter-flow
Cross-flow
Heating-surface 300 - 1400 m²/m³ 20 - 300 m²/m³
Materials Aluminum Aluminum
Stainless steel (SS)
Carbon steel (CS)
Special alloys
Temperatures -269°C to +65 °C (150 °F) All
Pressures Up to 115 bar (1660 psi) Up to 250 bar (3625 psi)
Applications Cryogenic plants Also for corrosive fluids
Non-corrosive fluids Also for thermal shocks
Very limited installation space Also for higher temperatures

Our Evaluation Methods
Data on operating conditions (Temperatures, Pressures, Flowrates, etc) for all these processes is not widely available (Only some is reported).
We decided to perform simulations using our best estimates.
We used minimum compression work as guide.
We identified non-improvable points

Details of methodology Conditions after each stage of refrigeration were noted After making simple simulations mimic real process,
variables were transferred to real process simulation Optimization- Refrigerant composition Optimization- Compressor work Restriction needed- Heat transfer area
All cells in LNG HX must have equal area Restriction needed- Second law of thermodynamics
Check temperature of streams Utilities
Obtain cooling water flow rate

Pre- Cooling
Sub-Cooling
Liquefaction
High Pressure
Low Pressure
CO2 Pre-cooled Linde Process
Modification of the Mixed Fluid Cascade Process
Three distinct stages using 3 mixed refrigerants with different compositions
Carbon dioxide is sole refrigerant in pre-cooling stage
Separate cycles and mixed refrigerants help in the flexibility and thermodynamic efficiency
Process is safer because hydrocarbon inventory is less
8 MTPA Capacity
Inlet Gas
LNG
100oC
-70oC
-140oC
-260oC


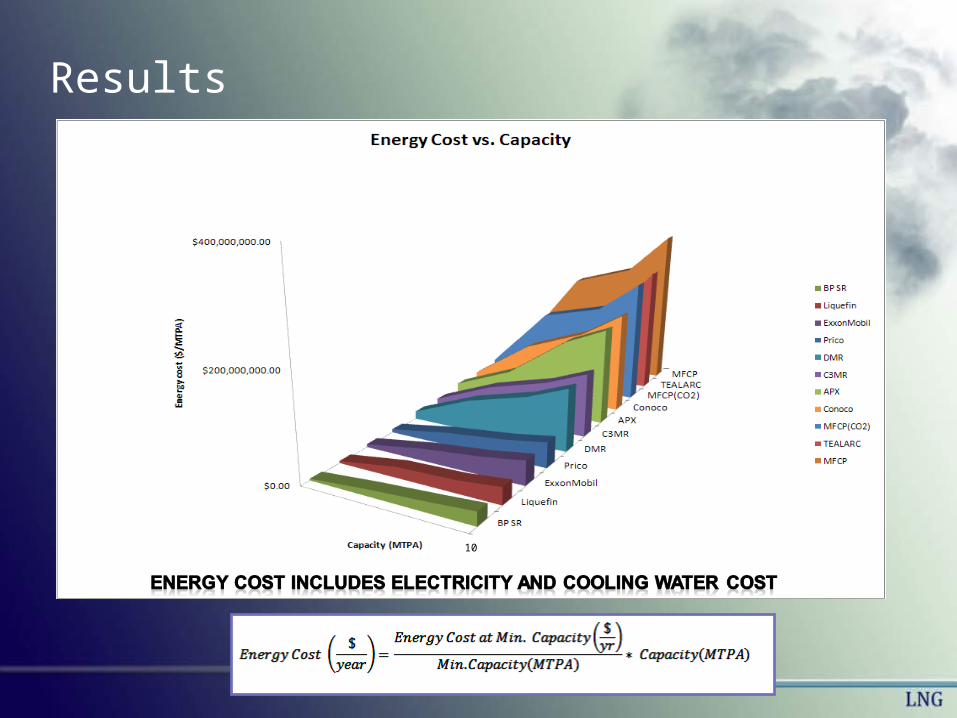
Results

Economic Life of 20 years New train required at the documented
maximum capacity of each specific process. Average cost of electricity and cooling water
throughout the US used in analysis. Energy cost evaluated at a minimum capacity
of 1.2 MTPA
Cost Basis

Results
10
10
Results

Results
Process Cost per ton ($) Max capacity (MTPA) Prico 5.12 1.20 Liquefin 3.41 6.00 ExxonMobil 4.83 4.80 DMR 12.58 4.80 APX 19.20 7.80 MFCP 31.73 7.20 MFCP(CO2) 24.77 7.20 TEALARC 25.35 6.00 C3MR 12.93 4.80 Conoco 20.15 5.00

Analysis
Our results may not match market trendsOperating temperature and pressure range
as well as flowrate information unavailablePrecedents to compare results unavailable Information on cost to use process
unavailable (licensing, proprietary production fees, etc.)

Analysis We may be trapped in local minima and failed
to identify better conditions
Work
Temperature
Global Minimum
Local Minimum

Conclusions We successfully simulated several LNG
production plants We obtained capital and operating costs and
determined a ranking Some connection with existing trends were
identified, but other results do not coincide with market trends
We discussed why discrepancies may arise.

Questions?