
EVALUATION OF LEWIS ACID CATALYSED AND OTHER NITRATION ... · EVALUATION OF LEWIS ACID CATALYSED...
201
1 EVALUATION OF LEWIS ACID CATALYSED AND OTHER NITRATION STRATEGIES FOR THE SELECTIVE NITRATION OF CRESOLS by Rudolf Jacob Francois van Niekerk Baccalaureus Technologiae: Chemistry (P.E. Technikon) A dissertation submitted in fulfillment of the requirements for the Magister Technologiae: Chemistry In the Faculty of Applied Science at the Port Elizabeth Technikon January 2001 Promoter: Prof. B. Zeelie
Transcript of EVALUATION OF LEWIS ACID CATALYSED AND OTHER NITRATION ... · EVALUATION OF LEWIS ACID CATALYSED...
1
EVALUATION OF LEWIS ACID CATALYSED
AND OTHER NITRATION STRATEGIES FOR
THE SELECTIVE NITRATION OF CRESOLS
by
Rudolf Jacob Francois van Niekerk
Baccalaureus Technologiae: Chemistry
(P.E. Technikon)
A dissertation submitted in fulfillment
of the requirements for the
Magister Technologiae: Chemistry
In the Faculty of Applied Science
at the Port Elizabeth Technikon
January 2001
Promoter:
Prof. B. Zeelie

2
ACKNOWLEDGEMENTS
• My promoter Prof. Ben Zeelie for his help and guidance.
• Dr. Benita Barton for proofreading this dissertation.
• The staff of the Chemistry department for their support; thanks to Magriet
Bosma for the administrative organisation.
• My friends and fellow students at the Chemistry department, special thanks to
Babrie, Anita, Derek, Wilroy and Marek. Also, my friends outside the
department for their encouragement.
• My parents, brothers and sisters for all their love, support and prayers.
• Christine for all the words of encouragement and for loving me.
3
SUMMARY
The nitration of m- and p-cresol was investigated under mild reaction conditions
in a number of solvents; the effects of certain nitration catalysts were also
evaluated. These different reaction parameters were evaluated in terms of their
effect on a number of important reaction responses. Other important factors that
were investigated were the manipulation of the isomer ratios by changing
reaction parameters, as well as important process chemistry information, such as
product distribution, isolation and purification, identification of side products
formed, and evaluation of the heat of reaction.
Use was made of an experimental design system to evaluate the effect of
reaction parameters on the chosen design responses. It was found that the ratio
of para to ortho nitrocresol products could be influenced slightly by using low
concentrations of nitric acid and low reaction temperatures.
A different mechanism for the formation of 2-methyl-1,4-benzoquinone (from m-
cresol nitration) was proposed (compared with that previously reported), which
could explain a “one mole nitric acid” pathway and the fact that only the p-
benzoquinone isomer was observed.
Reaction side products were identified and found to consist of dimers of cresol
and nitrocresol, which were probably the result of oxidation of the cresol,
subsequent formation of a quinomethide intermediate and reaction with either the
product or the substrate.
The heat of nitration was determined for various reaction systems and found to
be governed by two factors, namely the actual nitration process and also an
oxidation process, which is responsible for the formation of side products.
4
CONTENTS
ACKNOWLEDGEMENTS II
SUMMARY III
CONTENTS IV-IX
CHAPTER 1: INTRODUCTION 1-35
1.1 CURRENT TRENDS OF THE SOUTH AFRICAN CHEMICAL
INDUSTRY 1
1.2 CHEMICALS FROM COAL 5
1.3 CRESOLS 7
1.3.1 Physical properties 8
1.3.2 Chemical properties 9
1.3.3 Sources 9
1.3.3.1 Isolation from coal tars 9
1.3.3.2 Recovery from spent refinery caustics 10
1.3.3.3 Methods of production 11
1.3.4 Separation of cresol mixtures 11
1.3.5 Uses 13
1.3.5.1 o-Cresol 13
1.3.5.2 m-Cresol 14
1.3.5.3 p-Cresol 14
1.3.5.4 m-/ p-Cresol 14
1.4 NITROCRESOLS 15
1.4.1 Physical properties 15
5
1.4.2 Uses 16
1.4.2.1 4-Nitro-m-cresol 16
1.4.2.2 2-Nitro-p-cresol 17
1.4.2.3 2,6-Dinitro-p-cresol 17
1.5 NITRATION 18
1.5.1 General properties of nitroaromatic compounds 18
1.5.2 The mechanism of nitration 18
1.5.3 Nitration via nitrosation 20
1.5.4 Reactivity and orientation in nitrations 21
1.5.5 The ortho to para ratio 22
1.5.6 Ipso nitration 23
1.6 METHODS OF NITRATION AS APPLIED TO CRESOLS AND
OTHER HIGHLY ACTIVATED AROMATIC SUBSTRATES 24
1.6.1 Clays 24
1.6.1.1 “Clayfen” 25
1.6.1.2 “Claycop” 26
1.6.2 Lanthanide triflates 27
1.6.3 Mixed acid methods 28
1.6.3.1 Nitric/ sulphuric acid mixtures 28
1.6.3.2 Nitric/ nitrous acid mixtures 29
1.6.4 Nitration via nitrosation 29
1.6.4.1 NaNO3/ H2SO4 29
1.6.4.2 NaNO3/ NaNO2 mixtures 32
1.6.5 Other Innovations 32
1.6.5.1 Use of acetic anhydride 32
1.6.5.2 Solvent effects 32
1.6.5.3 Use of transfer reagents 33
1.6.5.4 Use of gaseous reactants 33
1.6.5.5 Side-chain nitration 34
6
1.7 INDUSTRIAL CONCERNS 34
1.7.1 Scale-up of nitrations 34
1.7.2 Future of nitrations 35
CHAPTER 2: EXPERIMENTAL 36-47
2.1 MATERIALS 36
2.1.1 Reagents for synthesis 36
2.1.2 Reagents for analysis 37
2.2 SYNTHETIC PROCEDURES 38
2.2.1 Preparation of reactive clays 38
2.2.1.1 Preparation of clay supported iron(III)nitrate – “clayfen” 38
2.2.1.2 Preparation of clay supported copper(III)nitrate – “claycop” 39
2.2.2 Preparation of 4-methyl-2-nitrophenol 39
2.3 EXPERIMENTAL PROCEDURES 40
2.3.1 Nitrations 40
2.3.1.1 Dilute nitric acid 40
2.3.1.2 Lanthanide triflate catalysed reactions 40
2.3.1.3 Nitrations with “clayfen” 41
2.3.1.4 Nitrations with “claycop” 41
2.3.1.5 Nitration with nitric and sulphuric acid mixtures 41
2.3.1.6 Nitrosation reactions with NaNO2 and H2SO4/ or HNO3 41
2.3.2 Reaction calorimetry 42
2.4 ANALYTICAL PROCEDURES 44
2.4.1 Gas Chromatography 44
2.4.2 High Performance Liquid Chromatography 44
2.4.3 Gas Chromatography – Mass Spectrometry 45
2.4.4 Nuclear Magnetic Resonance 46
2.4.5 Differential Scanning Calorimetry 46
7
2.4.6 UV/ Visible Spectrophotometry 47
2.4.7 pH determination 47
2.4.8 Titrimetric analyses 47
CHAPTER 3: NITRATION OF m-CRESOL 48-91
3.1 INTRODUCTION 48
3.2 OBJECTIVES 49
3.3 RESULTS AND DISCUSSION 49
3.3.1 Definitions 49
3.3.2 Nitrations using yttrium(III)triflate as catalyst 50
3.3.3 Nitration with dilute nitric acid 52
3.3.3.1 General 52
3.3.3.2 Identification of reaction variables 52
3.3.3.3 Selection of the experimental domain 53
3.3.3.4 Experimental design and responses 54
3.3.3.5 Statistical evaluation – Analysis of Variance 56
3.3.3.6 Analysis of the fitted response surfaces 66
3.3.3.7 Confirmatory experiments 71
3.3.4 Nitrations using yttrium(III)triflate at low temperatures 74
3.3.5 Nitration using clays 76
3.3.5.1 “Claycop” 76
3.3.5.2 “Clayfen” 77
3.3.6 Nitration with nitric and sulphuric acid mixtures 79
3.3.7 Proposed mechanism for the formation of
2-methyl-p-benzoquinone 80
3.3.8 Nitrosation 85
3.3.8.1 Nitrosation using NaNO2 and H2SO4 85
3.3.8.2 Gas-phase nitrosation 87
8
3.4 CONCLUDING REMARKS 89
CHAPTER 4: NITRATION OF p-CRESOL 92-105
4.1 INTRODUCTION 92
4.2 OBJECTIVES 94
4.3 RESULTS AND DISCUSSION 95
4.3.1 Mono- and dinitration of p-cresol 95
4.3.2 Effect of substrate loading 96
4.3.3 Scale-up of p-cresol nitration – isolation of reaction product 100
4.4 CONCLUDING REMARKS 104
CHAPTER 5: HEAT OF p-CRESOL NITRATION 106-127
5.1 INTRODUCTION 106
5.1.1 Heat flow method 108
5.1.2 Power compensation method 109
5.1.3 Reflux flow method 110
5.1.4 Typical applications 111
5.2 OBJECTIVES 112
5.3 RESULTS AND DISCUSSION 113
5.3.1 Nitration of p-cresol using the reaction calorimeter 113
5.3.2 Effect of substrate loading 117
5.3.3 Effect of catalyst on heat of reaction 119
5.3.4 Effect of nitric acid concentration on the heat of reaction 121
5.3.5 Estimation of the heat of reaction 122
9
5.4 CONCLUDING REMARKS 126
CHAPTER 6: SUMMARY AND CONCLUDING REMARKS 128-131
6.1 NITRATION OF m-CRESOL 128
6.2 NITRATION OF p-CRESOL 129
6.3 HEAT OF p-CRESOL NITRATION 130
APPENDICES 132-147
REFERENCES 148-154
10
CHAPTER 1
INTRODUCTION 1.1 CURRENT TRENDS OF THE SOUTH AFRICAN CHEMICAL INDUSTRY
For a developing country, South Africa has an unusually large chemical industry,
with substantial economic significance to the country. The industry is the largest
of its kind in Africa, and differs from the other African chemical industries in that it
is largely based on coal, which is used as a feedstock for its extensive synthetic
fuels industry.
The chemical industry in South Africa has a relatively long history having been
founded in 1896 to meet the demand for explosives for the mining industry. The
discovery of diamonds near Kimberley, gold on the Witwatersrand and coalfields
around Witbank and Vryheid, led to a blossoming mining industry and an
increasing demand for explosives. The next 50 years saw diversification into the
manufacture of inorganic acids, fertilisers and mining chemicals.
Since South Africa is a country with no proven oil reserves, little natural gas and
an abundant coal resource, it is not surprising that the gasification of coal
became a major factor in the development of the industry. The establishment of
the petrochemical industry can be traced to when the first oil-from-coal plant was
commissioned in Sasolburg in the early 1950’s. However, it was only during the
sixties that it became possible for an organic chemical industry, based on local
raw materials and feedstocks, to become a reality. This development was further
driven by the establishment of two large oil-from-coal plants at Secunda during
the early 1980’s to provide self-sufficiency in fuels. The synfuel sector serves not
only the local petroleum industry as a fuel source, but has now become the major
source of chemical feedstock and intermediates.

11
The chemical industry in South Africa has also been shaped by the political and
regulatory environment which prevailed from 1948 to 1994. This created a
philosophy of isolationism which, in turn, fostered an inward approach with the
focus on import replacement. This encouraged the building of smaller scale
plants with capacities to satisfy the local markets. Plants were constructed close
to the inland coalfields, which had the added benefit that chemical plants were
located close to the heavily populated Gauteng area, the largest domestic
market. After South Africa’s re-admittance to the world markets, this strategy has
changed since smaller plants are not very competitive in the global market,
because of the economics of scale and high transport costs. The local chemical
industry is now focusing on the need to be internationally competitive and the
industry is re-shaping itself accordingly.1
The South African chemical industry may be divided into three sectors: primary
(feedstocks and commodity chemicals), secondary (intermediate chemicals) and
tertiary products (speciality chemicals). SASOL, AECI and Dow Sentrachem
dominate the primary and secondary sectors, and they have recently diversified
and expanded their businesses to include tertiary products as well. Indeed, these
three companies have dominated the South African chemical industry since the
eighties.
Over the past five years there has been a significant change within the South
African chemical industry with company mergers and rationalisation being the
order of the day. SASOL has been involved with a number of projects requiring
huge amounts of capital, designed to improve their range of products as well as
the quality and quantity. More international companies trading on the African
continent inspired this move. In 1998, the Competitions Board rejected a bid by
SASOL to take over AECI. SASOL has recently announced that it will go ahead
with the building of a “world-scale” n-butanol plant at either Sasolburg or
Secunda. The plant is expected to go into production during 2002. This is in
addition to the detergent alcohol plant that will be built in Secunda at an
estimated cost of R1bn. SASOL has also expanded their international sales-
network and has opened offices in Asia, Europe and North America. SASOL
12
manufactures more than 200 fuel and chemical products and export their
products to more than 70 countries around the world.2
AECI has undergone significant changes in recent times. They sold their interest
in Polifin to SASOL in 1999, and have been in the process of discarding their
fertiliser business with the sale of their 50 percent share of Kynoch. They have
also recently entered into a joint venture with an American company, PPG
Industries, to further develop their range of technical paints manufactured by
Dulux.
In 1997 Sentrachem, another of the South African chemical giants, was taken
over by the Dow Chemical Company. This buy-out came at a time when
Sentrachem’s profitability was extremely low due to prolonged droughts, high
interest rates, increasing international competition and the plunging value of the
rand. Sentrachem was in the process of rationalisation when Dow successfully
acquired control. Since then, Dow has changed the appearance of the company
significantly with the purchase of Hoechst’s shares in Safripol. Sanachem has
been restructured and is now trading under the Dow Agrosciences umbrella, the
focus being export of speciality chemicals such as herbicides and pesticides.
Dow Sentrachem have also entered into a joint venture with Bayer, named
Chrome Chemicals, with the construction of a “high-tech” plant near Newcastle to
produce value-added chrome chemicals. The Dow Chemical Company is
currently the second largest US investor and has indicated that it would seek
further investment opportunities in South Africa. The group has moved its Middle-
East-Africa headquarters from London to Johannesburg.3
The changes that the industry has seen in recent years seem to be only the tip of
the iceberg, with international competition becoming tougher all the time. The
only way for the medium-to-large sized company to survive is to become bigger
by continually incorporating its competitors into its own structures. Another
strategy, for large companies, is to trim their businesses and to discard all non-
core business. The result is that a number of large corporations are established

13
that have interests in a number of markets, but only trading in products that form
the core of their business.
Producers of commodity chemicals are now also diversifying and becoming
involved with the production of valuable downstream products. These companies
make use of their own feedstocks to produce the high-priced speciality
chemicals, instead of selling the low-valued bulk chemicals. A term has been
coined to describe the current trends in manufacturing markets; this is known as
“globalisation” of markets. These trends are not new to the world and have been
in operation for years. It is, however, a relatively new concept in South Africa.
This process is also still far from being over since companies must remain
competitive. South Africa is seen as the leader of Africa and because of previous
political isolation, is still a relatively untapped market. For this reason, big
companies such as Dow have been establishing a foothold in Africa. It is their
hope that South Africa will open the door to the rest of the continent. International
investment in this country has, however, been very slow due to the unstable
socio-economic situation in the country with its unusually high crime,
unemployment and illiteracy figures.
This trend of market globalisation has allowed small companies to manufacture
high-value low-volume speciality products for the domestic market, which cannot
be produced cost-effectively by the major players in the world chemical industry.
Examples of such efforts are the small-scale production of animal feeds,
fertilisers and the formulation of lubricants for the local rubber industry. The
production of low-priced detergents, soaps and softeners for the predominantly
black market is also a result.
It is thus apparent that the South African chemical industry is undergoing a
metamorphosis and might emerge a more streamlined industry. Opportunities
have presented themselves to the small chemicals producer as well as the
corporate giant. If the instability in the country comes to an end, the possibility
exists that the South African chemical industry may experience a sudden growth
explosion.
14
1.2 CHEMICALS FROM COAL
As mentioned above, South Africa is a country that has no significant natural oil
or gas fields. During the years of political isolation, it became necessary for the
country to investigate the possibility of using low-grade coal, one of the few
abundant natural resources in South Africa, to produce oil and other chemical
feedstocks. The oil would be used to produce fuel for the local market and
feedstocks for the South African chemical industry. It is thus that the
Government-sponsored South-African Coal Oil and Gas Corporation (SASOL)
was established and obtained licenses to operate plants for the production of
synthesis gas from coal and the Fischer-Tropsch process, as well as a process
which was based upon the American Hydrocol process. Both these processes
were used; the former to produce high proportions of medium-octane petrol, light
petroleum gas and a range of chemicals, and the latter to produce mainly higher
boiling waxes, oils and diesel.4,5
The production of coal gas on large-scale brought with it the problem of how to
dispose of the coal tar formed as by-product. Although coal tar has been distilled
for many years, it was previously used as a waterproof application and later for
creosoting railway sleepers. The rapid growth of the organic chemical industry
soon indicated that coal tar was a valuable source of new chemical substances,
benzene, phenol, aniline, naphthalene, toluene, anthracene and the cresols all
being eventually isolated from it.6,7
When coal is heated to 1000oC, in the absence of air, coke is formed with a
number of liquid and gaseous decomposition products. Coke is almost pure
carbon, and is used in the manufacture of steel.8 After the coking process, the
liquid and gaseous by-products are condensed to form the coal tar. The liquid by-
products include an aqueous phase containing ammonia and an organic phase;
the phases are subsequently separated and the organics are distilled into a
number of crude fractions. The aqueous phase is steam-distilled to liberate
ammonia, which is recovered in the form of ammonium sulphate for the fertiliser
market.9
15
The coal tar, an extremely complex mixture of organic compounds, is normally
separated by distillation, to afford a number of fractions of tar oils and a pitch
residue. The number of fractions and their content depend on the temperature at
which the carbonisation was carried out. Tars that were obtained at relatively low
temperatures (420oC) contain particularly high amounts of phenolics, but little
benzene and naphthalene.7
In general, the main tar fractions obtained at the specified temperature ranges
have the following composition:
• Light oil
(Up to 170oC)
Contains mainly crude naphtha with some benzene, toluene and xylene.
These are mainly used as solvents for paints and polishes, although benzene
is also used in explosives, saccharine and polyurethanes. The light oil fraction
is small since most of the low boiling hydrocarbons remain entrained in the
coal gas and are removed during the gas-oil washing stage.
• Middle oil
(170-230oC)
Originally this lower boiling fraction was known as “carbolic oil” and contains
mainly phenol, cresols and the xylenols. These compounds are used as
disinfectants and in the production of resins and plasticisers. Phenol is used
in the synthesis of aspirin and nylon. The high boiling fraction is mainly used
in the production of insect repellent and is also useful in the manufacture of
dyestuffs and resins.
• Heavy oil
(230-270oC)
This fraction contains a high proportion of “creosote”, a blend of high boiling
tar oils from which valuable components such as anthracene and tar acids
and bases have been removed. Mixtures of pitch and creosote produced from
16
this fraction are used as liquid coal tar fuels for heating furnaces. Creosote
oils are also widely used for preserving wood and in the formulation of sheep
dips and fruit sprays. During World War II, creosote was hydrogenated to
produce petrol.
• Anthracene oil
(270-350oC)
This fraction contains very small quantities of anthracene and phenanthrene,
which are removed as crude coke by cooling and filtering. Anthracene is used
in the manufacture of dyestuffs based on anthraquinone. The other
components are heavy coal tar fuels and road tar.
• Pitch
The pitch residue is used as a fuel, as a binding agent for the production of
smokeless fuel briquettes, weather-proofing roofs, and for the manufacture of
anti-corrosion metal-paints.7
1.3 CRESOLS
Cresols are important chemical raw materials, which were originally obtained
only from coal tar in the coal-gasification process; after World War II, they were
also obtained from spent refinery caustics. Since 1960, they have been produced
synthetically on a much larger scale than that obtained from natural sources, i.e.
cresol from coal tar.
Cresol and its derivatives are widely distributed in nature. They are produced as
metabolites of various micro-organisms and are found in the urine of mammals.
Humans eliminate approximately 87 mg of p-cresol per day in their urine. Cresol
is also found in small amounts in certain foods and drinks; it is found in tomatoes,
cheeses, coffees and teas.9
17
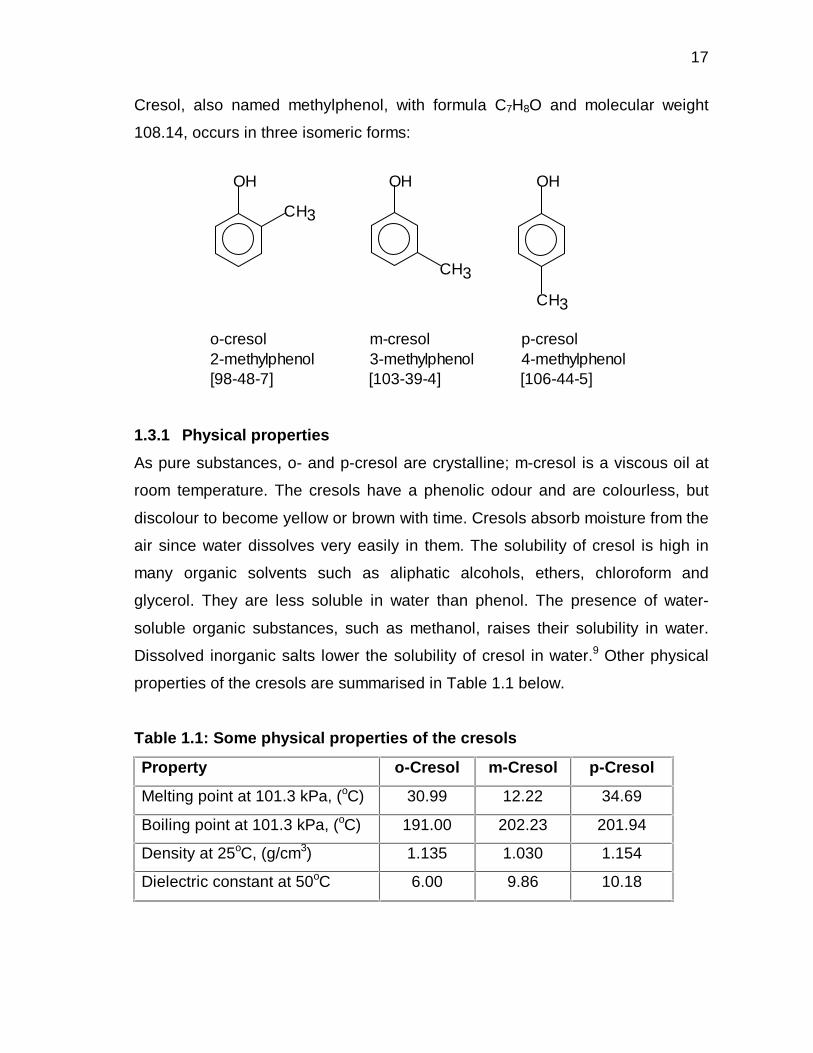
Cresol, also named methylphenol, with formula C7H8O and molecular weight
108.14, occurs in three isomeric forms:
1.3.1 Physical properties
As pure substances, o- and p-cresol are crystalline; m-cresol is a viscous oil at
room temperature. The cresols have a phenolic odour and are colourless, but
discolour to become yellow or brown with time. Cresols absorb moisture from the
air since water dissolves very easily in them. The solubility of cresol is high in
many organic solvents such as aliphatic alcohols, ethers, chloroform and
glycerol. They are less soluble in water than phenol. The presence of water-
soluble organic substances, such as methanol, raises their solubility in water.
Dissolved inorganic salts lower the solubility of cresol in water.9 Other physical
properties of the cresols are summarised in Table 1.1 below.
Table 1.1: Some physical properties of the cresols
Property o-Cresol m-Cresol p-Cresol
Melting point at 101.3 kPa, (oC) 30.99 12.22 34.69
Boiling point at 101.3 kPa, (oC) 191.00 202.23 201.94
Density at 25oC, (g/cm3) 1.135 1.030 1.154
Dielectric constant at 50oC 6.00 9.86 10.18
CH3
OH OH
CH3
OH
CH3
o-cresol m-cresol p-cresol2-methylphenol 3-methylphenol 4-methylphenol[98-48-7] [103-39-4] [106-44-5]
18
1.3.2 Chemical properties
Chemically, the cresols are similar to phenol. These compounds are weak acids
and dissolve in aqueous alkali solutions to form cresolates. They can thus be
extracted into sodium hydroxide solution from solvents that are not miscible with
water. Their acidity is, however, so low (pKa 10.1-10.3) that they may be liberated
by hydrogen sulphide (pKa 7.2) and carbon dioxide (pKa 6.4) from cresolates.
Therefore, they hardly dissolve in solutions of sodium carbonate or sodium
hydrogen carbonate.9
Cresols, like phenol, undergo electrophilic substitution reactions. The electrophile
normally attaches to the aromatic nucleus in the o- and p-positions relative to the
hydroxyl group. The cresols can therefore be nitrated in even dilute nitric acid;
nitrosation, sulphonation and alkylation also readily occur. Electrophilic
substitutions are occasionally complicated by the formation of the
cyclohexadienone intermediate after addition of the electrophile.
1.3.3 Sources
Cresols have a number of sources which may be separated into two main
groups, namely, “natural” sources and “synthetic” sources. One “natural” source
is the isolation of cresols and xylenols from coal tars which are obtained in high-
temperature coking, low-temperature carbonisation and Lurgi pressure
gasification of coal processes, as applied by SASOL; another “natural” source of
the cresols is spent refinery caustics. “Synthetic” sources refer to production
processes that were established to produce cresol in large enough quantities to
satisfy the increasing demand in these compounds.
1.3.3.1 Isolation from coal tars
The content of the phenolic compounds that may be isolated from coal tar is
heavily dependent upon the process employed. For instance, the high-
temperature coke-oven tar, obtained in the production of metallurgical coke from
bituminous coal at 900-1300oC, contains approximately 0.4-0.6 wt % phenol, 0.8-
1 wt % cresols and 0.2-0.5 wt % xylenols. Approximately 10 times more C6 – C8
phenols are isolated from coal tars obtained from the low-temperature

19
carbonisation and the Lurgi pressure gasification. The phenols may be isolated
from the tar by extraction with sodium hydroxide or from the carbolic oil fraction,
which boils at 180-210oC.9
The scale of cresols and xylenols recovery from coal tars has been continually
decreasing over the past two decades. The primary reason for this decrease is
the fact that the consumption of the iron- and steel-producing industry, chiefly
responsible for the production of coal tars, has been declining. Processes that
lead to lower phenolics-containing tars have been used increasingly. The
situation may change when the gasification of coal once again becomes the main
source of syngas for the petrochemicals industry, as the price of natural gas
rises.
1.3.3.2 Recovery from spent refinery caustics
This method of cresol isolation is mostly employed in the United States. The
cresols and xylenols are obtained from the naphtha fraction produced in catalytic
and thermal cracking processes in the petrochemical industry. During the
removal of sulphur compounds contained in these fractions by scrubbing with
concentrated alkaline solutions, the phenolic compounds are extracted. The
phenols are then precipitated from the alkaline phase in a packed column with a
countercurrent stream of carbon dioxide and decanted. The phenols still present
in the carbonate/ hydrogen carbonate phase are extracted with an organic
solvent, and then again extracted into the alkaline aqueous phase, which is then
returned to the column. A typical composition of the phenol mixture obtained in
this way is approximately 20 % phenol, 18 % o-cresol, 22 % m-cresol, 9 % p-
cresol, 28 % xylenols and 3 % higher phenols. This mixture is then separated by
distillation into phenols, o-cresol, a m-/ p-cresol mixture and the xylenols.9
20
1.3.3.3 Methods of production
Cresols are currently produced in the following processes:
• Alkali fusion of toluene sulphonates,
• Alkaline chlorotoluene hydrolysis,
• Rearrangement of cymene hydroperoxide,
• Methylation of phenol in the vapour or liquid phase.
The first three processes are based upon a method for producing phenol from
benzene, but use toluene as starting substrate. The methylation of phenol is a
process that was developed specifically for the production of cresols.9
1.3.4 Separation of cresol mixtures
Since the difference in boiling point of m- and p-cresol is so small, distillation of a
mixture of the isomers of cresol only yields pure o-cresol and a mixture of the
other two isomers. m-Cresol and p-cresol may even be obtained as one boiling
fraction when the distillation is carried out under reduced pressure. Thus other
methods had to be developed to separate mixtures of m- and p-cresol. These are
summarised in Table1.2:
21
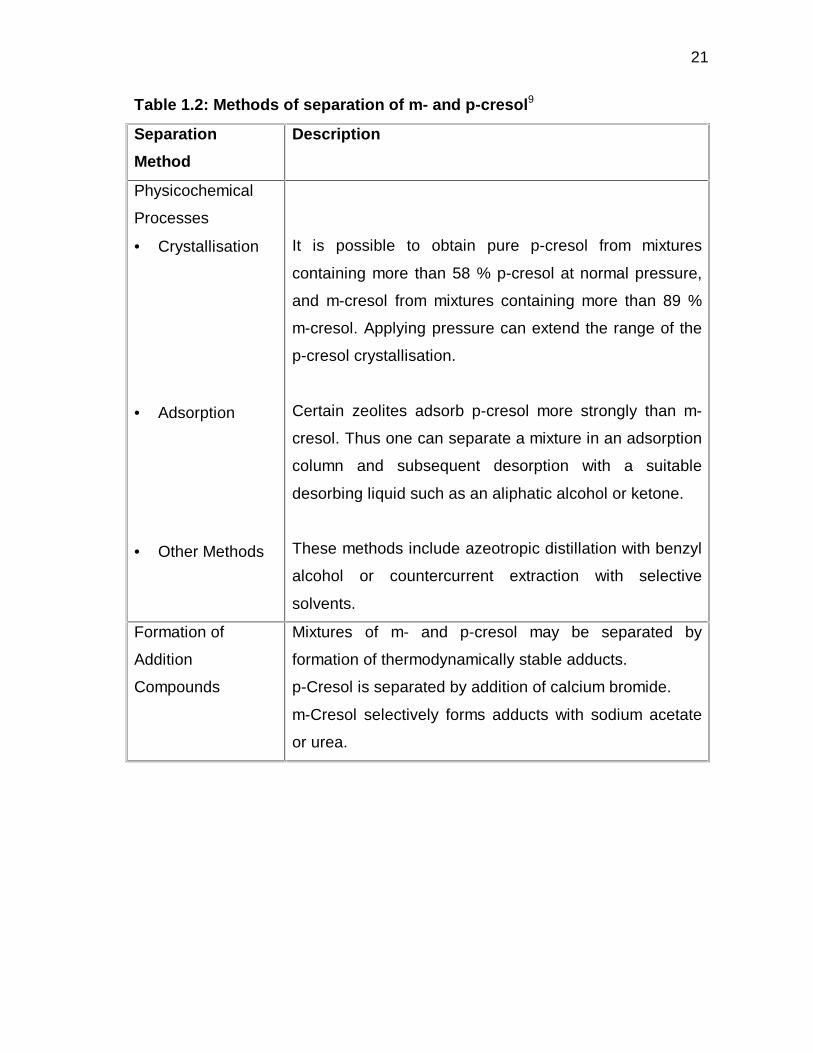
Table 1.2: Methods of separation of m- and p-cresol9
Separation
Method
Description
Physicochemical
Processes
• Crystallisation
• Adsorption
• Other Methods
It is possible to obtain pure p-cresol from mixtures
containing more than 58 % p-cresol at normal pressure,
and m-cresol from mixtures containing more than 89 %
m-cresol. Applying pressure can extend the range of the
p-cresol crystallisation.
Certain zeolites adsorb p-cresol more strongly than m-
cresol. Thus one can separate a mixture in an adsorption
column and subsequent desorption with a suitable
desorbing liquid such as an aliphatic alcohol or ketone.
These methods include azeotropic distillation with benzyl
alcohol or countercurrent extraction with selective
solvents.
Formation of
Addition
Compounds
Mixtures of m- and p-cresol may be separated by
formation of thermodynamically stable adducts.
p-Cresol is separated by addition of calcium bromide.
m-Cresol selectively forms adducts with sodium acetate
or urea.
22
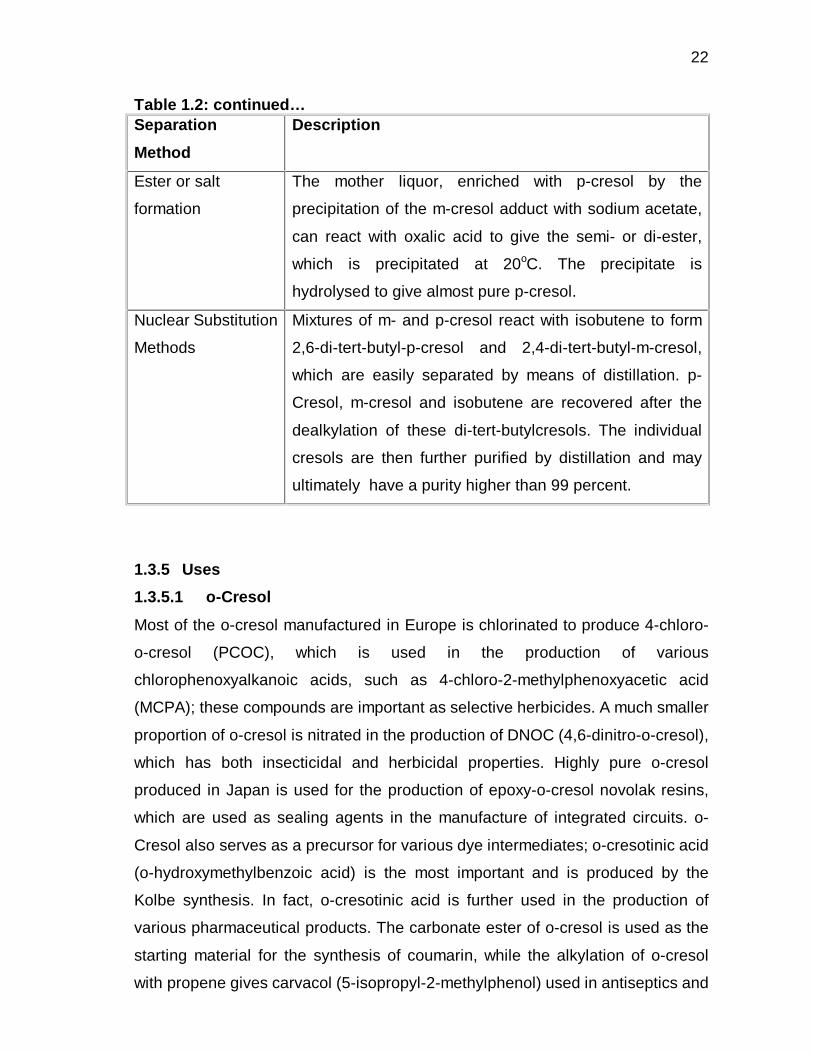
Table 1.2: continued… Separation
Method
Description
Ester or salt
formation
The mother liquor, enriched with p-cresol by the
precipitation of the m-cresol adduct with sodium acetate,
can react with oxalic acid to give the semi- or di-ester,
which is precipitated at 20oC. The precipitate is
hydrolysed to give almost pure p-cresol.
Nuclear Substitution
Methods
Mixtures of m- and p-cresol react with isobutene to form
2,6-di-tert-butyl-p-cresol and 2,4-di-tert-butyl-m-cresol,
which are easily separated by means of distillation. p-
Cresol, m-cresol and isobutene are recovered after the
dealkylation of these di-tert-butylcresols. The individual
cresols are then further purified by distillation and may
ultimately have a purity higher than 99 percent.
1.3.5 Uses
1.3.5.1 o-Cresol
Most of the o-cresol manufactured in Europe is chlorinated to produce 4-chloro-
o-cresol (PCOC), which is used in the production of various
chlorophenoxyalkanoic acids, such as 4-chloro-2-methylphenoxyacetic acid
(MCPA); these compounds are important as selective herbicides. A much smaller
proportion of o-cresol is nitrated in the production of DNOC (4,6-dinitro-o-cresol),
which has both insecticidal and herbicidal properties. Highly pure o-cresol
produced in Japan is used for the production of epoxy-o-cresol novolak resins,
which are used as sealing agents in the manufacture of integrated circuits. o-
Cresol also serves as a precursor for various dye intermediates; o-cresotinic acid
(o-hydroxymethylbenzoic acid) is the most important and is produced by the
Kolbe synthesis. In fact, o-cresotinic acid is further used in the production of
various pharmaceutical products. The carbonate ester of o-cresol is used as the
starting material for the synthesis of coumarin, while the alkylation of o-cresol
with propene gives carvacol (5-isopropyl-2-methylphenol) used in antiseptics and
23
fragrances. o-Cresol is also used in small amounts to produce various
antioxidants.9
1.3.5.2 m-Cresol
m-Cresol, either pure or mixed with p-cresol, is used as the starting material of
important insecticides such as O,O-dimethyl-O-(3-methyl-4-nitrophenyl)-thiono-
phosphoric acid ester (fenitrothion) and O,O-dimethyl-O-(3-methyl-4-methyl-
thiophenyl)-thionophosphoric acid ester (fenthion). In addition, m-cresol is
required as starting material for the production of m-phenoxytoluene which, after
oxidation to m-phenoxybenzaldehyde, serves as an important precursor in the
production of pyrethroid insecticides. m-Cresol is an important chemical in the
fragrance and flavour industry, and serves as the starting material in the
production of (−)-menthol. 6-tert-Butyl-m-cresol is obtained by the isobutylation of
m-cresol, and is used as a starting material in the flavours industry and for the
production of various antioxidants. In Japan, m-cresol is aminated to form m-
toluidine. A number of disinfectants and preservatives are obtained from 4-
chloro-m-cresol, which is a product of the selective chlorination of m-cresol.
2,4,6-Trinitro-m-cresol has been used as an explosive.9
1.3.5.3 p-Cresol
p-Cresol, pure or mixed with the meta-isomer is used for the production of 2,6-di-
tert-butyl-p-cresol (BHT), a widely applicable antioxidant. 2-Alkyl-p-cresols, which
are produced through the monoalkylation of p-cresol and further condensed with
formaldehyde or sulphur dichloride, are also fairly important as antioxidants. It is
used extensively in the fragrance and flavour industry to produce p-anisaldehyde
from p-cresol methyl ether. As with o-and m-cresol, the para isomer is also used
as dye components.9
1.3.5.4 m-/ p-Cresol
Mixtures of the isomers (free from the o-isomer) are used to produce tricresyl
phosphate and diphenyl cresyl phosphate, which are useful as fire-resistant
hydraulic fluids, lubricant additives, air filter oils and as fire-retardant plasticisers
24
for PVC. Cresols have fungicidal properties and have thus found application as
soap disinfectants. Crude cresols are used as wood preservatives. Cresol
mixtures are also used in ore flotation and fiber treatment, and as a metal
degreasing and oil-cutting component. Methylcyclohexanol and methyl-
cyclohexanone are produced by the hydrogenation of cresols and are used in the
paint and textile industries.
1.4 NITROCRESOLS
Many mono- and dinitrocresols are available, but only those that may be
prepared easily and economically by either nitration or nitrosation of readily
available cresols, are significant. The next most accessible route to nitrocresols
is by diazotization of nitrotoluidines. Some phenols with higher alkyl groups are
readily available and certain of their nitro-derivatives are used as agrochemicals.
1.4.1 Physical properties
Compounds of this group are all yellow solids at room temperature with melting
points ranging between 33 and 146oC. Boiling points are generally high with
decomposition occurring at atmospheric pressure. Steam-distillation provides a
method of separation and purification for some of these compounds. Some of
these compounds are explosive and most decompose violently with the formation
of nitrous vapours. They are all extremely soluble in solvents such as petroleum
ether and toluene and some have a limited solubility in water. All may be
crystallised as either prisms, plates or needles from a variety of solvents.10,11
Table 1.3 highlights the more important nitrocresols and their physical properties.
25
Table 1.3: Some physical properties of the more important nitrocresols.
Property 4-Nitro-m-
cresol
2-Nitro-p-
cresol
4,6-Dinitro-
o-cresol
2,6-Dinitro-
p-cresol
Melting point (oC) 128-129 33 86.5 82
Boiling point (oC) >200 at atm.
decomp.
125
(2.9 kPa)
- -
Solubility in water sparingly sparingly sparingly -
1.4.2 Uses
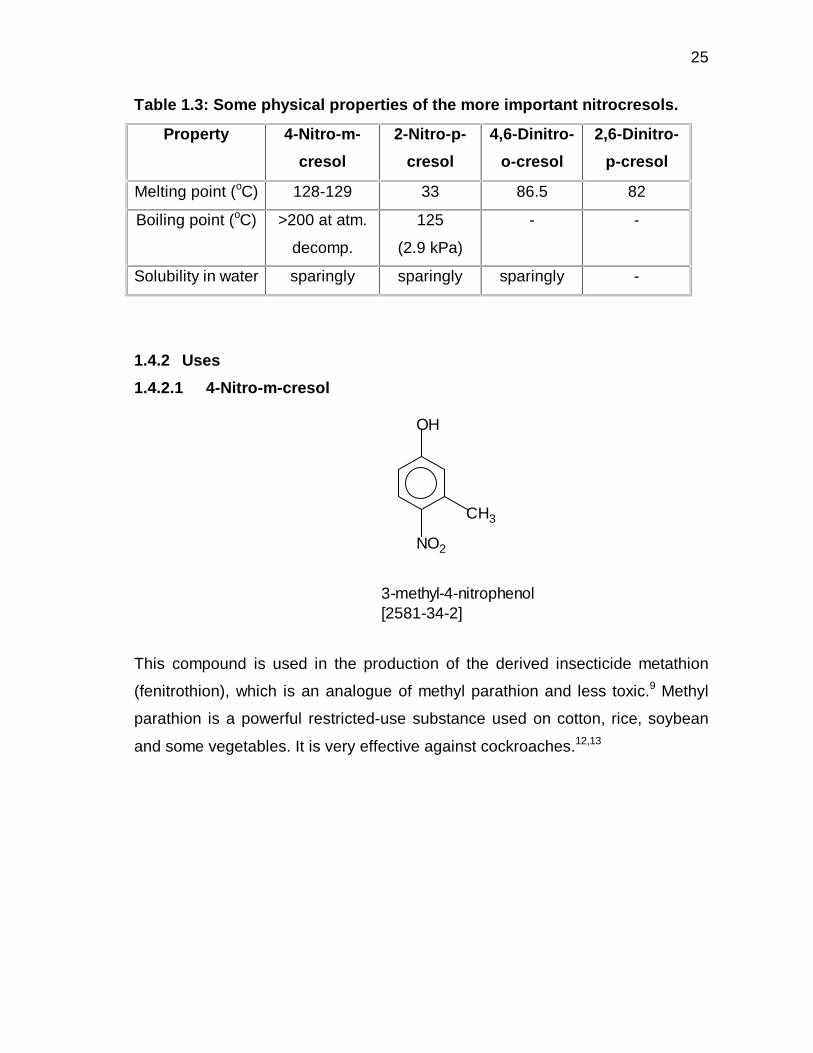
1.4.2.1 4-Nitro-m-cresol
This compound is used in the production of the derived insecticide metathion
(fenitrothion), which is an analogue of methyl parathion and less toxic.9 Methyl
parathion is a powerful restricted-use substance used on cotton, rice, soybean
and some vegetables. It is very effective against cockroaches.12,13
3-methyl-4-nitrophenol[2581-34-2]
OH
NO2
CH3
26
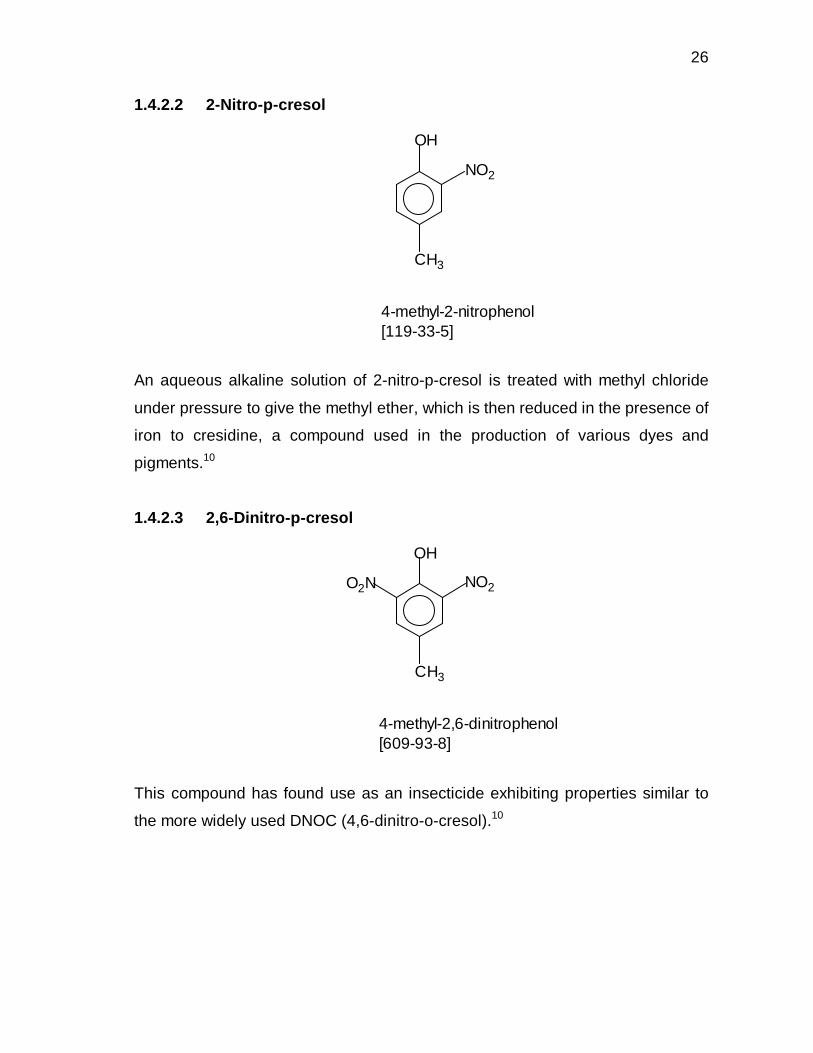
1.4.2.2 2-Nitro-p-cresol
An aqueous alkaline solution of 2-nitro-p-cresol is treated with methyl chloride
under pressure to give the methyl ether, which is then reduced in the presence of
iron to cresidine, a compound used in the production of various dyes and
pigments.10
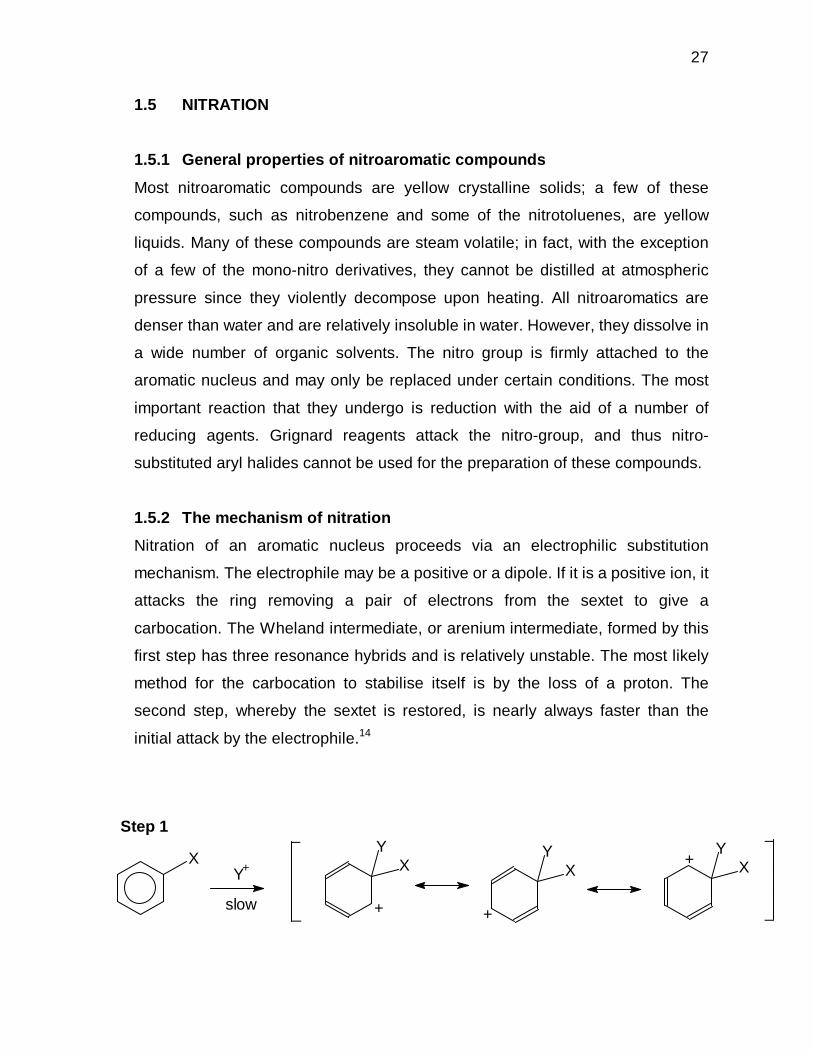
1.4.2.3 2,6-Dinitro-p-cresol
This compound has found use as an insecticide exhibiting properties similar to
the more widely used DNOC (4,6-dinitro-o-cresol).10
OH
CH3
NO2
4-methyl-2-nitrophenol[119-33-5]
OH
CH3
NO2O2N
4-methyl-2,6-dinitrophenol[609-93-8]
27
1.5 NITRATION
1.5.1 General properties of nitroaromatic compounds
Most nitroaromatic compounds are yellow crystalline solids; a few of these
compounds, such as nitrobenzene and some of the nitrotoluenes, are yellow
liquids. Many of these compounds are steam volatile; in fact, with the exception
of a few of the mono-nitro derivatives, they cannot be distilled at atmospheric
pressure since they violently decompose upon heating. All nitroaromatics are
denser than water and are relatively insoluble in water. However, they dissolve in
a wide number of organic solvents. The nitro group is firmly attached to the
aromatic nucleus and may only be replaced under certain conditions. The most
important reaction that they undergo is reduction with the aid of a number of
reducing agents. Grignard reagents attack the nitro-group, and thus nitro-
substituted aryl halides cannot be used for the preparation of these compounds.
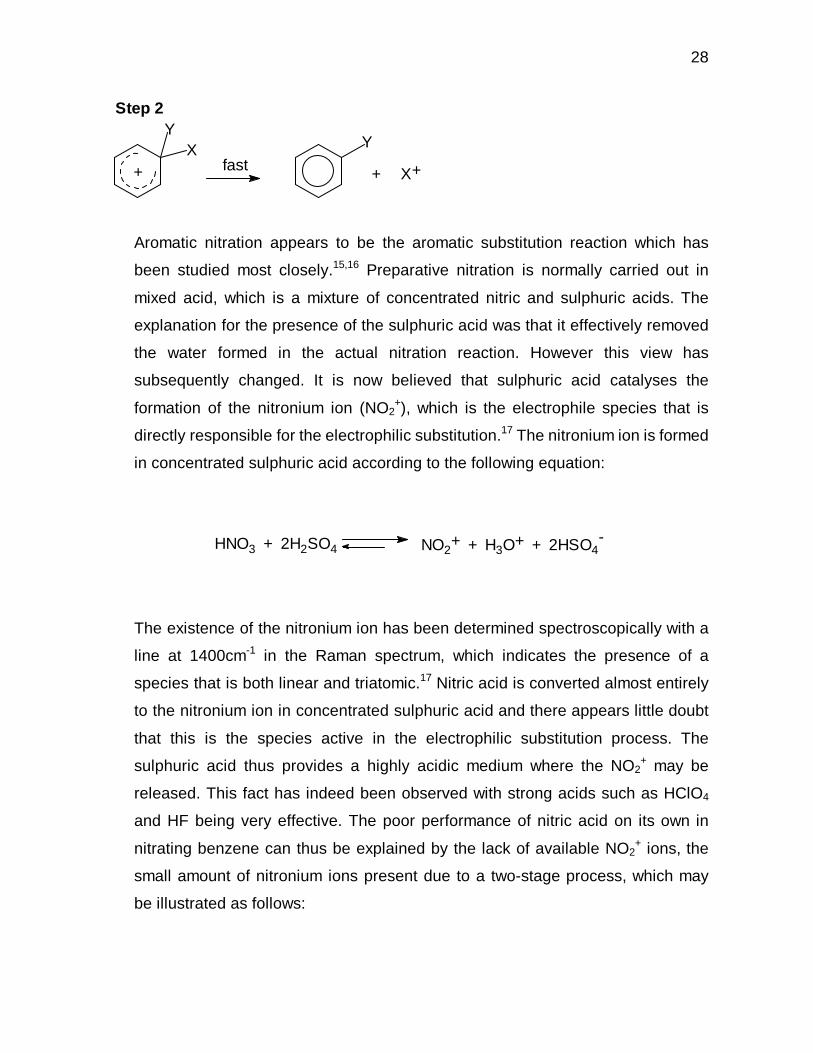
1.5.2 The mechanism of nitration
Nitration of an aromatic nucleus proceeds via an electrophilic substitution
mechanism. The electrophile may be a positive or a dipole. If it is a positive ion, it
attacks the ring removing a pair of electrons from the sextet to give a
carbocation. The Wheland intermediate, or arenium intermediate, formed by this
first step has three resonance hybrids and is relatively unstable. The most likely
method for the carbocation to stabilise itself is by the loss of a proton. The
second step, whereby the sextet is restored, is nearly always faster than the
initial attack by the electrophile.14
Step 1 _
_
_
_
YX
YX
YXY+
slow
X
+
+
+
28
Aromatic nitration appears to be the aromatic substitution reaction which has
been studied most closely.15,16 Preparative nitration is normally carried out in
mixed acid, which is a mixture of concentrated nitric and sulphuric acids. The
explanation for the presence of the sulphuric acid was that it effectively removed
the water formed in the actual nitration reaction. However this view has
subsequently changed. It is now believed that sulphuric acid catalyses the
formation of the nitronium ion (NO2+), which is the electrophile species that is
directly responsible for the electrophilic substitution.17 The nitronium ion is formed
in concentrated sulphuric acid according to the following equation:
The existence of the nitronium ion has been determined spectroscopically with a
line at 1400cm-1 in the Raman spectrum, which indicates the presence of a
species that is both linear and triatomic.17 Nitric acid is converted almost entirely
to the nitronium ion in concentrated sulphuric acid and there appears little doubt
that this is the species active in the electrophilic substitution process. The
sulphuric acid thus provides a highly acidic medium where the NO2+ may be
released. This fact has indeed been observed with strong acids such as HClO4
and HF being very effective. The poor performance of nitric acid on its own in
nitrating benzene can thus be explained by the lack of available NO2+ ions, the
small amount of nitronium ions present due to a two-stage process, which may
be illustrated as follows:
HNO3 + 2H2SO4 NO2+ + H3O+ + 2HSO4
-
+
Step 2Y
Xfast
Y
+ X+

29
Aromatic nitrations are generally slowed down by the addition of nitrate since the
substrate and NO3- would compete for the available NO2
+ ions. It is thus
expected that any compound that is capable of forming nitrates when added to
the nitrating mixture will lower the rate. Nitrous acid is known to be almost
completely ionised in concentrated HNO3. It is thus not surprising that nitrations
carried out in pure nitric acid or in other organic solvents are generally
decelerated by the addition of pure nitrous acid or nitrites, this action being
similar to that which would result from the addition of any strong base. However,
highly activated aromatic compounds such as phenol are found to undergo
nitration readily in even dilute nitric acid, and this occurs at a far higher rate than
can be explained on the basis of the NO2+ that is present in the mixture.17
1.5.3 Nitration via nitrosation
This effect is observed almost exclusively with highly activated aromatic
substrates, such as phenol and mesitylene. These substrates are known to
undergo nitrosation by nitrous acid, resulting in a nitroso-aromatic, which is
known to be rapidly oxidised by nitric acid to the corresponding nitro
compounds.18 The reason why this mechanism (nitrosation) has only been
observed for the more reactive aromatic compounds is twofold:
• The NO+ ion is a weaker acid and thus a much less powerful reagent in
electrophilic substitutions than is the NO2+ ion.
• Substantial quantities of NO+ ions may exist in solutions in which only small
amounts of NO2+ ions are present.18
H3O+ + NO3- + NO2
+ NO2 + HNO3H2O slow+
fast..HO NO2 + HNO3 H2O NO2 + NO3
- +

30
The nitrosophenol, which may be isolated, is oxidised very rapidly by nitric acid to
yield the p-nitrophenol. Nitrous acid is generated in this step and the process
becomes gradually faster. No nitrous acid need be present initially in the nitric
acid, since a small amount of the latter attacks phenol oxidatively to yield HNO2.
The rate-determining step is again believed to be the formation of the
intermediate carbocation. At the same time, direct nitration via the NO2+ ion takes
place, the conditions of the reaction medium determining the favoured route.
1.5.4 Reactivity and orientation in nitrations
When a mono-substituted benzene derivative, C6H5Y, undergoes electrophilic
attack, the incoming substituent will be incorporated on the ring at either the
ortho-, meta-, or para-position relative to the existing substituent. The rate of this
reaction will take place faster or slower than with benzene itself. Substitution
takes place either predominantly at the m- position or predominantly at the o- or
p-positions. Formation of the m-isomer is always slower than with benzene; the
formation of the o- or p-isomers is usually faster than with benzene itself. The
existing substituent, Y, directs substitution on the basis of electronic effects. It
can, of course, also have steric influence, but this effect would be observed
mostly at the o-position. Substituents, Y, may thus be classed as either being m-
directing, or o-/ p-directing; if substitution occurs faster than with benzene they
are termed activating; if slower, they are said to be deactivating.19,20 The rates
vary due to the substituent Y either adding electron density to the π-ring system
+
OH OHOH
H
OH
NO
NO+
NO
NO3
-
NO2
+ HNO2
HNO3
HNO2
+ 2HNO3 H3O+ 2NO3-+ + NO+
31
(activating) or alternatively withdrawing electron density (deactivating). This effect
is thus governed by the inductive effect. There is, however, another electronic
effect, known as the resonance effect, whereby electrons from the π-ring system
may be delocalised over the substituent as well as the ring, forming a partial
positive charge on the ring. Nitration of nitrobenzene, where Y is NO2, is found to
result in a mixture of 93 % m-, 6 % o- and 1 % p-isomers; i.e. NO2 is classed as a
meta-directing (deactivating) substituent. By contrast, nitration of anisole (Y is
OMe) yields 56 % p-, 43 % o- and 1 % m-isomers. The -OMe group is therefore
termed an o/ p-director and activates the aromatic nucleus since electrophilic
attack of anisole is faster than benzene.17
1.5.5 The ortho to para ratio
Consider for example, C6H5Y. If electronic effects alone were responsible for the
position that a substituent attaches to the mono-substituted aromatic nucleus, it
would be expected that the ortho to para ratio of isomers would be 2 : 1 since
there are 2 ortho-sites and only one para. There are a number of reasons why
this ratio is practically never observed:
• The para position is in a more favourable position for attack since the position
ortho to the substituent (Y) is effectively shielded. This steric effect causes a
decrease in the area through which an attacking electrophile could attach to
the aromatic nucleus. It would be expected that the o : p ratio would decrease
with an increase in bulkiness of the substituent, Y.
• This steric effect could however present itself in another way. The ortho to
para ratio would also be expected to decrease with increasing bulk of the
attacking group. For example, in the nitration of chlorobenzene, the ortho to
para ratio is 0.4; in the chlorination of the same substrate the ratio is 0.7.
• The strength of the inductive effect also plays a role in determining the ortho
to para ratio. In the nitration of a series of halobenzenes, the o : p ratio falls
from 0.70 to 0.14 as one proceeds from iodobenzene to fluorobenzene.
32
• There are some cases where ortho-substitution takes place with almost the
total exclusion of any para attack. It has been suggested that groups such as
CHO, COOH and NO2 facilitate nitration at the ortho position by dipole-dipole
interaction with the incoming nitronium ion.
• The solvent in which the reaction is carried out also influences o-/ p-ratios.
This may arise from changes in the relative stabilisation by solvent molecules
of the transition states for o- and p- attack, but may also involve the actual
nature of the attacking electrophile being different in different solvents.17,18
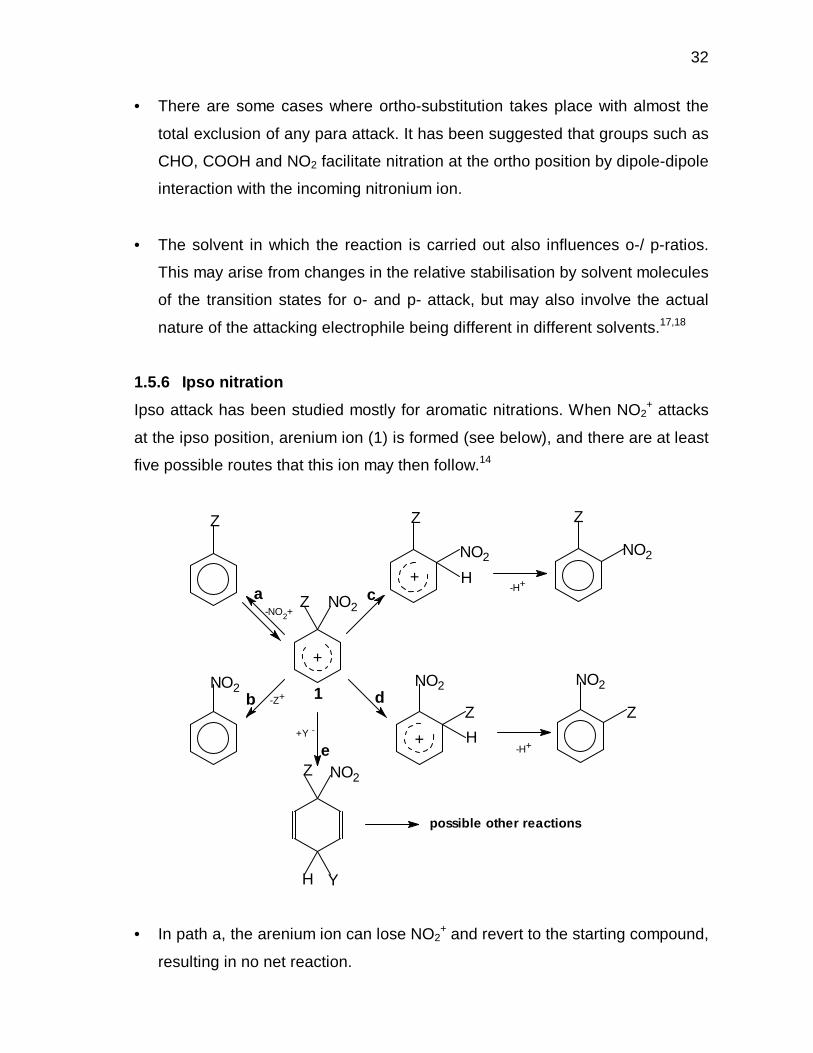
1.5.6 Ipso nitration
Ipso attack has been studied mostly for aromatic nitrations. When NO2+ attacks
at the ipso position, arenium ion (1) is formed (see below), and there are at least
five possible routes that this ion may then follow.14
• In path a, the arenium ion can lose NO2+ and revert to the starting compound,
resulting in no net reaction.
Z
NO2
Z
NO2
Z
Z
Z
NO2
NO2
NO2
NO2Z
H
H
H Y
-H+
-H+
-NO2+
a
b
c
d
e
-Z+
+Y -
possible other reactions
NO2
Z
1
+
+
+
33
• If path b is followed, the arenium ion can lose Z+ in which case a simple
aromatic substitution with leaving group other than H takes place.
• The electrophilic group can undergo a 1,2-migration, followed by loss of an
aromatic proton; path c will thus result in the same product as direct nitration.
It is, however, not easy to ascertain exactly how much of the ortho product is
formed in this way.
• In path d, the substituent (Z) can undergo 1,2-migration, and this would also
result in the formation of the ortho product, though this arrangement would
become more apparent if other substituents were present on the ring.
• The arenium ion may be subjected to nucleophilic attack (path e). This would
result in the formation of cyclohexadienes by 1,4-addition to the ring; further
reactions are then possible.
1.6 METHODS OF NITRATION AS APPLIED TO CRESOLS AND OTHER
HIGHLY ACTIVATED AROMATIC SUBSTRATES
1.6.1 Clays
Many practical problems still remain with the commercial nitration of various
organic substrates. For instance, in the United Kingdom, p-nitrotoluene was
obtained by the nitration of toluene but, until only recently, most of the co-formed
o-nitrotoluene was believed to be worthless and discarded or burnt. The poor
selectivity of the reaction meant that approximately 30 000 T per year of the
para-isomer was accompanied by 60 000 T of waste isomer (o-nitrotoluene).21 In
an age where environmental considerations could not allow such means of
disposal or, for that matter, such large amounts of by-products and waste, it is
clear that there is a need for better regioselective control.
34
Traditionally, solids, such as chromatographic adsorbents, have been used in
reactions to provide a surface on which to spread out a reagent. It was found that
some of these procedures provided high yields under mild conditions. The ease
of reaction set-up and work up was exceptional, with the cleanliness of the
reaction mixture being another advantage. Progress in surface science,
availability of new solids and an improved understanding of heterogeneous
catalysis has provided opportunities to design better catalysts and solid reagents.
Microporous solids such as silica and alumina offer a wide range of active sites
for catalysis and can mostly be regenerated if deactivated during a reaction.
Solid catalysts also have other advantages. The number of diffusional
encounters is increased when the adsorbate is anchored to a solid; the
adsorbates migrate to active catalytic sites which lowers the activation energy.
Another consequence is the restriction of angles of attack, which increases the
selectivity. Further increases in selectivity might be obtained when using
microporous solids such as zeolites which are shape selective.21
1.6.1.1 “Clayfen”
The uses of anhydrous metallic nitrates in organic nitrations have been known for
a number of years.22 It was established that in some metallic nitrates, covalent
bonding existed between the metal and the oxygen of the nitrate groups, which
may coordinate the metal by three different modes: as unidentate, bidentate or
bridging ligands. The highest reactivity was observed in the bidentate case, with
the metallic centre having abnormally high coordination numbers.23
The reactivity of the acetone solvate of iron(III)nitrate, obtained from
concentration under vacuum of acetone solution of iron(III)nitrate nonahydrate,
was investigated. This very unstable reagent was stabilised on a suitable solid
support.
K10 clay, an inexpensive acidic industrial catalyst, was chosen as the support
after trials were conducted with other clays, sand, silica gel, alumina and others.
This reagent was very unstable and lost its reactivity after only a few hours with
the constant evolution of nitrogen dioxide. It was applied to number of reactions
35
such as the oxidation of alcohols, regioselective nitration of phenols and the
conversion of thioketones into ketones.23 The nitration of phenols was carried out
under very mild conditions leading to only mononitrated products with great ease
of work up of reaction mixtures. The reactions were carried out at room
temperature in ether. The reaction was regioselective with no meta-nitration
being detected. With m-cresol, yields of 34 % para and 20 % ortho-products were
observed, with one of the ortho-products being favoured with respect to the
other. p-Cresol gave 58 % yield of the ortho-product.23 This method proved very
efficient in the ring-nitration of estrone, which is an important industrial reaction.
“Clayfen” nitration of this substrate gave a 55 % yield.24
1.6.1.2 “Claycop”
A group led by Cornelius and Laszlo25 studied a wide range of aromatic
substrates, from the nitration of benzene and activated aromatics through to
strongly activated aromatic compounds such as phenol, cresol and anisole with
K10 clay supported cupric nitrate. It was claimed that by simply varying the
conditions, it was possible to drive the reaction to either mono- or polynitration.
The reactions were carried out using Menke conditions, i.e. in the presence of
acetic anhydride, where the likely nitrating species is acetyl nitrate. In the
polynitration of benzene, significantly higher amounts of “claycop” were used,
and at times, small amounts of fuming nitric acid were added with cooling to 0 –
5oC. Generally the reactions proceeded satisfactorily at room temperature with
excellent yields of polynitrated products. This system was also applied to the
mononitration of substrates like m- and p-cresol, phenol and anisole. For m-
cresol, a yield of 90 % was obtained with a product distribution of 55 % and 15
%, respectively, for 5-methyl-2-nitrophenol and 3-methyl-4-nitrophenol. The
nitration of p-cresol gave a 95 % yield with selectivity of 92 % to 4-methyl-2-
nitrophenol. Nitration occurred mostly in the ortho-position with all substrates
except anisole. The difference in regioselectivity when using “claycop” with acetic
anhydride or “clayfen” might be due to the formation, in the former, of an
intermediate ester which lowers the electronic density of the ring, particularly in
the para-position, decreasing its susceptibility toward electrophilic attack.
36
1.6.2 Lanthanide triflates
Lanthanide(III)triflates were used in the nitration of a range of simple aromatic
compounds using stoichiometric amounts of 69 % nitric acid with high yields.26
The only by-product of the reaction was water and the catalyst was recycled by
simple evaporation from the water phase. Lanthanides have found increasing
use as mild and selective reagents in organic synthesis; particularly
lanthanide(III)triflates have been used to good effect as Lewis acids in Diels-
Alder, Michael, Friedel-Crafts 27,28 and Mukaiyama 29 reactions.
It is well known that even small amounts of water inhibit the action of other Lewis
acid catalysts, such as AlCl3, which is normally the catalyst of choice for Friedel-
Crafts-type reactions. Lanthanide(III)triflates, however, are stable in water and
therefore do not decompose under aqueous work up conditions, unlike
conventional Lewis acids.
In the nitration of activated aromatic systems, such as toluene, no dinitrated
products were observed. However, the catalyst failed to effect any nitration of
nitrobenzene under such mildly acidic conditions. This is in agreement with the
results obtained by Kawada, Mitamura and Kobayashi27 which indicated that this
catalytic system only works with highly electron-rich aromatics because of its low
Lewis acidity. For example, while the Friedel-Crafts acylation of anisole,
mesitylene and xylene proceeded readily, no acylation was observed for toluene
and benzene.
It was found that the lanthanide triflate salts, after reaction and subsequent
recycling, were still active for further nitrations with little loss in rate or yield, and
no change in the selectivity.26 The different rates obtained with various lanthanide
triflates indicate that the metal centre is involved. It is well known that mixtures of
nitric acid and triflic acid effect nitration,30 but it seems unlikely that free triflic acid
was formed since the pH of an aqueous lanthanide triflate solution was nearly
neutral.26

37
The relative ratios of the various nitroaromatic isomers produced are consistent
with electrophilic attack by NO2+, or more possibly by a NO2
+ carrier (2) or a
bidentate lanthanide nitrate species (3).
1.6.3 Mixed acid methods
As mentioned before, a number of nitration methods make use of mixed acids.
Mixtures of nitric acid with concentrated sulphuric acid have been used most
often. However, any strong acid that may cause the nitric acid to ionise into the
NO2+ species will effect nitration. Examples of such acids are HF and HClO4,
18
TFA (trifluoroacetic acid),31 CF3SO3H (trifluoromethanesulphonic acid)30 and
methanesulphonic acid.
1.6.3.1 Nitric/ sulphuric acid mixtures
It was shown by Coombes et al.32 that ipso substitution is important in the
nitration of p-cresol in H2SO4 and that 4-methyl-4-nitrocyclohexa-2,5-dienone, the
intermediate, smoothly decomposes into 4-methyl-2-nitrophenol. In fact, when p-
methylanisole is nitrated under the same conditions, 4-methyl-2-nitrophenol is an
important product formed through nitronium attack at C – Me, followed by attack
of water and loss of the methoxy group. In 54 – 82 % sulphuric acid, anisole was
quantitatively mononitrated, but the o : p ratio drops from 1.84 to 0.71 : 1. It thus
seems as if high para-selectivities were obtained in high sulphuric acid
concentrations. However, the authors report a loss in yield and accountability at
sulphuric acid concentrations higher than 82 %. This was attributed to dinitration
taking place, even though reactions were carried out in equimolar proportions of
reactants (HNO3 and the substrate). Mixed acid nitrations are known to produce
high amounts of side products due to oxidation and over-nitration. Another
consequence of mixed acid systems is the generation of large quantities of acid
2
O
O
OLn
H
N+ +
-
3
Ln O
O
O
N+
38
waste, the treatment of which adds to the production cost of any product. The
decrease in the o : p ratio, observed for methylanisoles, was also seen for m-
cresol, where the proportion of para-substitution increases from 33 to 52 % over
the range 58 to 81 % sulphuric acid.33
The system was also used, in a number of patents, as the method of choice for
the nitration of certain phenol derivatives.34,35 Sasaki and Mukai34 used this
method to nitrate tri-m-cresyl phosphate to selectively produce 5-methyl-2-
nitrophenol. According to them, it was possible to change the regioselectivity of
the tri-m-cresyl phosphate nitration by changing the reaction conditions; it was
thus possible to also selectively produce 3-methyl-4-nitrophenol.
1.6.3.2 Nitric/ nitrous acid mixtures
It has been illustrated in this discussion how nitrous acid may catalyse aromatic
nitration.17,18 This technique was employed by Subluskey 36 to nitrate a mixture of
m- and p-cresol. Nitrous acid was introduced into the acid mixture in the form of
liquid N2O4, which was condensed from cooled NO2 gas. Cresol was added and
the mixture left to react at below 5oC. The crude product was filtered as a cake,
and the 3-methyl-4-nitrophenol removed by extraction and purified by
crystallisation from benzene. The yield of 3-methyl-4-nitrophenol from this
reaction was 65 %.
1.6.4 Nitration via nitrosation
A number of methods have described the use of sodium nitrate as the nitrating
agent in the presence of a strong acid; some of these made use of sodium nitrite
as a catalyst for the reaction. Presumably the addition of nitrite (NO2-) was
involved in the formation of a nitrosating agent (NO+).37,38
1.6.4.1 NaNO3/ H2SO4
Kagan, Girard and Quertani37 made use of NaNO3 in the presence of
hydrochloric acid with lanthanum(III)nitrate as catalyst. They claimed that the
nitration of phenol only started once the lanthanum nitrate was added. It was also
claimed that only two products were formed during the nitration of m-cresol; the
39
reaction gave a total yield of 86 %, the selectivity was 87 and 13 % respectively
for 5-methyl-2-nitrophenol and 3-methyl-2-nitrophenol.
However, it has since been shown by Thompson and Zeegers38 that the work
done by Kagan was inaccurate. It was found that lanthanum nitrate has no
catalytic influence on the reaction mixture. In addition, during the nitration of m-
cresol, four products were consistently formed. The major product was the 4-nitro
isomer, followed by the 6-nitro and the 2-nitro isomer, and the 2-methyl-1,4-
benzoquinone by-product. The formation of the benzoquinone species had also
been observed when using procedures such as dilute HNO3, HNO3/ AcOH, clay
supported Cu(NO3)223 and NO2/ CH2Cl2. No quinone was observed when
nitration was carried out in 70 % H2SO4/ HNO3 at 0oC, a medium in which NO2+ is
the dominant nitrating species.33
Tompson et al. made use of a small excess of sodium nitrate in 3 M H2SO4 and a
catalytic amount of sodium nitrite. This method produced excellent results in the
mononitration of phenols, with yields of 90-95 % and no tarry by-products. The
authors noticed the existence of an “induction period”, related to temperature and
acid concentration, which could be decreased by the addition of sodium nitrite.
Conversely, the latency period could be increased by the addition of urea, a
nitrous acid trap; the addition of one equivalent of urea completely suppressed
nitration.38
It was proposed that the nitration mechanism of phenols in a two-phase system
proceeds through an initial electron transfer (ET) step with NO+ as the transfer
agent, the induction period being due to slow formation of the transfer agent.
40
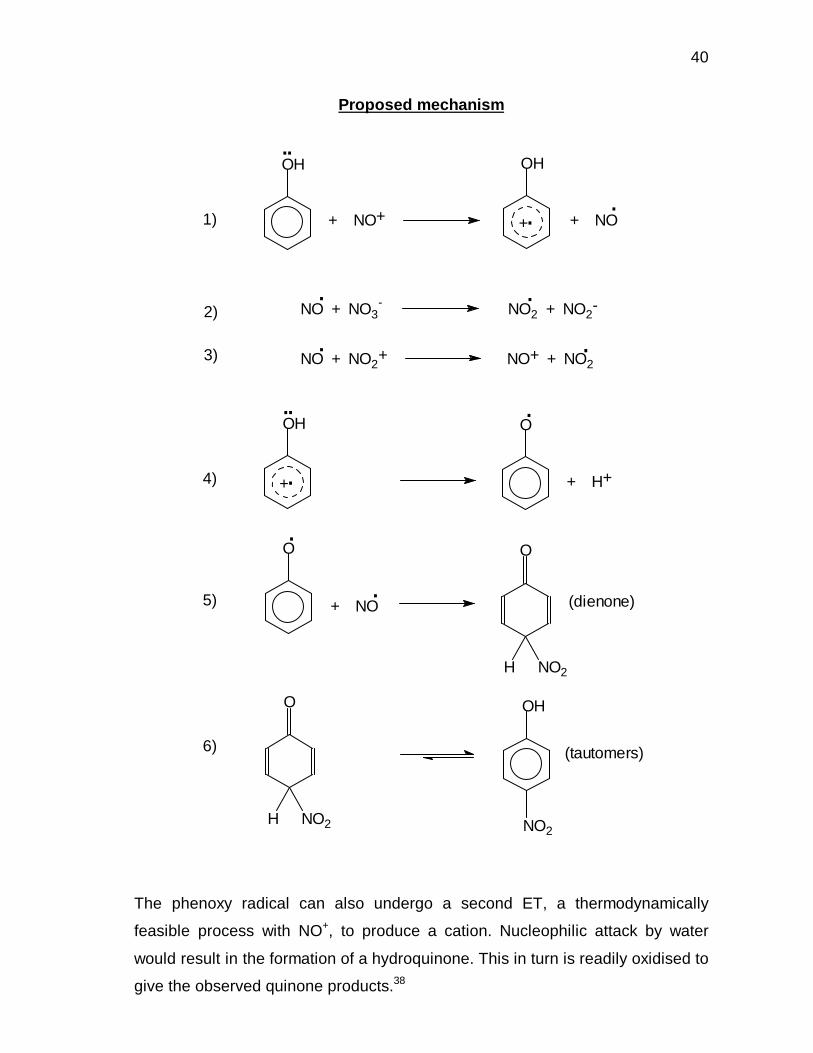
Proposed mechanism
The phenoxy radical can also undergo a second ET, a thermodynamically
feasible process with NO+, to produce a cation. Nucleophilic attack by water
would result in the formation of a hydroquinone. This in turn is readily oxidised to
give the observed quinone products.38
OH
+ H+4)
2)
3)
OH
1) + NO+
OH
O...
OH
NO + NO3-
. . NO2 + NO2
-
.. NO+ + NO2 NO + NO2
+
.+
..
.+ NO
.+
NO2H
O.
O
.+ NO (dienone)5)
NO2H
O
NO2
6) (tautomers)

41
1.6.4.2 NaNO3/ NaNO2 mixtures
In another study, NV and NIII were used as
nitrating agents, where NV is both HNO3 and NO3-
(from NaNO3) and NIII is both NO+ and HONO (from
NaNO2) in 50 – 60 % H2SO4.39 When only NV was
used, after 30 seconds reaction time almost no
nitrophenol was formed. When using NIII, the
reaction was practically complete in the same
time period; nitrosation is rapid and yields almost
entirely p-nitrophenol. Using NV for a longer time
(7 min) gave almost complete nitration; the
isomer ratio changed to 0.78 : 1 (o : p), which is
vastly different from that obtained by the
nitrosation route (0.03 : 1). It thus seems that
nitration via nitrosation exhibits an apparent
preference for p-nitro products. The rate of
nitrosation also seems to be higher than that of
direct nitration.
1.6.5 Other innovations
1.6.5.1 Use of acetic anhydride
42
Various publications reported the use of acetic
anhydride in the nitration mixture.40-44 The exact
reason for its inclusion is not very clear as it is
claimed by some that the reactive acetyl nitrate
species is formed in these mixtures.40 In contrast,
others claim that it is required as a dehydrating
agent, removing excess water when the reaction
is carried out with dilute nitric acid.42
1.6.5.2 Solvent effects
Nitrations, like many other types of reactions, may
be carried out in a variety of media. Changing the
solvent may, however, affect the outcome of the
reaction in terms of product yields, selectivities
and product distribution. For example, Germain,44
showed that the nitration of anisole with 65 %
nitric acid and sodium nitrite at room temperature
gave remarkably different o : p ratios in a variety
of solvents. The yields of the various reactions
were also markedly different. In carbon
tetrachloride, the products of the anisole nitration
were exclusively ortho- or para-nitroanisoles, with
43
an unusual para preference (o : p = 1 : 3.7).
Alkanes were found to be the most effective
solvents, while no reaction was observed in
diethyl ether.44
As is the case with any other reaction type, the
solvent should not react with the active species to
produce side products. It is exactly for that
reason that halogenated solvents, such as
ethylene dichloride and ethylene trichloride, have
been used frequently in these reactions.44 Also of
major importance is the fact that these solvents
showed high preference for para-products. This
was also observed in the case of ethyl acetate and
n-butyl acetate.
1.6.5.3 Use of transfer reagents
Nitrations of aromatics have recently been carried
out by the use of the nitropyridinium and
quinolinium ions.45,46 In these cases the reaction
is found to take place via a nucleophilic
displacement pathway, involving the N-
44
nitropyridinium ions themselves and not free
nitronium. It was found that steric factors, even
with such bulky nitrating agents (transfer agents),
did not play a major role in determining the
regioselectivities.45
In another publication, activated nitropyridinium
carboxylate salts were shown to effect highly
selective ortho nitration of phenol.47 It was
claimed that these highly reactive compounds
could be manufactured by passing NO2 – N2O4 gas
into a solution containing the pyridinium
carboxylic acid. The expensive nitronium
tetrafluoroborate, the reagent normally used for
these preparations, became unnecessary and the
recovered pyridinium salt could be reused in
further reactions.
In a separate study, use was made of
nitropyrazoles as the transfer agent in the
nitration of estrone. Yields were consistently in
45
the region of 35 – 40 %, with an apparent
preference for the ortho isomer.48
1.6.5.4 Use of gaseous reactants
The nitrations of phenols have also been carried
out with gaseous reactants. Mostly these gaseous
reactions are carried out with mixtures of NO2 and
N2O4.49,50 The mechanism of these nitrations are
believed to be the initial abstraction of the
phenolic hydrogen by NO2• and then reaction of
the phenoxy radical with a second molecule of
NO2•. Nitrations have even been carried out with
methyl nitrate.51
1.6.5.5 Side-chain nitration
Most studies on the nitration of aromatic
compounds have been concerned with the
electrophilic substitution of the aromatic nucleus.
However, some studies have dealt with the
nitration of the aromatic side-chain.52
Cerium(IV)ammonium nitrate has been used as a
side-chain-specific nitration agent. The
46
mechanism seems to involve abstraction of a
proton from the aromatic substituent with
subsequent oxidation of the resulting benzyl
radical to a cation. As is the case with other ET
(electron transfer) nitration reactions, abstraction
of the proton seems to be the rate-determining
step.
1.7 INDUSTRIAL CONCERNS
1.7.1 Scale-up of nitrations
Safety concerns regarding the scale-up of
nitrations result from a long history of safety
problems associated with nitration reactions such
as runaway reactions, explosions and product
stability problems.
The causes leading to exothermic runaway
reaction, have been identified as:

47
1. A poor understanding of the reaction
chemistry, or the kinetics, leading to a
badly designed plant.
2. Underrated control and safety backup
systems.
3. Inadequate procedures and training.
The first factor is the most important to chemists,
as it is their duty to interpret the relevant reaction
mechanisms.
48
Failure to adequately assess the process chemistry or reaction kinetics accounts
for a significant number of incidents. Specific causes include:
1. An underestimation of the heat evolved.
2. Unanticipated side-reactions, including the formation of unstable
by-products.
3. Changes in the onset temperature (for runaway decompositions)
with varying reaction conditions.
4. Unpredicted autocatalysis.
An underestimation of the heat of reaction, prior to scale-up, caused particular
problems and resulted in a number of failures. Heat dissipation from conventional
laboratory glassware is generally much higher than from a full-scale reactor. This
is a result of significant reductions in the surface area to volume ratio of reaction
vessels with increasing size. It is therefore essential that, before scale-up,
accurate information on the heat of reaction and, where appropriate, the heat
generation rate be obtained so that adequate cooling can be provided. Unless
this is done, the large-scale vessel may have an insufficient cooling capacity and
an exothermic runaway reaction may occur.53
1.7.2 Future of nitrations
With chemists under increasing pressure to perform “green chemistry”,
processes are required for the selective preparation of mono- and poly- nitrated
aromatic compounds. These processes must minimize the formation of by-
products and large amounts of highly acidic waste. Of equal importance is the
development of high yield nitration processes that are also economic in terms of
capital investment as well as energy inputs. It is however a certainty that
aromatic nitrations will remain one of the most important and widely used
industrial synthetic methods.

49
CHAPTER 2
EXPERIMENTAL
2.1 MATERIALS
2.1.1 Reagents for synthesis
All materials used during the respective syntheses, together with their sources
and respective grades, are listed in Tables 2.1 and 2.2 and were used as
received.
Table 2.1: Organic reagents for synthesis Chemical Formula Supplier Grade/ Purity
Acetic anhydride CH3COOCOCH3 Saarchem 99 %
Acetone CH3COCH3 Riedel de Haen 99 %
Carbon tetrachloride CCl4 Saarchem 99 %
m-Cresol CH3C6H4OH Merck 99 %
m-/ p-Cresol CH3C6H4OH Sastech 99 %
p-Cresol CH3C6H4OH Aldrich 99 %
1,2-Dichloroethane ClH2CCH2Cl BDH AR
Dichloromethane CH2Cl2 BDH AR
Diethyl ether (C2H5)2O Saarchem AR
Ethanol C2H5OH BDH AR
Petroleum ether (60 – 80oC)
Saarchem 99 %
Trifluoromethanesulphonic acid
CF3SO3H Aldrich 99 %
50
Table 2.2: Inorganic reagents for synthesis
Chemical Formula Supplier Grade/ Purity
Cupric nitrate Cu(NO3).3H2O NT Lab Supplies CP
De-ionised water H2O BHT DSA-30 water system
����� �����
Ferric nitrate Fe(NO3)3.9H2O Merck AR
Magnesium sulphate MgSO4 Saarchem CP
Montmorillonite K10 clay Aldrich
Nitric acid (65%) HNO3 Saarchem AR
Nitric acid (93%) HNO3 Protea Chemicals CP
Sodium bicarbonate NaHCO3 NT Lab Supplies CP
Sodium chloride NaCl NT Lab Supplies CP
Sodium nitrate NaNO3 Saarchem AR
Sodium nitrite NaNO2 Saarchem AR
Sulphuric acid (98%) H2SO4 BDH AR
Yttrium carbonate Y2(CO3)3.H2O Aldrich >99 %
Yttrium chloride YCl3.6H2O Aldrich 98 %
Yttrium triflate Y(CF3SO3)3 Aldrich >99 %
2.1.2 Reagents for analysis
The reagents used for HPLC analysis are listed in
Table 2.3. All standard materials were used as
received. Table 2.4 gives miscellaneous reagents
also used for analysis.
Table 2.3: Reagents for HPLC analysis
Chemical Formula Supplier Grade/ Purity

51
Acetonitrile CH3CN BDH HPLC
2,6-Dinitro-p-cresol C7H6N2O5 Acros 95 %
2-Methyl-1,4-benzoquinone
C7H6O2 Aldrich 99 %

52
Table 2.3: continued…
Chemical Formula Supplier Grade/ Purity
Methanol CH3OH BDH HPLC
3-Methyl-2-nitrophenol C7H7NO3 Aldrich 99 %
3-Methyl-4-nitrophenol C7H7NO3 Aldrich 99 %
4-Methyl-2-nitrophenol C7H7NO3 Aldrich 99 %
5-Methyl-2-nitrophenol C7H7NO3 Acros 97 %
Nitrobenzene C6H5NO2 Merck 99 %
Table 2.4: Miscellaneous reagents for analysis
Chemical Formula Supplier Grade/ Purity
Buffer solution (pH4) Saarchem AR
Buffer Solution (pH7) Saarchem AR
De-ionised water H2O BHT DSA-30 water system
��� � ������
Di-sodium tetraborate Na2B4O7.10H2O Sky Chem AR
Phenolphtalein C20H14O4 M&B AR
Phosphoric acid H3PO4 Holpro
Analytics
CP
2.2 SYNTHETIC PROCEDURES
2.2.1 Preparation of reactive clays
2.2.1.1 Preparation of clay supported iron(III)nitrate
– “clayfen”
53
Montmorillonite K10 (100 g) was added to 500 cm3
of de-ionised water and stirred vigorously for five
minutes. After stirring was stopped, the mixture
was left to stand for approximately one minute to
allow impurities (mainly silica particles) to settle.
The supernatant suspension was carefully
decanted, and the washed clay separated by
centrifugation. The clay was dried overnight at
120oC and stored in a desiccator.
Iron(III)nitrate nonahydrate (11.3 g; 0.028 mol) was
dissolved in 190 cm3 of acetone with vigorous
stirring. Montmorillonite K10 clay (15 g), pre-
treated as above, was slowly added to the acetone
mixture and left to stir for 12 hours. The acetone
was removed by evaporation on a rotary
evaporator under reduced pressure at 50oC, and
the resultant solid dried under these conditions
until a light yellow free-flowing powder was
obtained. The “clayfen” prepared in this manner
was used immediately, as the reagent is quite
unstable and releases NO2 gas constantly.
54
2.2.1.2 Preparation of clay supported
copper(II)nitrate – “claycop”
Pre-treated montmorillonite K10 (15 g) was added
to a stirred solution of copper(II)nitrate trihydrate
(10.0 g; 0.041 mol) in 190 cm3 acetone and left to
stir for 12 hours. The acetone was removed by
evaporation on a rotary evaporator under reduced
pressure at 50oC to yield a light blue free-flowing
powder. The “claycop” was stored in a desiccator.
This reagent is more stable than “clayfen”, and
may be stored for extended periods without any
obvious loss in activity.23-25
2.2.2 Preparation of 4-methyl-2-nitrophenol
p-Cresol (19.60 g; 181 mmol) was weighed into a
250 cm3 three-necked round bottom flask
containing 150 cm3 1,2-dichloroethane and the
solution stirred at 60oC. Nitric acid (65%; 18.32 g;
191 mmol) was added dropwise over a period of
60 minutes. After the acid addition was complete,
the reaction was left for an additional two hours to
55
ensure completion of the reaction. The mixture
was then poured over ice and the organic phase
extracted with petroleum ether. The excess
solvent was removed by distillation, after which
the crude product was weighed and set up for
steam distillation with internal steam generation.
The product was extracted from the aqueous
phase with ether and the solvent removed by
vacuum distillation. The product solidified once it
cooled to yield a solid that was golden-yellow in
colour with the distinct nitroaromatic odour (see
Appendix 4.3 and 4.4 for GC-MS and H-NMR data).
56
2.3 EXPERIMENTAL PROCEDURES
2.3.1 Nitrations
2.3.1.1 Dilute nitric acid
A stock solution of the substrate (m- or p-cresol)
was made in a 500 cm3 volumetric flask with the
reaction solvent, 1,2-dichloroethane. This mixture
also included nitrobenzene (internal standard) to
facilitate later analysis. The concentration of
cresol and nitrobenzene were both 0.15 mol.dm-3.
The stock solution was delivered from a burette
into a 100 cm3 two-necked round bottom flask
containing a magnetic follower. The reactor,
containing 20.00 cm3 of substrate solution, thus
contained cresol (3.00 mmol) and nitrobenzene
(3.00 mmol). Nitric acid (65 %) was added in a 1 : 1
ratio with the substrate, using a 250 µl
microsyringe. The nitric acid (0.29 g; 0.21 cm3;
3.00 mmol) was then weighed directly into the
substrate solvent mixture and a stopwatch was
started. The reaction ensued immediately and the

57
round bottom flask was placed in a stirred oil
bath, pre-heated at the specified temperature, and
fitted with a reflux condenser.
Sampling was carried out prior to nitric acid
addition (representing the time zero sample) and
during the reaction at specified times, typically at
30 or 60 minutes. This was done by taking a 0.5
cm3 aliquot with a 2 cm3 graduated pipette. This
sample was further diluted with 2.00 cm3 of
acetonitrile using a burette.
2.3.1.2 Lanthanide triflate catalysed reactions
Yttrium(III)triflate (0.16 g; 0.30 mmol) was weighed
into a 100 cm3 round bottom flask and 20.00 cm3
of the substrate/ internal standard stock solution
was added to the reaction flask by means of a
burette. The mixture was stirred for five minutes
before the time (0) sample was taken. The nitric
acid (0.29 g; 3.00 mmol) was weighed into the
reaction mixture, timing was started and the

58
mixture placed in a pre-heated oil bath and fitted
with a reflux condenser.
59
2.3.1.3 Nitrations with “clayfen”
Into a 100 cm3 two-neck round bottom flask
containing 50 cm3 of diethyl ether was added 5 g
of freshly prepared “clayfen”. To this suspension
was added m-cresol (1.09 g; 10.1 mmol) and
nitrobenzene (1.24 g; 10.1 mmol). The mixture was
stirred vigorously at room temperature for 20
hours. Samples were taken periodically during the
reaction to determine the progress.
2.3.1.4 Nitrations with “claycop”
To a suspension of “claycop” (2.40 g) in 30.0 cm3
carbon tetrachloride and 7.5 cm3 acetic anhydride
was added m-cresol (1.09 g; 10.1 mmol) and
nitrobenzene (1.23 g; 10.0 mmol). The mixture was
stirred vigorously for 60 minutes at room
temperature. Samples were taken at regular
intervals to determine the reaction progress.
2.3.1.5 Nitration with nitric and sulphuric acid mixtures
Into a 100 cm3 two-necked round bottom flask was added 20.00 cm3 of the
substrate/ internal standard stock solution. To that was added 98% H2SO4 (0.61
g; 6 mmol), and the mixture subsequently stirred for five minutes before an initial
60
sample was taken. 65% Nitric acid (0.281 g; 2.93 mmol) was added to the
reaction mixture by microsyringe and timing of the reaction started. The ratio of
nitric acid to substrate and nitric acid to sulphuric acid was 1 : 1 and 1 : 2,
respectively. The mixture was left to react for one hour with constant stirring.
2.3.1.6 Nitrosation reactions with NaNO2 and H2SO4/ or HNO3
A series of reactions were carried out with different nitrosating mixtures. In two of
the reactions, sodium nitrite was the nitrosation/ nitration agent with different
amounts of sulphuric acid as the promoter. In the third, reaction sodium nitrite
was added in a catalytic quantity with 65 % nitric acid.
m-Cresol and nitrobenzene in 1,2-dichloroethane (20.00 cm3) were added to the
reaction vessels from a burette. To the first reaction was added NaNO2 (0.21 g)
and H2SO4 (0.15 g); the molar ratio of NaNO2 : H2SO4 was 2 : 1.
In the second reaction, NaNO2 (0.21 g) and H2SO4 (0.03 g) were again added,
but, the ratio was 10 : 1 in this case.
In the final reaction NaNO2 (0.02 g; 0.30 mmol) was added to the substrate/
internal standard mixture. Nitric acid (0.28 g; 0.20 cm3) was subsequently added
to the nitration mixture.
In all three cases, mixtures were left to react for one hour with constant stirring
(750 rpm) at room temperature.
2.3.2 Reaction calorimetry
A number of reactions were carried out using the HEL Simular reaction
calorimeter. The data gathered from the reactions carried out on this instrument
were utilised for a variety of applications and studies, from determining the heats
of reaction to using the instrument to determine the efficiency of certain catalyst
systems, or a tool to carry out more controlled scale-up procedures.
61
The system was used to automate, as well as
duplicate, aspects of the nitration reactions. The
nitration of p-cresol was not only carried out on
this system to determine amount of energy
released in the exothermic process (heat of
reaction) but also because of the excellent control
of experimental variables such as reaction
temperature and feed rate.
The P.E. Technikon Chemistry department
recently acquired the HEL (Hazard Evaluation
Laboratories) non-isothermal reaction calorimetry
unit. HEL Winiso control and real-time data
logging software, interfaced with the power
compensation interfaces, controls the instrument.
A 500 cm3 stainless steel (SS316) Büchi reactor
with bottom drain valve and glass insert is at the
heart of the instrument. The inlet and outlet of the
reactor jacket is connected to a Julabo F32
heater/ chiller unit. A Leeson, magnetic driven,
impeller provides agitation. A HEL internal
calibration heater with a 25 mm hot-end provides
62
heating from within the reactor. Liquid reagents
are dosed to the reactor via a Prominent gamma
G/ 4b metering pump running off a Oxford top-
loader balance. Temperature differences are
measured and logged in real-time at a number of
key points in the reactor, for the purpose of
thermodynamic calculations, by PT100
temperature probes. Provision is made on the unit
for a number of additional unit operations such as
on-line pH determination and adjustment,
introduction of gaseous reagents via a mass flow
controller, solids feed and an additional liquid
feed, distillation apparatus as well as reactions
under pressure (up to 50 bar).
The reaction calorimeter was operated in power compensation mode with use of
the glass reaction liner. The compensation drop (the difference between the
reactor temperature and jacket circulation temperature) was set between 30 and
50oC. In all cases, p-cresol was the substrate and the reaction was carried out in
250 cm3 1,2-dichlorethane. Though there were certain changes in the reaction
variables, such as acid concentration, use of a catalyst, sampling during the
reaction, acid feed rate and substrate loading, a representative method may be
written as follows:
p-Cresol (40.0 g; 0.370 mol) was weighed into the reactor glass liner; to this was
added 250 cm3 1,2-dichloroethane. The liner, containing the reaction mixture,
63
was placed inside the reactor and the reactor lid was secured on to the system. A
reflux condenser fitted with a rubber hose (for venting of noxious fumes) was
fitted to the reactor lid. The reactor was heated up to 50oC with the internal
calibration heater with constant stirring at 500 rpm. Once stable temperature and
power baseline curves were obtained, the reaction was initiated. Nitric acid (35.6
g; 25.4 cm3) was added to the reactor via the liquid dosing pump with a constant
feed rate of 0.5 cm3.min-1. After addition of the acid was complete, the mixture
was stirred for an additional 90 minutes to ensure completeness of reaction.
Samples were taken before and after the reaction by removing a 0.5 cm3 aliquot
and diluting it with 5.00 cm3 acetonitrile. To that was weighed an accurate
amount of the internal standard (nitrobenzene).
64
2.4 ANALYTICAL PROCEDURES
2.4.1 Gas Chromatography
GLC Analyses were carried out using a Varian
3400 Gas Chromatograph equipped with a 30 m x
0.32 mm i.d. SPB-1(Supelco) column, or a 30 m x
0.32 mm i.d. SPB-5 (Supelco) column, and a flame
ionisation detector. Data were acquired from the
detector by means of an Olirite personal
computer, equipped with Delta for Windows
chromatography software. The carrier gas (N2)
flow rate was 1.88 cm3.min-1 with a column head
pressure of 0.42 kg.cm-3. The injector was
operated in the split mode with a split ratio of 1 :
���� ZLWK� DQ� LQMHFWLRQ� YROXPH� RI� �� O�� 6DPSOHV�
weUH�LQMHFWHG�ZLWK�WKH�DLG�RI�D�+DPLOWRQ���� O�*&�
syringe. Typical GC conditions for analyses are
given in Table 2.5. This technique was not used
for quantification, but only as a tool to determine
the progress of certain reactions.
Table 2.5: Important GC settings
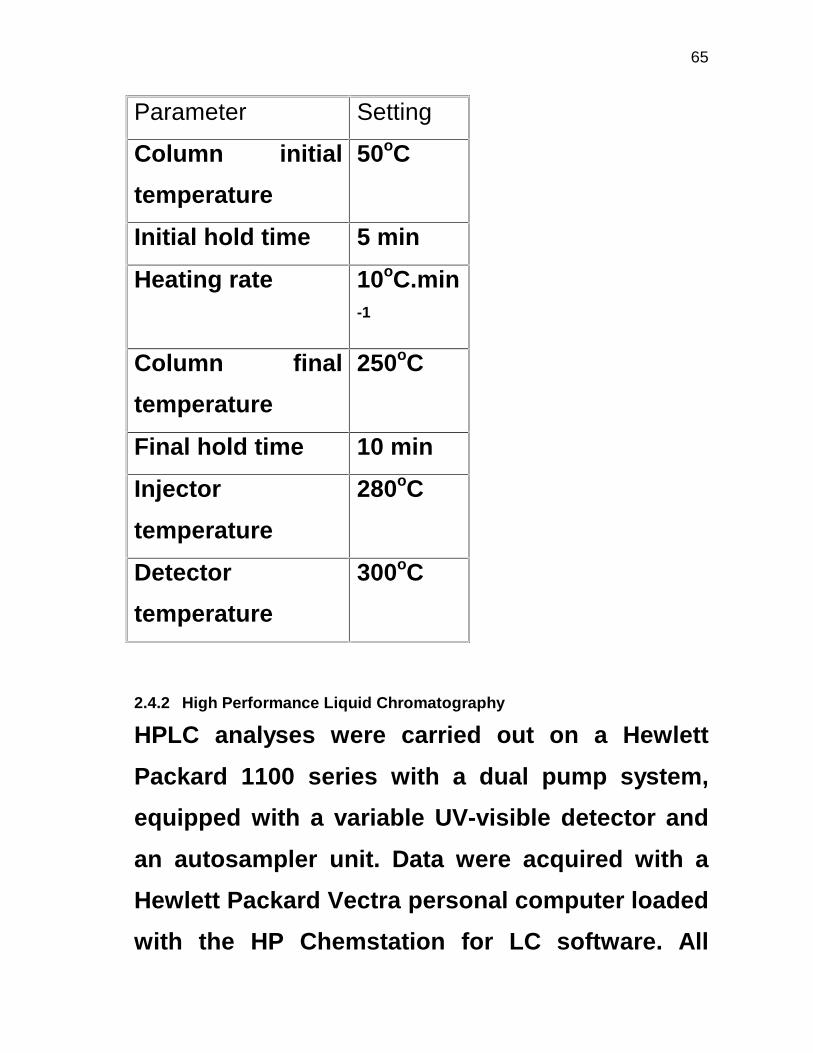
65
Parameter Setting
Column initial
temperature
50oC
Initial hold time 5 min
Heating rate 10oC.min-1
Column final
temperature
250oC
Final hold time 10 min
Injector
temperature
280oC
Detector
temperature
300oC
2.4.2 High Performance Liquid Chromatography
HPLC analyses were carried out on a Hewlett
Packard 1100 series with a dual pump system,
equipped with a variable UV-visible detector and
an autosampler unit. Data were acquired with a
Hewlett Packard Vectra personal computer loaded
with the HP Chemstation for LC software. All
66
solvents were HPLC grade and were degassed
prior to analysis with a Millipore vacuum
degassing unit. Water, adjusted to a pH of 3 (with
H3PO4), and acetonitrile were used as mobile
phases and the instrument was operated in the
isocratic mode. A 3.9 x 300 mm Waters
%RQGDSDN� &18 (serial no. W90211G041) column
or a 4.6 x 250 mm Waters Symmetry Shield RP8
(serial no.T71701N04) column were used for
analyses of reaction samples.
As different substrates were used in the
reactions, analysis of the mixtures required
different LC conditions. These settings are
summarised in Table 2.6. The internal standard
method, with nitrobenzene as standard, was used
for the analysis of individual components of m-
cresol and p-cresol reaction mixtures. Response
factors for the compounds of interest were
determined by means of a three-level calibration
using standard solutions containing known
amounts of the analytes and internal standard.
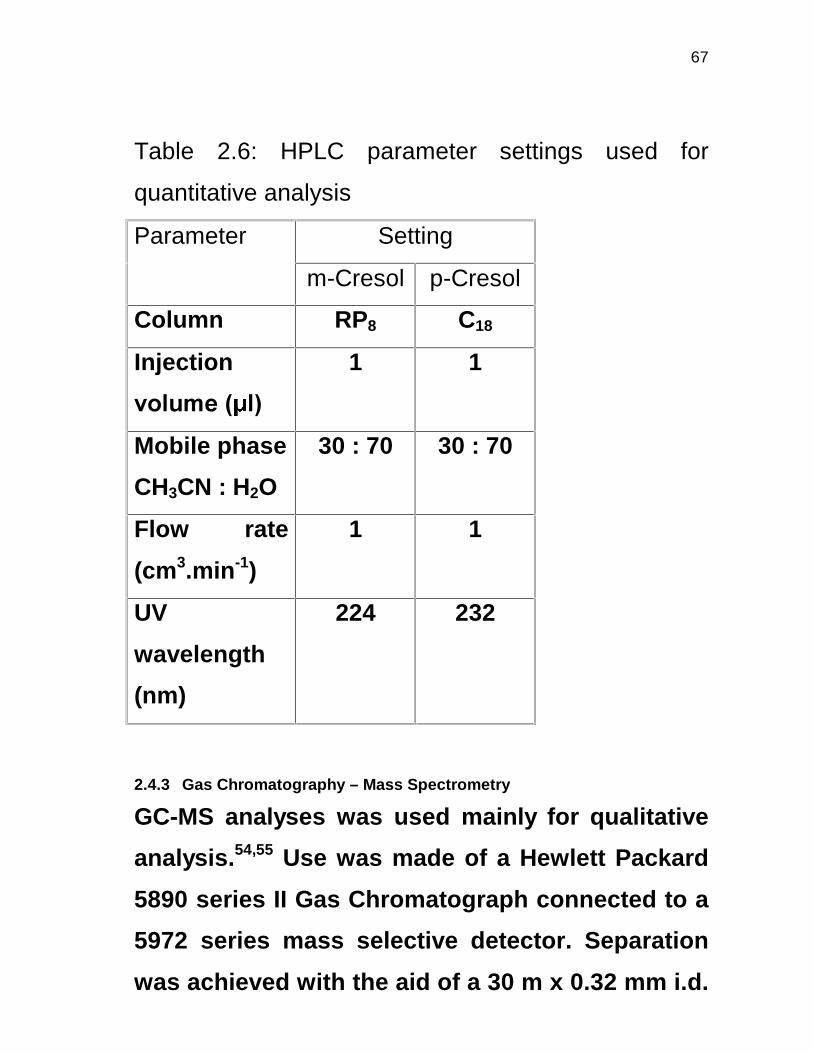
67
Table 2.6: HPLC parameter settings used for
quantitative analysis
Setting Parameter
m-Cresol p-Cresol
Column RP8 C18
Injection
YROXPH�� O�
1 1
Mobile phase
CH3CN : H2O
30 : 70 30 : 70
Flow rate
(cm3.min-1)
1 1
UV
wavelength
(nm)
224 232
2.4.3 Gas Chromatography – Mass Spectrometry
GC-MS analyses was used mainly for qualitative
analysis.54,55 Use was made of a Hewlett Packard
5890 series II Gas Chromatograph connected to a
5972 series mass selective detector. Separation
was achieved with the aid of a 30 m x 0.32 mm i.d.
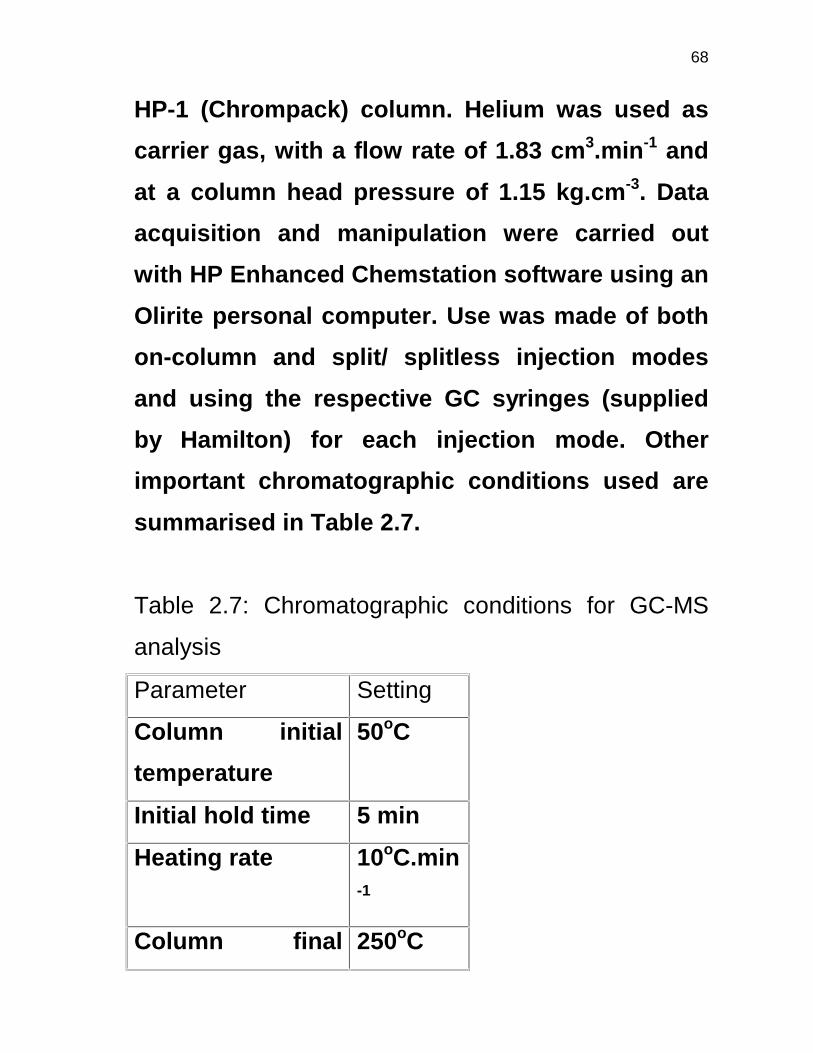
68
HP-1 (Chrompack) column. Helium was used as
carrier gas, with a flow rate of 1.83 cm3.min-1 and
at a column head pressure of 1.15 kg.cm-3. Data
acquisition and manipulation were carried out
with HP Enhanced Chemstation software using an
Olirite personal computer. Use was made of both
on-column and split/ splitless injection modes
and using the respective GC syringes (supplied
by Hamilton) for each injection mode. Other
important chromatographic conditions used are
summarised in Table 2.7.
Table 2.7: Chromatographic conditions for GC-MS
analysis
Parameter Setting
Column initial
temperature
50oC
Initial hold time 5 min
Heating rate 10oC.min-1
Column final 250oC

69
temperature
Final hold time 10 min
Injector
temperaturea
280oC
Detector
temperature
300oC
Detector solvent
delay
2 min
a – An injector heating program was used with the on-column injection mode.
This mode of operation was mainly used for the
identification of specific mass fragments in
reaction samples, with the aid of the Chemstation
library of organic compounds. The observed
fragmentation patterns were then compared to
calculated fragmentations.
2.4.4 Nuclear Magnetic Resonance
NMR analysis was carried on a 400 MHz Bruker
instrument. Samples were dissolved in CDCl3 with
tetramethylsilane as internal standard. Analyses
of data were carried out on a Compaq personal
computer with WINNMR software.
70
2.4.5 Differential Scanning Calorimetry
A Mettler Toledo DSC 820 was used to determine
the decomposition temperature of 2,6-dinitro-p-
cresol. The sample was placed in an aluminium
sample pan (working range up to 400oC) and
sealed with a press. Data were analysed on a
Mecer premium-X personal computer with the aid
of the Mettler STARe software.
2.4.6 UV/ Visible Spectrophotometry
The optimum UV absorbance wavelengths of
HPLC standards were first determined with the aid
of a Beckman DU® 7500 double beam UV/ Vis
spectrophotometer with IBM colour screen and
Beckman DU series 7000 software. A quartz
sample cell (cuvette) was used with methanol or
acetonitrile as solvents.
2.4.7 pH determination
Use was made of a Metrohm 654 digital pH meter
with a WTW Sentix single glass pH electrode
71
(serial no. C000304091) to adjust the pH of the
aqueous phase (pH = 3) for use in HPLC analysis.
2.4.8 Titrimetric analyses
Nitric acid, of varying concentrations, was
standardised by direct titration with borax
(Na2B4O7.10H2O) and using phenolphthalein as
acid/ base indicator.
72
CHAPTER 3
NITRATION OF m-CRESOL
3.1 INTRODUCTION
Industrially important nitrocresols have all been prepared by the direct
nitration of the cresol in mixtures of concentrated nitric and sulphuric
acids or by the nitrosation and subsequent oxidation of the cresol
substrate. Highly activated aromatic compounds, such as phenol and
cresols, are easily nitrated and may be successfully nitrated even in dilute
nitric acid.
The main concern in the nitration of m-cresol is
the regio-selectivity of the reaction. This is a
consequence of the fact that both the hydroxyl
and methyl groups are activating para-directors
on the aromatic ring. Thus, the substrate is
sufficiently activated towards electrophilic attack
at any of the available aromatic sites. Of the three
nitro-products that are formed in the reaction,
only 3-methyl-4-nitrophenol has significant
industrial importance. It is possible to separate
this isomer from the two ortho-products (3-
methyl-2-nitrophenol and 5-methyl-2-nitrophenol)

73
by steam distillation. However, separation of the
two ortho-products is not as easily achieved.
The fourth product in the m-cresol nitration is 2-
methyl-1,4-benzoquinone. The formation of this
species has been explained in terms of the
formation of a phenol radical with the subsequent
nucleophilic attack by water to form
methylhydroquinone. The methylhydroquinone is
then oxidised to the benzoquinone in the nitric
acid medium.
Another problem that is often encountered in the
nitration of phenolics with nitric acid is that highly
activated substrates such as these readily form
tarry by-products. The formation of these reaction
tars may be the result of the formation of dimers
and higher oligomers.
3.2 OBJECTIVES

74
From the preceding discussion, it is clear that
regio-selectivity during the nitration of m-cresol is
a major concern. Other points of interest are the
minimisation of by-products and tars. The
objectives for this section may thus be
summarised as follows:
• To investigate the influence of catalysis on the
regio-selectivity, conversion, yield and
accountability during nitration procedures.
• To evaluate and adjust the levels of reaction
parameters such as temperature, acid
concentration and acid to substrate ratio by
using statistical experimental designs with the
view to optimise regio-selectivity, yield and
accountability.
• To investigate the effect of alternative nitrating
procedures on regio-selectivity.
3.3 RESULTS AND DISCUSSION
3.3.1 Definitions

75
The following terms were used in the discussion
of results:
( )
( ) 1100
charged substrate of molesconsumed substrate of moles
(%) Conversion ×=
( )( ) 1
100charged substrate of moles
formedproduct specific of moles (%)product a of Yield ×=
( )( ) 1
100formed products all of moles
formedproduct specific a of moles (%)product a of ySelectivit ×=
( )( ) 1
100charged substrate of moles
reaction after substrate and products of moles (%) lityAccountabi ×=
eldsproduct yi all of sum (%) yieldTotal =
3.3.2 Nitrations using yttrium(III)triflate as catalyst
Waller et al.26 made use of lanthanide triflate salts
as catalysts for the nitration of a number of
aromatic species in ClC2H4Cl with stoichiometric
amounts of 65 % HNO3. Typically, yields in excess
of 95 % were reported for activated aromatic
substrates such as toluene and xylene. Apart
from the high yields obtained, the use of this
catalyst was claimed to offer other advantages
too, such as:
76
• The formation of H2O as the only by-product;
• The recycling of the catalyst without significant
loss in activity; and
• The use of mild reaction conditions which
alleviates safety concerns.
In view of the possible advantages of
yttrium(III)triflate as nitration catalyst, it was of
interest to investigate whether the use of this
catalyst would have any influence on the regio-
selectivity during the nitration of m-cresol with
dilute nitric acid solutions. For these reactions,
the yttrium(III)triflate was weighed directly into a
reaction flask containing 20 cm3 of 1,2-
dichloroethane containing m-cresol (0.3249 g; 3
mmol) and nitrobenzene (0.3693 g; 3 mmol).
Reactions were carried out with an acid to
substrate ratio of 1 : 1. 65 % Nitric acid (0.2879 g;
3 mmol) was added to the mixture over a period of
approximately one minute at room temperature.
Timing was started as soon as the first drop of
acid fell into the reaction flask. The mixture was
77
placed in a pre-heated oil bath and heated to
reflux. Sampling was carried out as described in §
2.3.1.1. HPLC analysis was carried out with the
internal standard method as described in § 2.4.2.
The reaction was followed for 30 minutes. The
results obtained are shown in Table 3.1 and
illustrated graphically in Figure 3.1.
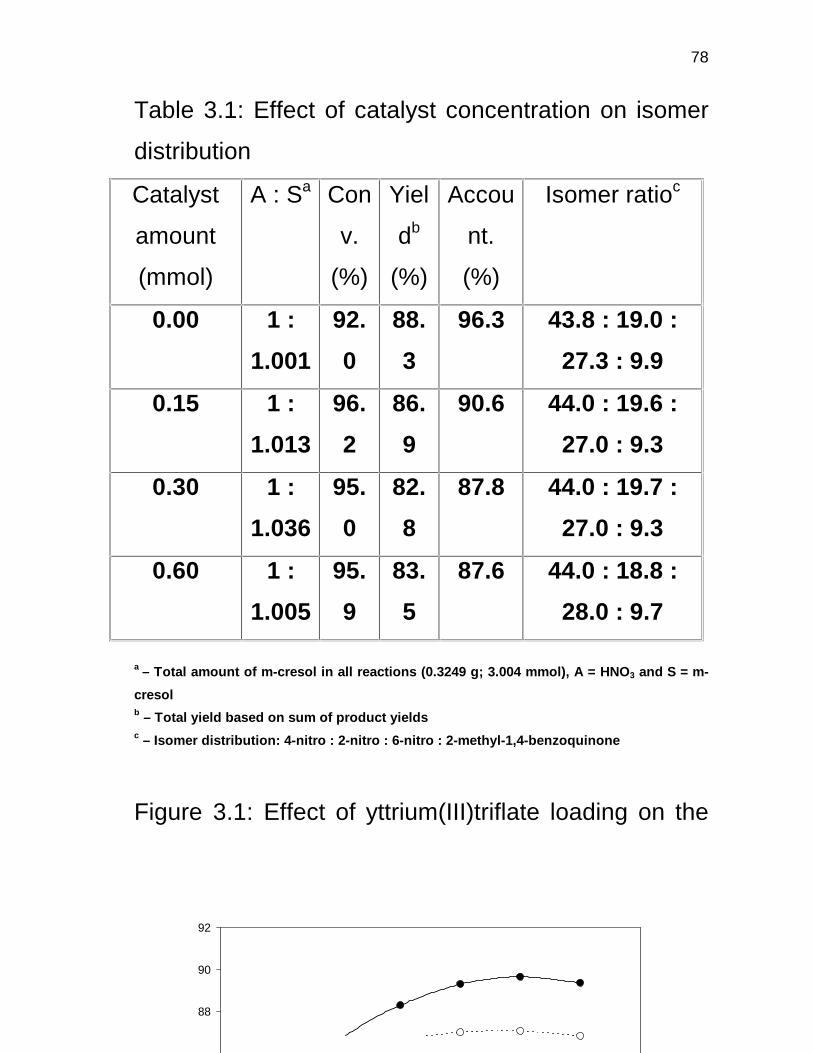
78
Table 3.1: Effect of catalyst concentration on isomer
distribution
Catalyst
amount
(mmol)
A : Sa Con
v.
(%)
Yiel
db
(%)
Accou
nt.
(%)
Isomer ratioc
0.00 1 :
1.001
92.
0
88.
3
96.3 43.8 : 19.0 :
27.3 : 9.9
0.15 1 :
1.013
96.
2
86.
9
90.6 44.0 : 19.6 :
27.0 : 9.3
0.30 1 :
1.036
95.
0
82.
8
87.8 44.0 : 19.7 :
27.0 : 9.3
0.60 1 :
1.005
95.
9
83.
5
87.6 44.0 : 18.8 :
28.0 : 9.7 a – Total amount of m-cresol in all reactions (0.3249 g; 3.004 mmol), A = HNO3 and S = m-
cresol b – Total yield based on sum of product yields c – Isomer distribution: 4-nitro : 2-nitro : 6-nitro : 2-methyl-1,4-benzoquinone
Figure 3.1: Effect of yttrium(III)triflate loading on the
total percentage yield obtained
88
90
92

79
80
The results presented in Table 3.1 and Figure 3.1
is somewhat surprising in that the presence of
Y(TFA)3 (yttrium(III)triflate) clearly had a
detrimental effect on the nitration efficiency.
There is a significant decrease in both the yield of
desired nitration products as well as the
accountability of the reaction. Furthermore, the
relative amounts of products clearly show that
Y(TFA)3 has no influence on the regio-selectivity
of the nitration.
These results could possibly be explained in
terms of the rapid reaction between nitric acid and
m-cresol in the absence of a catalyst under the
reaction conditions used. However, the decrease
in accountability of the reaction in the presence of
Y(TFA)3 cannot be easily explained. In order to
understand the role of the catalyst in these
reactions, it was decided to investigate the
nitration of m-cresol with dilute nitric acid without
using a catalyst in more detail.

81
3.3.3 Nitration with dilute nitric acid
3.3.3.1 General The nitration of m-cresol in 1,2-dichloroethane with dilute nitric acid was
evaluated with the aid of a full 23 central composite experimental design with the
view to obtaining a thorough understanding of the nitration mechanism and the
experimental variables that affect the outcome of the reaction.56,57 The optimum
points derived from this design are only applicable to the reaction as carried out
in the laboratory, and provides no information about process details or possible
scaling-up of the reaction.
3.3.3.2 Identification of reaction variables
The optimisation of chemical reactions requires that all experimental variables
that may affect the reaction in any way, be identified and investigated.58 Such
variables would normally include many chemical engineering factors, such as
reactor design, heat transfer, feed of materials, etc., for the investigation of
production scale processes. However, in this case, chemical engineering factors
were excluded from the design since the aim of the experimental design was to
determine whether the chosen variables had a significant effect on the design
responses on laboratory-scale.
For the present design, the following variables were identified as ones that might
impact on the reaction results: the nitric acid concentration, ratio of acid to
substrate and the reaction temperature. It was felt that the acid concentration
could affect the results because of the change in the amount of aqueous solution
introduced into the reaction mixture, and thus also a change in the number of
collisions between the aqueous nitronium ions and the substrate molecules in the
organic phase. The concentration of the nitric acid also determines the amount of
nitronium ions. The acid to substrate ratio is associated with the reaction
stoichiometry and hence the degree of substrate conversion and product
formation. Reaction temperature was included in the design since temperature
plays an important role in the kinetics of individual reactions, both product and
by-product formation reactions, and may influence the selectivity of the reaction.
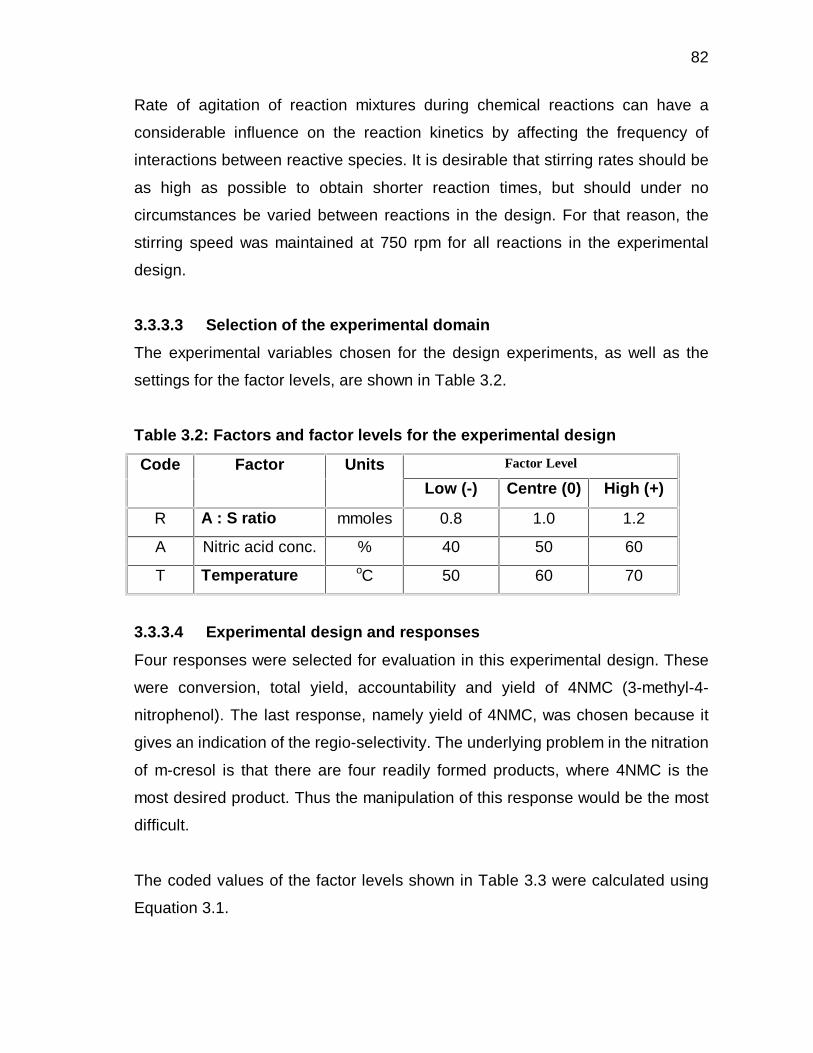
82
Rate of agitation of reaction mixtures during chemical reactions can have a
considerable influence on the reaction kinetics by affecting the frequency of
interactions between reactive species. It is desirable that stirring rates should be
as high as possible to obtain shorter reaction times, but should under no
circumstances be varied between reactions in the design. For that reason, the
stirring speed was maintained at 750 rpm for all reactions in the experimental
design.
3.3.3.3 Selection of the experimental domain
The experimental variables chosen for the design experiments, as well as the
settings for the factor levels, are shown in Table 3.2.
Table 3.2: Factors and factor levels for the experimental design
Factor Level Code Factor Units
Low (-) Centre (0) High (+)
R A : S ratio mmoles 0.8 1.0 1.2
A Nitric acid conc. % 40 50 60
T Temperature oC 50 60 70
3.3.3.4 Experimental design and responses
Four responses were selected for evaluation in this experimental design. These
were conversion, total yield, accountability and yield of 4NMC (3-methyl-4-
nitrophenol). The last response, namely yield of 4NMC, was chosen because it
gives an indication of the regio-selectivity. The underlying problem in the nitration
of m-cresol is that there are four readily formed products, where 4NMC is the
most desired product. Thus the manipulation of this response would be the most
difficult.
The coded values of the factor levels shown in Table 3.3 were calculated using
Equation 3.1.
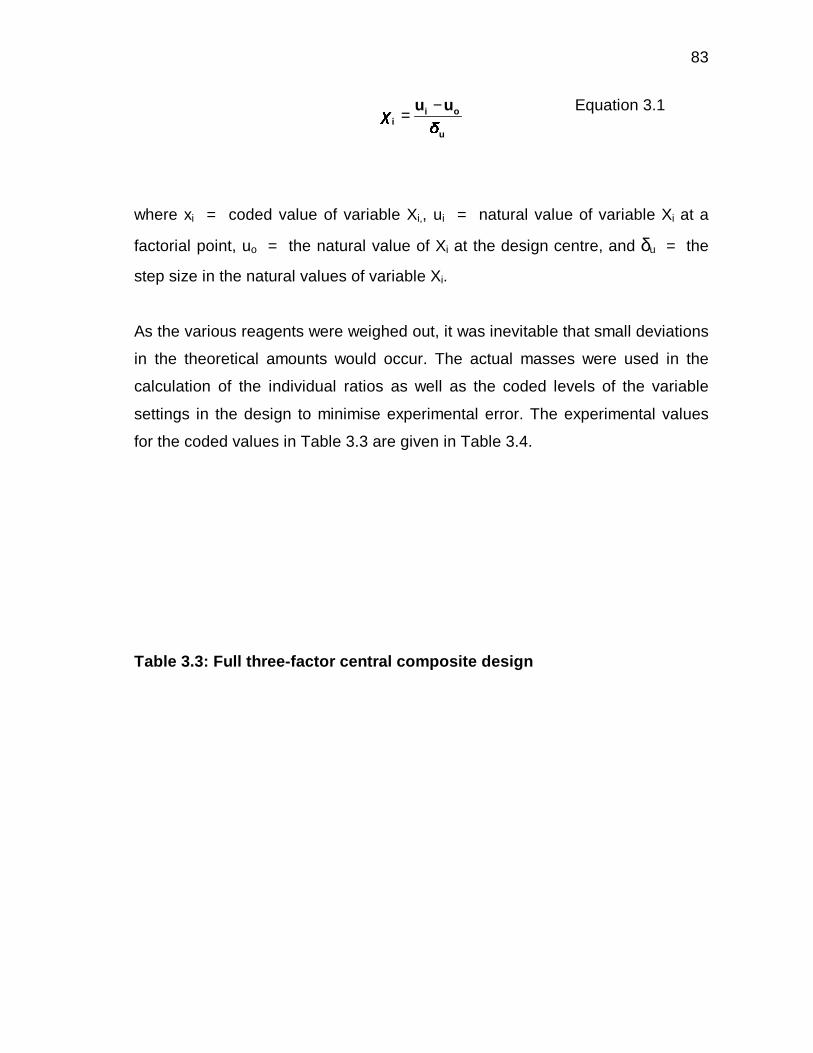
83
u
oii
uu −= Equation 3.1
where xi = coded value of variable Xi,, ui = natural value of variable Xi at a
factorial point, uo = the natural value of Xi at the design centre, and δu = the
step size in the natural values of variable Xi.
As the various reagents were weighed out, it was inevitable that small deviations
in the theoretical amounts would occur. The actual masses were used in the
calculation of the individual ratios as well as the coded levels of the variable
settings in the design to minimise experimental error. The experimental values
for the coded values in Table 3.3 are given in Table 3.4.
Table 3.3: Full three-factor central composite design
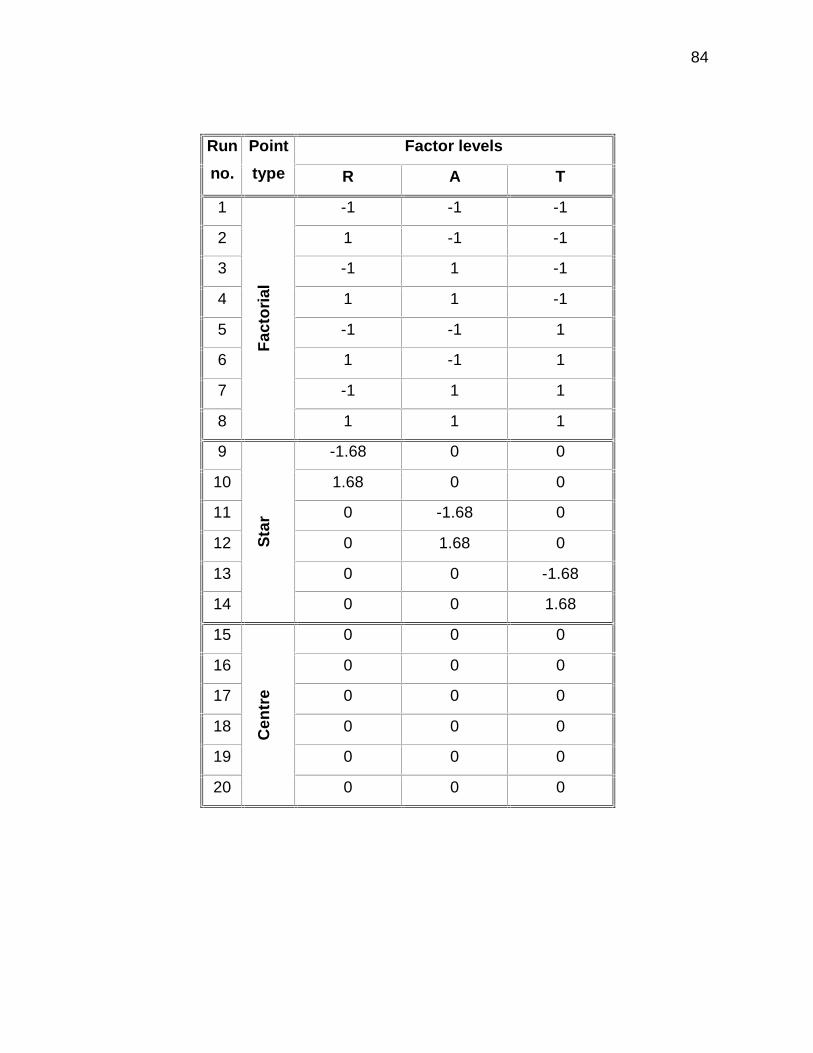
84
Factor levels Run
no.
Point
type R A T
1 -1 -1 -1
2 1 -1 -1
3 -1 1 -1
4 1 1 -1
5 -1 -1 1
6 1 -1 1
7 -1 1 1
8
Fac
tori
al
1 1 1
9 -1.68 0 0
10 1.68 0 0
11 0 -1.68 0
12 0 1.68 0
13 0 0 -1.68
14
Sta
r
0 0 1.68
15 0 0 0
16 0 0 0
17 0 0 0
18 0 0 0
19 0 0 0
20
Cen
tre
0 0 0
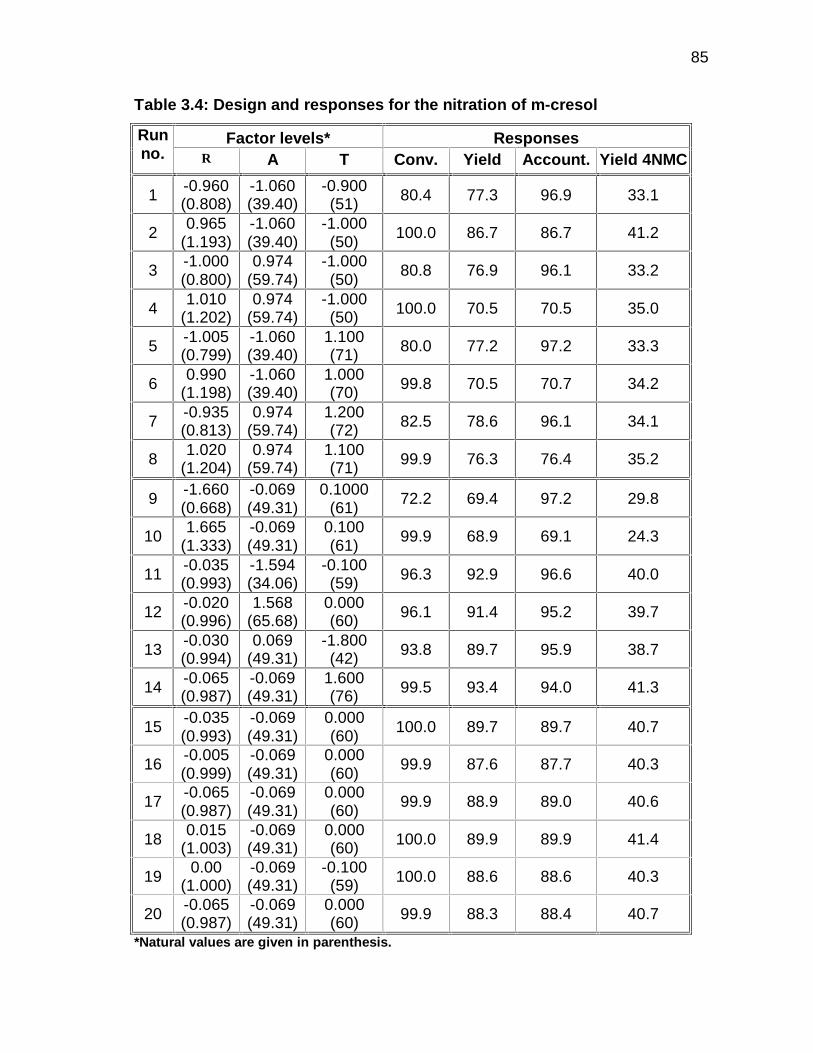
85
Table 3.4: Design and responses for the nitration of m-cresol
Factor levels* Responses Run no. R A T Conv. Yield Account. Yield 4NMC
1 -0.960 (0.808)
-1.060 (39.40)
-0.900 (51) 80.4 77.3 96.9 33.1
2 0.965
(1.193) -1.060 (39.40)
-1.000 (50)
100.0 86.7 86.7 41.2
3 -1.000 (0.800)
0.974 (59.74)
-1.000 (50)
80.8 76.9 96.1 33.2
4 1.010
(1.202) 0.974
(59.74) -1.000 (50) 100.0 70.5 70.5 35.0
5 -1.005 (0.799)
-1.060 (39.40)
1.100 (71) 80.0 77.2 97.2 33.3
6 0.990
(1.198) -1.060 (39.40)
1.000 (70) 99.8 70.5 70.7 34.2
7 -0.935 (0.813)
0.974 (59.74)
1.200 (72) 82.5 78.6 96.1 34.1
8 1.020
(1.204) 0.974
(59.74) 1.100 (71) 99.9 76.3 76.4 35.2
9 -1.660 (0.668)
-0.069 (49.31)
0.1000 (61)
72.2 69.4 97.2 29.8
10 1.665
(1.333) -0.069 (49.31)
0.100 (61)
99.9 68.9 69.1 24.3
11 -0.035 (0.993)
-1.594 (34.06)
-0.100 (59) 96.3 92.9 96.6 40.0
12 -0.020 (0.996)
1.568 (65.68)
0.000 (60) 96.1 91.4 95.2 39.7
13 -0.030 (0.994)
0.069 (49.31)
-1.800 (42) 93.8 89.7 95.9 38.7
14 -0.065 (0.987)
-0.069 (49.31)
1.600 (76) 99.5 93.4 94.0 41.3
15 -0.035 (0.993)
-0.069 (49.31)
0.000 (60)
100.0 89.7 89.7 40.7
16 -0.005 (0.999)
-0.069 (49.31)
0.000 (60)
99.9 87.6 87.7 40.3
17 -0.065 (0.987)
-0.069 (49.31)
0.000 (60)
99.9 88.9 89.0 40.6
18 0.015
(1.003) -0.069 (49.31)
0.000 (60) 100.0 89.9 89.9 41.4
19 0.00
(1.000) -0.069 (49.31)
-0.100 (59) 100.0 88.6 88.6 40.3
20 -0.065 (0.987)
-0.069 (49.31)
0.000 (60) 99.9 88.3 88.4 40.7
*Natural values are given in parenthesis.
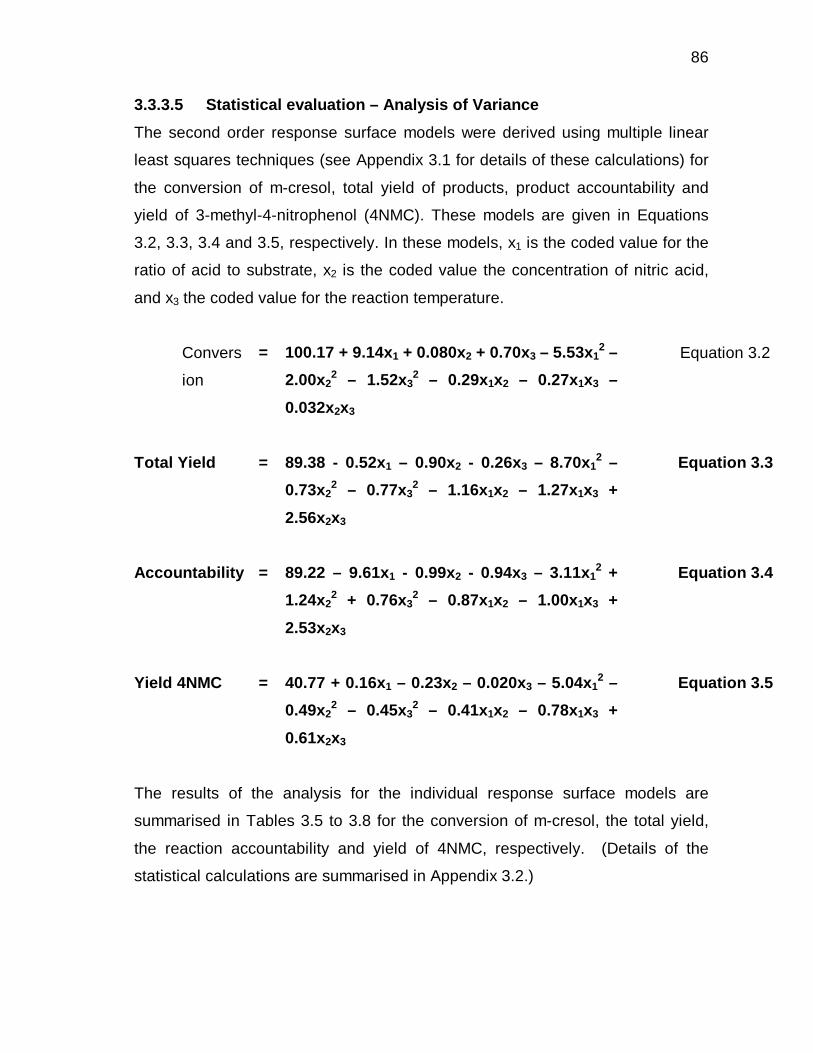
86
3.3.3.5 Statistical evaluation – Analysis of Variance
The second order response surface models were derived using multiple linear
least squares techniques (see Appendix 3.1 for details of these calculations) for
the conversion of m-cresol, total yield of products, product accountability and
yield of 3-methyl-4-nitrophenol (4NMC). These models are given in Equations
3.2, 3.3, 3.4 and 3.5, respectively. In these models, x1 is the coded value for the
ratio of acid to substrate, x2 is the coded value the concentration of nitric acid,
and x3 the coded value for the reaction temperature.
Convers
ion
= 100.17 + 9.14x1 + 0.080x2 + 0.70x3 – 5.53x12 –
2.00x22 – 1.52x3
2 – 0.29x1x2 – 0.27x1x3 –
0.032x2x3
Equation 3.2
Total Yield = 89.38 - 0.52x1 – 0.90x2 - 0.26x3 – 8.70x12 –
0.73x22 – 0.77x3
2 – 1.16x1x2 – 1.27x1x3 +
2.56x2x3
Equation 3.3
Accountability = 89.22 – 9.61x1 - 0.99x2 - 0.94x3 – 3.11x12 +
1.24x22 + 0.76x3
2 – 0.87x1x2 – 1.00x1x3 +
2.53x2x3
Equation 3.4
Yield 4NMC = 40.77 + 0.16x1 – 0.23x2 – 0.020x3 – 5.04x12 –
0.49x22 – 0.45x3
2 – 0.41x1x2 – 0.78x1x3 +
0.61x2x3
Equation 3.5
The results of the analysis for the individual response surface models are
summarised in Tables 3.5 to 3.8 for the conversion of m-cresol, the total yield,
the reaction accountability and yield of 4NMC, respectively. (Details of the
statistical calculations are summarised in Appendix 3.2.)
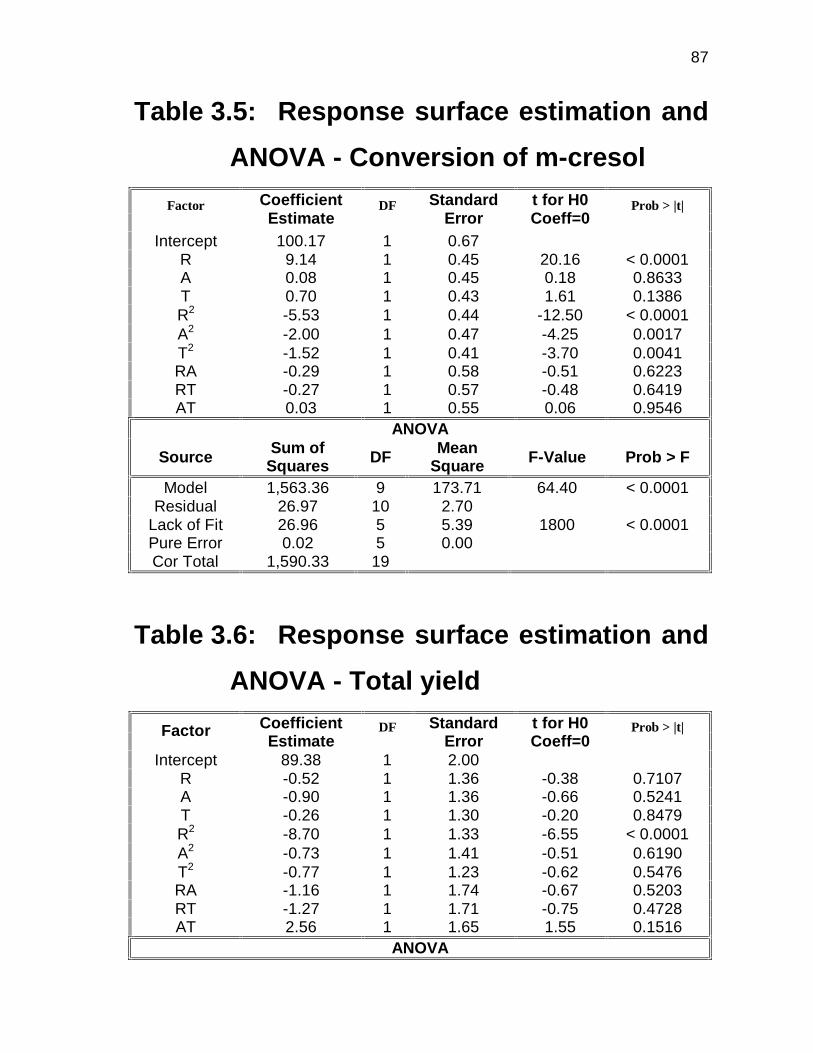
87
Table 3.5: Response surface estimation and
ANOVA - Conversion of m-cresol
Factor Coefficient Estimate
DF Standard Error
t for H0 Coeff=0
Prob > |t|
Intercept 100.17 1 0.67 R 9.14 1 0.45 20.16 < 0.0001 A 0.08 1 0.45 0.18 0.8633 T 0.70 1 0.43 1.61 0.1386 R2 -5.53 1 0.44 -12.50 < 0.0001 A2 -2.00 1 0.47 -4.25 0.0017 T2 -1.52 1 0.41 -3.70 0.0041 RA -0.29 1 0.58 -0.51 0.6223 RT -0.27 1 0.57 -0.48 0.6419 AT 0.03 1 0.55 0.06 0.9546
ANOVA
Source Sum of Squares DF Mean
Square F-Value Prob > F
Model 1,563.36 9 173.71 64.40 < 0.0001 Residual 26.97 10 2.70
Lack of Fit 26.96 5 5.39 1800 < 0.0001 Pure Error 0.02 5 0.00 Cor Total 1,590.33 19
Table 3.6: Response surface estimation and
ANOVA - Total yield
Factor Coefficient Estimate
DF Standard Error
t for H0 Coeff=0
Prob > |t|
Intercept 89.38 1 2.00 R -0.52 1 1.36 -0.38 0.7107 A -0.90 1 1.36 -0.66 0.5241 T -0.26 1 1.30 -0.20 0.8479 R2 -8.70 1 1.33 -6.55 < 0.0001 A2 -0.73 1 1.41 -0.51 0.6190 T2 -0.77 1 1.23 -0.62 0.5476 RA -1.16 1 1.74 -0.67 0.5203 RT -1.27 1 1.71 -0.75 0.4728 AT 2.56 1 1.65 1.55 0.1516
ANOVA

88
Source Sum of Squares DF Mean
Square F-Value Prob > F
Model 1,169.70 9 129.97 5.35 0.0075 Residual 243.05 10 24.31
Lack of Fit 239.30 5 47.86 63.76 0.0002 Pure Error 3.75 5 0.75 Cor Total 1,412.75 19
Table 3.7: Response surface estimation and
ANOVA - Accountability
Factor Coefficient Estimate
DF Standard Error
t for H0 Coeff=0
Prob > |t|
Intercept 89.22 1 1.63 R -9.61 1 1.11 -8.67 < 0.0001 A -0.99 1 1.11 -0.90 0.3910 T -0.94 1 1.06 -0.89 0.3950 R2 -3.11 1 1.08 -2.88 0.0164 A2 1.24 1 1.15 1.07 0.3086 T2 0.76 1 1.01 0.75 0.4700 RA -0.87 1 1.42 -0.61 0.5541 RT -1.00 1 1.39 -0.72 0.4889 AT 2.53 1 1.34 1.88 0.0892
ANOVA
Source Sum of Squares DF Mean
Square F-Value Prob > F
Model 1,542.58 9 171.40 10.62 0.0005 Residual 161.37 10 16.14
Lack of Fit 157.94 5 31.59 46.07 0.0003 Pure Error 3.43 5 0.69 Cor Total 1,703.95 19
Table 3.8: Response surface estimation and
ANOVA - Yield 4NMC
Factor Coefficient Estimate
DF Standard Error
t for H0 Coeff=0
Prob > |t|
Intercept 40.77 1 0.82 R 0.16 1 0.56 0.29 0.7745 A -0.23 1 0.56 -0.42 0.6856 T -0.02 1 0.53 -0.04 0.9703 R2 -5.04 1 0.54 -9.26 < 0.0001 A2 -0.49 1 0.58 -0.85 0.4131

89
T2 -0.45 1 0.51 -0.89 0.3943 RA -0.41 1 0.71 -0.57 0.5810 RT -0.78 1 0.70 -1.12 0.2890 AT 0.61 1 0.68 0.90 0.3909
ANOVA
Source Sum of Squares DF Mean
Square F-Value Prob > F
Model 364.66 9 40.52 9.94 0.0006 Residual 40.78 10 4.08
Lack of Fit 39.96 5 7.99 49.13 0.0003 Pure Error 8.13E-01 5 0.16 Cor Total 405.43 19
Several aspects regarding the results summarised in Tables 3.4 to 3.8 deserve
further comment. �Substrate (m-cresol) conversion varies between 72 mole % and 100 mole %
and appears to be a direct function of the amount of nitric acid used in a
particular reaction. There is an excellent correlation between the amount of
nitric acid charged and the amount of m-cresol converted indicating that the
reaction between nitric acid and m-cresol occurs in a 1 : 1 ratio. �The total yield of reaction products varies between 69 mole % and 97 mole %
and is consistently lower than the conversion of m-cresol achieved. This is a
clear indication of the formation of undesirable side products. �As a result of the formation of undesirable side products suggested above,
the accountability of the reaction in terms of the products quantified is never
100 %. �The yield of 4NMC varies between 24 % and 41 %, indicating that the
manipulation of regio-selectivity during the nitration reaction is possible to
some extent. �The statistical evaluation of the effects of the individual reaction variables on
the experimental responses shows that the acid : substrate ratio has by far
the largest influence, being significant for the conversion, total yield,
accountability and yield of 4NMC. �Other variables that show significant influences on one or more responses
include reaction temperature (conversion), acid concentration (conversion),
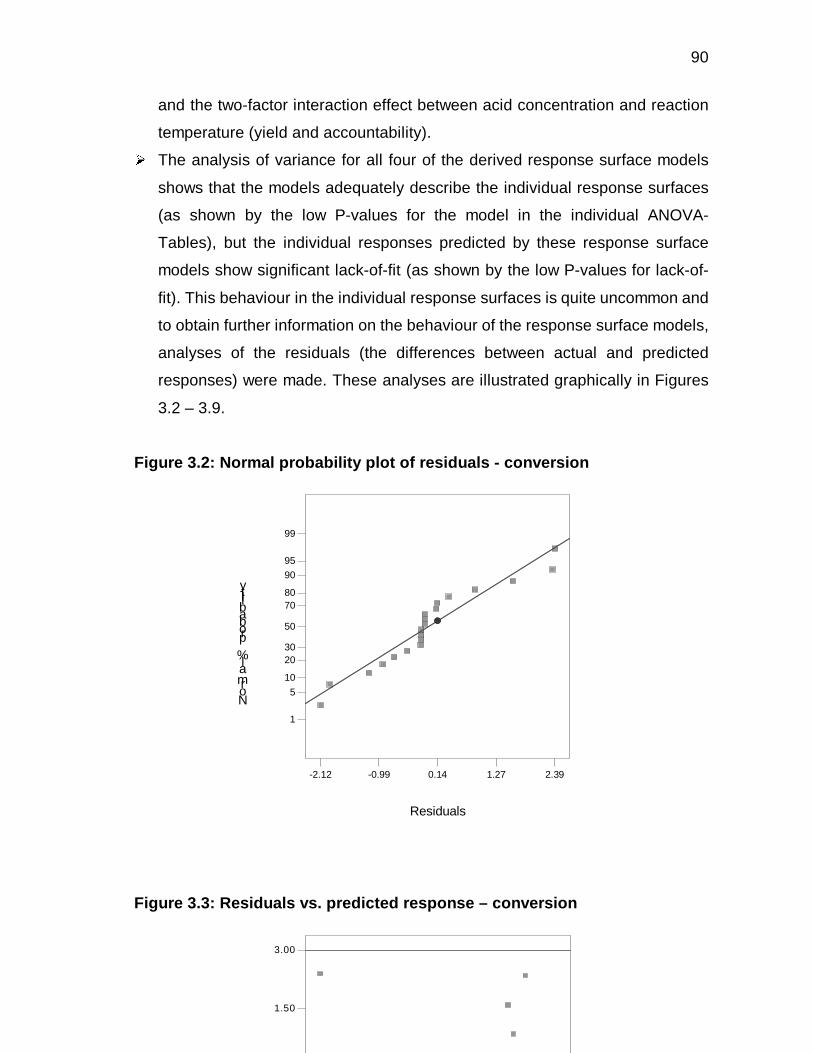
90
and the two-factor interaction effect between acid concentration and reaction
temperature (yield and accountability). �The analysis of variance for all four of the derived response surface models
shows that the models adequately describe the individual response surfaces
(as shown by the low P-values for the model in the individual ANOVA-
Tables), but the individual responses predicted by these response surface
models show significant lack-of-fit (as shown by the low P-values for lack-of-
fit). This behaviour in the individual response surfaces is quite uncommon and
to obtain further information on the behaviour of the response surface models,
analyses of the residuals (the differences between actual and predicted
responses) were made. These analyses are illustrated graphically in Figures
3.2 – 3.9.
Figure 3.2: Normal probability plot of residuals - conversion
Figure 3.3: Residuals vs. predicted response – conversion
Normal % probability
Residuals
-2.12 -0.99 0.14 1.27 2.39
1
5
10
2030
50
7080
90
95
99
1.50
3.00

91
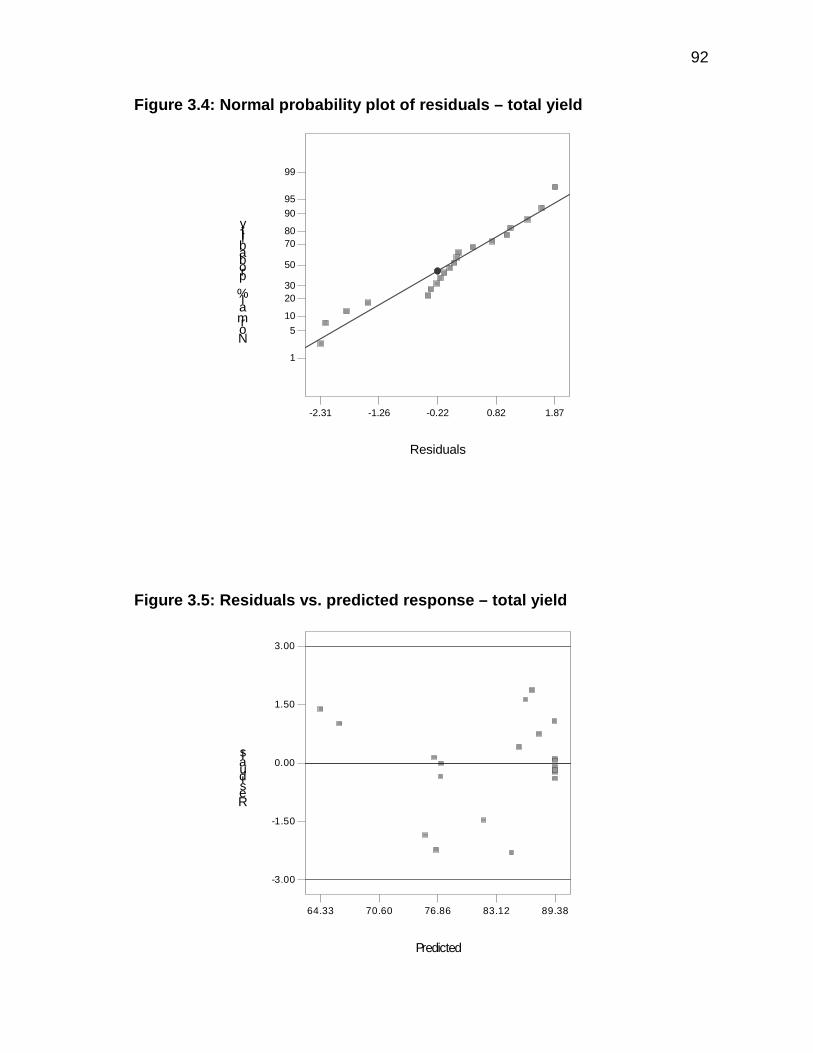
92
Figure 3.4: Normal probability plot of residuals – total yield
Figure 3.5: Residuals vs. predicted response – total yield
Residuals
Predicted
-3.00
-1.50
0.00
1.50
3.00
64.33 70.60 76.86 83.12 89.38
Normal % probability
Residuals
-2.31 -1.26 -0.22 0.82 1.87
1
5
10
2030
50
7080
90
95
99

93
Figure 3.6: Normal probability plot of
residuals - accountability
Figure 3.7: Residuals vs. predicted response - accountability
Normal % probability
Residuals
-2.43 -1.37 -0.30 0.77 1.83
1
5
10
2030
50
7080
90
95
99
Residuals
Predicted
-3.00
-1.50
0.00
1.50
3.00
64.48 73.49 82.50 91.51 100.52

94
Figure 3.8: Normal probability plot of residuals – yield of 4NMC
Figure 3.9: Residuals vs. predicted response – yield of 4NMC
Normal % probability
Residuals
-2.47 -1.22 0.03 1.28 2.52
1
5
10
2030
50
7080
90
95
99
2222
Residuals
Predicted
-3.00
-1.50
0.00
1.50
3.00
26.70 30.22 33.73 37.25 40.77
95
Two types of analyses59,60 were carried out, namely normal probability plots of
the residuals, and plots of the residuals versus the individual predicted
responses. In the first case, because the residuals represent the experimental
error in each experimental point and because experimental error should always
be distributed normally, straight lines are expected with the individual residuals
falling on or nearly on these straight lines. From the individual plots (Figures 3.2,
3.4, 3.6 and 3.8) it can be seen that there appears to be some or other cyclic
deviation about the straight line, but the overall trend is linear. In the case of the
plots of the residuals versus predicted response, a random distribution of points
about the zero-line is expected with the outer bands remaining parallel to the
zero line. There does not appear to be any abnormality in the plots (Figures 3.3,
3.5, 3.7 and 3.9) obtained. Both these analyses confirms the results of the
ANOVA i.e. the models describe the response surfaces adequately, but with poor
prediction power.
The reason for the observed results may possibly be traced to the manner in
which the nitration reactions were performed. It should firstly be noted that the
experimental variation at the six centre points, as indicated by the relative value
of the mean square for “Pure Error” in the respective ANOVA-Tables, is
remarkably small. This clearly indicates that both the synthetic procedure and the
analytical method give reliable results. Secondly, the variation in the
experimental error in the factorial and star points of the design is, however,
comparatively large as is indicated by the mean square values for “Lack-of-fit” in
the respective ANOVA-Tables. This suggests that either the synthetic method, or
the analytical method, or both, is not reliable. Since the analytical method
remained exactly constant and because the centre points were performed
randomly between the design points, the possibility of the analytical method
being unreliable may be ignored. Hence remaining is the synthetic method, which
is not constant between the design points and the centre points. The reason for
this is the inclusion of “acid : substrate ratio” and “acid concentration” as
variables in the design without correcting for the total volume of the final reaction
mixture. In the centre points, there would be no variation in the total reaction
volume, but in the design points, the total reaction volume would vary
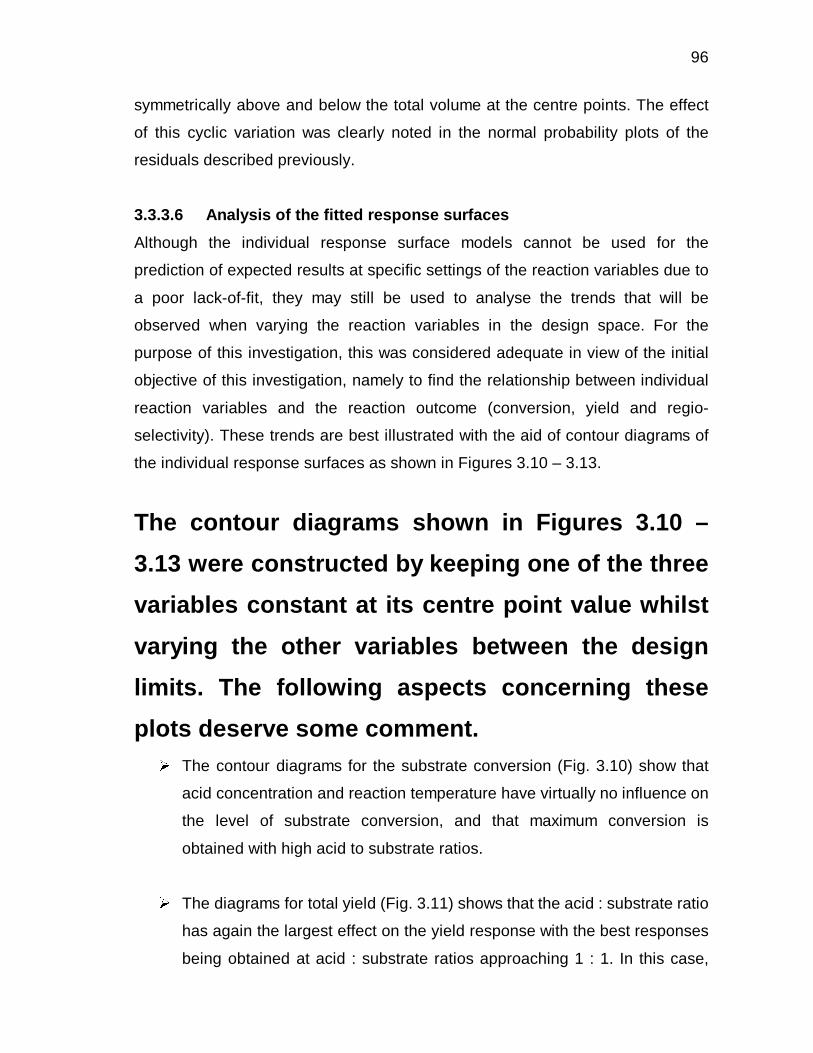
96
symmetrically above and below the total volume at the centre points. The effect
of this cyclic variation was clearly noted in the normal probability plots of the
residuals described previously.
3.3.3.6 Analysis of the fitted response surfaces
Although the individual response surface models cannot be used for the
prediction of expected results at specific settings of the reaction variables due to
a poor lack-of-fit, they may still be used to analyse the trends that will be
observed when varying the reaction variables in the design space. For the
purpose of this investigation, this was considered adequate in view of the initial
objective of this investigation, namely to find the relationship between individual
reaction variables and the reaction outcome (conversion, yield and regio-
selectivity). These trends are best illustrated with the aid of contour diagrams of
the individual response surfaces as shown in Figures 3.10 – 3.13.
The contour diagrams shown in Figures 3.10 –
3.13 were constructed by keeping one of the three
variables constant at its centre point value whilst
varying the other variables between the design
limits. The following aspects concerning these
plots deserve some comment. �
The contour diagrams for the substrate conversion (Fig. 3.10) show that
acid concentration and reaction temperature have virtually no influence on
the level of substrate conversion, and that maximum conversion is
obtained with high acid to substrate ratios.
�The diagrams for total yield (Fig. 3.11) shows that the acid : substrate ratio
has again the largest effect on the yield response with the best responses
being obtained at acid : substrate ratios approaching 1 : 1. In this case,

97
however, there appears to be a small, yet significant, increase in the total
yield with decreasing acid concentration.
�
As in the case of total yield, the acid : substrate ratio again exerts the
largest influence on the accountability of the reaction, but now increased
accountability is observed with decreasing acid : substrate ratios (Fig.
3.12).
Figure 3.10: Contour diagrams for conversion of m-cresol
DESIGN-EXPERT Plot
Actual Factors:X = RatioY = Temp
Actual Constants:Acid = 49.68
Conversion (%)
Ratio
Tem
p
0.80 0.90 1.00 1.10 1.20
50.00
55.00
60.00
65.00
70.00
86.6135
90.0823
93.5511
97.0199
100.489
Prediction98.1236
Prediction103.934
Prediction86.1805
Prediction99.9973
DESIGN-EXPERT Plot
Actual Factors:X = RatioY = Acid
Actual Constants:Temp = 60.20
Convers ion (%)
R at io
Acid
0.80 0.90 1.00 1.10 1.20
40 .00
45 .00
50 .00
55 .00
60 .00
86.6135
90.0823
93.5511
97.0199 100.489
Prediction 98.2457
Prediction 103.883
Prediction 86.1144
Prediction 98.8998
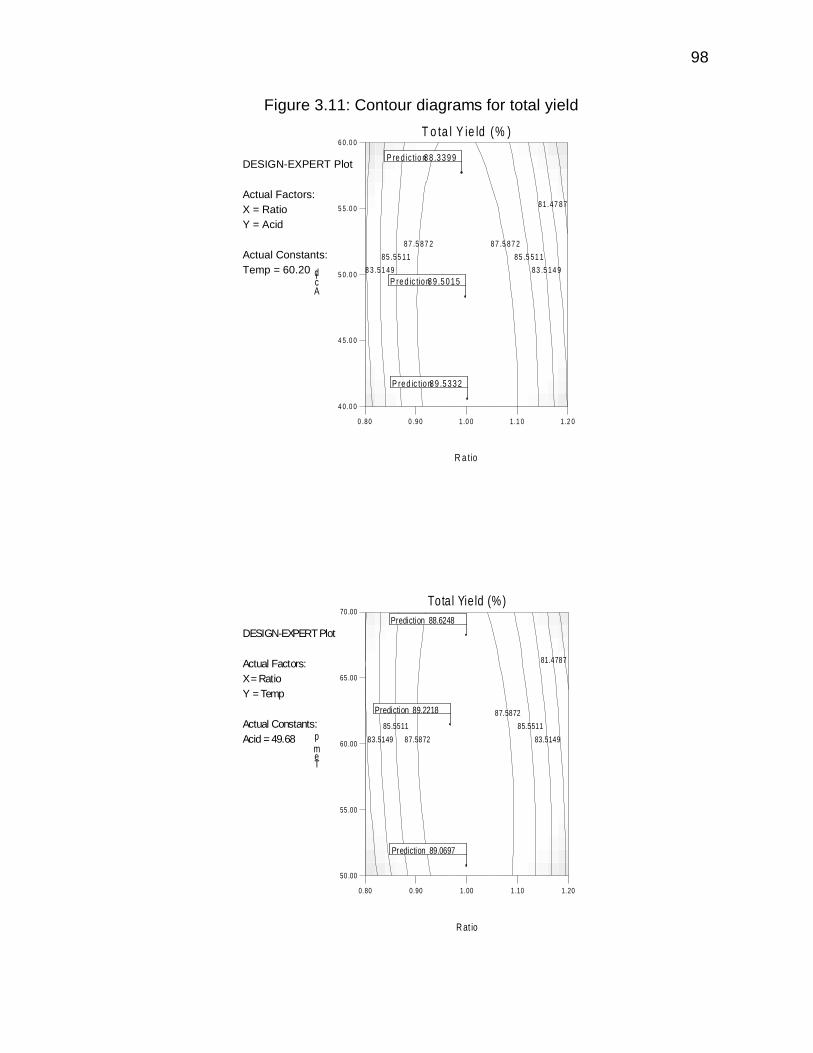
98
Figure 3.11: Contour diagrams for total yield
DESIGN-EXPERT Plot
Actual Factors:X = RatioY = Temp
Actual Constants:Acid = 49.68
Total Yie ld (%)
R at io
Temp
0.80 0.90 1.00 1.10 1.20
50 .00
55 .00
60 .00
65 .00
70 .00
81.4787
83.5149 83.5149
85.5511 85.5511
87.5872
87.5872
Prediction 89.0697
Prediction 88.6248
Prediction 89.2218
DESIGN-EXPERT Plot
Actual Factors:X = RatioY = Acid
Actual Constants:Temp = 60.20
T o ta l Y ie ld (% )
R a tio
Acid
0 .80 0 .90 1 .0 0 1 .1 0 1 .2 0
4 0 .0 0
4 5 .0 0
5 0 .0 0
5 5 .0 0
6 0 .0 0
81 .47 87
8 3 .51 49 83 .5 14 9
85 .55 11 85 .5 51 1
87 .5 87 2 87 .5 87 2
P re d ic tio n8 9 .5 3 3 2
P re d ic tio n8 8 .3 3 9 9
P re d ic tio n8 9 .5 0 1 5
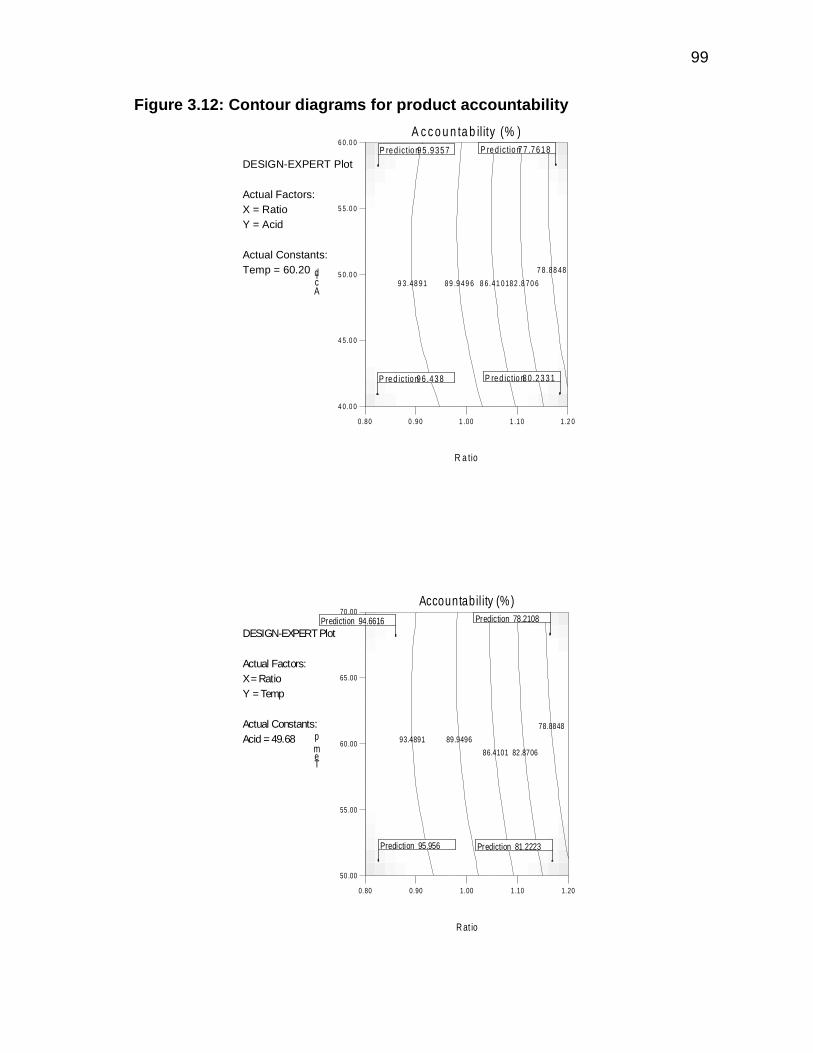
99
Figure 3.12: Contour diagrams for product accountability
DESIGN-EXPERT Plot
Actual Factors:X = RatioY = Temp
Actual Constants:Acid = 49.68
Accountabil ity (%)
R at io
Temp
0.80 0.90 1.00 1.10 1.20
50 .00
55 .00
60 .00
65 .00
70 .00
82.870686.4101
89.949693.4891
78.8848
Prediction 78.2108
Prediction 95.956 Prediction 81.2223
Prediction 94.6616
DESIGN-EXPERT Plot
Actual Factors:X = RatioY = Acid
Actual Constants:Temp = 60.20
A c c o u n ta b il ity (% )
R a tio
Acid
0 .80 0 .90 1 .00 1 .10 1 .2 0
4 0 .0 0
4 5 .0 0
5 0 .0 0
5 5 .0 0
6 0 .0 0
82 .8 70 68 6 .41 0189 .9 49 69 3 .48 91
7 8 .88 48
P re d ic tio n9 5 .9 3 5 7
P re d ic tio n9 6 .4 3 8 P re d ic tio n8 0 .2 3 3 1
P re d ic tio n7 7 .7 6 1 8
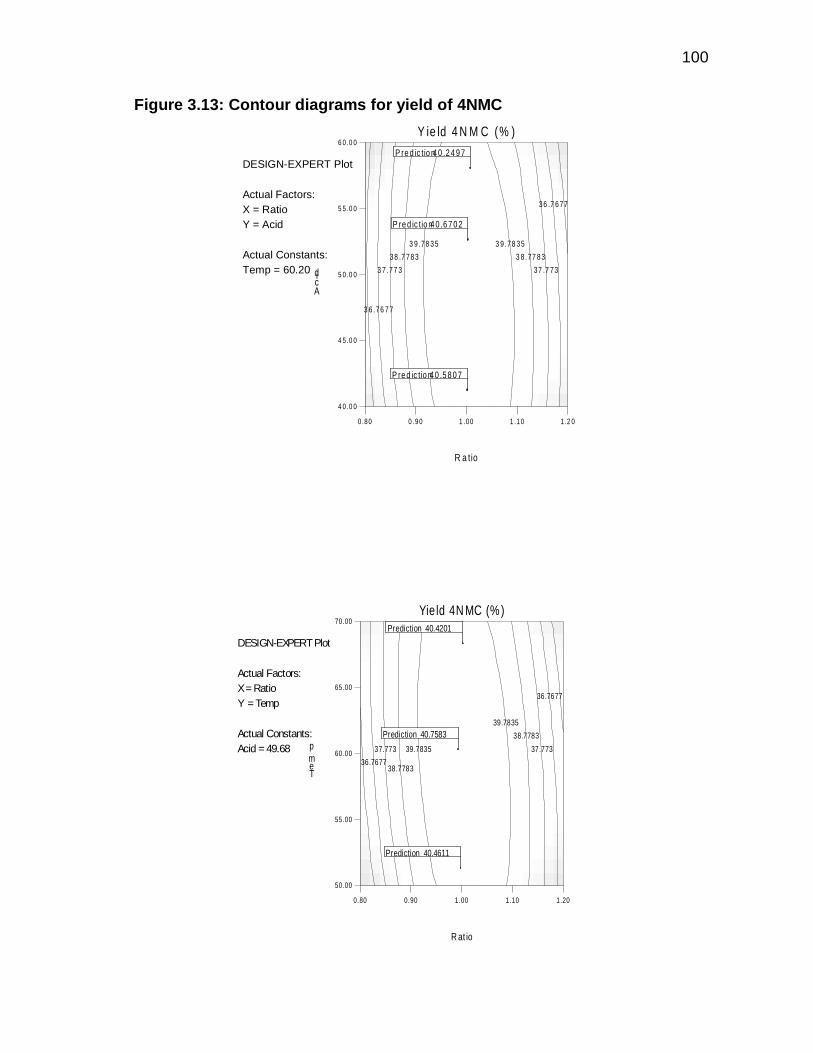
100
Figure 3.13: Contour diagrams for yield of 4NMC
DESIGN-EXPERT Plot
Actual Factors:X = RatioY = Temp
Actual Constants:Acid = 49.68
Yield 4N MC (%)
R at io
Temp
0.80 0.90 1.00 1.10 1.20
50 .00
55 .00
60 .00
65 .00
70 .00
36.7677
36.7677
37.773 37.773
38.7783
38.7783
39.7835
39.7835
Prediction 40.4611
Prediction 40.4201
Prediction 40.7583
DESIGN-EXPERT Plot
Actual Factors:X = RatioY = Acid
Actual Constants:Temp = 60.20
Y ie ld 4 N M C (% )
R a tio
Acid
0 .80 0 .90 1 .00 1 .10 1 .2 0
4 0 .0 0
4 5 .0 0
5 0 .0 0
5 5 .0 0
6 0 .0 0
3 6 .76 77
36 .7 677
3 7 .77 3 37 .7 73
38 .7 783 3 8 .77 83
3 9 .78 35 3 9 .78 35
P re d ic tio n4 0 .2 4 9 7
P re d ic tio n4 0 .5 8 0 7
P re d ic tio n4 0 .6 7 0 2
101
½ At acid : substrate ratios approaching 1 : 1,
both decreasing acid concentration and
decreasing reaction temperature improves the
accountability in terms of the four reaction
products quantified. �
The diagrams for 4NMC yield (Fig. 3.13) again show that improved
selectivities are obtained with acid : substrate ratios approaching 1 : 1, with
decreasing acid concentration having only a small positive effect on the
selectivity.
3.3.3.7 Confirmatory experiments
From the discussions in the preceding section, the following strategies can be
proposed to increase the responses for total yield, accountability and yield of
4NMC: �Keep the acid : substrate ratio as close to 1 : 1 as possible. �Decrease the acid concentration as far as is practically possible. �Decrease the reaction temperature.
102
Several experiments were carried out in order to test the validity of the above
proposals. These reactions were carried out using the same method as
described for the initial design. The results from these experiments are
summarised in Table 3.9.
Table 3.9: Validity of design Temp.a
(oC)
Acidb
(%)
A : S Conv.
(%)
Yield
(%)
Account.
(%)
Isomer ratioc
0 39.4 1 : 1.007 72.8 69.6 96.8 42.0 : 19.3 : 26.0 : 11.4
5 39.4 1 : 1.001 76.7 73.9 97.2 42.5 : 20.5 : 25.7 : 11.7
10 39.4 1 : 0.999 75.6 72.2 96.6 40.9 ; 20.8 : 26.0 : 10.8
Results after 30 min reaction time a – Bath temperature b – Acid concentration - % m/m c – Isomer distribution: 4-nitro : 2-nitro : 6-nitro : 2-methyl-1,4-benzoquinone The results shown in Table 3.9 indicate that the
proposals made above do indeed hold. The
combination of a lower acid concentration and
lower temperature results in a significantly
improved accountability for the reaction, albeit at
lower conversions. The yield of 4NMC is also
slightly improved, but the improvement is too
small to warrant further manipulation. In fact,
decreasing the acid concentration to below ca.
35% results in very slow reactions (less than 10%
substrate conversion after three hours). A limit of
the nitric acid concentration seems to exist, below
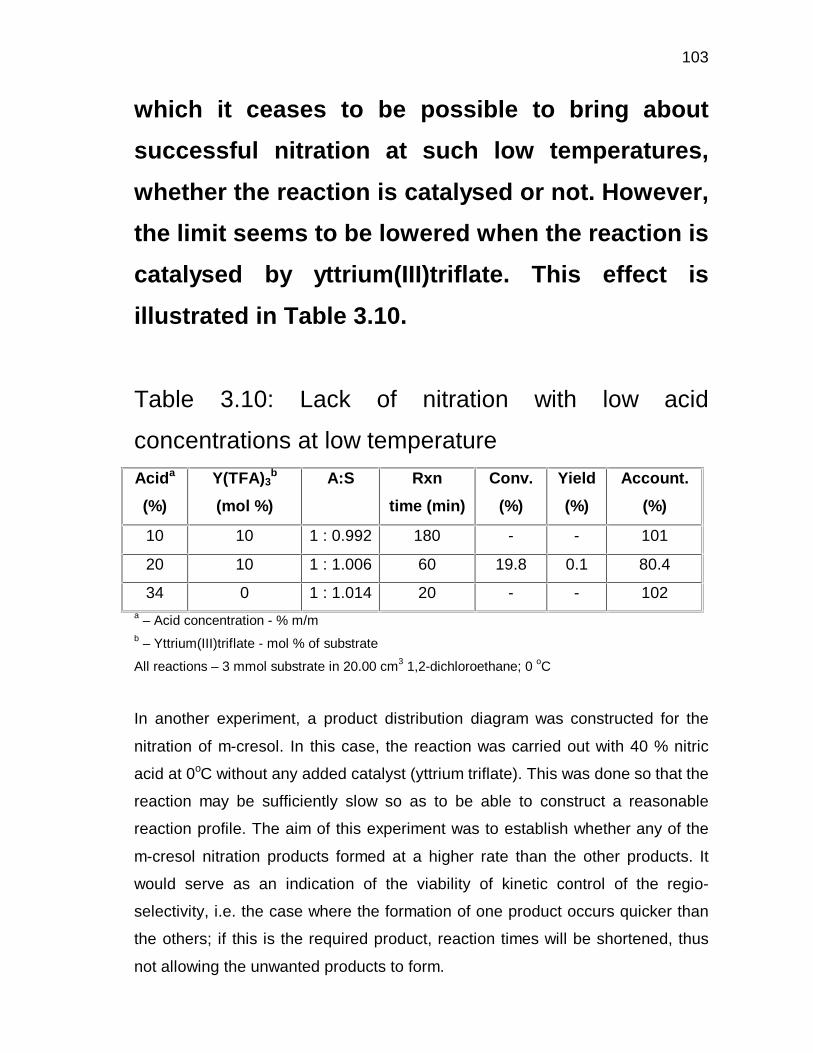
103
which it ceases to be possible to bring about
successful nitration at such low temperatures,
whether the reaction is catalysed or not. However,
the limit seems to be lowered when the reaction is
catalysed by yttrium(III)triflate. This effect is
illustrated in Table 3.10.
Table 3.10: Lack of nitration with low acid
concentrations at low temperature
Acida
(%)
Y(TFA)3b
(mol %)
A:S Rxn
time (min)
Conv.
(%)
Yield
(%)
Account.
(%)
10 10 1 : 0.992 180 - - 101
20 10 1 : 1.006 60 19.8 0.1 80.4
34 0 1 : 1.014 20 - - 102 a – Acid concentration - % m/m b – Yttrium(III)triflate - mol % of substrate
All reactions – 3 mmol substrate in 20.00 cm3 1,2-dichloroethane; 0 oC
In another experiment, a product distribution diagram was constructed for the
nitration of m-cresol. In this case, the reaction was carried out with 40 % nitric
acid at 0oC without any added catalyst (yttrium triflate). This was done so that the
reaction may be sufficiently slow so as to be able to construct a reasonable
reaction profile. The aim of this experiment was to establish whether any of the
m-cresol nitration products formed at a higher rate than the other products. It
would serve as an indication of the viability of kinetic control of the regio-
selectivity, i.e. the case where the formation of one product occurs quicker than
the others; if this is the required product, reaction times will be shortened, thus
not allowing the unwanted products to form.
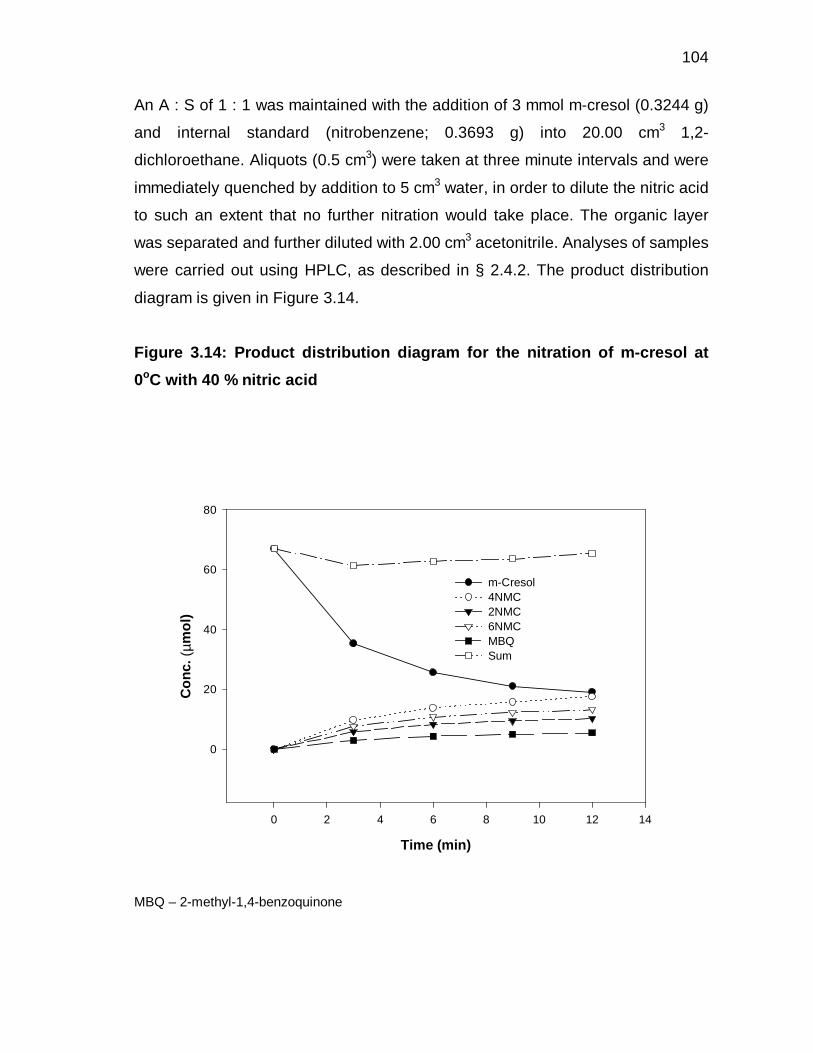
104
An A : S of 1 : 1 was maintained with the addition of 3 mmol m-cresol (0.3244 g)
and internal standard (nitrobenzene; 0.3693 g) into 20.00 cm3 1,2-
dichloroethane. Aliquots (0.5 cm3) were taken at three minute intervals and were
immediately quenched by addition to 5 cm3 water, in order to dilute the nitric acid
to such an extent that no further nitration would take place. The organic layer
was separated and further diluted with 2.00 cm3 acetonitrile. Analyses of samples
were carried out using HPLC, as described in § 2.4.2. The product distribution
diagram is given in Figure 3.14.
Figure 3.14: Product distribution diagram for the nitration of m-cresol at
0oC with 40 % nitric acid
MBQ – 2-methyl-1,4-benzoquinone
Time (min)
0 2 4 6 8 10 12 14
Co
nc.
(µm
ol)
0
20
40
60
80
m-Cresol 4NMC 2NMC 6NMC MBQSum
105
The product distribution curve clearly shows that all the products form at
approximately the same rate. It also seems that the relative ratios of the
different products with respect to each other are maintained throughout
the reaction. The reaction conditions under which this reaction was
carried out (low temperature, no catalyst and low acid concentration)
was too mild to force the reaction to completion as only approximately
70 % of the substrate was converted. The accountability of the reaction
(indicated on the graph as “sum”) initially dipped but soon increased
until it practically remained constant for the remainder of the reaction.
This dip could be caused by the initial formation of an intermediate that
may not be quantified, but which then reacts further to form a
nitrocresol product, and thus ultimately added into the material balance.
3.3.4 Nitrations using yttrium(III)triflate at low temperatures
In view of the results obtained above, it is clear
that more effective nitration results can be
achieved at low acid concentrations and low
nitration temperatures. However, there appears to
be a limit in how far the reaction temperature and
the acid concentration can be reduced whilst still
maintaining practical reaction rates. It was
therefore decided to investigate the use of
yttrium(III)triflate as catalyst under these
conditions, not only to establish whether the use
of the catalyst will enable the use of reaction
conditions not practically feasible in the absence
106
thereof, but also to establish whether the catalyst
may display any regio-selective preference. In the
studies described previously (§ 3.3.2), it was
concluded that the effect of the catalyst was
masked by the “extreme” reaction conditions
(high temperatures and acid concentration) so
that the effect of the catalyst could not be seen. In
order to establish whether there is indeed a
catalytic effect, several reactions were carried out
at reduced acid concentrations and low nitration
temperatures using yttrium(III)triflate as catalyst.
The results of these studies are summarised in
Table 3.11.

107
Table 3.11: Nitration with yttrium(III)triflate at low acid
concentrations and low temperatures
Acida
(%)
A:S Conv.
(%)
Yieldb
(%)
Account.
(%)
Isomer ratioc
34d 1 : 1.014 95.6 94.2 98.6 40.8 : 19.1 : 27.1 : 11.1
34e 1 : 0.992 99.9 84.8 85.0 41.2 : 17.6 : 28.3 : 12.9
40d 1 : 1.004 95.1 91.0 95.9 42.3 : 20.3 : 26.1 : 11.2 a – Acid concentration: % m/m b – Total yield = sum of product yields c – Order of isomers: 4-nitro; 2-nitro; 6-nitro; 2-methyl-1,4-benzoquinone
All reactions carried out at 0oC; 30 min total reaction time; catalyst load of 10 mol%
relative to the substrate d – Substrate load of 1.6 % (m/v) e – Substrate load of 4.8 % (m/v)
It is clear from the above results that the Y(TFA)3
catalyst does in fact facilitate the reaction, since
there is almost full conversion after only 30
minutes reaction time. When nitration was carried
out in the absence of added triflate under the
same conditions (0oC and 40 % nitric acid; Table
3.9), only approximately 70 mole % of the
substrate was converted. Since conversion is
practically complete in this case, the total yield is
also much higher. Accountability is comparable
with those obtained previously (Table 3.9). In the

108
second reaction, a higher substrate loading was
used, which had a clear detrimental effect on the
yield and accountability. It seems that by
increasing the substrate loading, one is also
increasing the relative number of side reactions.
Although there is very little difference in the
product selectivities, it does seem that the
reaction with the highest acid concentration also
produced the highest selectivity to 4NMC, but at a
lower accountability. It is thus clear that the
addition of yttrium(III)triflate does promote the
nitration reaction, but that this catalytic effect is
masked under harsher reaction conditions.
Addition of the catalyst hence also broadens the
range of conditions under which the nitration
reaction may be successfully carried out,
although there seems to be no need to add it
when the reaction is carried out with relatively
concentrated nitric acid (higher than 40 %) and at
temperatures above zero.
3.3.5 Nitration using clays
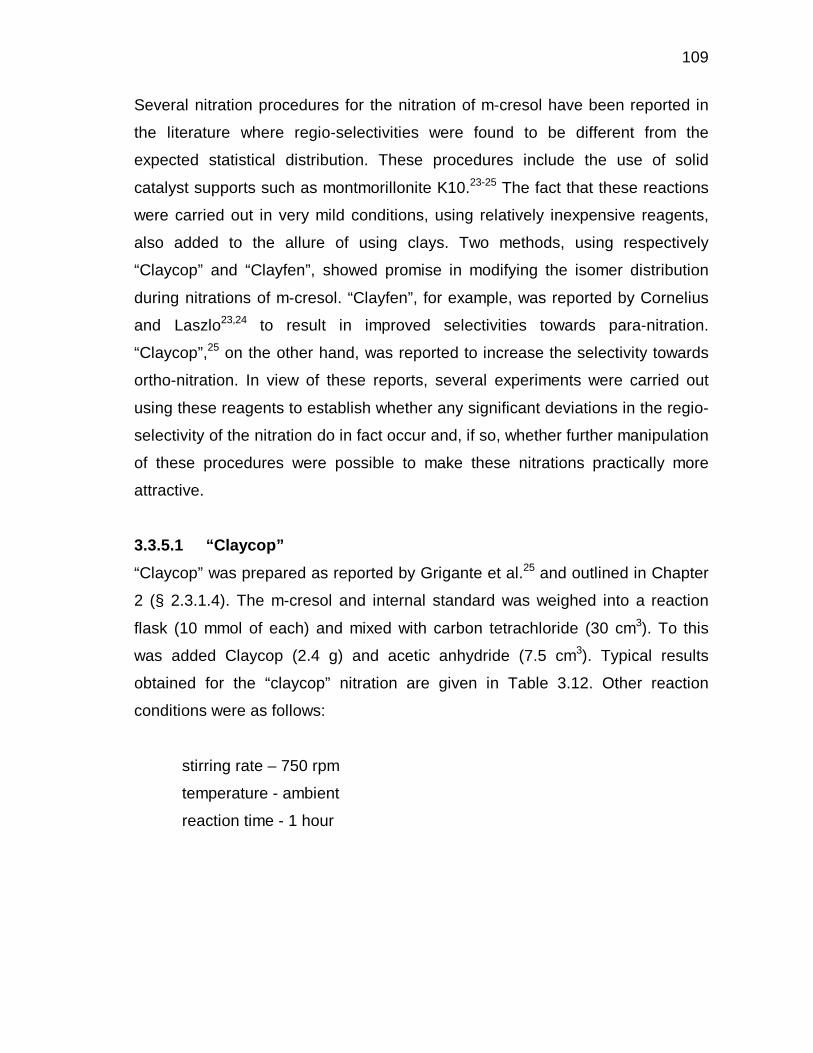
109
Several nitration procedures for the nitration of m-cresol have been reported in
the literature where regio-selectivities were found to be different from the
expected statistical distribution. These procedures include the use of solid
catalyst supports such as montmorillonite K10.23-25 The fact that these reactions
were carried out in very mild conditions, using relatively inexpensive reagents,
also added to the allure of using clays. Two methods, using respectively
“Claycop” and “Clayfen”, showed promise in modifying the isomer distribution
during nitrations of m-cresol. “Clayfen”, for example, was reported by Cornelius
and Laszlo23,24 to result in improved selectivities towards para-nitration.
“Claycop”,25 on the other hand, was reported to increase the selectivity towards
ortho-nitration. In view of these reports, several experiments were carried out
using these reagents to establish whether any significant deviations in the regio-
selectivity of the nitration do in fact occur and, if so, whether further manipulation
of these procedures were possible to make these nitrations practically more
attractive.
3.3.5.1 “Claycop”
“Claycop” was prepared as reported by Grigante et al.25 and outlined in Chapter
2 (§ 2.3.1.4). The m-cresol and internal standard was weighed into a reaction
flask (10 mmol of each) and mixed with carbon tetrachloride (30 cm3). To this
was added Claycop (2.4 g) and acetic anhydride (7.5 cm3). Typical results
obtained for the “claycop” nitration are given in Table 3.12. Other reaction
conditions were as follows:
stirring rate – 750 rpm
temperature - ambient
reaction time - 1 hour
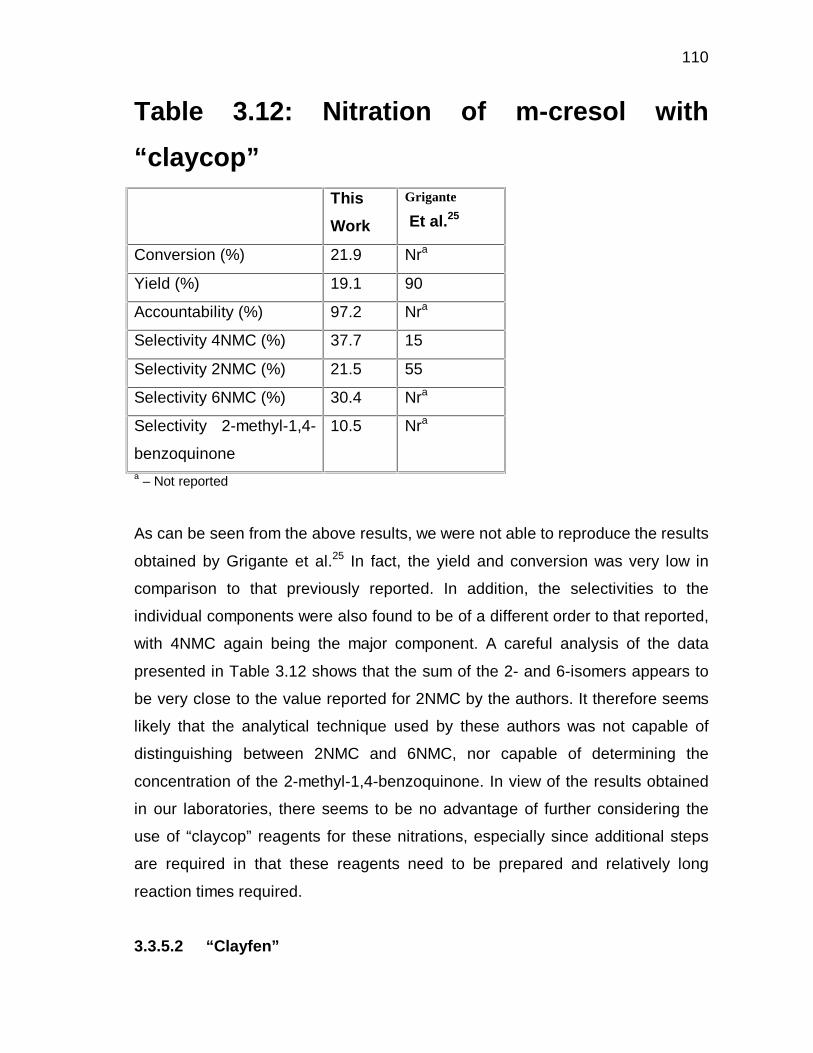
110
Table 3.12: Nitration of m-cresol with
“claycop” This
Work
Grigante
Et al.25
Conversion (%) 21.9 Nra
Yield (%) 19.1 90
Accountability (%) 97.2 Nra
Selectivity 4NMC (%) 37.7 15
Selectivity 2NMC (%) 21.5 55
Selectivity 6NMC (%) 30.4 Nra
Selectivity 2-methyl-1,4-
benzoquinone
10.5 Nra
a – Not reported
As can be seen from the above results, we were not able to reproduce the results
obtained by Grigante et al.25 In fact, the yield and conversion was very low in
comparison to that previously reported. In addition, the selectivities to the
individual components were also found to be of a different order to that reported,
with 4NMC again being the major component. A careful analysis of the data
presented in Table 3.12 shows that the sum of the 2- and 6-isomers appears to
be very close to the value reported for 2NMC by the authors. It therefore seems
likely that the analytical technique used by these authors was not capable of
distinguishing between 2NMC and 6NMC, nor capable of determining the
concentration of the 2-methyl-1,4-benzoquinone. In view of the results obtained
in our laboratories, there seems to be no advantage of further considering the
use of “claycop” reagents for these nitrations, especially since additional steps
are required in that these reagents need to be prepared and relatively long
reaction times required.
3.3.5.2 “Clayfen”
111
Clay-supported ferric nitrate was prepared by mixing ferric nitrate nonahydrate
with K10 clay in acetone, as described in § 2.3.1.3.23,24 The m-cresol and internal
standard was weighed into a reaction flask (10 mmol of each) and diluted with
diethyl ether (50 cm3). “Clayfen” was weighed into the flask (5 g). Typical results
for the “clayfen” nitration are given in Table 3.13. Other reaction conditions were
as follows:
stirring rate – 750 rpm
temperature - ambient
reaction time – 1 hour
Table 3.13: Nitration of m-cresol with
“clayfen” This
Work
Laszlo
et al.23,24
Conversion (%) 56.0 nra
Yield (%) 54.8 nra
Accountability (%) 99.1 nra
Selectivity 4NMC (%) 41.4 34
Selectivity 2NMC (%) 22.6 20
Selectivity 6NMC (%) 26.8 nra
Selectivity 2-methyl-1,4-
benzoquinone (%)
8.9 nra
a – Not reported
The results from these experiments were slightly better than for “claycop”. The
conversion was, however, relatively low, taking into account that the reaction was
left for 1 hour. The total yield obtained in this reaction is very close to the 58%
claimed for the nitration of p-cresol. As can be seen, the accountability of
products was very high, although the selectivity to 4NMC was higher than the

112
34% claimed by the authors. As in the case of “claycop”, no mention was made
of the formation of the other reaction products.
113
3.3.6 Nitration with nitric and sulphuric acid mixtures
The use of mixtures of nitric and sulphuric acid in nitrations has been practiced
for as long as the technique has been known. The sulphuric acid ionises the nitric
acid into free nitronium ions, which are the real attacking electrophile. In addition
to sulphuric acid, these reactions (nitrations) have also been carried out
successfully by mixing nitric acid with a variety of strong acids such as
trifluoroacetic acid and trifluoromethanesulphonic acid.30,31 In a series of
publications by Coombes and his fellow workers,32,33 it was shown that the
concentration of sulphuric acid could influence the regio-selectivity in the nitration
of “activated” aromatic substrates such as methylanisole and m-cresol. For m-
cresol, this apparent decrease in the ortho/ para ratio was observed over the
range of sulphuric acid concentrations of 58 – 81 %. The proportion of para-
products is claimed to have changed from 33 to 52 % over this concentration
range. Another interesting point about the work carried out by this group was the
fact that the formation of 2-methyl-1,4-benzoquinone was not reported.
On the other hand, nitrations in highly
concentrated acid mixtures have some inherent
drawbacks, such as the fact that tars and other
side products are often formed, not to mention
the formation of large amounts of acid wastes.
The possible increase in para-selectivity does
offer possible advantages, provided that the
disadvantages referred to above can be alleviated.
For these reactions, m-cresol (0.3244 g; 3 mmol) was weighed into a reaction
flask and mixed with 20 cm3 1,2-dichloroethane. Sulphuric acid (98 %) was
added in a 2 : 1 ratio with 65% nitric acid (0.28 g). The ratio of nitric acid to m-
cresol was set at 1 : 1. The reaction was carried out at room temperature whilst

114
stirring at 750 rpm. The mixture was left to react for one hour. Results obtained
are summarised in Table 3.14.
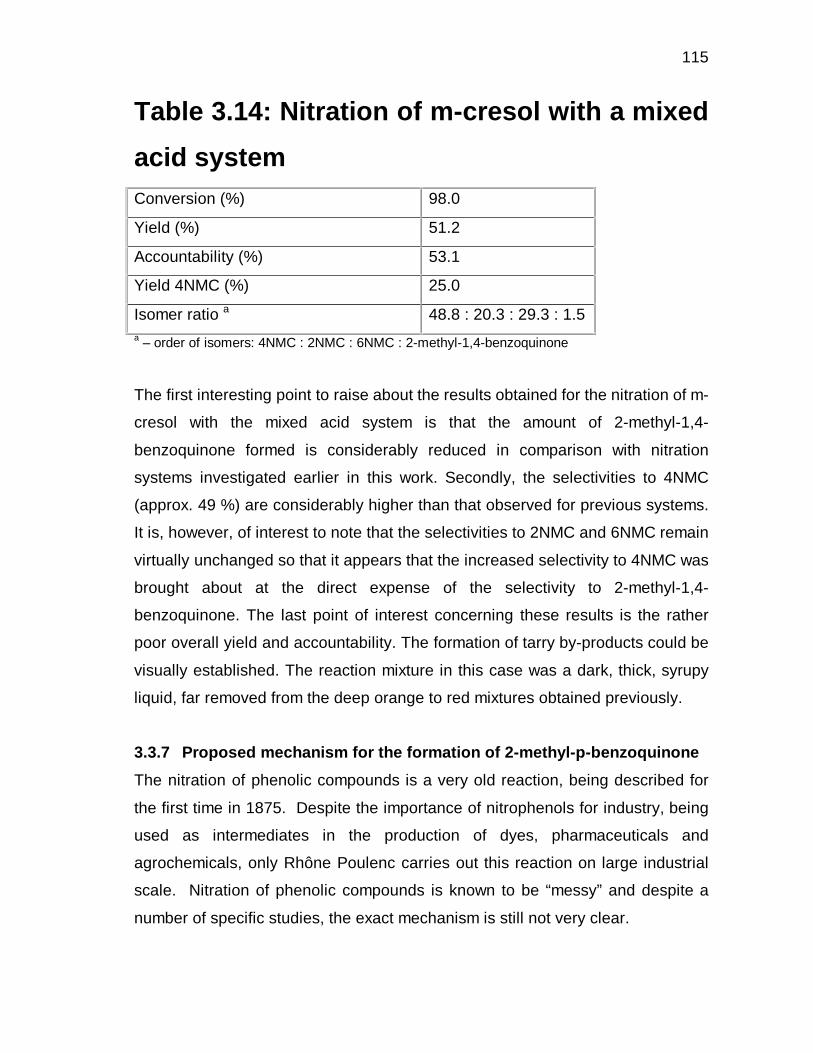
115
Table 3.14: Nitration of m-cresol with a mixed
acid system Conversion (%) 98.0
Yield (%) 51.2
Accountability (%) 53.1
Yield 4NMC (%) 25.0
Isomer ratio a 48.8 : 20.3 : 29.3 : 1.5 a – order of isomers: 4NMC : 2NMC : 6NMC : 2-methyl-1,4-benzoquinone
The first interesting point to raise about the results obtained for the nitration of m-
cresol with the mixed acid system is that the amount of 2-methyl-1,4-
benzoquinone formed is considerably reduced in comparison with nitration
systems investigated earlier in this work. Secondly, the selectivities to 4NMC
(approx. 49 %) are considerably higher than that observed for previous systems.
It is, however, of interest to note that the selectivities to 2NMC and 6NMC remain
virtually unchanged so that it appears that the increased selectivity to 4NMC was
brought about at the direct expense of the selectivity to 2-methyl-1,4-
benzoquinone. The last point of interest concerning these results is the rather
poor overall yield and accountability. The formation of tarry by-products could be
visually established. The reaction mixture in this case was a dark, thick, syrupy
liquid, far removed from the deep orange to red mixtures obtained previously.
3.3.7 Proposed mechanism for the formation of 2-methyl-p-benzoquinone
The nitration of phenolic compounds is a very old reaction, being described for
the first time in 1875. Despite the importance of nitrophenols for industry, being
used as intermediates in the production of dyes, pharmaceuticals and
agrochemicals, only Rhône Poulenc carries out this reaction on large industrial
scale. Nitration of phenolic compounds is known to be “messy” and despite a
number of specific studies, the exact mechanism is still not very clear.
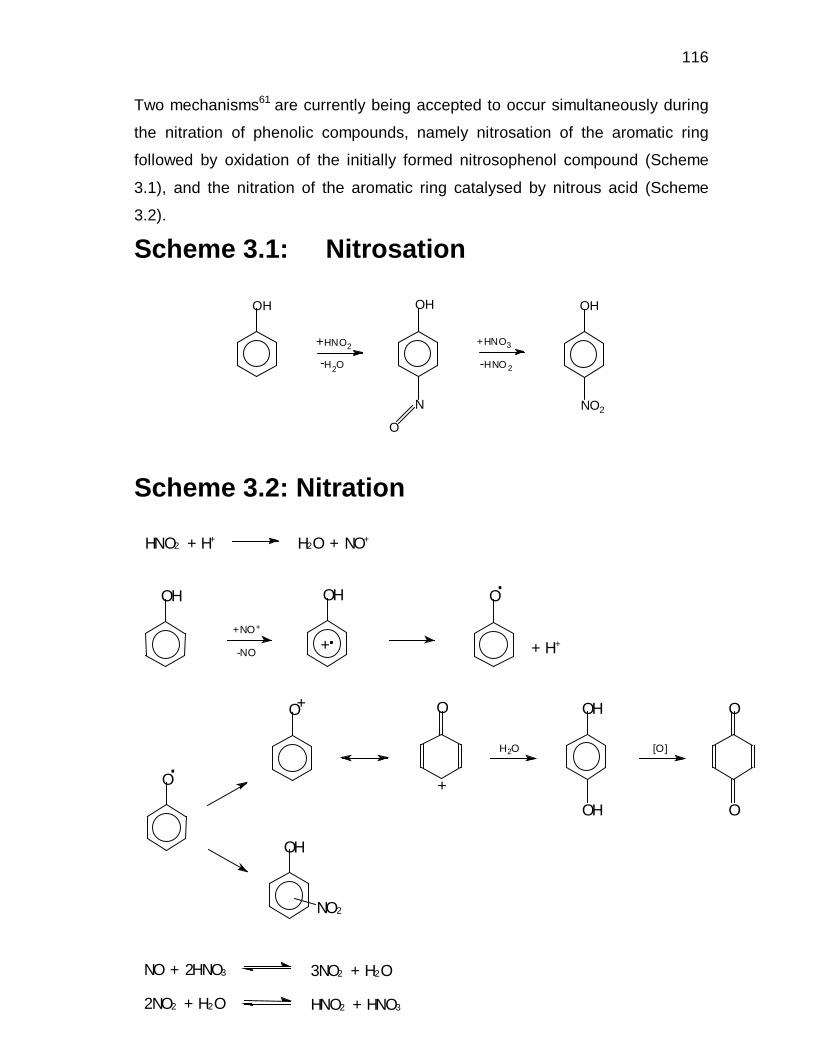
116
Two mechanisms61 are currently being accepted to occur simultaneously during
the nitration of phenolic compounds, namely nitrosation of the aromatic ring
followed by oxidation of the initially formed nitrosophenol compound (Scheme
3.1), and the nitration of the aromatic ring catalysed by nitrous acid (Scheme
3.2).
Scheme 3.1: Nitrosation
Scheme 3.2: Nitration
OH
+HNO2
H2O-
+HNO3
-HNO 2
OH
NO2N
OH
O
.+
OH
+ H+
.OOH
-NO
+NO+
HNO2 + H+ H2O + NO+
O
O
OH
OH
O
+.
O
[O]H2O
NO2
OH
+O
NO + 2HNO3 3NO2 + H2O
2NO2 + H2O HNO2 + HNO3
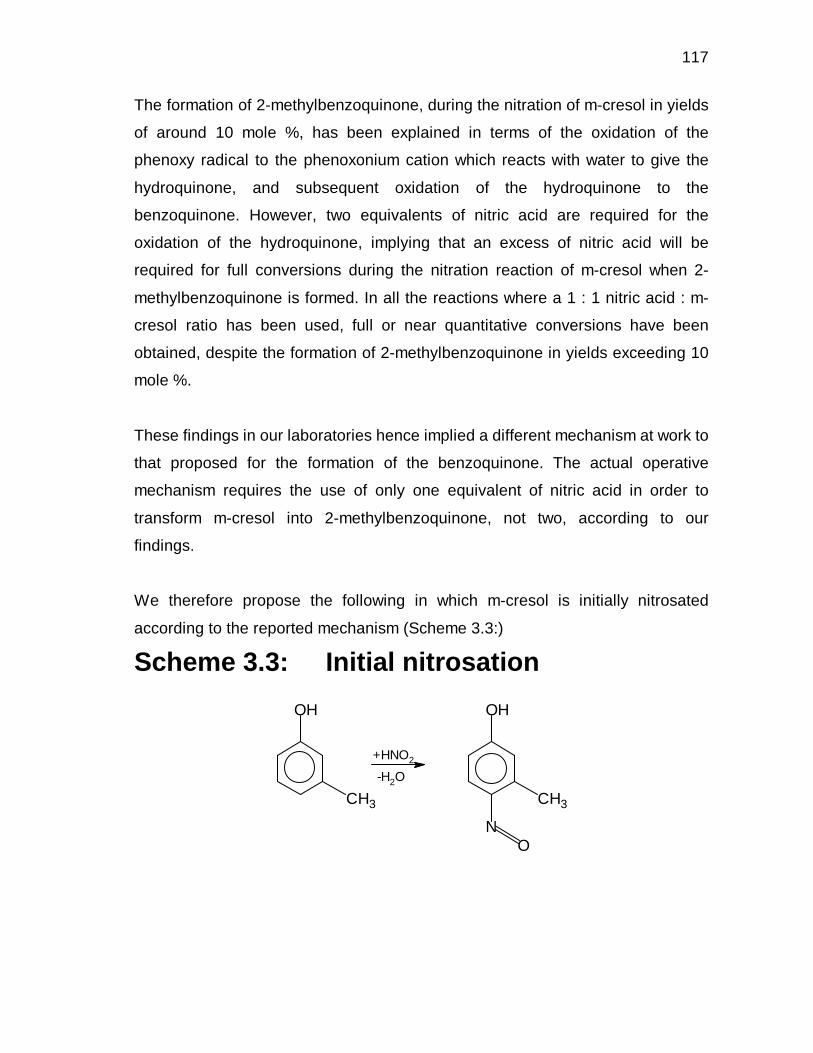
117
The formation of 2-methylbenzoquinone, during the nitration of m-cresol in yields
of around 10 mole %, has been explained in terms of the oxidation of the
phenoxy radical to the phenoxonium cation which reacts with water to give the
hydroquinone, and subsequent oxidation of the hydroquinone to the
benzoquinone. However, two equivalents of nitric acid are required for the
oxidation of the hydroquinone, implying that an excess of nitric acid will be
required for full conversions during the nitration reaction of m-cresol when 2-
methylbenzoquinone is formed. In all the reactions where a 1 : 1 nitric acid : m-
cresol ratio has been used, full or near quantitative conversions have been
obtained, despite the formation of 2-methylbenzoquinone in yields exceeding 10
mole %.
These findings in our laboratories hence implied a different mechanism at work to
that proposed for the formation of the benzoquinone. The actual operative
mechanism requires the use of only one equivalent of nitric acid in order to
transform m-cresol into 2-methylbenzoquinone, not two, according to our
findings.
We therefore propose the following in which m-cresol is initially nitrosated
according to the reported mechanism (Scheme 3.3:)
Scheme 3.3: Initial nitrosation
-H2O
+HNO2
ON
CH3CH3
OHOH
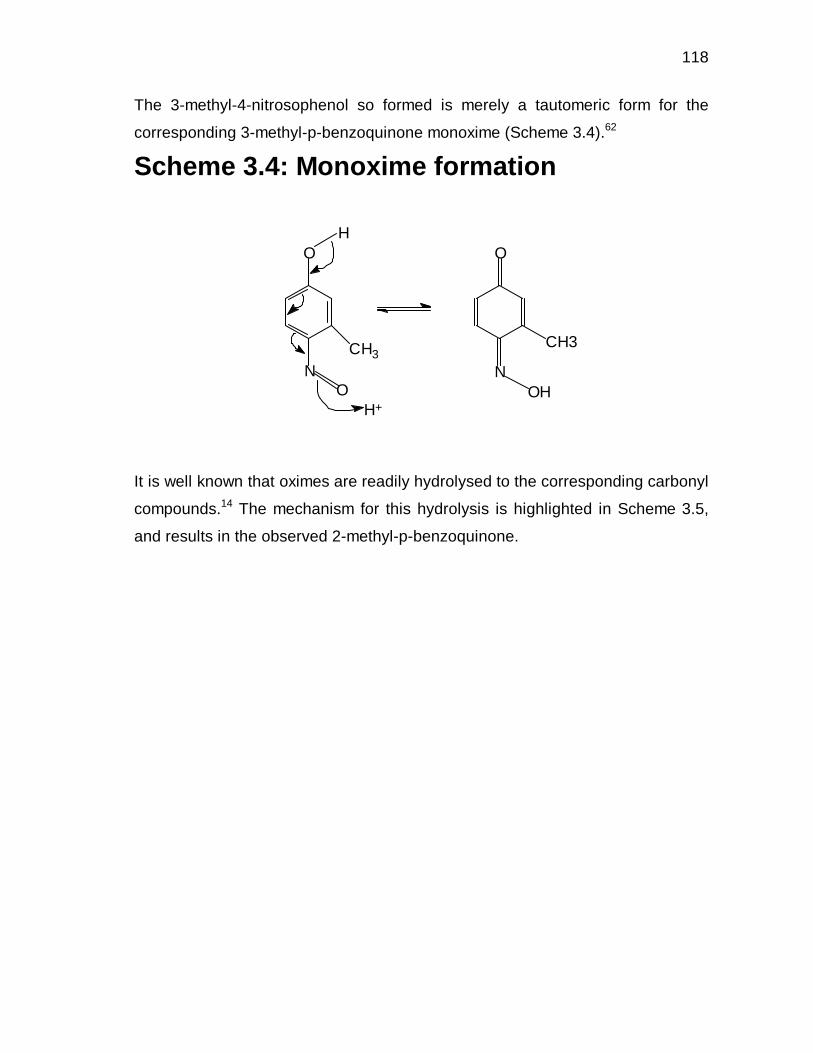
118
The 3-methyl-4-nitrosophenol so formed is merely a tautomeric form for the
corresponding 3-methyl-p-benzoquinone monoxime (Scheme 3.4).62
Scheme 3.4: Monoxime formation
It is well known that oximes are readily hydrolysed to the corresponding carbonyl
compounds.14 The mechanism for this hydrolysis is highlighted in Scheme 3.5,
and results in the observed 2-methyl-p-benzoquinone.
CH3
H+
O
CH3
HO
NO OH
N
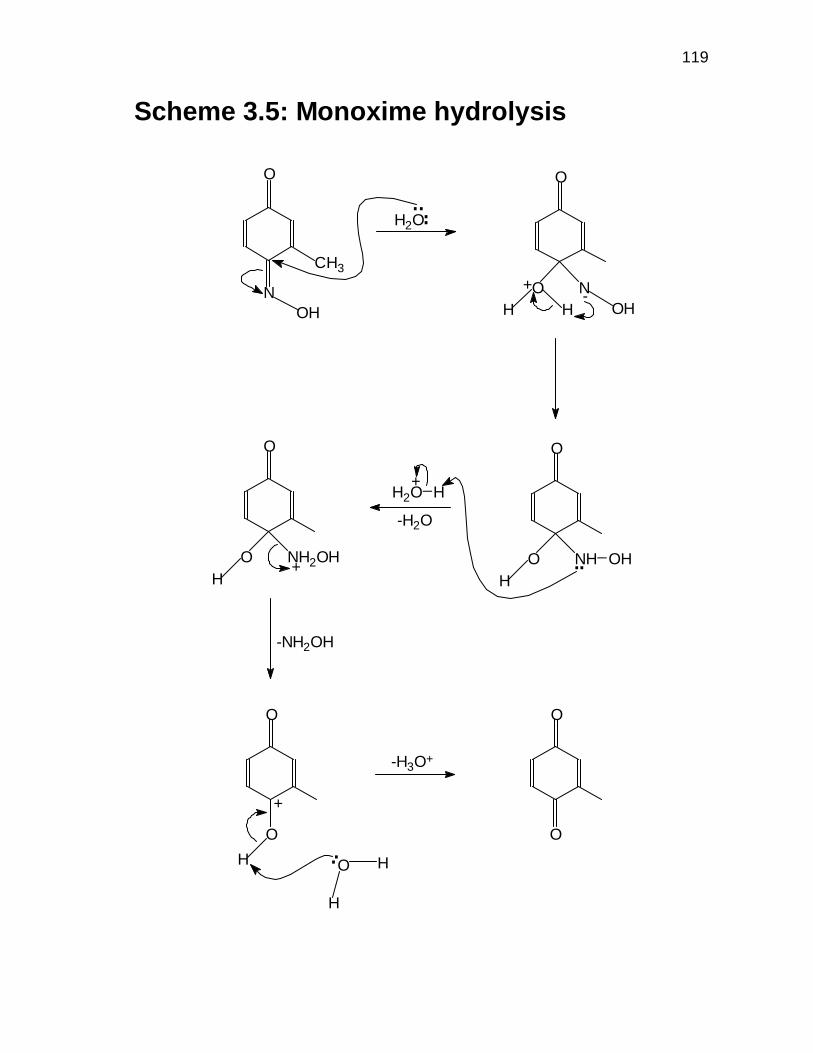
119
Scheme 3.5: Monoxime hydrolysis
..
CH3
NOH
O
H2O..
OHNO
H H
+
O
-
O
HO NH OH_..
O
HO NH2OH
H2O_H+
-H2O
+
-NH2OH
OO
H
O
-H3O+
..
H
O H
+
O
120
The mechanism proposed above, not only explains the stoichiometry of the
reaction, but also explains the observation that increasing concentrations of
sulphuric acid, used as nitration catalyst, decreases the amount of 2-
methylbenzoquinone. Sulphuric acid, a strong oxidant itself, would be expected
to favour the formation of 2-methylbenzoquinone according to the oxidation
mechanism of Scheme 3.2. However, the decrease in the amount of 2-
methylbenzoquinone is easily rationalised in terms of a reduced tendency for the
nitrosation in the presence of sulphuric acid. The formation of 2-
methylbenzoquinone via hydrolysis of an initially formed nitrosophenol also
explains why no o-benzoquinone is observed in these reactions, since nitrosation
is always p-selective.39
3.3.8 Nitrosation
It has been shown that nitrous acid may catalyse aromatic nitration. Some
authors have even claimed that efficient nitration may be obtained through only
nitrosation with subsequent oxidation of the nitrosophenol to the nitrophenol. It is
also claimed that the nitrosation process is fairly rapid and that nitrosation
favours p-nitrophenols.38
3.3.8.1 Nitrosation using NaNO2 and H2SO4
Ross, Hum and Blucher showed that para-selective nitration may be obtained
with mixtures NaNO3 and NaNO2 in 50 – 60% H2SO4. When they made use of
only NaNO2 with H2SO4, they claimed to have obtained an o : p ratio of 0.03 : 1
of nitrophenol products.39
This method was thus applied to the nitration of m-cresol to determine whether it
would favour the formation of 4NMC (decrease in the o : p ratio). Changing the
o : p ratio of m-cresol, as opposed to phenol, does present a greater challenge
since the cresol does have a higher degree of substitution. Another factor that
influences the ease of the regio-selectivity manipulation is the characteristics of
the aromatic substituents. In this case, two activating o/ p-directors are located
meta to one another.
121
A series of reactions were carried out to determine the effect of nitration via
nitrosation on the o : p ratio. The reactions were all carried out at room
temperature with constant stirring at 750 rpm. A stock solution of substrate in 1,2-
dichloroethane was made up of which 20,00 cm3 was delivered to the reaction
flask by burette. Two of the reactions made use of only NaNO2 as nitrating agent
with different amounts of sulphuric acid added. In these reactions, NaNO2 was
added in a 1 : 1 ratio to the substrate. In the third reaction, HNO3, in a A : S ratio
of 1 : 1, was used as nitrating agent with 10 mol % of NaNO2 as catalyst.
Table 3.15: Nitration of m-cresol with NaNO2
NaNO2
(g)
HNO3
(g)
H2SO4
(g)
Conv
(%)
Yield
(%)
Account.
(%)
Selectivity
4NMC (%)
0.2077a - 0.1544 14.5 0.60 86.1 41.7
0.2067b - 0.0298 16.0 12.7 96.7 41.7
0.0259c 0.2819 - 96.2 90.0 93.8 43.4 a – NaNO2 : H2SO4 = 2 : 1 b – NaNO2 : H2SO4 = 10 : 1 c – HNO3 : NaNO2 = 10 : 1
Results after 60 min reaction time
Nitrating agent : substrate ratio = 1 : 1
Acid concentrations: HNO3 = 65%; H2SO4 = 98%
The results shown in Table 3.15, above indicate that the NaNO2/ H2SO4 reaction
is best carried out with a nitrating agent to acid ratio of 10 : 1. However, substrate
conversions were very low, with no significant change in the 4NMC selectivity.
Concentrated sulphuric acid was used undiluted in this study. The concentration
of sulphuric acid used by Ross et al.39 was in the range of 50 – 60%, which might
have affected the results. It is possible that the substrate might have reacted with
the sulphuric acid instead of the generated NO+ ions. The third reaction gave
promising results, with a high selectivity for 4NMC.
In another experiment, the nitrosation was carried out by the addition of 2 mole
equivalents of nitrosating/ nitrating agent (NaNO2; 0.437 g; 6.33 mmol) per mole
122
of substrate (m-cresol; 0.348 g; 3.22 mmol). Internal standard (nitrobenzene; 3
mmol) was also added to the mixture. The reaction was carried out in 1,2-
dichloroethane (20.00 cm3), while 60 % H2SO4 (10 cm3) was used to generate
the NO2+ ions in solution. Samples were taken and analysed by HPLC as
described in § 2.3.1.1 and § 2.4.2. The results for this experiment are
summarised in Table 3.16.
Table 3.16: Nitrosation of m-cresol with 2 mole equivalents NaNO2
N : Sa Conv
(%)
Yield
(%)
Account.
(%)
Isomer ratiob
1.966 : 1 99.9 88.4 88.6 49.4 : 16.1 : 24.4 : 10.1 a – Nitrosation/ Nitration agent : Substrate ratio
b – order of isomers: 4NMC : 2NMC : 6NMC : 2-methyl-1,4-benzoquinone
The above results show an apparent increase in the selectivity to 4NMC, with an
associated decrease in the selectivity to 2NMC and 6NMC. These results seem
much better than those reported in Table 3.15. However, the third entry in Table
3.15 is primarily the cause of direct nitration (nitric acid was the nitration agent),
whereas the results above could only have occurred via nitrosation.
3.3.8.2 Gas-phase nitrosation
In a patent by Smith and McGee,63 it was claimed that a ratio of 21.6 : 1 of p : o
nitro-products was obtained in the nitrosation and subsequent oxidation to
nitrophenol. A yield of approximately 90 % nitrophenol was also claimed. The
reaction system made use of two separate reaction flasks. In the first, generation
of the oxides of nitrogen (mainly NO2) was caused by the reaction of a strong
acid with NaNO2. The NO2 gas was then swept, with the aid of N2, into the
second reaction flask. This flask contained sulphuric acid. The substrate,
dissolved in acetic acid, was slowly added to the mixture from a dropping funnel.
The nitroaromatic products could be formed immediately by adding dilute nitric
acid to the sulphuric acid/ acetic acid mixture. This mixture was kept at a
constant temperature of 0oC.

123
It was decided to apply this method to the nitrosation of m-cresol. In flask one
was added 50 % H2SO4 (49 cm3; 0.351 mol). A solution of NaNO2 (7.12 g; 0.103
mol) in approximately 40 cm3 water was added dropwise from a dropping funnel.
The gasses were swept into the second flask by N2. The temperature of this flask
was maintained at 20oC. In the second flask was a mixture of 50 % H2SO4 (41
cm3; 0.292 mol) and 20 % HNO3 (32 cm3; 0.113 mol). m-Cresol (11.3 g; 0.104
mol), dissolved in approximately 40 cm3 acetic acid was added dropwise to the
acid mixture at approximately the same rate as that of the NaNO2 mixture (added
over about 90 minutes). The mixture was stirred vigorously and kept at a
temperature of 0oC. After addition of the reagents was complete, the reaction
mixture was left to stir for an additional hour at 0oC. Aliquots (0.5 cm3) were
removed from the mixture before and after completion of the reaction, and diluted
with 10 cm3 water. Nitrobenzene (0.100 g) was added to the sample before the
organic phase was extracted with 10.00 cm3 ethyl acetate. These samples were
further diluted with acetonitrile (0.5 cm3 with 2.5 cm3 CH3CN), before HPLC
analysis was carried out. Results from this experiment are given in Table 3.17.
Table 3.17: Gas-phase nitrosation of m-
cresol This
Work
Smith and
McGee63
Conversion (%) 99.7 nrb
Yield (%) 8.2 90.1
Accountability (%) 8.4 nrb
Selectivity 4NMC (%) 75.6 nra
Selectivity 2NMC (%) 2.4 20
Selectivity 6NMC (%) 7.3 nra
Selectivity 2-methyl-1,4-
benzoquinone (%)
14.6 nra
p : o ratio 8.2 21.6 a – Phenol as substrate b – not reported
124
The results in Table 3.17 show very low conversion, yield and accountability.
However, a very high p : o ratio was observed, yet still not in the same range as
that reported. Lack of experimental experience in this relatively difficult-to-control
reaction system might be the reason for the poor results obtained in our
laboratories. It does, however, seem feasible that nitrosation might improve the
relatively rigid selectivities to 4NMC reported throughout this work.
3.4 CONCLUDING REMARKS
The following remarks may serve as a summary of results obtained in this work.
• Nitration of m-cresol with dilute nitric acid in a stoichiometric ratio, in the
presence of a lanthanide triflate such as yttrium(III)triflate, gave high
conversions and yields with reasonable material balance. These results were,
however, not significantly better than those obtained when the catalyst was
absent from the reaction mixture. The percentage selectivity to 3-methyl-4-
nitrophenol (4NMC) seemed marginally higher in mixtures where the catalyst
was present; at the same time, there was an obvious loss in product
accountability. It would thus seem that the catalyst does somehow promote
nitration at the para position (relative to the OH group), but that it also
catalyses side reactions, which lead to unquantifiable products. The catalyst
is thus best omitted from the reaction mixture. A range of nitric acid
concentrations may be employed for the successful nitration of m-cresol at
low temperatures. Addition of yttrium(III)triflate extended this viable
concentration range further. It was also found that at low temperatures, the
triflate does in fact catalyse nitration, but high reaction temperatures and
relatively high nitric acid concentrations masked this catalytic effect.
• From the results obtained from the experimental design, it may be concluded
that the nitration of m-cresol with only dilute nitric acid in 1,2-dichloroethane is
an extremely robust reaction, and that it may be successfully carried out
125
under a wide range of experimental conditions. The equations, which
describe the second order response surface models were determined for the
four reaction responses. Subsequently, the validity of these models was
confirmed by analysis of variance and normal probability plots. Contour plots
were then constructed for each of the reaction responses, where two
variables were plotted against each other, the third being kept constant.
From these contour plots, it was shown that the temperature and nitric acid
concentration does not have any significant effect upon the reaction
responses, such as conversion, total yield, 4NMC selectivity and
accountability. The acid to substrate ratio was found to be the only significant
reaction variable, and accurately controlling this factor at a value of 1 : 1 gave
the highest overall responses. The model did however indicate that the 4NMC
selectivity and accountability responses might be slightly increased by
working at a lower temperature and a lower acid concentration. This premise
was tested by carrying out a series of reactions between 0 and 10oC, where
the acid concentration was 39.4%. The A : S ratio was kept constant at 1 : 1.
These reactions produced results as predicted by the experimental design. It
was shown that conversion increased with temperature and that lower
temperatures and concentrations increased the accountability and 4NMC
selectivity. However, these improvements come at a cost: the substrate
conversion is relatively low at these low conditions, and with low conversion is
coupled low yield.
• Nitrations using clay supported nitrating agents could not be successfully
applied in this study. It did, however, appear that “clayfen” had an apparent
preference for para-nitration, whereas “claycop” exhibited a preference for the
ortho-position.
• The nitration of m-cresol with mixed acid gave high conversions. However,
the yield and material balance was very low. This was expected as these
reaction conditions are very harsh and, with a highly activated substrate such
126
as m-cresol, often lead to by-products and tars. On the other hand,
exceptionally high selectivity was obtained for 4NMC. Another interesting
aspect to note is that almost no 2-methyl-1,4-benzoquinone was generated in
this reaction.
• Nitration via nitrosation, in our hands, did not produce the expected results.
The conversions and yields were very low. There did not seem to be any
improvement in the selectivity of 4NMC. In the reaction where NaNO2 was
used as a catalyst, the results were comparable to nitration with 65% nitric
acid in the absence of any catalyst. The 4NMC selectivity did appear to be
higher in the case of the former. The gas-phase nitrosation was not very
successful in terms of the observed conversion, total yield etc. It was,
however, interesting to note that the selectivity to 4NMC and associated p : o
ratio was far higher than in any of the other experiments. It seems thus that
with some experience in this reaction, it could be possible to increase the p :
o ratio.
It may hence be concluded that the nitration of m-cresol is best carried out with
dilute nitric acid in a 1 : 1 ratio in the absence of a catalyst. The reaction mixtures
so produced are clean and free of tars and other solids. Conversions are typically
quantitative, with yields and accountabilities in excess of 90 %. The yield of
4NMC was routinely higher than 40 %. Of the alternative nitration methods used,
only the mixed acid system produced comparable results.
127
CHAPTER 4
NITRATION OF p-CRESOL
4.1 INTRODUCTION
In comparison to the nitration of m-cresol, the nitration of p-cresol is considerably
simpler in terms of the number of products which may form. Under conditions
that result in mononitration only, there is only one product, namely 2-nitro-p-
cresol. The only consideration in such a nitration process is to minimise
dinitration and by-products arising from the oxidation of the methyl group by the
nitrating mixture.
The amounts of products obtained from a reaction and also the quality of these
products, in other words the yield and purity of products, are of major importance
in large-scale production processes. At the same time, it is important to know the
amounts of chemicals and raw materials charged in each process to yield these
products. This information, termed the material balance, is extremely important in
production economics for a number of reasons. Firstly, it is not cost effective to
produce chemical products on an industrial scale when there is no indication of
how much of each chemical is required, and how much product is expected.
Secondly, chemistry in the hands of the ignorant can be extremely dangerous, as
reactions often produce heat, which may cause the reaction to run away;
sometimes even toxic or explosive mixtures may form.
The process chemist has always been equipped to answer nearly all questions
relating to the material balance. These answers may be found by an intimate
study of the reaction mechanism and stoichiometry. Many reactions, though, do
not proceed through discrete reactant ratios; it is then especially necessary to
establish the rates of reactions relative to the various reactants and products.

128
The construction of product distribution curves is often helpful in determining the
rates of reaction. Of course, short reaction times (high reaction rates) also imply
quicker batch turnovers, which in turn implies higher production volumes.
Once the rate of reaction is established, it is prudent to determine the product
yields and product purity. This implies that the product must be removed, or
isolated, from any impurities that might be present in the reaction mixture, such
as side products and reaction solvent, and then to subsequently determine its
purity. It is often necessary for the chemist to make use of purification techniques
such as extraction, recrystallisation and distillation to eventually obtain an
adequately pure product. Of course, if the reaction route is ever to become an
industrially viable process it is important for the chemist to select isolation
methods that may be carried out on industrial scale, which means that cost
effectiveness and safety should also be taken into consideration.
Nowadays, chemists are under increasing pressure to obtain higher yields and
conversions in shorter times. At the same time, it is compulsory to obtain these
results by making use of what is currently known as “green” chemistry. Concern
for our environment is growing; it has become imperative to counter the damage
that was done by over-zealous industrialists in the fifties and sixties. It is thus
important for the chemist to minimise the wastes generated in a chemical
process. The reaction wastes also need to be identified and quantified.
Traditionally, the chemist’s involvement would end with an intimate knowledge of
the reaction mechanism and the material balance, and the chemical engineer
would then take over. It was always the engineer’s function to determine the
energy balance of a reaction; in other words the amount of energy that must be
added through heating etc. to initiate the reaction, how much energy is produced
during the reaction and the amount of energy that has to be removed through
cooling during the reaction to keep the process safe. Also included in the energy
balance is the internal energy of each reactant. Another very important factor is
the amount of heat lost through the reactor material to the environment. This
information was required for scale-up purposes, since energy in a “world-scale”

129
production plant may be treated as a commodity, and heating and cooling of any
reaction mixture increases the unit price of a chemical product. Cost efficiency is
not the only reason why knowledge of the heat balance is required. Heat evolved
in a chemical reaction also has a serious implication in terms of the safety of
plant personnel, as plant equipment and certain chemicals have a specified safe
working range.
The skill associated with determining the energy balance of a chemical reaction
has become accessible to the modern process chemist. Through a thorough
knowledge of reaction thermodynamics and making use of techniques such as
reaction calorimetry, it has become possible for the chemist to gain a lot more
information concerning a specific reaction.
4.2 OBJECTIVES
The objectives for this part of the investigation may be summarised as follows:
• To nitrate p-cresol with dilute nitric acid and to
determine the product distribution diagrams for
each of the mono- and dinitration steps.
• To determine whether the two steps proceed
discretely or if they occur concurrently.
• To increase the scale of the reaction and to
isolate the product, as well as to determine the
purity of the product.
• To identify the waste generated during the
reaction and to quantify it.

130
4.3 RESULTS AND DISCUSSION
4.3.1 Mono- and dinitration of p-cresol
p-Cresol and nitrobenzene (internal standard) were made up in a stock solution
with either 1,2-dichloroethane or iso-propanol. This stock solution was run into a
reaction vessel by means of a burette (20.00 cm3; 3.0 mmol p-cresol and
nitrobenzene). 65% HNO3 was weighed into reaction mixture (0.29 g; 3.0 mmol)
with a microsyringe and the reaction mixture placed in a temperature bath at
60oC with constant stirring at 750 rpm. The mixture was left to react for 15
minutes, before samples were taken and submitted for HPLC analysis (§ 2.3.1.1
and § 2.4.2). The results for the separate reactions are given in Table 4.1.
Table 4.1: Mono- and dinitration of p-cresol
Rxn.
No.
Solvent [Acid]
%
A : S Conv.
(%)
Yield
2NPCa (%)
Yield
DNPCb (%)
Account.
(%)
1. DCE 65 0.959 : 1 100 95.8 - 95.8
2. DCE 65 1.958 : 1 100 - 97.5 97.5
3. DCE 93 1 : 1.014 100 92.4 4.5 96.9
4.c DCE 93 1 : 0.989 100 94.3 2.2 96.5
5. i-PrOH 65 1 : 1.002 7.0 6.6 - 99.6
6. i-PrOH 93 1 : 0.985 54.9 53.8 - 98.8
7.c i-PrOH 93 1 : 0.968 42.2 39.0 - 96.8 a – 2NPC – 2-nitro-p-cresol b – DNPC – 2,6-dinitro-p-cresol c – Reactions done at 5oC.
131
The nitration of p-cresol resulted in the desired
nitrocresol products in excellent yields when
using 1,2-dichloroethane as reaction solvent.
Using a higher acid concentration resulted in the
formation of small quantities of dinitrated
products during mononitration. The accountability
of the nitration reaction was excellent in all cases.
Two reactions (reactions 4 and 7) were carried out
at lower reaction temperatures, but without
affecting the reaction outcome too drastically.
4.3.2 Effect of substrate loading
Several experiments were also carried out at
higher substrate loadings (the reactions shown in
Table 4.1 were carried out at low (1.7 %) substrate
loading). In this study, 93 % (m/m) nitric acid was
used as nitration agent. The substrate and
internal standard were weighed into the reaction
flask containing 20.00 cm3 1,2-dichloroethane. The
nitric acid was added to the mixture over a period
of one minute, after which the mixture was
immersed in an ice bath at 5oC. Timing of the
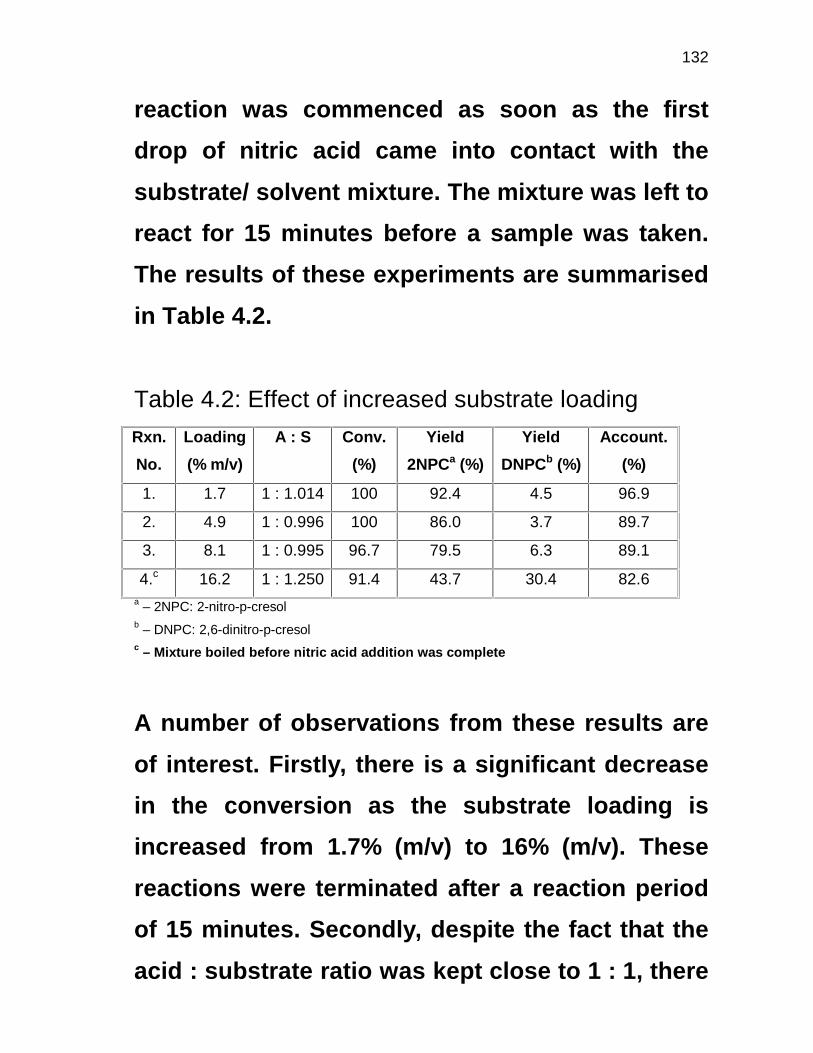
132
reaction was commenced as soon as the first
drop of nitric acid came into contact with the
substrate/ solvent mixture. The mixture was left to
react for 15 minutes before a sample was taken.
The results of these experiments are summarised
in Table 4.2.
Table 4.2: Effect of increased substrate loading
Rxn.
No.
Loading
(% m/v)
A : S Conv.
(%)
Yield
2NPCa (%)
Yield
DNPCb (%)
Account.
(%)
1. 1.7 1 : 1.014 100 92.4 4.5 96.9
2. 4.9 1 : 0.996 100 86.0 3.7 89.7
3. 8.1 1 : 0.995 96.7 79.5 6.3 89.1
4.c 16.2 1 : 1.250 91.4 43.7 30.4 82.6 a – 2NPC: 2-nitro-p-cresol b – DNPC: 2,6-dinitro-p-cresol c – Mixture boiled before nitric acid addition was complete
A number of observations from these results are
of interest. Firstly, there is a significant decrease
in the conversion as the substrate loading is
increased from 1.7% (m/v) to 16% (m/v). These
reactions were terminated after a reaction period
of 15 minutes. Secondly, despite the fact that the
acid : substrate ratio was kept close to 1 : 1, there
133
is a significant increase in the yield of dinitrated
product. This clearly suggests a rapid reaction of
the initially formed mononitrated product due to
the presence of a local excess of acid in the
reaction mixture. The last observation relates to
the observed decrease in reaction accountability
as the substrate loading is increased.
The chromatograms obtained from the HPLC
analyses (Appendix 4.1) for these reaction
mixtures indicated the formation of a number of
side products. These were investigated using
mass spectrometry, a total of five different by-
products being observed in the GC-trace
(Appendix 4.2). The mass fragmentation patterns
of the individual compounds (three of the five
could be elucidated) were used to assign identity
to the individual by-products. These assignments
are summarised in Table 4.3.
Table 4.3: GC-MS assignments for the by-products
obtained in the p-cresol nitration
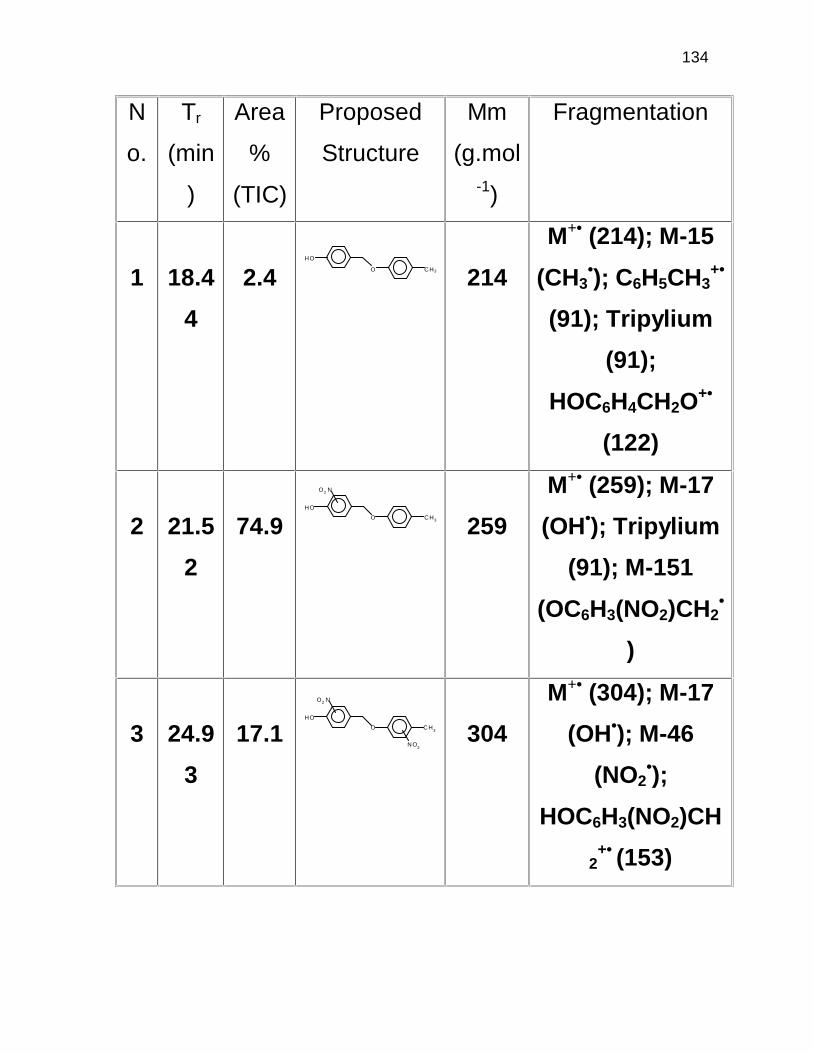
134
N
o.
Tr
(min
)
Area
%
(TIC)
Proposed
Structure
Mm
(g.mol-1)
Fragmentation
1
18.4
4
2.4
214
M+• (214); M-15
(CH3•); C6H5CH3
+•
(91); Tripylium
(91);
HOC6H4CH2O+•
(122)
2
21.5
2
74.9
259
M+• (259); M-17
(OH•); Tripylium
(91); M-151
(OC6H3(NO2)CH2•
)
3
24.9
3
17.1
304
M+• (304); M-17
(OH•); M-46
(NO2•);
HOC6H3(NO2)CH
2+• (153)
CH3O
HO
O
O2 N
CH3
HO
O
O2 N
HO
CH3
NO2

135
From the tentative assignments made in Table 4.3,
it can be seen that by-product formation is mainly
the result of oxidation of the aromatic ring, most
probably to give an initial quinone methide
intermediate, which then undergoes nucleophilic
addition with either unreacted substrate or
nitration product. Possible mechanisms of
formation for these by-products are given in
Scheme 4.1. High acid concentrations and high
substrate and/ or product concentrations will
obviously favour these reactions.
In other oxidative work carried out on p-cresol in
our laboratories,64 similar dimers, to those shown
in Table 4.3 (compounds with Mm. 214, 259 and
304), were also observed. Their formation was
explained in terms of nucleophilic addition of p-
cresol or the respective nitro-substituted
products to quinomethide or nitro-substituted
quinomethide. It has previously been reported
that quinomethides do exist as intermediates
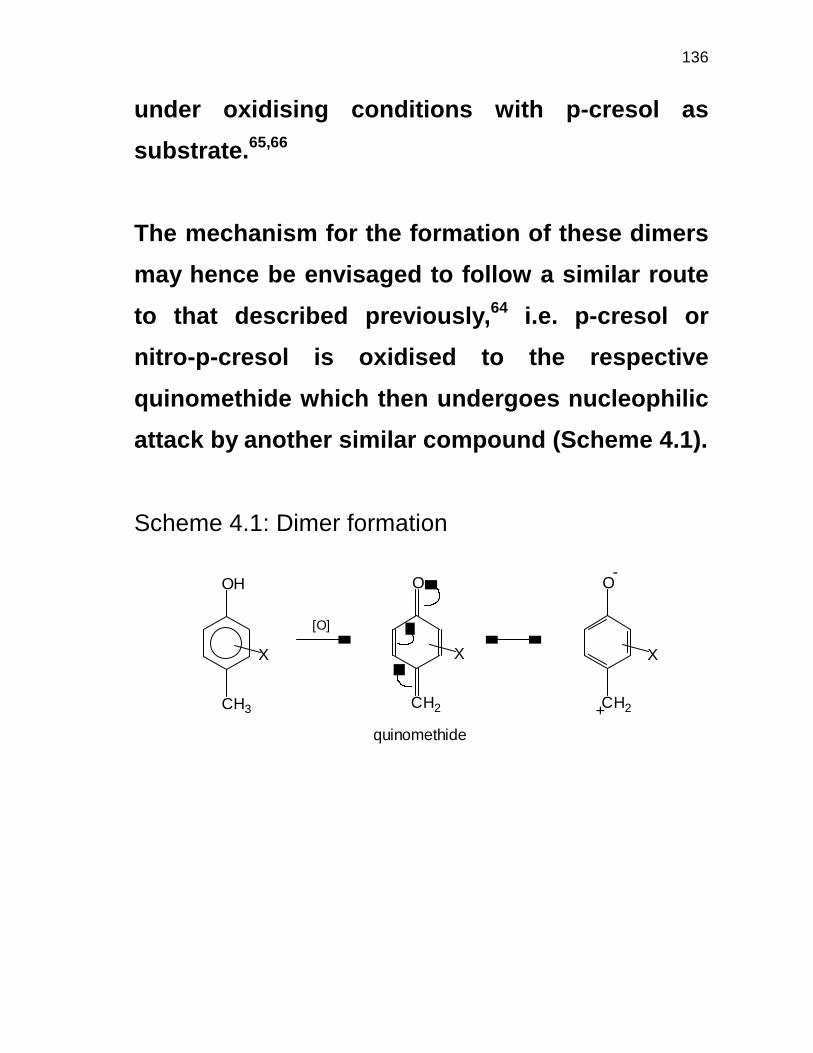
136
under oxidising conditions with p-cresol as
substrate.65,66
The mechanism for the formation of these dimers
may hence be envisaged to follow a similar route
to that described previously,64 i.e. p-cresol or
nitro-p-cresol is oxidised to the respective
quinomethide which then undergoes nucleophilic
attack by another similar compound (Scheme 4.1).
Scheme 4.1: Dimer formation
OH
X
CH3
[O]
O
CH2
X
O
CH2
X
-
+
quinomethide
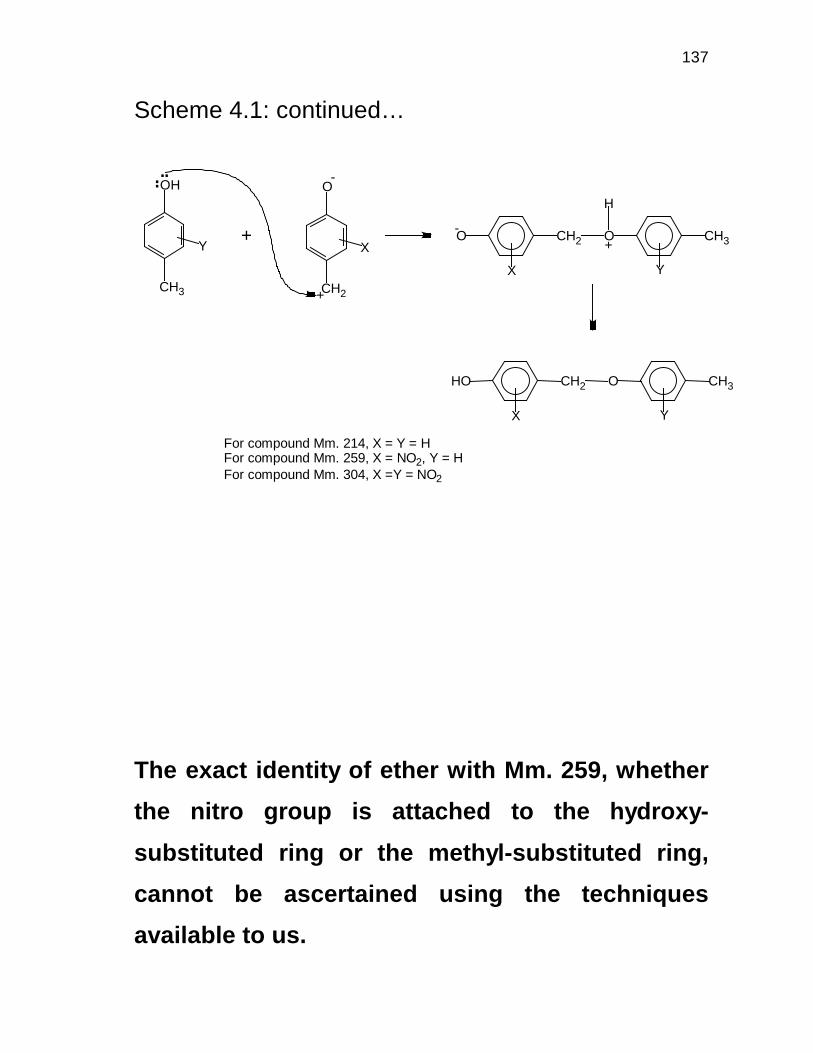
137
Scheme 4.1: continued…
The exact identity of ether with Mm. 259, whether
the nitro group is attached to the hydroxy-
substituted ring or the methyl-substituted ring,
cannot be ascertained using the techniques
available to us.
.... O
CH2
X
-
+
+Y
CH3
OH
HO CH3
Y
O
X
CH2
CH3+-
H
Y
OO
X
CH2
For compound Mm. 214, X = Y = HFor compound Mm. 259, X = NO2, Y = HFor compound Mm. 304, X =Y = NO2
138
Despite the formation of these by-products, the
direct nitration of p-cresol to either mono- or
dinitrated product appears quite attractive since
high yields and accountabilities are possible. The
formation of by-products, including DNPC during
the mononitration of p-cresol, seems controllable
in terms of acid concentration, substrate loading
and rate of acid addition. The results obtained
indicate that the mononitration product is
sufficiently deactivated towards further attack to
ensure that all of the substrate is first converted
before the dinitration step commences. This
implies that the mono- and dinitration reactions
proceed as separate steps and that the formation
of DNPC can be effectively minimised by careful
control of the experimental variables referred to
above.
4.3.3 Scale-up of p-cresol nitration – isolation of
reaction product
139
In order to study the isolation of 2NPC formed
during the direct nitration of p-cresol, it was
necessary to increase the scale of the substrate
load in the reaction to facilitate the subsequent
product isolation and purification of 2NPC. The
reaction was carried out in a 250 cm3 three-
necked round-bottomed flask with 1,2-
dichloroethane (150 cm3) as solvent. p-Cresol
(19.6 g; 181 mmol) was added to the solvent and
the solution stirred at 60oC. Nitric acid (65%; 18.3
g; 191 mmol) was added dropwise over a period
of 60 minutes. After the acid addition was
complete, the reaction was left to stir for an
additional two hours to complete the reaction. At
this point, the reaction mixture was poured over
ice, the phases separated and the organic layer
extracted into ether. The solvent was removed by
distillation. The crude product was weighed and
set up for steam distillation with internal steam
generation. The product was subsequently
extracted from the water phase with ether and the
solvent was removed by vacuum distillation.
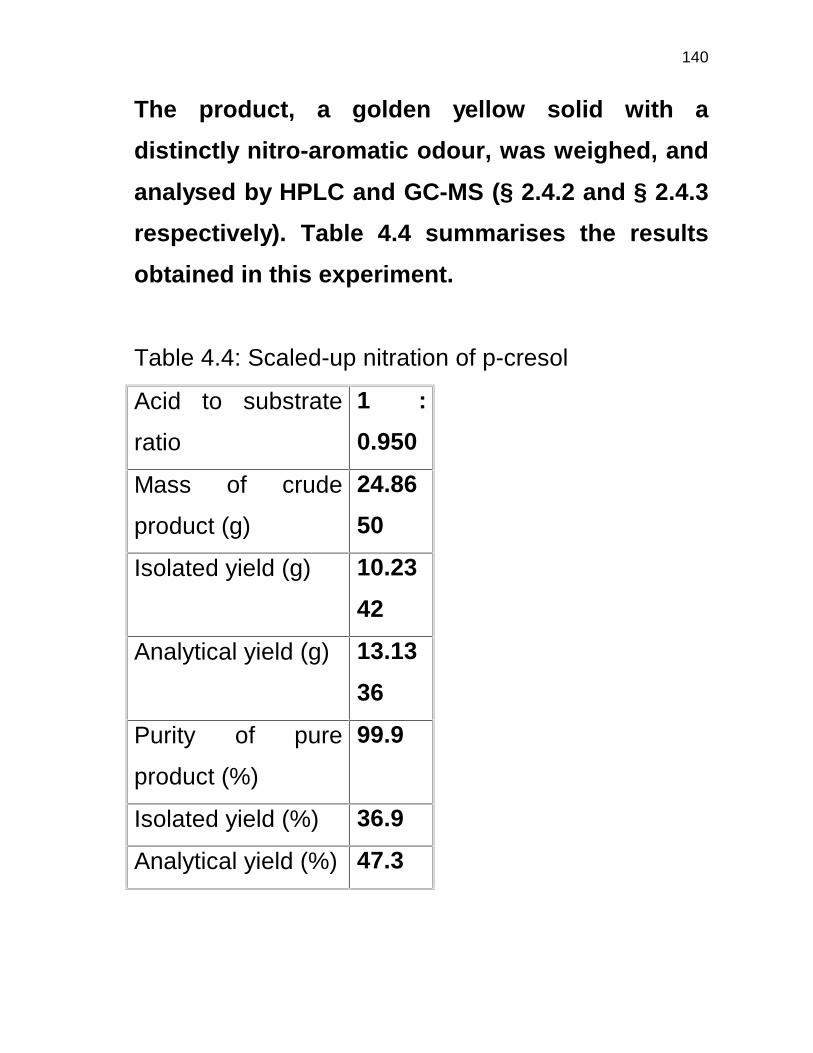
140
The product, a golden yellow solid with a
distinctly nitro-aromatic odour, was weighed, and
analysed by HPLC and GC-MS (§ 2.4.2 and § 2.4.3
respectively). Table 4.4 summarises the results
obtained in this experiment.
Table 4.4: Scaled-up nitration of p-cresol
Acid to substrate
ratio
1 :
0.950
Mass of crude
product (g)
24.86
50
Isolated yield (g) 10.23
42
Analytical yield (g) 13.13
36
Purity of pure
product (%)
99.9
Isolated yield (%) 36.9
Analytical yield (%) 47.3
141
Mass spectrometric and H-NMR (Appendix 4.3 and
4.4) analysis proved that the isolated product was
indeed 2NPC. The purity determined with the aid
of HPLC, using the internal standard method,
showed that the steam distillation was effective in
purifying the crude product. Although the isolated
yield is low, it compares well with the HPLC yield
obtained for these reactions. Analysis of the
residue from the isolation step by GC-MS showed
the same by-products found previously
(compounds in Table 4.3), together with small
amounts of dinitrated product. These results
seem to indicate that careful control of the acid
addition rate alone will not be sufficient to obtain
good results due to the rapid nature of the
reactions in question (nitration, dinitration and
oxidation).
Two further reactions were carried out at these
high substrate loadings: in the first, acid was fed
to the reaction mixture containing all the
substrate in the 1,2-dichloroethane solvent and in
142
the second, acid and substrate were fed
simultaneously to the reactor containing half the
amount of reaction solvent. Use was made of the
Simular reaction calorimeter for the purposes of
using the dosing pumps, for better process
control. Details of the operation of this instrument
are given in § 2.3.2 and § 5.3.1. Calorimetric data
obtained in these reactions will also be discussed
in § 5.3.
In the first reaction p-cresol (40.0 g; 370 mmol) was weighed into the glass liner
containing 1,2-dichloroethane (250 cm3). Nitric acid (65%; 35.6 g; 371 mmol) was
fed to the reactor at 0.5 g.min-1.
In the second reaction, the acid to substrate ratio of 1 : 1 was maintained
throughout. The reactor contained 155 g of 1,2-dichloroethane prior to the
addition of any other reactants. 194 g of a mixture containing p-cresol (80.9 g;
748 mmol) in 1,2-dichloroethane (309 g) was dosed to the reactor at a rate of
2.73 g.min-1 over approximately 71 minutes. Nitric acid (65 %; 35.5 g; 370 mmol)
was simultaneously dosed at a rate of 0.5 g.min-1.
Samples were taken from the reaction mixture and analysed with the aid of
HPLC. The sampling procedure may be summarised as follows: 0.5 cm3 aliquots
were removed from the reaction mixture; nitrobenzene (0.45 g) was added to all
samples prior to further dilution with 5.00 cm3 acetonitrile. After completion of the
reactions, products were isolated in exactly the same manner as described
earlier in this section (§ 4.3.4). Results from the scaled-up reactions are
summarised in Table 4.5.
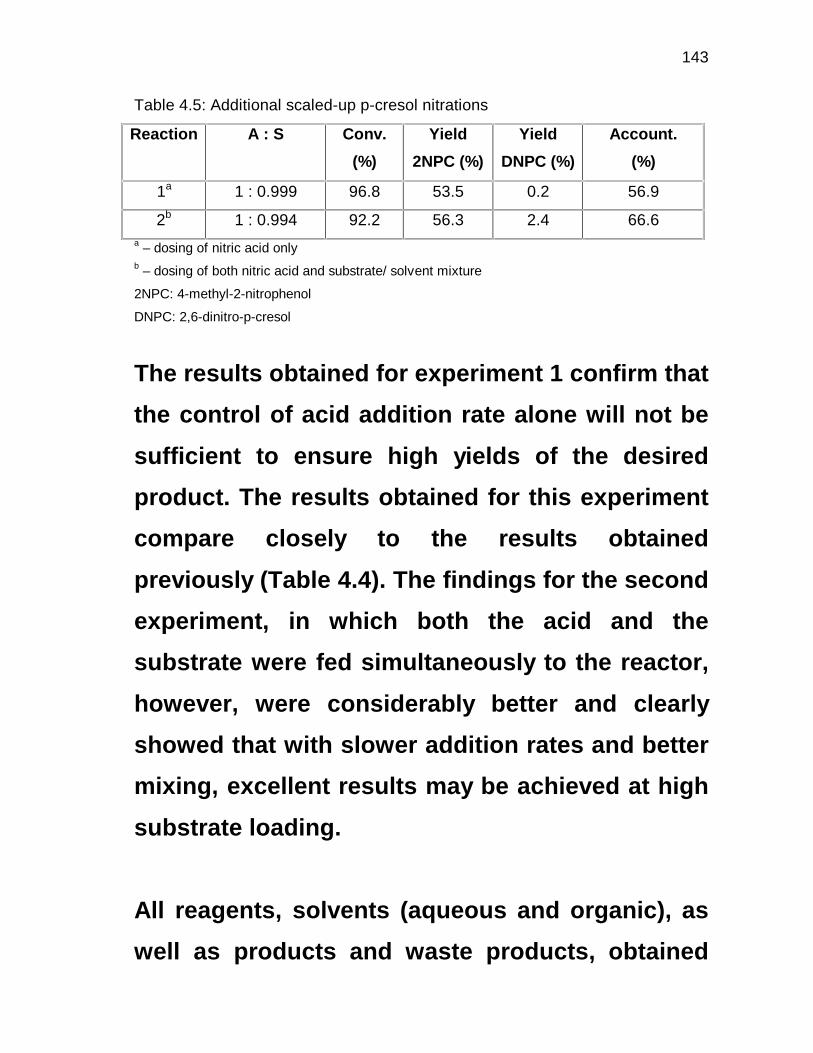
143
Table 4.5: Additional scaled-up p-cresol nitrations
Reaction A : S Conv.
(%)
Yield
2NPC (%)
Yield
DNPC (%)
Account.
(%)
1a 1 : 0.999 96.8 53.5 0.2 56.9
2b 1 : 0.994 92.2 56.3 2.4 66.6 a – dosing of nitric acid only b – dosing of both nitric acid and substrate/ solvent mixture
2NPC: 4-methyl-2-nitrophenol
DNPC: 2,6-dinitro-p-cresol
The results obtained for experiment 1 confirm that
the control of acid addition rate alone will not be
sufficient to ensure high yields of the desired
product. The results obtained for this experiment
compare closely to the results obtained
previously (Table 4.4). The findings for the second
experiment, in which both the acid and the
substrate were fed simultaneously to the reactor,
however, were considerably better and clearly
showed that with slower addition rates and better
mixing, excellent results may be achieved at high
substrate loading.
All reagents, solvents (aqueous and organic), as
well as products and waste products, obtained

144
from reaction 2 (Table 4.5) were weighed. This
information was used to construct a detailed
mass balance, given in Figure 4.1.
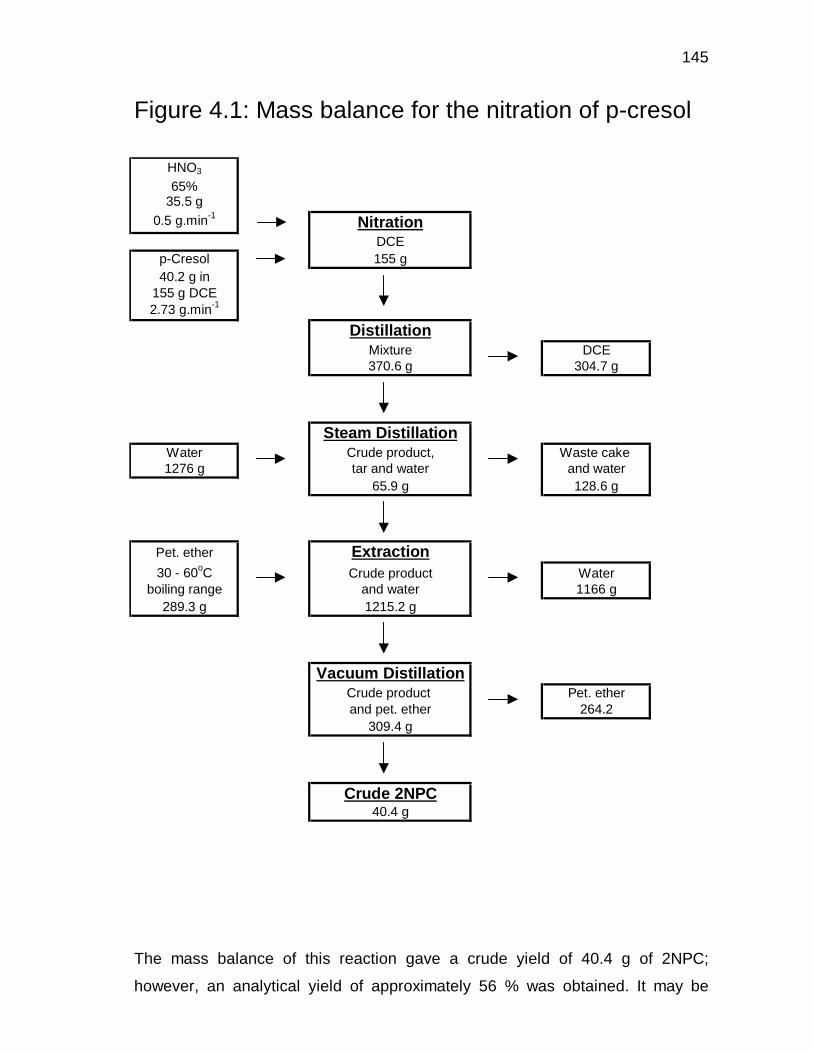
145
Figure 4.1: Mass balance for the nitration of p-cresol
The mass balance of this reaction gave a crude yield of 40.4 g of 2NPC;
however, an analytical yield of approximately 56 % was obtained. It may be
HNO3
65%35.5 g
0.5 g.min-1 NitrationDCE
p-Cresol 155 g40.2 g in
155 g DCE2.73 g.min-1
DistillationMixture DCE370.6 g 304.7 g
Steam DistillationWater Crude product, Waste cake 1276 g tar and water and water
65.9 g 128.6 g
Pet. ether Extraction30 - 60oC Crude product Water
boiling range and water 1166 g289.3 g 1215.2 g
Vacuum DistillationCrude product Pet. etherand pet. ether 264.2
309.4 g
Crude 2NPC40.4 g
146
concluded that the product still needs further purification. It does seem that the
isolation method (steam distillation) is efficient enough to remove most of the
2NPC that was produced in the reaction since the percentage recovery (isolated
yield/ analytical yield) was consistently higher than 75 %. Losses did however
occur when considering the system as a whole. Evaporation of solvents,
especially low boiling solvents such as petroleum ether, could account for some
of the material losses. Furthermore, small amounts of 2NPC are soluble in water,
and hence some of the material may have been lost in the extraction step.
Therefore, even though most of the reaction material seems to be accounted for,
some losses did occur which would have to be minimised even further if a
process such as this was ever to be carried out on a production scale.
4.4 CONCLUDING REMARKS
• The mono- and dinitration of p-cresol produced the expected products.
Nitration in 1,2-dicloroethane yielded very promising results (yields and
accountabilities higher than 90 %), whereas nitration in iso-propanol gave
very poor results, only 55 % conversion with 93 % nitric acid at 60oC. Higher
acid concentrations resulted in the formation of greater amounts of dinitrated
products. The mono- and dinitration reactions proceed as separate steps,
since no DNPC was observed in the mononitration under properly controlled
conditions.
• The substrate loading (m/v) was found to have great influence on the reaction
accountabilities. The substrate conversion decreased and the amount of
DNPC increased with an increase in the substrate loading, even when the A :
S was carefully controlled at 1 : 1. This means that stirring and slow addition
is very important in the nitration reaction to avoid the formation of local
excesses of acid. GC-MS analysis of the waste products revealed the
formation of a number of ether dimers of cresol and nitrocresol. These
147
products are probably the result of oxidation taking place in the reactor at the
same time as the nitration process.
• The nitration of p-cresol was scaled-up to facilitate the isolation and
purification of 2NPC. The reaction where nitric acid (18.3 g) was added to p-
cresol (19.6 g) in 1,2-dichloroethane gave a very low material balance and
isolated yield (approx. 37%) and analytical yield, while the purity of the
isolated product was found to be 99.9 %.
• Two further scale-up reactions were carried out, one with a final A : S ratio of
1 : 1 and the other where the A : S ratio was maintained at 1 : 1 throughout
the reaction. Results clearly showed that the accountability and yield
(analytical) were higher in the second case. This is thought to be the result of
better mixing and slower addition. A mass balance was constructed for the
second reaction through the separation of product, solvents and waste. This
also indicated that the isolation method is efficient for the separation of the
product. However, some losses did occur when considering the process as a
whole, and some material could ultimately not be accounted for.
148
CHAPTER 5
HEAT OF p-CRESOL NITRATION
5.1 INTRODUCTION
Reaction calorimetry is a relatively new technique
that is available to the modern process chemist. It
is a powerful tool for the determination of a
number of thermodynamic properties of batch
and semi-batch processes required for the scale-
up of chemical reactions. Organic processes
traditionally went through a number of stages
between the lab-scale and production scale,
before production plants could be erected. The
reason for this is that many properties of a
chemical reaction are often found to be scale-
dependent. The most important property that
needs to be dealt with effectively is the heat
generated by the chemical reaction. The
laboratory chemist can effectively deal with heat
generated in a lab-scale reaction by removing the
149
heating source and possibly adding ice to the
mixture. However, on a production facility,
cooling and heating systems need to be designed
for the removal/ supply of much larger amounts of
heat. For this, an accurate knowledge of the total
amount of heat generated, as well as the rate of
heat generation, is required.
Conventionally, the different stages in a process
scale-up included: initially small lab-scale
reactions with the production of a few grams of
product; this then was increased to kilogram-
scale in a process laboratory. The process
chemist carried out these steps. After this would
follow pilot-scale reactions where the problems
associated with production would first appear,
since use would be made of steam and chilled
water for heating and cooling, respectively. Pilot
reactors are typically between ten and 100 litres.
After this would follow the Com-Dev stage
(commercial development) where the problems
associated with heating and cooling are normally
150
even larger, and thus more representative of
those experienced on large production plants.
The scale in this case would be very close to
production plant-scale, and generally the same
types of reactors would be used. This stage was
normally carried out exclusively by chemical
engineers and gave them the very last chance to
ensure that the reaction system was safe and
could be carried out successfully on a production
scale plant. After this, once all the parties
involved with the development of a specific
process were satisfied that the system was safe
and cost effective, it was introduced to the final
stage, which was the actual production stage.
However, with the advent of reaction calorimetry,
it has become possible for a process chemist to
determine the energy characteristics at the lab-
scale stage. It is thus possible to shorten the pilot
trials for some processes and in some cases to
even eliminate them completely.67-70

151
Batch chemical reactions can be conveniently
studied in reaction calorimeters. These devices
are based on conventional jacketed laboratory
reactors, and can provide invaluable information
concerning the safety and operability of a
process. A typical reaction calorimeter is shown
in Figure 5.1, illustrating the fact that the system
is basically a computer-controlled pilot reactor
system, from which thermal data may be
obtained. Reaction calorimetry allows the heat
output rate, Qr, for a reaction to be determined
from a heat balance across the reactor wall, given
in Equation 5.1:
doseaccumLremr QQQQQ +++= Equation
5.1
where QL is the heat loss from the vessel, Qrem the
heat removed (or added) by the oil circulating
around the vessel jacket, Qaccum is the sensible
heat (if any) being accumulated by the reactants
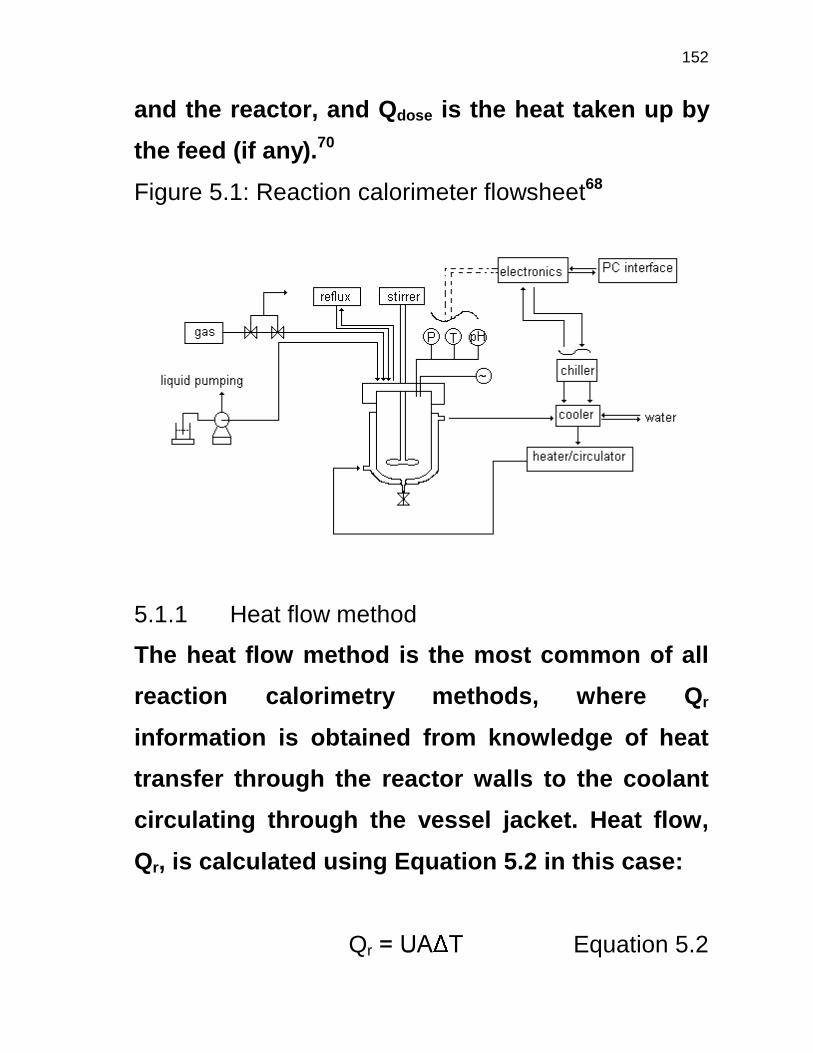
152
and the reactor, and Qdose is the heat taken up by
the feed (if any).70
Figure 5.1: Reaction calorimeter flowsheet68
5.1.1 Heat flow method
The heat flow method is the most common of all
reaction calorimetry methods, where Qr
information is obtained from knowledge of heat
transfer through the reactor walls to the coolant
circulating through the vessel jacket. Heat flow,
Qr, is calculated using Equation 5.2 in this case:
Qr� �8$ 7� Equation 5.2
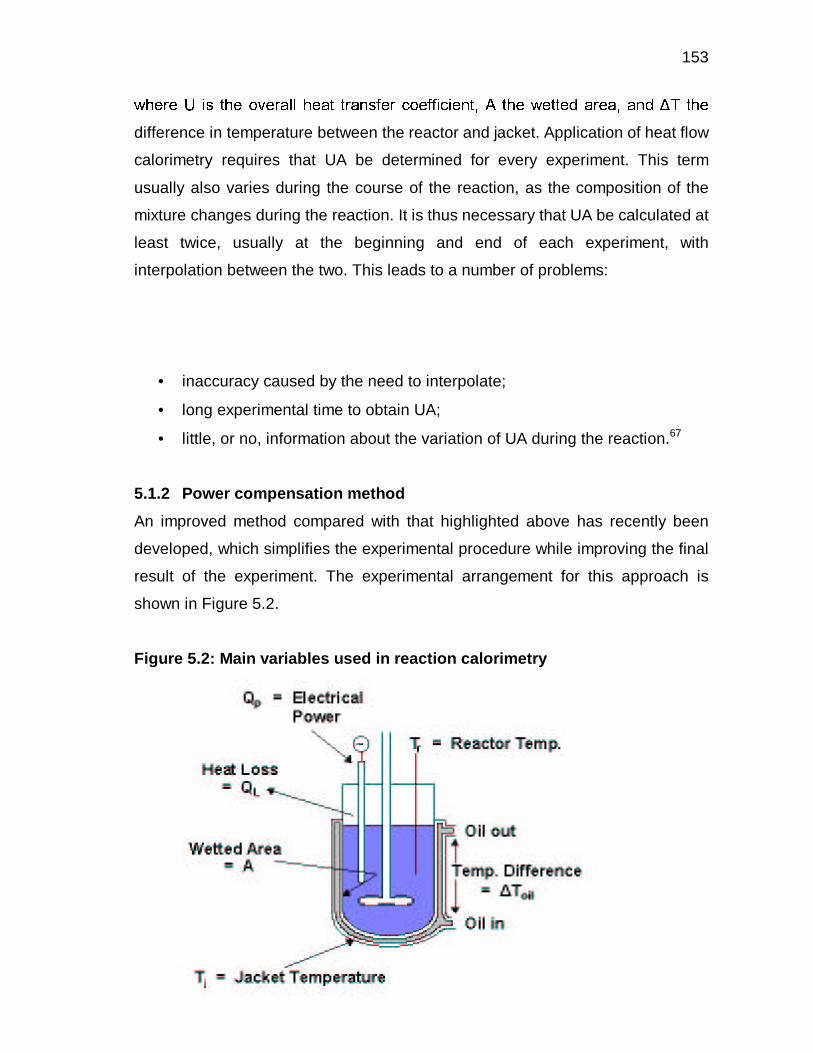
153
��������������� �!���#"%$&���('�)*)+���,'%�-�!��'�.���/����102"3��/4/5��0%����.&�76�89���%�:�;�%�4�<�3=>'����3'6�'�.%= ?������difference in temperature between the reactor and jacket. Application of heat flow
calorimetry requires that UA be determined for every experiment. This term
usually also varies during the course of the reaction, as the composition of the
mixture changes during the reaction. It is thus necessary that UA be calculated at
least twice, usually at the beginning and end of each experiment, with
interpolation between the two. This leads to a number of problems:
• inaccuracy caused by the need to interpolate;
• long experimental time to obtain UA;
• little, or no, information about the variation of UA during the reaction.67
5.1.2 Power compensation method
An improved method compared with that highlighted above has recently been
developed, which simplifies the experimental procedure while improving the final
result of the experiment. The experimental arrangement for this approach is
shown in Figure 5.2.
Figure 5.2: Main variables used in reaction calorimetry
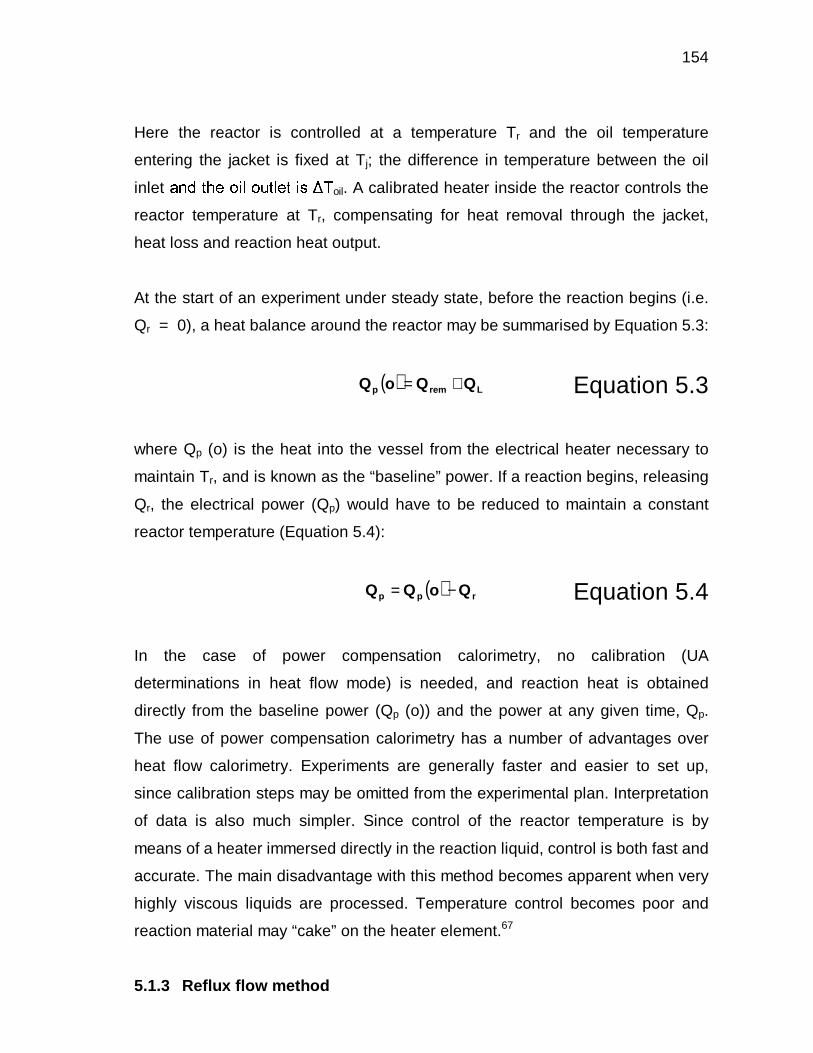
154
Here the reactor is controlled at a temperature Tr and the oil temperature
entering the jacket is fixed at Tj; the difference in temperature between the oil
inlet '�.�= �!���:"�@)&"�A&�B)��%�C��� ?oil. A calibrated heater inside the reactor controls the
reactor temperature at Tr, compensating for heat removal through the jacket,
heat loss and reaction heat output.
At the start of an experiment under steady state, before the reaction begins (i.e.
Qr = 0), a heat balance around the reactor may be summarised by Equation 5.3:
( ) Lremp QQoQ += Equation 5.3
where Qp (o) is the heat into the vessel from the electrical heater necessary to
maintain Tr, and is known as the “baseline” power. If a reaction begins, releasing
Qr, the electrical power (Qp) would have to be reduced to maintain a constant
reactor temperature (Equation 5.4):
( ) rpp QoQQ −= Equation 5.4
In the case of power compensation calorimetry, no calibration (UA
determinations in heat flow mode) is needed, and reaction heat is obtained
directly from the baseline power (Qp (o)) and the power at any given time, Qp.
The use of power compensation calorimetry has a number of advantages over
heat flow calorimetry. Experiments are generally faster and easier to set up,
since calibration steps may be omitted from the experimental plan. Interpretation
of data is also much simpler. Since control of the reactor temperature is by
means of a heater immersed directly in the reaction liquid, control is both fast and
accurate. The main disadvantage with this method becomes apparent when very
highly viscous liquids are processed. Temperature control becomes poor and
reaction material may “cake” on the heater element.67
5.1.3 Reflux flow method
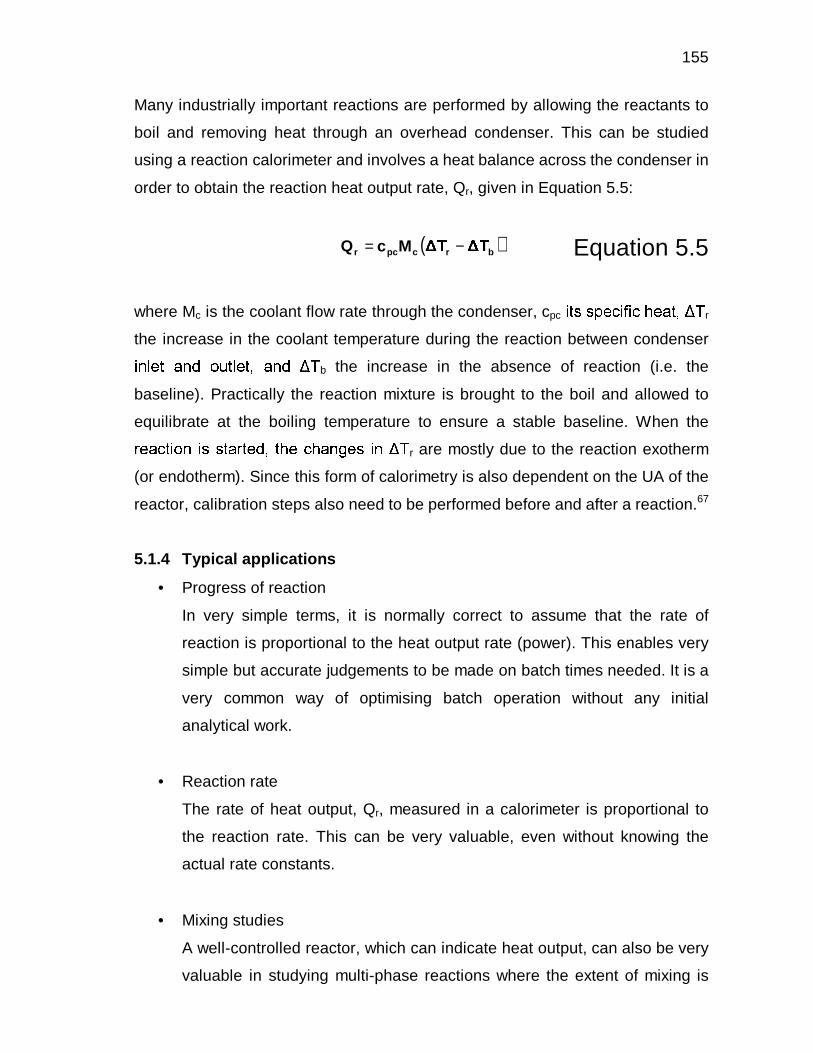
155
Many industrially important reactions are performed by allowing the reactants to
boil and removing heat through an overhead condenser. This can be studied
using a reaction calorimeter and involves a heat balance across the condenser in
order to obtain the reaction heat output rate, Qr, given in Equation 5.5:
( )brcpcr
DDMcQ −= Equation 5.5
where Mc is the coolant flow rate through the condenser, cpc� �<����E��30%� /F��0G���,'%�B6 ?
r
the increase in the coolant temperature during the reaction between condenser �H.�) �I�J'�.%=K"�A&�7)��%�B6L'�.�= ?
b the increase in the absence of reaction (i.e. the
baseline). Practically the reaction mixture is brought to the boil and allowed to
equilibrate at the boiling temperature to ensure a stable baseline. When the �(�,'30��B��"�.#��� ���<'��M�M�3=6�!���N0���'�.%O3�3�P�H. ?
r are mostly due to the reaction exotherm
(or endotherm). Since this form of calorimetry is also dependent on the UA of the
reactor, calibration steps also need to be performed before and after a reaction.67
5.1.4 Typical applications
• Progress of reaction
In very simple terms, it is normally correct to assume that the rate of
reaction is proportional to the heat output rate (power). This enables very
simple but accurate judgements to be made on batch times needed. It is a
very common way of optimising batch operation without any initial
analytical work.
• Reaction rate
The rate of heat output, Qr, measured in a calorimeter is proportional to
the reaction rate. This can be very valuable, even without knowing the
actual rate constants.
• Mixing studies
A well-controlled reactor, which can indicate heat output, can also be very
valuable in studying multi-phase reactions where the extent of mixing is
156
crucial. Induction periods can be identified with these instruments, since
the reaction onset can be identified from the power output.
• Process safety
Knowing the heat output rate, Qr, the cooling duty for the scaled-up
process can be directly specified. This is very important design
information, but also has a significant bearing on the safety of the system.
The reaction enthalpy may be used to obtain the theoretical adiabatic
temperature rise, ?
ad. This is a useful parameter, although not entirely
sufficient to define the extent of the hazard. A knowledge of reactant
accumulation is a much more valuable parameter. Accumulation is
essentially a direct result of slow initial reaction rates. As more reactants
are dosed into the reactor, a build-up of this unreacted material occurs.
There is thus also an accumulation of potential energy in the reactor.
When the reaction is set off, large amounts of energy is released, and
even if fresh feed to the reactor is stopped, the danger cannot be averted.
This leads to, what is known as, a runaway reaction.67
5.2 OBJECTIVES
The objectives for this chapter may be summarised as follows:
• The use of the Simular Reaction calorimeter to determine the heat evolved in
a nitration reaction.
• To investigate the influence of the substrate loading in a scaled-up reaction.
• The use of calorimetry to investigate the influence of catalysts on the heat of
reaction as well as the mechanism of nitration.
• To determine the effect of nitric acid concentration on the heat of reaction.
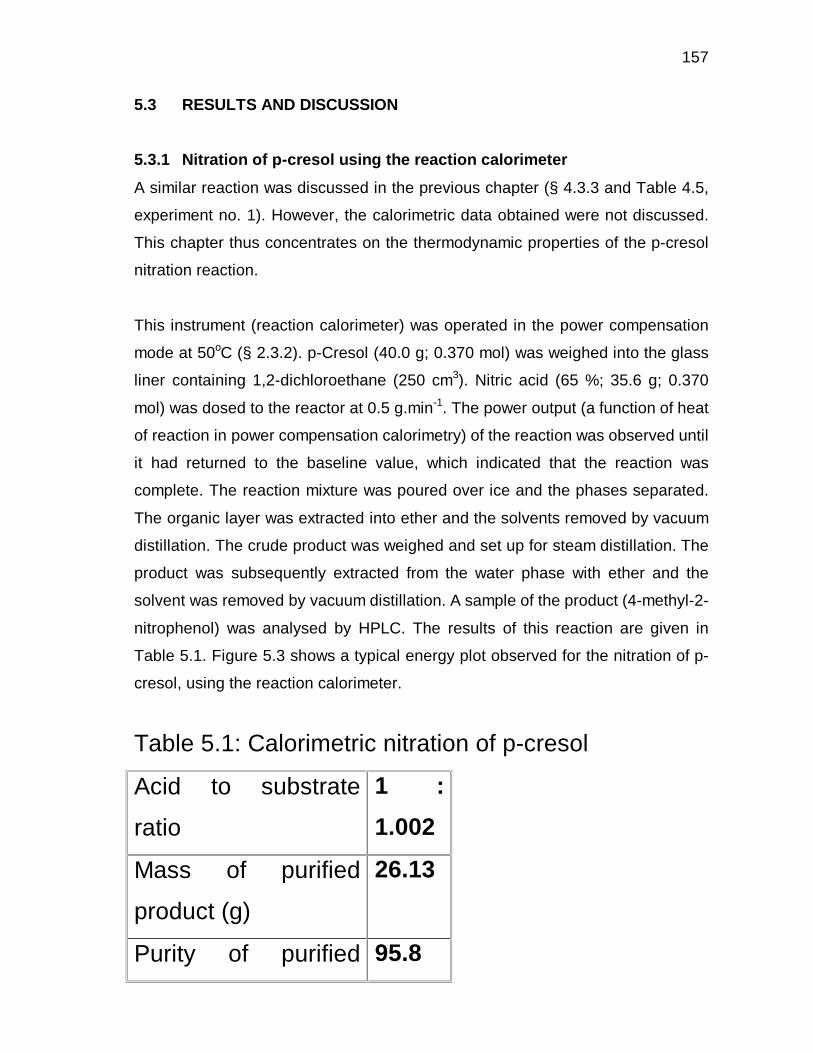
157
5.3 RESULTS AND DISCUSSION
5.3.1 Nitration of p-cresol using the reaction calorimeter
A similar reaction was discussed in the previous chapter (§ 4.3.3 and Table 4.5,
experiment no. 1). However, the calorimetric data obtained were not discussed.
This chapter thus concentrates on the thermodynamic properties of the p-cresol
nitration reaction.
This instrument (reaction calorimeter) was operated in the power compensation
mode at 50oC (§ 2.3.2). p-Cresol (40.0 g; 0.370 mol) was weighed into the glass
liner containing 1,2-dichloroethane (250 cm3). Nitric acid (65 %; 35.6 g; 0.370
mol) was dosed to the reactor at 0.5 g.min-1. The power output (a function of heat
of reaction in power compensation calorimetry) of the reaction was observed until
it had returned to the baseline value, which indicated that the reaction was
complete. The reaction mixture was poured over ice and the phases separated.
The organic layer was extracted into ether and the solvents removed by vacuum
distillation. The crude product was weighed and set up for steam distillation. The
product was subsequently extracted from the water phase with ether and the
solvent was removed by vacuum distillation. A sample of the product (4-methyl-2-
nitrophenol) was analysed by HPLC. The results of this reaction are given in
Table 5.1. Figure 5.3 shows a typical energy plot observed for the nitration of p-
cresol, using the reaction calorimeter.
Table 5.1: Calorimetric nitration of p-cresol
Acid to substrate
ratio
1 :
1.002
Mass of purified
product (g)
26.13
Purity of purified 95.8
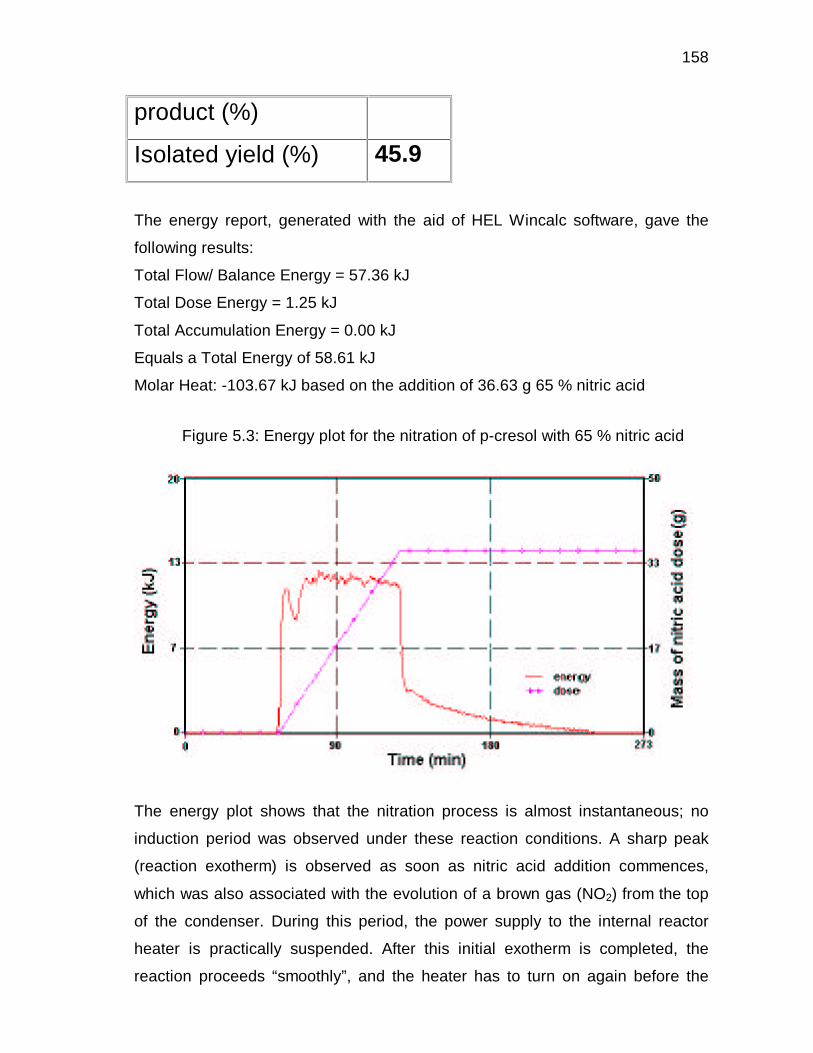
158
product (%)
Isolated yield (%) 45.9
The energy report, generated with the aid of HEL Wincalc software, gave the
following results:
Total Flow/ Balance Energy = 57.36 kJ
Total Dose Energy = 1.25 kJ
Total Accumulation Energy = 0.00 kJ
Equals a Total Energy of 58.61 kJ
Molar Heat: -103.67 kJ based on the addition of 36.63 g 65 % nitric acid
Figure 5.3: Energy plot for the nitration of p-cresol with 65 % nitric acid
The energy plot shows that the nitration process is almost instantaneous; no
induction period was observed under these reaction conditions. A sharp peak
(reaction exotherm) is observed as soon as nitric acid addition commences,
which was also associated with the evolution of a brown gas (NO2) from the top
of the condenser. During this period, the power supply to the internal reactor
heater is practically suspended. After this initial exotherm is completed, the
reaction proceeds “smoothly”, and the heater has to turn on again before the
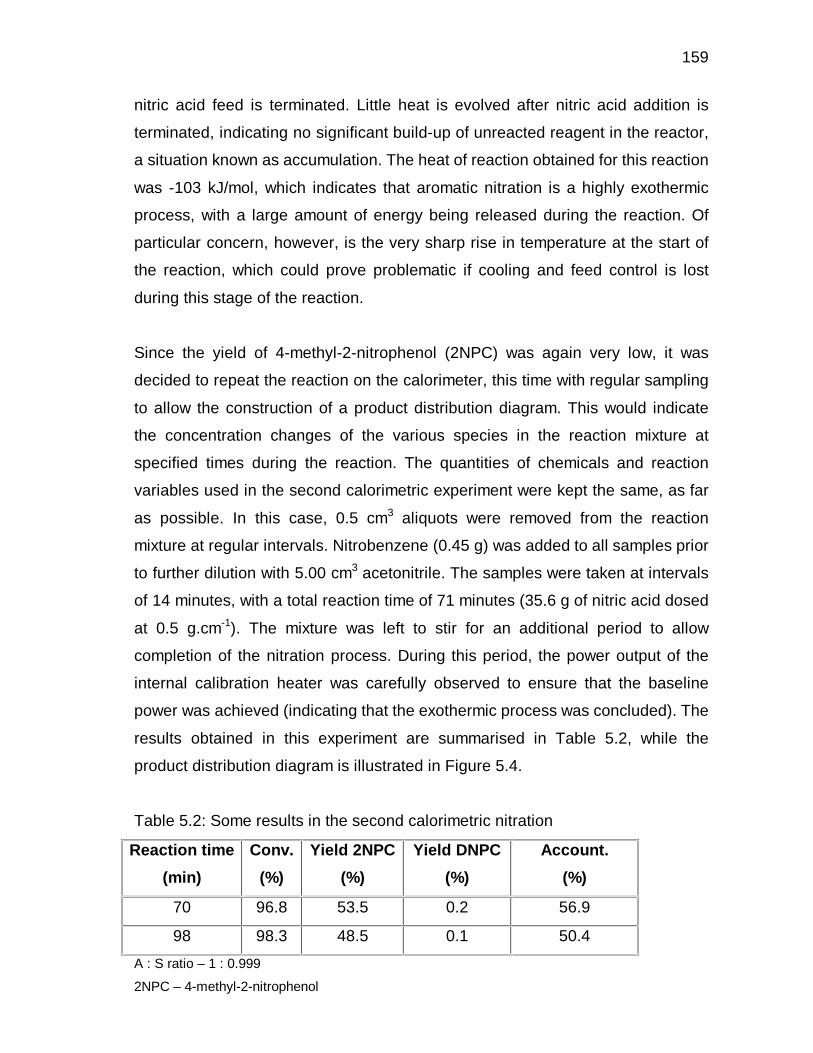
159
nitric acid feed is terminated. Little heat is evolved after nitric acid addition is
terminated, indicating no significant build-up of unreacted reagent in the reactor,
a situation known as accumulation. The heat of reaction obtained for this reaction
was -103 kJ/mol, which indicates that aromatic nitration is a highly exothermic
process, with a large amount of energy being released during the reaction. Of
particular concern, however, is the very sharp rise in temperature at the start of
the reaction, which could prove problematic if cooling and feed control is lost
during this stage of the reaction.
Since the yield of 4-methyl-2-nitrophenol (2NPC) was again very low, it was
decided to repeat the reaction on the calorimeter, this time with regular sampling
to allow the construction of a product distribution diagram. This would indicate
the concentration changes of the various species in the reaction mixture at
specified times during the reaction. The quantities of chemicals and reaction
variables used in the second calorimetric experiment were kept the same, as far
as possible. In this case, 0.5 cm3 aliquots were removed from the reaction
mixture at regular intervals. Nitrobenzene (0.45 g) was added to all samples prior
to further dilution with 5.00 cm3 acetonitrile. The samples were taken at intervals
of 14 minutes, with a total reaction time of 71 minutes (35.6 g of nitric acid dosed
at 0.5 g.cm-1). The mixture was left to stir for an additional period to allow
completion of the nitration process. During this period, the power output of the
internal calibration heater was carefully observed to ensure that the baseline
power was achieved (indicating that the exothermic process was concluded). The
results obtained in this experiment are summarised in Table 5.2, while the
product distribution diagram is illustrated in Figure 5.4.
Table 5.2: Some results in the second calorimetric nitration
Reaction time
(min)
Conv.
(%)
Yield 2NPC
(%)
Yield DNPC
(%)
Account.
(%)
70 96.8 53.5 0.2 56.9
98 98.3 48.5 0.1 50.4
A : S ratio – 1 : 0.999
2NPC – 4-methyl-2-nitrophenol

160
DNPC – 2,6-dinitro-p-cresol
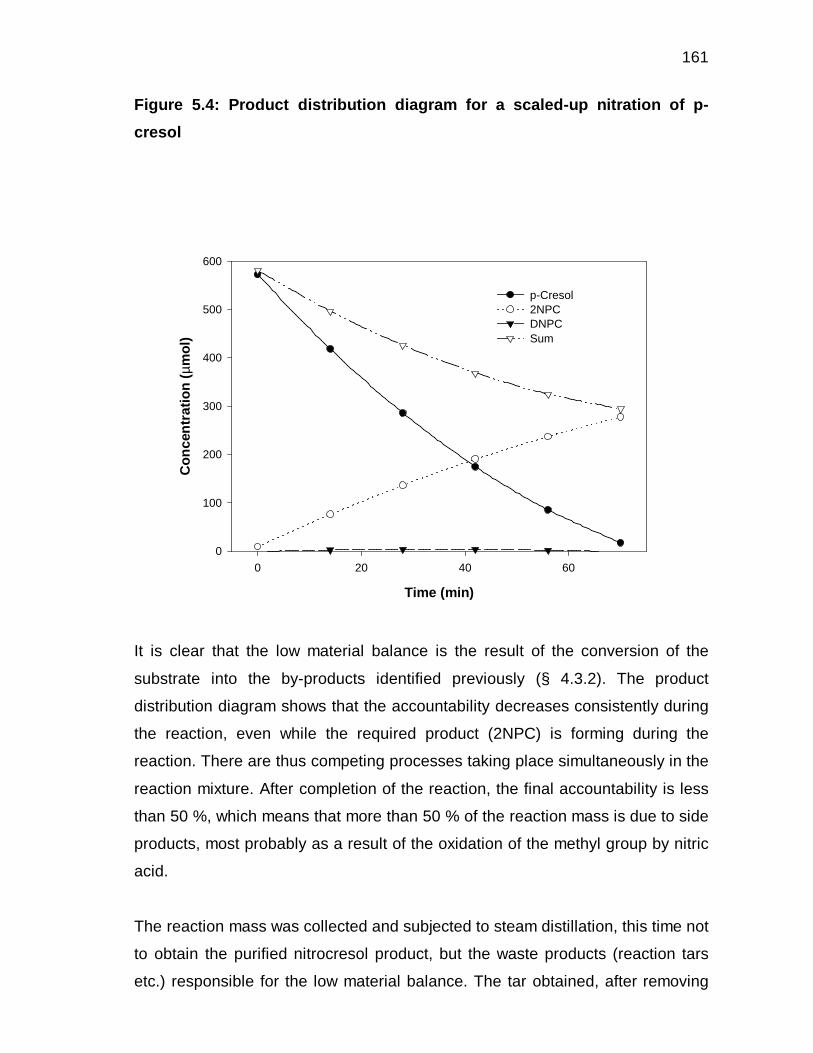
161
Figure 5.4: Product distribution diagram for a scaled-up nitration of p-
cresol
It is clear that the low material balance is the result of the conversion of the
substrate into the by-products identified previously (§ 4.3.2). The product
distribution diagram shows that the accountability decreases consistently during
the reaction, even while the required product (2NPC) is forming during the
reaction. There are thus competing processes taking place simultaneously in the
reaction mixture. After completion of the reaction, the final accountability is less
than 50 %, which means that more than 50 % of the reaction mass is due to side
products, most probably as a result of the oxidation of the methyl group by nitric
acid.
The reaction mass was collected and subjected to steam distillation, this time not
to obtain the purified nitrocresol product, but the waste products (reaction tars
etc.) responsible for the low material balance. The tar obtained, after removing
Time (min)
0 20 40 60
Co
nce
ntr
atio
n (
µmo
l)
0
100
200
300
400
500
600
p-Cresol2NPCDNPCSum
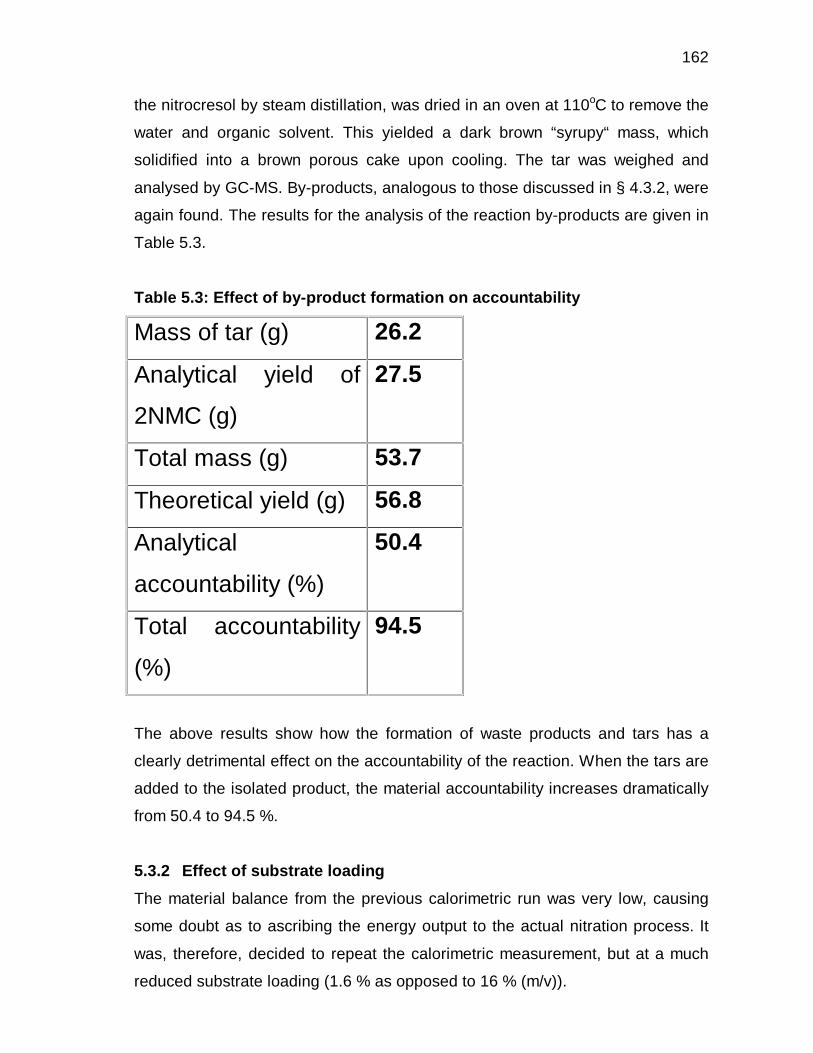
162
the nitrocresol by steam distillation, was dried in an oven at 110oC to remove the
water and organic solvent. This yielded a dark brown “syrupy“ mass, which
solidified into a brown porous cake upon cooling. The tar was weighed and
analysed by GC-MS. By-products, analogous to those discussed in § 4.3.2, were
again found. The results for the analysis of the reaction by-products are given in
Table 5.3.
Table 5.3: Effect of by-product formation on accountability
Mass of tar (g) 26.2
Analytical yield of
2NMC (g)
27.5
Total mass (g) 53.7
Theoretical yield (g) 56.8
Analytical
accountability (%)
50.4
Total accountability
(%)
94.5
The above results show how the formation of waste products and tars has a
clearly detrimental effect on the accountability of the reaction. When the tars are
added to the isolated product, the material accountability increases dramatically
from 50.4 to 94.5 %.
5.3.2 Effect of substrate loading
The material balance from the previous calorimetric run was very low, causing
some doubt as to ascribing the energy output to the actual nitration process. It
was, therefore, decided to repeat the calorimetric measurement, but at a much
reduced substrate loading (1.6 % as opposed to 16 % (m/v)).
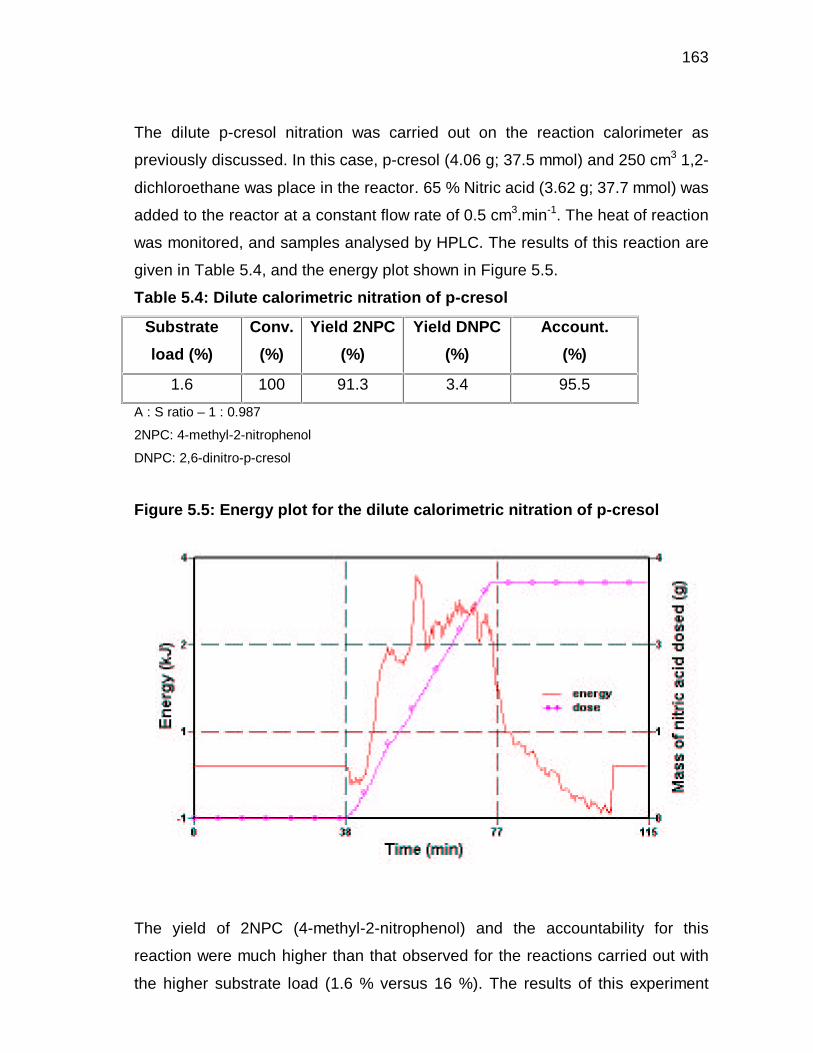
163
The dilute p-cresol nitration was carried out on the reaction calorimeter as
previously discussed. In this case, p-cresol (4.06 g; 37.5 mmol) and 250 cm3 1,2-
dichloroethane was place in the reactor. 65 % Nitric acid (3.62 g; 37.7 mmol) was
added to the reactor at a constant flow rate of 0.5 cm3.min-1. The heat of reaction
was monitored, and samples analysed by HPLC. The results of this reaction are
given in Table 5.4, and the energy plot shown in Figure 5.5.
Table 5.4: Dilute calorimetric nitration of p-cresol
Substrate
load (%)
Conv.
(%)
Yield 2NPC
(%)
Yield DNPC
(%)
Account.
(%)
1.6 100 91.3 3.4 95.5
A : S ratio – 1 : 0.987
2NPC: 4-methyl-2-nitrophenol
DNPC: 2,6-dinitro-p-cresol
Figure 5.5: Energy plot for the dilute calorimetric nitration of p-cresol
The yield of 2NPC (4-methyl-2-nitrophenol) and the accountability for this
reaction were much higher than that observed for the reactions carried out with
the higher substrate load (1.6 % versus 16 %). The results of this experiment
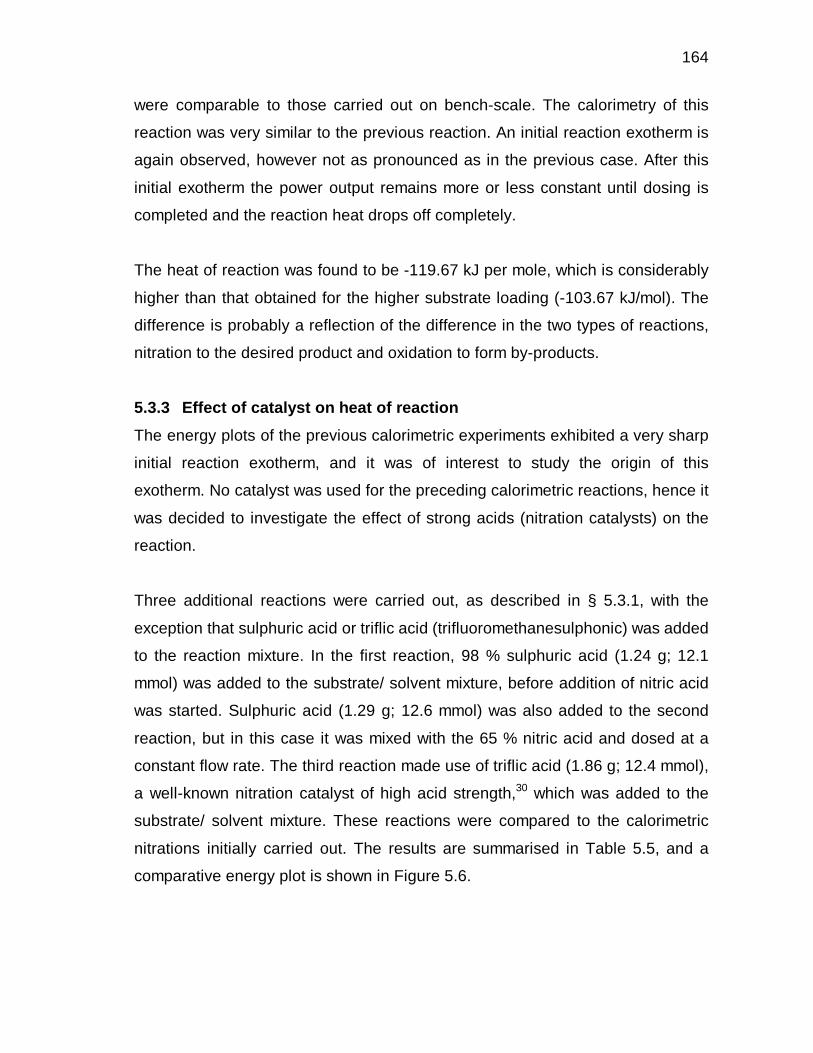
164
were comparable to those carried out on bench-scale. The calorimetry of this
reaction was very similar to the previous reaction. An initial reaction exotherm is
again observed, however not as pronounced as in the previous case. After this
initial exotherm the power output remains more or less constant until dosing is
completed and the reaction heat drops off completely.
The heat of reaction was found to be -119.67 kJ per mole, which is considerably
higher than that obtained for the higher substrate loading (-103.67 kJ/mol). The
difference is probably a reflection of the difference in the two types of reactions,
nitration to the desired product and oxidation to form by-products.
5.3.3 Effect of catalyst on heat of reaction
The energy plots of the previous calorimetric experiments exhibited a very sharp
initial reaction exotherm, and it was of interest to study the origin of this
exotherm. No catalyst was used for the preceding calorimetric reactions, hence it
was decided to investigate the effect of strong acids (nitration catalysts) on the
reaction.
Three additional reactions were carried out, as described in § 5.3.1, with the
exception that sulphuric acid or triflic acid (trifluoromethanesulphonic) was added
to the reaction mixture. In the first reaction, 98 % sulphuric acid (1.24 g; 12.1
mmol) was added to the substrate/ solvent mixture, before addition of nitric acid
was started. Sulphuric acid (1.29 g; 12.6 mmol) was also added to the second
reaction, but in this case it was mixed with the 65 % nitric acid and dosed at a
constant flow rate. The third reaction made use of triflic acid (1.86 g; 12.4 mmol),
a well-known nitration catalyst of high acid strength,30 which was added to the
substrate/ solvent mixture. These reactions were compared to the calorimetric
nitrations initially carried out. The results are summarised in Table 5.5, and a
comparative energy plot is shown in Figure 5.6.
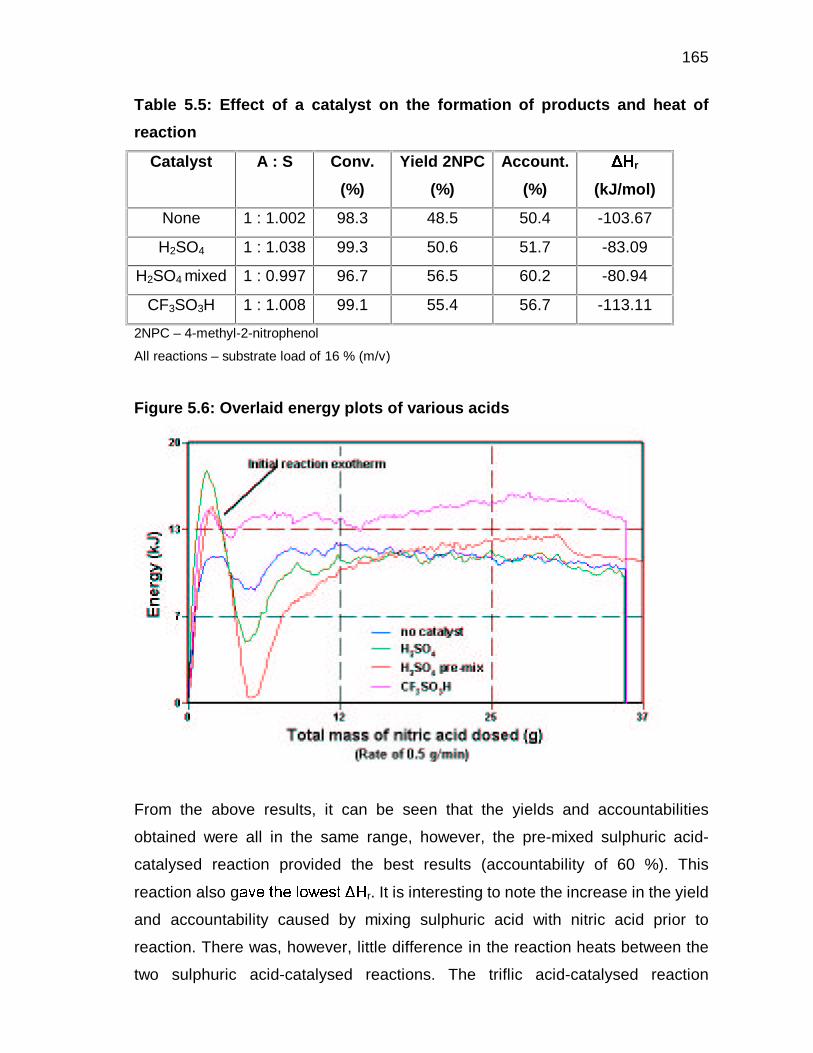
165
Table 5.5: Effect of a catalyst on the formation of products and heat of
reaction
Catalyst A : S Conv.
(%)
Yield 2NPC
(%)
Account.
(%)
Qr
(kJ/mol)
None 1 : 1.002 98.3 48.5 50.4 -103.67
H2SO4 1 : 1.038 99.3 50.6 51.7 -83.09
H2SO4 mixed 1 : 0.997 96.7 56.5 60.2 -80.94
CF3SO3H 1 : 1.008 99.1 55.4 56.7 -113.11
2NPC – 4-methyl-2-nitrophenol
All reactions – substrate load of 16 % (m/v)
Figure 5.6: Overlaid energy plots of various acids
From the above results, it can be seen that the yields and accountabilities
obtained were all in the same range, however, the pre-mixed sulphuric acid-
catalysed reaction provided the best results (accountability of 60 %). This
reaction also g '%$&�R���%�S)�"2�;�3��� T r. It is interesting to note the increase in the yield
and accountability caused by mixing sulphuric acid with nitric acid prior to
reaction. There was, however, little difference in the reaction heats between the
two sulphuric acid-catalysed reactions. The triflic acid-catalysed reaction

166
produced the highest heat of reaction, which compares favourably with the
energy obtained during the nitration when using a low substrate loading. Triflic
acid is known to catalyse electrophilic aromatic substitution reactions, such as
aromatic nitration. These results therefore seem to confirm previous suggestions
that a higher reaction heat is associated with nitration as compared to oxidation.
While sulphuric acid is known to be a strong oxidant and also to catalyse
oxidation processes,71 triflic acid is not an oxidant.
5.3.4 Effect of nitric acid concentration on the heat of reaction
In another calorimetry experiment, the concentration of nitric acid was increased
to 93 %. It was also important to determine the effect that the acid concentration
would have on the yield and accountability. p-Cresol (40.0 g; 370 mmol) was
added to 250 cm3 1,2-dichloroethane and placed in the reactor. Fuming nitric
acid (25.6 g; 361 mmol) was dosed to the reactor at a constant rate of 0.5 g.min-1
over approximately 51 minutes. HPLC analysis of reaction samples gave the
results summarised in Table 5.6. The energy plots for the varying acid
concentrations are compared by means of an overlay plot in Figure 5.7.
Table 5.6: Effect of acid concentration on the reaction results
[HNO3]
(%)
A : S Conv.
(%)
Yield 2NPC
(%)
Account.
(%)
Qr
(kJ/mol)
65 1 : 1.002 98.3 48.5 50.4 -103.67
93 1 : 1.025 96.7 70.3 76.9 -139.94
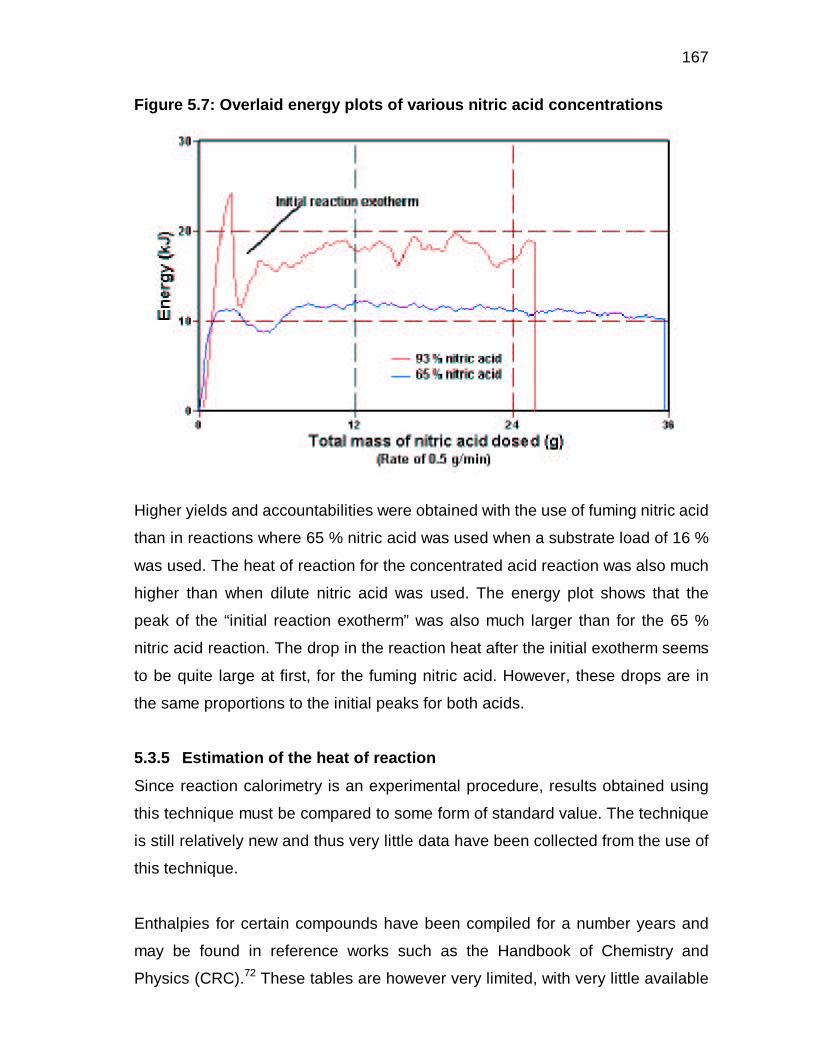
167
Figure 5.7: Overlaid energy plots of various nitric acid concentrations
Higher yields and accountabilities were obtained with the use of fuming nitric acid
than in reactions where 65 % nitric acid was used when a substrate load of 16 %
was used. The heat of reaction for the concentrated acid reaction was also much
higher than when dilute nitric acid was used. The energy plot shows that the
peak of the “initial reaction exotherm” was also much larger than for the 65 %
nitric acid reaction. The drop in the reaction heat after the initial exotherm seems
to be quite large at first, for the fuming nitric acid. However, these drops are in
the same proportions to the initial peaks for both acids.
5.3.5 Estimation of the heat of reaction
Since reaction calorimetry is an experimental procedure, results obtained using
this technique must be compared to some form of standard value. The technique
is still relatively new and thus very little data have been collected from the use of
this technique.
Enthalpies for certain compounds have been compiled for a number years and
may be found in reference works such as the Handbook of Chemistry and
Physics (CRC).72 These tables are however very limited, with very little available
168
data on complicated molecules. It has thus necessitated the use of an estimation
technique.73
Heat of reaction (enthalpy) can be determined from the enthalpies of formation, T
f, of the compounds taking part in the reaction. Thus, for the reaction shown in
Equation 5.6, the reaction enthalpy Hr is given by Equation 5.7, with the general
form shown in Equation 5.8:
UVWX
+→+ Equation
5.6
fBfAfDfCr
YYYYY−−+= Equation
5.7
∑= fiir
Zv
Z Equation
5.8
where vi is the stoichiometric coefficient of compound i (according to the rules of
chemical thermodynamics, vi is positive for products and negative for educts), '�.�= T
fi the enthalpy of formation of compound i.
Chemical reactions can be considered as processes in which molecular bonds
are broken and others are formed. The thermodynamic functions for a chemical
reaction can therefore be considered as the sum of the contributions of those
chemical bonds which were altered by the reaction. In a similar approach, the
structural groups of the reacting molecules can be used as the basis for
estimating thermodynamic reaction quantities, in particular those of organic
substances. A number of these group contribution methods have been proposed
169
for the estimation of standard enthalpies, Gibbs formation energies and standard
entropies.
In the Joback73 [ �%�!��"3=�6 T of298 is calculated according to Equation 5.9:
Hiiof298 Is68.29\ ∑+= Equation
5.9
where si is the number of structural groups of type I and IHi are the increments of
structural groups I for the enthalpy of formation. It is evident from the above
equation that the enthalpy of formation can only be directly calculated for a
temperature of 298.15 K. In order to calculate these quantities for other
temperatures, the molar heat capacities, cop, have to be evaluated as a function
of temperature by means of Equation 5.10.
dT]^^ T
298.15
opr
or298
orT ∫+=
Equation
5.10
Deviations of standard entalpies of formation and Gibbs energies calculated
using this method are mostly below 10 kJ/mol, but a number of cases have been
found where large differences were observed. With methods such as the one
proposed by Benson,74,75 errors are somewhat smaller because it allows larger
structural differentiation. These methods are however rather tedious in their
application and will not be further discussed.
By making use of Equation 5.9, the enthalpies of formation for p-cresol and 4-
methyl-2-nitrophenol were estimated using Joback’s increments, and found to be
-128.59 and -150.82, respectively. Joback’s increments are shown in Table 5.7.
The heats of formation of aqueous nitric acid and water were found in the CRC.72
Equation 5.8 was then used to calculate the heat of reaction (298 K) of the
nitration of p-cresol. This value was found to be -100.75 kJ/mol, but could,

170
however, not be directly compared with the experimentally determined value
since the reactions were carried out at 50oC. The estimated heat of reaction, at
298 K, thus had to be evaluated at 323 K. Equation 5.10 was used to calculate T o
rT at 50o _ 6`3A��/F�H�����+����� 0 opr had to be determined. This is essentially a heat
balance of the heat capacities of the species taking part in the reaction, and may
be calculated using Equation 5.11.
∑= piipr cva Equation
5.11
The same problem was experienced with the availability of heat capacity data, as
was experienced with the formation enthalpies of nitrocresol etc. This value had
to be estimated, and use was made of Joback’s group contribution method for
the estimation of calorific properties.73 This necessitated the use of Equation
5.12:
3r
7dj
2r
4cj
r
bj
r
ajop
T102.06IsT103.91Is
T0.210Is37.93Isc
×++
×++
++
−=
∑∑
∑∑
−−
Equation
5.12
where sj is the number of the group j and the increments Ia, Ib, Ic and Id, are
component-specific parameters and are tabulated for various groups. The
average error in cop is usually less than 2 %.73 Table 5.7 gives the Joback
increments used for this calculation.
bdc�e�fhgji�kml�nIoqprec3s�t�uwv xzyqs�{5g�|Sg�y3}7v�~�pr{�}��qgLg%v3}�x4|�c%}�xhprySp�~ Qr and co
p
Group si,j IH Ia Ib Ic Id
non ring
–CH3
1
-76.45
19.5
-8.08 x 10⁻³
1.53 x 10⁻⁴
-9.67 x 10⁻⁸

171
ring
=CH–
=C<
3
3
2.09
46.43
-2.14
-8.25
5.74 x 10⁻²
0.101
-1.64 x 10⁻⁶
-1.42 x 10⁻⁴
-1.59 x 10⁻⁸
6.78 x 10⁻⁸
oxygen
–OH (phenol)
1
-221.65
-2.81
0.111
-1.16 x 10⁻⁴
4.94 x 10⁻⁸
nitrogen
–NO2
1
-66.57
25.9
-3.74 x 10⁻³
1.29 x 10⁻⁴
-8.88 x 10⁻⁸
The values for cop298 and � o
pr were found to be 154.96 J.mol-1.K-1 and -30.21
J.mol-1.K-1 �%���3���%� ���B� � �� �3� � r323, calculated according to Equation 5.10, was found
to be -101.51 kJ/mol.
This final result compared very well with the experimental values obtained on the
reaction calorimeter. It should, however, be noted that the values obtained by
calorimetry consist of a combination of reaction heats, whereas the calculated
heats are for the nitration reaction only.
5.4 CONCLUDING REMARKS
• In the first calorimetric nitration, an isolated yield of 45.9 % was obtained. A
heat of reaction of -103.67 kJ/mol was obtained for the nitration of p-cresol
with 65 % nitric acid in a 1 : 1 acid to substrate ratio, in the absence of
catalyst, with 1,2-dichloroethane as solvent.
• The reaction was repeated on the calorimeter, this time with sampling to
facilitate the construction of a product distribution diagram. The product
distribution showed that the accountability was approximately 50 %. The
reaction mass was collected and the waste separated from the product. The
waste was dried and weighed and the mass added to the mass of product
(calculated from the analytical yield). This increased the accountability of the
reaction to 94.5 % of the theoretical yield. The side products were identified
172
by GC-MS analysis and found to consist of dimers of p-cresol and nitro-p-
cresol.
• The calorimetry was repeated with the substrate load of only 10 % of the
previous scaled-up reactions (1.6 % substrate load). Analysis of this mixture
showed an increase in the yield of 2NPC and the accountability to 91.3 and
95.5 %, respectively. The decreased substrate load was thus responsible for
an associated increase in both yield and accountability. The heat of reaction
was much higher for this reaction, but this could be attributed to the volume
differences as well as the composition of the reaction mixture and thus its
heat characteristics.
• Sulphuric acid or triflic acid was added to the reaction mixture to ascertain its
the effect on a region of the energy plot, called the “initial reaction exotherm”. �
r values for sulphuric acid were much lower than those of triflic acid and
neat reaction mixtures. Triflic acid had the highest heat of reaction
(approximately -114 kJ/mol). The energy plot showed a very different profile
for triflic acid; very little NO2 gas was evolved in this reaction. All these factors
seem to indicate that an alternative mechanism was operative in the presence
of triflic acid. When sulphuric acid was pre-mixed with nitric acid, the lowest �
r was obtained while it gave the highest yield and accountability. Again the
material balance was very low when a substrate load of 16 % was used.
• A reaction was carried out with 93 % nitric acid and no catalyst to determine
the effect on the accountability and product yield. The heat of reaction in this
case was found to be -139.94 kJ/mol. The yield of 2NPC and accountability
were found to be 70.3 and 76.9 %, respectively.
• The heat of reaction for the nitration of p-cresol at 50oC was determined by
estimating the formation enthalpy and molar heat capacity of 4-methyl-2-
nitrophenol. These values were found to be -150.82 kJ/mol and 154.96
J.mol-1.K-1. Integration of the change in heat capacity with respect to

173
temperature gave the heat of reaction for the nitration of p-cresol of -101.51
kJ/mol. This result was in agreement with experimental values. However, this
value can only be estimated for the nitration process alone, and does not give
any information concerning the p-cresol oxidation.
174
CHAPTER 6
SUMMARY AND CONCLUDING REMARKS
The nitration of m- and p-cresol under mild reaction conditions was investigated
by means of the following steps, namely the:
Evaluation or development of nitration methods having a favourable influence on
the regio-selectivity in the nitration of m-cresol, with the goal being the
achievement of high ratios of para- to ortho-products.
Successful application of said methods to the nitration of p-cresol, with eventual
scale-up of the reaction system and assessment of certain process
efficiency criteria.
Application of calorimetry for the evaluation of the heat of nitration of p-cresol and
the effect of certain reaction parameters on the heat evolved.
6.1 NITRATION OF m-CRESOL
• Yttrium(III)triflate was used as catalyst in the nitration of m-cresol at mild to
low nitric acid concentrations at temperatures between 0 and 60oC. It was
shown that Y(TFA)3 catalysed the reaction, giving good yields and
accountabilities; however, little difference was observed in the isomer
distribution.
• Use was made of an experimental design to evaluate reaction parameters
such as reaction temperature, acid concentration and the acid to substrate
ratio. It was found that the A : S ratio was significant for all of the design
responses. The derived model indicated that decreased temperatures and
acid concentrations did increase the selectivity to 4NMC and the overall
accountability.
175
• The use of metal supported clays as nitrating agents as well as the use of a
mixture of nitric and sulphuric acid was applied to the nitration of m-cresol. Of
the various methods, only the mixed acid system gave results comparable to
those obtained in dichloroethane with dilute nitric acid. This method gave a
high apparent preference for 4NMC, with almost a complete absence of the
formation of 2-methyl-1,4-benzoquinone.
• A different mechanism to that reported was proposed for the nitration of
activated aromatic substrates with dilute acid, which could better account for
the formation of 2-methyl-1,4-benzoquinone. This mechanism is thought to
proceed via nitrosation, formation of the monoxime and subsequent
hydrolysis to the benzoquinone.
• Nitration via nitrosation is known to have a high preference for para-
substitution. However, this procedure could not be successfully applied (in
terms of conversions and yields), while a high p : o ratio was obtained.
6.2 NITRATION OF p-CRESOL
• p-Cresol was nitrated in 1,2-dichlorethane and iso-propanol with mild and
high acid concentrations (65 and 93 %, respectively). Reactions in
dichloroethane generally gave high yields and accountabilities. Reactions with
high acid concentrations gave a higher proportion of dinitrated products.
• Substrate loading was found to be the single most important factor,
influencing the yield of 2NPC and the accountability significantly. By carefully
controlling the A : S ratio, together with high stirring rates and slow addition
rates, the formation of products could be controlled.
176
• Side products were identified by GC-MS and proposed to be the result of the
oxidation of p-cresol to form the quinomethide intermediate which then
reacted with substrate or product.
• Scale-up of the reaction showed that the isolation method was relatively
successful as a means of separating and purifying the product (2NPC). A
mass balance was carried out on one of the reactions. Some material losses
did occur; however, the total process accountability was acceptable.
6.3 HEAT OF p-CRESOL NITRATION
• Calorimetry was used to evaluate the heat evolved during the nitration
reaction. Nitration of p-cresol in dichloroethane with 65 % nitric acid was
found to be a highly exothermic process with heat of -103.67 kJ/mol being
released.
• Waste generated by the scaled-up nitration process was isolated and added
to the product yield. This increased the reaction accountability significantly
and was in good agreement with the trends observed from the product
distribution diagram.
• Substrate loading was found to also have an impact on the heat evolved
during the nitration process.
• Nitration with sulphuric acid as catalyst gave a heat of reaction much lower
than that obtained in neat nitration mixtures. Triflic acid gave the highest heat
of reaction. This was attributed to the fact that sulphuric acid also promoted
oxidation processes which released less heat. Triflic acid catalyses nitration
only, releasing more heat than neat reaction mixtures.

177
• The heat of reaction for the nitration of p-cresol was estimated, and this value
was found to compare well with those experimentally obtained. These
theoretical values, however, only describe the nitration process whereas the
experimentally obtained values were also influenced by side reactions, such
as the proposed oxidation process.
This work has shown that the direct nitration of cresol may successfully be
carried out with dilute nitric acid in the absence of any catalyst. The manipulation
of reaction variables to increase the p : o ratio was, however, not as easily
carried out. However, until nitrosation can effectively be applied to m-cresol, high
p : o ratios will remain the "Holy Grail" of the nitration of highly activated
substrates. Results from this work have however helped to shed some light on
the mechanism for the formation of the benzoquinone species. The substrate
loading was found to be extremely important in nitration of activated aromatic
substrates. Furthermore, nitration is an extremely exothermic process which,
together with the previously mentioned fact, has serious implications on the
application of this reaction on production scale
.
178
REFERENCES
1) G. C. Gerrans, “South Africa – History of the chemical industry
introduction”, http://mbendi.co.za/caia/chsahs01.htm and all internet links
found at this website.
2) “Sasol announces R835-million n-butanol plant and plans for acrylic acid
in South Africa” and “New detergent alcohol plant for SASOL”,
http://mbendi.co.za/a_sndmsg/news_view.asp.
3) B. Anderson, “Dow Chemical on lookout for further SA investment”,
http://www.businessday.co.za/b.day/index/direct/1,3524,6128-2,00.html.
4) J. Meintjies, Sasol 1950 - 1975, Tafelberg-Uitgewers Beperk, Capetown,
(163pp.), (1975).
5) B.H. Weil, J.C. Lane, The Technology of the Fischer-Tropsch Process,
London Constable & Co Ltd., London, pp. 6 - 23, (1949).
6) P. Tooley, Fuels, Explosives and Dyestuffs – Today, John Murray,
London, pp. 103 - 160, (1971).
7) H.A. Wittcoff, B.G. Reuben, Industrial Organic Chemicals in Perspective,
Part One: Raw Materials and Manufacture, John Wiley and Sons, New
York, pp. 39 - 45 and pp. 127 - 131, (1980).
8) G.A. Cook, Survey of Modern Industrial Chemistry, Ann Arbor Science
Publishers, Michigan, pp. 147 - 178, (1980).
9) H. Fiege, “Cresols and xylenols” in: Ullman’s Encyclopedia of Industrial
Chemistry, W. Gerhartz and Y.S. Yamamoto (Eds.), 5th ed., VCH, New
York, Vol. A8, pp. 25 – 59, (1991).
10) G. Booth, “Nitro compounds, aromatic” in: Ullmann’s Encyclopedia of
Industrial Chemistry, W. Gerhartz and Y.S. Yamamoto (Eds.), 5th ed.,
VCH, New York, Vol. A17, pp. 411 – 455, (1991).
11) J. Buckingham, S.M. Donaghy, Dictionary of Organic Compounds, 5th ed.,
Vol. 4, Chapman and Hall, pp. 3831 – 3832 and pp. 3951 – 3952, (1982).
12) B. Hilleman, “Pesticides triggers large-scale evacuation, decontamination
effort”, Chemical and Engineering News, Vol. 74, (51), 22 – 23, (1996).

179
13) B. Hilleman, “Methyl parathion: EPA’s challenge”, Chemical and
Engineering News, Vol. 75, (4), 28, (1997).
14) J. March, Advanced Organic Chemistry- Reactions, Mechanisms and
Structures, 4th ed., John Wiley and Sons, New York, pp. 501 – 525 and
884 – 885, (1992).
15) G.A. Olah, “Mechanism of electrophilic aromatic substitution”, Accounts of
Chem. Res., Vol. 4, 240 – 248, (1971).
16) J.H. Ridd, “Mechanism of aromatic nitration”, Accounts of Chem. Res.,
Vol. 4, 248 – 253, (1971).
17) P. Sykes, A Guidebook to Mechanism in Organic Chemistry, 6th ed.,
Longman Scientific & Technical, London, pp. 130 – 177, (1986).
18) E. S. Gould, Mechanism and Structure in Organic Chemistry, Holt
Rinehart & Winston Inc., London, pp. 419 – 440, (1969).
19) R. J. Qualette, J.D. Rawn, Organic Chemistry, J. Challice and P.F. Corey
(Eds.), Prentice Hall Inc., New Jersey pp. 506 – 520, (1996).
20) T.W.G. Solomons, Organic Chemistry, 5th edition, John Wiley & Sons Inc.,
New York, pp. 654 – 664, (1992).
21) L. Delaude, P. Laszlo, K. Smith, “Heightened selectivity in aromatic
nitrations and chlorinations by the use of solid supports as catalysts”,
Accounts of Chem. Res., Vol. 26, 607 – 613, (1993).
22) D. W. Amos, D. A. Baines, G. W. Flewett, “Nitration of titanium(IV)nitrate”,
Tetrahedron Letters, Vol. 34, 3191 – 3194, (1973).
23) A. Cornelius, P. Laszlo, “Clay- supported copper(II) and iron(III) nitrates:
novel multi- purpose reagents for Organic synthesis”, Synthesis, October,
909 – 918, (1985).
24) A. Cornelius, P. Laszlo, P. Pennetreau, “Nitration of estrone into 2-
nitroestrone by clay-supported ferric nitrate“, J. Org. Chem., Vol. 48, 4771
– 4772, (1983).
25) B. Gigante, A. O. Prazeres, M. J. Marcelo-Curto, A. Cornelius, P. Laszlo,
“Mild and selective nitration by ‘claycop’”, J. Org. Chem., Vol. 60, 3445 –
3447, (1995).
180
26) F. J. Waller, A. G. Barret, D. C. Braddock, D. Ramprasad,
“Lanthanide(III)triflates as recyclable catalysts for atom economic aromatic
nitration”, Chem. Commun., Vol. 6, 613 – 614, (1997).
27) A. Kawada, S. Mitamura, S. Kobayashi, “Ln(Otf)3 – LiClO4 as reusable
catalyst system for Friedel-Crafts acylation”, Chem. Commun., 183 – 184,
(1996).
28) A. Kawada, S. Mitamura, S. Kobayashi, “Lanthanide
Trifluoromethanesulphonates as reusable catalysts: catalytic Friedel-
Crafts acylation”, J. Chem. Soc., Chem. Commun., 1157 – 1158, (1993).
29) S. Kobayashi, I. Hachiya, “Lanthanide triflates as water- tolerant Lewis
acids. Activation of commercial formaldehyde solution and use in Aldol
reaction of silyl enol ethers with aldehyde in aqueous media”, J. Org.
Chem., Vol. 59, 3590 – 3596, (1994).
30) C. L. Coon, W.G. Blucher, M.E. Hill, “The nitration with nitric acid and
trifluoromethanesulphonic acid”, J. Org. Chem., Vol. 38, (25), 4243 –
4248, (1973).
31) B. A. Kowalczyk, P. N. Roberts, G. K. McEwan, J. Robinson, “Scale up of
the nitration of 1-acetyl-3,4-dichloro-1,2-(ethylenedioxy)benzene using
nitric acid/ trifluoroacetic acid”, Organic Process Research and
Development, Vol. 1, 355 – 358, (1997).
32) R. G. Coombes, J. G. Golding, G. D. Tobin, J. W. Barnett, R. B. Moodie,
K. Schofield, J. B. Weston, “Electrophilic aromatic substitution. Part 16.
The nitration of anisole, o-methylanisole and p-methylanisole in aqueous
sulphuric acid”, J. C. S. Perkin II, 248 – 255, (1977).
33) R. G. Coombes, J. G. Golding, P. Hadjigeorgiou, “Electrophilic aromatic
substitution. Part 23. The nitration of phenol and the cresols in aqueous
sulphuric acid”, J. C. S. Perkin II, 1451 – 1459, (1979).
34) M. Sasaki, K. Mukai, “Preparation of 5-methyl-2-nitrophenol”, US Patent
No. 4 034 050, (1977).
35) H. Kanno, H. Chida, Y. Otani, “Selective nitration of phenol derivatives”,
US Patent No. 5 847 231, (1998).
36) L. A. Subluskey, “Manufacture of para-nitro-meta-cresol from meta/ para-
cresol mixtures” US Patent No. 3 980 717, (1976).
181
37) H. B. Kagan, P. Gigard, M. Quertani, “Selective nitration of phenols
catalysed by lanthanum(III)nitrate”, Tetrahedron Letters, Vol. 23, (42),
4315 – 4318, (1982).
38) M. J. Thompson, P. J. Zeegers, “Studies on the two-phase nitration of
selected phenols”, Tetrahedron Letters, Vol. 29, (20), 2471 – 2474,
(1988).
39) D. S. Ross, G. P. Hum, W.G. Blucher, “Catalysis of aromatic nitration by
the lower oxides of nitrogen”, J. Chem. Soc., Chem. Commun., 532 – 533,
(1980).
40) K. Schofield, R. B. Moodie, J. G. Hoggett, “The duality of mechanism for
nitration in acetic anhydride”, J. Chem. Soc., Chem. Commun., 605 – 606,
(1969).
41) A. Fischer, G. N. Henderson, “Ipso nitration: nitration of 2-alkylphenols in
acetic anhydride. Formation of 6-alkyl-6-nitrocyclohexa-2,4-dienones”,
Tetrahedron Letters, Vol. 21, 4661 – 4662, (1980).
42) T. McCullough, “Beauty or the beast: nitration of phenol”, J. Chem. Ed.,
Vol. 67, (9), 801, (1990).
43) I. J. G. Priestley, J. P. Muxworthy, J. H. Atherton, M. Lennon, S. M. Brown,
“Nitration process”, US Patent No. 5 952 531, (1999).
44) A. Germain, “Solvent effects in the two-phase nitration of anisole”, J.
Chem. Soc., Chem. Commun., 1697 – 1698, (1990).
45) G. A. Olah, S. C. Narang, J. A. Olah, R. L. Pearson, C. A. Cupas,
“Aromatic substitution 45. Transfer Nitrations of aromatics with N-
nitropyridinium and quinolinium ions”, J. Am. Chem. Soc., Vol. 102, (10),
3507 – 3510, (1980).
46) J. K. Kochi, E. K. Kim, K. Y. Lee, “Aromatic nitration with electrophilic N-
nitropyridinium cations. Transitotory charge-transfer complexes as key
intermediates”, J. Am. Chem. Soc., Vol. 114, 1756 – 1770, (1992).
47) H. Pervez, L. Rees, C. J. Suckling, “Selective nitration of phenol”, J.
Chem. Soc., Chem. Commun., 512 – 513, (1985).
48) E. Santaniello, M. Ravasi, P. Ferraboschi, “A-Ring nitration of estrone”, J.
Org. Chem., Vol. 48, 739 – 740, (1983).

182
49) A. Fischer, N. Mathivanan, “Formation of dienones on the reaction of
cresols, xylenols and 2-naphtol with nitrogen dioxide: observation of keto
tautomers of nitrophenols”, Tetrahedron Lettters, Vol. 29, (16), 1869 –
1872, (1988).
50) R. G. Coombes, A. W. Diggle, S. P. Kempsall, “The mechanism of phenol
and 4-methylphenol by nitrogen dioxide in solution”, Tetrahedron Letters,
Vol. 35, (34), 6373 – 6376, (1994).
51) M. Attina, F. Cacace, “Substrate and positional selectivity of the gas-
phase nitration of substituted benzenes by protonated methyl nitrate. The
first example of a well-behaved aromatic nitration by a gaseous cation”, J.
Am. Chem. Soc., Vol. 108, 318 – 319, (1986).
52) J. H. Ridd, S. Dintürk, “Reactions of cerium(IV)ammonium nitrate with
aromatic compounds in acetonitrile. Part 1. The mechanism of side-chain
substitution”, J. C. S. Perkin II, 961 – 964, (1982).
53) I. Keeley, “The evaluation of technical production processes for 2-chloro-
3-phenoxy-6-nitroaniline”, M. Tech.: Chemistry Dissertation, P.E.
Technikon, (1999).
54) J. R. Chapman, Practical Organic Mass Spectrometry, 2nd ed., John Wiley
and Sons, New York (330pp.), (1993).
55) W. Kemp, Organic Spectroscopy, 3rd ed., Macmillan Press Ltd., London,
(392pp.), (1991).
56) G. E. P. Box, K.B. Wilson, J. Roy. Statist. Soc., Vol. B13, 1, (1951).
57) G. E. P. Box, J. S. Hunter, Ann. Math. Statist. Vol. 28, 195, (1957).
58) R. Carlson, Data handeling in science and technology 8: Design and
optimization in organic synthesis, Elsevier, Amsterdam, 201-205, (1992).
59) R. H. Meyers, D. C. Montgomery, Response Surface Methodology, V.
Banet and R. A. Bradley (Eds.), John Wiley and Sons, New York,
(700pp.), (1995).
60) L. Davies, Efficiency in Research, Development and Production: The
Statistical Design and Analysis of Chemical Experiments, The Royal
Society of Chemistry, Cambridge, (179pp.), (1993).
183
61) E. Fache, D. Laucher, M. Constantini, M. Beclere, F. Perrin-Janet, “The
roots of organic development”, in: Industrial Chemistry Library, J. Desmurs
and S. Ratton (Eds.), Elsevier, Amsterdam, Vol. 8, pp. 368 – 379, (1996).
62) H. Beyer, W. Walter, Handbook of Organic Chemistry, Prentice Hall Inc.,
New Jersey, pp. 516, (1996).
63) W. E. Smith, T. W. McGee, “Nitrosation of aromatic compounds”, US
Patent no. 4232175, (1980).
64) B. M. Schoonees, “The production of hydroxy-substituted aromatic
aldehydes and ketones by catalytic, liquid-phase oxidation” D. Tech.:
Chemistry Thesis, P.E. Technikon, (2000).
65) R. A. Sheldon, N. de Heij, “Aromatic aldehydes via catalytic oxidation” in:
Role of Oxygen in Chemistry and Biochemistry, W. Ando and Y. Moro-oka
(Eds.), Elsevier, Amsterdam, pp. 243 – 258, (1988).
66) Hammerich, Svensmark, “Oxygen-containing compounds” in: Organic
Electrochemistry – an Introduction and a Guide, H. Lund and M.M. Baizer,
3rd ed., Marcel Dekker, New York, pp. 616 – 628, (1991).
67) J. Singh, “Reaction calorimetry for process development: recent
advances”, Process Safety Progress, Vol. 16, 43 – 49, (1997).
68) J. Singh, “Automation of reaction research- an alternative to robotics”,
Hazard Evaluation Laboratory – Products and Services catalogue, 157 –
160.
69) J. Singh, “Batch runaway relief: re-evaluation of “credible” scenario”,
Process Safety Progress, Vol. 16, 255 – 261, (1997).
70) “Non isothermal calorimetry”, Hazard Evaluation Laboratory – Simular
Operating Manual, 1 – 20.
71) T.L. Brown, H.E. LeMay, B.E. Bursten, Chemistry – The Central Science,
5th ed., Prentice Hall Inc., New Jersey, pp. 841, (1991).
72) CRC Handbook of Chemistry and Physics, D.R. Lide and H.P.R.
Friederikse (Eds.), 74th ed., CRC Press Inc., pp. 5-1 – 5-75, (1993).
73) O. Ulfert, P. Hanns-Ingolf, “Estimation of physical properties” in: Ullmann’s
Encyclopedia of Industrial Chemistry, W. Gerhartz and Y.S. Yamamoto
(Eds.), 5th ed., VCH, New York, Vol. B1, chapter 6, pp 1 – 55, (1991).
184
74) S. W. Benson, F. R. Cruickshank, D. M. Golden, G. R. Haugen, H. E.
O’Neal, A. S. Rodgers, R. Shaw, R. Walsh, “Additivity rules for the
estimation of thermochemical properties”, Chemical Reviews, Vol. 69, 279
Amsterdam: 324, (1969).
75) S.W. Benson, “Methods for the estimation of thermochemical data” in
Thermochemical Kinetics, 2nd ed., John Wiley and Sons, New York, pp. 19
– 72, (1976).
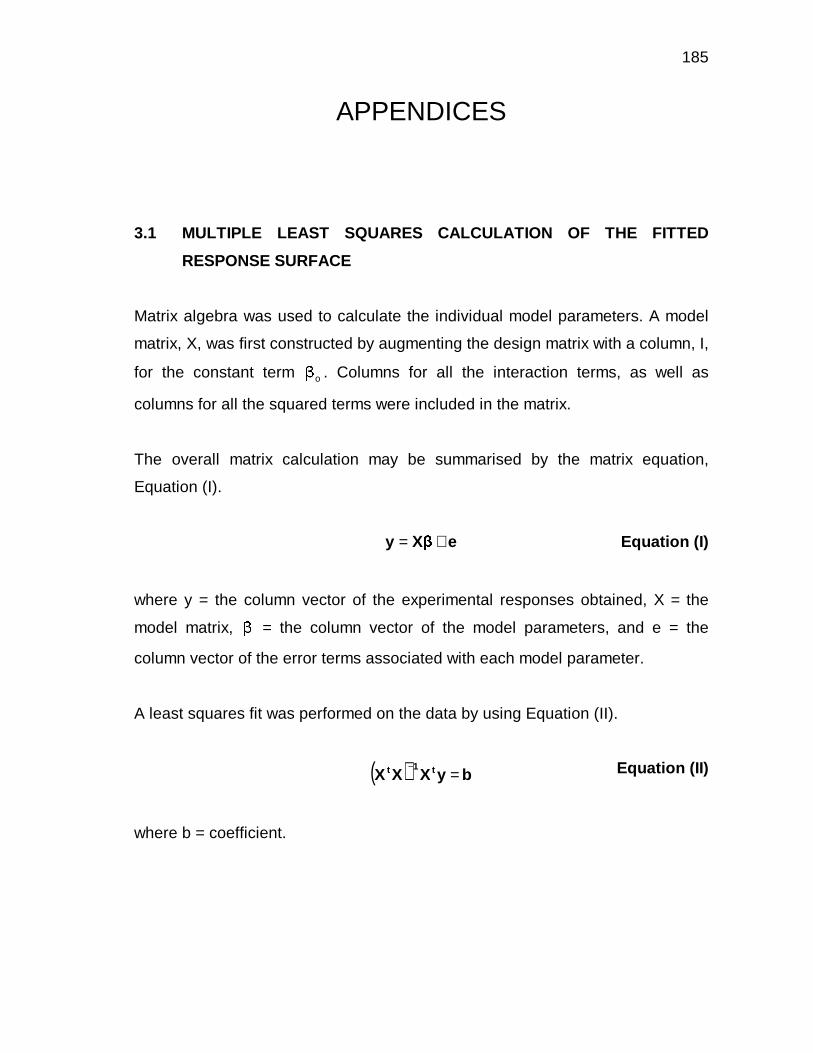
185
APPENDICES
3.1 MULTIPLE LEAST SQUARES CALCULATION OF THE FITTED
RESPONSE SURFACE
Matrix algebra was used to calculate the individual model parameters. A model
matrix, X, was first constructed by augmenting the design matrix with a column, I,
for the constant term o . Columns for all the interaction terms, as well as
columns for all the squared terms were included in the matrix.
The overall matrix calculation may be summarised by the matrix equation,
Equation (I).
eXy += Equation (I)
where y = the column vector of the experimental responses obtained, X = the
model matrix, = the column vector of the model parameters, and e = the
column vector of the error terms associated with each model parameter.
A least squares fit was performed on the data by using Equation (II).
( ) byXXX t1t =−
Equation (II)
where b = coefficient.

186
3.2 CALCULATIONS FOR ANOVA
3.2.1 Estimation of “Pure Error”
To obtain an independent estimate of the pure experimental error, six replicate
experiments were carried out at the design centre (all variables fixed at their
centre point values). The variable settings and responses obtained for these
replicate runs are shown in Table 3.4. The mean error square is defined as:
( )1N
yys
0
2i0i2
1 −−
= ∑ Equation (III)
Using the responses in Table 3.4, variances for conversion, yield, accountability
and yield of 4NMC were found to be 0.00, 0.75, 0.69 and 0.16, respectively.
3.2.2 Significance of individual model parameters
The sum of squares (SS) for the individual, main and interaction effects was
calculated using Equations (IV) and (V), respectively.
( )N
YaSS
2
ii∑= Equation (IV)
( )N
YbaSS
2
iii∑= Equation (V)
where ai and bi are the coded values for the respective factors in the ith
experimental run, Y is the observed experimental response in the ith experimental
run, and N is the number of experimental runs.
Since eight factorial experiments were used to estimate eight parameters (one
average, three main effects, three 2-factor interactions and one 3-factor
interaction), each effect was estimated with only one degree of freedom. The
mean sum of squares (MSS) of the individual model parameters, defined as
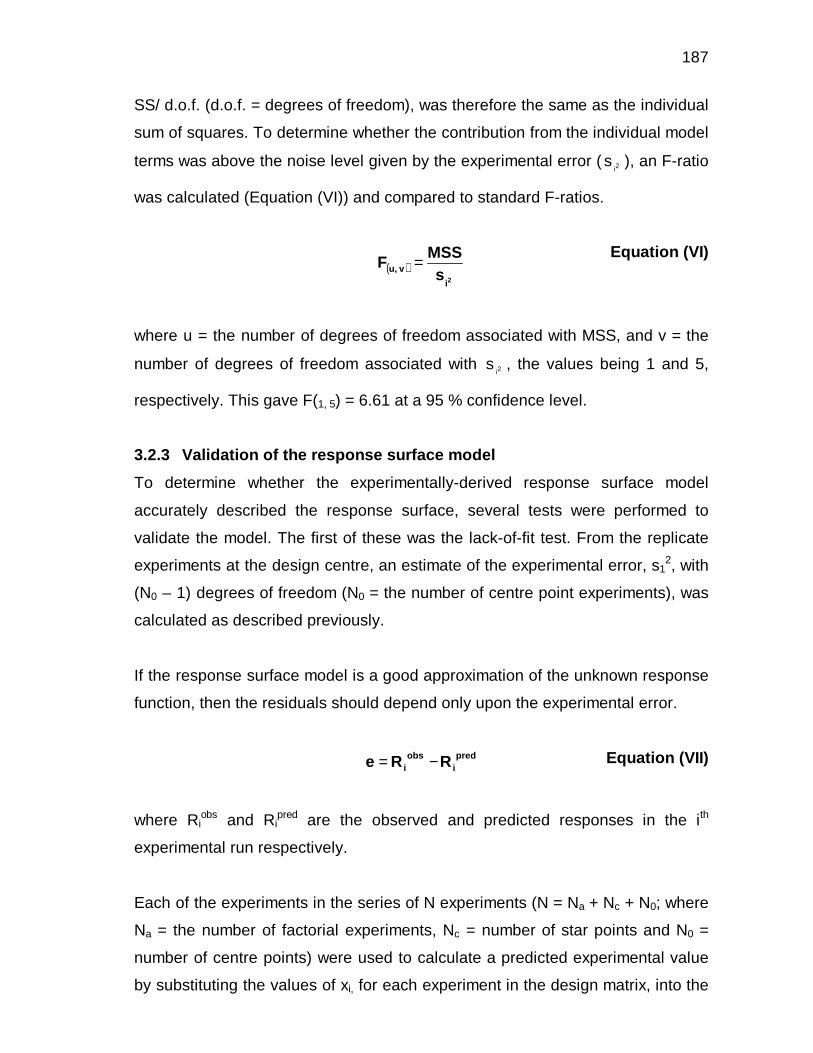
187
SS/ d.o.f. (d.o.f. = degrees of freedom), was therefore the same as the individual
sum of squares. To determine whether the contribution from the individual model
terms was above the noise level given by the experimental error ( 2is ), an F-ratio
was calculated (Equation (VI)) and compared to standard F-ratios.
( )
2i
v u, sMSS
F = Equation (VI)
where u = the number of degrees of freedom associated with MSS, and v = the
number of degrees of freedom associated with 2is , the values being 1 and 5,
respectively. This gave F(1, 5) = 6.61 at a 95 % confidence level.
3.2.3 Validation of the response surface model
To determine whether the experimentally-derived response surface model
accurately described the response surface, several tests were performed to
validate the model. The first of these was the lack-of-fit test. From the replicate
experiments at the design centre, an estimate of the experimental error, s12, with
(N0 – 1) degrees of freedom (N0 = the number of centre point experiments), was
calculated as described previously.
If the response surface model is a good approximation of the unknown response
function, then the residuals should depend only upon the experimental error.
predi
obsi RRe −= Equation (VII)
where Riobs and Ri
pred are the observed and predicted responses in the ith
experimental run respectively.
Each of the experiments in the series of N experiments (N = Na + Nc + N0; where
Na = the number of factorial experiments, Nc = number of star points and N0 =
number of centre points) were used to calculate a predicted experimental value
by substituting the values of xi, for each experiment in the design matrix, into the
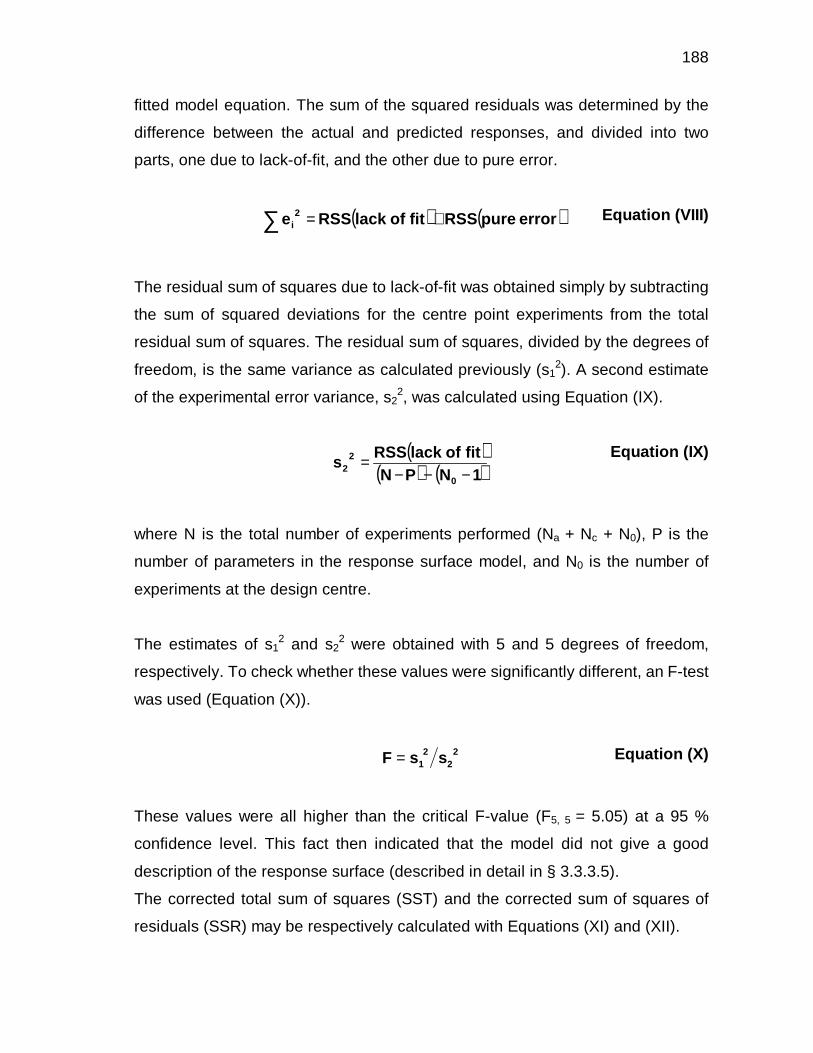
188
fitted model equation. The sum of the squared residuals was determined by the
difference between the actual and predicted responses, and divided into two
parts, one due to lack-of-fit, and the other due to pure error.
( ) ( )error pureRSSfit of lackRSSe 2i +=∑ Equation (VIII)
The residual sum of squares due to lack-of-fit was obtained simply by subtracting
the sum of squared deviations for the centre point experiments from the total
residual sum of squares. The residual sum of squares, divided by the degrees of
freedom, is the same variance as calculated previously (s12). A second estimate
of the experimental error variance, s22, was calculated using Equation (IX).
( )( ) ( )1NPN
fit of lackRSSs
0
22 −−−
= Equation (IX)
where N is the total number of experiments performed (Na + Nc + N0), P is the
number of parameters in the response surface model, and N0 is the number of
experiments at the design centre.
The estimates of s12 and s2
2 were obtained with 5 and 5 degrees of freedom,
respectively. To check whether these values were significantly different, an F-test
was used (Equation (X)).
22
21 ssF = Equation (X)
These values were all higher than the critical F-value (F5, 5 = 5.05) at a 95 %
confidence level. This fact then indicated that the model did not give a good
description of the response surface (described in detail in § 3.3.3.5).
The corrected total sum of squares (SST) and the corrected sum of squares of
residuals (SSR) may be respectively calculated with Equations (XI) and (XII).

189
( ) ( )
N
RRSST
2
2 ∑∑ −= Equation (XI)
( ) ( )
N
RRSSR
2
pred2pred
∑∑ −= Equation (XII)
were R = design responses and Rpred = the predicted design responses.

190
4.1 HPLC chromatograms showing unidentified peaks in the nitration of p-cresol
a)
b)
min0 2 4 6 8 10 12 14 16 18
mAU
0
100
200
300
400
500
600
VWD1 A, Wavelength=232 nm (RUDI2\PC190006.D)
2.6
48 2
.954 3
.256
3.5
22 3
.638
3.9
28
4.3
83
5.1
26
5.7
27
6.1
90
8.7
41
12.
031
- n
itrob
enze
ne
14.
339
- D
NP
C
15.
549
- 2
NP
C
min0 2 4 6 8 10 12 14 16 18
mAU
0
100
200
300
400
500
VWD1 A, Wavelength=232 nm (RUDI2\PC190002.D)
2.6
47 2
.949 3
.254
3.6
49
4.3
84
5.7
30
7.3
98 -
p-c
reso
l
8.7
59
12.
048
- n
itrob
enze
ne
14.
367
- D
NP
C
15.
564
- 2
NP
C
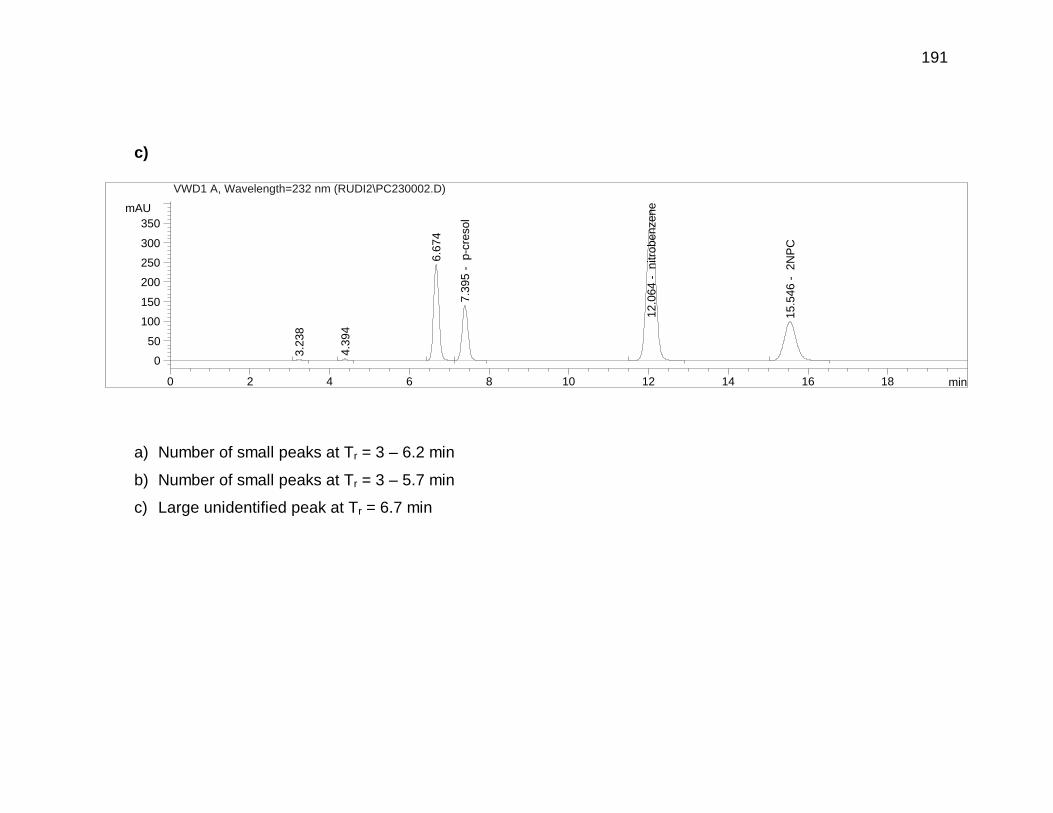
191
c)
a) Number of small peaks at Tr = 3 – 6.2 min
b) Number of small peaks at Tr = 3 – 5.7 min
c) Large unidentified peak at Tr = 6.7 min
min0 2 4 6 8 10 12 14 16 18
mAU
0
50
100
150
200
250
300
350
VWD1 A, Wavelength=232 nm (RUDI2\PC230002.D)
3.2
38
4.3
94
6.6
74
7.3
95 -
p-c
reso
l
12.
064
- n
itrob
enze
ne
15.
546
- 2
NP
C
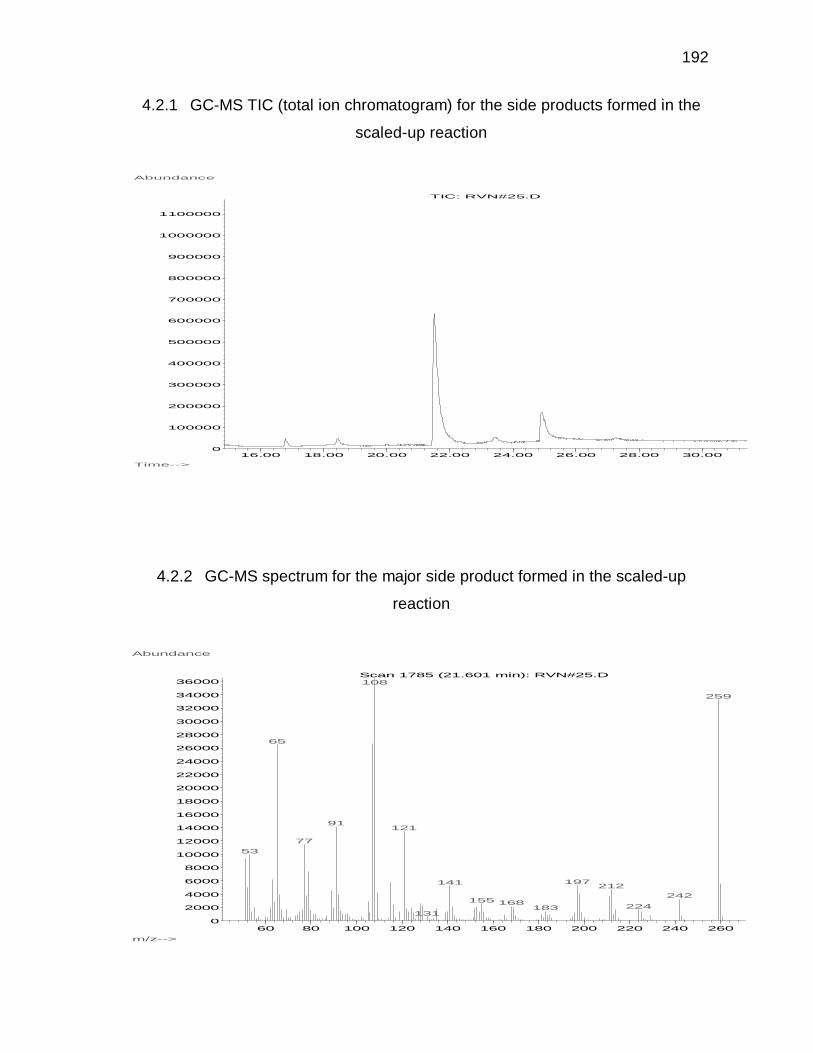
192
4.2.1 GC-MS TIC (total ion chromatogram) for the side products formed in the
scaled-up reaction
4.2.2 GC-MS spectrum for the major side product formed in the scaled-up
reaction
16.00 18.00 20.00 22.00 24.00 26.00 28.00 30.000
100000
200000
300000
400000
500000
600000
700000
800000
900000
1000000
1100000
Time-->
Abundance
TIC: RVN#25.D
60 80 100 120 140 160 180 200 220 240 2600
2000
4000
6000
8000
10000
12000
14000
16000
18000
20000
22000
24000
26000
28000
30000
32000
34000
36000
m/z-->
Abundance
Scan 1785 (21.601 min): RVN#25.D108
259
65
91121
77
53
197141 212
242155 168
224183131
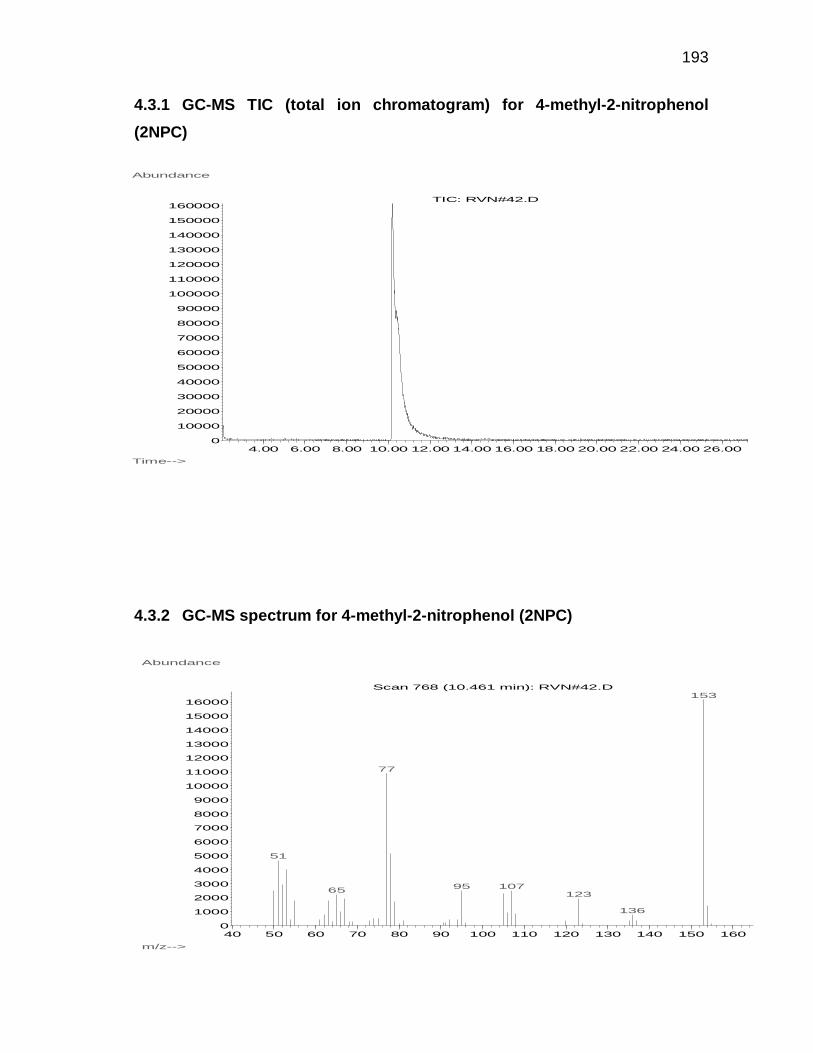
193
4.3.1 GC-MS TIC (total ion chromatogram) for 4-methyl-2-nitrophenol
(2NPC)
4.3.2 GC-MS spectrum for 4-methyl-2-nitrophenol (2NPC)
4.00 6.00 8.00 10.00 12.00 14.00 16.00 18.00 20.00 22.00 24.00 26.000
10000
20000
30000
40000
50000
60000
70000
80000
90000
100000
110000
120000
130000
140000
150000
160000
Time-->
Abundance
TIC: RVN#42.D
40 50 60 70 80 90 100 110 120 130 140 150 1600
1000
2000
3000
4000
5000
6000
7000
8000
9000
10000
11000
12000
13000
14000
15000
16000
m/z-->
Abundance
Scan 768 (10.461 min): RVN#42.D153
77
51
1079565 123
136
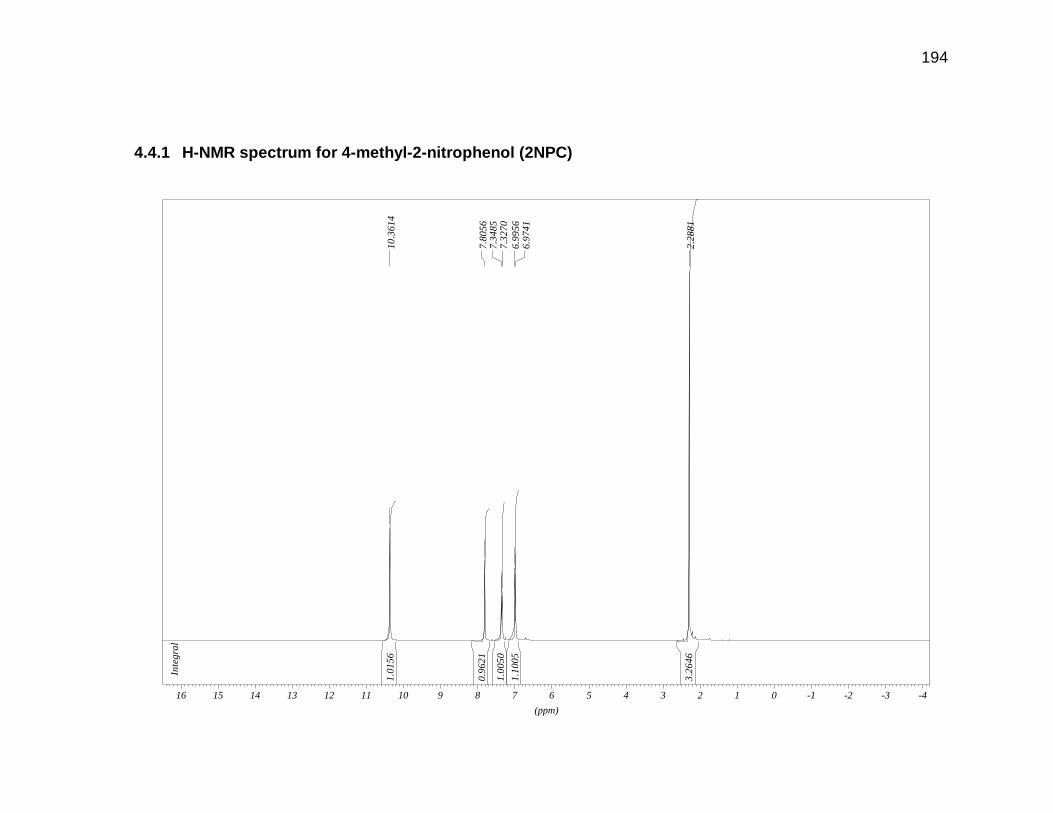
194
4.4.1 H-NMR spectrum for 4-methyl-2-nitrophenol (2NPC)
1.01
56
0.96
21
1.00
50
1.10
05
3.26
46
Inte
gral
10.3
614
7.80
567.
3485
7.32
706.
9956
6.97
41
2.28
81
(ppm)
-4-3-2-1012345678910111213141516
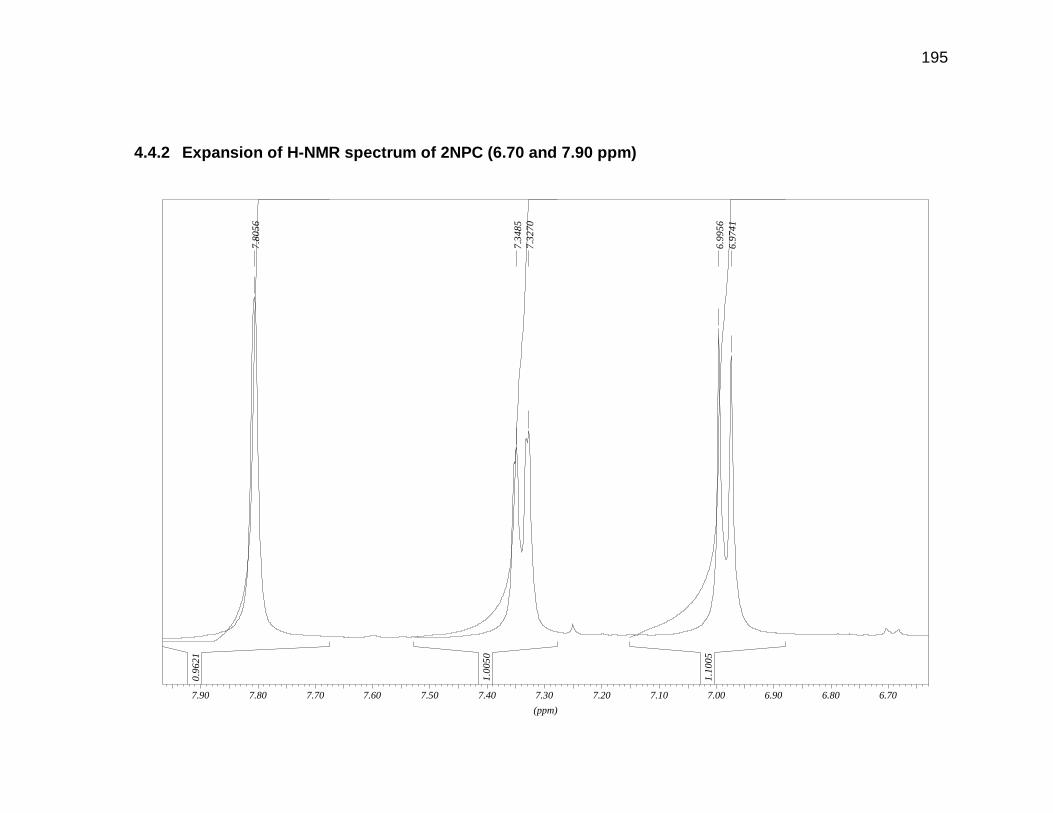
195
4.4.2 Expansion of H-NMR spectrum of 2NPC (6.70 and 7.90 ppm)
0.96
21
1.00
50
1.10
05
7.80
56
7.34
857.
3270
6.99
566.
9741
(ppm)
6.706.806.907.007.107.207.307.407.507.607.707.807.90
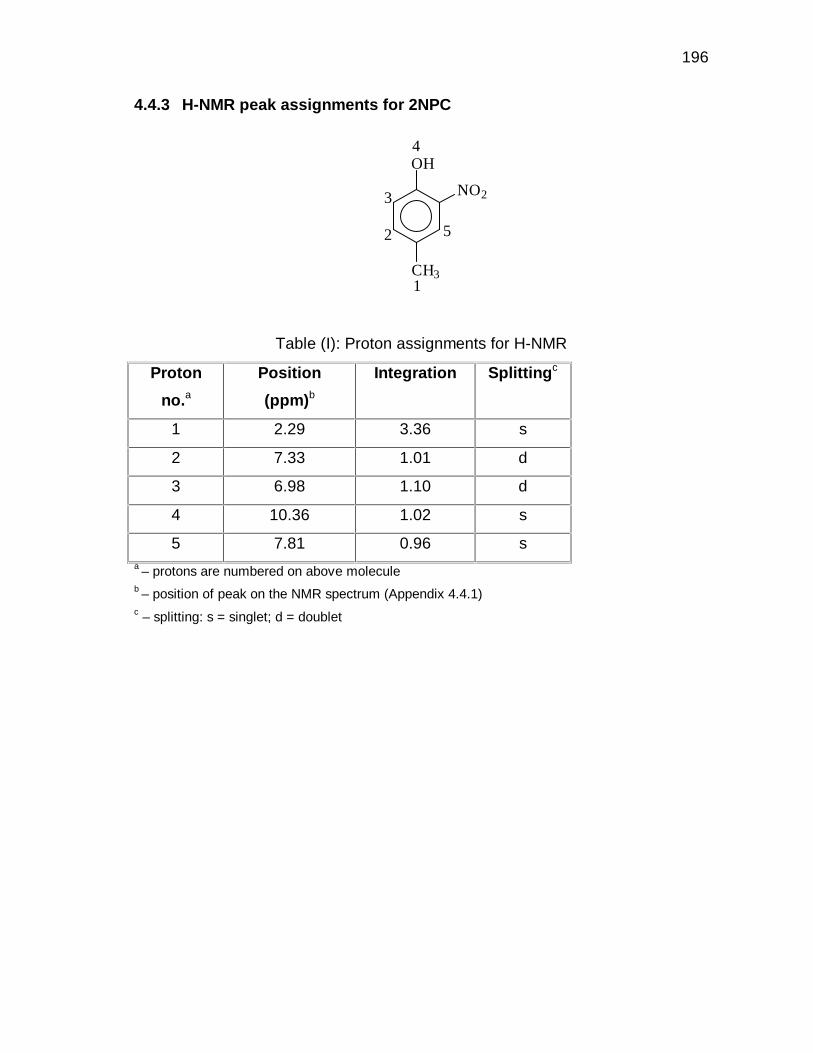
196
4.4.3 H-NMR peak assignments for 2NPC
Table (I): Proton assignments for H-NMR
Proton
no.a
Position
(ppm)b
Integration Splittingc
1 2.29 3.36 s
2 7.33 1.01 d
3 6.98 1.10 d
4 10.36 1.02 s
5 7.81 0.96 s a – protons are numbered on above molecule
b – position of peak on the NMR spectrum (Appendix 4.4.1)
c – splitting: s = singlet; d = doublet
OH
CH3
NO2
1
2
3
4
5
197
(I) LIST OF EQUATIONS
3.1 Coded values 54
3.2 Conversion 56
3.3 Total Yield 56
3.4 Accountability 56
3.5 Yield 4NMC 56
5.1 Heat output rate 107
5.2 Heat flow 108
5.3 Steady state 109
5.4 Electrical power 109
5.5 Reflux flow – heat output rate 110
5.6 Reaction coefficients 123
5.7 Reaction enthalpy 123
5.8 General form 123
5.9 Joback’s method – enthalpy 123
5.10 Enthalpies at temperatures other than 298.15oK 124
5.11 Heat capacity of reagents 124
5.12 Joback’s method – heat capacity 125
(I) Matrix equation 132
(II) Least squares fit 132
(III) Mean error square 133
(IV) Sum of squares – main effects 133
(V) Sum of squares – interaction effects 133
(VI) F- ratio 134
(VII) Experimental error 134
(VIII) Sum of squares residuals 135
(IX) Error variance 135
(X) F-test 135
(XI) Corrected total sum of squares 136

198
(XII) Corrected sum of squares residuals 136
(II) LIST OF FIGURES
3.1 Effect of yttrium(III)triflate loading on the total percentage
yield obtained 51
3.2 Normal probability plot of residuals – conversion 61
3.3 Residuals vs. predicted response – conversion 61
3.4 Normal probability plot of residuals – total yield 62
3.5 Residuals vs. predicted response – total yield 62
3.6 Normal probability plot of residuals – accountability 63
3.7 Residuals vs. predicted response – accountability 63
3.8 Normal probability plot of residuals – yield 4NMC 64
3.9 Residuals vs. predicted response – yield 4NMC 64
3.10 Contour diagrams for conversion of m-cresol 67
3.11 Contour diagrams for total yield 68
3.12 Contour diagrams for product accountability 69
3.13 Contour diagrams for yield of 4NMC 70
3.14 Product distribution diagram for the nitration of m-cresol
at 0oC with 40 % nitric acid 73
4.1 Mass balance for the nitration of p-cresol 103
5.1 Reaction calorimeter flowsheet 108
5.2 Main variables used in reaction calorimetry 109
5.3 Energy plot for the nitration of p-cresol with 65 % nitric acid 114
5.4 Product distribution diagram for a scaled-up nitration of p-cresol 116
5.5 Energy plot for the dilute calorimetric nitration of p-cresol 118
5.6 Overlaid energy plots of various acids 120
5.7 Overlaid energy plots of various nitric acid concentrations 122
199
(III) LIST OF SCHEMES
3.1 Nitrosation 81
3.2 Nitration 81
3.3 Initial nitrosation 82
3.4 Monoxime formation 83
3.5 Monoxime hydrolysis 84
4.1 Dimer formation 98
(IV) LIST OF TABLES
1.1 Some physical properties of the cresols 8
1.2 Methods of separation of m- and p-cresol 12
1.3 Some physical properties of the more important nitrocresols 16
2.1 Organic reagents for synthesis 36
2.2 Inorganic reagents for synthesis 37
2.3 Reagents for HPLC analysis 37
2.4 Miscellaneous reagents for analysis 38
2.5 Important GC settings 44
2.6 HPLC parameter settings used for quantitative analysis 45
2.7 Chromatographic conditions for GC-MS analysis 46
3.1 Effect of catalyst concentration on isomer distribution 51
3.2 Factors and factor levels for the experimental design 53
3.3 Full three-factor central composite design 55
3.4 Design and responses for the nitration of m-cresol 56
3.5 Response surface estimation and ANOVA – Conversion
of m-cresol 58
3.6 Response surface estimation and ANOVA – Total yield 58
3.7 Response surface estimation and ANOVA – Accountability 59

200
3.8 Response surface estimation and ANOVA – Yield 4NMC 59
3.9 Validity of design 71
3.10 Lack of nitration with low acid concentrations at low temperature 72
3.11 Nitration with yttrium(III)triflate at low acid
concentrations and low temperatures 75
3.12 Nitration of m-cresol with “claycop” 77
3.13 Nitration of m-cresol with “clayfen” 78
3.14 Nitration of m-cresol with a mixed acid system 80
3.15 Nitration of m-cresol with NaNO2 86
3.16 Nitrosation of m-cresol with 2 mole equivalents NaNO2 87
3.17 Gas-phase nitrosation of m-cresol 88
4.1 Mono- and dinitration of p- cresol 95
4.2 Effect of increased substrate loading 96
4.3 GC-MS assignments for the by-products obtained
in the p-cresol nitration 97
4.4 Scaled-up nitration of p-cresol 100
4.5 Additional scaled-up p-cresol nitrations 102
5.1 Calorimetric nitration of p-cresol 113
5.2 Some results in the second calorimetric nitration 115
5.3 Effect of by-product formation on accountability 117
5.4 Dilute calorimetric nitration of p-cresol 118
5.5 Effect of a catalyst on formation of products
and heat of reaction 120
5.6 Effect of acid concentration on the reaction results 121
5.7 Joback’s increments for the estimation of � r and cop 125
(I) Proton assignments for H-NMR 143

CCI


![[4+2] And [4+3] Cycloaddition Reactions And Lewis Acid ... · Loughborough University Institutional Repository [4+2] And [4+3] Cycloaddition Reactions And Lewis Acid Catalysed Cycloisomerisation](https://static.fdocuments.us/doc/165x107/5b5c4b507f8b9ac6028bf1a7/42-and-43-cycloaddition-reactions-and-lewis-acid-loughborough-university.jpg)