Evaluation of Intel Architectures -...
72
Evaluation of Intel Architectures An Experimental Manual for System On Chip (SoC), Operating Systems and Pervasive Computing, Embedded Systems In association with Intel Collaboration Program Designed by: Zeenat Shareef, MTech (Mobile and Pervasive Computing) Under the guidance of: Dr. S.R.N Reddy, HOD and Associate Professor, CSE Mr. Naveen Gv, Technical Consultant Engineer, Intel Department of Computer Science Indira Gandhi Delhi Technical University for Women Kashmere Gate, Delhi-110006
Transcript of Evaluation of Intel Architectures -...

Evaluation of Intel Architectures
An Experimental Manual for
System On Chip (SoC), Operating Systems and Pervasive
Computing, Embedded Systems
In association with Intel Collaboration Program
Designed by: Zeenat Shareef, MTech (Mobile and Pervasive Computing)
Under the guidance of: Dr. S.R.N Reddy, HOD and Associate Professor, CSE
Mr. Naveen Gv, Technical Consultant Engineer, Intel
Department of Computer Science
Indira Gandhi Delhi Technical University for Women
Kashmere Gate, Delhi-110006

LIST OF EXPERIMENTS
EXP. No Description of Experiment 1. Introduction to Intel Edison.
2. Write the steps to install the drivers and IDE’s for Intel Edison
3. Write the steps to configure Intel Edison and enable the WI-FI module
4. Write the steps to enable the Bluetooth module in Intel Edison and connect
with a device and transfer text using SPP.
5. To demonstrate Bluetooth communication between two Intel Edison SoCs
6. Demonstration of file/folder sharing between Intel Edison and the Android
phone using the FTP.
7. Write a program to blink the LED on the Intel Edison using Arduino
8. Write a program to blink the LED on the Intel Edison using Wylodrin
9. Write a program to blink the LED on the Intel Edison using Intel XDK IoT
Edition
10. Write a program to blink the LED on the Intel Edison using Eclipse CDT for
IoT.
11. Write the steps to install MCU SDK for Intel Edison.
12. Write a program to blink the LED on the Intel Edison using MCU SDK
13. Demonstration of communication between Intel Atom processor and
microcontroller
14. Intel VTune Amplifier For Systems on core i7 Host Platform- Theory and
Questions
15. To execute an application on Intel Edison using Intel System Studio 2015
toolchain.
16. Intel VTune Amplifier For Systems on Intel Edison (Target Platform)
17. To evaluate the healthcare application using Intel Inspector 2015 for Systems.

EXPERIMENT 1
AIM: Introduction to Intel Edison.
INTEL EDISON- A SOC based on Intel Atom
The Intel Edison compute module is designed to lower the barriers to entry for anyone
prototyping and producing IoT and wearable computing products. Intel Edison contains the
core system processing and connectivity elements: processor, PMIC, RAM, eMMC, and Wi-
Fi/BT. Intel Edison is a module that interfaces with end-user systems via a 70-pin connector.
The Intel Edison compute module does not include any video input or output interfaces (MIPI
CSI, MIPI DSI, HDMI, etc.). Internal image processing and graphics processing cores are
disabled (ISP, PowerVR, VED, VEC, VSP, etc.). Intel Edison relies on the end-user support
of input power.
Fig1: Block Diagram of Intel Edison
i) SoC: Main SoC of the board is new Intel Atom "Tangier" (Z34XX), produced with 22 nm
which combines a dual-core Atom running Yocto Linux at 500MHz with Intel’s MCU-like
Quark processor clocked at 100MHz. The Quark is currently inactive, but will eventually run
a “ViperOS” RTOS derived from the VxWorks platform offered by Intel subsidiary Wind
River. “Tangier,” a stripped down version of Intel’s Atom Z34xx (“Merrifield”).
Intel Atom Processor Z34xx Series is the next generation 22 nm SoC product targeted for the
smartphone market segment. The SoC contains dual IA-32 cores operating at 500 MHz.
ii) Managed NAND (eMMC) flash
Edison uses 4 GB of managed NAND to store the file system and user data. Managed NAND
flash contains a full MMC controller, wear-leveling firmware, and all the other features that
are typically found in MMC cards, except it is available in a small BGA form-factor.
• Bus mode − Data bus width: 1 bit (default), 4 bits, 8 bits
− Data transfer rate: up to 200 MBps (HS200)

iii) DDR SDRAM
Edison supports 1 GB LPDDR3 memory at speeds up to 1033 MT/s.
• 8 banks , Row addresses R0-R13 , Column addresses C0-C9
• Dual-channel 32 bits
• 400 MHz clock max (800 MT/s)
iv) Wi-Fi / BT module
The Murata integrated Wi-Fi BT module is built around a Broadcom BCM43340 Wi-Fi /BT
device.The Broadcom BCM43340 single chip quad device provides the highest level of
integration for a mobile or handheld wireless system, with integrated dual band (2.4 / 5 GHz)
IEEE 802.11a/b/g/n MAC/baseband/radio with Bluetooth 4.0.
• Dual-band 2.4 GHz and 5 GHz IEEE 802.11 a/b/g/n.
• Single-stream IEEE 802.11n support for 20 MHz and 40 MHz channels provides
PHY layer rates up to 150 Mbps for typical upper layer throughput in excess of 90
Mbps.
• Complies with Bluetooth Core Specification Version 4.0 with provisions for
supporting future specifications. Bluetooth Class 1 or Class 2 transmitter operation.
• Security: − WPA and WPA2 (personal) support for powerful encryption and
authentication.
v) 70-pin interface connector
The Edison module connects to the end user device via a 70-pin connector. The connector on
Edison is a Hirose 70-pin DF40 Series “header” connector sometimes referred to as a “plug”
connector.

EXPERIMENT 2
AIM: Write the steps to install the drivers and IDE for Intel Edison.
REQUIREMENTS: Intel Edison, 12 V power supply, micro USB cable
PROCEDURE:
1. Unpack the Intel Edison board and screw the nuts in the expansion board. Here, we
have the arduino expansion board.
2. Download the Windows Drivers setup 1.2.1 from
http://www.intel.com/support/edison/sb/CS-035180.htm so that the Intel Edison will
be connected as a COM port to the laptop.
3. Download the latest Yocto image from the above mentioned site and extract it on the
Edison flash.
4. Download putty to connect through serial and SSH connections to access the linux
side of Edison.( http://www.putty.org/)
5. Now install the IDE through which you would like to program the Edison
1. Arduino Software 1.5.3 - Intel 1.0.4 software -
http://www.intel.com/support/edison/sb/CS-035180.htm
2. Eclipse(CDT) - https://software.intel.com/en-us/iot/downloads
3. Intel XDK

EXPERIMENT 3
AIM: Write the steps to configure Intel Edison and enable the WI-FI module.
REQUIREMENTS: Intel Edison, 12 V adapter, USB cable, Putty.
PROCEDURE:
1. Connect the 2nd
micro USB cable (serial port) of Intel Edison with the laptop and
open putty.
2. In putty, write the COM Port number( Open Device manager) for that and change the
baud r ate from 9600 to 115200 and click on open
3. Press enter a couple of times and the login screen of Intel Edison opens up with name
of the Linux Distribution prompting the user to enter the login name and password.
The default edison login is root
The default password is root.
Entering into Intel Edison
4. To configure Intel Edison with a new name and password, write the following
command
Configure_edison --setup
Command to setup Intel Edison configurations

5. A screen opens up which asks the user to enter the password. Write the password and
press enter. This password will be the entry point to this device and login password.
Changing Intel Edison password
6. Enter the name of your device which is an optional case.
7. Write the name of the device (atleast 5 characters long) and confirm it by pressing ‘Y’
for yes.
Changing Intel Edison Device Name
8. It then asks if the user wants to configure the wifi and connect to a network. Select
‘Yes’, and the system will start scanning for the available wifi connections.

Connecting Intel Edison to Wi-Fi network
The Network Name along with their SSID appears on the screen. Type the SSID of the
network you would like to connect with. Then it will ask for the network password for the
connection. Type in the password and press enter.
Here, the SSID and connection name is 5: EMBEDDED_LAB
The password is igdtuw#@#246
9. If the connection is successful then it will give the IP address of the device through
which one can connect and work with the Intel Edison.
IP of Intel Edison
So, here we get a message on the screen that the connection has been successful and get
the IP address as 172.16.3.179.
To check if the connection is actually successful then write the IP address that you got
here in the browser.

Intel Edison Device Information
10. Now to wirelessly connect to Intel Edison through WiFi, open SSH in putty and type
the IP address (Here, we have 172.16.3.179).
SSH into Edison with IP address
On successful connection, the Intel Edison command line opens up. Open this will
username (default- root) and password- the one you typed in step 5.
Now you have enabled the Wifi Module and can write commands as you used to do in
serial terminal.
To check if the device is connected to the internet or not, type ifconfig in the command
line.

Checking wi-fi configurations
There in the wlan0 section in the screen, you see the inet address as 172.16.3.179. Thus
this proves that you are connected to the network.
RESULT:
Thus we have configured the Intel Edison with new name and password. We have
successfully connected to a wifi network and accessed our Intel Edison via that network.

EXPERIMENT 4
AIM: Write the steps to enable the Bluetooth module in Intel Edison and connect with a
device and transfer text using SPP profile.
REQUIREMENTS: Intel Edison, 12 V adapter, USB cable, Putty.
PROCEDURE:
1. As we have already connected our Intel Edison with the network, we can have access
to Linux Distribution via SSH after providing the IP address of the Edison device.
Login through SSH
2. You will get a login screen. Enter by providing the default login as root and your
password.
Commands for Bluetooth configurations
3. Write the following command
rfkill unblock bluetooth
This will unblock the Bluetooth.

4. Next to configure the UART and fire up the radio type hciconfig hci0 up
5. Now type bluetoothctl which will take us to the controller we are working with.
You will enter the Bluetooth command line.
6. To have a view of all the available commands type help and you will get the screen as
shown.
7. To let the device become discoverable and pairable type discoverable on and
pairable on.
Commands for Bluetooth configuration
8. Now we will fire the agent. So type agent on and then default-agent. This will look
after pairing and all.

Pairing with Android Phone
9. Now take your device- here we have taken the device as an android phone and scan
for nearby Bluetooth radios. Select the Intel Edison device name and the phone with
it.
Pairing request on Android Phone
10. Now quit from the terminal

SPP Profile
11. Now configure the Bluetooth to listen to other Bluetooth devices by typing rfcomm
listen hci0&.
12. Now open blueterm in your android phone and connect with Intel Edison. Thus
connection is established between Intel Edison and the android phone.
13. To check if the data sent by the android phone is received or not, type
cat /dev/rfcomm0.
Receiving data on Edison
14. Now, whatever you type from your blueterm should be received in the Intel Edison
screen (Last Figure).

Sending data from Blueterm App in Android Phone
RESULT: Thus we have established connection with another bluetooth device and sent
characters.

EXPERIMENT 5
AIM: To demonstrate Bluetooth communication between two Intel Edison SoCs.
REQUIREMENTS: Two Intel Edison boards, 12 V adapter, USB cable, Putty
PROCEDURE:
1. The two Edison boards that will be used will be denoted as Edison A and Edison
B.
2. Power on the two Intel Edison boards and follow the step 4.3 to connect these
boards to the Wi-Fi network.
3. Now connect to the wireless network remotely through SSH.
4. Enable bluetooth on both the boards by using the command rfkill unblock
bluetooth on both these boards.
5. Put both the boards in bluetoothctl mode by using bluetoothctl command. The
mac address of each Intel Edison board can be seen below this command.
6. On both the boards enable the agents using the command agent on and set them to
default using default-agent command. They will look after all the action that
needs to be taken for bluetooth communication with Intel Edison.
7. On board A, start a scan using the command scan on to get the address of all
nearby Bluetooth devices. MAC address of Intel Edison B will also be shown.
8. To pair board A with board B, write the command pair <MAC Address> of
board B. On boards B pairing requests will be visible, affirm the request to pair.
9. Now to connect these two boards, write the command connect <MAC Address>.
10. On board B, authentication requests will be visible. Affirm in order to connect
with Bluetooth A.
11. Now these two bluetooth devices will be connected and connection established
message will be visible on the screen.
Commands on Intel Edison board A having IP address 192.168.0.104

Commands on Intel Edison board B having IP address 192.168.0.105
Bluetooth connection between two Intel Edison boards
Setup of the two Intel Edison Boards
RESULT: Bluetooth communication between two Intel Edison SoCs were successfully
established.

EXPERIMENT 6
AIM: Demonstration of file/folder sharing between Intel Edison and the Android phone
using the FTP profile.
REQUIREMENTS: Putty, Intel Edison board, 12 V adapter, usb cable,
PROCEDURE:
1. Enable Bluetooth using the command rfkill unblock bluetooth and enter the
command line using bluetoothctl command.
2. Establish bluetooth communication between Intel Edison and Android Phone by following the
steps in experiment 3.
3. Start the obex service and verify its status using the commands start systemctl start
obex and systemctl status obex.
4. Download Bluetooth File Transfer application from android playstore. This
application has FTP profile.
5. Open the Bluetooth File Transfer application. Select the Bluetooth option.Select the
Intel Edison as the device to connect to.
6. Select target Bluetooth profile as File Transfer Profile.
7. Once the android phone is connected to Intel Edison, it will show the files and folders
in the obex directory.
Steps for selecting Intel Edison board to connect with Bluetooth File Transfer Application.

Edison folder shown in the Bluetooth Transfer App
RESULT:
The folder called Edison was successfully shared between the Intel Edison board and the
Android Mobile Device.

EXPERIMENT 7
AIM: Write a program to blink the LED on the Intel Edison using Arduino
REQUIREMENTS: Intel Edison, 12 V adapter, USB cable, Arduino
PROCEDURE:
1. Open arduino1.5.3-intel1.0.4.
2. Click on Arduino.
3. New-> Examples->Basics->Blink.
4. Connect the micro-usb cable away from the edge of Intel Edison to the laptop.
5. Tools->Board=Intel Edison->COM->select the COM port by looking at the device
manager.
6. Verify the code and upload.
7. The led will blink on the Intel Edison.
CODE ( Sample Example Code):
// Pin 13 has an LED connected on most Arduino boards.
// give it a name:
int led = 13;
// the setup routine runs once when you press reset:
void setup() {
// initialize the digital pin as an output.
pinMode(led, OUTPUT);
}
// the loop routine runs over and over again forever:
void loop() {
digitalWrite(led, HIGH); // turn the LED on (HIGH is the voltage level)
delay(1000); // wait for a second
digitalWrite(led, LOW); // turn the LED off by making the voltage LOW
delay(1000); // wait for a second
}

SNAPSHOTS
RESULT: Thus we have successfully program the Intel Edison using Arduino IDE.

EXPERIMENT 8
AIM: Write a program to blink the LED on the Intel Edison using Wyliodrin IDE
REQUIREMENTS: Intel Edison, 12 V adapter, USB cable, Internet connection,Wyliodrin
IDE
PROCEDURE:
1. Sign in Wyliodrin using the gmail account.
2. Power on Intel Edison and copy the file wyliodrin.json on it. Make sure the file is
named exactly wyliodrin.json.
script files for wyliodrin
3. Connect Intel Edison to Wi-Fi as shown in experiment 2 and connect board
wirelessly over the network.
4. To install and run wyliodrin in Intel Edison follow the following steps:
mkdir /media/storage
mount -o loop,ro,offset=8192 /dev/mmcblk0p9 /media/storage
cd /media/storage
sh install_edison.sh
Downloading Wyliodrin packages
5. On the Wyliodrin Applications page, click the Add Board button. You will be
asked to provide the name and the type. Enter any name you like and select the Intel
Edison as board type.

New board configuration
6. Connect to the network by typing the network name and the network password
which should be the same as the Intel Edison board.
Connecting the board to Wi-Fi network
7. After that your board will also be shown online. Now select new project->Name of
the project. Select the programming language as visual programming. And Select the
project to be opened. Here we have taken the project as led blinking.
Making the board online
8. In order to program the Intel Edison via wyliodrin, drag and drop the required
components on the programming menu.

Visual Programming in Wyliodrin
9. On the side menu when your board is online, an option to start the led blinking on
the board will be shown. When you click on start, the led will blink on the Intel
Edison board and when you click on stop, the blinking will stop.
10.One can also open the console of Intel Edison through wyliodrin interface.
Terminal window of Wyliodrin
12. The code is automatically generated in python and javascript and is displayed as
follows
Javascript
var wyliodrin = require("wyliodrin");
wyliodrin.pinMode (13, 1);
console.log('Led on pin 13 should blink');
console.log('Press the Stop button to stop');

while (true) {
wyliodrin.digitalWrite (13, 1);
wyliodrin.delay (500);
wyliodrin.digitalWrite (13, 0);
wyliodrin.delay (500);
}
Python
from wyliodrin import *
from time import *
pinMode (13, 1)
print('Led on pin 13 should blink')
print('Press the Stop button to stop')
while True:
digitalWrite (13, 1)
sleep ((500)/1000.0)
digitalWrite (13, 0)
sleep ((500)/1000.0)
RESULT: Thus we have successfully program the Intel Edison using Wyliodrin IDE.

EXPERIMENT 9
AIM: Write a program to blink the LED on the Intel Edison using Intel XDK IoT
Edition
REQUIREMENTS: Intel Edison, 12 V adapter, USB cable, Intel XDK IOT Edition
PROCEDURE
1. Download Intel IOT XDK from the site https://software.intel.com/en-us/html5/xdk-iot.
2. Download and run bonjour if it is not there. The link will be provided in the XDK itself if
bonjour is not present in the XDK.
3. New Project->Template->On Board LED Blink.
4. Type in the location and project name.
5. Connect your Intel Edison to the Wi-Fi network and obtain the IP address of the board as
this will be used in step 6.
6. Now connection establishment between the Intel Edison board and the XDK needs to be
done. On the bottom side of the screen, there will be a caption of IOT Device. IOT Device-
Add Manual Connection. A menu appears in which type the IP address of the Intel Edison
board along with its username which is root and the password of the Intel Edison Board.
Connecting Intel XDK to Wi-Fi network
7. After establishing connection, it will prompt the user to sync the XDK with the board so
click on sync.

8. Once the connection is established, select the option sync PC time w/clock on target
device.
9. Upload the sketch on the board.
10. Click on the run button to run the program.
Different buttons of Intel XDK IDE
The LED will blink as per the commands of the user whether he clicks on start or stop.
Output in Intel Edison
Code
var mraa = require('mraa');
console.log('MRAA Version: ' + mraa.getVersion());
)
var myOnboardLed = new mraa.Gpio(13);
myOnboardLed.dir(mraa.DIR_OUT);
var ledState = true

periodicActivity();
function periodicActivity()
{
myOnboardLed.write(ledState?1:0);
ledState = !ledState;
setTimeout(periodicActivity,1000);
}
RESULT: Thus we have successfully program the Intel Edison using Intel XDK IoT Edition.

EXPERIMENT 10
AIM: Write a program to blink the LED on the Intel Edison using Eclipse CDT for IoT
REQUIREMENTS: Intel Edison, 12 V adapter, USB cable, Putty, Eclipse IOT kit for
windows
PROCEDURE:
1. Download Intel-iot-devkit (https://software.intel.com/en-us/iot/downloads)
2. Open Eclipse.
3. Go to Remote System Explorer
Remote System Explorer
4. On the left corner of the screen you will have to create a new connection.
5. To connect to the remote device, make a new SSH connection.
Creating new SSH connection

6. Define the new connection with the IP address of the device to connect to and give a
name to this connection.
Remote SSH connection
7. After establishing the connection you will get setup as shown in the figure and you
will have to right click on the Edison and select connect.
Remote configurations
8. It will then prompt you to get the password for the network.
Remote SSH
9. Now you will get a message that the system is connected with the terminal of linux.

10. Now go to C++ and select the remote led blinking example on the project explorer
11. Debug the application. Now go to Run->Run Configurations
Run Configurations
Select the debug file that you want to run. The connection as the remote connection of
Edison. Click on Apply. Then Run.
12. You will get the output on the terminal and the Led will blink on the board.
Output

EXPERIMENT 11
AIM: Write the steps to install the MCU SDK for Intel Edison.
REQUIREMENTS: Intel Edison, 12 V adapter, USB cable, Putty, Eclipse MCU SDK
PROCEDURE:
1. Download the setup from MCU SDK.
2. Run the cygwin setup and click on next to download all the packages.
3. After the package installation, launch the MCU Development kit setup. Eclipse IDE
opens up.
4. Now download the script file from the download site and put them in the
mcusdkhome/cygwin/home.
5. Now remotely transfer the scripts from windows host to the target Intel Edison SoC
and copy them to /home/root directory using mininit setup found in cygwin by typing
the pscp command.
Shell files(.sh) at /home/root at Intel Edison.
6. Enable the scripts by typing chmod +x /home/root/*.sh.
Installation of MCU SDK

EXPERIMENT 12
AIM: Write a program to blink the LED on the Intel Edison using MCU SDK.
REQUIREMENTS: Intel Edison, 12 V adapter, USB cable, Putty, Eclipse MCU SDK
PROCEDURE:
1. MCU -> New Project-> Project Template.
2. Write the code for LED blinking.
3. Build the program.
4. To deploy the program on the board, first configure network over USB by
providing IP to it except 192.168.2.15.
5. Now, select the download option from the menu. It will ask for the password to
enter into the linux console.
6. To download the package into the SoC, it will reboot the linux.
7. On the command line write ‘sh init_DIG.sh –o 13 –d output’. After some time
the led will blink.
8. To see the microcontroller log information, select the MCU log where you can
view any type of debug information.
9. To remove the program and burn some other program, uninstall the previous
program. Again the linux will restart to unload the previous program.
Application Development in Eclipse, Network over usb, Downloading the
application, MCU log

LED blinking and uninstalling the program.
Application Development in the MCU SDK
CODE
#include "mcu_api.h"
#include "mcu_errno.h"
void mcu_main()
{
/* your configuration code starts here */
gpio_setup(40,1);
while (1) /* your loop code starts here */
{gpio_write(40,1);
mcu_sleep(1000);
gpio_write(40,0);
mcu_sleep(1000);
}
}
RESULT: Thus we have successfully program the Intel Edison using MCU SDK.

EXPERIMENT 13
AIM: Demonstration of communication between Intel Atom host processor and the
microcontroller.
REQUIREMENTS: Intel Edison boards, 12 V adapter, USB cable, Putty, Eclipse MCU
SDK
PROCEDURE:
1. MCU -> New Project-> Project Template.
2. Write the code for communication.
3. Build the program.
4. To deploy the program on the board, first configure network over USB by
providing IP to it except 192.168.2.15.
5. Now, select the download option from the menu. It will ask for the password to
enter into the linux console.
6. On the linux console to see the messages received type “cat /dev/ttymcu0”
.
Command on linux console, MCU Log
7. To see the microcontroller log information, select the MCU log where you can
view any type of debug information.
8. To remove the program and burn some other program, uninstall the previous
program. Again the linux will restart to unload the previous program.
CODE
#include "mcu_api.h"
#include "mcu_errno.h"
#include <string.h>
void mcu_main()
{
/* your configuration code starts here */
char buf[64];
int len;
while (1) /* your loop code starts here */
{ do {
len = host_receive((unsigned char *)buf, 64);
mcu_sleep(10);
} while (len <= 0);
if (strncmp(buf, "start", 5) == 0)
{
debug_print(DBG_INFO, "received start command!\n");
host_send((unsigned char*)"hello mcu\n", 10);
}
}
}
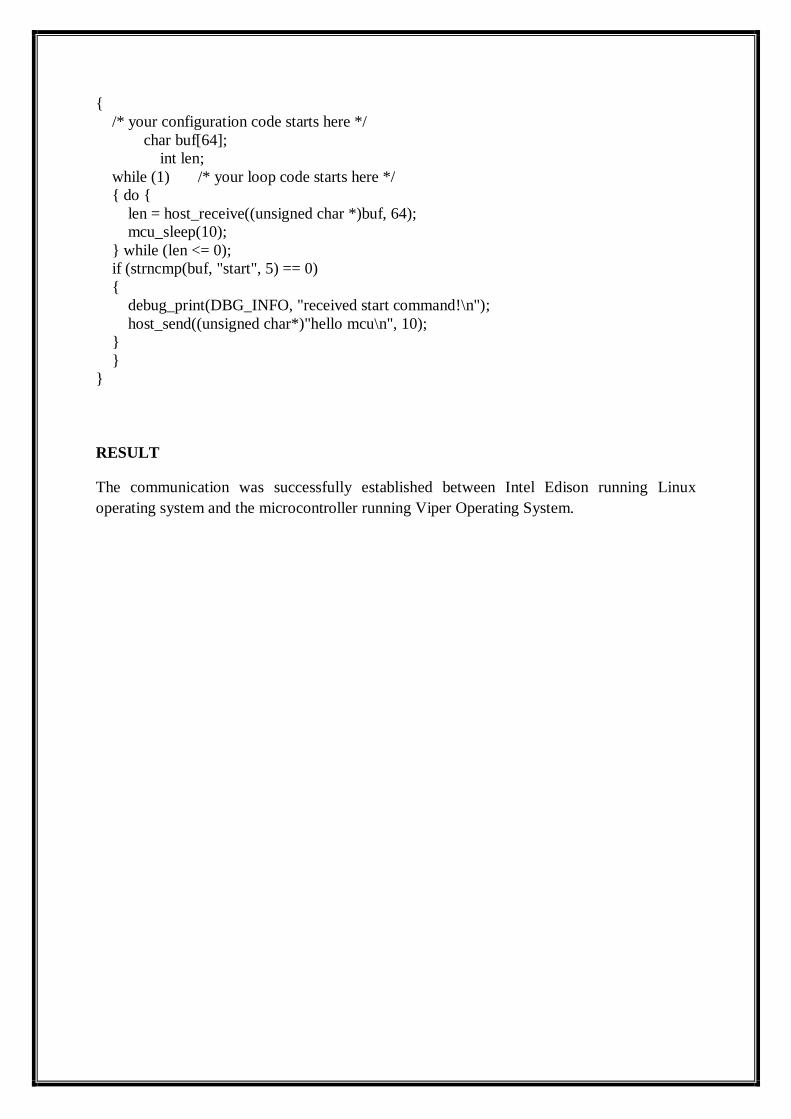
RESULT
The communication was successfully established between Intel Edison running Linux
operating system and the microcontroller running Viper Operating System.

EXPERIMENT 14
Intel VTune Amplifier For Systems on Host Environment
Aim
1. The aim of this experiment is to help the students learn and understand different
components of Intel VTune Amplifier for Systems 2015 in details.
2. On the basis of the text, answer the following questions.
Host Platform
Model: HP Pavilion dv6 Noteboook PC
Processor: Intel(R) Core(TM) i7-2670QM CPU @ 2.20GHz
Installed Memory (RAM): 2GB
System Type: 64 bit Operating System
Operating System: Windows 7
C++ Application
A hospital Management System was developed in Eclipse CDT. This System consists of two
main parts- The administrative mode and the Patient Mode. In the administrative mode, the
administrator can create a database and add all the relevant information about the doctors in
the hospital. There is also an option to display details of the doctor in the hospital. The user
function tells about the hospital’s history and all relevant information regarding the hospital.
The second main part- Patient mode allows a patient to view all the important information
related to the hospital in order to have an overview about it before booking an appointment
online. A provision is created in which the patient can register himself to book his
appointment with a particular doctor of the hospital. The last mode is the Exit Mode which
will terminate the program.
Hospital Management System Application on Eclipse
The application is completely user interactive and it depends totally on the user on how long
he would like to run the program without exiting from it. For example, the administrator can
add as many doctors as he wants to the list. Similary, the patient count is not static. The
program executes till the user chooses the relevant options in the menu.
The C++ application consists of 503 lines of code. The compiler used is MinGW Gcc.
Analysis of the application using Intel VTune Amplifier for Systems 2015
Intel VTune Amplifier for Systems is a part of Intel System Studio performance evaluation
tool which provides metrics for analysis of the application code and helps to find out where
there are bottlenecks in the system.
The analysis is divided into three modules:
1. Algorithm analysis
2. Micro architecture Analysis
3. CPU Specific Analysis
PROCEDURE:
1. Open VTune Amplifier 2015 for Systems.
2. New Project-> <Project Name>, <Location to save>
3. Project Properties window appears with the fields such as System Target [Remote
SSH/Android Device/Local) and Target Type(Launch Application/Attach to
Process/Profile System).
4. For this case study choose System Target->Local and Target Type->Launch
Application.
5. Select an executable file in the system and Click on OK.
6. Select any analysis that needs to be performed. For performance analysis Intel VTune
Amplifier for Systems needs to collect data samples. For that it needs to execute the
application program. Click on Start button on the page for data collection.
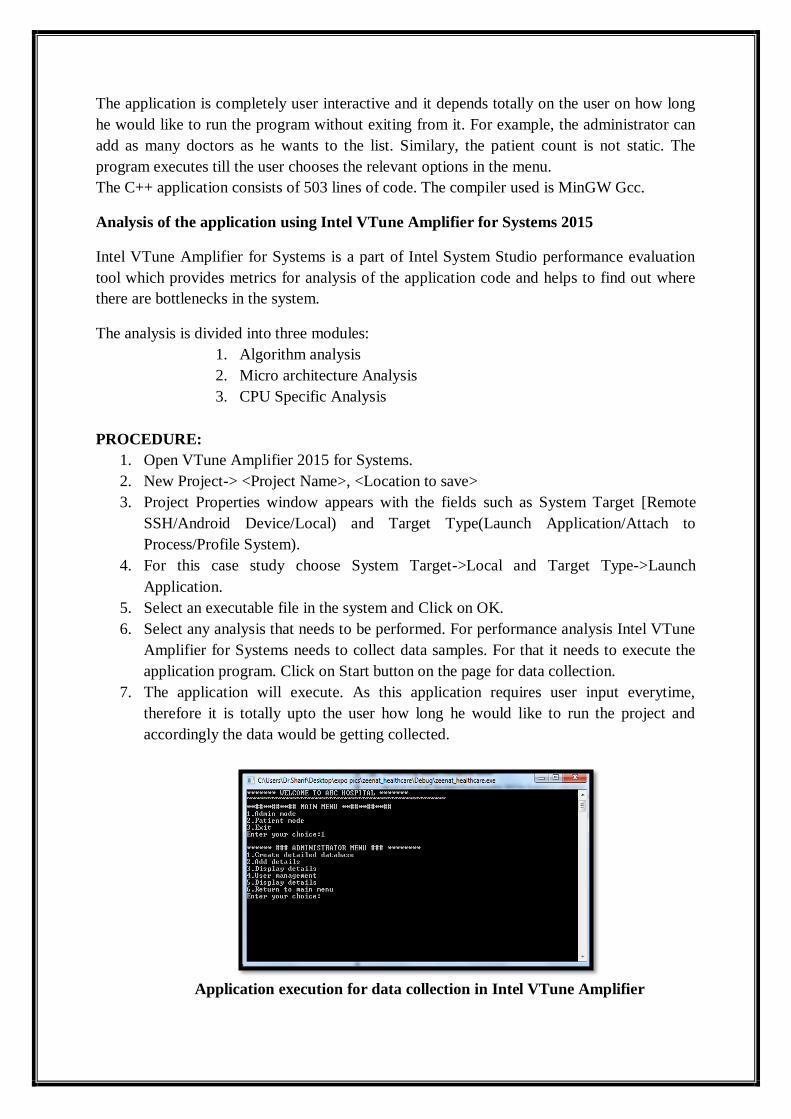
7. The application will execute. As this application requires user input everytime,
therefore it is totally upto the user how long he would like to run the project and
accordingly the data would be getting collected.
Application execution for data collection in Intel VTune Amplifier

8. After the data collection is finished, the result will be displayed of that particular
analysis. Also details of the platform is displayed in every analysis.
New Analysis Menu
MODULE 1: Algorithmic Analysis
To perform Algorithm Analysis to find where the algorithm choices are affecting the
performance of the application.
Basic Hotspots: This metric identifies the most time consuming code in the application. It
uses user mode sampling and trace collection. We just get to know how much time it took to
collect the data samples and the time CPU took to run the code. It is software based sampling
technique and has resolution of 10ms.
Target Platform Information
Advanced Hotspots: It also finds the most time consuming code in the application by
extending the hotspot analysis and collecting call stacks, context switch and statistical call
count data and also analyzes the CPI(cycles per instruction) metric. It is a hardware based
sampling technique with resolution of 1ms.
The advantages of hardware based sampling technique over software based sampling
technique includes:

a) Low overhead access to a wealth of detailed performance related information which
includes CPU’s functional unit, memory units like the cache memory and the main
memory.
b) No source code modification needed in general.
In advanced hotspots the following parameters can be evaluated:
Elapsed Time: The time between the beginning to the end of sample collection.
Instructions Retired: Total number of instructions executed while collecting the samples.
CPI (Cycles per Instruction) : It is a performance metric which indicates how much time
each executed instruction took. Theoretically the best CPI is 0.25 as the superscalar processor
can execute upto four instructions per cycle. But sometimes we get very high CPI (greater
than 1), which could be due to many reasons such as memory stalls, instruction starvation,
branch mispredictions or long latency instructions.
CPU frequency: This is the ratio between the actual and the nominal CPU frequencies. The
value 1.0 indicates that the CPU is operating in turbo boost mode.
Paused Time: It is the amount of time during which the analysis was paused either from GUI,
CLI Command line or user APIs.
Spin Time: It is the wait time during which the CPU is busy in some other activity other than
the application For examples, some synchronizing API causes the CPU to poll while the
software thread is waiting. Excessive spin time may not be good as it would decrease
productive work.
Overhead Time: it the time taken on overheads like the synchronization and threading APIs.
Effective Time: It is the actual time spent on the user code.
i.e. Effective Time = CPU Time – Spin Time – Overhead Time.
QoS Details

The figure shown above is a part of the summary table that enumerates the performance
values along with their metrics. On clicking on these metrics, the detailed insight into the
functions and modules responsible for these performance values appear. By looking into
these functions and modules, we can get to know which all functions have their instructions
retired[1-While executing the healthcare application 6,600,000 instructions had retired]and in
what all modules, synchronization issues have led to spin time in the application [IV-The spin
time of the application was 0.001 seconds]. A detailed view of the top hotspots functions
denoting how much CPU time each one is consuming is also presented (II). We can also get
to know which all functions are actually running in the user code in the CPU known as
effective time by utilization (III).
On clicking on any of these functions, we can view the assembly language code or source
code along with the memory address if it is available. If possible, we can also make
modifications in the code in order to improve the performance of the application.
Hotspot information
Top Hotspots: This enumerates the different modules in the code taking maximum CPU time
along with the time taken.
There are different ways to view and analyze these time consuming functions running on the
hardware platform.
In Top Down Approach, the names of the modules taking maximum CPU time along with
their functions is shown. How well the function is running in the CPU can be evaluated with
the performance metric like the OK, Poor, Idle, Ideal and Over Utilization markers. The CPU
time, number of instructions retired in each function is shown as in the figure.

The bottom up approach starts with the CPU cores and extends upto threads i.e.The
representation is such as it first displays the functions or sub-functions and then moves to the
higher threads and call stacks. The analysis is divided into groups and the user can select the
group and view
the results in that
particular
manner.
Bottom up and Top down approach
Graphical Analysis: Graphical evaluation can be performed through various ways –
evaluating the entire process and detailed analysis of the subprocess, evaluation of the
application thread(with Thread ID), analysis of the CPU cores, logical units to evaluate the
performance of the application in the CPU. Graphical Markers of spin time and wait time,
CPU time and hardware events are placed on the graph to represent how the thread is running
in the CPU core.
.
Thread in the CPU core

CPU histogram is another such graphical representation which shows the wall time in which
specific number of CPUs runs simultaneously. The performance metric characterizes the
performance in the category of Idle, Poor, OK and Ideal. As there is only a single application
thread, therefore most of the time the CPU is idle and averagely utilized by the application
thread.
The Hardware Event Count Viewpoint displays the estimated event count for all the
monitored event. It uses hardware event based collection.
Concurrency: This analysis is used to analyze how the thread is using the available logical
units and where parallelism is leading to overheads.
In this parameter, there is a module named hotspots by thread concurrency which denotes the
functions taking maximum time in the CPU. As there is just a single application thread
therefore, there is no thread concurrency and there are no markers in the graphical
representation.
Locks and Wait Analysis: It is used to identify the synchronization objects with high wait
count that under-utilize the available cores.
Wait count: It denotes the number of times the software thread has to wait for API that block
or cause synchronization.
Total Thread Count: It denotes the total application thread which is 1 here.
Top Waiting Objects header lists the top waiting objects in the application code. Reasons like
specific calls, wait for I/O and synchronization objects lead to wait for specific objects.
Wait Time denotes the total time spent on waiting due to synchronization objects.

Spin Time and Pause Time have the same definitions as mentioned in the advanced hotspot
section.
QoS parameters
On clicking on the performance metric, we get to know the detailed wait count of the
application. The modules causing waits in the application along with their wait count
breakdown is presented in [1]. There are seven top waiting objects in the application and their
wait counts are mentioned just beside them. The objects are further divided into threads and
functions and call stacks which give an insight to the user on where exactly waiting is taking
place. The wait time of each of the objects is presented in [2]. Again we can view the source
file or the assembly code along with their addresses by clicking on the function.
Functions in the CPU
For example, in the above mentioned figure, contains a list of objects which are causing wait
counts in the module. These are further divided into thread along with their thread ID, the
functions and the call stack along with how much time each of these functions is taking.
Caller/Callee: This section is used to analyze the hot sub-tree. It consists of all the functions
in the application with their performance evaluation by the wait time-total and self and wait
count-total and self parameters.

Functions and their wait counts
The graphical representation of the locks and wait is as follows showing all the metrics on
the timeline:
Timeline and Bottom up approach
The figure shows the process and with the Thread ID and waits on the CPU timeline. The
functions running on the thread are represented on the bottom up approach and relationship
between the graph and the bottom up approach technique is presented.
MODULE 2:Microarchitecture Analysis
To perform Microarchitecture Analysis which is a hardware level analysis type to
understand where the application is not using the hardware resources efficiently.
General Exploration: This parameter is used to analyze general issues affecting the
performance of the application. This analysis type is based on hardware event based sampling
collection.

Elapsed time: Total time between the beginning and the end of collection.
Clockticks: Total Number of cycles to execute the instructions.
Instructions Retired: Total Number of instructions executed
CPI: Same as mentioned in the Advanced Hotspots function.
MUX Reliability: As the number of hardware events are more than the number of hardware
counters, event multiplexing is used to share the hardware counters and collect different
subsets of event over time and this may affect the precision of the events collected.
Paused Time: the duration of time during which the analysis was paused either via the GUI
or the command line.
Performance evaluation of functions
In the figure, the above mentioned performance metric – Clockticks, Instructions Retired,
CPI rate are mentioned. When we click on any of these metrics, example, clockticks, we get a
list of functions and sub-division of clockticks among these functions. Again, on clicking on
these functions, we get the source code or the assembly code along with the starting address.
Filled pipeline slot: A thread can issue work upto four pipeline slots but fewer than four
pipeline slots may get filled whether due to front end experiencing some problem generating
micro-operand or stalls in the back-end. This metric displays the proportion of slot that may
have been filled but cancelled after issue.
Retiring: The number of instructions in the pipeline slot going to the backend in that cycle
constitutes the useful work. Due to errors such as unable to fetch instructions and decode
them properly in time (Front – end bound execution) and back-end not prepared to access
more than a certain kind of instructions at that time (Back – end bound execution), the useful
work cannot reach its peak value. The front end bound exception may be due to large code
set, poor code layout or microcode assists, whereas the back – end execution may be due to
long latency for operations or due to other contention for resources.
Assists: Certain corner operations cannot be handled in the execution unit. Therefore, certain
micro-code needs to be added to the pipeline to perform these operations. These micro-code

could be hundreds of line long and hence may add overhead to the code and deteriorate the
performance of the system.
Bad Speculation: Superscalor architecture consists of ‘front end’, where the instructions are
fetched and decoded into micro-operands and the backend where the instructions are
instructions are executed. In each cycle, the front end can generate upto four instructions into
the pipeline slots which eventually go to the backend. The number of instructions in the
pipeline slot going to the backend in that cycle constitutes the useful work. Due to errors such
as unable to fetch instructions and decode them properly in time (Front – end bound
execution) and back-end not prepared to access more than a certain kind of instructions at
that time (Back – end bound execution), the useful work cannot reach its peak value. The
front end bound exception may be due to large code set, poor code layout or large code set,
poor code layout or microcode assists, whereas the back – end execution may be due to long
latency for operations or due to other contention for resources.
Branch Mispredict: Due to branch mispredictions, a few pipeline slots may get filled by
unwanted instructions and these instructions waste the cycles as they wouldn’t have been
executed if correct instructions were issued. This metric presents the ratio of wasted cycles
due to branch mispredictions to all the cycles.
The above mentioned figure displays the filled pipeline performance evaluation metric. It can
be seen that the application doesnot have any bad speculation or branch mispredict and thus it
is free from these errors.
Pipelining performance evaluation
Unfilled pipeline slots(Stalls):
Back end bound: A significant amount of pipeline slot may remain empty. When operations
take too long in the backend, they introduce bubbles in the pipeline that result into fewer
pipeline slots getting filled with useful work that the machine can support. This results into

slower execution. Operations like divides and memory operations result into these types of
error.
DIVIDER: Divider operations which are executed in the DIV unit take a longer amount of
time to execute than other arithmetic instructions like multiply, addition and subtraction.
Flag Merge Stalls: Some instructions have longer latency on Intel architecture code named
Sandy Bridge. Operations such as shift cl have potentially longest flag merge stalls. It denotes
how flag merge affect the performance of the application.
Slow LEA Stalls: Some instructions have longer latency on Intel architecture code named
Sandy Bridge. Three operand LEA instructions have increased latency and reduced port
choices compared to other instructions. This parameter denotes how LEA affects the
performance of the application.
The application doesnot have any back-end bound performance issues like divider, Flag
Merge Stalls or slow LEA Stalls.
Memory Latency: This problem is due to the latency in the memory hierarchy. The sub
parameters of this domain includes the following:
LLC miss: Before the DRAM, the LLC (Last Level Cache) is the last, longest latency cache
in the memory hierarchy. Any misses here in the LLC will be services by the DRAM with
significant amount of latency. This metric shows the ratio between the cycles with LLC miss
to all the cycles.
LLC Hit: Though LLC hit can service better than LLC miss, still a lot of penalties can take
place. This parameter presents such penalties due to shared data.
DTLB Overhead: Translation between virtual memory and physical memory requires page
table which is stored in the main memory. To avoid frequent movement to access the page
table in the memory, the latest version of the page table is stored in the cache. This metric
represents the miss in accessing the first data TLB and then going to the second data TLB and
performing hardware page walk on the STLB which causes unnecessary delay and overheads
in the system.
Contested Access occurs when data written by one thread is read out by another thread in
another core. Examples include false sharing, synchronizations such as locks, true data
sharing such as modified locks. This parameter demonstrates ratio of cycle generating
handling contested access to all the cycles.

Data Sharing: Data shared by multiple threads increases the latency due to cache coherency.
Excessive data sharing can drastically harm the performance of multithreaded applications.
The metric is defined as the ratio of cycles the system spends on managing cache coherency
to all the cycles.
Here, we get to know that the application doesnot contain any memory latency-LLC Miss,
LLC Hit, DTLB Overhead or data sharing issues.
Memory Replacement: Certain conditions result into memory operations to perform
pathologically in the core pipeline.
L1D Replacement Percentage: Then a line enters the L1 cache memory, another line needs
to be evicted. But when active lines which are used in the program are evicted, it results into
performance issues in the system as again they have to be brought back to the cache when
they are called. Thus this metric measures the percentage of all replacements due to each row,
for example, if there is a replacement due to functions then this parameter measures all the
replacement due to functions.
L2 Replacement: Then a line enters the L2 cache memory, another line needs to be evicted.
But when active lines which are used in the program are evicted, it results into performance
issues in the system as again they have to be brought back to the cache when they are called.
Thus this metric measures the percentage of all replacements due to each row, for example, if
there is a replacement due to functions then this parameter measures all the replacement due
to functions.
LLC Replacement: Then a line enters the LLC cache memory, another line needs to be
evicted. But when active lines which are used in the program are evicted, it results into
performance issues in the system as again they have to be brought back to the cache when
they are called. Thus this metric measures the percentage of all replacements due to each row,
for example, if there is a replacement due to functions then this parameter measures all the
replacement due to functions.
Memory Reissues: Many times useful data is ejected from the cache by less useful data.
When there are long latency memory loads and some critical data is not getting accessed at a
fast rate, then the memory replacement parameters under this metric can be explored to find
out the reason for this performance degradation.

Loads blocked by Store forwarding: A memory store saves the data from the store buffer to
the memory, while a LOAD the instruction from the memory to the processor. Sometimes,
memory load wants to access data that have not yet stored. In that situations, most of the
times the data is transferred from the memory store buffer to the processor bypassing the
physical store operation. Certain times, when reading occurs before writing, the loads are
blocked in the system. Thus this metric finds out the performance penalties due to these
blocked loads.
Split Loads and Split Stores: Data moves in the cache line in the granularity of 64 bytes per
line which is more than the required line granularity required for integer, float data types. For
these data types, the cache line can be split and then divided into two. For managing these
split loads/store, we have split registers in Intel Architecture. Problems arise when these split
registers which are used by other loads/stores are consumed by new split loads/stores in the
row.
4K Aliasing: When an earlier read occurs before a later write, WAR (Write-After-Read) error
may take place. To check if these errors exists in the system or not, the memory order buffer
MOB buffer checks the lower 12 bit of the memory load and the memory store to find out the
potential for hazards. If they match then the load is reissued. However as only 12 bits are
matched, false detection of the WAR could happen. This metric evaluates the performance
penalties of handling such false detection.
As seen in the figure, there is no memory replacement or memory reissues error in the
application. The percentage of all memory replacement due to each function is zero.
Memory Performance Evaluation
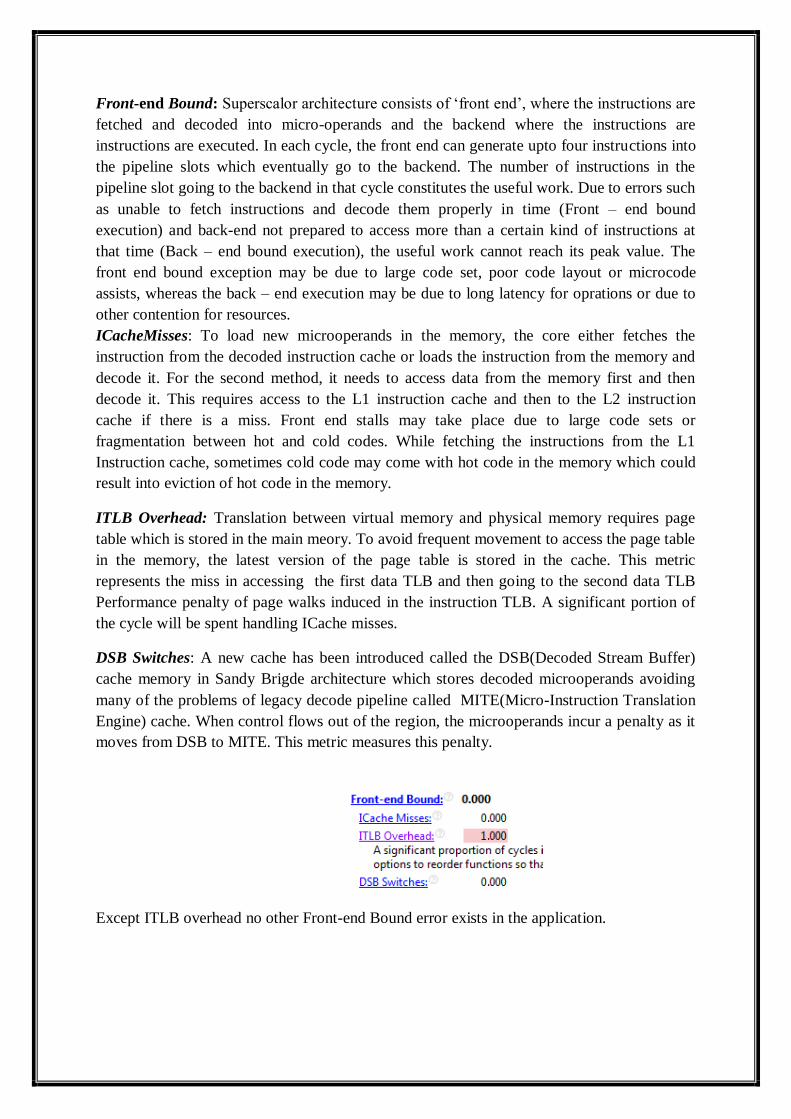
Front-end Bound: Superscalor architecture consists of ‘front end’, where the instructions are
fetched and decoded into micro-operands and the backend where the instructions are
instructions are executed. In each cycle, the front end can generate upto four instructions into
the pipeline slots which eventually go to the backend. The number of instructions in the
pipeline slot going to the backend in that cycle constitutes the useful work. Due to errors such
as unable to fetch instructions and decode them properly in time (Front – end bound
execution) and back-end not prepared to access more than a certain kind of instructions at
that time (Back – end bound execution), the useful work cannot reach its peak value. The
front end bound exception may be due to large code set, poor code layout or microcode
assists, whereas the back – end execution may be due to long latency for oprations or due to
other contention for resources.
ICacheMisses: To load new microoperands in the memory, the core either fetches the
instruction from the decoded instruction cache or loads the instruction from the memory and
decode it. For the second method, it needs to access data from the memory first and then
decode it. This requires access to the L1 instruction cache and then to the L2 instruction
cache if there is a miss. Front end stalls may take place due to large code sets or
fragmentation between hot and cold codes. While fetching the instructions from the L1
Instruction cache, sometimes cold code may come with hot code in the memory which could
result into eviction of hot code in the memory.
ITLB Overhead: Translation between virtual memory and physical memory requires page
table which is stored in the main meory. To avoid frequent movement to access the page table
in the memory, the latest version of the page table is stored in the cache. This metric
represents the miss in accessing the first data TLB and then going to the second data TLB
Performance penalty of page walks induced in the instruction TLB. A significant portion of
the cycle will be spent handling ICache misses.
DSB Switches: A new cache has been introduced called the DSB(Decoded Stream Buffer)
cache memory in Sandy Brigde architecture which stores decoded microoperands avoiding
many of the problems of legacy decode pipeline called MITE(Micro-Instruction Translation
Engine) cache. When control flows out of the region, the microoperands incur a penalty as it
moves from DSB to MITE. This metric measures this penalty.
Except ITLB overhead no other Front-end Bound error exists in the application.

Pipeline performance Evaluation
BANDWIDTH
It shows event hardware based metric to quantify bandwidth over time and show code regions
where the application is generating significant bandwidth to DRAM.
Memory bandwidth is the rate at which the data can be read from or write into the semi-
conductor memory of the processor.
The bandwidth is divided into average bandwidth, read bandwidth and write bandwidth.
Memory Bandwidth of the application
The graphical representation shown over here displays the average bandwidth of the
application, the read and the write bandwidth of the application in GB/seconds.

Detailed analysis of bandwidth
This figure demonstrates that on bandwidth analysis, we will get the summary of the sample
metric collected like CPU Time, Instructions Retired, CPI Rate, LLC Miss and Paused Time.
On clicking the package option, another window opens up demonstrating the read, write and
total bandwidth in graphical manner. Also, a list of all the functions in the package along with
detailed performance metric like CPU time, CPI Rate and Instructions Retired of each
function appears. On clicking on any of these functions, we can get an insight into the
assembly language code of that module along with its memory address.
MODULE 3: Sandy Bridge Architecture
To perform hardware level Analysis on processors based on Intel micro architecture
codenamed Sandy Bridge to evaluate where the hardware resources are not used efficiently.
Access Contention: This metric is used to count the number of events in the hardware event
monitoring using the hardware event based collection method.
1) The hardware event metric displays detailed count of all the hardware events as
shown in the figure.
2) The Performance Monitoring Unit is found in the high end processors which is a
hardware unit built inside processor to monitor its performance parameters such as
hardware event count by hardware event types, LLC cache hits, LLC cache misses
and the number of instructions retired depending on the support provided by
hardware platform.

Hardware event counts
On the summary page, we get the hardware events and the sample count of each event. On
clicking on any of these event, we get the names of the functions were these events are
occurring along with detailed event distribution of each function. On clicking on these
functions, we get the source code along with the source address of each function.
For pictorial representation, we can select any of the hardware events and it will show at what
time it is running in the CPU and in which core and logical unit.
Branch Issues: This parameter is used to analyze branch issues which may lead to wasted
work, increasing application runtime and more power consumption. This parameter displays
a list of branch misprediction hardware event types and event count.
Hardware event counts
As it can be seen in the figure, the Branch Misprediction parameter consists of various
events. To view where that particular event exists, we can click on that event and another
window opens up where one can dive into the detailed function description of all events
along with their hardware event sample count and events per sample metrics.
In the pictorial representation, it can be seen that as there is no
BR_MISP_RETIRED.TAKEN_PS , there are no markers present on the timeline for that
particular core or hardware context on the CPU.
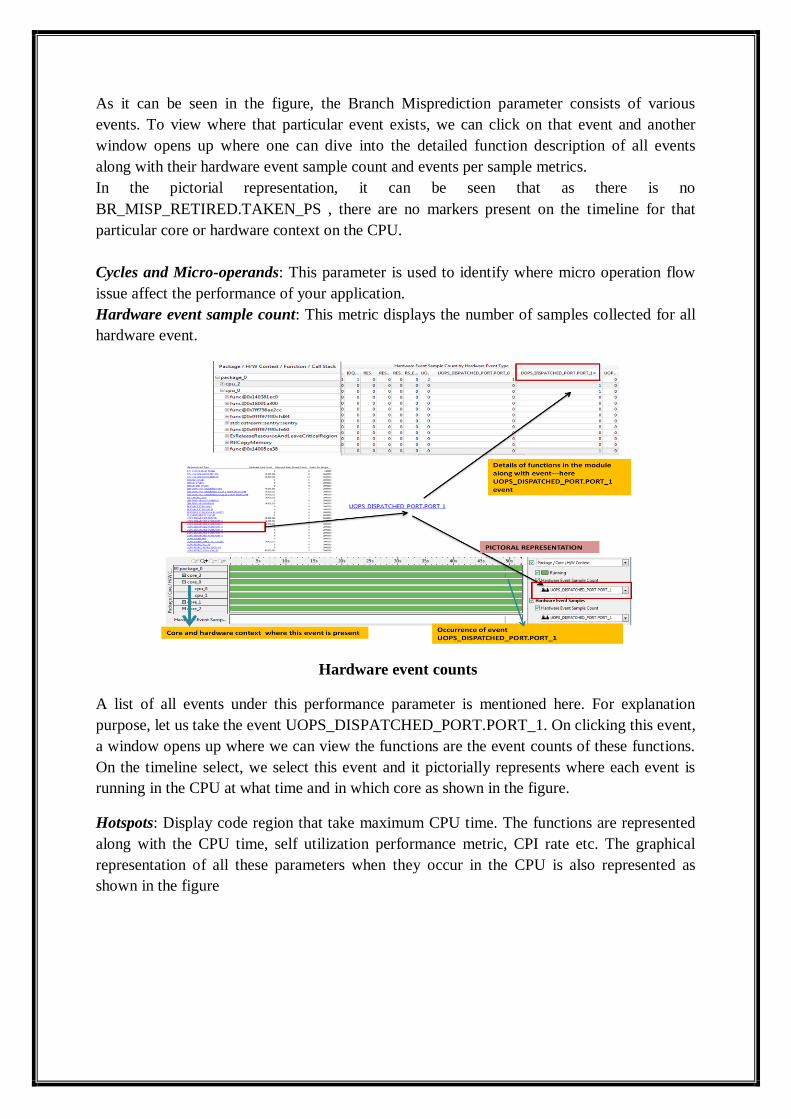
Cycles and Micro-operands: This parameter is used to identify where micro operation flow
issue affect the performance of your application.
Hardware event sample count: This metric displays the number of samples collected for all
hardware event.
Hardware event counts
A list of all events under this performance parameter is mentioned here. For explanation
purpose, let us take the event UOPS_DISPATCHED_PORT.PORT_1. On clicking this event,
a window opens up where we can view the functions are the event counts of these functions.
On the timeline select, we select this event and it pictorially represents where each event is
running in the CPU at what time and in which core as shown in the figure.
Hotspots: Display code region that take maximum CPU time. The functions are represented
along with the CPU time, self utilization performance metric, CPI rate etc. The graphical
representation of all these parameters when they occur in the CPU is also represented as
shown in the figure

Hotspots and their performance Metric
The hotspot viewpoint demonstrates the functions occupying maximum CPU time along with
their performance metric. The pictorial representation shows the performance parameters in
the CPU along with the different cores and logical units.
TSX Viewpoint: In this figure, on clicking on the performance metric of the summary table,
we get the detailed description of the functions which are having precise clockticks. In
precise clockticks, the program unit clock cycles are considered without its callees.
Details of the QoS parameters
Core Port Saturation: This has events that analyze how the core port saturation affects the
performance of your application at per core granularity.
TSX Exploration: Metrics related to Intel Transactional Synchronizations Extensions. This
metric helps to identify how efficiently INTEL TSX is used.

TSX Exploration Viewpoint
In this figure, on clicking on the performance metric of the summary table, we get the
detailed description of the functions which are having precise clockticks. In precise
clockticks, the program unit clock cycles are considered without its callees.
On the basis of reading of the text, develop an application on Eclipse CDT and
demonstrate the following:
1. Demonstrate the concept of bottom- up approach and top-down approach.
2. Demonstration of thread running in the processor unit.
3. To find the most time consuming modules in the application and calculate its
performance parameters.
4. To understand and demonstrate the pipeline bottlenecks that could occur in the
processor while running the application.
5. To understand and demonstrate the memory issues that could occur in the processor
while running the application.
6. To understand and demonstrate the branching issues that can occur in the processor
while running the application.
7. Demonstration of bandwidth details of the application.

EXPERIMENT 15
Aim: To execute an application on Intel Edison using Intel System Studio 2015
toolchain.
HOST
Model: HP Pavilion dv6 Noteboook PC
Processor: Intel(R) Core(TM) i7-2670QM CPU @ 2.20GHz
Installed Memory (RAM): 2GB
System Type: 64 bit Operating System
Operating System: Windows 7
TARGET
Intel Edison
Processor: Intel Atom 34XX SoC
Installed memory (Flash): 4GB
Operating System: Poky Linux 1.6
REQUIREMENTS
Intel Edison, Connecting wires, Internet connection, Putty, Eclipse CDT, Intel System
Studio 2015
EXPERIMENTAL SETUP
Experimental Setup for target platform
PROCEDURE:
1. Open iotdk-ide-win. Select devkit-launcher.
2. Now by default, this IOT IDE doesnot contain any repositories of Intel System Studio
2015. Therefore, we need to add Intel System Studio Repositories to it add Intel
System Studio 2015 Components.
iot-ide-win->Help->Install new Software->Add-><Directory of Intel System Studio
2015.1.039>/eclipse_support/cdt8.0/eclipse

Adding Intel System Studio to Eclipse
3. File-> New->C++ Project->Name of Project->Tool Chain (Intel System Studio).
Creating a new project in Eclipse CDT with ISS toolchain
4.Now we need to add Intel System Studio Compiler Path
Project->Properties->Settings->Intel System Studio Settings
Sysroot=<path of iotdk-ide-win/devkit-x86/sysroot>
GNU Prefix=i586-poky-linux-
This settings are needed to add the path of the target compiler. Here, the target platform is
Intel Edison running Poky Linux 1.6.

Eclipse Settings to use Intel System Studio Components
5. Write the code in the workspace.
6. Build the project.
7. Now create a remote connection between the host machine and target system-Intel
Edison. For that refer how to connect Intel Edison to the Wi-Fi network and get IP of
Edison.
Remote System Explorer->New connection->SSH only->Host Name: Type the IP
address of the Edison Board (here, 192.168.0.102)->Connection Name: give any
name(here, Edison-Zeenat)-> In properties Window->Default User ID: root.
Right click on the Edison connection->Connect ->type in the password of your Edison
board and you are connected to your Edison Board.
Remote Connection with Intel Edison
8. To debug the Run ->Debug Configurations->Connection (Edison-Zeenat)->Remote
absolute file path for C++ Application (/tmp/filename)->Debug.

9. A window opens up where we can view the disassembly of the code. On remote shell
we can view the basic commands on the remote shell and information of the port and the
process ID in remote debugging.
Remote Debugging from Eclipse on Intel Edison
10. To run the Code on the Edison, Select the project ->Run->Run Configurations->
Remote Absolute file path for C++ Application (/tmp/project name)-> Command to
execute before application(chmod 755 /tmp/project name).
Run Configuration Settings

11. The console of Intel Edison console opens up and here, we can see the program
execution.
Output on Intel Edison Console in Eclipse
Answer the following questions
1. To demonstrate the concept of remote compilation and remote debugging.
2. To demonstrate the concept of toolchain-SDK .

EXPERIMENT 16
Intel VTune Amplifier For Systems on Intel Edison (Target Platform)
AIM: To create remote connection between Intel VTune Amplifier 2015 for Systems
and the Intel Edison
REQUIREMENTS
Putty, Puttygen, Plink, pscp, Intel VTune Amplifier 2015 for Systems,Intel Edison and
Internet Connection
HOST
Model: HP Pavilion dv6 Noteboook PC
Processor: Intel(R) Core(TM) i7-2670QM CPU @ 2.20GHz
Installed Memory (RAM): 2GB
System Type: 64 bit Operating System
Operating System: Windows 7
TARGET
Intel Edison
Processor: Intel Atom 34XX SoC
Installed memory (Flash): 4GB
Operating System: Poky Linux 1.6
EXPERIMENTAL SETUP
Experimental Setup for VTune Amplifier with Intel Edison
PROCEDURE
1. Set up a passwordless SSH
1. The host and the target system-Intel Edison should be connected to the same
network. To connect Intel Edison to the Internet through its built-in WiFi module ,
refer to experiment on ‘Configuring Intel Edison Wi-Fi’.

2. Open puttygen.exe. Click on ‘generate’ to generate a public key and save this key
for future references.
Putty key generation
A. Login into the Intel Edison using SSH connection, copy the key into .ssh
file.
a. root@igdtuw: vi ~/ .ssh/authorized_keys
b. Copy the key generated
c. Exit from this editor
B. Open Putty, SSH->Auth->Browse for the saved key (.ppk) file.
C. Data->Connection->Auto-Login Username= ‘root’.
D. Session->Connection Type: SSH. Type IP address of Edison and port:22
and save the settings
E. Now, on successfully completing these steps, we have generated a
passwordless SSH
Password SSH access to Intel Edison
2. Copy the files of Intel VTune Amplifier into the Intel Edison /opt/ directory.
As there are no inbuilt drivers or files for remote collection of data, therefore, we need to
add vtune_amplifier_target_x86.tgz to the/opt/intel folder. As we donot have intel folder,
therefore create one using the command: mkdir intel.
3. To copy the folder remotely, use the pscp command in the Windows Command Line.

Remote package transfer from host to target platform on Intel Edison
Open the command line-> Change directory to putty directory ->Use the following command
to copy the files.
pscp “<installation directory of Intel System Studio>\VTune Amplifier 2015 for
Systems\target\linux32\vtune_amplifier_target_x86.tgz”
[email protected]:/opt/intel
You will get the files in the directory.
4. Open VTune Amplifier for Systems. New Project (Name of Project).
Project Properties: Target System->Remote Linux (SSH)
SSH Details:[email protected]:22
Target Type ->Launch Application and then select the application.
Installation Target Directory ->
/opt/intel/Vtune_amplifier_2015_for_systems.1.1.304110
Application->/tmp/<filename>
Configuration Settings in Intel Edison
5. On successful connection establishment, a new window will open for new analysis.

New Analysis of Intel VTune for Intel Edison
6. Select the analysis type that you want to select and click on start. The program will
execute. When you want to stop the execution, click on terminate button. Intel VTUne
will take time to collect data and copy them to the host folder. After some time, open the
analysis file to view the result.
RESULT
The results of the analysis is shown in the figure below:
Platform Information of Intel Edison
Here the general architecture evaluation when the program is executing in the Intel Edison is
demonstrated.
The graphical representation of the hardware event is depicted.
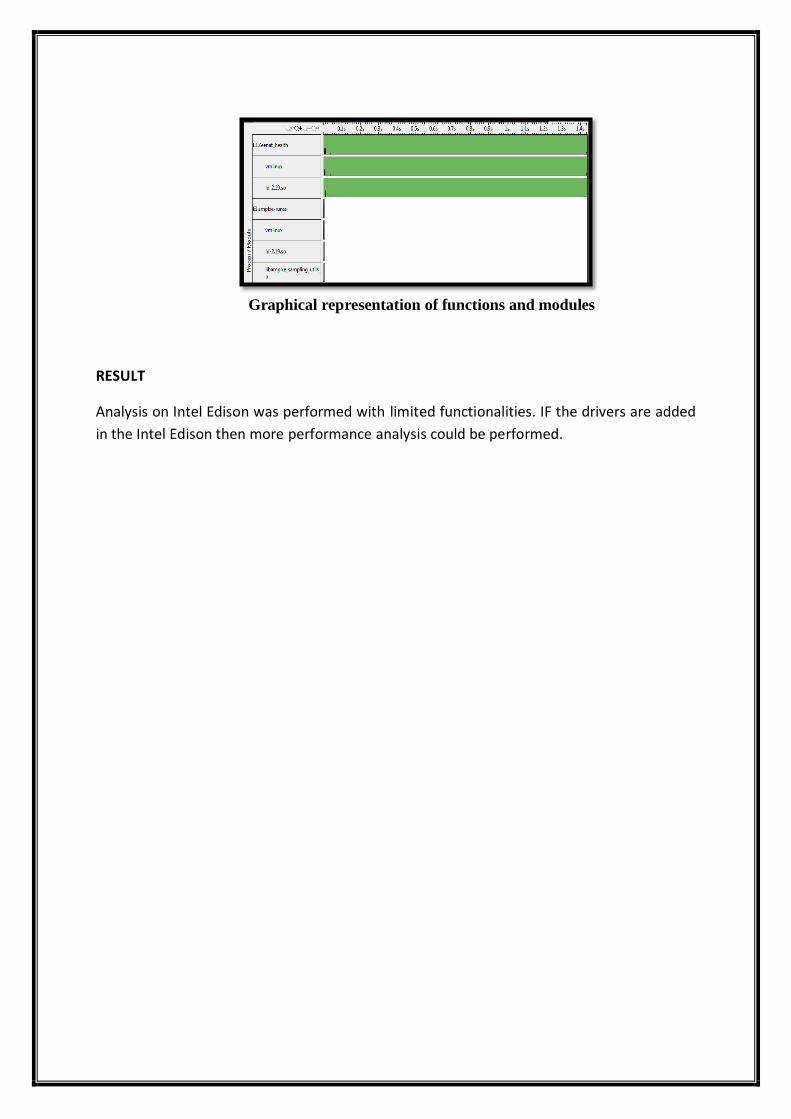
Graphical representation of functions and modules
RESULT
Analysis on Intel Edison was performed with limited functionalities. IF the drivers are added
in the Intel Edison then more performance analysis could be performed.

EXPERIMENT 17
AIM: To evaluate the healthcare application using Intel Inspector 2015 for Systems.
TARGET PLATFORM
Model: HP Pavilion dv6 Noteboook PC
Processor: Intel(R) Core(TM) i7-2670QM CPU @ 2.20GHz
Installed Memory (RAM): 2GB
System Type: 64 bit Operating System
Operating System: Windows 7
C++ Application
A hospital Management System was developed in Eclipse CDT. This System consists of two
main parts- The administrative mode and the Patient Mode. In the administrative mode, the
administrator can create a database and add all the relevant information about the doctors in
the hospital. There is also an option to display details of the doctor in the hospital. The user
function tells about the hospital’s history and all relevant information regarding the hospital.
The second main part- Patient mode allows a patient to view all the important information
related to the hospital in order to have an overview about it before booking an appointment
online. A provision is created in which the patient can register himself to book his
appointment with a particular doctor of the hospital. The last mode is the Exit Mode which
will terminate the program.
Images showing the Hospital Management System Application on Eclipse CDT

The application is completely user interactive and it depends totally on the user on how long
he would like to run the program without exiting from it. For example, the administrator can
add as many doctors as he wants to the list. Similary, the patient count is not static. The
program executes till the user chooses the relevant options in the menu.The C++ application
consists of 503 lines of code. The compiler used is MinGW Gcc.
Analysis of the application using Intel Inspector 2015 for Systems
Intel Inspector for Systems is an evaluation tool that performs memory error analysis
and thread error analysis for an application running in the CPU.
The analysis is divided into two modules:
4. Memory Error Analysis
5. Thread Error Analysis
PROCEDURE:
1. Open Intel Inspector 2015 for Systems.
2. New Project-> <Project Name>, <Location to save>
3. Project Properties Window appears where an executable file needs to be selected
for analysis.
4. Select new analysis option.
5. A window appears where there are two types of analysis present- Memory Error
Analysis and Thread Error Analysis.
6. Select the one you would like to evaluate.
7. Click on start to start the analysis by collecting data. The program will execute for
sample collection.

8. Any errors if present in the system will be displayed along with other related
information.
MODULE 1:
Detection of memory errors while application is executing in the processor. This type of
analysis increases the load on the system and time and resources to perform analysis.
This module is divided into three sub-analysis types depending on how much overhead they
introduce in the system.
1. Detect Leaks
2. Detect Memory Problems
3. Locate Memory Problems
Detect Leaks: Narrowest scope of error analysis. It introduces least time and resource
overhead on performing analysis on the system.
Detect Memory Problems: It is a medium scope data analysis type and increases the
load and time on the system for performance evaluation of the application.
Locate Memory Problems: It is a widest scope error analysis tool and captures the
widest scope of error along with the error details. It results into maximum time and
memory overhead on the system.
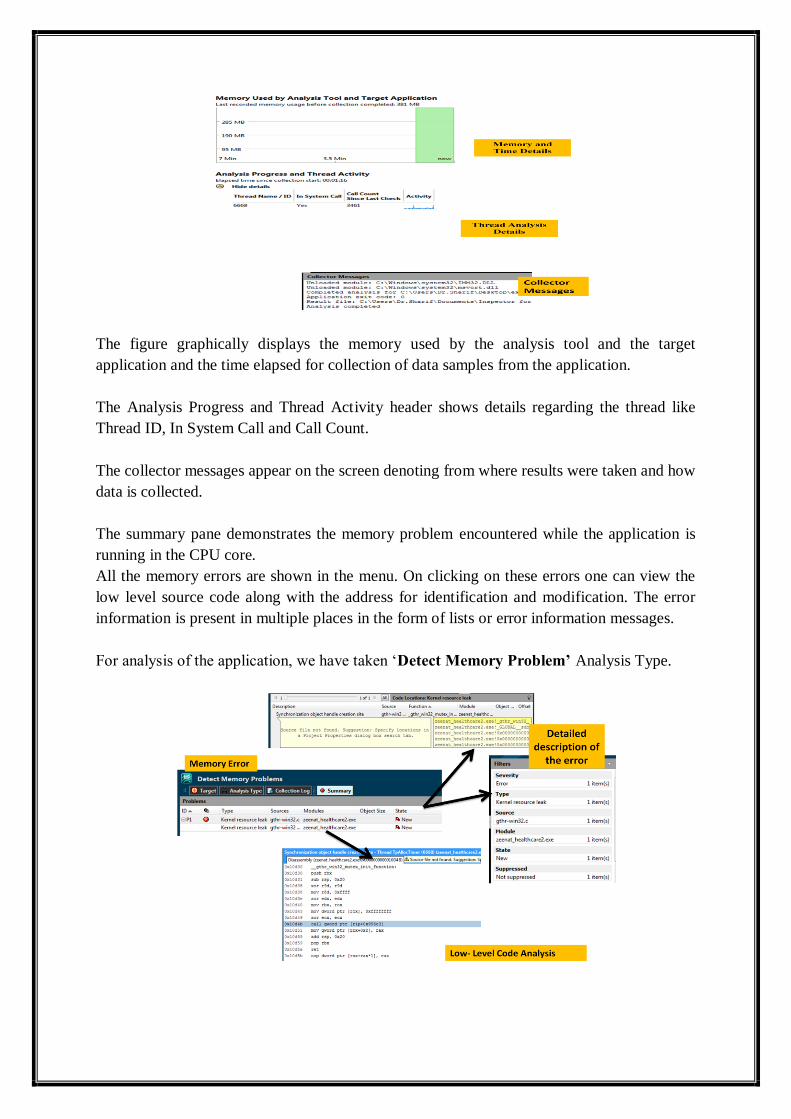
The figure graphically displays the memory used by the analysis tool and the target
application and the time elapsed for collection of data samples from the application.
The Analysis Progress and Thread Activity header shows details regarding the thread like
Thread ID, In System Call and Call Count.
The collector messages appear on the screen denoting from where results were taken and how
data is collected.
The summary pane demonstrates the memory problem encountered while the application is
running in the CPU core.
All the memory errors are shown in the menu. On clicking on these errors one can view the
low level source code along with the address for identification and modification. The error
information is present in multiple places in the form of lists or error information messages.
For analysis of the application, we have taken ‘Detect Memory Problem’ Analysis Type.

MODULE 2:
Detection and analysis of Threading Error in the application running in the CPU.
This module has three sub-module analysis types depending on the amount of overhead and
time and resources it uses for analysis.
1. Detect Deadlock.
2. Detect Deadlock and Data Races
3. Locate Deadlock and Data Races
Detect Deadlock: Narrowest scope of error analysis. It introduces least time and resource
overhead on performing analysis on the system.
Detect Deadlock and Data Races: It is a medium scope data analysis type and increases
the load and time on the system for performance evaluation of the application.
Locate Deadlock and Data Races: It is a widest scope error analysis tool and captures
the widest scope of error along with the error details. It results into maximum time and
memory overhead on the system.
For the application, the ‘Locate Deadlock and Data Races’ was selected and result was that
no such deadlock or data races error were present in the module.
RESULT
The memory and thread errors were analyzed for the healthcare application.