EVALUATION OF ILLNESS PERCEPTIONS AND THEIR …
41
EVALUATION OF ILLNESS PERCEPTIONS AND THEIR ASSOCIATIONS WITH GLYCAEMIC CONTROL, CHRONIC KIDNEY DISEASE AND MEDICATION ADHERENCE IN TYPE 2 DIABETES MELLITUS PATIENTS AT HOSPITAL PULAU PINANG SHAMILA BALASUBRAMANIAM UNIVERSITI SAINS MALAYSIA 2018
Transcript of EVALUATION OF ILLNESS PERCEPTIONS AND THEIR …

EVALUATION OF ILLNESS PERCEPTIONS AND
THEIR ASSOCIATIONS WITH GLYCAEMIC
CONTROL, CHRONIC KIDNEY DISEASE AND
MEDICATION ADHERENCE
IN TYPE 2 DIABETES MELLITUS PATIENTS
AT HOSPITAL PULAU PINANG
SHAMILA BALASUBRAMANIAM
UNIVERSITI SAINS MALAYSIA
2018

EVALUATION OF ILLNESS PERCEPTIONS AND
THEIR ASSOCIATIONS WITH GLYCAEMIC
CONTROL, CHRONIC KIDNEY DISEASE AND
MEDICATION ADHERENCE
IN TYPE 2 DIABETES MELLITUS PATIENTS
AT HOSPITAL PULAU PINANG
by
SHAMILA BALASUBRAMANIAM
Thesis submitted in fulfilment of the requirements
for the degree of
Master of Science
May 2018

ii
ACKNOWLEDGEMENT
First and foremost, I would like to express my sincere gratitude and appreciation to
my main supervisor, Dr. Balamurugan Tangiisuran, who has supported, encouraged
and offered invaluable advice to me throughout the journey of obtaining my master’s
degree. At times when I felt discouraged or disillusioned, he was always there to offer
his guidance. His kindness, patience and competence will never be forgotten.
My deep gratitude goes to Dr. Lim Shueh Lin, Consultant Endocrinologist at Hospital
Pulau Pinang for the constant support she offered throughout the field work and data
collection. I would like to thank Dr. Nor Azizah Aziz and Dato’ Dr. Ong Loke Meng
for granting permission to conduct the research at the Endocrinology Department at
Hospital Pulau Pinang in cooperation with the Clinical Research Centre. My
appreciation is also due to Dr. Prof. John Weinman for permission to use the IPQ-R.
Special thanks to Dr. Goh Lay Hoon and Dr. Sivasangari Subramaniam from the
Clinical Research Centre at Hospital Pulau Pinang for their support and assistance
during data collection. I also owe my gratitude to the patients who participated in this
study.
Last but not least, I could not have completed the masters without the unwavering
support of my husband, Dr. Lars Kabatnik, who motivated me throughout the most
difficult times. I am indebted to my parents and parents-in-law for their support and
encouragement throughout this journey. My children: Julian, Lavinya and Benjamin
also deserve big hugs for supporting me in their own, sweet little way. A big thank
you to my cousin, Ashiwani A. Rames for always being there for me.
iii
TABLE OF CONTENTS
ACKNOWLEDGEMENT ii
TABLE OF CONTENTS iii
LIST OF TABLES vii
LIST OF FIGURES ix
LIST OF APPENDICES x
LIST OF ABBREVIATIONS xi
ABSTRAK xiii
ABSTRACT xv
CHAPTER 1 - INTRODUCTION 1
1.1 Background of the Study 1
1.2 Statement of the Problem 4
1.3 Objectives of the Study
1.3.1 General Objective
1.3.2 Specific Objectives
7
7
7
1.4 Conceptual Framework of the Study 8
1.5 Significance of Study 10
1.6 Chapter Outline 12
CHAPTER 2 – LITERATURE REVIEW 14
2.1 Diabetes 14
2.1.1 Burden of diabetes 14
2.1.2 Metabolic Control in Diabetes 16
2.1.3 Pharmacological Therapy 19
2.1.4 Chronic Kidney Disease in Diabetes 21
iv
2.2 Medication Adherence 25
2.3 Elderly Patients 27
2.4 Illness Representations 29
2.4.1 Revised Illness Perception Questionnaire (IPQ-R) 34
CHAPTER 3 - METHODOLOGY 49
3.1 Study Design 49
3.2 Study Setting 49
3.3 Study Period 49
3.4 Study Population 50
3.4.1 Sample Size 50
3.4.2 Sampling Technique 51
3.4.2(a) Inclusion Criteria 52
3.4.2(b) Exclusion Criteria
53
3.5 Ethical Approval 53
3.6 Instruments for Data Collection 54
3.6.1 Data Collection Form 54
3.6.2 The Revised Illness Perception Questionnaire (IPQ-R) 54
3.6.3 Eight-Item Morisky Medication Adherence Scale
(MMAS-8)
63
3.6.4 Classification of Chronic Kidney Disease 66
3.7 Study Procedure 67
3.7.1 Screening of patients 69
3.7.2 Patient recruitment 69
3.7.3 Informed Consent 70
v
3.7.4 Self-administered questionnaire completion
and medical records data collection
70
3.8 Data Analysis and Interpretation 70
CHAPTER 4 – RESULTS 72
4.1 Socio-demographic Characteristics and Clinical Data 72
4.2 The Scores of the Dimensions of the IPQ-R 78
4.3 Patients’ Perceptions of the Possible Causes of Diabetes 86
4.4 Association Between Dimensions of Illness Perceptions and
Glycaemic Control
89
4.5 Associations Between Illness Perceptions and Chronic
Kidney Disease in T2DM
92
4.6 Associations Between Illness Perceptions and Medication
Adherence
95
4.7 Associations Between Illness Perceptions and Age 101
CHAPTER 5 - DISCUSSION 103
5.1 Socio-Demographic Data and Clinical Background 103
5.2 Scores of Dimensions of Illness Perceptions 106
5.3 Differences in Score of Dimensions Illness Perceptions in
Patients With Good and Poor Glycaemic Control
109
5.4 Differences in Score of Dimensions of Illness Perceptions in
Patients According to Stages of Chronic Kidney Disease
114
5.5 Differences in Score of Dimensions of Illness Perceptions in
Patients With Low, Medium and High Adherence
117
5.6 Differences in Score of Dimensions of Illness Perceptions in
Patients as Compared to Younger and Older Patients
120

vi
CHAPTER 6 - CONCLUSION 122
6.1 General Conclusions 122
6.2 Strengths and Limitations 123
6.3 Future Implications 125
REFERENCES 127
APPENDICES
LIST OF PUBLICATIONS

vii
LIST OF TABLES
Page
Table 2.1 Dimensions of Illness Representations as in CSM and
Corresponding Description for the Dimensions
30
Table 2.2 Studies on Illness Perceptions and Their Associated Factors
in Different Illnesses Such as Diabetes, Hypertension,
Musculoskeletal Disease and Myocardial Infarction
39
Table 3.1 The Dimensions, Number of Items and Items in Each
Dimension of the Diabetes-Specific IPQ-R
58
Table 3.2 Dimensions, Description of Dimension, Question Number
and Possible Score of the IPQ-R
60
Table 3.3 Internal consistency (Cronbach’s alpha) for IPQ-R
Dimensions in the Malay translation of the IPQ-R
61
Table 3.4 Test-Retest Reliability using Spearman’s Rank Correlation
Coefficient for the IPQ-R dimensions of the Malay
Translation
62
Table 3.5 Classification of Chronic Kidney Disease 67
Table 4.1 Socio-demographic Characteristics and Clinical Data of
Patients
75
Table 4.2 IPQ-R Dimensions and Their Scores 81
Table 4.3 Descriptive Statistics for the Dimensions of the IPQ-R and
how Patients Answered the Individual Questions in the
IPQ-R
82
Table 4.4 Descriptive Statistics of how Patients Rated the Possible
Causes of Their Diabetes
87
Table 4.5 Differences in the Score of Dimensions of Illness
Perceptions in Patients With Poor and Good Glycaemic
Control
91
Table 4.6 Differences in the Score of Dimensions of Illness
Perceptions in Patients in the Different Stages of CKD
94
Table 4.7 Differences in the Score of Dimensions of Illness
Perceptions in Patients With Low, Medium and High
Adherence
98

viii
Table 4.8 Mean Rank Scores for IPQ-R Dimensions in Low, Medium
and High Adherence
99
Table 4.9 Differences in IPQ-R Dimension Scores in the Older and
Younger Age Group
102

ix
LIST OF FIGURES
Page
Figure 1.1 Conceptual framework of illness perceptions and their
associations with glycaemic control, chronic kidney disease
and medication adherence in T2DM.
9
Figure 2.1 Schematic representation of Leventhal et al.’s (1980)
common sense model of illness representations
31
Figure 3.1 The study procedure 68
Figure 4.1 Flow chart for patients included in the study and the reasons
for non-participation
73
Figure 4.2 Patients’ view of the most probable cause of the diabetes. 88
Figure 4.3 Scatter Plot of Pearson Correlations between medication
adherence and glycaemic control
100

x
LIST OF APPENDICES
APPENDIX A Patient Information Sheet and Informed Consent in
English
APPENDIX B Patient Information Sheet and Informed Consent in
Malay
APPENDIX C Permission to use the IPQ-R
APPENDIX D Diabetes-specific IPQ-R in English
APPENDIX E Diabetes-specific IPQ-R in Malay
APPENDIX F Copyright Agreement MMAS-8
APPENDIX G MMAS-8 Questionnaire in English
APPENDIX H MMAS-8 Questionnaire in Malay
APPENDIX I Ethical Approval Form
APPENDIX J Request for Permission from Hospital Pulau Pinang
APPENDIX K Permission to Conduct Study at Hospital Pulau Pinang
APPENDIX L Copyright Rightslink Hagger & Orbell (2003)
APPENDIX M Copyright Rightslink Weinman et al. (1996)

xi
LIST OF ABBREVIATIONS
BIPQ Brief Illness Perception Questionnaire
CI Confidence Interval
CSM Common Sense Model of Self -
Regulation of Leventhal
DALY Disability Adjusted Life Years
DCF Data Collection Form
ESRD End Stage Renal Disease
GDM Gestational Diabetes Mellitus
HPP Hospital Pulau Pinang
IDF International Diabetes Federation
IP Illness Perception
IPQ Illness Perception Questionnaire
IPQ-R Revised Illness Perception
Questionnaire
MOH Ministry of Health
MMAS-8 Eight-Item Morisky Medication
Adherence Scale
MREC Medical Research Ethics Committee
NHMS National Health Morbidity Survey
OAD Oral Anti-diabetic Agent
OR Odds Ratio
PMP Per Million Population
QoL Quality of Life

xii
RCT Randomised Controlled Trials
r Pearson Correlation Coefficient
rs Spearman’s Rank Correlation
Coefficient
SD Standard Deviation
SMBG Self-Monitoring of Blood Glucose
SPSS Statistical Package for Social Science
T1DM Type 1 Diabetes Mellitus
T2DM Type 2 Diabetes Mellitus
UK United Kingdom
US United States
USM Universiti Sains Malaysia
WHO World Health Organization

xiii
PENILAIAN PERSEPSI PENYAKIT TERHADAP KAWALAN GLISEMIK,
PENYAKIT BUAH PINGGANG KRONIK DAN TABIAT PENGAMBILAN
UBAT DALAM KALANGAN PESAKIT YANG MENGHIDAPI DIABETES
MELLITUS JENIS 2 DI HOSPITAL PULAU PINANG
ABSTRAK
Malaysia mempunyai kadar kelaziman diabetes tinggi iaitu 16.9% dan
kawalan glisemik suboptimal kerana hanya 23.8% pesakit mencapai HbA1C <7%.
Persepsi penyakit (IP) melibatkan strategi dan tingkah laku pesakit yang boleh
mempengaruhi kawalan glisemik. Objektif kajian adalah untuk menilai IP dan
hubungan dengan kawalan glisemik, penyakit buah pinggang kronik (CKD) dan tabiat
pengambilan ubat dalam kalangan pesakit diabetes jenis 2 (T2DM). Kajian keratan
rentas telah dijalankan dalam 384 pesakit T2DM atas 18 tahun di bawah rawatan
susulan dengan menggunakan Soal Selidik Persepsi Penyakit dan “Morisky
Medication Adherence Scale” (MMAS-8). Umur median pesakit adalah 58.1 tahun
dan tempoh median diabetes adalah 13 tahun. Responden terdiri daripada 38.8%
Melayu, 31.0% Cina dan 28.9% India dengan 55.7% wanita. Kadar 79.4% mempunyai
kawalan paras glisemik tidak sempurna dan 39.6% mempunyai kadar pengambilan
ubat rendah. Skor median Garis Masa Akut / Kronik, Akibat, Kawalan Peribadi,
Kawalan Rawatan, Pemahaman Penyakit, Garis Masa Kitaran dan Perwakilan Emosi
adalah masing-masing 23, 18, 22, 18, 19, 12 dan 14. Pesakit yang mempunyai kawalan
glisemik baik mempunyai skor Garis Masa Akut / Kronik (p = 0.048) dan Perwakilan
Emosi (p = 0.032) yang lebih tinggi daripada pesakit yang kurang dikawal, pesakit
tersebut percaya bahawa diabetes adalah penyakit kronik dan mengganggu emosi.
Pesakit dalam peringkat CKD yang lebih teruk mempunyai skor Garis Masa Kitaran

xiv
yang lebih tinggi (χ2 = 18.718, p = 0.001) dan mempercayai bahawa diabetes tidak
dapat diramalkan. Pesakit dengan tabiat pengambilan ubat baik mempunyai skor
tinggi dalam Pemahaman Penyakit (χ2 = 21.385, p <0.001) tetapi skor Akibat (χ2 =
17.592, p <0.001) dan Perwakilan Emosi adalah rendah (χ2 = 16.849, p <0.001), oleh
itu pesakit tersebut mempunyai pemahaman baik dan tidak dipengaruhi oleh persepsi
negatif. Pesakit dengan tabiat pengambilan ubat tidak sempurna mempunyai persepsi
negative iaitu Identiti (χ2 = 15.25, p <0.001) dan Garis Masa Kitaran (χ2 = 16.370, p
<0.001) yang tinggi. Pematuhan ubat dan HbA1c mempunyai hubungan linear yang
lemah. Dimensi Akibat mempunyai skor yang lebih tinggi dalam pesakit di bawah
umur 65 tahun (p = 0.003) yang berpendapat diabetes mempunyai kesan besar
terhadap hidup. Dimensi IP mempunyai hubungan yang signifikan dengan kawalan
glisemik, CKD, pengambilan ubat dan umur, oleh itu persepsi pesakit boleh
mempengaruhi kawalan glisemik dan tabiat pengambilan ubat. Kajian lanjut perlu
dijalankan di Malaysia dengan pendidikan dimensi IP yang tersasar untuk
meningkatkan kawalan paras gula secara optimal dengan objektif IP dimasukkan
dalam Panduan Klinikal Diabetes di masa depan.

xv
EVALUATION OF ILLNESS PERCEPTIONS AND THEIR ASSOCIATIONS
WITH GLYCAEMIC CONTROL, CHRONIC KIDNEY DISEASE AND
MEDICATION ADHERENCE IN TYPE 2 DIABETES MELLITUS
PATIENTS AT HOSPITAL PULAU PINANG
ABSTRACT
Malaysia has a high prevalence of diabetes at 16.9% and suboptimal glycaemic
control with only 23.8% achieving HbA1C of <7%. Illness perceptions (IP) involve
coping strategies and behavioural responses that influence glycaemic control. The
objective of this study was to evaluate IP and their associations with glycaemic
control, chronic kidney disease (CKD) and medication adherence in Type 2 diabetes
mellitus patients (T2DM). A cross-sectional study was conducted in a purposive
sample of 384 T2DM patients using Revised Illness Perception Questionnaire and 8-
Item Morisky Medication Adherence Scale. T2DM patients >18 years under regular
follow-up were included. The patients’ median age was 58.1 years and median
duration of diabetes was 13 years. There were 55.7% females and an ethnic
distribution of 38.8% Malays, 31.0% Chinese and 28.9% Indians. A staggering 79.4%
of patients had poor diabetes control and 39.6% of patients had low medication
adherence. The median score of Timeline Acute/Chronic, Consequences, Personal
Control, Treatment Control, Illness Coherence, Timeline Cyclical and Emotional
Representations was 23, 18, 22, 18, 19, 12 and 14, respectively. Patients with good
glycaemic control had a higher Timeline Acute/Chronic (p=0.048) and Emotional
Representations (p=0.032) score than poorly controlled patients, indicating they
believed that diabetes is chronic and experienced negative emotions. Patients in more
advanced stage of CKD had a significantly higher Timeline Cyclical score

xvi
(χ2=18.718, p=0.001), believing that their diabetes was unpredictable. Highly
adherent patients had a significantly higher Illness Coherence (χ2=21.385, p<0.001)
score but a significantly lower Consequences (χ2=17.592, p<0.001) and Emotional
Representations score (χ2=16.849, p<0.001), hence they had good understanding of
the disease and less negative perceptions of disease burden. Patients with low
adherence had a significantly higher Identity (χ2=15.25, p<0.001) and Timeline
Cyclical (χ2=16.370, p<0.001) score, therefore attributing more symptoms and a
cyclical nature to diabetes. Medication adherence and HbA1c were weakly correlated.
The Consequences dimension had a significantly higher score for patients below the
age of 65 years (p=0.003), therefore younger diabetics felt that their lives were
negatively affected. IP dimensions had significant associations with glycaemic
control, CKD, medication adherence and age, showing that patients’ beliefs can affect
illness outcomes and adherence behaviour. Further studies should be conducted in
Malaysia involving targeted patient education of IP dimensions to establish exact
relationships with glycaemic control for concrete recommendations to be included in
future Clinical Practice Guidelines to improve outcomes of diabetes.

1
CHAPTER 1
INTRODUCTION
1.1 Background of the study
Diabetes mellitus is a disease with multiple complications, which is caused by
hyperglycaemia. The pathophysiology behind the chronic state of hyperglycaemia is
reduced or complete defects in insulin secretion; or insulin resistance (World Health
Organization, 1999). Worldwide, approximately 424.9 million or 8.8% of adults
between the ages of 20 and 79 years are estimated to suffer from diabetes (International
Diabetes Federation, 2017). The prevalence of diabetes in adults in Malaysia has
increased alarmingly from 11.6% in 2006 (Ministry of Health Malaysia, 2013) to 17.5
% in 2015 (Institute for Public Health, 2015), which is an increase of 50.9% within the
space of 11 years. Malaysia has an increasing and alarming prevalence of diabetes,
which was the reason this disease was chosen as a focus of this study.
Diabetes can be classified into Type 1 diabetes mellitus (T1DM), type 2 diabetes
mellitus (T2DM), gestational diabetes mellitus (GDM) and specific types of diabetes
due to other causes, such as monogenic diabetes syndromes, diseases of the exocrine
pancreas and drug- or chemical-induced diabetes (American Diabetes Association,
2015; World Health Organization, 2006).
T2DM, which is the focus of this study, was previously referred to as “non- insulin-
dependent diabetes”. It is the most common form of diabetes and constitutes 90-95%
of all diabetes cases (American Diabetes Association, 2015). In T2DM,
hyperglycaemia occurs due to peripheral insulin resistance, impaired regulation of

2
hepatic glucose production and beta-cell dysfunction, with relative rather than absolute
insulin deficiency as opposed to T1DM (Kahn, 2003; Mahler & Adler, 1999). Beta-
cell dysfunction is a critical factor in the development of T2DM and worsens
progressively with increasing glucotoxicity (Stumvoll, Goldstein, & van Haeften,
2005). Stumvoll et al. also pointed out the important link between obesity, physical
inactivity and insulin resistance. The “deadly quintet” of hypertension,
hyperlipidemia, obesity, procoagulability, and hyperglycemia have been postulated as
the cause of oxidative stress and endothelial dysfunction that underlie the dysmetabolic
syndrome, which is a precursor of diabetes (Boyle, 2007).
T1DM is known to be caused by immune-associated destruction of insulin-producing
pancreatic β-cells, ultimately leading to absolute insulin deficiency and requiring
exogenous insulin replacement for life (Atkinson, Eisenbarth, & Michels, 2014).
T1DM comprises approximately 5-10% of cases and even though T1DM can be
diagnosed at any age, it is commonly first diagnosed in childhood with peaks in
presentation occurring between 5- 7 years of age and at or around the time of puberty
(American Diabetes Association, 2015; Atkinson et al., 2014). GDM is a form of
diabetes which is usually diagnosed in the second or third trimester of pregnancy in
patients with no known previous diagnosis of diabetes (American Diabetes
Association, 2015; World Health Organization, 1999). Specific types of diabetes, such
as monogenic diabetes syndromes and diseases of the exocrine pancreas constitute a
small percentage of all diabetes patients, comprising less than 5% in total (American
Diabetes Association, 2015).

3
Diabetes is a disease which often leads to a lifetime of suffering with multiple
debilitating complications. Acute complications of diabetes which can be life-
threatening include diabetic ketoacidosis, hyperglycaemic hyperosmolar state and
malignant hyperthermia-like syndrome with rhabdomyolysis (Pinhas-Hamiel &
Zeitler, 2007). Diabetes causes long-term microvascular complications: retinopathy,
nephropathy and neuropathy; and macrovascular complications: cardiovascular
disease, peripheral vascular disease and stroke (Alva, Gray, Mihaylova, Leal, &
Holman, 2015; DCCT Research Group, 1995; Stephenson & Fuller, 1994; Stratton et
al., 2000; Stumvoll et al., 2005; World Health Organization, 1999).
Diabetes is a major cause of blindness, kidney failure, heart attacks, stroke and lower
limb with an estimated 1.6 million deaths being directly caused by diabetes in 2015
(World Health Organization, 2016). The World Health Organization (WHO) predicted
that diabetes will be the seventh leading cause of death in 2030. A collaborative meta-
analysis of 102 prospective studies found that diabetes doubles the risk for coronary
heart disease, major stroke and fatalities related to vascular diseases (The Emerging
Risk Factors Collaboration, 2010).
Diabcare Malaysia was initially started in 1997 as an initiative to assess the prevalence
of diabetes as well as the level of care in the Malaysian setting (Mafauzy, Hussein, &
Chan, 2011). It was found by Mafauzy et al. in Diabcare 2008 that there was a high
rate of complications in their study population of 1549 patients with 75% of patients
having microvascular complications and 28.9% of patients having macrovascular
complications. Severe late complications (legal blindness, myocardial infarction,
coronary artery bypass graft/ angioplasty/ stents, cerebral stroke, end stage renal

4
disease and lower limb amputation) were documented in 25.4% of patients (Mafauzy
et al., 2011). According to these findings, it is obvious that the rate of high
complications in the Malaysian setting is worrisome.
It has been demonstrated that patients in Malaysia are not meeting their targets with
HbA1c, although it has been proven that good glycaemic control is essential in
diabetes (Abougalambou, Mafauzy, Syed Azhar, Abougalambou, & Mohamed Azmi,
2010; Mafauzy et al., 2011). Illness perceptions have been known to have significant
associations with glycaemic control and medication adherence but there is a lack of
data in Malaysia as no study has looked at these associations in Malaysian T2DM
patients (Bean, Cundy, & Petrie, 2007; Broadbent, Petrie, Main, & Weinman, 2006;
Davies et al., 2008; Kucukarslan, 2012). The more patients believe that their treatment
will be effective, the more they are likely to have better self-care with improved
glycaemic control (Skinner & Hampson, 2001). Therefore, it is important to
understand the possible associations between illness perceptions and glycaemic
control in the Malaysian setting.
1.2 Statement of the Problem
Diabetes is a chronic disease which has major implications on health with both
microvascular and macrovascular complications. The prevalence of diabetes is rising
worldwide and incidence is highest in developing countries, especially in Asia with
a high economic cost (Ramachandran, Ching, & Snehalatha, 2010).
Diabetes is on a relentless course of high prevalence and an increasing number of
patients in Malaysia with T2DM comprising more than 92.8% of the diabetes patient

5
population in Malaysia (Mafauzy et al., 2011). It is essential to bring this disease
under control and prevent patients from progressing with the deadly complications
of diabetes.
Good knowledge of diabetes and high medication adherence are significant predictors
of good metabolic control (Al-Qazaz et al., 2011). Glycaemic control has been shown
to be associated with medication adherence (Ahmad, Islahudin, & Paraidathathu,
2014; Chua & Chan, 2011; C. S. Lee, Tan, Sankari, Koh, & Tan, 2017). There is a link
between medication adherence and glycaemic control, which is why these two
variables were included in this study in association with illness perceptions to
understand the possible link to the psychology behind this phenomenon.
A major complication of diabetes is chronic kidney disease. The major cause of end
stage kidney disease requiring dialysis was reported to be caused by diabetes,
comprising 61% of cases. It is important that factors associated with glycaemic control
are identified, so that glycaemic control can be achieved to help delay the progression
of kidney disease in diabetic patients (Huri, Lim, & Lim, 2015).
In Malaysia, it has been found that diabetes care is far from satisfactory as the majority
of patients are not able to achieve good glycaemic control and there is a high
prevalence of complications (Mafauzy, 2006). Mafauzy recommended that steps are
taken to improve the management of diabetes by educating health professionals,
improving patients’ awareness of the disease, providing more resources, encouraging
self-care in diabetes and improving the communication between healthcare
professionals and patients. As glycaemic control is of paramount interest in diabetes

6
management, diabetic treatment has to be optimized through a multidisciplinary
method with the patient in the center of management. It is necessary to understand how
to help these patients in a holistic manner, in terms of pharmacological, psychological
and social management.
The Common Sense Model (CSM) of self-Regulation explains that patients develop
distinct cognitive illness representations which are defined as identity, cause, timeline,
consequences and control (H Leventhal, Brisette, & Leventhal, 2003; H Leventhal,
Meyer, & Nerenz, 1980). Illness perceptions which include both cognitive and
emotional representations of illness provide an insight into how patients develop
coping strategies as a result of a health threat and how subsequently these coping
strategies affect the self-management behaviour (Weinman, Petrie, Moss-Morris, &
Horne, 1996). Illness perceptions can affect health outcomes such as medication
adherence and metabolic control (Davies et al., 2008; Kucukarslan, 2012). As good
glycaemic control is an essential part of diabetes management, it was of interest to find
out whether there is a link between illness perceptions as a psychological parameter
and glycaemic control as a measure of disease outcome.
The Clinical Practice Guidelines (CPG) 2015 for T2DM (Ministry of Health Malaysia,
2015) mentioned that psychological and social factors are important influences on the
ability of patients to cope with chronic disease such as diabetes as they may affect the
overall success of the management. However, there is no mention of illness
perceptions in the Clinical Practice Guidelines. It is surely of relevance to investigate
whether illness perceptions have a role to play when it comes to glycaemic control,
chronic kidney disease which is a very worrisome complication of diabetes and

7
medication adherence. This exploratory study will hopefully reveal whether illness
perceptions have significant associations with the variables being studied. To the best
of my knowledge, no other study in Malaysia has placed its focus on illness
perceptions in association with all three variables: glycaemic control, chronic kidney
disease and medication adherence in T2DM. Ultimately, this study might enable more
research to be conducted in this area and open up the avenue for illness perceptions to
be included in future clinical guidelines with regards to psychosocial assessment and
care of diabetes.
1.3 Objectives of the Study
1.3.1 General objective:
To assess the associations between illness perceptions, glycaemic control, medication
adherence and chronic kidney disease in patients with T2DM in a tertiary care setting
in the multi-ethnic Malaysian setting.
1.3.2 Specific objectives:
To explore the associations between various domains of illness perceptions and
glycaemic control based on HbA1c in T2DM patients
To explore the associations between illness perceptions and chronic kidney
disease in T2DM patients
To explore the associations between illness perceptions and medication adherence
in T2DM patients
To explore whether there are differences in illness perceptions among younger
patients and elderly patients, defined as 65 years old and above

8
1.4 Conceptual Framework of the Study
The concept of illness perceptions was developed by Weinman et al. (1996) in order
to provide a quantitative assessment of the illness representations based on the CSM
of self-regulation of Leventhal (H Leventhal et al., 1980). Illness perceptions comprise
both cognitive and emotional representations of illness which can ultimately influence
the way a patient responds to psychological treatment and whether a patient adheres
to the treatment prescribed (Howard Leventhal, Leventhal, & Contrada, 1998;
Weinman & Petrie, 1997). The concept of illness perceptions comprises nine
dimensions which include both negative and positive perceptions: Identity, Timeline
Acute/Chronic, Consequences, Personal Control, Treatment Control, Timeline
Cyclical, Illness Coherence, Emotional Representations and Cause. These dimensions
are described in detail in Section 3.6.2.
Both cognitive and emotional representations give rise to coping strategies that have
an influence on medication adherence (Kucukarslan, 2012), glycaemic control (Mc
Sharry, Moss-Morris, & Kendrick, 2011) and chronic kidney disease (Clarke, Yates,
Smith, & Chilcot, 2016). Glycaemic control and medication adherence have been
shown to be associated with each other (Ahmad et al., 2014; Al-Qazaz et al., 2011;
Chua & Chan, 2011; S. F. Lee, Teh, Malar, Ong, & James, 2017). Therefore, it was
the purpose of my study to explore whether positive illness perceptions led to good
glycaemic control and medication adherence; likewise, whether patients with negative
illness perceptions had poor glycaemic control and medication adherence. The
perceptions in T2DM patients might also differ according to whether they have CKD
and in which stage they are. Patients in advanced stage of chronic kidney disease may
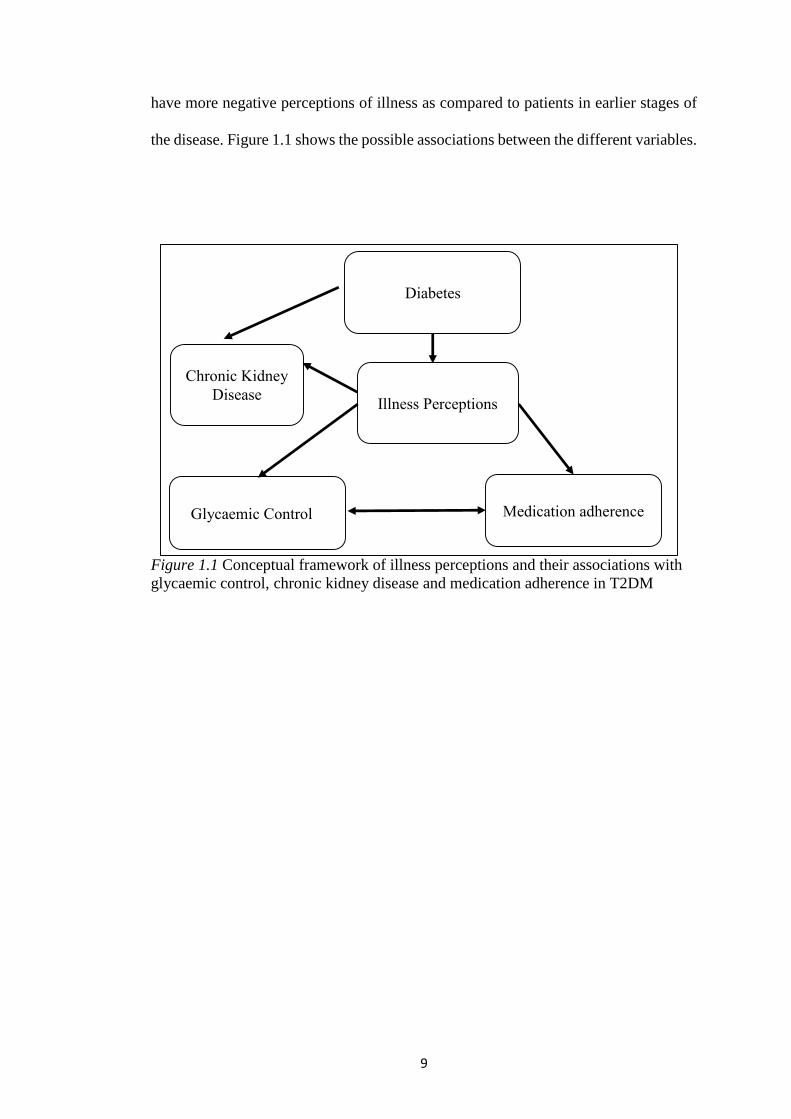
9
have more negative perceptions of illness as compared to patients in earlier stages of
the disease. Figure 1.1 shows the possible associations between the different variables.
Figure 1.1 Conceptual framework of illness perceptions and their associations with
glycaemic control, chronic kidney disease and medication adherence in T2DM
Diabetes
Chronic Kidney
Disease Illness Perceptions
Glycaemic Control Medication adherence

10
1.5 Significance of Study
The application of this exploratory study is to provide baseline data for the possible
significant associations between illness perceptions and the three variables being
studied. With this baseline data, further studies can be conducted with the potential of
targeted intervention of dimensions of illness perceptions being included as part of
psychological management in the T2DM CPG Ministry of Health Malaysia (MOH).
There has been evidence that a family-based intervention on poorly controlled T2DM
patients showed significant improvements in HbA1c and improved socio-
psychological beliefs (Keogh et al., 2011). A group education programme was
provided to T2DM patients by healthcare professionals who had been specifically
trained to empower patients psychologically and improve self-care (Davies et al.,
2008). This intervention managed to motivate patients to improve their negative
perceptions as well as initiate positive lifestyle changes. In the future, guidelines with
targeted dimensions of illness perceptions can be formulated with regular assessment
of illness perceptions using tools such as the IPQ-R or BIPQ.
It is important to establish a close collaboration between medical doctors, pharmacists,
diabetes specialist nurses and mental health care providers who are involved in the
care of T2DM patients. Patients who have poor glycaemic control, poor medication
adherence and patients who are known to have renal derangement can be identified.
All healthcare personnel in primary, secondary and tertiary care who are involved in
the care of T2DM can be trained to deliver psychological counselling with the aim of
improving negative perceptions, medication adherence and glycaemic control.
Pharmacists can use the opportunity during the Medication Therapy Adherence Clinic
(MTAC) and medical doctors during the follow-up clinic visit to identify patients who

11
have poor adherence and poor glycaemic control. These patients can then be
counselled in separate sessions or the counselling can be incorporated into the clinic
visit. Patients can be empowered during counselling sessions by improving their
negative perceptions and being encouraged to improve their adherence and self-care
of diabetes.
A computerised health database could be used by the health personnel involved in the
care of T2DM to update the perception status of patients and whether there is an
improvement in clinical outcomes. However, a health database must be handled in
such a way that patient confidentiality is maintained. The database can be used to keep
track of continuous assessment of illness perceptions using tools such as the IPQ-R,
monitoring of familial or social support, monitoring of self-care, regular assessments
of adherence by pharmacists, assessment of glycaemic control and referral to members
of the healthcare team that are trained in illness-perception based psychological
intervention (clinicians, pharmacists, nurses and mental health team).

12
1.6 Chapter Outline
This is a brief outline of the chapters that are presented in this thesis:
Chapter 2 - This chapter is a review of the literature tied to the objectives of this study.
The first part introduces the complications and burden of the disease, with reference
to the Malaysian setting. This is then expanded to include topics relevant to this study
comprising metabolic control, chronic kidney disease in diabetes and diabetes in the
elderly. The second part is about medication adherence, which is also tied to the
objectives of this study and explains why medication adherence is an essential
component of patient management. The third and final part is about illness perceptions,
the concept on which this study is based and the quantitative measure of illness
perceptions, the Revised Illness Perception Questionnaire (IPQ-R), which is a
parameter to measure illness perceptions in patients.
Chapter 3 - In this chapter, the explanation and justification behind this study are
presented in detail. The components of this chapter are study design, study setting,
study period, study population, sample size, sampling techniques, ethical approval and
instruments utilised. The final section in this chapter is the description of the study
procedure and data analysis.
Chapter 4 - The results of the study are presented in details in this chapter. A complete
overview of the statistical analysis showing the dimensions of illness perceptions as
well as their associations with metabolic control, medication adherence and CKD are
described and presented in tables and figures.

13
Chapter 5 - This chapter includes a detailed description of the findings in this study
as well as the learning points that can be derived from the results. A comparison of the
similarities and differences with other studies are also listed here.
Chapter 6 - This chapter is a conclusion and final summary with the strengths and
limitations of the study. The implications for the Malaysian setting, including inclusion
of illness perceptions in future CPGs and recommendations for further research are
included in this chapter.

14
Chapter 2
Literature Review
2.1 Diabetes
2.1.1 Burden of diabetes
Diabetes is growing at endemic proportions increasing the burden on healthcare
systems worldwide. Although in fact the total number of people with diabetes
worldwide was projected to rise from 171 million in 2000 to 366 million in 2030
(Wild, Roglic, Green, Sicree, & King, 2004), this figure had already been surpassed
in 2013 with 382 million patients and was expected to rise to 592 million by 2035
(Guariguata et al., 2014). In 2017, diabetes caused 4.0 million deaths globally and
USD 727 billion dollars in health spending (International Diabetes Federation, 2017).
In Malaysia, it was estimated that diabetes would have cost the government RM 1.40
billion in the year 2011 which was almost 10% of the entire MOH healthcare budget
(Idzwan Mustapha et al., 2017). Additionally, it was also estimated by Idzwan
Mustapha et. al that the total cost of diabetes including its complications was RM
2.04 billion annually and the yearly cost of dialysis was RM 42, 362 per patient. In a
nutshell, diabetes is a chronic and devastating disease with a high economic burden
for both patients and healthcare systems.
The global status report on non-communicable diseases 2014 (World Health
Organization, 2014), clarified that diabetes was directly responsible for 1.5 million
deaths in 2012 and 89 million Disability Adjusted Life Years (DALY), which is the
sum of years of potential life lost due to premature mortality and the years of

15
productive life lost due to disability. According to the same report, non-communicable
diseases, of which cardiovascular diseases, cancer, chronic respiratory diseases and
diabetes are responsible for more than 82% of deaths, currently cause more deaths than
all other causes combined and these deaths are projected to increase from 38 million
in 2012 to 52 million by 2030.
However, what used to be known as traditional complications of diabetes are not solely
applicable as there are many new aspects to newly known complications especially in
association with the metabolic syndrome as well as high lipid levels, therefore
physicians must be made aware of the new complications such as non-alcoholic fatty
liver disease, polycystic ovary syndrome and eating disorders in addition to well-
known complications such as stroke and cardiovascular disease (Twigg & Wong,
2015). It is of paramount importance to individualise the treatment of diabetes to
prevent these serious complications and optimise every single avenue of treatment,
may it be pharmacological or psychological management.
Globally, the number of diabetics has increased alarmingly from 108 million in 1980
to 422 million in 2014 (NCD Risk Factor Collaboration, 2016). The same study
showed that the rate of increase in prevalence was highest in countries with low and
middle incomes. In 2014, it was found that the highest number of patients with diabetes
were from east and south Asia with 106 million and 86 million diabetics, respectively
(NCD Risk Factor Collaboration, 2016). All these figures clearly show that diabetes is
becoming a real threat and optimal management of diabetes is crucial.

16
From 2009 to end of 2012, there were a total of 657,839 patients enrolled in the NRD
in Malaysia, which was established to keep track of the target achievement and clinical
outcomes of patients with diabetes managed at primary healthcare clinics under the
MOH. Nearly all the patients enrolled, 653,326, were diagnosed with T2DM indicating
the huge burden of T2DM in Malaysia, as patients diagnosed with T1DM or other
forms of DM comprised only a minimal 0.7% of the patients in the registry (Ministry
of Health Malaysia, 2013). In the National Health and Morbidity Survey (NHMS)
2015 in Malaysia, the overall prevalence of diabetes mellitus among adults of 18 years
and above was 17.5% out of 19,935 respondents. A general increasing trend in
prevalence with age was observed in the NHMS from 5.5% in the 18-19 years age
group with a peak of 39.1% among the 70-74 years age group (Institute for Public
Health, 2015). It was also noted that the Indians had the highest prevalence at 22.1%,
followed by the Malays at 14.6% and the Chinese at 12.0%, a trend which was also
observed in the previous NHMS in 2006 (Institute for Public Health, 2015; Letchuman
et al., 2010) . It can be deduced that Malaysia has a high prevalence of T2DM with all
ethnic groups at risk, with Indians having the highest prevalence.
2.1.2 Metabolic Control in Diabetes
Glycated haemoglobin, HbA1c was shown to correlate with the average glucose
control over the previous 8 – 12 weeks based on continuous glucose monitoring
(Nathan, Turgeon, & Regan, 2007). HbA1c shows how the glycaemic control in
patients has been maintained over the preceding 3 months. Therefore, it has been
recommended that the HbA1c test should be conducted as a routine measure in all
patients at the initial phase of diabetes assessment and at routine intervals on a 3-
monthly basis to determine whether patients’ have been able to achieve their

17
glycaemic targets and maintain them. Additionally, how frequently HbA1c is tested
should also be individualised based on the clinical situation, the treatment regimen
and the consultant or physician’s decision (American Diabetes Association, 2015).
The United Kingdom Prospective Diabetes Study (UKPDS), which ran from 1977 to
1997 and included 5102 patients at 23 centres across the United Kingdom was a
landmark study in showing the importance of blood glucose control in diabetes (Home,
2008; King, Peacock, & Donnelly, 1999; UK Prospective Diabetes Study (UKPDS)
Group, 1998a, 1998b, 1998c). It was the largest and longest study ever undertaken in
diabetes. Patients were followed for an average of 10 years to determine whether
intensive use of pharmacological therapy to lower blood glucose levels would result
in clinical benefits and whether the use of various sulfonylurea drugs, the biguanide
drug metformin, or insulin have specific therapeutic advantages or disadvantages. The
UKPDS results established that retinopathy, nephropathy, and possibly neuropathy are
benefited by lowering blood glucose levels with intensive therapy. A median HbA1c
of 7.0% was achieved with intensive therapy as compared with conventional therapy
with a median HbA1c of 7.9%. Epidemiological analysis of the UKPDS data showed
a continuous relationship between the risks of microvascular complications and
glycaemia; for every decrease of 1% in HbA1c there was a 35% reduction in the risk
of complications (King et al., 1999; UK Prospective Diabetes Study (UKPDS) Group,
1998b). It has been concluded that treatment of T2DM should include aggressive
efforts to lower blood glucose levels as close to normal as possible. Diabcare Malaysia
2013 which recruited 1667 patients from public hospitals showed only a small
improvement in glycaemic control with a mean HbA1c of 8.52 ± 2.01% as compared
to DiabCare 2008 with a mean of 8.66 ± 2.09% (Mafauzy et al., 2011; Mohamed,

18
Hussein, Nazeri, & Pheng Chan, 2016). Therefore, more awareness needs to be created
on diabetes, lifestyle modification and self-testing.
However, it is worth noting that the The Action to Control Cardiovascular Risk in
Diabetes (ACCORD) Study Group (2008) found that aggressively lowering blood
glucose levels in patients with cardiovascular disease or with presence of risk factors
was not necessarily beneficial. In the ACCORD study, 10,251 T2DM patients who
had either established cardiovascular disease or additional cardiovascular risk factors
with a median Hba1c of 8.1% were designated to receive intensive therapy with a
target of HbA1c level of below 6% or standard therapy with a target HbA1c of 7.0 to
7.9%. Unexpectedly, the use of intensive therapy increased mortality and did not
significantly reduce major cardiovascular events. The intensive-therapy group had a
relative increase in mortality of 22% and an absolute increase of 1.0% during the
follow-up period of 3.5 years as compared with the standard-therapy group, with
similar differences in death from cardiovascular causes. This increase in mortality
was found to be equivalent to one extra death for every 95 patients who were treated
for 3.5 years. The findings of this study suggest that individualising treatment in high-
risk patients with T2DM is necessary. However, intensive and quick lowering of
blood glucose level is not always the right approach.
Litwak et al. (2013) conducted a study called A1chieve which was an observational
study over four months of 66,726 T2DM patients who had begun using biphasic
insulin aspart 30, insulin aspart, or insulin detemir. The participants included patients
from 28 countries in Asia, Africa, Europe and South America. Malaysia was one of
the countries which were included in this study. Litwak and colleagues found poor

19
glycaemic control with mean baseline HbA1c values of ≥ 9.1% in patients with
macrovascular complications and ≥ 9.4% in patients with microvascular
complications in all regions in this study. At the time the analogue insulin therapy
was started, vascular complication rates were generally high and preventive therapy
was not at optimal level. They concluded that poor glycaemic control and sub-optimal
diabetes management in the regions studied may be due to poor adherence to
treatment regimens, lack of access to therapy, poor diet, and delay in initiating, or
failure to adequately optimise insulin therapy. Litwak and colleagues also drew
attention to the fact that significant numbers of people with diabetes have poor
psychological well-being and these psychological problems can adversely affect
adherence to treatment, as found by another study (Peyrot et al., 2005).
2.1.3 Pharmacologic Therapy in Diabetes
Although psychological management in diabetes is important, pharmacological
therapy is the mainstay of treatment in diabetes in addition to lifestyle changes such as
diet control, physical activity and weight reduction. Pharmacologic management is
important in controlling blood glucose levels and has been shown to be of benefit in
reducing microvascular complications (Huri, Lim, & Lim, 2015; Kahn, Cooper, & Del
Prato, 2014). Pharmacologic therapy of diabetes consists of oral anti-diabetic agents
and injectable agents, namely insulin and Glucagon-like Peptide-1 Receptor Agonists
(GLP-1 RA) (Ministry of Health Malaysia, 2015).
These are the groups of oral diabetic agents (OAD) and injectable agents that are
currently recommended for use in the CPG (Ministry of Health Malaysia, 2015):
OAD

20
Biguanides: Metformin
Sulphonylureas: Glibenclamide, Gliclazide, Glipizide and Glimepiride
Meglitinides: Repaglinide and Nateglinide
α-Glucosidase inhibitors: Acarbose
Thiazolidinediones: Rosiglitazone and Pioglitazone
Dipeptidyl Peptidase-4 inhibitors:
Sitagliptin, Vildagliptin, Saxagliptin, Linagliptin and Alogliptin
Sodium-glucose Co-transporter 2 inhibitors:
Dapagliflozin, Canagliflozin and Empagliflozin
Injectable Medication
Glucagon-like Peptide-1 Receptor Agonists: Exenatide, Liraglutide and
Lixisenatide
Insulin: Prandial, Basal and Pre-mixed
According to the CPG, an OAD can be used on its own as monotherapy or as combined
therapy with other OADs and insulin and/or GLP-1 RA. Based on the Malaysian CPG
and American Diabetes Association (ADA) guidelines, metformin is recommended as
the initial medication for the treatment of T2DM and can be used either as
monotherapy or in combination with other OADs if the patient is not able to achieve
glycaemic control after 3 months of intensive monotherapy (Chamberlain et al., 2017;
Ministry of Health Malaysia, 2015). According to both guidelines, insulin should be
started in patients who are unable to achieve good glycaemic control despite being on
optimal combination therapy and newly diagnosed patients who are symptomatic or
poorly controlled (HbA1c >10%).

21
2.1.4 Chronic Kidney Disease (CKD) in Diabetes
CKD is defined as abnormalities of kidney structure or function, present for 3 months,
with implications for health and CKD is classified based on cause, GFR category and
albuminuria category (Kidney Disease: Improving Global Outcomes (KDIGO) CKD
Work Group, 2013). Diabetic nephropathy progresses from microalbuminuria to
macroalbuminuria and finally End Stage Renal Disease (ESRD) (Soldatos & Cooper,
2008). As mentioned by the KDIGO CKD Work Group (2013), diabetic nephropathy
occurs in 25-40% of patients with type 1 or type 2 diabetes within 20-25 years of
disease onset and is also an independent risk factor for early death due to
cardiovascular disease.
In the USA, a study was carried out by Bailey, Wang, Zhu and Rupnow (2014) with
the aim of providing current national estimates of the prevalence of CKD in the overall
T2DM population, and in the subpopulation aged above 65 years using the new
KDIGO classification. 2915 adults diagnosed with T2DM were identified using data
from the National Health and Nutrition Examination Survey (NHANES) in the USA,
with 1466 being 65 years and above. Prevalence of CKD was 43.5% in the Type 2
Diabetes Mellitus population overall, and 61.0% in those above 65 years of age. The
prevalence of mildly decreased renal function or worse was 22.0% overall and 43.1%
in those 65 years and above. Prevalence of more severe renal impairment was 9.0%
overall and 18.6% in those above 65 years of age. Thus, Bailey et al. were able to
confirm the high prevalence of CKD in T2DM, especially in the age group of 65 years
and above (Bailey, Wang, Zhu, & Rupnow, 2014).

22
Wu et al. (2005) conducted a cross-sectional epidemiological study aimed to assess
the prevalence of microalbuminuria and macroalbuminuria among consecutively
screened hypertensive type 2 diabetic adult patients in 103 centres in China, Hong
Kong, Indonesia, Malaysia, Pakistan, Philippines, Singapore, South Korea, Taiwan
and Thailand. A population of 5549 patients was used for analysis. It was found that
the prevalence of microalbuminuria, which represents the earliest clinical evidence of
diabetic nephropathy and is a marker of increased cardiovascular morbidity was 39.8%
(39.2-40.5; 95% Confidence interval (CI)) and the prevalence of macroalbuminuria
was 18.8 % (18.2-19.3; 95% CI). This high prevalence is disturbing as it reflects the
high risk the Asian diabetic population is at of developing renal disease. In the
multivariate analyses, the predictive factors for the presence of microalbuminuria were
age greater than 59 years, elevated BMI, systolic blood pressure level greater than 139
mm Hg, and ethnic origin. In this study, it is important to note that 18.8% of patients
had macroalbuminuria despite patients with previously known macroalbuminuria or
diabetic nephropathy having been excluded. This is worrisome as the high rate of
macroalbuminuria had not been expected and had not been previously detected,
therefore it was questioned whether screening was adequate. Among the Malaysian
population of 733 patients in this study, it was found that 40% of patients had
microalbuminuria, whereas 15% of patients had macroalbuminuria. Wu et al.
recommended the implementation of screening programmes for microalbuminuria in
type 2 diabetic patients.
There was a study carried out in 19 public hospitals in Malaysia with 1099 patients as
part of the Diab-care Asia project, which was an initiative started in 1997 to document
and provide a baseline for the status of diabetes care as well as to assess prevalence of

23
diabetes complications (Mafauzy, 2006). The majority of patients, precisely 94.8%
had T2DM with a gender distribution of 46.5% males and 53.5% females. The mean
age was 55.8 ± 11.4. The diabetes control was unsatisfactory, as 59% of the patients
had a HbA1c level of more than 7% which reflects poor control with 6.6% of the
patients having microalbuminuria and 15.7% of the patients having macroalbuminuria.
Mafauzy concluded that control was not satisfactory with a high prevalence of
complications.
A study with 1077 patients was carried out at Hospital Universiti Sains Malaysia
(USM) with the purpose of identifying the diabetic status of T2DM outpatients in a
tertiary center and to estimate the prevalence of vascular complications
(Abougalambou et al., 2010). They found that nephropathy was the most common
vascular complication at 91.0% followed by neuropathy 54.4%, retinopathy 39.3%,
and macrovascular complications 17.5%. The mean age of patients in this study was
58.3 years with a mean duration of diabetes of 11 years, with only 23.4% of the patients
managing to achieve a HbA1c of below 7%, again reinforcing the poor glycaemic
control and high rate of complications as also found by Mafauzy (2006). However, as
this analysis was based on the T2DM patients in USM, which is a tertiary hospital, the
authors recommended that data from other centres are necessary to determine whether
the findings can be utilised for the diabetes care setting in general.
Diabetic nephropathy as the primary aetiology of renal failure has the highest mortality
when compared to other causes of end stage renal failure and diabetes has consistently
remained as the leading cause of CKD contributing to all new patients requiring
dialysis in Malaysia increasing from 53% in 2004 to 61% in 2013 (Goh, Ong, & Lim,

24
2013). In the 22nd Report of the Malaysian Dialysis and Transplant 2014, it was
reported that the number of patients receiving dialysis had increased from 13, 356
patients in 2005 to 34, 767 patients in 2014, which is a staggering increase of 160%
(Goh & Ong, 2015). Demographic changes were noted too in this report as patients
above 55 years old constituted 58% of all new dialysis patients as opposed to 52% in
2005.
It has been documented that dialysis acceptance and prevalence rates in Malaysia have
almost doubled in recent years with the dialysis acceptance of 1733 per million
population (PMP) in 2004 increasing to 3156 PMP in 2013 (Begum, Khan, & Ming,
2016). Begum et al. also attributed this increase in kidney failure to the increasing
incidence of diabetic kidney disease. In a series of six papers about global kidney
disease, it was noted that although CKD is an important cause of death and loss of
disability-adjusted life-years worldwide, awareness is still low among patients and
health-care providers (Jha et al., 2013). Jha et al. also commented that integration of
screening and management strategies for chronic kidney disease into national
programmes for non-communicable diseases can reduce the burden and cost of care of
CKD.