Evaluation of Ice and Frost Accumulation on the Space ...
14
The Space Congress® Proceedings 1976 (13th) Technology For The New Horizon Apr 1st, 8:00 AM Evaluation of Ice and Frost Accumulation on the Space Shuttle Evaluation of Ice and Frost Accumulation on the Space Shuttle External Tank External Tank R. E. Rhodes Shuttle Projects Office, J. F. Kennedy Space Center, NASA S. W. Walker Design Engineering, J. F. Kennedy Space Center, NASA Follow this and additional works at: https://commons.erau.edu/space-congress-proceedings Scholarly Commons Citation Scholarly Commons Citation Rhodes, R. E. and Walker, S. W., "Evaluation of Ice and Frost Accumulation on the Space Shuttle External Tank" (1976). The Space Congress® Proceedings. 5. https://commons.erau.edu/space-congress-proceedings/proceedings-1976-13th/session-4/5 This Event is brought to you for free and open access by the Conferences at Scholarly Commons. It has been accepted for inclusion in The Space Congress® Proceedings by an authorized administrator of Scholarly Commons. For more information, please contact [email protected].
Transcript of Evaluation of Ice and Frost Accumulation on the Space ...

The Space Congress® Proceedings 1976 (13th) Technology For The New Horizon
Apr 1st, 8:00 AM
Evaluation of Ice and Frost Accumulation on the Space Shuttle Evaluation of Ice and Frost Accumulation on the Space Shuttle
External Tank External Tank
R. E. Rhodes Shuttle Projects Office, J. F. Kennedy Space Center, NASA
S. W. Walker Design Engineering, J. F. Kennedy Space Center, NASA
Follow this and additional works at: https://commons.erau.edu/space-congress-proceedings
Scholarly Commons Citation Scholarly Commons Citation Rhodes, R. E. and Walker, S. W., "Evaluation of Ice and Frost Accumulation on the Space Shuttle External Tank" (1976). The Space Congress® Proceedings. 5. https://commons.erau.edu/space-congress-proceedings/proceedings-1976-13th/session-4/5
This Event is brought to you for free and open access by the Conferences at Scholarly Commons. It has been accepted for inclusion in The Space Congress® Proceedings by an authorized administrator of Scholarly Commons. For more information, please contact [email protected].
EVALUATION OF ICE AND FROST ACCUMULATION ON THE SPACE SHUTTLE EXTERNAL TANK
R. E. RhodesShuttle Projects OfficeJ. F. Kennedy Space Center, NASA
S. W. WalkerDesign EngineeringJ. F. Kennedy Space Center, NASA
ABSTRACT
.Ice/frost formation on the Space Shuttle cryogenic propel 1 ant tanks presents a different problem from that of past launch vehicles. Lift off weight addition has been the primary concern on past launch vehicles. The primary ice/frost concern on the Shuttle vehicle is damage to the Orbiter Thermal Protection System due to ice/frost impact. The approach used to arrive at a solution to this uni que Shuttle problem is presented. The launch vehi cle configuration selected and its limitations are described, along with congingency ground support equipment.
INTRODUCTION
The accumulation of ice/frost on insulated and un insulated surfaces of launch vehicles utilizing cryogenic propellants is well documented. It has been seen on closed circuit T.V., observed by Pad crews after propel!ant tanking, and recorded on launch and flight films. During launch and flight, some of the accumulated ice/frost is shed while the rest remains attached throughout the flight. The accumulation is also shed if the propellant tanks are drained.
Predicting the payload weight penalty resulting from the ice/frost accumulations has been the chief concern on past launch vehicles. The Space Shuttle has an additional and more complex concern because of its unique geometry. The ice/frost shed from the Space Shuttle External Tank (ET) ogive nose would probably hit the Thermal Protection System (TPS) of the piggyback orbiter vehicle. Figure 1 shows the complex configuration of the Shuttle vehi cle while being serviced on the launch pad.
The TPS is comprised of thousands of delicate, ceramic coated, tiles designed to protect the Orbiter and Astronauts from the scorching heat generated during re-entry into the earth's atmos phere. Damage to the TPS during launch or flight can result in a flight safety problem and extensive Orbiter post flight refurbishment.
This paper presents an overview of the programatic approach used to resolve this critical Space Shuttle problem.
BACKGROUND
The ET was originally baselined with insulation to protect against assent heating and prevent the for mation of liquid air during and after loading of
the cryogenic propellants, liquid oxygen (LOX) and liquid hydrogen (LH2). Therefore, one-half inch of spray-on-foam-insulation (SOFI) was specified for the LH2 tank sidewalls and aft bulkhead. In addition, an ablative material was specified for the aft bulkhead of the LH? tank as well as the ogive area of the LOX tank, which is located at the forward end of the ET. The ablative material was also applied to the innertank area between the LOX and LH2 tanks. The cylinderical portion of the LOX tank was left uninsulated as well as all ET to Orbiter and ET to Solid Rocket Boosters (SRBs) attach links.
Early developmental testing determined the orbiter TPS tiles would very likely be damaged if impacted by ice/frost falling from the ET. With the base line ET insulation, falling ice/frost was a virtual certainty.
DETERMINING THE PROBLEM'S MAGNITUDE
Once the problem was posed, engineers at Downey, California, working under the direction of the Orbiter Project Office at the Johnson Space Center (JSC) Houston, Texas,performed some crude tests to determine the TPS's susceptability to damage from falling ice/frost. The tests indicated a one inch cube of ice falling four inches would crack the tile's ceramic coating.
Simultaneously, the Shuttle Program Integration Office at JSC initiated a companion study supported by engineers in the ET Project Office at the Marshall Space Flight Center (MSFC), Huntsville, Alabama, and the Shuttle Project Office at the Kennedy Space Center, Florida. This study was aimed at identifying flight and ground systems which could be used to prevent ice or prevent falling ice/frost from impacting the Orbiter TPS.
The flight concepts considered included ET insula tion adequate to prevent frost, shields supported from the Solid Rocket Boosters,heater blankets on the ET, and a special conductive heater paint pow ered from the ground to prevent ice/frost accumula tion. Also considered were several phobic coatings which could be applied to control the buildup and sheding of ice/frost.
The ground systems considered ranged from large clamshell enclosures and heated air curtains to a variety of flexible bags which could be purged with dry gaseous nitrogen or air. These were intended to isloate the ET surface from the moisture ladened
4-43

ambient air. The nature of these concepts required themi to be in place until very near lift-off since ice/frost would begin to form once the uninsulated surfaces of the ET were exposed to the ambient air. This necessitated expensive and complex equipment for rapid removal of the isolation system.
Heating the ET surface with ground systems was also considered. However, with portions of the tank uninsulated, the heating requirement became imprac tical and the boil -off rate of the cryogenic pro- pell ant greatly increased. This increase impacted the ET vent system size.
In parallel scientists at the ET Project Office (MSFC) initiated a statistical survey of the environments at the two Space Shuttle launch sites, the Kennedy Space Center and Vandenburg A.F.B. California. A thermodynamic math model was deve loped relating all of the tank design and environ mental conditions which affect the ET surface temp erature, eg., insulation thickness, wind speed, ambient temperature, humidity, and thermal radia tion environment. The model would be used to opti mize the ET insulation thickness and determine the effect of a supplemental heating system.
No single simple system or solution was identifiedwhich totally solved the problem. Additional in sulation on the ET was required even though it added weight to the flight vehicle. This addition- all insulation did not provide a solution for the coldest weather conditions; however, it made supp1 ernenta1 non -f1i g ht heading systews feasible.
BASELINE CONFIGURATI ON CHANGE
The Shuttle Program Manager at JSC directed a change to the ET as a result of the preceeding analysis and environmental data review. In its new configuration, the ET will have a minimum of one inch of SOFI over its entire surface.,
This decision allowed the die si gin and planning for all phases of the Space Shuttle Program to con- tiny e. However, some important questions still! remained unanswered.
1. Were there risks to the Space Shuttle program posed by the baseline change?
2. Mere there feasible ground systems which might be i implemented if needed! to provide an allweather launch capability?
3. Could a conductive heater paint be used to eliminate a weather launch constraint?
4. What were the physical characteristics and the damage potential! of the Ice/frost which might form on the insulated cryogenic tanks?
5. Could the weather data be refined for the launch sites?
6. What were the launch probabilities based on the refined weather data?
ASSESSMENT OF BASELINE CHANGE
In order to assess risks and launch probabilities associated with the baseline change, the launch schedule impacts due to weather had to be under stood. Engineers and meteorologists at MSFC, therefore, initiated an effort to further develop and understand the environmental conditions of both KSC and VAFB. This effort provided a ten year weather history for KSC which, when used in con junction with the thermodynamic math model, would allow probability predictions for the formation of ice/frost on the external tank. The effect on launch probability of heat applied to the ET could also be determined. The results were compared with the Space Shuttle program requirement for a ninety five percent launch probability. A launch proba bility of eight five percent was determined to exist for the environmental conditions at KSC during the coldest hours of the coldest month. However, since most launches do not occur during this time, the overall impact for KSC was deter mined to be only two launch delays during the pro jected ten year Shuttle program.
The data for analyzing the environment at VAFB, was incomplete. Therefore, no launch probability assessments were made for that site. Action, how ever, has been taken to accumulate the data for this analysis.
SUPPLEMENTAL GROUND SYSTEMS
The math model indicated that ten watts per square foot of externally applied heat would increase the launch on time probability at KSC to greater than the required ninety-five percent. Ground systems for adding the required heat were evaluated by engineers at KSC. Two systems appeared feasible. The first used the existing twenty kilowatt Xenon Haunch pad searchlights focused on the ET. Some of these lights are already required for night- time operations. This system required that the ET be painted black, The second involved the use of an ambient temperature water shower above the ET.
Using searchlights for heating was simple from a facility point of view since the searchlights were virtually self contained and were portable. They also had the operational advantage of being passive in that the system did not have to be terminated or retracted at lift-off. A detailed analysis indicated the majority of the exposed surface area, which was of concern,could be heated using fifty searchlights placed in six arays six hundred feet from the vehicle. The searchlights were sited to compensate for the shadowing effect of the .Shuttle Service and Access Tower (SSAT) and the Payload Changeout Room (PCR) at the launch pad and to protect them from the blast during launch. The only area not receiving the minimum of 10 watts per squre foot was a narrow strip of the ET adjacent ot the SRBs and the side of the ET away from the orbiter and aft of the inner tank area- Ice/frost on these areas was not expected to impact the orbiter.
4-44
The shower system had a large facility impact in terms of permenantly installled equipment and also produced undesirable side effects. Although analy sis and preliminary small scale tests indicated the concept was feasible, adequate water distribution would have to be verified using a full scale test setup. Also, the undesirable side effects asso ciated with water intrusion into the Orbiter would have to be further evaluated. This system also has the disadvantage of interfering with visual observation of the launch vehicle during the final phases of the launch countdown. The major advant age of the system lies in its relative cost in- sensitivity to changes in the actual heat require ment.
SUPPLEMENTAL FLIGHT SYSTEM
At the MSFC ET Project Office, engineers investi gated applying conductive heater paint over the ET insulation to provide supplemental heating. Elec trical power for the system would be provided from the ground. The concept was determined to be feas ible, however, it had several shortcomings. The heat distribution was not uniform due to variations in the paint thickness. Small scratches produced arcing and the possibility of shorts to adjacent equipment caused safety problems. Applying the paint was also very critical.
EGLIN A.F.B. CLIMATIC CHAMBER TEST
An extensive test program was initiated by MSFC engineers at the Eglin A.F.B., Florida, Climatic Chamber. The purpose of the test was to validate the thermodynamic math model against varing environ mental conditions, characterize the physical prop erties of the ice/frost accumulations, and evaluate the effectiveness of the KSC searchlight radiant heating system and a conductive heater paint system applied to the test tank's insulated surface.
The ten foot diameter test tank was divided into quadrants to give several representative SOFI sur faces for evaluation. One surface was machined to remove its rind and provide a uniform one inch nominal thickness; a second surface was left "as sprayed" for a nominal thickness slightly in excess of one inch; the third and fourth surfaces were machined to one-half inch thickness with the fourth also receiving a conductive heater paint application. The one inch surfaces were painted black to allow evaluation of the Xenon searchlight heating system. Liquid Nitrogen was used in the tank to simulate the cryogenic propel 1 ant and thermocouples were placed on the insulation to measure its surface temperature.
Testing in the Climatic Chamber was accomplished by monitoring the SOFI surface temperature while the environmental conditions were varied. The data was then compared with the predictions from the thermo dynamic math model. The type and density of the accumulated ice/frost were also determined for con ditions when the SOFI surface temperature dropped below 32° F.
TEST RESULTS
Several important results were achieved from the Climatic Chamber tests. The thermodynamic model for predicting SOFI surface temperature was vali dated and the ice/frost formations were character ized. A maximum ice buildup of 1/16-inch or frost with a maximum thickness of 1/2-inch and a density of approximately fifteen pounds per cubic foot were observed. In all cases of frost'buildup, a very tightly adhered layer of ice about 1/32-inch formed adjacent to the insulation. Preliminary indications were that the observed formations of ice/frost would not pose a threat to the Orbiter TPS.
The searchlight heating concept also proved feasible for the predicted ten watts per square foot of radiant heat. As was expected, the searchlights are practically useless in a light rain or fog.
The Eglin test also proved the conductive heater paint's feasibility as a supplemental heating system. However, during the test, the paint demon strated many of the shortcomings previously noted.
The test tank also had an uninsulated protuberance to simulate the ET attach links, and ice formed on it as expected.
CURRENT STUDIES
Engineers at the responsible NASA centers are continuing to evaluate the magnitude of the ice/ frost formation on the ET uninsulated attach links and protuberances. Insulation and electrical heaters are being assessed against the risk of allowing the ice/frost to form.
The JSC Orbiter Project Office engineers are deter mining the risks to flight safety and the magnitude of the refurbishment effort which would be caused by ice damaged tiles.
SUMMARY
The Space Shuttle Program has an acceptable solution to the critical issue of ice/frost formation on the large surface areas of the ET with one inch of SOFI applied. Two supplemental ground solutions have been identified for use if required for a critical launch mission scheduled during the morning hours of a cold month. The facilities are available to complete the collection of environmental data at the VAFB launch site. The data will be available in ample time to arrive at a solution before the facil ity is activated. The protuberance issue is under evaluation and several concepts for solving this problem have been identified. Therefore, the ice/ frost accumulation problem is considered off of the Shuttle program critical list.
ILLUSTRATIONS
Figure 1. Space Shuttle on Launch Pad
4-45

In the event that the SRB begins taking on water, the umbilical will be reconnected and the SRB will again be dewatered. Following dewatering, the SRB will be towed to port by the recovery vessel, where the NP will be removed from the SRB and refurbished, if necessary.
DESIGN APPROACH
The design approach for the SRB Dewatering System included simulation modeling, a hydrodynamics an alysis, materials selection options, development of a dewatering system, and a failure mode and effects analysis study.
Simulation Modeling
The technology required to develop the unmanned, remotely controlled NP envisioned for the SRB De- watering System has been used in previous, similar vehicles. CURV III, which was used in rescuing the PISCES III manned submersible from the Atlan tic seabed, is representative of such technology. This technology was adapted to meet the NASA mission requirements. Docking of the NP in an SRB nozzle is the most critical of those requirements; therefore, a simulation of the docking procedure was used to provide a basis for performance prediction, design definition, and cost reduction in preselection of major system components.
A simulation system was designed and built that sup plied critical performance criteria for the selection of the propulsion system (motor location, amount of thrust per motor, thrust direction, nozzle plug mass, drag, propulsion, time delay)and operator evaluation. A graphics computer (ADAGE), and its associated hard ware and software, was utilized in the development of a stand-alone, realistic simulation system using the following:
1. An image processing computer, with FORTRANlevel processing capabilities and associated software, for on-line editing, compiling, and executing programs
2. Peripheral memories consisting of two tape drives and a disk unit
3. A 20-inch display console screen
4. A teletype for input and control
5. Tie-in capability for inputs from analog computers and a UNIVAC 1110 for real-time simulation
6. A joystick for operator inputs with X, Y and rotational motions allowed
For the simulation problem, the high speed process ing necessary for modeling the SRB dynamics was found to be too much for the ADAGE computer to do while working simultaneously on image processing. Since the SRB' s motions are independent of the NP, a magnetic tape was produced on the UNIVAC 1110
which represented the motion of the SRB as a func tion of time. The ADAGE, free of this time-consum ing task, was then programmed to calculate the re actions that the full-size NP would make to operator inputs. It then superimposed the contents of the SRB tape to give the motion of the NP, relative to the nozzle. The operator, then, saw a simulated picture of the nozzle as seen from the TV camera mounted on top of the NP. The operator pushed the joystick, trying to maneuver the NP inside the SRB. A successful dock was indicated by the sudden in version of the picture as the computer tried to com pute negative coordinates.
The implementation of the simulation procedure on the ADAGE system was very valuable from the stand point of gaining operator experience as well as from the technological conclusions. This modeling tech nique indicated that a hydraulic propulsion system was the most responsive to the docking requirement. The thruster configuration was analyzed in an X, Y system, where the horizontal thrusters were set at 90 degrees to each other, and in a rotational system, where the horizontal thrusters were parallel to each other. The advantages of the X, Y configuration were apparent immediately upon the first test run. In this configuration, docking maneuvers were su perior. Also rotation of the NP and potential oper ator error in maintaining direction were eliminated.
Hydrodynamics Analysis
The simulation modeling produced a preliminary con figuration (Figure 7) for a hydrodynamics analysis; Figure 8 shows the drag curves resulting from this first analysis. For this configuration, approxi mately 450 to 500 Ibs. of thrust would be required to achieve the velocity of 5 fps established as design target.
The final configuration (Figure 9) provides improve ment in several areas. Vertical and horizontal thrusters are paired to prevent rotational moments. Horizontal thrusters were placed as high as possible in order to bring the horizontal drag and thrust centers as nearly in line as possible. The final configuration resulted in lowering the horsepower requirements from the preliminary model of 45 hp to 30 hp due to reduction in drag.
Studies were also conducted on thruster and propel ler sizes. It was decided to use six interchange able thrusters (two in the vertical and four in the- horizontal) to provide maximum repair flexibility and minimum purchase costs. This resulted in a power requirement of 5 hp per thruster; off-the- shelf thrusters in this power range operate most efficiently at approximately 1000 RPM. Sixteen-inch propellers with thrust-augmenting shrouds were found to be most efficient. The final configuration reached after these studies produced drag forces shown in Figure 10. Final power versus drag calcu lations show the NP is capable of maintaining 5 fps horizontal speed. Results from the simulation study show this speed to be adequate for the expected SRB motions
4-48

Material Selection
A materials study determined critical design para meters for the NP structural components and evaluated candidate structural materials using the following criteria:
• Corrosion resistance
• Cost
• Availability
• Ease of fabrication
• Strength
• Weight
• Reliability
On the basis of weight and corrosion considerations, the aluminum alloys offered the best characteristics. Of the aluminum alloys, the 5086 series was selected as providing the best service in the expected marine environment. Wherever dissimilar metals are used, nonconducting material such as nylatron is used to prevent galvanic action.
Dewatering System Study
Two methods for dewatering the SRB were studied: mechanically pumping water out of the SRB or forcing water out by injecting air into the SRB. Analysis showed that to dewater the SRB within the required time (three hours) would require pump capacities greater than any available off-the-shelf pump. Since air must be supplied to the SRB as water is pumped out, no simplification in the dewatering system would result by using the pump, and special develop ment efforts would be required. Forcing air into the SRB is a reliable system with all required com ponents readily available and with known performance characteristics.
Failure Modes and Effects Analysis (FMEA)
The purpose of an FMEA is to identify points of fail ure and their effect on system performance and to permit their reduction or elimination when possible. The analysis covers all electronic, hydraulic, and pneumatic elements of the system.
The philosophy of this analysis is to conduct it in an iterative manner. Each iteration of the analysis proceeds through three basic phases. First, the mis sion profile for a typical SRB Dewatering System mis sion is defined and examined. Each part of the mis sion is defined and described. The preliminary analysis resulted in the following general mission profile:
• Prelaunch checkout
• Launch
• Postlaunch checkout
• Transit and navigation
• SRB inspection
• NP docking
• Dewatering
• Sealing
• Umbilical disconnection
• Towing
• NP removal
• NP refurbishment
As the system design is refined, the mission profile will be updated. During the second phase of the analysis, a reliability block diagram is prepared for each of the parts of the mission profile. The reliability block diagram graphically illustrates the reliability-oriented, series-parallel relation ships of the elements of the design. Once the fail ure modes are determined, the third phase of the analysis begins. The failure modes of each element of each reliability block diagram are analyzed and the effects of these modes on system performance, launch and mission success, are evaluated. The rela tive probability of occurrence of each failure mode is then calculated based on failure rate and mode data from a variety of sources. The probability of success of each phase of the mission profile is then calculated.
As each iteration is completed, the results are pro vided to the engineering team, along with recommen dations as to where design trade-offs can be accom plished to eliminate or reduce points of failure.
SYSTEM CONFIGURATION
During the early stages of design, it was determined that the SRB Dewatering System would be divided into two major subsystems: Shipboard Support, which con sists of a control console, compressed air supply, and power supplies, and the NP. The umbilical cable was then selected to provide the necessary mechani cal, pneumatic, power and electrical interface be tween the Shipboard Support and the NP. A major consideration in the design of all portions of the SRB Dewatering System was the use of existing off- the-shelf technology.
Shipboard Support
Control Console. Functional areas were determined for the control console: thruster control, naviga tion, NP status, and dewatering. See Figure 11 for the block diagram of the control console. Human factors engineering was used to divide the four
4-49

functions between an upright console and a table board (Figure 12). Navigation and NP status dis plays, as well as the video monitor, are grouped on the upright console. All controls (thruster, de- watering, and video camera tilt and focus) are loca ted on the table board, within easy reach of the op erator. Also on the table board are the mission- critical displays of docking and locking arm deploy ment lights.
The thruster control consists of a two-axis joystick for horizontal control with a rotational control knob on top and a separate vertical control stick. Joystick control is proportional in both speed and direction. When the control is moved in a given di rection, the NP responds to the movement in the same direction and the speed of movement is proportional to the distance the joystick is moved. Vertical thrust control is also proportional to the movement of the vertical control with a forward movement translated as an upward thrust.
Navigational functions include depth and heading dis plays as well as the video displays and controls. Except for the video tilt and focus controls, loca ted on the table, all navigation functions are grouped on the upright console. Depth is displayed in a digital readout (feet) and heading display uses both a digital readout to the nearest degree and a LED compass rose display to the nearest 10°. Buffer ing circuits for the LED display average the heading over short time periods in order to present the oper ator with a more easily observed display. The tilt and focus controls for the video camera are located on the table with the NP controls and the tilt dis play is on the upright console with the other dis plays. As with the vertical thruster control, a for ward movement of the video tilt control tilts the camera up and a forward movement of the video focus control focuses the camera on a point farther from the NP.
The NP status group consists of a leak detector dis play and power and hydraulic condition displays. In order to reduce the number of displays, each meter is used to monitor separate, but similar functions, de pending on the setting of a control switch directly below each meter. Both 440 VAC and 120 VAC are moni tored on one meter. The hydraulic pressure from either of two electro-hydraulic power units are monitored on a second meter and either hydraulic volume or fluid temperature are monitored on a third meter. Leak de tectors are placed in various parts of the NP. A sin gle display light illuminates if there is salt water present in the closed system.
The dewatering group consists of displays and controls critical to the dewatering mission of the NP. These are grouped on the table with the NP controls. When each leg is firmly positioned in the SRB, sensors on the four legs provide a signal which illuminates the docking displays on the control console. The center light in this display group illuminates when all three locking arms are deployed and locked. Dewatering group controls consist of locking arm deployment, sewer plug bag inflation, dewatering air control, and dewatering hose release. All four controls are grouped together on the left of the table and are protected by indivi dual switch guards to prevent accidental activation.
Compressed Air and Power Supplies. Compressed air for dewatering is supplied from the support ship. Compressed air for inflating the sewer plug is car ried on board the NP in high-pressure storage bottles. Power supply for the Dewatering System is 120 and 440 V, 3-phase, AC supplied by the support ship.
Nozzle Plug
NP design (Figure 13) was based on the mission re quirements and the availability of off-the-shelf hardware and technology. Preliminary simulation modeling, hydrodynamic studies, material selection trade-off, and the development of a dewatering sys tem were used to develop the NP configuration and power requirements. Once the over-all package con cept was established, seven functional areas were considered in the design (Figures 14a and 14b).
• Structure
• Power and Control
• Hydraulics and Thrusters
• Dewatering
• Video
• NP Sensors
e Search and Recovery (SAR)
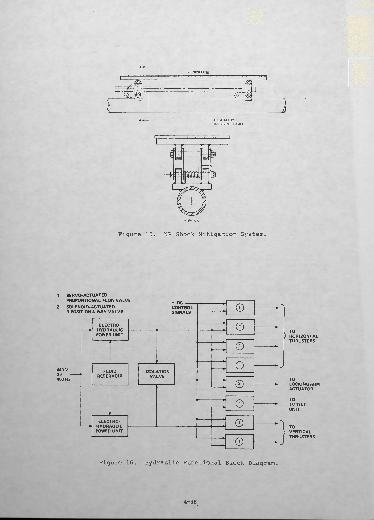
Structure. Series 5086 aluminum was chosen for the basic framework. Housings for the hydraulics, elec tronics and compressed air supplies are modular for ease of maintenance and the structure and internal mountings were designed to withstand shocks and stresses from over-the-side deployment of the NP. Built into the framework is a shock mitigation sys tem (Figure 15) that allows the NP to provide auto matic corrections for variations in nozzle lining thickness due to lining burnout and to absorb any shocks during the docking maneuver.
Power and Control Group. Power and control functions include the umbilical interface, power conditioning and distribution, power monitoring, signal condition ing and transmission, and control and buffering cir cuits. All electrical power enters the NP through the Power Control Group and commands and data signals between the control console and the NP are processed within this group.
Hydraulic Group. Figure 16 is a block diagram of the hydraulic system within the NP. Two electro- hydraulic units provide 15 hp of hydraulic power each. A. normally closed valve isolates the two units, preventing momentary fluid starvation if all thrusters are simultaneously put to full power, but, when opened, allowing either electro-hydraulic unit to power all hydraulically operated units. Thrusters are bent- axis piston type, chosen for their excellent control at low speeds, light weight, and reliability. Hy draulic cylinders for the control of the locking arms and video tilt unit are standard off-the-shelf items.
4-50

Dewatering Group. The dewatering group consists of docking and locking arm deployment sensors, locking arms, pneumatic controls for inflating the sewer plug and providing air for dewatering, a sewer plug and a dewatering hose. When the NP is properly docked within the SRB nozzle, sensors in the NP structure provide input signals to the control con sole, illuminating the docking display lights. When all four lights are on, the operator is assured of a solid docking and can then deploy the locking arms. If all three arms are properly deployed and locked, a light indicates the NP is firmly in place and ini tial dewatering of the SRB can start.
The three locking arms are pictorially shown in Fig ure 17 and are hydraulically operated, over-center locking devices used to hold the NP firmly in place inside the nozzle. Once deployed and locked, the arms provide a solid mechanical lock between the NP and the SRB. If necessary, the arms can be unlocked and relocked from the control console.
With the NP docked and locking arms deployed, initial dewatering is started. Air from a compressor on board the support vessel is fed, via the pneumatic hose married to the umbilical cable, into the SRB casing, forcing water out until the SRB assumes the log mode.
The sewer plug is then inflated to seal the nozzle. An electro-servo valve controls the flow of com pressed air from a cylinder onboard the NP and on command from the control console, the valve opens and compressed air inflates the sewer plug.
The sewer plug is an inflatable rubber toroid mounted on a central mandrel. It is constructed of well- tested and fuel-resistant material in current commer cial production with a minimum life of ten missions. It is designed to be self-storing so that special packaging procedures will not be required.
After the sewer plug is inflated and the SRB nozzle sealed, final log mode dewatering is accomplished by building up pressure within the SRB and forcing the remaining water out through a dewatering hose. When the operator presses the dewatering hose release con trol, the solenoid releases a latch and the dewater ing hose deploys. The hose is weighted and mounted to a 360° swivel plate, allowing the hose to auto matically fall to the lowest part of the SRB, insur ing complete dewatering.
Video Group. The video group, which provides the operator with visual controls during recovery opera tions, consists of an underwater, silicon diode video camera with a quartz iodide light, and a hydraulic tilt unit with a tilt position sensor. Both the light and camera can operate in either air or water. The video camera is equipped with an automatic iris control which maintains proper exposure. The camera also has a remote focusing system which responds to command signals from the control console to correctly focus the camera. The tilt unit is a standard off- the-shelf item and the position sensor is a potentio meter mechanically attached to the tilt mount.
NP Sensors Group. The NP sensors group consists of a compass, a depthometer, and leak detectors. The compass is a production model magnetic compass. The sending unit converts angular displacement into a pulse train where each pulse represents one degree of rotation from magnetic north. The depthometer is also a standard production model and consists of a potentiometer attached to a pressure diaphragm. Leak detectors installed at various points within the NP detect salt water by the proven method of grounding the circuit when salt water is present.
Search and Recovery (SAR) Group. In the event the NP becomes disabled or lost, means have been provi ded to aid in its location. An underwater acoustic locating device provides sonar contacts during search operations. Should the umbilical become severed and the NP lost, a radio beam and a flashing strobe light will provide means for visual contact.
UMBILICAL CABLE
The 600-foot Umbilical Cable has an integral kevlar strength member of 10,000 pounds and an outer scuff jacket. The pneumatic hose is married to the cable and floats are attached during launch.
MODULAR APPROACH
The NP utilizes the modular philosophy (Figure 18). In the event that future modifications are required to the NP to accommodate SRB retrievals, they can be accomplished at minimum cost and design change. In addition, the modular concept enhances maintainabil ity.
Figure 1. NASA Space Shuttle.
4-51

AIR COMPRESSOR
NOZZLE PLUG
AIR STORAGE UMBILICAL CABLE
CONTROL CONSOLE
Figure 2. SRB Dewatering System.
Figure 5. NP Docked.
Figure 3. NP Transit to SRB.
'WATER DISCHARGE
Figure 6. Log Mode Dewatering.
Figure 4. Inspection of SRB.
4-52

DRAG CENTERRANGE(NO CABLE)
NOZZLE WALL
Figure 7. Preliminary NP Configuration.Figure 9. Final NP Configuration.
0 1
Figure 8. Preliminary NP
Configuration Drag.
SPEED (FPS)
Figure 10. Final NP Configuration Drag
and Thrust Curves.
4-53

SHIPBOARDCONTROL CONSOLE
{ FROM COM
PRESSED AIR
SUPPLY
GROUP
DF WATER INC)GROUP
rUMBILICAL
DISCONNECTTHRUSTER CONTROL GROUP
1. VERTICAL THRUSTER CONTROL
2. HORIZONTAL THRUSTER CONTROL
NAVIGATION GROUP. DISPLAY UNIT
• COMPASS
• DEPTH
• VIDEO
• VIDEO TILT
. CONTROL UNIT
• VIDEO TILT
• VIDEO FOCUS
NP STATUS GROUP1. ELECTRICAL POWER STATUS
2. HYDRAULIC POWER STATUS
3. LEAK STATUS
DEWATERING GROUPDISPLAY UNITS
• DOCKING
• LOCKING ARM DEPLOYED
CONTROL UNITS
• ARM LOCK
• DEWATERING AIR
• BAG FILL
• DEWATERING HOSE RELEASE
J
Figure 11. SRB Dewatering System Functional Block Diagram (Shipboard).
MISSION PACKAGE SWITCHES (BAG FILL, DEWATERING HOSE RELEASE, DEWATERING AIR, ARM LOCK)
VERTICAL THRUSTER CONTROL STICK
DOCKING AN LOCKING ARM SENSORS DISPLAY LIGHTS
Figure 12. Control Console.
METERS AND CONTROLS FOR MONITORING POWER AND HYDRAULIC STATUS
REMOTE CONTROL LOCKOUT
HORIZONTAL THRUSTER CONTROL STICK
Figure 13.SRB Dewatering System
Nozzle Plug.
4-54

UMBILICAL CABLE
FROM SHIPBOARD
— — — — COMPRESSED AIR——————— ELECTRICAL
Figure 14a. SRB Dewatering Functional Block Diagram (NP).
POWER AND CONTROL GROUP
1. UMBILICAL INTERFACE
2. ELECTRICAL POWER DISTRIBUTION
3. ELECTRICAL POWER SENSING
4. SIGNAL CONDITIONING AND TRANSMISSION
5. CONTROL
HYDRAULIC GROUP
1. ELECTRO-HYDRAULIC POWER UNITS
2. HYDRAULIC CONTROL VALVES
3. HYDRAULIC POWER STATUS SENSORS
NP SENSOR GROUP
1. COMPASS
2. DEPTHOMETER
3. LEAK DETECTORS
VIDEO GROUP
1. VIDEO CAMERA
2. LIGHT
3. VIDEO TILT POSITION SENSOR
4. VIDEO TILT UNIT
5. FOCUS CONTROL
DEWATERING GROUP
1. SENSOR UNIT
• DOCKING
• LOCKING ARM
2. LOCKING ARM UNIT
3. PNEUMATIC CONTROL UNIT
• DEWATERING
• BAG FILL
4. SEWER PLUG
5. DEWATERING HOSE UNIT
SEARCH AND RECOVERY (SAR) GROUP
1.PINGER
2. RADIO BEACON
3. STROBE
STRUCTURE
• MODULE JOINT DESIGN
• SHOCK SYSTEM
• MATERIALS
Figure 14b. SRB Dewatering System Functional Block Diagram (NP)
4-55
V NEOPRENE
L ,. ._,
L "
lo •
j)•©•
^
'o g
^s>
f
1
LALUM. ALLOY TUBING (NP FRAME)
l\______"
Figure 15. NP Shock Mitigation System.
1 SERVO-ACTUATED
440V 30 - 400 Hz
OID^ TION
ACTUATED 4-WAY VALVE
ELECTRO HYDRAULIC POWER UNIT
FLUID RESERVOIR
ELECTRO- HYDRAULIC POWER UNIT
CONTROLSIGNALS
ISOLATION. VALVE
——— ».
——— 1».
0.)
d)
0)
(0
©
(0
(0
©
—————— lfc»
, —————— Ik,
TO) HORIZONTAL
THRUSTERS
TOLOCKING ARMACTUATOR
TOTV TILTUNIT
TOVERTICALTHRUSTERS
Figure 16. Hydraulic Functional Block Diagram.
4-56

IVER-CENTER OCK MECHANISM
Figure 17. Locking Arms Pictorial Presentation
OPTICS MODULE
DEWATERING MODULE
LOCKING ARM MODULE
SEWER PLUG MODULE
POWER MODULE
Figure 18. NP Modules.
4-57