Evaluation of GHG Allowance Allocation Options Karen Griffin, Adam Langton, and Scott Murtishaw...
31
Evaluation of GHG Allowance Allocation Options Karen Griffin, Adam Langton, and Scott Murtishaw April 21, 2008
-
Upload
oswald-armstrong -
Category
Documents
-
view
212 -
download
0
Transcript of Evaluation of GHG Allowance Allocation Options Karen Griffin, Adam Langton, and Scott Murtishaw...

Evaluation of GHG Allowance Allocation Options
Karen Griffin, Adam Langton, and
Scott Murtishaw
April 21, 2008

2
Distribution Issues = Fairness
The level of real GHG reductions is not an allocation issue. The distribution of costs and benefits is.
Fairness is treating similarly placed groups alike and differently placed groups differently.
The “differences” must be relevant to the issue.

3
Evaluation Criteria
• Consumer costs: Impacts on retail electricity customers
• Equity among customers of retail providers
• Administrative simplicity/transparency
• Accommodation of new resource entrants
The relevant criteria address how each distribution option is judged to be “fair”

4
Other Program Criteria
Other program criteria are constraints that don’t change among allocation options:•Level of real GHG reductions•Prevent increase in criteria air pollutants and toxic air contaminants•Localized emission impacts in communities already adversely impacted by air pollution

5
Pure and Preferred Options
– Reviewed technical studies and similar programs
– Selected principle options with an adequate technical literature or examples: historical emission-based, output-based, and auctioning
– Pure approach
– Preferred approach - modified to address weaknesses of pure approach
E3 is modeling options. The results will inform choices
6
Emission-Based Allocation
• Mechanics of Emission-Based allocation• Evaluation of a Pure Emission-Based
Allocation– Consumer Cost– Equity among Customers of Retail Providers– Administrative Simplicity/transparency– Accommodation of New Entrants
• Staff Preferred Emission-Based Allocation

7
Emission-Based Mechanics
• Provide allowances to deliverers on an historic emissions basis
• Multi-year baseline to smooth normal variation• All deliverers receive proportional declining caps • Awarded in perpetuity based on historic period• Administrative determination of baseline and historic
emissions from unspecified purchases• Special rules may be needed for new entrants

8
Key Impacts of Emission-based
• Wealth transfer to deliverers from most CA customers whose retail providers are dependent on competitive wholesale markets
• This does not occur for fully-resourced utilities, because they can choose how to use the value of the allowance
• New entrants disadvantaged unless there is a set-aside
• Substantial value set by State’s estimate of unspecified source emissions

9
Example of Potential Consumer Loss
• Pacific Gas and Electric 378 million $• Sacramento MUD 64 million $• San Diego Gas & Electric 103 million $• Southern California Edison 352 million $• Total 897 million $
Example uses 2005 data and $20 a metric ton
Assumes full pass-through of opportunity costs

10
Evaluation of Emission-Based
• Consumer Cost: Higher costs for market-dependent customers; for fully-resourced, it depends on provider decision of how to use allowance value
• Transfers: No transfers among retail providers• Administrative Simplicity: Simple, except
administrative decision on baseline and estimated emissions
• New Entrants: Requires either set-aside or discriminates against them

11
Preferred Emission-Based Allocation
• 50% emission-based allocation (compensation to deliverers in early years)
• Remainder distributed by mix of at least 10% auction and the rest output-based
• Transition from emission-based allocation to increasing shares of output-based or auctioning, initial idea is 6 years.
Deals with wealth transfer from consumers and with new entrants

12
Output-Based Allocation
• Mechanics of Output-Based Allocation• Evaluation of a Pure Output-Based Allocation
– Customer Cost– Equity among Customers of Retail Providers– Administrative Simplicity– Accommodation of New Entrants
• Variations on Output-Based Design• Staff Preferred Output-Based Allocation

13
Mechanics
• Freely Allocate Allowances on a Per Unit Generation Basis
• Benchmarking vs. Fixed-Cap Output-Based
• Generation from a Prior Period Needed for Fixed Cap
14
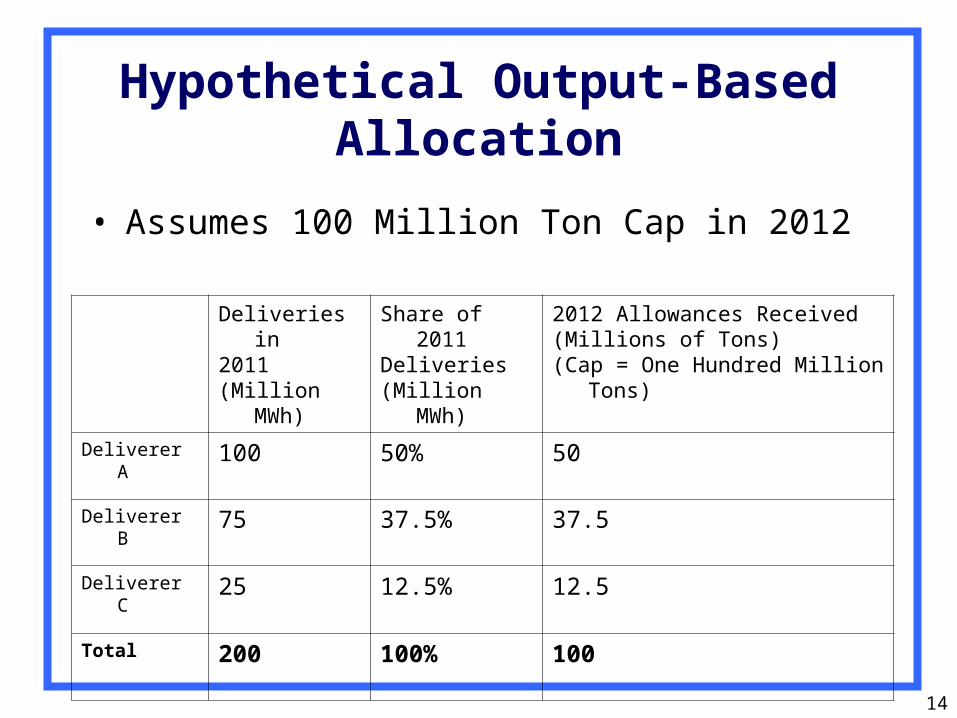
Hypothetical Output-Based Allocation
• Assumes 100 Million Ton Cap in 2012
Deliveries in2011(Million MWh)
Share of 2011Deliveries(Million MWh)
2012 Allowances Received(Millions of Tons)(Cap = One Hundred Million Tons)
Deliverer A 100 50% 50
Deliverer B 75 37.5% 37.5
Deliverer C 25 12.5% 12.5
Total 200 100% 100

15
Pure Output-Based Allocation
• Allocation to All Generation
• Based on Previous Year’s Generation
• Uniform level of allowances provided to Deliverers for each unit of generation
(Total Capped Emission Level, tons CO2e)
= Allowances per MWh
(Total Generation, MWh)

16
Pure Output-Based Allocation
0
100
200
300
400
500
600
700
800
900
Zero-GHG CCGT Gas CT Coal
Em
issi
on
Rat
es,
kgC
O2/
MW
h
Surplus Allowances
Emission Rate
Allocation Rate, All Sources

17
Key Impacts of Output-Based Allocation
• Provides cost advantage to low emitting and non-emitting sources relative to high emitting sources.
• Provides an overall incentive to increase generation.
18
Evaluation of a Pure Output-Based Allocation
• Consumer Cost: Dampens energy price increases and encourages increased levels of generation
• Transfers: Advantage to customers of retail providers with low emissions.
• Administrative Simplicity: Transparent, simple formula for allocating allowances
• New Entrants: With frequent updating, easily accommodates new entrants

19
Variations of Output-Based Allocation
• Benchmark versus Fixed Cap
• Updating Frequency/Baseline
• Restricting Generator Eligibility
• Fuel Differentiated

20
Fuel Differentiated Output-Based Allocation
Unweighted Generation Weighted Generation
GenerationFuel Type
Deliveries in2011,(million MWh)
Share of 2011Deliveries
2012AllowancesReceived,(In million tons)
WeightedDeliveries in2011,(millionMWh)
Share of 2011 Weighted Deliveries
2012AllowanceReceived, (in million tons)
Gas-Fired 100 66.7% 66.7 100 50% 50
Coal-Fired 50 33.3% 33.3 100 50% 50
Weighting Factor: Gas-Fired = 1, Coal-Fired = 2

21
Preferred Output-Based Allocation
• Restrict Allocation to Emitting Generation– Allowances to all generation transfers valuable allowances
to nuclear, hydro, and existing renewable generators.– Reduces transfers among customers of different retail
providers.• Fuel Differentiated Allocation
– Higher per energy unit allowances to high emitters – Further minimizes transfers by benefiting coal-fired
generation relative to undifferentiated output-based allocation.
– Need to identify sources of unspecified power adds administrative complexity
• Transition from Output-Based Allocation to Increasing Shares of Auctioning

22
Proposed Transition Schedule from Output-Based Allocation to Auctioning
Year % Allowances Issued on Output Basis
% Allowances Issued by Auction
2012 90% 10%
2013 80% 20%
2014 70% 30%
2015 50% 50%
2016 30% 70%
2017 10% 90%
2018+ 0% 100%

Auctioning
• Mechanics of Auctioning• Description and Evaluation of Pure Auctioning• Mechanics of Revenue Recycling to Retail
Providers• Variations on Revenue Recycling• Preferred Auctioning Approach
23

2424
Auctioning Mechanics
• Auctions of GHG allowances would be conducted by ARB or its agent
• Entities with a compliance obligation buy allowances according to anticipated need from the auction and/or the secondary market

2525
Description of a Pure Auction Allocation
• All allowances are distributed by auction• Assumes no direct refund of auction
revenues for electricity customer benefit• Assumes auctions revenues provide benefits
relatively evenly across California

2626
Evaluation of Pure Auction
• Consumer Cost: The need for deliverers to recover allowance costs raises the cost of electricity to consumers
• Transfers: Given assumptions, an indirect transfer of money from customers of high-GHG retail providers to customers of low-GHG retail providers occurs
• Administrative Simplicity: Requires no baselines for deliverers or retail providers
• New Entrants: No barrier to market entry for new deliverers

2727
Mechanics for Recycling Auction Revenue to Retail Providers
• A certain number of allowances per vintage are reserved for the electricity sector
• Either allowances or auction revenue rights (ARRs) are allocated to individual retail providers
• Allowances are centrally auctioned by ARB or its agent
• Retail providers that are also deliverers make/receive net payments – the difference between ARRs received and allowances purchased

2828
Variations on Auctioning with Revenue Recycling
• Sales-based: Auction revenue given to retail providers on the basis of retail sales– Verified energy savings could also qualify for
auction revenues
• Emission-based: Auction revenue given to retail providers on the basis of emissions associated with serving load in a fixed, historical base period

2929
Evaluation of Sales-Based Revenue Recycling
• Consumer Cost: The return of auction revenue to retail providers significantly lowers consumer cost
• Transfers: High-GHG retail providers would spend much more on allowances (whether directly or embedded in market prices) than they would receive in auction revenue– Effects would be similar to pure output-based
method
• Administrative Simplicity: Allocating on a sales basis is administratively simple

3030
Preferred Auction Approach• Initial revenue recycling on historic-emission basis• Consumer Cost: Low cost to consumers• Transfers: Minimizes transfers among customers of
different retail providers• Administrative Simplicity: Need to calculate base
period emissions adds additional complexity• Transition to increasing share of revenue recycling on
sales basis– Eventual distribution of revenue on “net” load (subtraction of
load served by utility-owned nuclear and hydro resources) is one method to consider

31
Summary of Options
Allocation Method Consumer Cost
Transfers Admin Simplicity
New Entrants
Pure Emission-Based /
Preferred Emission-Based
Pure Output-Based
Preferred Output-Based
Pure Auction
Preferred Auction
= performs well, = performs poorly