The Freeway Connection | Freeway to Success and Recipes 4 Your Success

NDOT Research Report
Report No. 300-12-803
Evaluation of Geometric Design Needs of
Freeway Systems Based on Traffic and
Geometric Data
October 2013
Nevada Department of Transportation
1263 South Stewart Street
Carson City, NV 89712
Disclaimer
This work was sponsored by the Nevada Department of Transportation. The contents of
this report reflect the views of the authors, who are responsible for the facts and the
accuracy of the data presented herein. The contents do not necessarily reflect the official
views or policies of the State of Nevada at the time of publication. This report does not
constitute a standard, specification, or regulation.
EVALUATION OF GEOMETRIC DESIGN NEEDS OF FREEWAY SYSTEMS
BASED ON TRAFFIC AND GEOMETRIC DATA
Submitted to
Nevada Department of Transportation
Research Division
Attn: Ken Chambers
1263 S. Stewart Street
Carson City, NV 89712
Submitted by
Hualiang (Harry) Teng, Ph.D., Associate Professor
Department of Civil and Environmental Engineering
University of Nevada, Las Vegas
4505 Maryland Parkway, Box 454007
Las Vegas, NV 89154-4007
October 20, 2013

6
ABSTRACT
In Las Vegas, Nevada, the increased traffic competes for the limited spaces available in the
freeway system and thus reduces safety performance. This study identified geometric design
issues on freeway systems in Las Vegas, Nevada, based on available safety data for freeway EN-
EX and EX-EN segment types. For every segment, crash rate and severity models were
developed. It was found that for EN-EX segment type, number of through lanes, curve radius,
shoulder and median widths had a significant impact on average crash rate. The same geometric
elements with an additional of AADT also indicated significant impact on severity crashes.
Segments with large radius reduced average crash rate while it did not have an impact on
severity crashes. Wide shoulders and medians reduced average crash rate and high severity
crashes. Long segments reduced average crash rate while it did not indicate an impact on crash
severity. The number of through lanes increased both average crash rate and high severity
crashes. For EX-EN segments, curve with large radius, wide shoulders and medians reduced both
average crash rate and high severity crashes. The number of through lanes increased average
crash rate on I-15 while it reduced average crash rate on I-215. It did not have an impact on
average crash rate on US 95. In addition, the number of through lanes increased the number of
high severity crashes on I-15 and I-215 while it reduced high severity crashes on US95. High
traffic volume increased average crash rate on I-215 while it did not indicate an impact on I-15
and US 95.
As far as countermeasures to improve safety, it was identified that on an EN-EX segment,
congestions usually occur in the following two situations. First, weaving would happen between
traffic streams on to freeway and that off from freeway. Either of these two traffic stream
become heavy, the freeway would become congested, which need separating them spatially.
When the traffic from the on-ramp is heavy, ramp metering can be installed, which is a way to
mitigate congestion and reduce crash on freeway. Second, if the traffic on the off-ramp could
not be clearly quickly, the queue would back up to freeway and then make the freeway
congested. In this case, signals at the end of the off-ramp need to be adjusted to make the off-
ramp traffic cleared on a timely manner. If this segment is long, warning signs would be
recommended to warn motorists of the congestion downstream.
7
An EX-EN segment is usually at the middle of an interchange, one side for traffic getting off
freeway and the other side getting on freeway. The congestions usually occur in the follows two
situations. First, the traffic on to freeway become heavy, making the merging on freeway
congested, and this congestion would quickly spill back to this segment. In this case, it is
suggested to install ramp metering. When the traffic is extremely heavy, separating the traffic on
to the freeway spatially from that goes through the downstream segment is necessary. If this
segment is long, warning signs are suggested to install on this segment, alerting the motorists of
the congestion downstream. Second, if the traffic getting off the freeway become heavy,
congestion on the off-ramp would back up to the freeway, which would create traffic turbulences
for traffic even after passing the point of off ramp.
8
TABLE OF CONTENTS
ABSTRACT .................................................................................................................................................. 6
ACKNOWLEDGEMENTS ........................................................................... Error! Bookmark not defined.
TABLE OF CONTENTS .............................................................................................................................. 8
LIST OF FIGURES .................................................................................................................................... 10
CHAPTER 1 INTRODUCTION ................................................................................................................ 11
1.1. Motivation background ............................................................................................................... 11
1.2 Statement of the problem ............................................................................................................ 16
1.3 Research hypothesis .................................................................................................................... 16
1.4 Objectives ................................................................................................................................... 17
1.5 Study contributions ........................................................................ Error! Bookmark not defined.
1.6 Organization of the report ........................................................................................................... 17
CHAPTER 2 LITERATURE REVIEW ..................................................................................................... 18
2.1 Introduction .................................................................................... Error! Bookmark not defined.
2.2 Freeway safety performance and modeling ................................... Error! Bookmark not defined.
CHAPTER THREE METHODOLOGY .................................................................................................... 24
3.1 Introduction .................................................................................... Error! Bookmark not defined.
3.2 Data collection ............................................................................... Error! Bookmark not defined.
3.3 Data analysis .................................................................................. Error! Bookmark not defined.
3.3.1 Crash rate model specification ................................................................................................ 26
3.3.2 Crash Severity Model specification ........................................................................................ 28
CHAPTER 4 DATA COLLECTION ......................................................................................................... 31
CHAPTER 5: MODELING RESULTS ...................................................................................................... 45
5.1 Descriptive statistics ................................................................................................................... 45
5.2 Modeling results and discussion for crash rate model. ............................................................... 50
5.3 Modeling results and discussion for severity model ................................................................... 52
CHAPTER 6 CONCLUSIONS AND RECOMMENDATIONS ............................................................... 94
REFERENCES ........................................................................................................................................... 95

9
LIST OF TABLES
Table 1: Previous studies with freeway characteristics .................................. Error! Bookmark not defined.
Table 2: Total segments in each freeway .................................................................................................... 32
Table 3: Number of segment types and crashes in every freeway .............................................................. 45
Table 4: Summary of crash types in every freeway .................................................................................... 45
Table 5: Comparison of proportional of crashes per segment type per freeway ......................................... 46
Table 6: Descriptive statistics of variables for EN-EX and EX-EN segment types ................................... 47
Table 7: Descriptive statistics of transformed variables for EN-EX and EX-EN segment types ......... Error!
Bookmark not defined.
Table 8: Crash Rate Model Results............................................................................................................. 50
Table 9: Probit Model Results .................................................................................................................... 53
10
LIST OF FIGURES
Figure 1: EN-EX segment type configuration ............................................................................................ 12
Figure 2: EX-EN segment type configuration ............................................................................................ 13
Figure 3: Typical Layout and Variables for the EN-EX Ramp Spacing Combination ............................... 23
Figure 4: Flow chart of activities ................................................................................................................ 25
Figure 5: Study location .............................................................................................................................. 32
Figure 6: EN-EX Segment (bounded by entry A and exit B) ..................................................................... 33
Figure 7: EN-EN Segment (bounded by entries C and D) .......................................................................... 33
Figure 8: EX-EX Segment (bounded by exits E and F) .............................................................................. 34
Figure 9: EX-EX Segment (bounded by exit G and entry H) ..................................................................... 34
Figure 10: Overlay problems of crashes and segments ............................................................................... 35
Figure 11: Crashes overlaid with digitized segments ................................................................................. 36
Figure 12: Definition of length of segment ................................................................................................. 37
Figure 13: Sample segment digitized showing the measurements of segment width ................................. 37
Figure 14: Median and shoulder width – ground distance between the two red lines ................................ 38
Figure 15: Part of a segment indicating through lanes ................................................................................ 38
Figure 16: Reverse curve located on US 95 and Russell Rd interchange, .................................................. 40
Figure 17: Weaving movement variables - lane change from ramp-to-freeway and weaving movement
lanes ............................................................................................................................................................ 42
Figure 18: One-sided weaving segments (Source: HCM2010) .................................................................. 42
Figure 19: Balanced approach example, calculated output value in red ..................................................... 43
Figure 20: Comparative map of given AADT locations calculated ............................................................ 44
Figure 21: Distribution of crash rate against median and shoulder widths across segment types .............. 48
Figure 22: Distribution of crash rate against length and radius across segment types ................................ 48
Figure 23: Distribution of crash rate against through lanes and AADT across segment types ................... 49

11
CHAPTER 1 INTRODUCTION
1.1. Motivation background
The Nevada traffic crash reports indicated that for year 2006 to 2010, a total of 176,858 crashes
occurred. In 2010, the report indicated that 30,187 crashes occurred. Detailing these crashes by
severity level, the report indicated that, 115 fatal crashes, 12,147 injury crashes and 17,925
property damage crashes were recorded with respective percentages as 0.38% fatal, 40.24%
injury, and 59.38% property damage.
With respect to freeways, crash data obtained from NDOT indicated that a total of 1,661 crashes
occurred on the freeway systems during the year 2010. Among these 12 (0.72%) crashes were
fatal, 735 (44.25%) injury crashes and 914 (55.03%) property damage crashes. These data
indicate that more severe crashes happened on freeways than on arterials, which need further
investigation to improve safety performance. Different alternatives can be implemented to
improve safety performance on freeways including increasing capacity at bottleneck locations,
altering the geometrics to eliminate safety hazards, enhancing various attributes of the freeway
environment (e.g., signing, pavement markings, illumination) to increase safety and driver
convenience (FHWA 2011). Among these alternatives, those on geometric design are
fundamental.
This research is intended to evaluate contributing factors to crash occurrence and recommend
corresponding countermeasures in Las Vegas of Nevada. Four types of segments bounded by
ramps can be found in Las Vegas of Nevada: EN-EX, EX-EN, EN-EN, and EX-EX where EN
means an on-ramp and EX stands for off-ramp. Among them, the number of EN-EN and EX-EX
segment types is very small and was not considered in the analysis in this study. This section
covers a brief explanation of an overview of safety performance for EN-EX and EX-EN segment
types in terms of their geometric elements and operation factors.
12
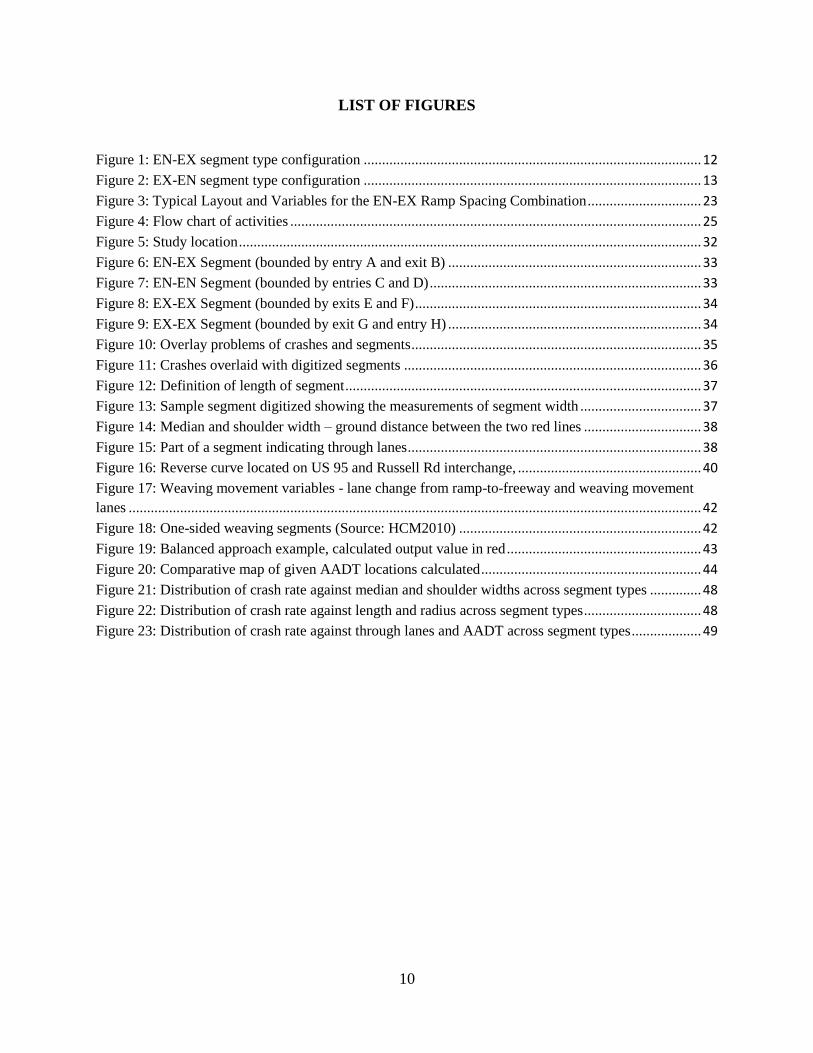
EN-EX segments
EN-EX segments have an on-ramp for entering vehicles and off-ramp for vehicles leaving the
facility. The two ramps can either be joined by a continuous auxiliary lane (see Figure 1.1: a) or
a limited auxiliary lane joining an on-ramp (see Figure 1.1: b) or an off-ramp (see Figure 1.1: c):
Figure1.1: EN-EX segment type configuration
These segments are called weaving segments (2010 Highway Capacity Manual). They are
characterized by intense lane-changing maneuvers as drivers must access lanes appropriate for
their desired exit point. Traffic flows in these segments is subjected to turbulence in excess of
that normally present on other segment types.
Safety performance of these segments can be affected by its geometric elements such as the
number of lanes on the main facility, segment length, curvature, shoulder and medians widths,
and the total flows (AADT) experienced on the segments. Number of lanes may affect safety
performance in two ways: More lanes on a segment induce lane-change activity and this can be
thought of in two situations: In the first situation, the flow from the on-ramp merging with the
main stream must cross the path of the flow leaving the main facility. The second situation
occurs when vehicles that do not weave from one lane of the facility to the other make additional
lane changes to avoid concentrated areas of turbulence within the segment. The turbulence
created by lane changes increases the chance of collisions depending on the merging vehicle
speed, acceptable gaps, and drivers’ decision. With few number of lanes rear-end collisions are
also likely to occur due to congestion.
Figure 1: a Figure 1: b
Figure 1: c
13
Failure to maintain a safe following distance of the lead vehicle intending to exit the main
facility, vehicle speed and short length of segments increase the chance of crash occurrence.
Segments located in urban areas exhibit high density of entrance and exits tendencies and these
increases more weaving leading to an increase in rear-end crashes on these segments (Golob et
al. 2004). Sideswipe collisions may also be experienced when vehicles overtake each other on
lanes that are not involved in weaving maneuvers. This happens when drivers intend to avoid
lanes with high traffic flows. They are also more likely to occur on an on-ramps compared to off-
ramps due to an increase in merging activity.
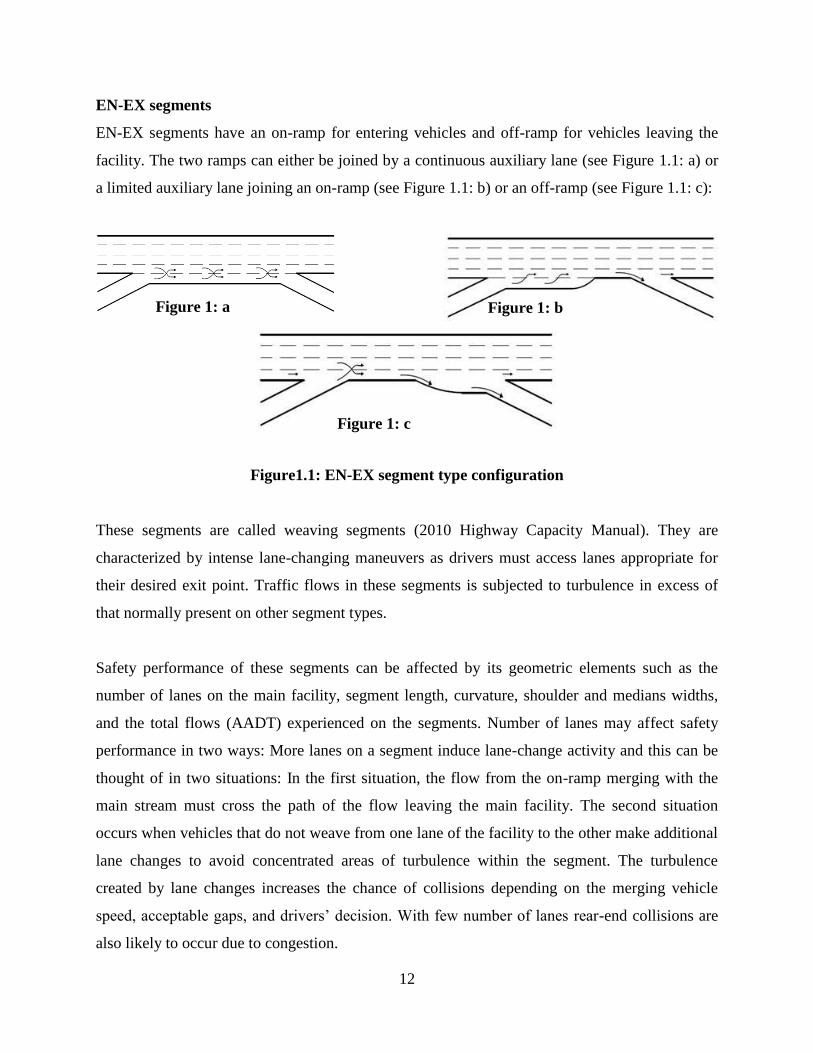
EX-EN segments
EX-EN segments have an off-ramp followed by an on-ramp and only through vehicular traffic is
expected to use the segments (see Figure 1.2 below).
Figure1.2: EX-EN segment type configuration
Geometric elements likely to influence safety performance are the length of segments, the
number of through lanes, curvature, narrow medians without barriers, and grade. Since the only
traffic using the segments are through traffic, there will be less lane-changing activity because
vehicles are not expected to exit at the next terminal. The segments are likely to experience rear-
end, head-on, sideswipe, and angle crashes as a results of its geometric configuration. Rea-end
crashes are likely to happen on these segments due to the congestion caused by the merging of
on-ramp traffic to mainline at the segments downstream. They can be between two vehicles or
chain-reaction rear-end crashes (Kim et al. 2007). Chain-reaction rear-end crashes are more
likely with higher volumes which reduces the likelihood to reduce crashes. Truck percentage on
freeways also contribute to an increase of occurrence of rear-end crashes. On the event that a
leading vehicle is a truck, the following vehicles tend to switch lanes and overtake the truck due
14
to slow speed of the truck. Rear-end crashes will increase if the maneuvers are erratic, there are
more improper lane changes, and insufficient headway for a following truck after an overtake
action. Few number of through lanes reflected by road congestion and driver distraction can also
result in rear-end crashes. Head-on crashes had no predominant cause and can occur at all times
(NCHRP Report 500-18). Factors which have been reported to contribute to head-on crash
occurrence are narrow medians without barriers, high traffic volumes travelling at high speeds,
and driver behavior. Narrow medians without barriers increase the likelihood of cross-over
crashes. Driver behavior includes fatigue, inattention, and excessive speeding. Sideswipe crashes
are mainly caused by unsafe lane-change actions, failure to stay in the lane, and disregard for
pavement markings.
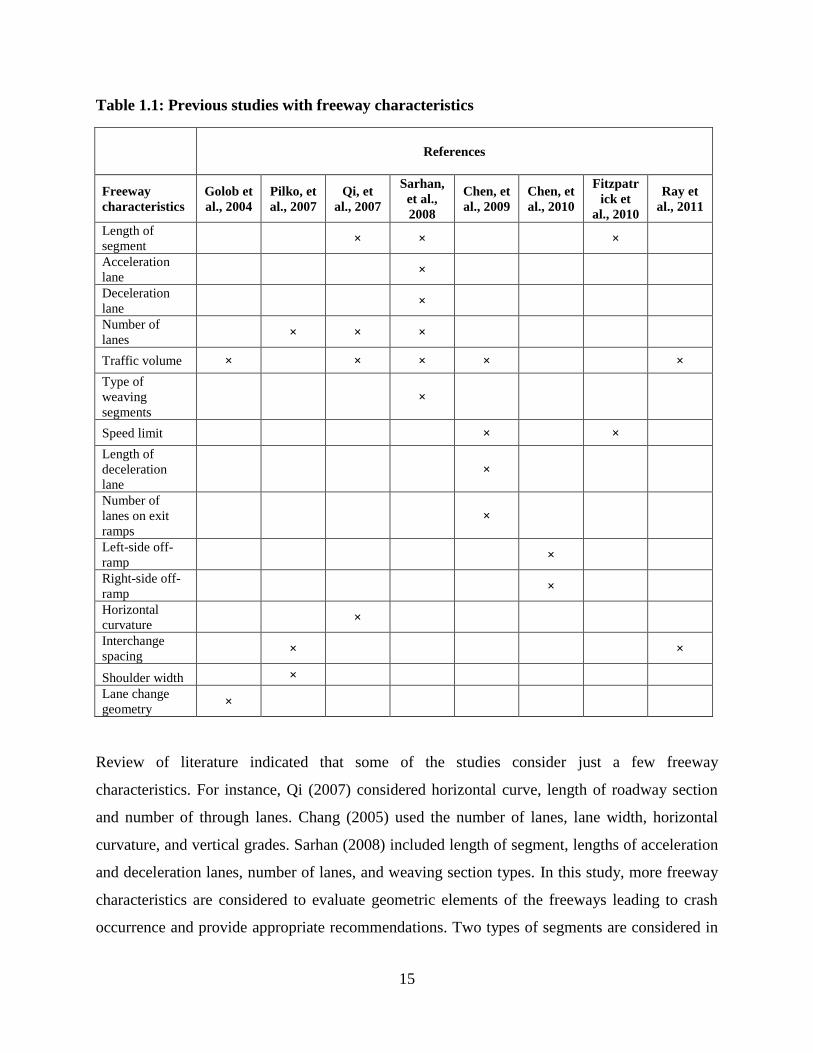
Different research activities have investigated the relationship of crashes on freeways to its
geometric characteristics (Pilko et al., 2007; Ray et al., 2011; Fitzpatrick et al., 2010; Abdel-Aty,
2009; Sarhan et al., 2008; Golob et al., 2004; Chen et al., 2010; Qi et al., 2007). Table 1.1 shows
every reference with freeway characteristics studied.
Results from these studies lead to different recommendations to improve safety performance of
freeways. For instance, Fitzapatrick et al., (2010) proposed updates to current Texas Department
of Transportation guidelines on recommended distances between ramps. The same task was also
conducted by Ray et al., (2011). In their study relationship between ramp spacing and safety was
discussed for three ramp combinations: EN–EX, EN–EN and EX–EN.
Instead of focusing on freeway segments between ramps or interchanges, weaving sections
within the system were also investigated. Sarhan et al. (2008) found that for two acceleration
lane with the same length, extended acceleration lanes increases collision frequency compared to
limited acceleration lanes. Deceleration lanes were also found to have the same trend. The study
also incorporated risk factors defining two types of weaving movements (Types A and B). In
Type A, a vehicle makes one lane change to reach the desired terminal and in Type B one of the
two weaving maneuvers could be accomplished without any lane change. The results indicated
that Type B had the highest crash frequency.
15
Table 1.1: Previous studies with freeway characteristics
References
Freeway
characteristics
Golob et
al., 2004
Pilko, et
al., 2007
Qi, et
al., 2007
Sarhan,
et al.,
2008
Chen, et
al., 2009
Chen, et
al., 2010
Fitzpatr
ick et
al., 2010
Ray et
al., 2011
Length of
segment × × ×
Acceleration
lane ×
Deceleration
lane ×
Number of
lanes × × ×
Traffic volume × × × × ×
Type of
weaving
segments
×
Speed limit × ×
Length of
deceleration
lane
×
Number of
lanes on exit
ramps
×
Left-side off-
ramp ×
Right-side off-
ramp ×
Horizontal
curvature ×
Interchange
spacing × ×
Shoulder width ×
Lane change
geometry ×
Review of literature indicated that some of the studies consider just a few freeway
characteristics. For instance, Qi (2007) considered horizontal curve, length of roadway section
and number of through lanes. Chang (2005) used the number of lanes, lane width, horizontal
curvature, and vertical grades. Sarhan (2008) included length of segment, lengths of acceleration
and deceleration lanes, number of lanes, and weaving section types. In this study, more freeway
characteristics are considered to evaluate geometric elements of the freeways leading to crash
occurrence and provide appropriate recommendations. Two types of segments are considered in
16
this study: EN-EX, and EX-EN. In every segment six models are develop to explain the two
types of crashes: crash rate and severity crashes.
1.2 Statement of the problem
A freeway is considered as a major highway infrastructure designed to achieve high mobility and
transitioning on and off urban streets through ramps. Currently, high frequency of crashes
occurred on the freeway systems in Las Vegas, Nevada caused by more traffic weaving
movements as a result of increased traffic. This is attributed to traffic flows competing at the
limited spaces of the weaving sections on freeways. Drivers using these systems require more
spaces available for appropriate decision making to avoid crashes. In the event that spaces
between segment terminals is not sufficient, the likelihood of crash occurrence increases because
drivers do not have time to observe and make decisions of avoiding crashes.
So far, models that were developed to quantify safety issues of geometric risk factors have
evaluated EN-EX segment types (Liu et al., 2010; Golob et al., 2004; Sarhan et al., 2008). Little
attention is given to detailed investigation of the effect of freeway geometric elements to crash
rate and severity for EX-EN segment types. This proposed study will identify geometric design
issues on freeway systems in Las Vegas, Nevada, based on available safety data for EN-EX and
EX-EN segment types.
1.3 Research hypothesis
This study assumes that safety problems on freeway systems can be appropriately investigated
by focusing on freeway segments between ramps. These segments are taken to be those located
between the entry and exit to the terminals. Investigating geometrical elements on these
segments will help understand the likely cause of crashes on freeways. One of the geometric
elements assumed to cause crashes is the short length of segments defined by the space between
entry and exit terminals. If the length on these segments is sufficient to allow drivers to observe
and make decisions to avoid safety hazards, the likelihood of crash frequency occurring on the
systems will be minimized.
17
Because of short lengths within these segments, it is further assumed that there are safety
problems caused by vehicular traffic crossing each other for the purpose of either avoiding
weaving vehicles or entering or exiting the facility. Segments involved in weaving movements
are assumed to have geometric components which influence how movements are taking place
and are likely to cause safety problems experienced within these segments. The geometrical
configurations of entry to and exit from the main facility are likely to result in safety issues.
Freeway segments which have auxiliary lanes to allow drivers to plan ahead and make decision
to enter the facility are assumed to have better safety performance compared to those segments
which do not have auxiliary lanes. Finally, it is also assumed that there is insufficient number of
lanes to accommodate growing number of traffic on freeways and such a condition may likely
cause crashes.
1.4 Objectives
Since safety issues are associated with geometric elements of freeway systems, the aim of the
study was to investigate geometric design leading to safety problems. This was done by
calibrating regression models to identify the geometric design factors that influence safety in the
freeway systems in Las Vegas, Nevada. Different sets of regression models were developed for
EN-EX and EX-EN segments. The developed models (crash rate models and crash severity
models) were compared to identify the geometric problems. Solutions to mitigate the geometric
design problems were proposed.
1.5 Organization of the report
There are six chapters included in this study. Problem statement, research hypothesis, study
objectives and benefits are explained in Chapter 1. Chapter 2 reviews previous research activities
specifically conducted on freeway systems including safety performance modeling approaches.
Chapter 3 discusses study methodology where crash rate and severity model specifications are
detailed. Data collection is described in Chapter 4. Chapter 5 discusses calibrated models and
results of analysis. The solutions to mitigate the geometric design problems were presented in
Chapter 6. Conclusions and recommendations are given in Chapter 7.

18
CHAPTER 2 LITERATURE REVIEW
This section reviews these characteristics with the main focus placed on safety performance of
freeway geometric elements and statistical safety modeling approaches used in safety studies.
The review is anticipated to provide a base in identifying safety problems specifically related to
freeway systems, development of safety performance functions and recommends
countermeasures to solve the identified problems.
Sarhan et al. (2008) conducted a study to evaluate the safety performance of freeways as
influenced by the characteristics of speed-change lanes at the entrance and exit areas. Using data
collected from 26 interchanges along highway 417 within the City of Ottawa, Ontario, Canada,
the research group investigated the effects on collision frequencies occurred on the segments and
on speed-change lanes of freeway geometric and operation features. Freeway geometric features
included lengths of segments, acceleration and deceleration lanes as limited or extended lanes,
number of lanes on the main facility, number of lanes of the two ramps bounding each segments
and the type of weaving segments. Traffic volumes for main facility and at the entrance and exit
ramps were also included. Using negative binomial modeling approach, the results indicated that
increasing the lengths of both acceleration and deceleration lanes reduce crash frequencies as
more time is available to motorists for correct decisions on merging and diverging tasks.
Reduction in crash frequency was also true at locations where limited length of speed-change
lanes was used compared to extended length. This implies that extended lanes are likely to be
used as both acceleration and deceleration lanes which may increase the collision. It is also true
that unfamiliar drivers may have impression that the number of lanes spans to both terminals, a
situation which may subject them to risk factors.
They further investigated the effect on collision frequencies resulting from the type of weaving
movements experienced on the weaving segments. Weaving movements were classified as Type
A, where each weaving vehicle makes one lane change for successful completion of maneuver
and Type B in which one of the two weaving maneuvers could be accomplished without making
any lane change while a maximum of one lane-change is required by the other weaving vehicle.
Modeling results indicated that weaving type A was safer compared to weaving type B.
19
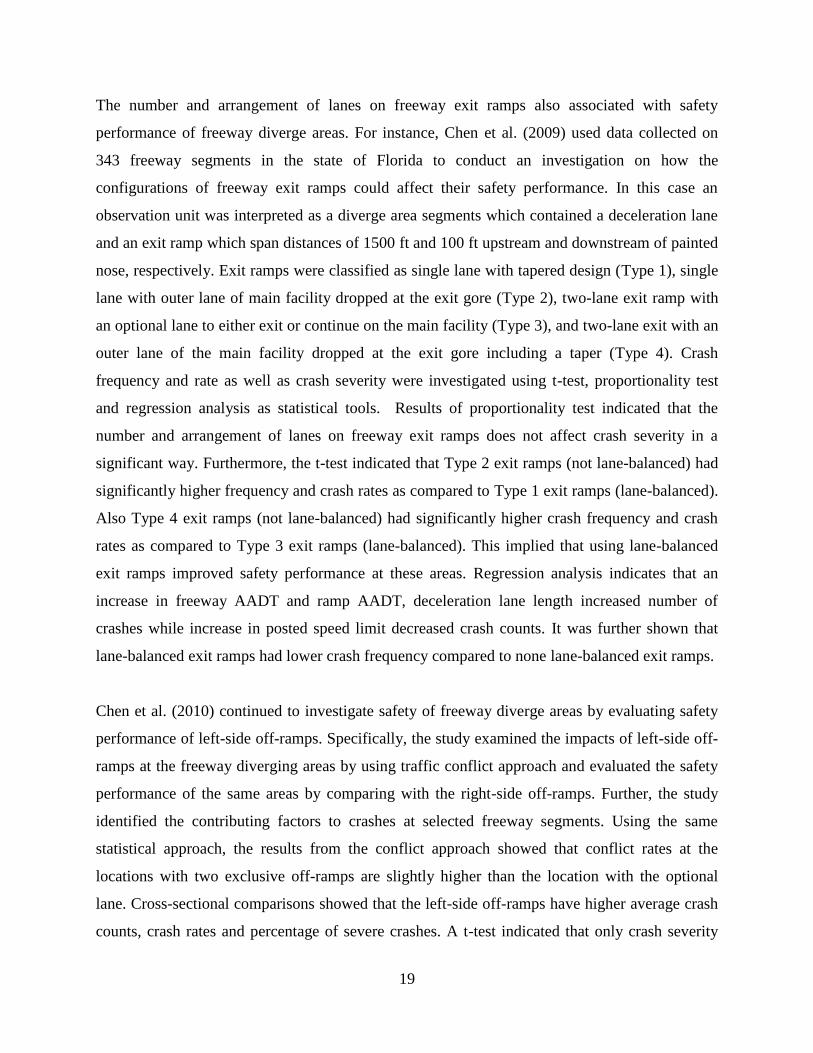
The number and arrangement of lanes on freeway exit ramps also associated with safety
performance of freeway diverge areas. For instance, Chen et al. (2009) used data collected on
343 freeway segments in the state of Florida to conduct an investigation on how the
configurations of freeway exit ramps could affect their safety performance. In this case an
observation unit was interpreted as a diverge area segments which contained a deceleration lane
and an exit ramp which span distances of 1500 ft and 100 ft upstream and downstream of painted
nose, respectively. Exit ramps were classified as single lane with tapered design (Type 1), single
lane with outer lane of main facility dropped at the exit gore (Type 2), two-lane exit ramp with
an optional lane to either exit or continue on the main facility (Type 3), and two-lane exit with an
outer lane of the main facility dropped at the exit gore including a taper (Type 4). Crash
frequency and rate as well as crash severity were investigated using t-test, proportionality test
and regression analysis as statistical tools. Results of proportionality test indicated that the
number and arrangement of lanes on freeway exit ramps does not affect crash severity in a
significant way. Furthermore, the t-test indicated that Type 2 exit ramps (not lane-balanced) had
significantly higher frequency and crash rates as compared to Type 1 exit ramps (lane-balanced).
Also Type 4 exit ramps (not lane-balanced) had significantly higher crash frequency and crash
rates as compared to Type 3 exit ramps (lane-balanced). This implied that using lane-balanced
exit ramps improved safety performance at these areas. Regression analysis indicates that an
increase in freeway AADT and ramp AADT, deceleration lane length increased number of
crashes while increase in posted speed limit decreased crash counts. It was further shown that
lane-balanced exit ramps had lower crash frequency compared to none lane-balanced exit ramps.
Chen et al. (2010) continued to investigate safety of freeway diverge areas by evaluating safety
performance of left-side off-ramps. Specifically, the study examined the impacts of left-side off-
ramps at the freeway diverging areas by using traffic conflict approach and evaluated the safety
performance of the same areas by comparing with the right-side off-ramps. Further, the study
identified the contributing factors to crashes at selected freeway segments. Using the same
statistical approach, the results from the conflict approach showed that conflict rates at the
locations with two exclusive off-ramps are slightly higher than the location with the optional
lane. Cross-sectional comparisons showed that the left-side off-ramps have higher average crash
counts, crash rates and percentage of severe crashes. A t-test indicated that only crash severity
20
for left side exit ramps is significantly different with the right side diverge areas at selected
freeway segments. A crash prediction model indicated that increasing freeway AADT, ramp
AADT and length of deceleration lane would increase crash counts while increasing ramp length
would reduce the potential crash counts for both left-side and right-side diverge areas.
Gore area is another location in freeway systems known to affect safety and operational
performance of freeways especially when a driver is in its vicinity. It is described as a triangular
piece of land found where roads merge or split and they are intended to help organize and protect
traffic when cars are entering or exiting highway (Wikipedia 2013). When a driver approaches
these areas, a large amount of directional information must be processed for a short period of
time to avoid unpredictable maneuvers resulting from driver indecisiveness (FHWA-RD-97-095
1997). Lunenfeld (1993) showed that drivers increase the chance of making errors when they are
to maneuver in the vicinity of the gore areas. Hakkert et al. (1998) showed that the use of bollard
devices help to reduce erratic vehicle maneuvers at highway exits by 60% in daytime and up to
65% at night time.
Qi, et al. (2007) further conducted an investigation on geometric variables that were mainly
located at the main facility. These included horizontal curvature, number of lanes, and length of
roadway section. The study also included traffic flow defined as the hourly volume per lane and
weather characteristics variables. Using data collected from Hampton roads, southeast Virginia,
random effects ordered probit models were developed. Their results indicated that crash rates are
very high at low levels of congestion, and decreases rapidly with increasing V/C ratio which then
gradually increase at peak levels of congestion. The number of lanes was found significant. In
the case of horizontal curve, the percentage of horizontal curve in a road section will affect the
traffic accident likelihood with respect to unfamiliar drivers.
Chang (2005) considered numbers of lanes, lane width, horizontal curvature, vertical grade and
AADT in their study. They developed Negative binomial and artificial neural network models,
which indicated that an increase in the number of lanes increases accident likelihood because the
total amount of lane changing as well as conflicts between traffic will increase. Freeway sections
with grade equal to 3% or greater were found to increase the accident likelihood when compared

21
to level sections. The results of horizontal curve showed that there is a reduction in accident
likelihood with degree of curvature greater than six degrees. It was further revealed that the more
closely interchanges are located, the more crash frequency is experienced. Lastly it was also
indicated that as AADT increases, crash frequency is more likely to occur.
O'Cinneide (1998) is a study that reviewed the literature from different countries that dealt with
the impacts of geometric design on roadway safety. The review included all types of roads and
different geometric features. For example, it reviewed the study that investigated the impact of
passing lane on two or three lane roads. It also reviewed the study on the impact of the number of
lane on safety on two lane highways. It indicates that significant difference would result from
modification of road alignments.
Realizing the tradeoff between access and safety by building an interchange between two
interchanges, Pilko et al. (2007) investigated the characteristics of freeway segment, interchange
to interchange, that influence safety. The characteristics considered in this study include
interchange spacing, shoulder widths and number of lanes in the freeway segment. Measures for
safety are total crashes and fatal and injury crashes happened in a freeway segment. The data for
these characteristics and safety were collected from the states of California and Washington.
Linear regression models were developed to correlate the safety and the characteristics of
freeway segments. Sensitivity of the model was analyzed, and it was found that their models
show a high sensitivity to freeway length and ramp AADT when predicting fatal and injury
crashes.
The study in Park et al. (2009) focuses on the freeway segments that have curve and ramps. The
freeway segments were not defined from interchange to interchange, or from ramp to ramp. They
were selected only for those that have a curve with tangent before and after the curve. There may
be ramps on some of the identified curves. These curves were on either rural or urban freeways.
The geometric features identified for each curve includes number of lanes, median type, and
density of ramps. The measure for safety is crash frequency. Negative binomial regress models
were developed to relate the safety and the geometric features.

22
Golob et al. (2004) conducted a study on the safety implication of weaving sections on freeways.
In their study, weaving sections were categorized into three types. Type A are weaving section
where every merging or diverging vehicles must execute one lane change, Type B are those
merging or diverging can be done without changing lanes, and Type C are those where one
maneuver requires at least two lane changes. They used the data from Southern California. A
multivariate Probit model was developed that relates the type of weaving section where an
accident occurred and the characteristics of accident, the features of weaving section type, and
traffic flow. It was found that there was no difference among these three types in terms of overall
accident rates. However, there were significant differences in terms of the types of accidents that
occur within these types in terms of severity, and location of the primary collision, the factors
causing the accident, and the time period in which the accident is most likely to occur. We
realized that Highway Capacity Manual has adopted a new categorization of weaving sections,
which will be used in this study.
Ray et al. (2011) developed guidelines for ramp and interchange spacing, with emphasis given to
ramp spacing. Safety is measured by number of crashes, crash types, and severity. Based on
previous research, this study discusses the relationship between ramp spacing for the following
three ramp combinations: EN-EX, EX-EN and EN-EN. Equations like Equation (1) to calculate
crash frequency are provided for the ramp spacing combinations EN-EX and EN-EN.
𝑇𝑜𝑡𝑎𝑙 = 9.7 ∗ 10−6𝐿1.0(𝐷𝐴𝐷𝑇)1.12(𝐴𝐷𝑇𝐸𝑁)0.18(𝐴𝐷𝑇𝐸𝑁)
0.02𝑒𝑥𝑝 (450
𝑠− 0.23 ∗ 𝐴𝑢𝑥𝐿𝑛) (1)
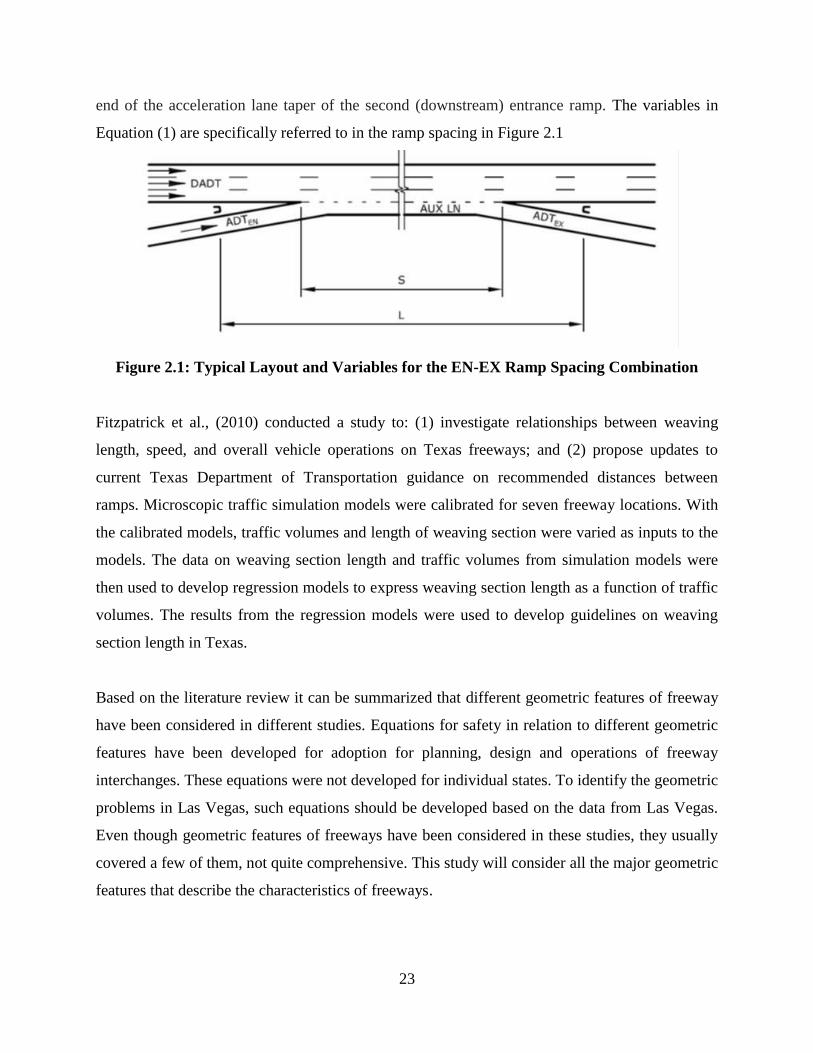
“L” is segment length (in miles) defined from the physical gore of the first (upstream) entrance
ramp to the end of the acceleration lane taper of the second (downstream) entrance ramp; “S” is
ramp spacing (in feet) defined from the painted tip of the first entrance ramp to the painted tip of
the second entrance ramp; “DADT” is the average daily traffic (in vehicles per day) on the
freeway mainline upstream of the first entrance gore in the analysis direction; “(ADTEN)” – the
first term is the average daily entering traffic (in vehicles per day) from the first entrance ramp;
“(ADTEN)” – the second term is the average daily entering traffic (in vehicles per day) from the
second entrance ramp; and “Total” is the number of crashes (of all types and severities) (crashes
per year) expected to occur between the physical gore of the first (upstream) entrance ramp to the
23
end of the acceleration lane taper of the second (downstream) entrance ramp. The variables in
Equation (1) are specifically referred to in the ramp spacing in Figure 2.1
Figure 2.1: Typical Layout and Variables for the EN-EX Ramp Spacing Combination
Fitzpatrick et al., (2010) conducted a study to: (1) investigate relationships between weaving
length, speed, and overall vehicle operations on Texas freeways; and (2) propose updates to
current Texas Department of Transportation guidance on recommended distances between
ramps. Microscopic traffic simulation models were calibrated for seven freeway locations. With
the calibrated models, traffic volumes and length of weaving section were varied as inputs to the
models. The data on weaving section length and traffic volumes from simulation models were
then used to develop regression models to express weaving section length as a function of traffic
volumes. The results from the regression models were used to develop guidelines on weaving
section length in Texas.
Based on the literature review it can be summarized that different geometric features of freeway
have been considered in different studies. Equations for safety in relation to different geometric
features have been developed for adoption for planning, design and operations of freeway
interchanges. These equations were not developed for individual states. To identify the geometric
problems in Las Vegas, such equations should be developed based on the data from Las Vegas.
Even though geometric features of freeways have been considered in these studies, they usually
covered a few of them, not quite comprehensive. This study will consider all the major geometric
features that describe the characteristics of freeways.

24
CHAPTER THREE METHODOLOGY
In this study, the geometric design issues on freeways in Las Vegas were investigated by
following this process: literature review, methodology development, data collection, and data
analysis. In literature review, the relevant studies conducted in the past were obtained from
different sources and compiled with the identification of their study objectives, methods
employed and the findings. The gap in identifying geometric design issues in the past was then
revealed. Given the inputs from literature review, the methods to identify the geometric design
needs are determined. The needed safety, geometric, operation and traffic data are then collected.
These data were screened for quality control. They were analyzed based on descriptive statistics
and used to develop crash rate and severity models. The results of the models were interpreted
from which the geometric design needs of freeway were identified. To identify the specific
segments that have geometric design problem, highway design experts in Las Vegas, Nevada
were consulted, and their inputs, with the results from the regression models, were compiled.
This process is presented in Figure 3.1.

25
Figure 3.1: Research methodology
Literature Review
Modeling method
Development
Data collection
Crash rate model
calibration
Crash severity
model calibration
Model
Interpretation
Model
Interpretation
Identification of Geometric Design
Needs
26
In this study, data for four segment types were collected: EN-EN, EX-EX, EN-EX, and EX-EN.
Crash data include crash rate and crash severity. . Freeway characteristics data included length of
segment, median and shoulder widths, number of through lanes, curve radius, grades, auxiliary
lanes, number of lanes involved in weaving movements, AADT, and number of lane changes
both from ramp-to-freeway and from freeway-to-ramp. Data analysis involves the quantitative
description of data collected and the actual modeling of the data to quantify the relationship
between freeway characteristics and crashes. Main features of data are described using
descriptive statistics using graphs and summary statistics. To quantify the effects of freeway
characteristics on crashes, statistical models are used. The following sections explain the
statistical theory of the models for the type of crashes obtained.
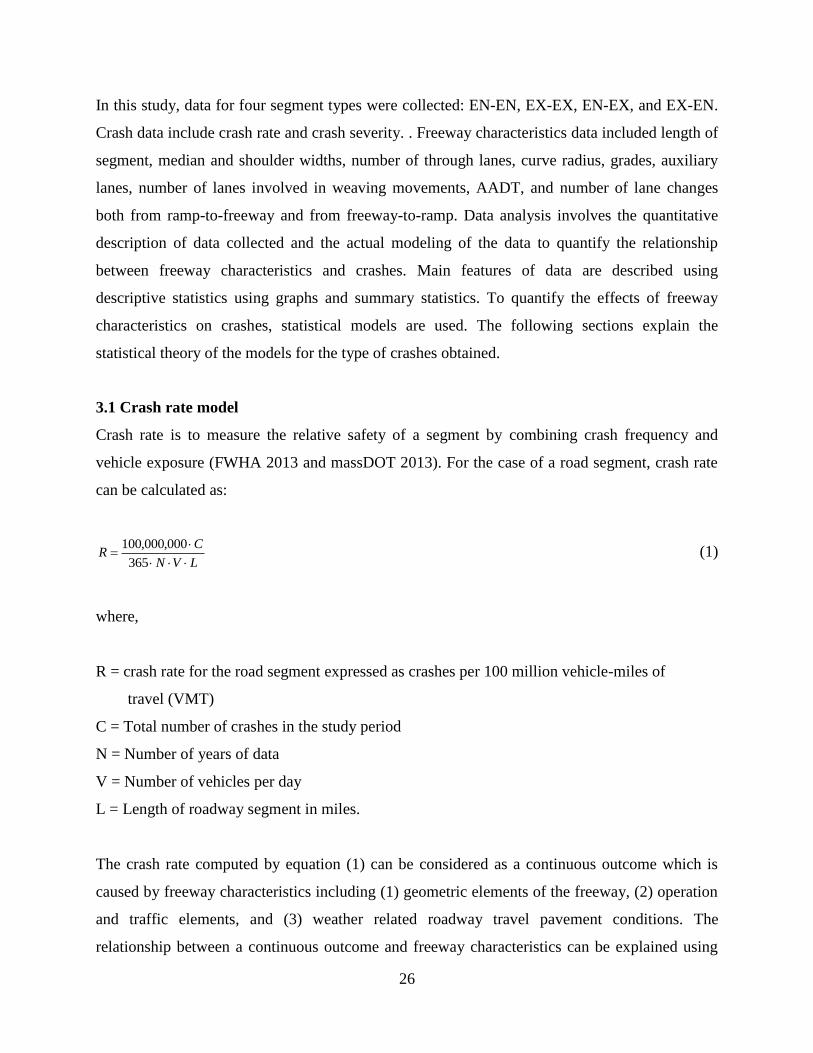
3.1 Crash rate model
Crash rate is to measure the relative safety of a segment by combining crash frequency and
vehicle exposure (FWHA 2013 and massDOT 2013). For the case of a road segment, crash rate
can be calculated as:
LVN
CR
365
000,000,100 (1)
where,
R = crash rate for the road segment expressed as crashes per 100 million vehicle-miles of
travel (VMT)
C = Total number of crashes in the study period
N = Number of years of data
V = Number of vehicles per day
L = Length of roadway segment in miles.
The crash rate computed by equation (1) can be considered as a continuous outcome which is
caused by freeway characteristics including (1) geometric elements of the freeway, (2) operation
and traffic elements, and (3) weather related roadway travel pavement conditions. The
relationship between a continuous outcome and freeway characteristics can be explained using

27
multiple linear regression technique. Data are modeled using a linear function of freeway
characteristics, whose values are used to predict the crash rate. The basic form of a linear
function, 𝑦𝑖 for data point 𝑦𝑖, and 𝑝 freeway characteristics is given as:
𝑦𝑖 = 𝛽0 + 𝛽1𝑥𝑖1 +⋯………… . . + 𝛽𝑝𝑥𝑖𝑝 + 𝜀𝑖 (2)
where, 𝛽0………… . . , 𝛽𝑝 are the unknown partial regression coefficients which indicate the
relative effect of a particular freeway characteristic on the crash rate. 𝑦𝑖 is the crash rate; 𝑥𝑖 are
freeway characteristics; 𝜀𝑖 is the error term which captures all other factors which influence the
crash rate, other than the freeway characteristics in the model and it is assumed to be normally
distributed.
The partial regression coefficients in equation (2) are estimated using ordinary least squares
technique. The goodness of fit of the fitted regression model can be measured by using the
sample coefficient of determination which gives the proportional or percentage of the total
variation in the crash rate explained jointly by the freeway characteristics and it is given as:
𝑅2 = 𝑆𝑆𝑇−𝑆𝑆𝐸
𝑆𝑆𝑇 (3)
where, SST is the total sum of squares given as:
𝑆𝑆𝑇 = ∑ (𝑦𝑖 − �̅�)2𝑛
𝑖 (4)
SSE is the error sum of squares given as:
𝑆𝑆𝐸 = ∑ (𝑦𝑖 − 𝑦𝑖)̂2𝑛
𝑖=1 (5)
The overall significant of the regression can be tested based on the assumption that none of the
freeway characteristics has any linear relationship with the crash rate and it uses an F-statistic
given as:
28
𝐹 = 𝑅2/𝑝
(1−𝑅2)/(𝑛−𝑃−1) (6)
where,
𝑅2 = the coefficient of determination given by equation (3)
𝑛 = number of observations, and
𝑝 = number of freeway characteristics in the model.
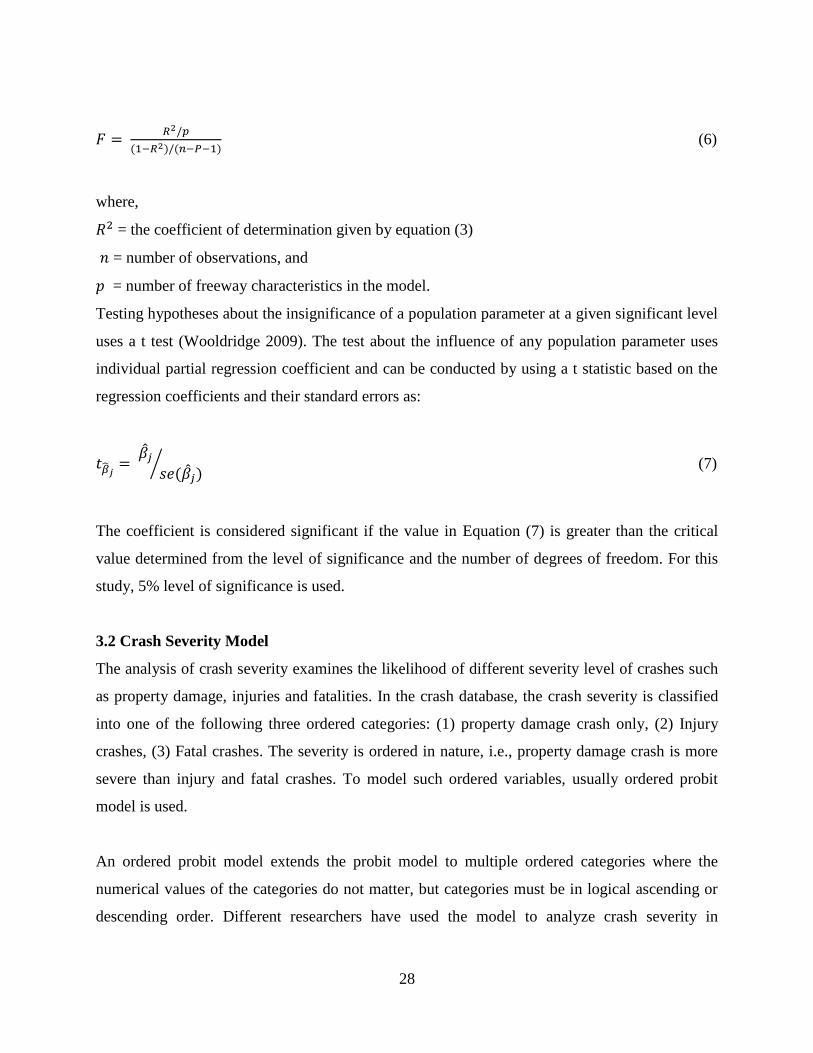
Testing hypotheses about the insignificance of a population parameter at a given significant level
uses a t test (Wooldridge 2009). The test about the influence of any population parameter uses
individual partial regression coefficient and can be conducted by using a t statistic based on the
regression coefficients and their standard errors as:
𝑡�̂�𝑗 = �̂�𝑗𝑠𝑒(�̂�𝑗)⁄ (7)
The coefficient is considered significant if the value in Equation (7) is greater than the critical
value determined from the level of significance and the number of degrees of freedom. For this
study, 5% level of significance is used.
3.2 Crash Severity Model
The analysis of crash severity examines the likelihood of different severity level of crashes such
as property damage, injuries and fatalities. In the crash database, the crash severity is classified
into one of the following three ordered categories: (1) property damage crash only, (2) Injury
crashes, (3) Fatal crashes. The severity is ordered in nature, i.e., property damage crash is more
severe than injury and fatal crashes. To model such ordered variables, usually ordered probit
model is used.
An ordered probit model extends the probit model to multiple ordered categories where the
numerical values of the categories do not matter, but categories must be in logical ascending or
descending order. Different researchers have used the model to analyze crash severity in
29
different areas of transportation and other fields (Gray et al. 2008, Zhu et al. 2011, Kockelman et
al. 2002, Dykin et al. 2002, Abdel-Aty 2003, Yamamoto et al. 2008, and Shimamura et al. 2005).
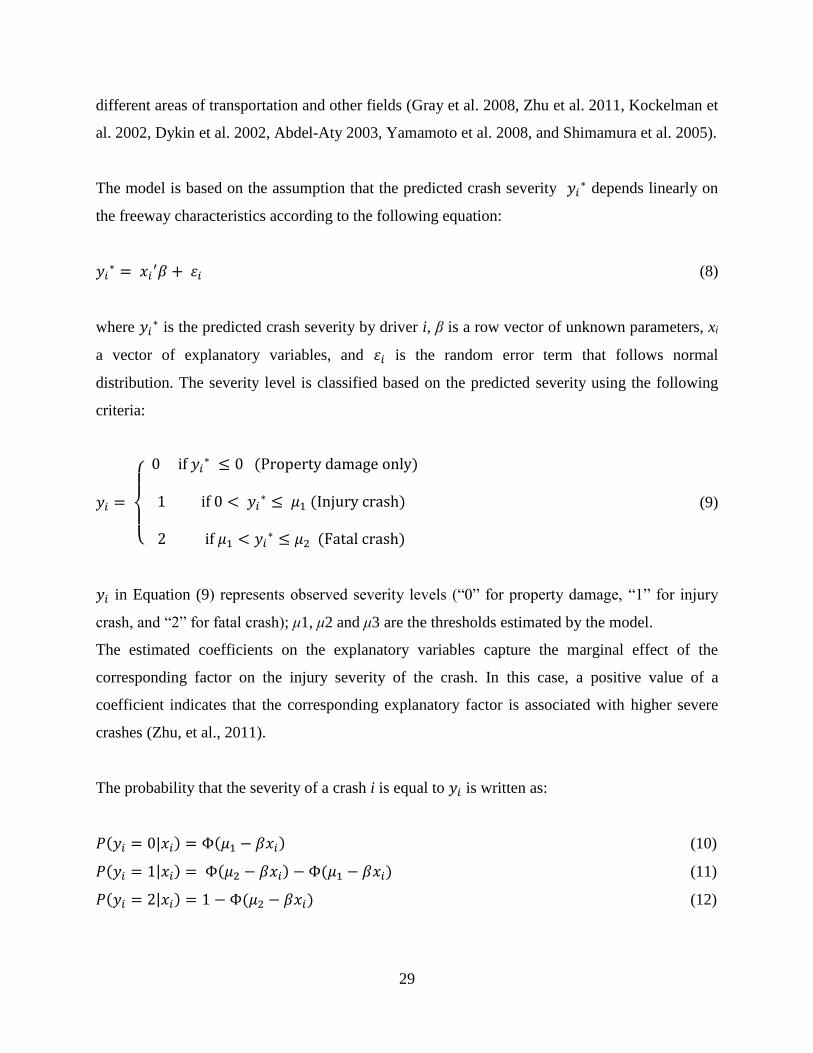
The model is based on the assumption that the predicted crash severity 𝑦𝑖∗ depends linearly on
the freeway characteristics according to the following equation:
𝑦𝑖∗ = 𝑥𝑖
′𝛽 + 𝜀𝑖 (8) (8)
where 𝑦𝑖∗ is the predicted crash severity by driver i, β is a row vector of unknown parameters, xi
a vector of explanatory variables, and 𝜀𝑖 is the random error term that follows normal
distribution. The severity level is classified based on the predicted severity using the following
criteria:
𝑦𝑖 =
{
0 if 𝑦𝑖
∗ ≤ 0 (Property damage only)
1 if 0 < 𝑦𝑖∗ ≤ 𝜇1 (Injury crash)
2 if 𝜇1 < 𝑦𝑖∗ ≤ 𝜇2 (Fatal crash)
(9)
𝑦𝑖 in Equation (9) represents observed severity levels (“0” for property damage, “1” for injury
crash, and “2” for fatal crash); μ1, μ2 and μ3 are the thresholds estimated by the model.
The estimated coefficients on the explanatory variables capture the marginal effect of the
corresponding factor on the injury severity of the crash. In this case, a positive value of a
coefficient indicates that the corresponding explanatory factor is associated with higher severe
crashes (Zhu, et al., 2011).
The probability that the severity of a crash i is equal to 𝑦𝑖 is written as:
𝑃(𝑦𝑖 = 0|𝑥𝑖) = Φ(𝜇1 − 𝛽𝑥𝑖) (10)
𝑃(𝑦𝑖 = 1|𝑥𝑖) = Φ(𝜇2 − 𝛽𝑥𝑖) − Φ(𝜇1 − 𝛽𝑥𝑖) (11)
𝑃(𝑦𝑖 = 2|𝑥𝑖) = 1 − Φ(𝜇2 − 𝛽𝑥𝑖) (12)
30
In Equations (10), (11), and (12), Φ(. ) is the standard normal cumulative distribution function.
The log-likelihood function of a crash being any severity is given as:
log𝐿 = ∑ ln [𝑃(𝑦𝑖)]𝑖 (13)
The coefficients 𝛽𝑗 are computed in such a way they maximize the log-likelihood function
indicated by Equation (13). The overall significance of the explanatory variables is tested by
comparing the restricted log-likelihood (𝐿𝑜𝑔 𝐿𝑅) to the maximized log-likelihood (𝐿𝑜𝑔 𝐿𝑈) to
produce the likelihood ratio test statistic given as:
𝐿𝑅 = −2(𝐿𝑜𝑔 𝐿𝑅) − 𝐿𝑜𝑔 𝐿𝑈) (14)
This statistic is distributed as 𝜒2 with degrees of freedom equal to the number of explanatory
variables. The test is based on the null hypothesis that none of the explanatory variables have an
effect.
For the analysis of data with ordered probit model, an equivalent statistic to 𝑅2 does not exist
because the model are maximum likelihood estimates arrived at through an iterative process
(UCLA 2013). In this study, the goodness-of-fit of the model is evaluated using McFadden’s
Pseudo statistic given as:
𝑃𝑠𝑒𝑢𝑑𝑜 − 𝑅2 = 1 −𝐿𝑜𝑔 𝐿𝑈
𝐿𝑜𝑔 𝐿𝑅 (15)
where 𝐿𝑜𝑔 𝐿𝑅 is the log-likelihood of the intercept model treated as a total sum of squares, and
𝐿𝑜𝑔 𝐿𝑈 is the log-likelihood of the model treated as the sum of squared errors. A small ratio of
the log-likelihoods indicates that the full model is as far better fit than the intercept model.
31
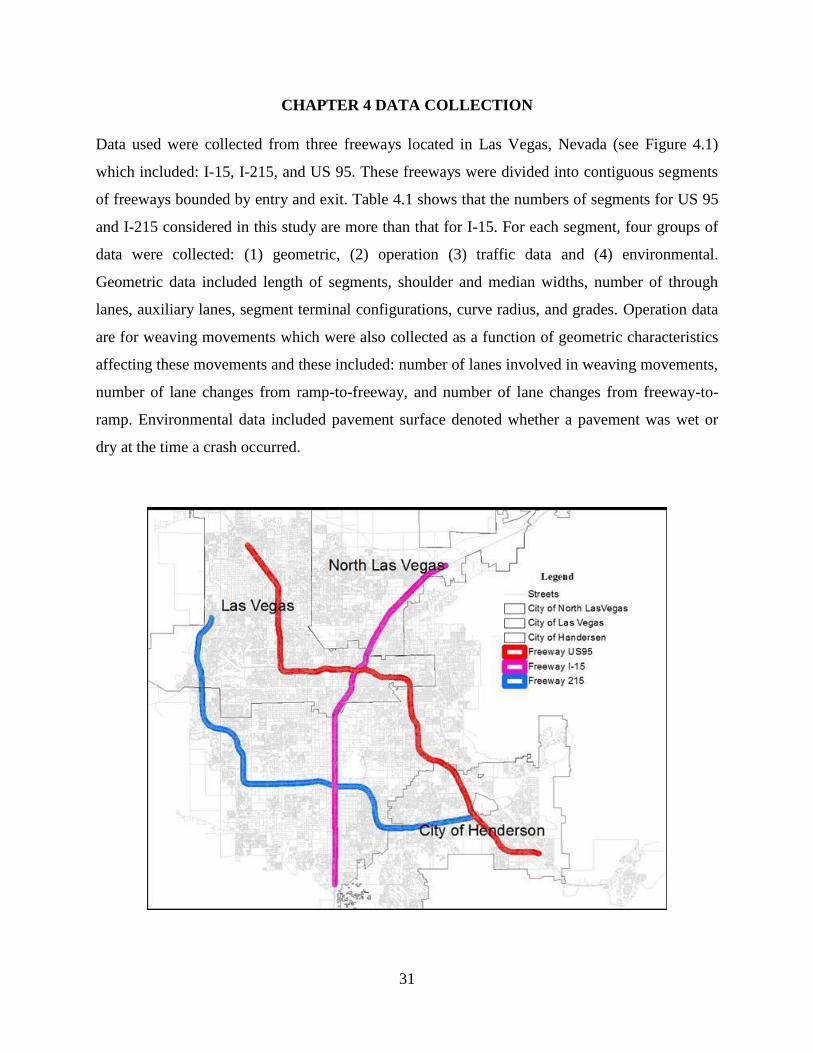
CHAPTER 4 DATA COLLECTION
Data used were collected from three freeways located in Las Vegas, Nevada (see Figure 4.1)
which included: I-15, I-215, and US 95. These freeways were divided into contiguous segments
of freeways bounded by entry and exit. Table 4.1 shows that the numbers of segments for US 95
and I-215 considered in this study are more than that for I-15. For each segment, four groups of
data were collected: (1) geometric, (2) operation (3) traffic data and (4) environmental.
Geometric data included length of segments, shoulder and median widths, number of through
lanes, auxiliary lanes, segment terminal configurations, curve radius, and grades. Operation data
are for weaving movements which were also collected as a function of geometric characteristics
affecting these movements and these included: number of lanes involved in weaving movements,
number of lane changes from ramp-to-freeway, and number of lane changes from freeway-to-
ramp. Environmental data included pavement surface denoted whether a pavement was wet or
dry at the time a crash occurred.
32
Figure 4.1: Study location
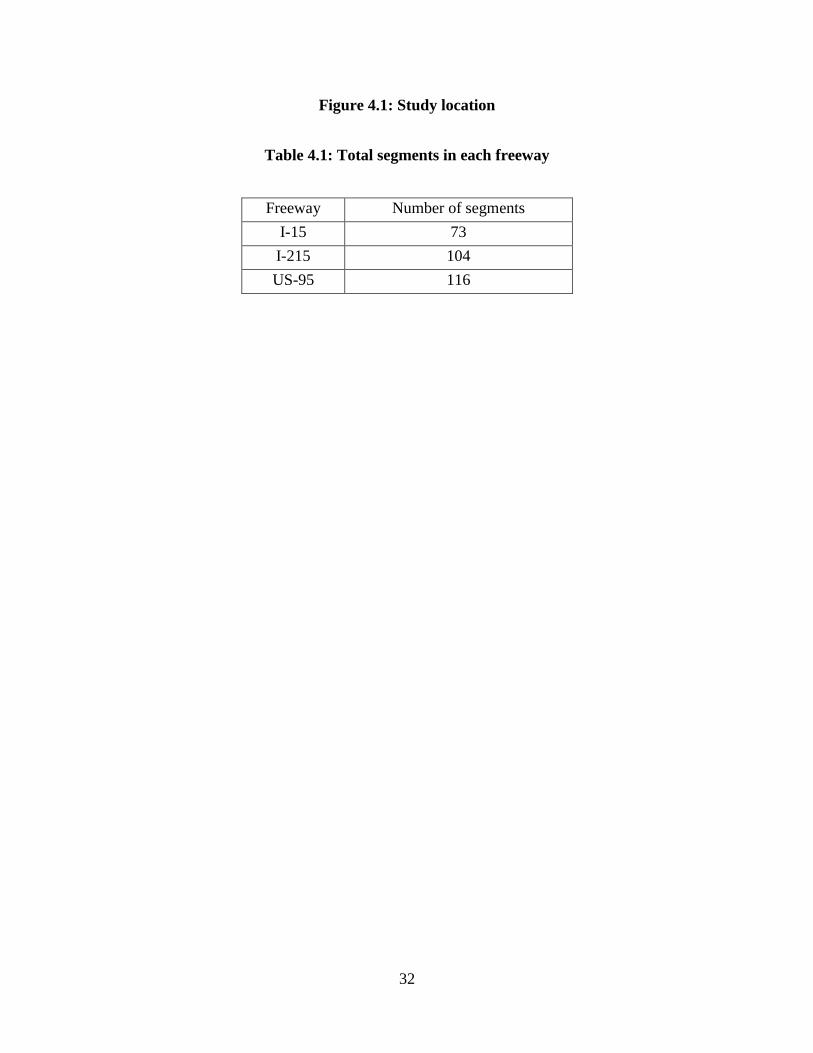
Table 4.1: Total segments in each freeway
Freeway Number of segments
I-15 73
I-215 104
US-95 116
33
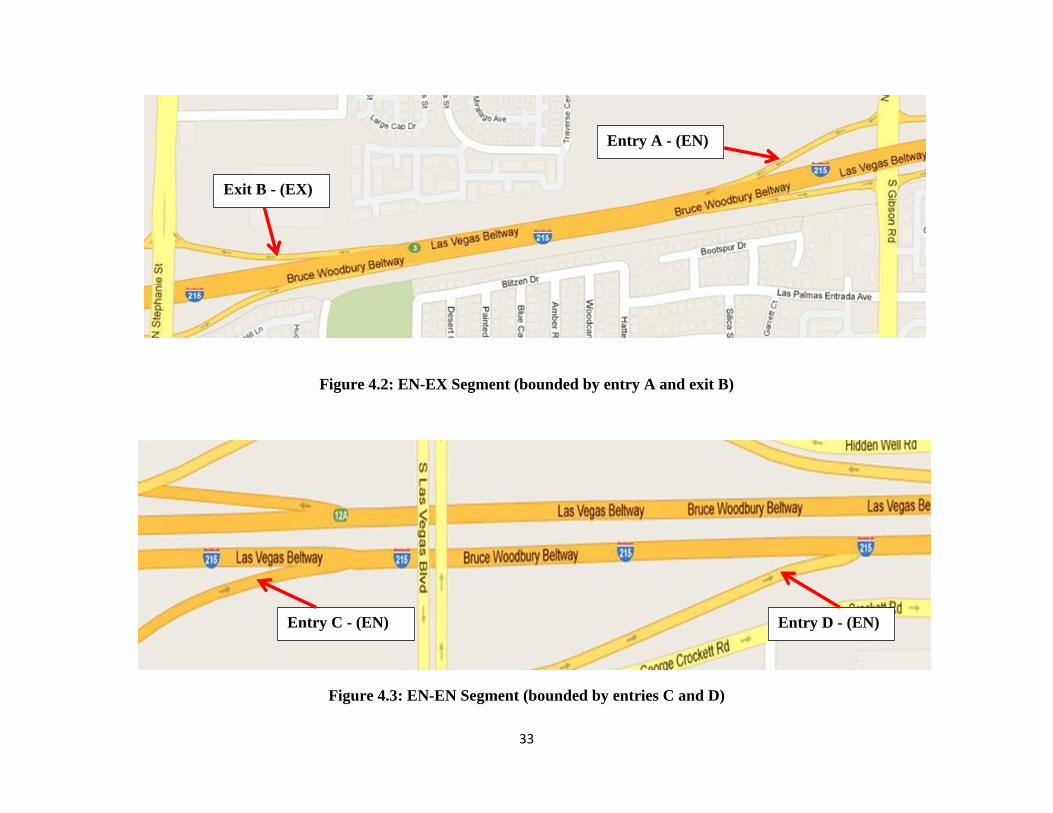
Figure 4.2: EN-EX Segment (bounded by entry A and exit B)
Figure 4.3: EN-EN Segment (bounded by entries C and D)
Entry A - (EN)
Exit B - (EX)
Entry C - (EN) Entry D - (EN)
34
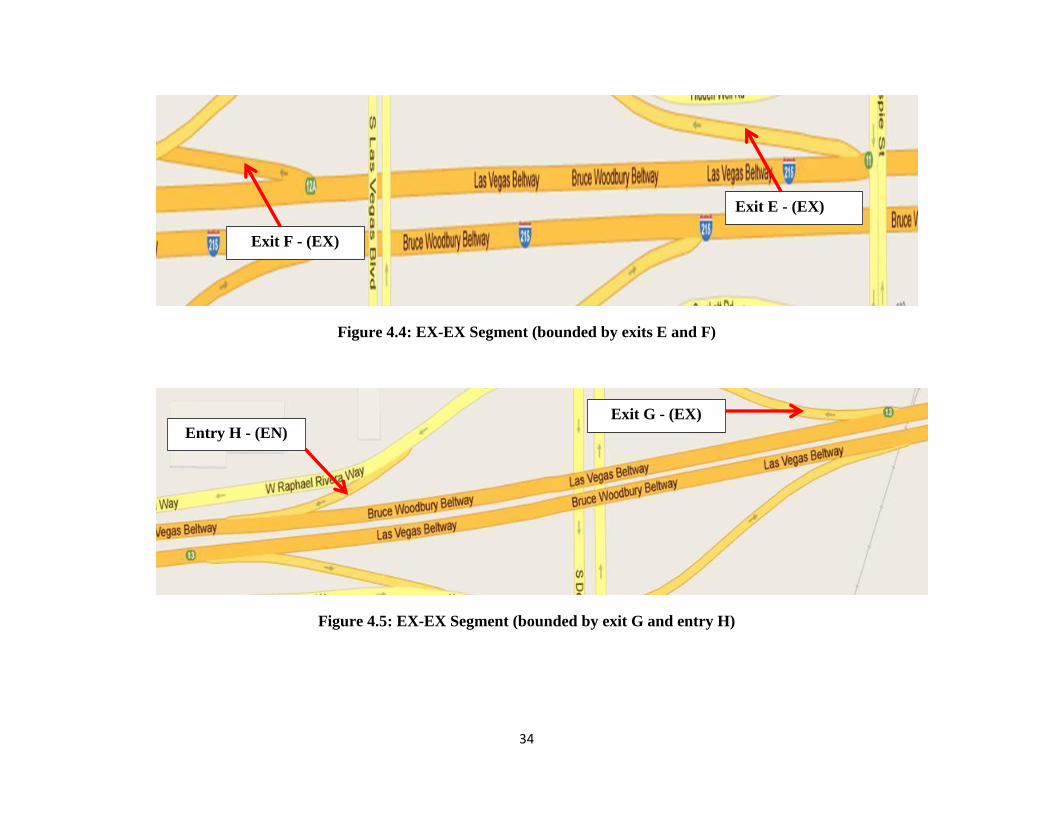
Figure 4.4: EX-EX Segment (bounded by exits E and F)
Figure 4.5: EX-EX Segment (bounded by exit G and entry H)
Exit F - (EX)
Exit E - (EX)
Entry H - (EN)
Exit G - (EX)
35
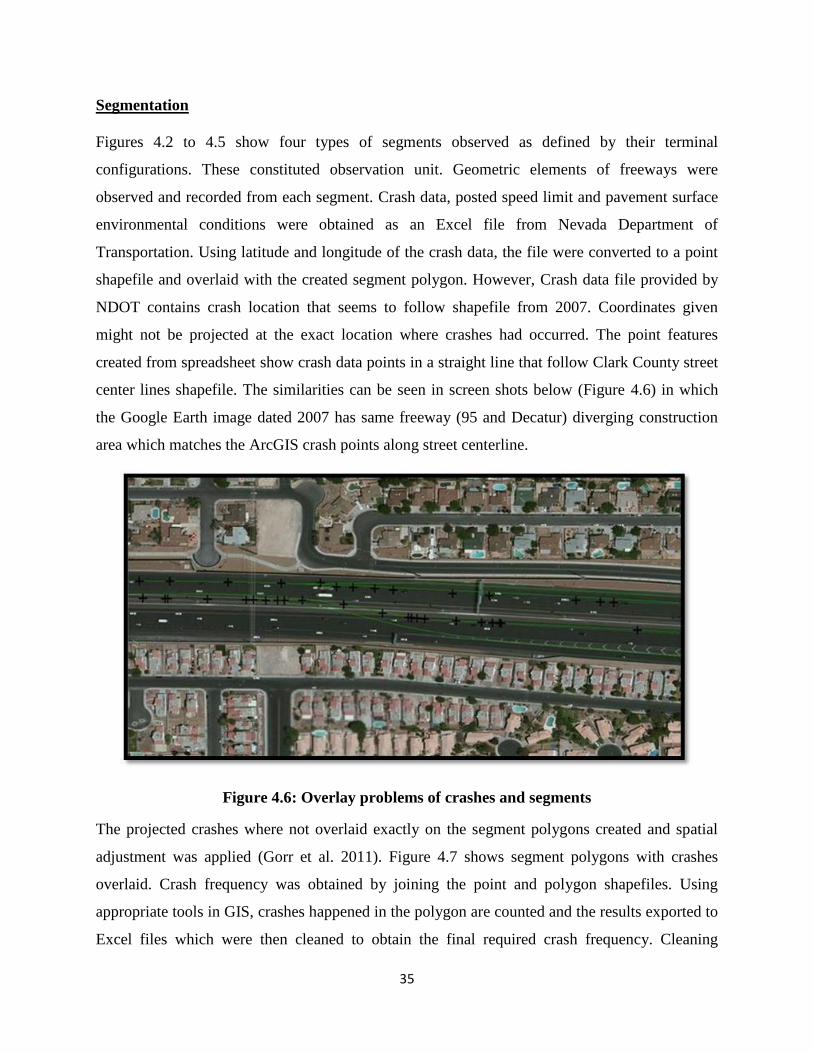
Segmentation
Figures 4.2 to 4.5 show four types of segments observed as defined by their terminal
configurations. These constituted observation unit. Geometric elements of freeways were
observed and recorded from each segment. Crash data, posted speed limit and pavement surface
environmental conditions were obtained as an Excel file from Nevada Department of
Transportation. Using latitude and longitude of the crash data, the file were converted to a point
shapefile and overlaid with the created segment polygon. However, Crash data file provided by
NDOT contains crash location that seems to follow shapefile from 2007. Coordinates given
might not be projected at the exact location where crashes had occurred. The point features
created from spreadsheet show crash data points in a straight line that follow Clark County street
center lines shapefile. The similarities can be seen in screen shots below (Figure 4.6) in which
the Google Earth image dated 2007 has same freeway (95 and Decatur) diverging construction
area which matches the ArcGIS crash points along street centerline.
Figure 4.6: Overlay problems of crashes and segments
The projected crashes where not overlaid exactly on the segment polygons created and spatial
adjustment was applied (Gorr et al. 2011). Figure 4.7 shows segment polygons with crashes
overlaid. Crash frequency was obtained by joining the point and polygon shapefiles. Using
appropriate tools in GIS, crashes happened in the polygon are counted and the results exported to
Excel files which were then cleaned to obtain the final required crash frequency. Cleaning

36
involved removing all variables created under the process of counting for instance crash number,
vehicle and street directions.
Crash severity data were also obtained by overlaying the crashes with polygon shapefiles.
Crashes falling in an individual segment were visualized and recorded in the same way as for the
frequency data, and the resulting data were exported to the Excel file for data cleaning. The data
exported to the Excel file include many data items. Not all the data items were needed in the
modeling process, for instance codes indicating street directions, driver actions, crash number,
and city towns. This information was removed as a process to clean the dataset. The speed limit
and travel way surface conditions were also extracted from the crash data file obtained from
Nevada Department of Transportation.
Figure 4.7: Crashes overlaid with digitized segments
Geometric data
Length of each segment was defined as the base length (𝐿𝐵) between its terminals as defined in
2010 Highway Capacity Manual and in Roess et al. ((2011) which is shown in Figure 4.8. The
width of each segment was taken as equal to the width of a freeway define by the number of
through lanes plus the inside median and outside shoulder widths (Figure 4.9). This helped

37
include all crashes occurred on the main facility, speed-change lanes, and those found on median
and shoulders.
Figure 4.8: Definition of length of segment (Source: HCM2010)
Figure 4.9: Sample segment digitized showing the measurements of segment width
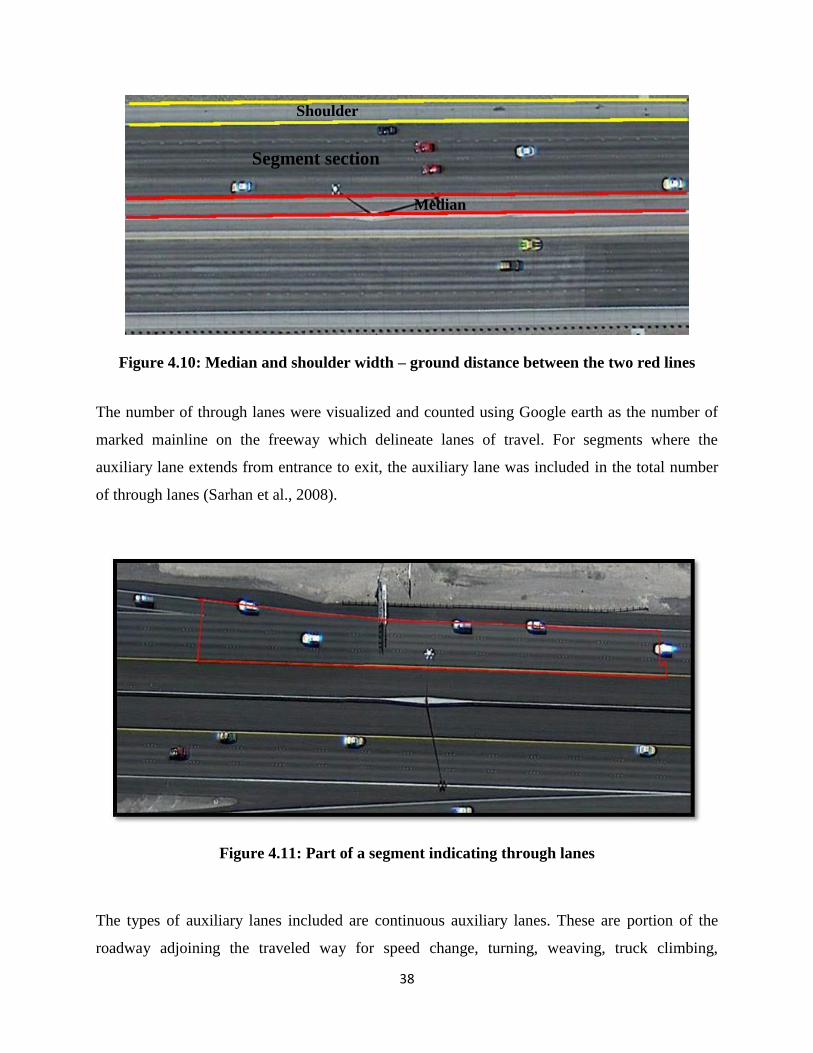
It is shown in Figure 4.10 that shoulder width was taken as the ground length measured from the
point where edges of the external lanes touch the shoulder to the point where it ends at pavement
edge. The median width was taken as the ground length from the point where the extreme inside
lane touches the median to the center of the median on each direction of the freeway. This width
included the inside shoulder. Both median and shoulders were measured using available tools in
the Google Earth Pro Imagery of 2010. Figure 4.10 illustrates the measurement of these
variables.
38
Figure 4.10: Median and shoulder width – ground distance between the two red lines
The number of through lanes were visualized and counted using Google earth as the number of
marked mainline on the freeway which delineate lanes of travel. For segments where the
auxiliary lane extends from entrance to exit, the auxiliary lane was included in the total number
of through lanes (Sarhan et al., 2008).
Figure 4.11: Part of a segment indicating through lanes
The types of auxiliary lanes included are continuous auxiliary lanes. These are portion of the
roadway adjoining the traveled way for speed change, turning, weaving, truck climbing,
Segment section
Shoulder
Median
39
maneuvering of entering and leaving traffic. Their purpose is to supplement through-traffic
movement and improve operational efficiency (AASHTO 2001)
Vertical and horizontal alignments are not reported in any database for the state of Nevada.
Grade for freeway segments was recorded from Google Earth pro using the average grade
technique (Roess 2011). This approach is acceptable for freeway segments containing composite
grades with segment lengths less than 4,000 feet and grades less than 5%. Freeway segment
elevations were recorded from Google Earth at the painted gore nose of each terminal on either
side of the segment. The difference of the two elevations was divide by the segment length
resulting in the calculated average grade and used as a variable in the modeling as the average
grade for that segment. Google Earth provides the ability to produce alignment grade by creating
a path in order to generate a profile. However, most freeway segments have multiple grade
changes which cause uncertainty with collecting either the maximum grade of the freeway
segment or to record the average. One study suggests the use of global positioning systems
(GPS) to collect roadway alignment (Awuah-Baffour et al. 1997). We did not take this GPS
approach because the fore mentioned study was not concerned with the use of the data but just
the accuracy of the data collection.
In this study, each curve observed on each segment from Google Earth was treated as a simple
curve, and the radii were determined using ArcGIS Curve Calculator under the COGO toolbar.
The arc length was measured in ArcGIS, along with the chord length. With those two
measurements, the freeway segment radii were determined with the use of the calculator. Some
segments shared the same curve radius due to curve length surpassing the designated
segmentation of painted gore to painted gore. When a segment contained more than one curve,
the shorter radius was taken having the most extreme effect on vehicle maneuvering. An
example can be seen in Figure 4.12. Such was the case for freeway segments containing part of
a curve and no curve for the reminder.

40
Figure 4.12: Reverse curve located on US 95 and Russell Rd interchange, curve with
smaller radius circled
More complicated curves such as spiral and combination curves, similar to the reverse curve
seen in Figure 4.12, could not be determined based on visual inspection. There are a few
methods exist for recording curve radius. According to one method, researchers suggest using
ArcGIS to dissolve polyline vertices into those segment vertices with drastic changes in order to
analyze less coordinates (Hans et al. 2012). Then the resulting coordinates are used to iterate
chord lengths which are then analyzed through regression. This method was proven to be the
most accurate but may be too time consuming. Thus it was not adopted for this study.
Operation data
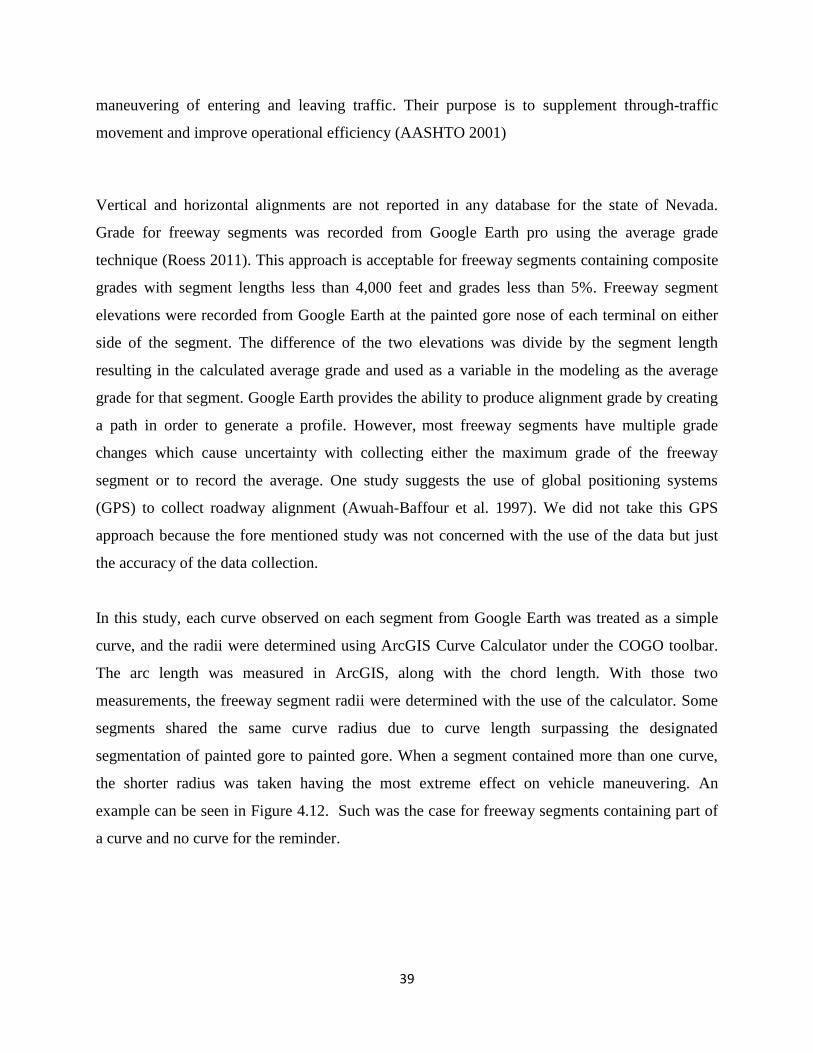
On EN-EX segments where merging movements are closely followed by diverging segments,
there is insufficient distance for merge and diverge segments to operate independently. This
situation necessitate traffic streams to cross each other because drivers entering and exiting the
facility need to locate themselves to their desired lanes for either continuing travel along the
facility or exiting the facility. Segments of the facility from which an additional weaving
movements are taking place by lane–changing activity are called weaving segments. These
segments have geometric components which influence how movements are taking place and are
likely to cause safety problems experienced within these segments. To present the traffic
situations on these segments, three data items were collected: lane change from ramp-to-freeway,

41
lane change from freeway-to-ramp, and number of lanes involved in weaving movements (see
Figures 4.13 and 4.14). These data items are defined in the 2010 Highway Capacity Manual.
From a segment like the one on Figure 4.13, it is assumed that every weaving vehicle enters the
segment in the lane closest to its desired exit and leaves the segment in the lane closest to its
entry. The number of lane change in Figure 4.13 is one. The second data item involved the
minimum number of lanes involved for successively completing the lane changes. Since a
vehicle moves from the auxiliary lane to the lane closest to the next exit terminal, only two lanes
are involved to successively complete the movement.
42
Figure 4.13: Weaving movement variables - lane change from ramp-to-freeway and weaving movement lanes
Figure 4.14: One-sided weaving segments (Source: HCM2010)
Width of main facility Auxiliary lane
43
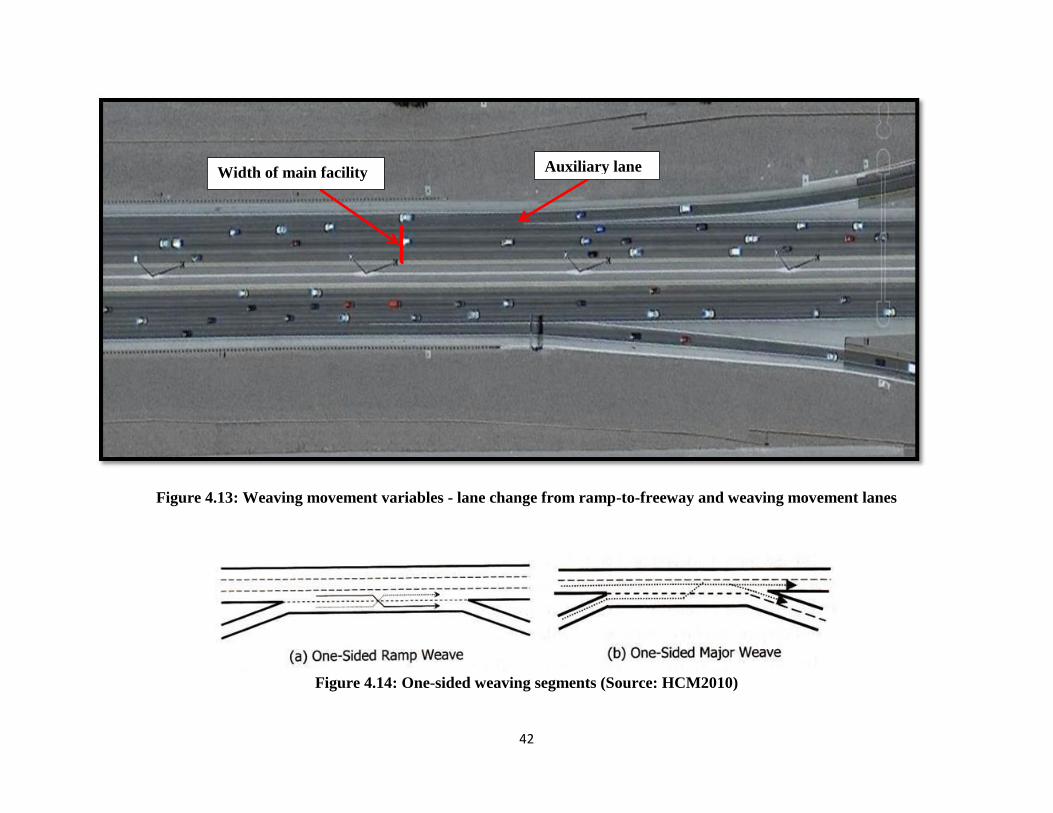
Traffic volume and speed limit data
Traffic and control data involved speed limit and average annual daily traffic data (AADT).
Average annual daily traffic data were provided by the Nevada Department of Transportation
(NDOT), given in their recent report for Clark County NDOT (2012). NDOT reported actual
vehicle counts and estimated values for 2010. Although counts were not provided for each
segment location, further evaluation for missing segment volumes was needed. For the segments
requiring additional analysis, a balanced approach was taken to determine traffic volumes for
each location using ramp volumes and nearby count locations provided. This approach is
demonstrated in Figure 4.15 where the sum of the given volumes 126,000 vehicles per day for
mainline flow is calculated with 15,000 and 12,000 for on-ramp and off-ramp, respectively. The
resulting AADT of 153,000 vehicles per was taken for the segment of US 95 south of Craig
Road.
Figure 4.15: Balanced approach example, calculated output value in red
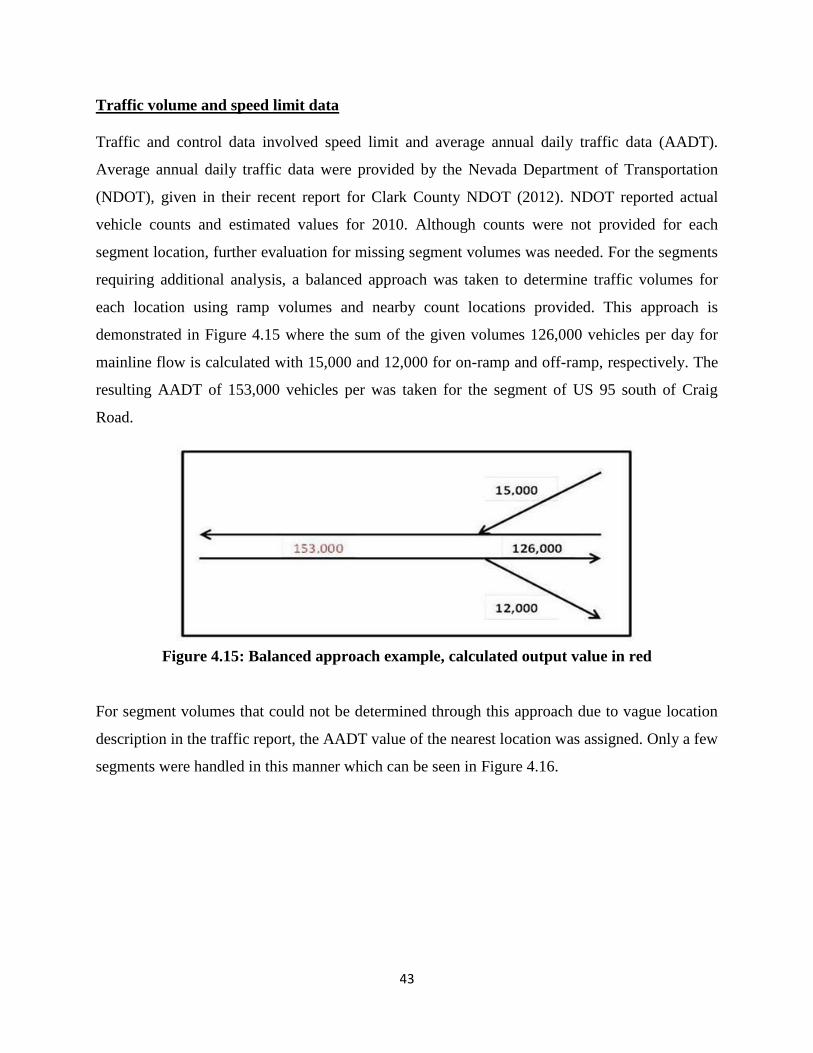
For segment volumes that could not be determined through this approach due to vague location
description in the traffic report, the AADT value of the nearest location was assigned. Only a few
segments were handled in this manner which can be seen in Figure 4.16.
44
Figure 4.16: Comparative map of given AADT locations calculated
45
CHAPTER 5 MODELING RESULTS
5.1 Descriptive statistics
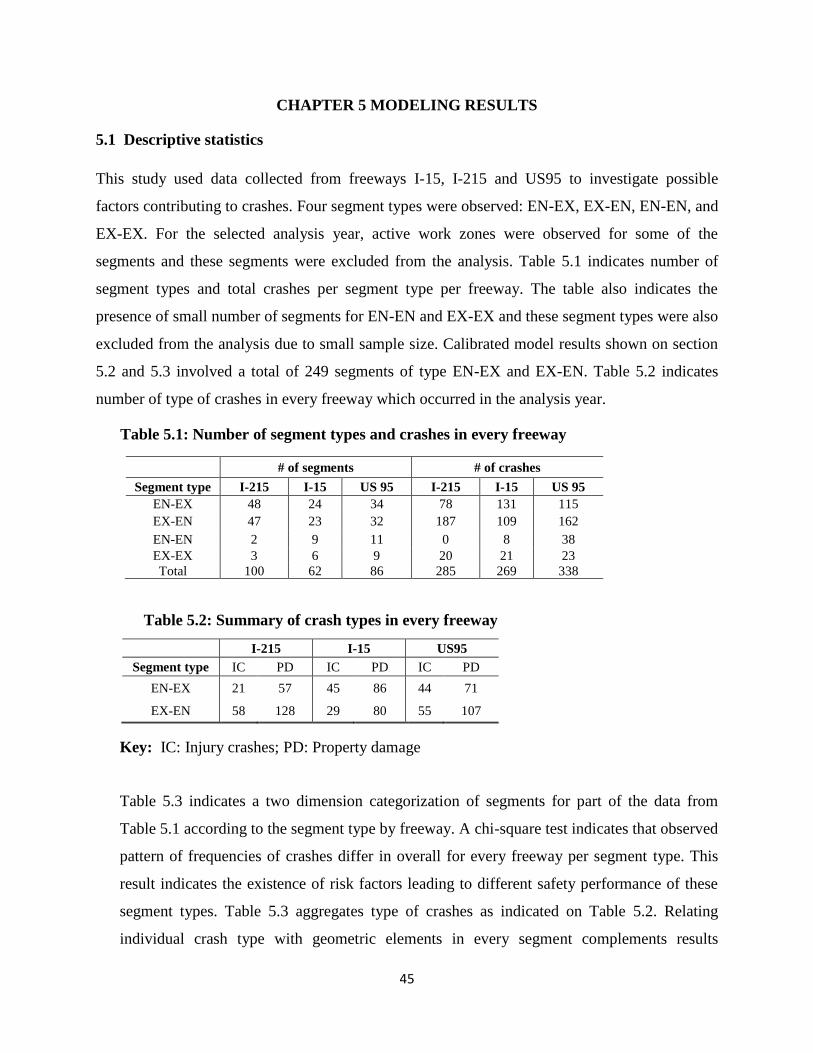
This study used data collected from freeways I-15, I-215 and US95 to investigate possible
factors contributing to crashes. Four segment types were observed: EN-EX, EX-EN, EN-EN, and
EX-EX. For the selected analysis year, active work zones were observed for some of the
segments and these segments were excluded from the analysis. Table 5.1 indicates number of
segment types and total crashes per segment type per freeway. The table also indicates the
presence of small number of segments for EN-EN and EX-EX and these segment types were also
excluded from the analysis due to small sample size. Calibrated model results shown on section
5.2 and 5.3 involved a total of 249 segments of type EN-EX and EX-EN. Table 5.2 indicates
number of type of crashes in every freeway which occurred in the analysis year.
Table 5.1: Number of segment types and crashes in every freeway
# of segments # of crashes
Segment type I-215 I-15 US 95 I-215 I-15 US 95
EN-EX 48 24 34 78 131 115
EX-EN 47 23 32 187 109 162
EN-EN 2 9 11 0 8 38
EX-EX 3 6 9 20 21 23
Total 100 62 86 285 269 338
Table 5.2: Summary of crash types in every freeway
Key: IC: Injury crashes; PD: Property damage
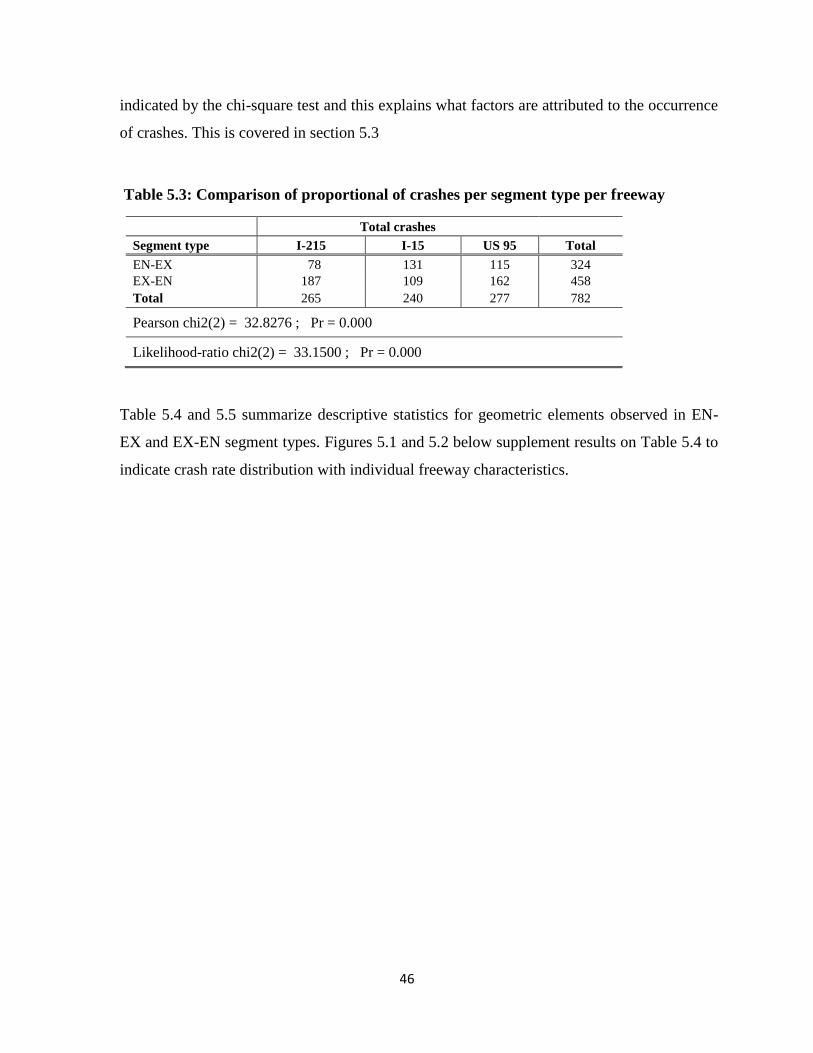
Table 5.3 indicates a two dimension categorization of segments for part of the data from
Table 5.1 according to the segment type by freeway. A chi-square test indicates that observed
pattern of frequencies of crashes differ in overall for every freeway per segment type. This
result indicates the existence of risk factors leading to different safety performance of these
segment types. Table 5.3 aggregates type of crashes as indicated on Table 5.2. Relating
individual crash type with geometric elements in every segment complements results
I-215 I-15 US95
Segment type IC PD IC PD IC PD
EN-EX 21 57 45 86 44 71
EX-EN 58 128 29 80 55 107
46
indicated by the chi-square test and this explains what factors are attributed to the occurrence
of crashes. This is covered in section 5.3
Table 5.3: Comparison of proportional of crashes per segment type per freeway
Total crashes
Segment type I-215 I-15 US 95 Total
EN-EX 78 131 115 324
EX-EN 187 109 162 458
Total 265 240 277 782
Pearson chi2(2) = 32.8276 ; Pr = 0.000
Likelihood-ratio chi2(2) = 33.1500 ; Pr = 0.000
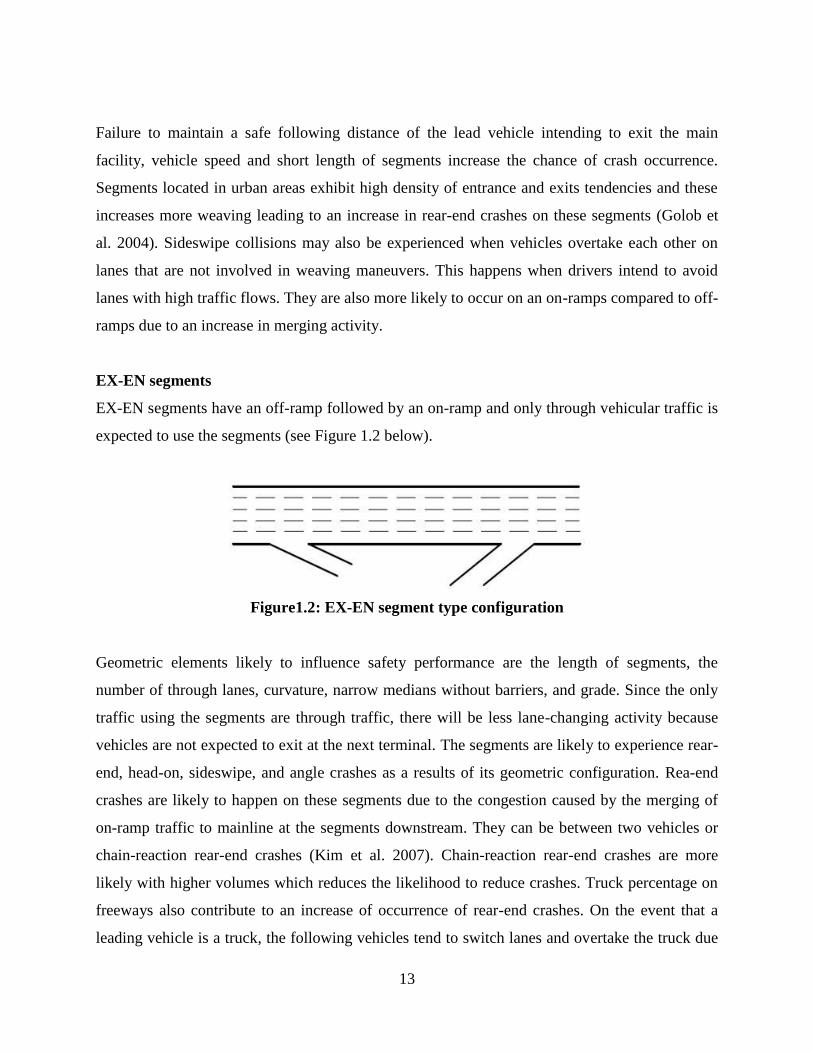
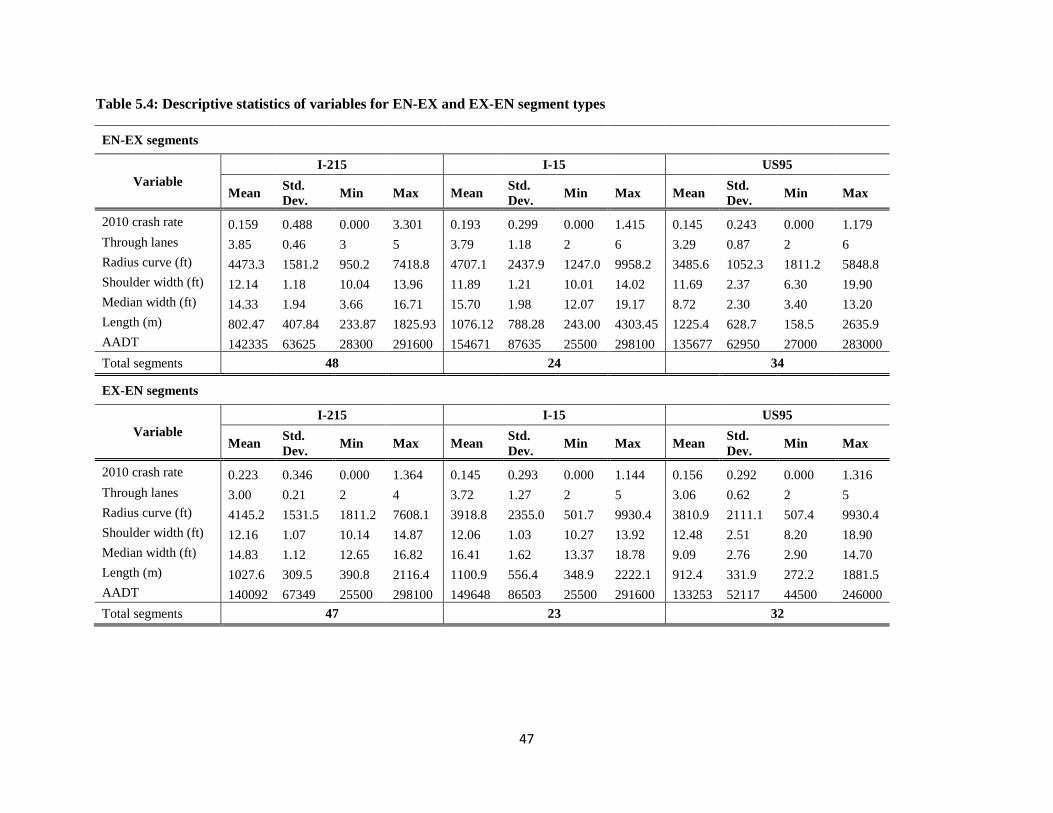
Table 5.4 and 5.5 summarize descriptive statistics for geometric elements observed in EN-
EX and EX-EN segment types. Figures 5.1 and 5.2 below supplement results on Table 5.4 to
indicate crash rate distribution with individual freeway characteristics.
47
Table 5.4: Descriptive statistics of variables for EN-EX and EX-EN segment types
EN-EX segments
Variable
I-215 I-15 US95
Mean Std.
Dev. Min Max Mean
Std.
Dev. Min Max Mean
Std.
Dev. Min Max
2010 crash rate 0.159 0.488 0.000 3.301 0.193 0.299 0.000 1.415 0.145 0.243 0.000 1.179
Through lanes 3.85 0.46 3 5 3.79 1.18 2 6 3.29 0.87 2 6
Radius curve (ft) 4473.3 1581.2 950.2 7418.8 4707.1 2437.9 1247.0 9958.2 3485.6 1052.3 1811.2 5848.8
Shoulder width (ft) 12.14 1.18 10.04 13.96 11.89 1.21 10.01 14.02 11.69 2.37 6.30 19.90
Median width (ft) 14.33 1.94 3.66 16.71 15.70 1.98 12.07 19.17 8.72 2.30 3.40 13.20
Length (m) 802.47 407.84 233.87 1825.93 1076.12 788.28 243.00 4303.45 1225.4 628.7 158.5 2635.9
AADT 142335 63625 28300 291600 154671 87635 25500 298100 135677 62950 27000 283000
Total segments 48 24 34
EX-EN segments
Variable
I-215 I-15 US95
Mean Std.
Dev. Min Max Mean
Std.
Dev. Min Max Mean
Std.
Dev. Min Max
2010 crash rate 0.223 0.346 0.000 1.364 0.145 0.293 0.000 1.144 0.156 0.292 0.000 1.316
Through lanes 3.00 0.21 2 4 3.72 1.27 2 5 3.06 0.62 2 5
Radius curve (ft) 4145.2 1531.5 1811.2 7608.1 3918.8 2355.0 501.7 9930.4 3810.9 2111.1 507.4 9930.4
Shoulder width (ft) 12.16 1.07 10.14 14.87 12.06 1.03 10.27 13.92 12.48 2.51 8.20 18.90
Median width (ft) 14.83 1.12 12.65 16.82 16.41 1.62 13.37 18.78 9.09 2.76 2.90 14.70
Length (m) 1027.6 309.5 390.8 2116.4 1100.9 556.4 348.9 2222.1 912.4 331.9 272.2 1881.5
AADT 140092 67349 25500 298100 149648 86503 25500 291600 133253 52117 44500 246000
Total segments 47 23 32
48
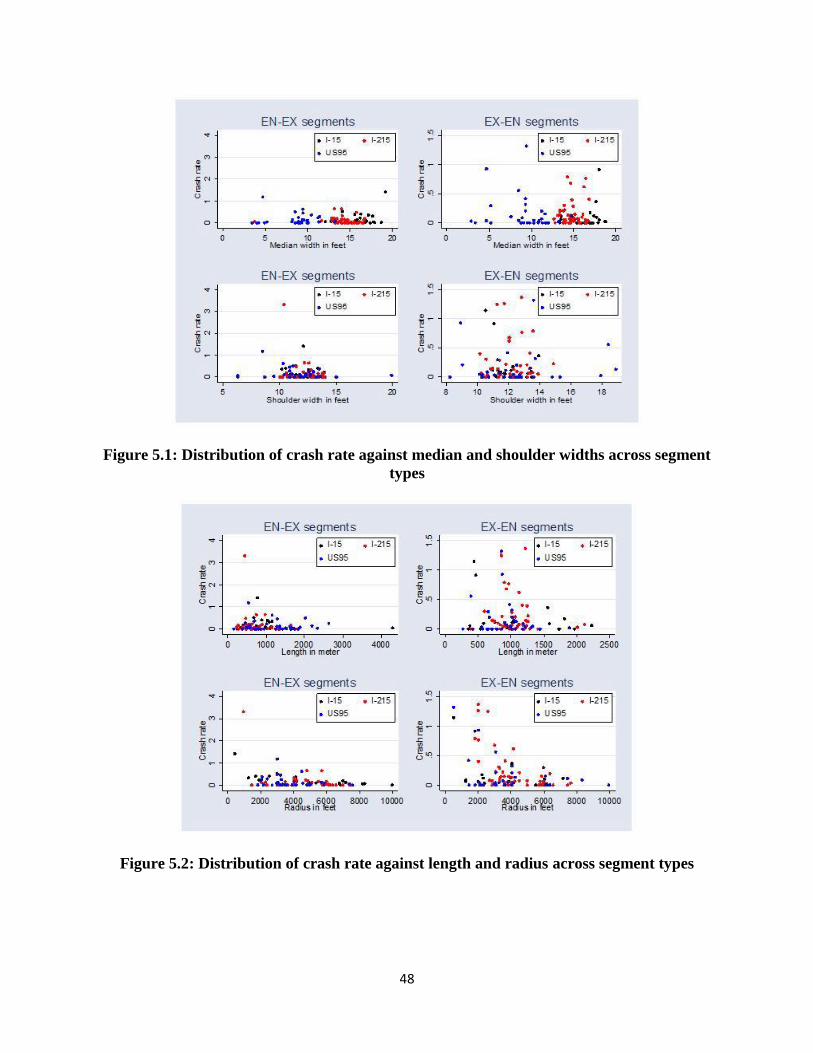
Figure 5.1: Distribution of crash rate against median and shoulder widths across segment
types
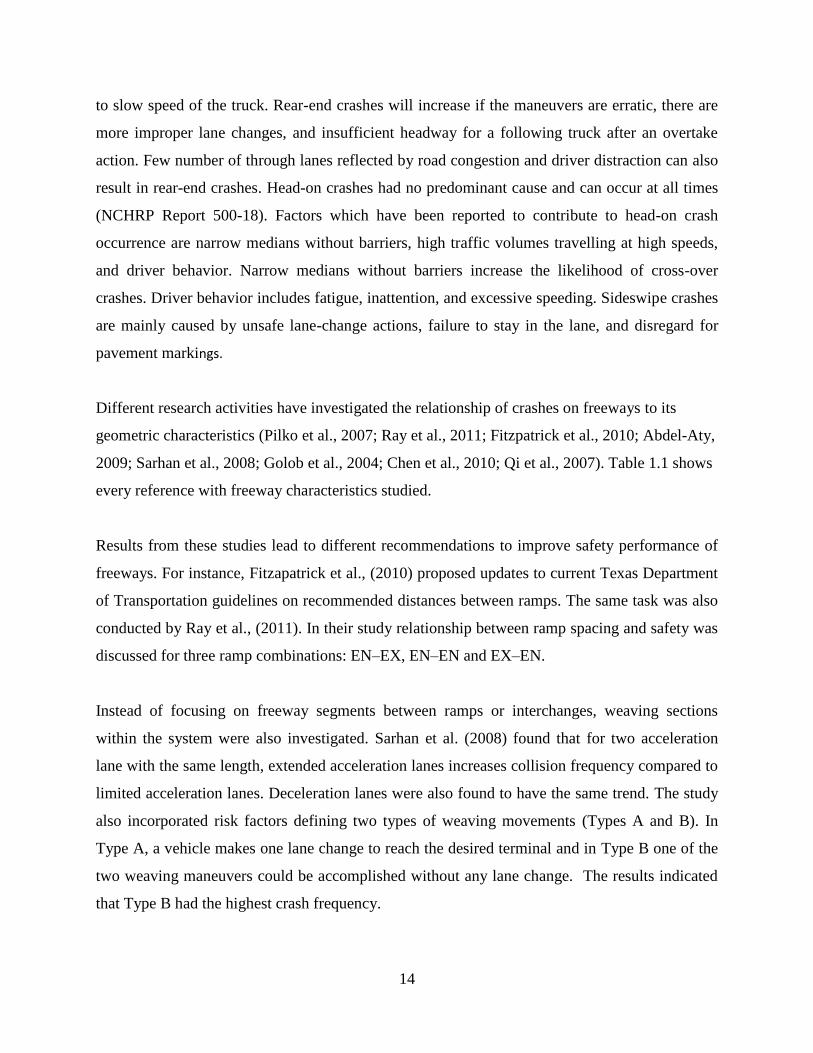
Figure 5.2: Distribution of crash rate against length and radius across segment types

49
Figure 5.1 above presents the distribution of crash rate across median and shoulder widths for
EN-EX and EX-EN segment types. Comparing the medians of EN-EX and EX-EN segments, the
figure indicates that I-15 and I-215 have wider medians than US 95. Also the crash rate is higher
for EX-EN segments compared to EN-EX segments. For EX-EN segments, there are higher
crash rate for narrower shoulders than for EN-EX segments.
Figure 5.2 presents the distribution of crash rate across segment length and radius of curve. The
figure shows that there are higher crash rate for EX-EN segments with relatively low segment
length and radius of curve than EN-EX segments. Furthermore, EN-EX segments on I-15, I-215,
and US 95 have short lengths while these values are sparse for EX-EN segments
Figure 5.3: Distribution of crash rate against through lanes and AADT across segment
types
Figure 5.3 presents the distribution of crash rate across the number of through lanes and traffic
volume. EX-EN indicates higher crash rate at low values of number of through lane compared to
EN-EX segments. However, crash rate decreases with more through lanes.

50
In general, observed freeway characteristics as summarized in Tables 5.4 and their corresponding
graphical presentations in Figures 5.1, 5.2, and 5.3 indicates that safety performance of EN-EX
and EX-EN segments seems to be a function of their geometric elements observed on those
segment types. The quantification of their impact on crash rate can be investigated by calibrating
a model relating crash rate and geometric characteristics and this is discussed in section 5.2.
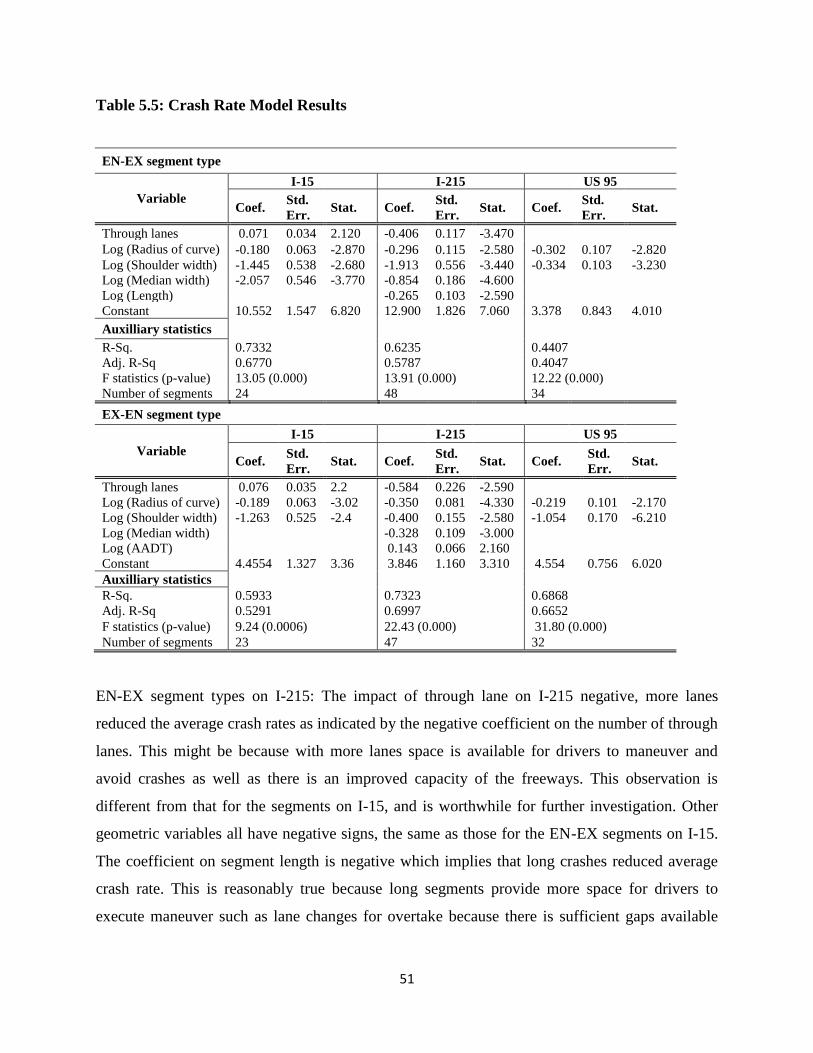
5.2 Crash rate model
Table 5.6 presents the results of crash rate model estimated using Stata software (2008). As
indicated by the test of exclusion restrictions and corresponding p-values, all predictors included
in the models have an overall impact to crash rates. The models also indicate that predictors in
EN-EX segment types on I-15 explained the highest percentage of crash rate variations. For EX-
EN segment type I-215 was observed to explain the highest percentage.
EN-EX segment on I-15: The results in Table 5.5 indicated that more lanes increased average
crash rate as shown by the positive coefficient on the number of through lanes. This might be due
to the fact that, segments with more lanes influences driver behavior of maneuverability such as
lane changes which may lead to sideswipe and angle crashes. In cases where there are high
traffic volumes and high percentage of trucks in the facility, overtaking vehicles are susceptible
to rear-end chain reaction crashes. The coefficient on the radius of curve is negative which
implies that segments with large radius reduced average crash rate. This might be that large
radius provide better visibility for drivers negotiating curves to avoid encountered risk factors.
Wide shoulders and medians have a negative impact on I-15. This is shown by the negative
coefficient on both shoulder and median width. Wider medians and shoulders are expected to
provide more spaces for emergency storage of disable vehicles which reduce the risk of rear-end
crashes. Also drivers can easily maneuver to avoid crashes or more spaces used as a recovery
area for drivers who have left the travel lane.
51
Table 5.5: Crash Rate Model Results
EN-EX segment type
Variable
I-15 I-215 US 95
Coef. Std.
Err. Stat. Coef.
Std.
Err. Stat. Coef.
Std.
Err. Stat.
Through lanes 0.071 0.034 2.120 -0.406 0.117 -3.470
Log (Radius of curve) -0.180 0.063 -2.870 -0.296 0.115 -2.580 -0.302 0.107 -2.820
Log (Shoulder width) -1.445 0.538 -2.680 -1.913 0.556 -3.440 -0.334 0.103 -3.230
Log (Median width) -2.057 0.546 -3.770 -0.854 0.186 -4.600
Log (Length)
-0.265 0.103 -2.590
Constant 10.552 1.547 6.820 12.900 1.826 7.060 3.378 0.843 4.010
Auxilliary statistics
R-Sq. 0.7332 0.6235 0.4407
Adj. R-Sq 0.6770 0.5787 0.4047
F statistics (p-value) 13.05 (0.000) 13.91 (0.000) 12.22 (0.000)
Number of segments 24 48 34
EX-EN segment type
Variable
I-15 I-215 US 95
Coef. Std.
Err. Stat. Coef.
Std.
Err. Stat. Coef.
Std.
Err. Stat.
Through lanes 0.076 0.035 2.2 -0.584 0.226 -2.590
Log (Radius of curve) -0.189 0.063 -3.02 -0.350 0.081 -4.330 -0.219 0.101 -2.170
Log (Shoulder width) -1.263 0.525 -2.4 -0.400 0.155 -2.580 -1.054 0.170 -6.210
Log (Median width)
-0.328 0.109 -3.000
Log (AADT)
0.143 0.066 2.160
Constant 4.4554 1.327 3.36 3.846 1.160 3.310 4.554 0.756 6.020
Auxilliary statistics
R-Sq. 0.5933 0.7323 0.6868
Adj. R-Sq 0.5291 0.6997 0.6652
F statistics (p-value) 9.24 (0.0006) 22.43 (0.000) 31.80 (0.000)
Number of segments 23 47 32
EN-EX segment types on I-215: The impact of through lane on I-215 negative, more lanes
reduced the average crash rates as indicated by the negative coefficient on the number of through
lanes. This might be because with more lanes space is available for drivers to maneuver and
avoid crashes as well as there is an improved capacity of the freeways. This observation is
different from that for the segments on I-15, and is worthwhile for further investigation. Other
geometric variables all have negative signs, the same as those for the EN-EX segments on I-15.
The coefficient on segment length is negative which implies that long crashes reduced average
crash rate. This is reasonably true because long segments provide more space for drivers to
execute maneuver such as lane changes for overtake because there is sufficient gaps available

52
between vehicles. Note that segment length is not a significant variable for EN-EX segments on
I-15, an observation counter expectation. This needs further investigation.
EN-EX segments on US95: There were only two variables that are statistically significant: radius
of curve and shoulder width. Their signs are the same as those on the other two freeways.
The results for the EX-EN segments in Table 5.5 are quite similar to those of the EN-EX
segments, with the following exceptions. First, the number of through lane has different signs in
the models for I-15 and I-215, but their signs are opposite in the case for EN-EX. This will be
further investigated. Second, traffic flow AADT becomes significant, which is not significant in
the models for EN-EX segments. This might reflect the situation where traffic congestion back
into from EN-EX segment to EX-EN segments, as the increase of traffic flow. The impact of
traffic may not be observed on the EN-EX segments, but on the EX-EN segments. Third,
segment length is not a significant variable for EX-EN segment which is the case for the EN-EX
segments. In other words, segment length is important to EN-EX segments than EX-EN
segments. One reason might be that traffic weaving that causes crashes on EN-EX may not be a
significant problem on the EX-EN segments. These three observations make EN-EX segments
different from EX-EN segments.
5.3 Severity model
Table 5.6 presents results estimated from severity model. The likelihood ratio tests for all models
indicate that they are statistically significant. For EN-EX segments on I-15, only the number of
through lanes, shoulder, and median width was statistically significant.

53
Table 5.6: Ordered Probit Model Results
EN-EX segment
Variable
I-15 I-215 US95
Coef. Std.
Err. Stat. Coef.
Std.
Err. Stat. Coef.
Std.
Err. Stat.
Through lanes 0.628 0.180 3.490 15.735 5.748 2.740 -0.278 0.108 -2.570
Shoulder width -0.709 0.267 -2.660 -7.599 2.763 -2.750 -0.365 0.080 -4.590
Median width -0.480 0.142 -3.370 -0.850 0.430 -1.980
_Cut1 11.910 4.219 39.736 17.001 4.529 1.001
Auxiliary statistics
LR chi2(15) 68.39 62.34 30.4
Prob > chi2 0.000 0.0000 0.0000
Pseudo R2 0.4120 0.8491 0.1954
Number of Crashes 131 78 115
EX-EN segments
Variable
I-15 I-215 US95
Coef. Std.
Err. Stat. Coef.
Std.
Err. Stat. Coef.
Std.
Err. Stat.
Through lanes 2.201 0.825 2.670 1.687 0.391 4.310 -0.505 0.128 -3.940
Shoulder width -3.012 0.807 -3.730 -0.332 0.084 -3.940 -0.138 0.036 -3.800
Median width
-0.151 0.041 -3.660
Cut_ 18.785 9.128
-0.022 1.633 -0.010 2.365 0.660
Auxiliary lanes
LR chi2(15) 48.35 120.92 24.66
Prob > chi2 0.0000 0.0000 0.0000
Pseudo R2 0.4526 0.5120 0.1330
Number of rashes 109 187 162
EN-EX segments on I-15: only the number of through lanes, shoulder, and median width was
statistically significant. The coefficient on the number of through lanes on I-15 is positive which
indicates that more lanes on EN-EX segment on I-15 increased the likelihood of more severe
crash (e.g., injury crashes or fatality). This can be explained by the fact that more lanes attract
more vehicles to use the facility and this increases the likelihood of crash occurrence. Observed
dataset indicated that sideswipe collision increased with the number of through lanes. In this case
it should be noted that sideswipe collisions occur when two vehicles are traveling side-by-side in
the same direction and one vehicle drifts into the lane next to it, swiping the other vehicle. This
indicates the existence of more lane changes related to segments with more lanes.
The coefficient on the shoulder width is negative which implies that wide shoulders reduce the
likelihood of high severity crashes. It might be due to the fact that more space is available for
emergency storage of disabled vehicles and maintenance activities. Storage of disabled vehicles
reduces the risk of rear-end crashes and prevent a lane from being closed. Shoulders also provide

54
a space for drivers to maneuver to avoid crashes, improve stopping sight distance at curves, as
well as recovery area for drivers who have left the travel lane. The coefficient on the median
width is negative which indicates that wide medians reduced the likelihood of high severity
crashes. This is because medians may be used as recovery areas by out-of-control vehicles in the
case where a median is unprotected.
EN-EX segments on I-215: the results are similar to those on I-15.
EN-EX segment on US 95: the coefficient on the number of through lanes is positive which
indicates that more lanes increased the likelihood of high severity crashes. This observation is
the opposite of that for other two freeways, and need further investigation. The coefficient on
the shoulder width is negative, the same for other two freeways. However, the coefficient for
median width is not significant, different from other two freeways. These two differences reflect
the distinct characteristics of US 95 comparing other two freeways.
The results for EX-EN segments on these three freeways are similar to those on EN-EX
segments, with the exceptions on median width for EX-EN segment on I-15. For the EN-EX
segment, wider median reduce the likelihood of high severity crash. In the case of EX-EN, lane
changing activities are reduced comparing on EN-EX, and thus the function for median to
provide buffer to out-of-track vehicles is diminished, and thus the variable become not
significant. It can also be seen from Table 5.6 that the relative magnitude of the influence of the
variables are different from those on the EN-EX segments.

55
CHAPTER 6 - IDENTIFYING THE SEGMENTS WITH GEOMETRIC DESIGN
PROBLEMS
This study used the results from regression models to identify the segments with geometric
design problems. Segments with geometric characteristics values above or below their
corresponding mean by two standard deviations imply that they present potentials for crashes
due to geometric design problems. Figure 6.1 presents the steps to sort out these segments. The
notations used on the flow chart are provided below:
𝑋𝑖 : a significant variable from the regression results and 𝑖 = 1,… . , 𝑛,
𝜇𝑖 ∶ computed mean of a variable 𝑋𝑖,
𝜎𝑖 ∶ computed standard deviation of a variable, 𝑋𝑖, and
𝛽𝑖: regression coefficient for a variable 𝑋𝑖.

56
Compute 𝜇𝑖 −
2𝜎𝑖 and 𝜇𝑖 +
Compute 𝜇𝑖
and 𝜎𝑖 of 𝑋𝑖
𝑋𝑖 <
𝜇𝑖 − 2𝜎𝑖 and - 𝛽 ?
𝑋𝑖 >
𝜇𝑖 + 2𝜎𝑖 and +𝛽𝑖
Identify and
record 𝑋𝑖 Identify and
record 𝑋
YES
𝑋𝑖 is
ok
𝑋𝑖 is
ok
YES
𝑋𝑖 = 𝑋𝑛
?
YES
End

57
Presented in Tables 6.1 and 6.2 are the segments on each of the three freeways based on crash
rate and severity models, respectively. The results are also presented in Tables 6.3 and 6.4 list the
segments with their geometric problems.
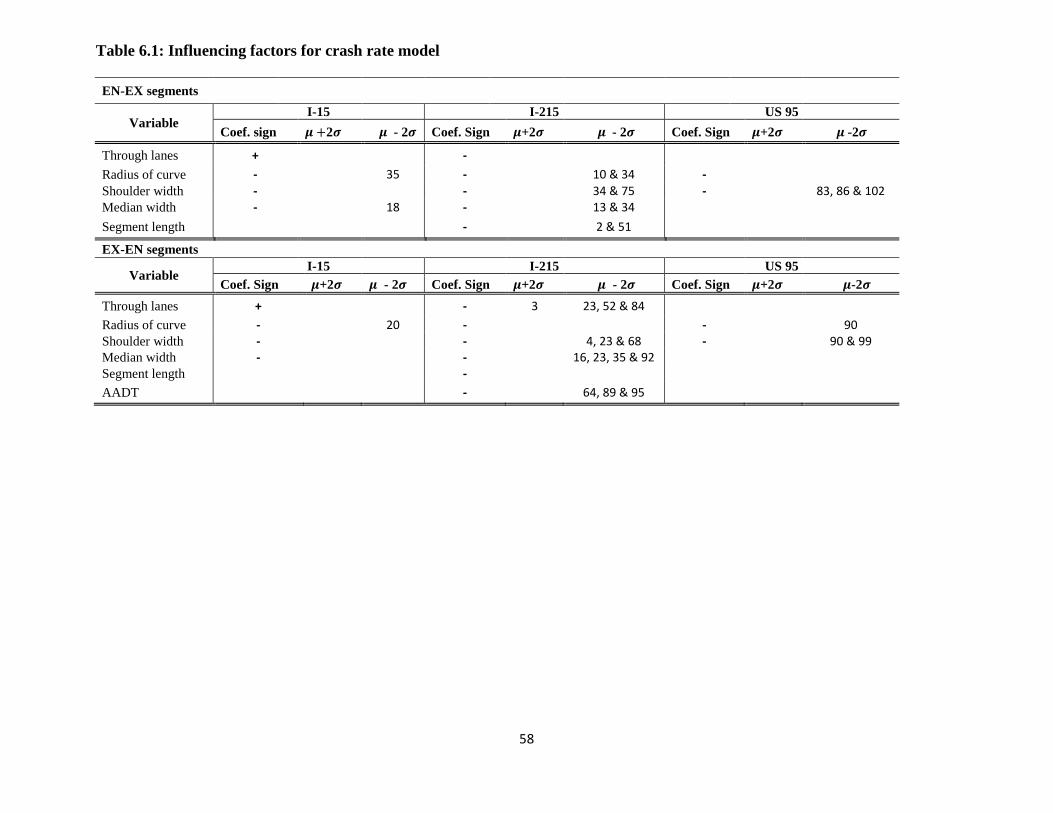
58
Table 6.1: Influencing factors for crash rate model
EN-EX segments
Variable I-15 I-215 US 95
Coef. sign 𝝁 +2𝝈 𝝁 - 2𝝈 Coef. Sign 𝝁+2𝝈 𝝁 - 2𝝈 Coef. Sign 𝝁+2𝝈 𝝁 -2𝝈
Through lanes +
-
Radius of curve -
35 -
10 & 34 - Shoulder width -
-
34 & 75 -
83, 86 & 102
Median width -
18 -
13 & 34
Segment length - 2 & 51 EX-EN segments
Variable I-15 I-215 US 95
Coef. Sign 𝝁+2𝝈 𝝁 - 2𝝈 Coef. Sign 𝝁+2𝝈 𝝁 - 2𝝈 Coef. Sign 𝝁+2𝝈 𝝁-2𝝈
Through lanes +
- 3 23, 52 & 84
Radius of curve -
20 -
-
90 Shoulder width -
-
4, 23 & 68 -
90 & 99
Median width -
-
16, 23, 35 & 92
Segment length
-
AADT - 64, 89 & 95
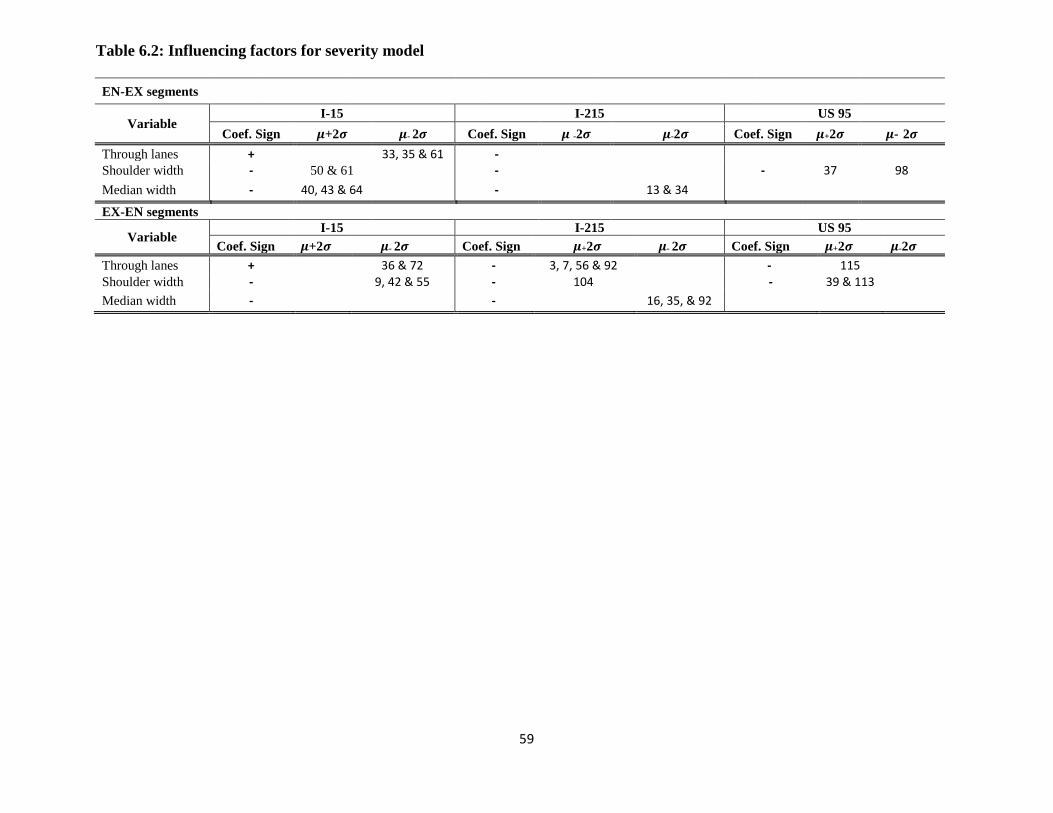
59
Table 6.2: Influencing factors for severity model
EN-EX segments
Variable I-15 I-215 US 95
Coef. Sign 𝝁+2𝝈 𝝁- 2𝝈 Coef. Sign 𝝁 -2𝝈 𝝁-2𝝈 Coef. Sign 𝝁+2𝝈 𝝁- 2𝝈
Through lanes +
33, 35 & 61 -
Shoulder width - 50 & 61 -
- 37 98
Median width - 40, 43 & 64 - 13 & 34 EX-EN segments
Variable I-15 I-215 US 95
Coef. Sign 𝝁+2𝝈 𝝁- 2𝝈 Coef. Sign 𝝁+2𝝈 𝝁- 2𝝈 Coef. Sign 𝝁+2𝝈 𝝁-2𝝈
Through lanes +
36 & 72 - 3, 7, 56 & 92
- 115 Shoulder width -
9, 42 & 55 - 104
- 39 & 113
Median width - - 16, 35, & 92
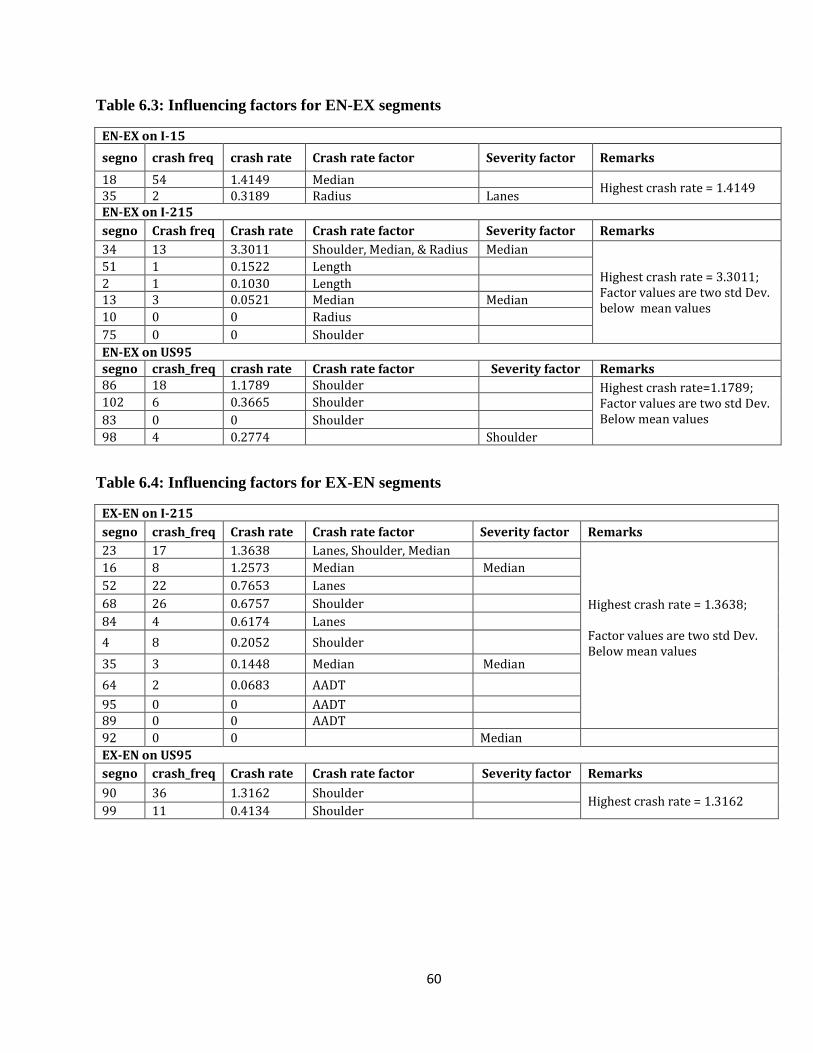
60
Table 6.3: Influencing factors for EN-EX segments
EN-EX on I-15
segno crash freq crash rate Crash rate factor Severity factor Remarks
18 54 1.4149 Median Highest crash rate = 1.4149
35 2 0.3189 Radius Lanes EN-EX on I-215
segno Crash freq Crash rate Crash rate factor Severity factor Remarks
34 13 3.3011 Shoulder, Median, & Radius Median
Highest crash rate = 3.3011; Factor values are two std Dev. below mean values
51 1 0.1522 Length
2 1 0.1030 Length 13 3 0.0521 Median Median
10 0 0 Radius
75 0 0 Shoulder
EN-EX on US95
segno crash_freq crash rate Crash rate factor Severity factor Remarks 86 18 1.1789 Shoulder Highest crash rate=1.1789;
Factor values are two std Dev. Below mean values
102 6 0.3665 Shoulder
83 0 0 Shoulder
98 4 0.2774 Shoulder
Table 6.4: Influencing factors for EX-EN segments
EX-EN on I-215
segno crash_freq Crash rate Crash rate factor Severity factor Remarks
23 17 1.3638 Lanes, Shoulder, Median
Highest crash rate = 1.3638; Factor values are two std Dev. Below mean values
16 8 1.2573 Median Median
52 22 0.7653 Lanes
68 26 0.6757 Shoulder
84 4 0.6174 Lanes
4 8 0.2052 Shoulder
35 3 0.1448 Median Median
64 2 0.0683 AADT
95 0 0 AADT 89 0 0 AADT
92 0 0 Median
EX-EN on US95
segno crash_freq Crash rate Crash rate factor Severity factor Remarks
90 36 1.3162 Shoulder Highest crash rate = 1.3162
99 11 0.4134 Shoulder
61
To verify the geometric problems on these segments, local highway design experts were consulted.
Meetings with them were made where the results listed in Tables 6.3 and 6.4 were presented to them
segment-by-segment. If the identified geometric problems are not consistent with their perceptions, they
provided the possible geometric problems they perceived. For each segment, discussions on
countermeasures to improve safety were also made. The sections below list the discussions and the
countermeasures.
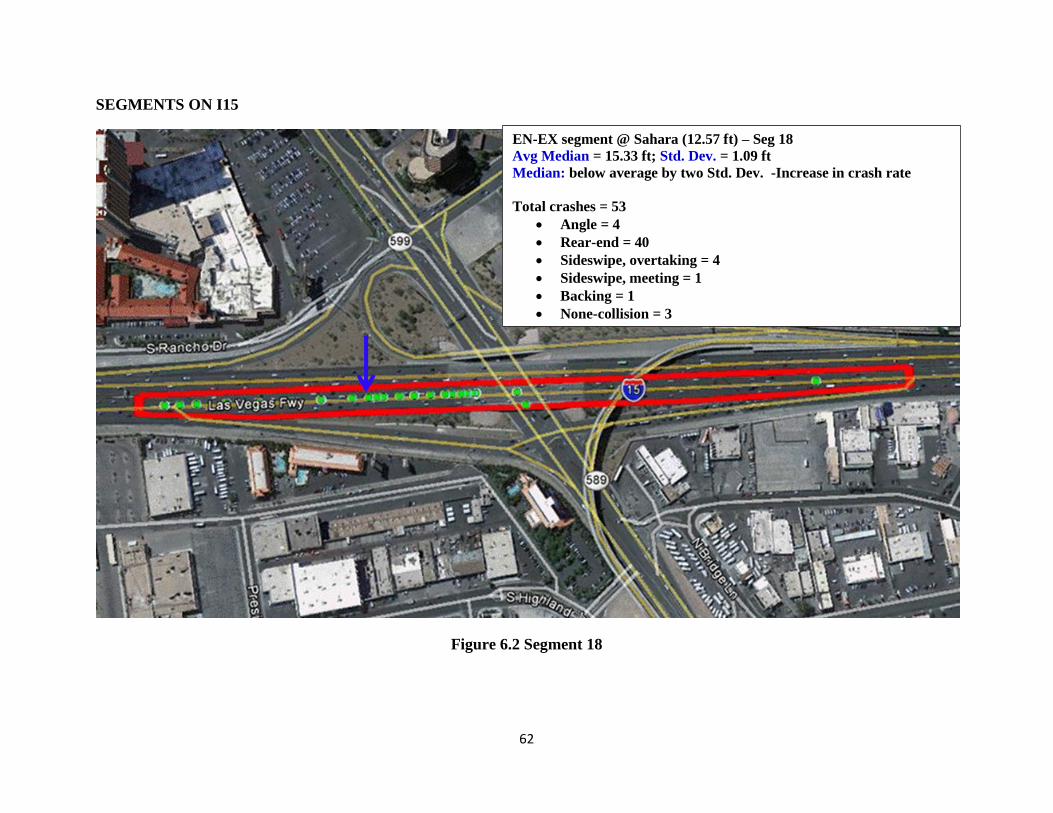
62
SEGMENTS ON I15
Figure 6.2 Segment 18
EN-EX segment @ Sahara (12.57 ft) – Seg 18
Avg Median = 15.33 ft; Std. Dev. = 1.09 ft
Median: below average by two Std. Dev. -Increase in crash rate
Total crashes = 53
• Angle = 4
• Rear-end = 40
• Sideswipe, overtaking = 4
• Sideswipe, meeting = 1
• Backing = 1
• None-collision = 3

63
Segment #18 is located on Northbound I15 at Sahara Av. The on-ramp has three lanes and the
merging traffic causes significant traffic congestion which would move upstream, initially with
right most lane blocked, ultimately with all mainline lanes blocked, during peak period. The
model indicates that this segment experienced an increase in crash rate due to narrow median.
Observation on non-geometric factors indicated that many crashes occurred when pavement
surface was wet and when traffic was in peak period. Many of these crashes are rear-end. It is
likely that the cause of the crash are temporary reduction of pavement surface friction, but not
narrow median that are revealed through the methodology used in this study.
Meeting with experienced professionals revealed that congestion is the primary contributing
factor for crash occurrence. When congestion starts in peak period, drivers on the mainline tend
to drive on the right side lane and merge at the end, while queues develop at the merge of main
facility and entry ramp. Significant amount of weaving movement downstream of this segment
causes congestion. It was indicated that the effective way of removing the weaving is separating
the involved traffic movement spatially. Neon project has included some improvements
regarding this.

64
Figure 6.3 Segment 35
EN-EX segment @ Lamb Blvd (2 lanes) Segment 35
Avg No. of lanes = 3.79; Std. Dev. = 1.18
Lanes: below average by two Std. Dev. -Increase in crash rate
Total crashes = 2
• Angle = 1
• Sideswipe, meeting = 1

65
Segment 35, northbound I-15 at Lamb Blvd, shown in Figure 6.3 has only two crashes happened,
one of which occurred on wet pavement surface. Both crashes occurred on dark condition.
Although the lighting may be the probable cause, it may not be conclusive due to few crashes
observed.
Consultation with other professionals indicated that driver behavior may likely have contributed
to crash occurrence. It was suggested that traffic volume should further be investigated and an
additional lane might be added if needed.
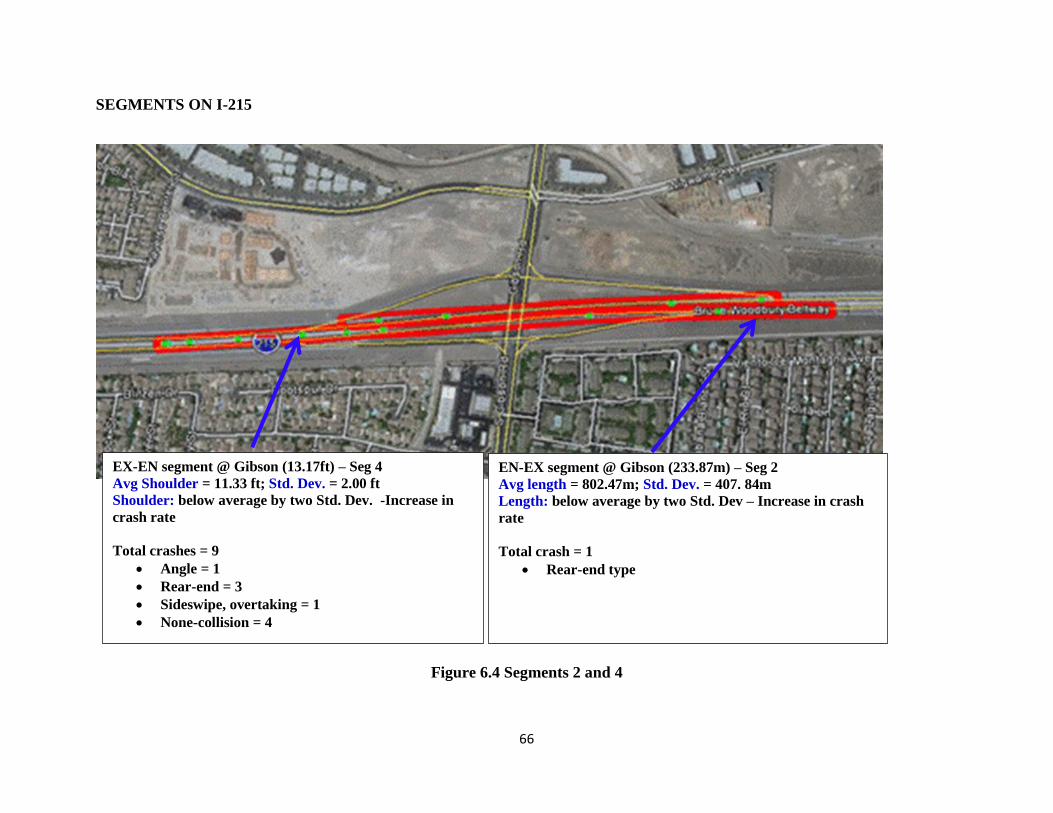
66
SEGMENTS ON I-215
Figure 6.4 Segments 2 and 4
EX-EN segment @ Gibson (13.17ft) – Seg 4
Avg Shoulder = 11.33 ft; Std. Dev. = 2.00 ft
Shoulder: below average by two Std. Dev. -Increase in
crash rate
Total crashes = 9
• Angle = 1
• Rear-end = 3
• Sideswipe, overtaking = 1
• None-collision = 4
EN-EX segment @ Gibson (233.87m) – Seg 2
Avg length = 802.47m; Std. Dev. = 407. 84m
Length: below average by two Std. Dev – Increase in crash
rate
Total crash = 1
• Rear-end type
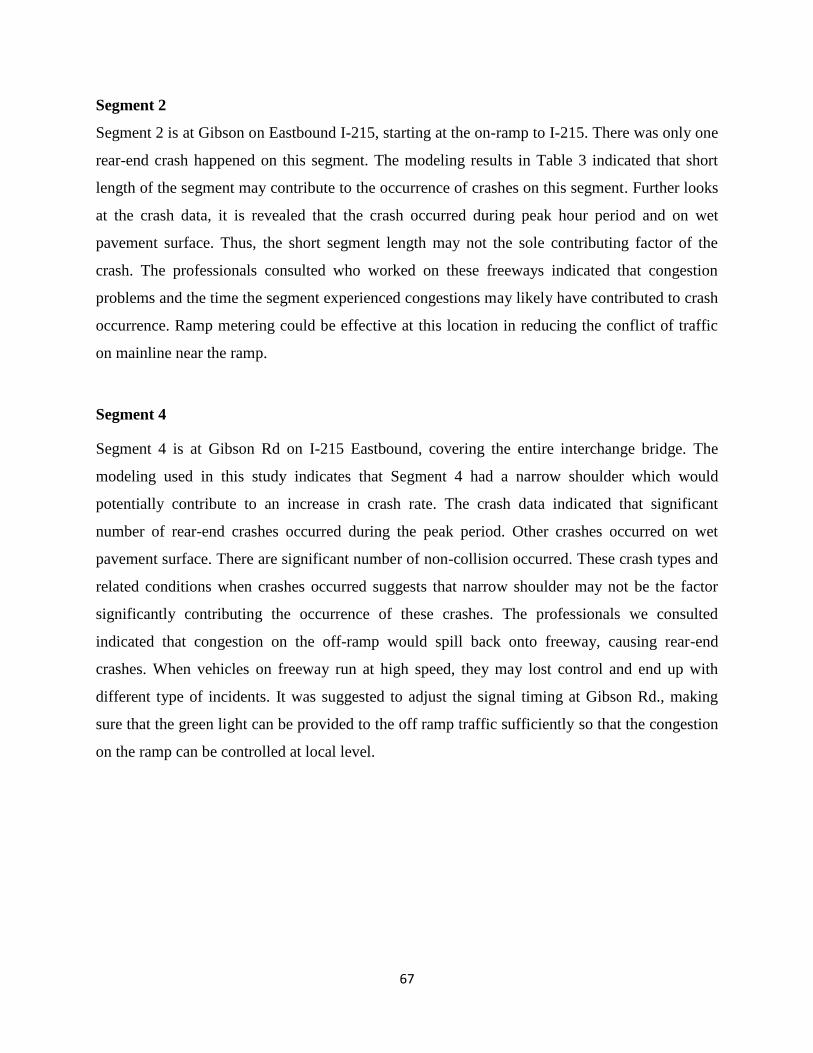
67
Segment 2
Segment 2 is at Gibson on Eastbound I-215, starting at the on-ramp to I-215. There was only one
rear-end crash happened on this segment. The modeling results in Table 3 indicated that short
length of the segment may contribute to the occurrence of crashes on this segment. Further looks
at the crash data, it is revealed that the crash occurred during peak hour period and on wet
pavement surface. Thus, the short segment length may not the sole contributing factor of the
crash. The professionals consulted who worked on these freeways indicated that congestion
problems and the time the segment experienced congestions may likely have contributed to crash
occurrence. Ramp metering could be effective at this location in reducing the conflict of traffic
on mainline near the ramp.
Segment 4
Segment 4 is at Gibson Rd on I-215 Eastbound, covering the entire interchange bridge. The
modeling used in this study indicates that Segment 4 had a narrow shoulder which would
potentially contribute to an increase in crash rate. The crash data indicated that significant
number of rear-end crashes occurred during the peak period. Other crashes occurred on wet
pavement surface. There are significant number of non-collision occurred. These crash types and
related conditions when crashes occurred suggests that narrow shoulder may not be the factor
significantly contributing the occurrence of these crashes. The professionals we consulted
indicated that congestion on the off-ramp would spill back onto freeway, causing rear-end
crashes. When vehicles on freeway run at high speed, they may lost control and end up with
different type of incidents. It was suggested to adjust the signal timing at Gibson Rd., making
sure that the green light can be provided to the off ramp traffic sufficiently so that the congestion
on the ramp can be controlled at local level.

68
Figure 6.5 Segments 13 and 16
EN-EX segments (3.66ft) – Seg 13
Avg median = 14.14 ft; Std. Dev. = 2.32 ft
Median: below average by two Std. Dev – Increase in crash
rate
Total crash = 3
• Angle = 2
• Non-collision = 1
EX-EN segment (15.2ft) – Seg 16
Avg median = 13.63 ft; Std. Dev. = 2.87 ft
Median: below average by two Std. Dev – Increase in crash
rate
Total crashes = 9
• Angle = 2
• Rear-end = 5
• Sideswipe, overtaking = 2
• None-collision = 3

69
Segment 13
Segment 13 is on westbound I-215 between Valle Verde Dr. and Green Valley Pkwy. The
modeling indicated that narrow median is a contributing factor for crashes at this segment. The
crash data show that two crashes were angle crash which occurred during peak hour period. This
segment is long upgrade, and there was a full auxiliary lane connecting these two interchanges.
Thus, it is hard to figure out the cause of the crashes.
Segment 16 is at Green Valley Pkwy on eastbound I-215, running from one side of the
interchange to the other side. The modeling indicates that narrow median might be a contributing
factor for the occurrence of crashes. The crash data present that significant rear-end crashes
happened on this segment. These crashes were highly likely caused by traffic from the eastbound
on-ramp. The District in that area and the Green Valley Ranch Casino may generate traffic that
makes the traffic significantly congested the on-map to Henderson. In addition, St. Rose Pkwy
carries significant traffic that feeds to this segment. Thus, it was suggested to have ramp
metering on this ramp on Green Valley Pkwy and St. Rose.

70
Figure 6.6 Segment 23
EX-EN segment (12.82ft) – Seg 23
Avg median = 11.13 ft; Std. Dev. = 2.00 ft
Shoulder: below average by two Std. Dev – Increase in crash rate
Total crashes = 18
• Angle = 6
• Rear-end = 5
• Sideswipe, overtaking = 1
• None-collision = 9

71
Segment 23
Segment 23 is on a big curve at Eastern Ave. on the westbound of I-215. Crashes distributed. It
was identified by the models that the numbers of lanes and widths of shoulder and median are
below average, and thus could be the contributing factors to the occurrence of crashes on this
segment. It is further observed that the segment has three different locations where crashes
occurred. At the exit terminal, the observed data indicated that there are more rear-end crashes
which occurred during peak hour period on wet pavement surface. The traffic volume on-ramp
from Eastern Ave. is usually very high because it is a major arterial in this area of the freeway.
The weaving of traffic at this location is very heavy. Ramp metering should be considered at this
location. In addition, the on-ramp is a tapered type, which should be changed to parallel type,
making the entrance of traffic to mainline easier. It is noticed that the space around the on-ramp
is sufficiently large to make such a change.
At the middle of the segment, there were also crashes happened. These crashes are comprised of
angle, rear-end, and sideswipe in approximately equal proportion. A great number of crashes
occurred during peak period on wet pavement surface. These crashes may be caused by the
congestion at the exit terminal downstream. A warning sign with dynamic message is suggested
to alert the motorist running at high speed.
There are few numbers of crashes observed at the entrance which occurred on wet pavement
surface with only crash happened during peak period. It is noticed that the traffic to the off-ramp
is very heavy during peak period, and these traffic may backup to freeway mainline, causing
traffic turbulence, which would influence driver behavior passing the off-ramp. A warning sign
of slow-moving vehicles downstream is more appropriate to be installed for this location.
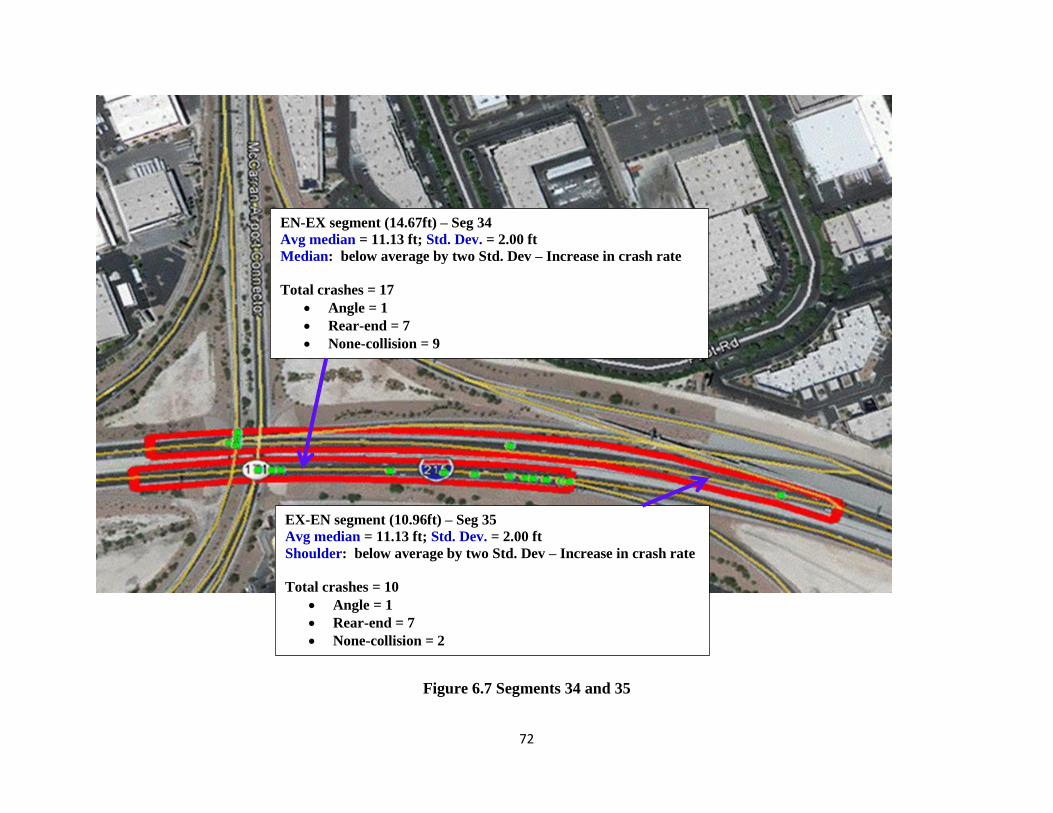
72
Figure 6.7 Segments 34 and 35
EN-EX segment (14.67ft) – Seg 34
Avg median = 11.13 ft; Std. Dev. = 2.00 ft
Median: below average by two Std. Dev – Increase in crash rate
Total crashes = 17
• Angle = 1
• Rear-end = 7
• None-collision = 9
EX-EN segment (10.96ft) – Seg 35
Avg median = 11.13 ft; Std. Dev. = 2.00 ft
Shoulder: below average by two Std. Dev – Increase in crash rate
Total crashes = 10
• Angle = 1
• Rear-end = 7
• None-collision = 2

73
Segment 34
Segment 34 is at the airport connector on the Eastbound I-215. The modeling results indicated that the
widths of shoulder and median are narrow, and radius of curve is sharp on segment 34, which would have
contributed to the occurrence and severity of crashes. Crash data indicated that there were more rear-end
crashes occurred at the exit terminal. In general, these crashes occurred when the pavement was wet and
during the peak hour period with a Dark-sport lighting condition. As a matter of fact, this segment
involved significant traffic weaving: the traffic from the airport and the west of I-215 conflicting with
traffic getting off I-215 on the off-ramp. Particularly when the traffic on the off-ramp cannot be cleared
quickly, this situation becomes the worst. From the meeting with some experts in road design it was
known that this segment will be widened so that more lanes can be dedicated to weaving. A flyer from the
airport to Eastbound I-215 will be constructed, which separate the weaving traffic spatially. This
construction is expensive, but will solve the congestion and safety problem significantly.
Segment 35
Segment 35 is at the airport connector of westbound of I-215. The modeling results indicate that
the narrow median at this segment would contribute to the crash occurrence significantly.
Actually, the influencing factors would be more coming from traffic in the connected road
segments. At the downstream end, it was a merging point for traffic from the airport going to the
west. Congestion has always been formed at this point and the segment downstream, which
conflicts with the through traffic on this segment. This might be a reason for having many
crashes at this point. This problem would be reduced by building an elevated structure that can
allow the traffic from the airport to go to the west of Las Vegas Blvd. The database indicates that
the pavement surface was wet at the time of crash occurrence and these crashes are associated
with a greater number of rear-end crashes at this spot. The database also indicates that more
young drivers were involved compared to old drivers. At the middle of this segment, two crashes
were observed which involved old drivers on wet pavement surface. This implies that age
combined with pavement condition factors may likely have contributed to crashes. At the
upstream end of this segment, traffic turbulences were usually formed due to the congestion on
the off-ramp to the airport. Travelers may behave differently after they move out the turbulences,
causing more crashes. This problem would be mitigated by building a flyer from eastbound I-215
to the airport, separating the traffic from both directions of I-215 merging and weaving at the
point right before the tunnel.
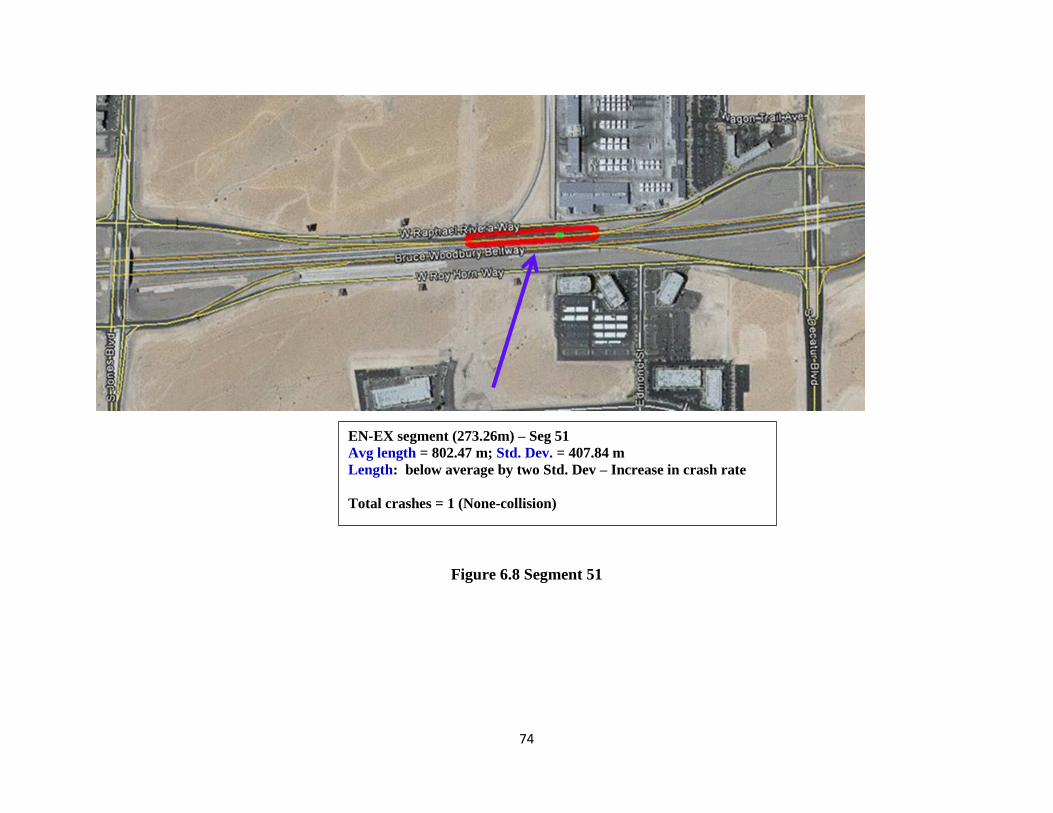
74
Figure 6.8 Segment 51
EN-EX segment (273.26m) – Seg 51
Avg length = 802.47 m; Std. Dev. = 407.84 m
Length: below average by two Std. Dev – Increase in crash rate
Total crashes = 1 (None-collision)

75
Segment 51
Segment 51 is the segment on westbound I-215 between Decatur Blvd and Jones Blvd. This
segment is very short, and the modeling results show that the segment length would be a
contributing factor to the crashes on this segment. The dataset registered only one crash involved
a driver aged 65 years occurred during rainy season and normal daylight. Since there was only
one crash recorded, it cannot indicate clearly whether it was caused by geometric characteristics
or non-geometric characteristics.
According to the experts consulted in this project, driver behavior like speeding also may likely
contribute to crash occurrence, for which further investigation based on real-time data may be
able to capture unobserved underlying reasons contributing to crash occurrence.

76
Figure 7.9 Segment 52
EX-EN segment (3 lanes) – Seg 52
Avg No. of lanes = 3; Std. Dev. = 0.21
Lanes: below average by two Std. Dev – Increase in crash
rate
Total crashes = 13
• Angle = 4
• Rear-end = 2
• Backing = 1
• Sideswipe, overtaking = 1
• None-collision = 2
77
Segment 52
Segment 52 is at Jones Blvd on the eastbound of I-215. There was fewer number of lanes than
average. The modeling results imply that this would have contributed to the crash occurrence at
this location. At the upstream location of this segment, an angle crash happened during darkness
and on wet pavement surface with a driver action as changing lanes. At the downstream location,
another angle crash occurred on wet pavement surface. These crash data imply that it would be
non-geometric factors that contributed to a greater extent to the occurrence of crashes, for which
other data are needed to identify the causes of the crashes.
The design experts suggested that speeding and the time when a crash happened may have likely
contributed to crash occurrence. Additional signage may help alleviate speeding by informing
drivers as they approach the segment.
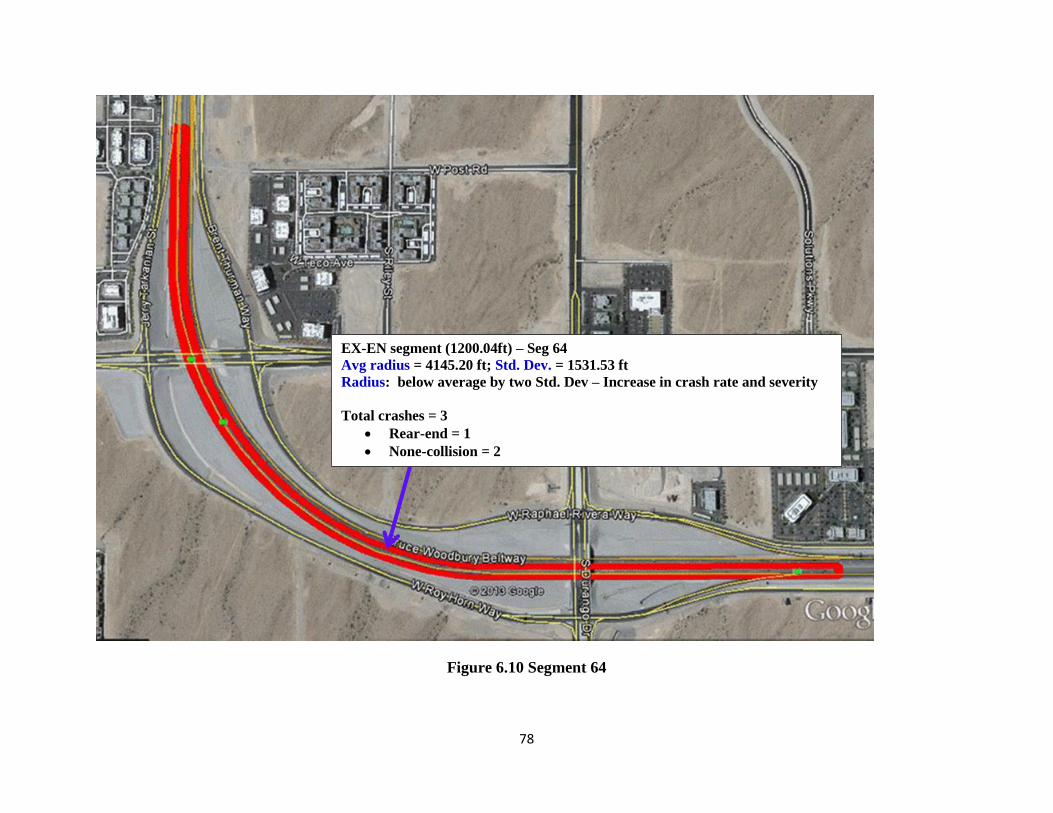
78
Figure 6.10 Segment 64
EX-EN segment (1200.04ft) – Seg 64
Avg radius = 4145.20 ft; Std. Dev. = 1531.53 ft
Radius: below average by two Std. Dev – Increase in crash rate and severity
Total crashes = 3
• Rear-end = 1
• None-collision = 2

79
Segment 64
Segment 64 is at Durango Dr. on eastbound I-215. It is a long curve. The modeling results
indicate that high traffic volume would contribute the occurrence of crashes on this segment. An
increase in traffic may likely induce more crashes, which probably would be rear-end. However,
only three crashes were observed from the database with only one crash being a rear- end crash.
Thus, the crash type was not correspondent to the traffic flow.
The highway design experts consulted in this study indicated that vehicles tended to drive at
speed beyond the design speed, which may have contributed to crashes. It was suggested that
putting signs to alert drivers of speeding may likely reduce crashes.
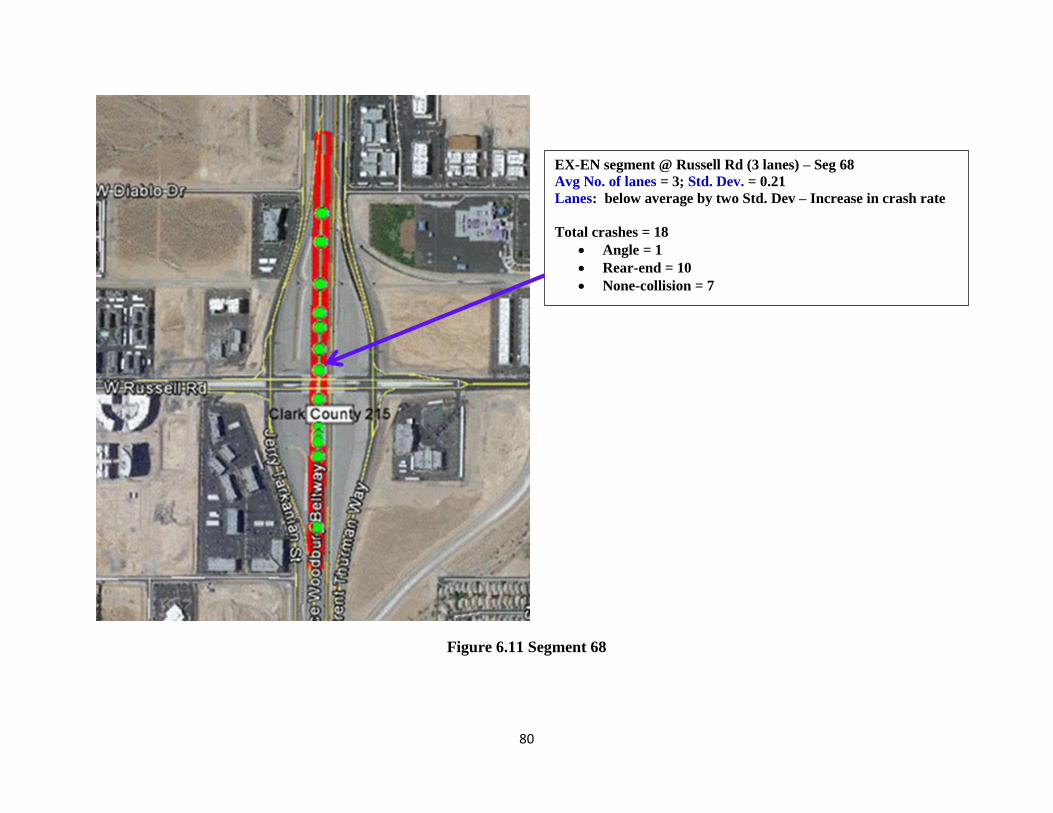
80
Figure 6.11 Segment 68
EX-EN segment @ Russell Rd (3 lanes) – Seg 68
Avg No. of lanes = 3; Std. Dev. = 0.21
Lanes: below average by two Std. Dev – Increase in crash rate
Total crashes = 18
• Angle = 1
• Rear-end = 10
• None-collision = 7

81
Segment 68
Segment 68 is at Russell Rd. on eastbound of I-215. It had a narrow shoulder, which was identified to
have had contributed to the occurrence of crashes. The crash data indicate that there were ten rear-end
crashes out of 18 crashes happened on this segment. In addition, these crashes happened on wet pavement
surface during peak hour period and dark condition, which might have actually influenced the occurrence
of crashes than shoulder. It is also observed that there were seven crashes that were non-collision, which
was very hard to figure out the cause of crashes without real-time data.
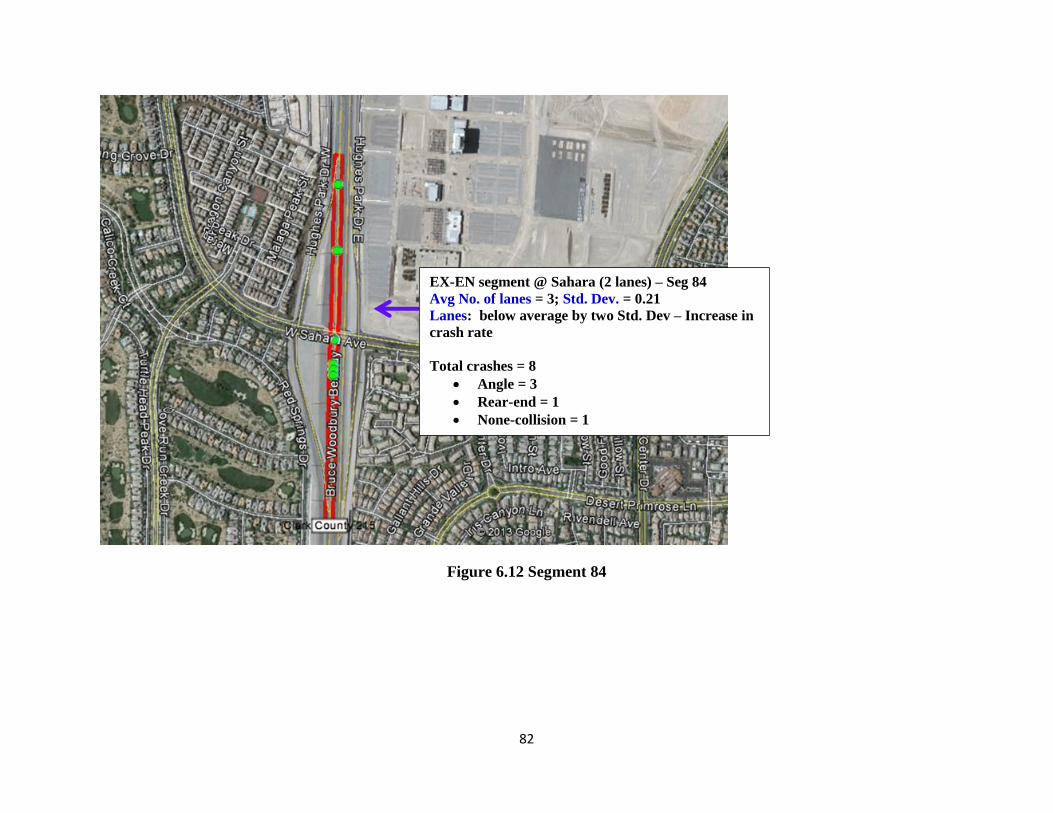
82
Figure 6.12 Segment 84
EX-EN segment @ Sahara (2 lanes) – Seg 84
Avg No. of lanes = 3; Std. Dev. = 0.21
Lanes: below average by two Std. Dev – Increase in
crash rate
Total crashes = 8
• Angle = 3
• Rear-end = 1
• None-collision = 1

83
Segment 84
Segment 84 is located at Sahara Ave. on eastbound I-215. The modeling results indicate that
there was fewer number of lanes on this segment which would have contributed to the crash
occurrence on this segment. However, the crash data shows that most crashes happened during
peak hour period which suggests congestion may be more lightly contributing to these crashes.
Without real time data it is difficult to understand the underlying problems for these crashes.

84
SEGMENTS ON US95
Figure 6.13 Segment 102
EN-EX segment @Stephanie (13.5ft) – seg 102
Avg shoulder = 10.94; Std. Dev. = 2.96
Shoulder: below average by two Std. Dev – Increase
in crash rate
Total crashes = 7
• Angle = 3
• None-collision = 4
85
Segment 102
Segment 102 is at Russell Rd. on the southbound of US 95. It is an EN-EX segment between the
Russell and Galleria Dr. interchanges. Its shoulder was narrow which was identified to cause
more crashes. There were three crashes in total happened on this segment, and these crashes
were associated with wet pavement surface. The design experts consulted indicated that vehicles
tended to speeding on this downgraded segment, which may likely contribute to the occurrence
of these crashes. It was suggested that putting signs to alert speeding to reduce crash occurrence.
In addition, due to relatively few crashes observed in this segment, more real-time data are
needed to identify the underlying causes of crashes.
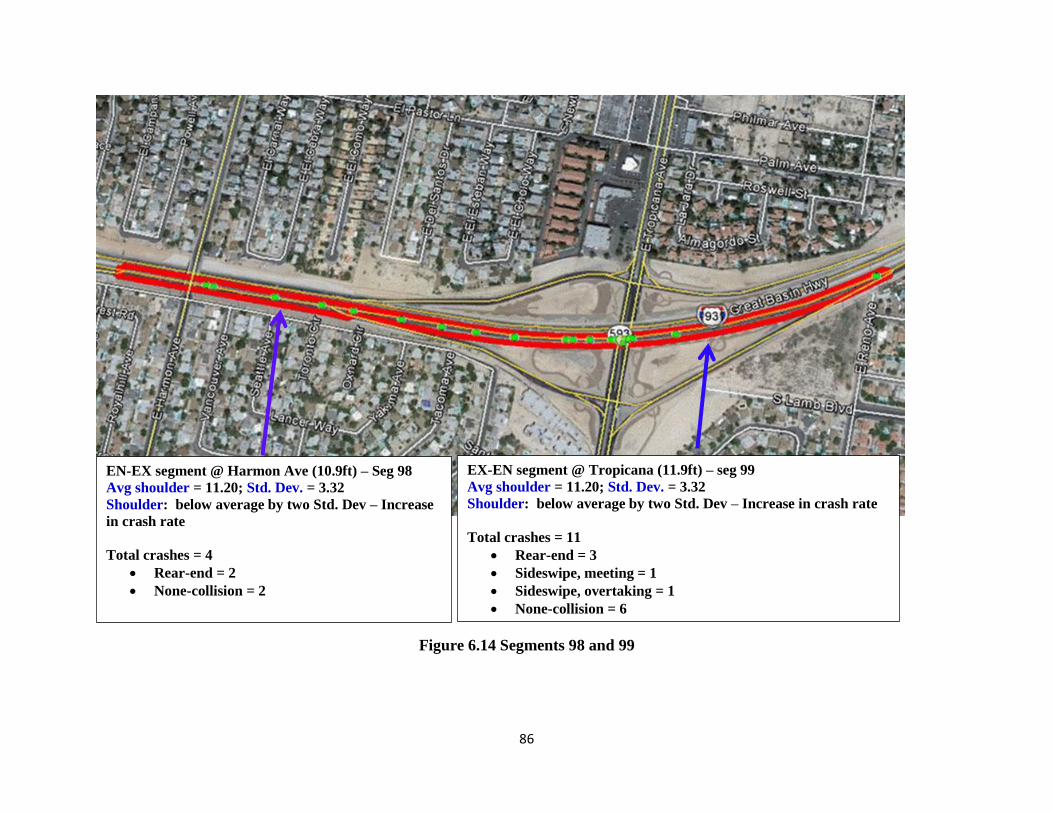
86
Figure 6.14 Segments 98 and 99
EN-EX segment @ Harmon Ave (10.9ft) – Seg 98
Avg shoulder = 11.20; Std. Dev. = 3.32
Shoulder: below average by two Std. Dev – Increase
in crash rate
Total crashes = 4
• Rear-end = 2
• None-collision = 2
EX-EN segment @ Tropicana (11.9ft) – seg 99
Avg shoulder = 11.20; Std. Dev. = 3.32
Shoulder: below average by two Std. Dev – Increase in crash rate
Total crashes = 11
• Rear-end = 3
• Sideswipe, meeting = 1
• Sideswipe, overtaking = 1
• None-collision = 6
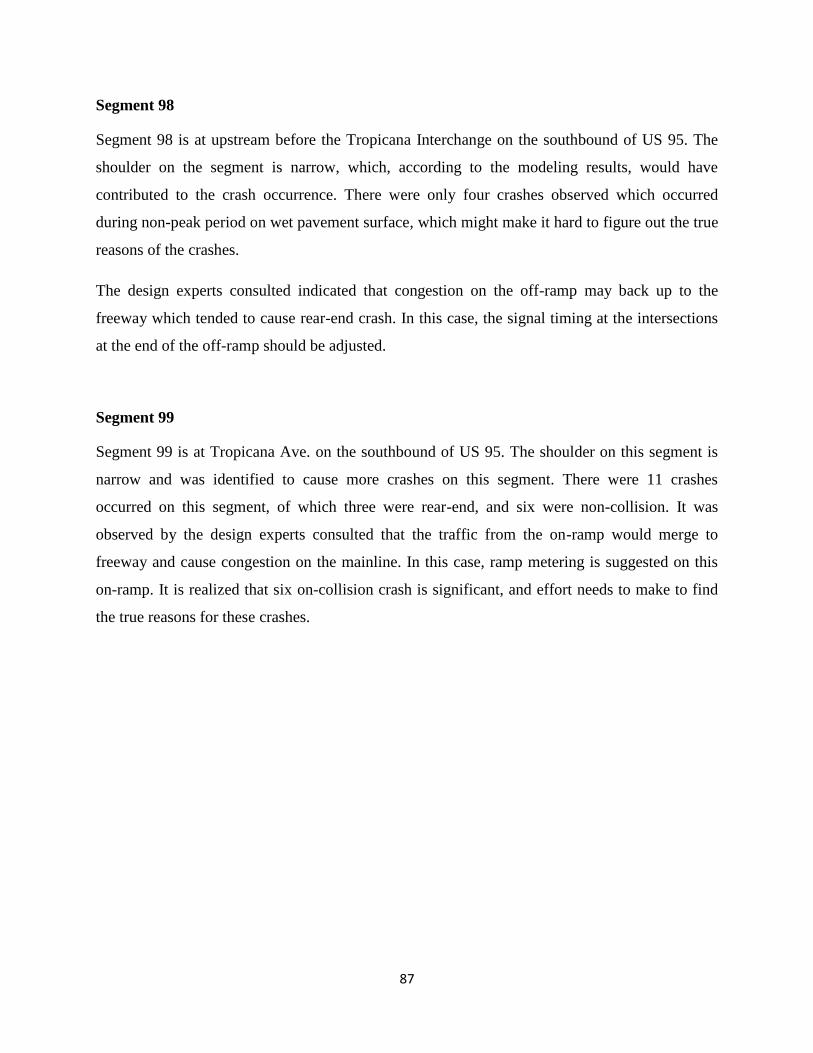
87
Segment 98
Segment 98 is at upstream before the Tropicana Interchange on the southbound of US 95. The
shoulder on the segment is narrow, which, according to the modeling results, would have
contributed to the crash occurrence. There were only four crashes observed which occurred
during non-peak period on wet pavement surface, which might make it hard to figure out the true
reasons of the crashes.
The design experts consulted indicated that congestion on the off-ramp may back up to the
freeway which tended to cause rear-end crash. In this case, the signal timing at the intersections
at the end of the off-ramp should be adjusted.
Segment 99
Segment 99 is at Tropicana Ave. on the southbound of US 95. The shoulder on this segment is
narrow and was identified to cause more crashes on this segment. There were 11 crashes
occurred on this segment, of which three were rear-end, and six were non-collision. It was
observed by the design experts consulted that the traffic from the on-ramp would merge to
freeway and cause congestion on the mainline. In this case, ramp metering is suggested on this
on-ramp. It is realized that six on-collision crash is significant, and effort needs to make to find
the true reasons for these crashes.
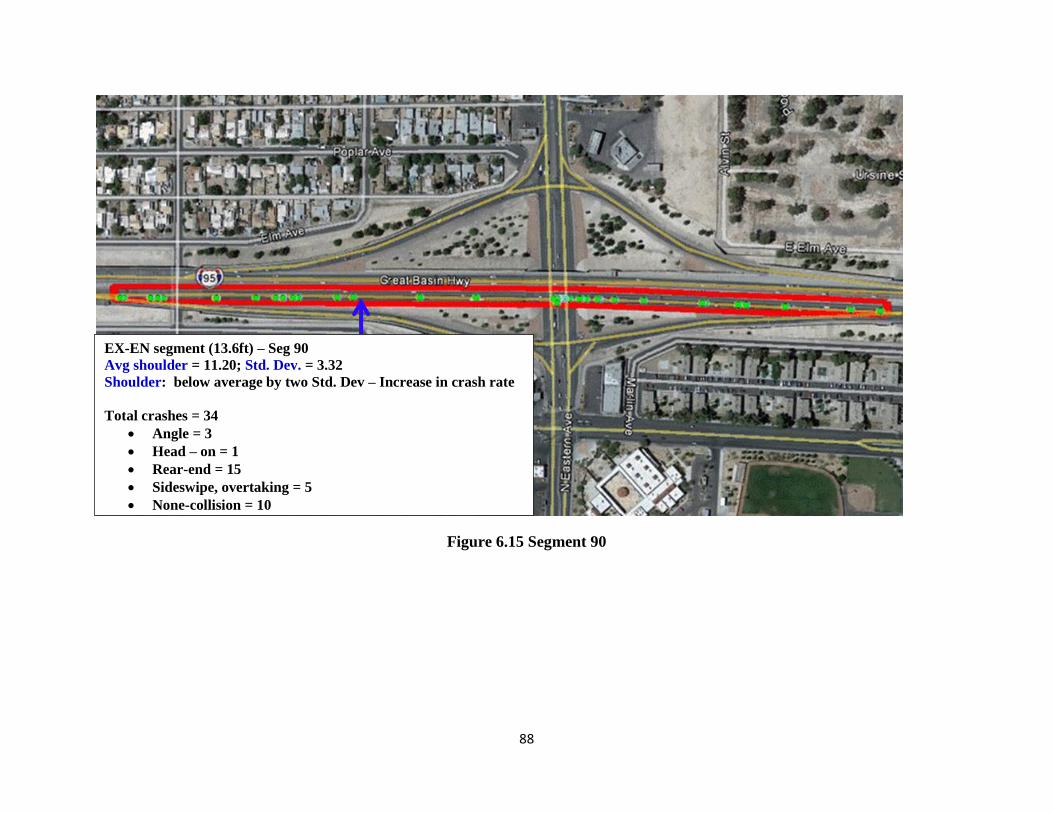
88
Figure 6.15 Segment 90
EX-EN segment (13.6ft) – Seg 90
Avg shoulder = 11.20; Std. Dev. = 3.32
Shoulder: below average by two Std. Dev – Increase in crash rate
Total crashes = 34
• Angle = 3
• Head – on = 1
• Rear-end = 15
• Sideswipe, overtaking = 5
• None-collision = 10

89
Segment 90
Segment 90 is at Eastern Ave. on southbound of US 95. The shoulder on this segment was
narrow. The modeling results imply that the narrow shoulder would have contributed to the
occurrence of the crashes on this segment. The crash data reveal that there were 15 rear-end
crashes and 10 non-collision out of 34 crashes. The data also show that there was more crashes
occurred when the pavement surface was wet and during peak hour period.
It was discussed in consulting with the design experts that traffic at this segment tended to drive
fast since there are more traveling lane than the segments upstream. At the same time, more
traffic moved out of the on-ramp which merged into the mainline and thus caused congestion.
This congestion would force traffic slow down and thus cause rear-end crashes. Ramp metering
on the ramp was suggested to regulate the traffic into the freeway. It has been noticed that there
are significant number of crashes that were non-collision. Efforts need to make to find the true
reasons for these crashes. Also, many crashes happened when it rained. Countermeasures to
prevent crashes in raining should be developed at this segment.

90
Figure 6.16 Segment 86
EN-EX segment @ City pkwy and Main st(8.5ft) – Seg 86
Avg shoulder = 10.94; Std. Dev. = 2.96
Shoulder: below average by two Std. Dev – Increase in crash rate
Total crashes = 19
• Angle = 4
• Rear-end = 9
• Sideswipe, overtaking = 2
• None-collision = 4
91
Segment 86
Segment 86 is the first segment after the spaghetti bowl on the southbound of US 95, ending at
the off-ramp to the Casino Center Blvd. The traffic from the west side of the spaghetti bowl goes
through this segment. These two traffic streams, one from the spaghetti bowl, and the other from
the west, are heavy and weave significantly at this segment. The traffic on the off ramp usually
cannot clear the ramp quickly, which make the queue on the ramp to spill back to freeway. Since
this segment is also relative short, the congestion from the off-ramp would move to the on-ramp.
These congesting conditions would cause rear-end crashes which comprise half of the 19 crashes
happened on this segment. This situation may have contributed more to the crash occurrence
than narrow shoulder does.
The design experts suggested that signage could be used to alert drivers of the congestion on this
segment, which could be a way to prevent crashes. More importantly, it was suggested to
redesign this section to separate the traffic streams that weave at this segment.
The identified countermeasures for these segments are listed in Table 6.5 and 6.6, and summary
is provided in the conclusion chapter.

92
Table 6.5 EN-EX Segments
Seg
# Location Countermeasures suggested
I-15
18 Northbound I-15 at Sahara Ave. Separating weaving movement spatially.
Neon project.
35 Northbound I-15 at Lamb Blvd Add additional lane if needed
I-215
34 Airport connector on the Eastbound I-215. Add lanes, build a flyer from the airport to
eastbound I-215
51 Westbound I-215 between Decatur Blvd
and Jones Blvd N/A
2 Gibson Rd. on Eastbound I-215 Ramp metering
13 Westbound I-215 between Valle Verde Dr.
and Green Valley Pkwy N/A
US 95
86 First segment after the spaghetti bowl on
southbound of US 95
Signage for congestion, redesign section
of spaghetti bowl to separate weaving
102 Russell Rd. on the southbound of US 95 Install signs to alert speeding to reduce
crash occurrence
98 Upstream before the Tropicana interchange
on the southbound of US 95
signal timing at the intersections at the
end of the off-ramp should be adjusted
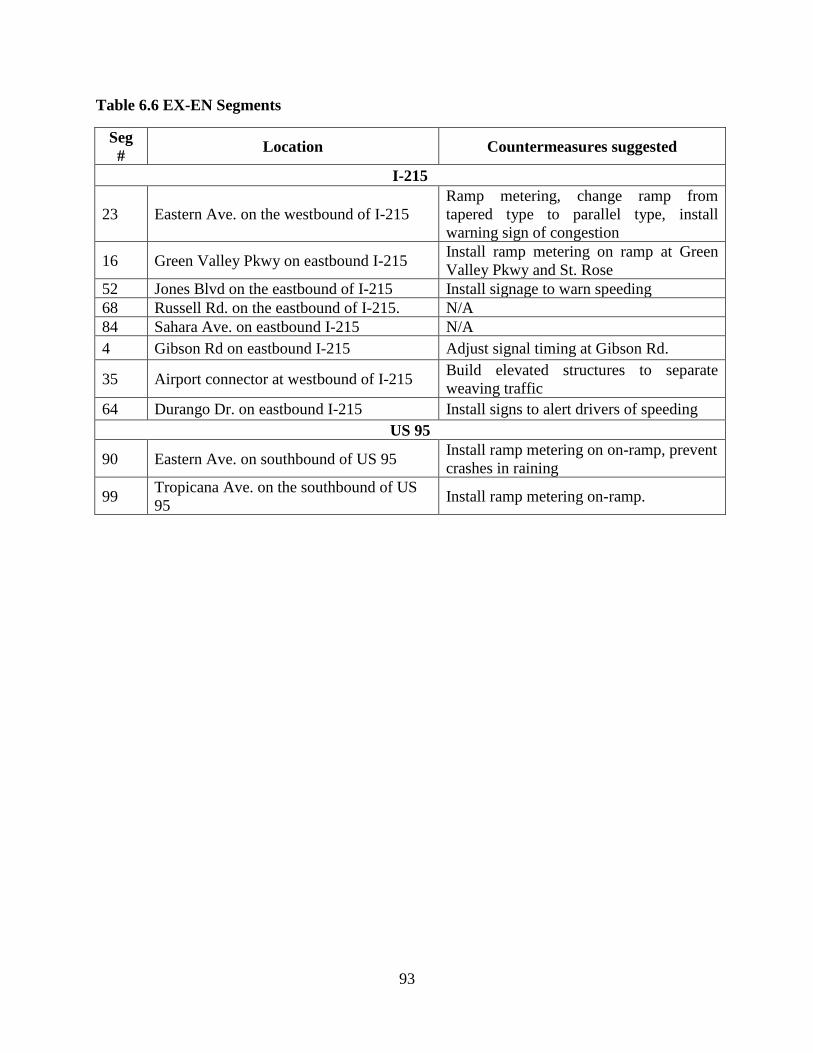
93
Table 6.6 EX-EN Segments
Seg
# Location Countermeasures suggested
I-215
23 Eastern Ave. on the westbound of I-215
Ramp metering, change ramp from
tapered type to parallel type, install
warning sign of congestion
16 Green Valley Pkwy on eastbound I-215 Install ramp metering on ramp at Green
Valley Pkwy and St. Rose
52 Jones Blvd on the eastbound of I-215 Install signage to warn speeding
68 Russell Rd. on the eastbound of I-215. N/A
84 Sahara Ave. on eastbound I-215 N/A
4 Gibson Rd on eastbound I-215 Adjust signal timing at Gibson Rd.
35 Airport connector at westbound of I-215 Build elevated structures to separate
weaving traffic
64 Durango Dr. on eastbound I-215 Install signs to alert drivers of speeding
US 95
90 Eastern Ave. on southbound of US 95 Install ramp metering on on-ramp, prevent
crashes in raining
99 Tropicana Ave. on the southbound of US
95 Install ramp metering on-ramp.
94
CHAPTER 7 CONCLUSIONS AND RECOMMENDATIONS
This study investigated the effect of primary geometric factors to the occurrence of crashes on
freeways in the Las Vegas metropolitan area in Southern Nevada. Multiple linear and probit
regression models were calibrated for crash rate and severity for two freeway segment types:
EN-EX and EX-EN. GIS and Google map tools were used in collecting crash, geometric and
other relevant data. Geometric variables used in this study included number of through lanes on
the main facility, length of segments, curve radius within the segments, medians, and shoulders.
Modeling results
Based on analyzing the results, it can be seen that the distinct characteristics of these two
segment types determine that they have different factors influencing crash rate and severity. In
general, the following observations on safety performance of EN-EX and EX-EN segments in
terms of geometric elements can be summarized below.
EN-EX Segments
The geometric factors influencing crash rate on EN-EX segments are number of lane, shoulder
and median width, segment length and curvature. Because I-15, I-215 and US 95 are different in
many aspects of geometric conditions, some of these factors are significant only on some of
these freeways, but not others. Among these five geometric factors, segment length and
curvature did not have any influence on crash severity. In other words, number of lane, shoulder
and median width determine crash rate and the severity, while segment length and curvature only
have influence on the rate to occur crashes, but not the severity of crash after they occurred.
EX-EN segments
Different from the case of EN-EX segments, among the five geometric factors, segment length
did not influence crash rate on EX-EN segments. Instead, AADT is the additional factor that
influences crash rate. These differences were caused by the distinct characteristics EX-EN
segment comparing with EX-EX segments: high traffic volume caused congestion to migrate
from EN-EX segments to EX-EN segments. Among the four geometric factors that influence
95
crash rate, only the number of lanes, shoulder and median width influenced both crash rate and
severity. Segment curve did not influence crash severity. Because of the unique characteristics of
I-15, I-215, and US 95, the impact patterns of these factors on crash rate and severity on
individual freeways are different.
Geometric problems and countermeasures
EN-EX segments usually appear before and after an EX-EN segment on a diamond interchange.
On an EN-EX segment, congestions usually occur in the following two situations.
First, weaving would happen between traffic streams on to freeway and that off from freeway.
Either of these two traffic stream become heavy, the freeway would become congested, which
need separating them spatially. The cases at the airport connector on the eastbound of I-215 and
the first segment after the spaghetti bowl on southbound of US 95 are examples for this situation.
When the traffic from the on-ramp is heavy, ramp metering can be installed, which is a way to
mitigate congestion and reduce crash on freeway. The segment after the Gibson interchange at
the southbound of I-215 is this situation.
Second, if the traffic on the off-ramp could not be clearly quickly, the queue would back up to
freeway and then make the freeway congested. In this case, signals at the end of the off-ramp
need to be adjusted to make the off-ramp traffic cleared on a timely manner. If this segment is
long, warning signs would be recommended to warn motorists of the congestion downstream.
The cases at the segment before Tropicana Ave. and the segment after Russell Rd. on the bound
of US 95 belong to this situation.
An EX-EN segment is usually at the middle of an interchange, one side for traffic getting off
freeway and the other side getting on freeway. The congestions usually occur in the follows two
situations.
First, the traffic on to freeway become heavy, making the merging on freeway congested, and
this congestion would quickly spill back to this segment. In this case, it is suggested to install
ramp metering. The cases at Eastern Ave. on the westbound of I-215, Green Valley Pkwy on

96
eastbound I-215, and Eastern Ave. and Tropicana Ave. on southbound of US 95 belong to this
case. When the traffic is extremely heavy, separating the traffic on to the freeway spatially from
that goes through the downstream segment is necessary. This is the case on the Airport connector
on the westbound of I-215. If this segment is long, warning signs are suggested to install on this
segment, alerting the motorists of the congestion downstream. This is the case for the segments
at Eastern Ave. on the westbound of I-215, and Jones Blvd and Durango Dr. on the eastbound of
I-215. It is particularly important to the segment at Eastern Ave. because the segment is on a
curve. It is important to the segments at Jones Blvd and Durango Dr. because the speeds before
traffic reach to these segments are high.
Second, if the traffic getting off the freeway become heavy, congestion on the off-ramp would
back up to the freeway, which would create traffic turbulences for traffic even after passing the
point of off ramp. This is the case for the segment at Gibson Rd. on the eastbound of I-215.
Future Study Needs
There are some observations that are worthwhile to be further investigated. First, the geometric
variable: number of through lanes, influence either the crash rate or severity differently among
these three freeways. It increased crash rate on I-15, decreased crash rate on I-215, and did not
show any significant impact on crash rate on US 95. This inconsistence needs to be investigated
in depth.
Second, the safety performance of EN-EX segments and EX-EN segments are highly correlated
because traffic congestion usually moved from one type of segments to another. Thus, the
modeling of crash rate or crash severity should consider these two types of segment jointly, not
in a manner to mix them up blandly, but in an pairing-up fashion. In other words, these two types
of segments around an interchange should be grouped in modeling for simultaneous
consideration.
Third, the crash data shows that significant number of crashes happened when the pavement was
wet, almost at any locations on the freeway. Investigation should be conducted to identify the
97
type of crashes happened when it was raining or snowing. Countermeasures to prevent crashes in
these weathers may need to be identified for implementation.
Fourth, significant number of non-collisions crashes happened. With this issue, it is very hard to
identify the cause of crashes, and then as a consequence, it is hard to develop countermeasures.
To fully uncover the causes of crashes, this study suggests recording the videos of crashes when
they happen. Technologically it is possible to record the crashes that happen in the view of
cameras that are installed on the freeway systems. It is also legally feasible for universities to
record such videos.
Fifth, the errors in the data collected in this study may influence the modeling results. Most of
the data including number of lane, lane width, shoulder width, median width, curve and grade are
collected using goolge map. It is recognized that the goolge map is projection of three dimension
image. The projection may distort the view of the road feature, which makes the measurements
based on vision observation of google map are not accurate. This issue makes it necessary to
develop a geometric database from which the measurements of such geometric features can be
extracted easily. It is perceived that developing such a uniform database is feasible. At the same
time, it is recognized that road geometric features on highway network changes every years and
the changes can happen at different times. Capturing such changes is challenging. In addition,
extracting geometric features from as-built design file is tedious.
Six, the impact of geometric features on crashes can also be recognized from the profile of
freeways and crashes happened. For example, the median and shoulder on I-215 are wide, which
may tend to encourage speeding, one of primary causes of crashes. The curves on the EX-EN
segment at Eastern Ave. on westbound of I-215 and the EX-EN segment at Durango Dr. on the
eastbound of I-215 are obviously have certain influence on the crashes happened on these
segments. The length of segments at Gibson Rd. on eastbound of I-215, the segments at Jones
Blvd on eastbound of I-215 seemingly contributed to the occurrence of crashes. The critical issue
is how to code and measure the curves and present them in modeling.
98
Seven, it is important to include traffic flow and capacity of the ramps at the two ends of a
segment, whether they are EX-EN or EN-EX type. It is because that they determine the extent of
weaving in one segment and the one next to it.
Eight, it is important to include the pattern of traffic flow on a segment to show its impact to
crashes. AADT is an average value that cannot reflect the fluctuation of traffic. Intuitively, it is
the fluctuation of the flow in the peak and no-peak time periods that is directly relevant to the
occurrence of crashes. The FAST data may contain certain errors that made it hard to include
them in the modeling. Thus, it is important to improve the traffic data quality for modeling
safety.
Nine, the approach to identify the geometric problems of freeways may need to be improved.
There are a few segments that have high number of crashes happened, but they are not included
in pool of segments identified through the modeling approach. It might be due to the fact that the
factors that influence the occurrence of crashes on these segments are not part of the variables
considered in the modeling. Looking into these segments missing in the pool can help to identify
additional factors influence crash occurrence.
99
REFERENCES
AASHTO. (2004). A Policy on Geometric Design of Highway and Streets, Fifth Edition. Washington, D.C:
AASHTO.
AASHTO. (2010). Highway Safety Manual, 1st ed. Washington: American Association of State Highway
and Transportation Officials (AASHTO).
Agrest, A. (2002). Categorical Data Analysis, 2nd ed. Hoboken: John Wiley & Sons, Inc.,.
American Association of State Highway and Transportation Officials. (2004). A Policy on Geometric
Design of Highways and Streets. Washington, D.C: AASHTO.
Awuah-Baffour, R., et al., (1997). Global positioning system with an attitude: Method for collecting
roadway grade and superelevation data. Transportation Research Record.
Barnett, A. G., et al. (2008). An Introduction to Generalized Linear Models, 3rd ed. Boca Raton: Chapman
& Hall/CRC.
Cameron, A. C., et al., (1998). Regression Analysis of Count Data. Press Syndicate of the University of
Cambridge.
Chang, L. (2005). Analysis of freeway accident frequencies: Negative binomial regression versus artificial
neural network. Safety Science , 541–557.
Chen, H., et al., (2009). Evaluating the safety impacts of the number and arrangement of lanes on
freeway exit ramps. Accident Analysis and Prevention, 543–551.
Chen, H., et al., (2011). Safety performance evaluation of left-side off-ramps at freeway diverge areas.
Accident Analysis and Prevention, 605-612.
Cirillo, A. J. (1971). The Relationship of Accidents to length of speed-change lanes and Weaving Area on
Interstate Highway. Highway Research Record, 312.
Dobson, A. J., et al., (2008). An Introduction to Generalized Linear Models. NY: Taylor & Francis Group,
LLC.
Faraway, J. J. (2006). Extending the Linear Model with R: Generalized Linear, Mixed Effects and
Nonparametric Regression Models. Boca Raton: Chapman & Hall/CRC.
FHWA. (1993). The Association Of Median Width And Highway Accident Rate, FHWA-RD-93-046. U.S
DOT.
FHWA. (1998). Synthesis of Human Factors Research on Older Drivers and Highway Safety. U.S
Department of Transportation.

100
Fitzpatrick, K., et al., (2006). Opearation and Safety of Right - Turn lanes Designs. Transportation
Research Board.
Golob, T. F., et al., (2004). Safety aspects of freeway weaving sections. Transportation Research Part A
38, 35–51.
Green, W. H. (1997). Econometric Analysis, 3rd edition. Printice - Hall, Inc.
Hakkert, A. S. (1998). Consideration of Bollard Treatment at exit Gore areas. Transportation Research
Board, 133-139.
HCM2010. (2010). Highway Capacity Manual Volume 2: Uninterrupted flow. Washington, D.C:
Transportation Research Board.
Hilbe, M. J. (2011). Negative Binomial Regression, second edition. Cambridge University Press.
Hoffmann, J. P. (2004). Generalized Linear Models: An Applied Approach. Pearson Education, In.
KITTELSON & ASSOCIATES, I. (2011). Guidelines for Ramp and Interchange spacing. Washington, D.C:
Transportation Research Board.
Leisch, J. P. (1993). Operational considerations for Systems of Interchanges". Transportation Research
Record, 106-111.
Lundy, A. R. (1967). The Effect of Ramp Type and Geometry on Accidents. Highway Research Record,
163, 80-117.
Lunenfeld, H. (1993). Human factors Associated with Interchange Design features. Transportation
Research Record, 1385.
McCullagh, P., et al., (1983). Generalized Linear Models, 2nd ed. Chapman and Hall.
McCulloch, C. E., et al., (2008). Generalized, Linear, and Mixed Models, 2nd ed. Hoboken: John Wiley &
Sons, Inc.,.
Mullins, B., et al., (1961). Freeway Traffic Accident Analysis and Safety Study. Highway Research Board
Bulletin, 291.
Navid, W. (2008). Statistics for Engineers and Scientists. Mc Graw Hill companies.
Poch , M., et al., (1996). Negative Binomial Analysis of Intersection - Accident Frequencies. Journal of
Transportation Engineering, Vol 122, No.2, Paper No. 10216.
Poch, M., et al., (2007). NEGATIVE BINOMIAL ANALYSIS OF INTERSECTION-AcCIDENT FREQUENCIES.
Journal of Transportation Engineering, 10216, Vol. 122, No.2.
Qi, Y., et al.,(2007). Freeway Accident likelihood Prediction using a Panel Data Analysis Approach.
Journal of Transportation Engineering, 149-156.
101
Roess, et al., (2011). Traffic Engineering, Fourth Edition. Prentice Hall.
Sarhan, M., et al., (2008). Safety performance of freeway sections and relation to length of speed-
change lanes. NRC Research Press, 531-541.
TRB. (2010). Highway Capacity Manual, Volume 2: Uninterrupted flow. Washington: Transportation
Research Board.
Washington, et al., (2011). Statistical and Econometric Methods for Transportation Data Analysis, second
edition. Taylor & Francis Group.
Winkelmann, R. (2008). Econometric Analysis of Count Data, 5th edition. Springer - Verlag Berlin
Heidelberg.
Wooldridge, (2009). Introductory econometrics: A modern approach. Mason: South-Western Cengage
Learning.
Ye, F., et al (2013). Comparing Three Commonly Used Crash Severity Models on Sample Size
Requirements: Multinomial Logit, Ordered Probit and Mixed Logit Models.
https://ceprofs.civil.tamu.edu/ Accessed May, 2013

Nevada Department of Transportation
Rudy Malfabon, P.E. Director
Ken Chambers, Research Division Chief
(775) 888-7220
1263 South Stewart Street
Carson City, Nevada 89712