Evaluation of Fly Ash in lean Portland Cement Concrete...
92
Evaluation of Fly Ash in lean Portland Cement Concrete Base "Econocrete" Project No. MLR-85-3 & MLR-86-1 Highway Division August 1986 ----- Iowa Department ----- of Transportation
Transcript of Evaluation of Fly Ash in lean Portland Cement Concrete...
Evaluation of Fly Ashin
lean Portland Cement Concrete Base
"Econocrete"
Project No. MLR-85-3& MLR-86-1
Highway DivisionAugust 1986
-----~t& Iowa Department----- ~'l of Transportation

Disclaimer
The Contents of this report reflect theviews of the author who is responsiblefor the facts and the accuracy of thedata presented herein. The contents donot necessarily reflect the officialviews or policies of the Iowa Departmentof Transportation. This report does notconstitute a standard, specification orregulation.

Evaluation of Fly Ashin
Lean Portland Cement Concrete BaseEconocrete
Project No. MLR-86-l
BySam G. Moussalli
Cement and Concrete Engineer
Office of MaterialsIowa Department of Transportation
August 1986

PAGE ii
TABLE OF CONTENTS
Page
Abstract ..•.•
Introduction.
.. .. .. .. .. .. .. .. .. .. .. .. .. .. .. .. .. .. .. .. .. .. .. .. .. .. .. .. .. .. .. .. .. .. .. .. .. .. .. .. .. .. .. .. .. .. .. ..
.......................... II ..
1
2
Objective. ...................................................................................................... 2
Scope .. .. .. .. .. .. .. .. .. .. .. .. .. .. .. .. .. .. .. .. .. .. .. .. .. .. .. .. .. .. .. .. .. .. .. .. .. .. .. .. 3
Laboratory Procedures • .. .. .. .. .. .. .. .. .. .. .. .. .. .. .. .. .. .. .. .. .. .. .. .. .. .. .. .. II .. 4
Fly Ash Substitution Rates.Aggregate Gradation.Econocrete Controls.Testing .
Materials .Mixes .. .. .. .. .. .. .. .. .. .. ..
457778
Test Results and Interpretation. 10
Compressive Strength & Durability.Setting Time of Fly Ash Econocrete.
1011
Test Results & Discussion . 31
Conclusion ••••.
Recommendation •
.. .. .. .. .. .. .. .. .. .. .. .. .. .. .. .. .. .. .. .. .. .. .. .. .. .. .. .. .. .. .. .. .. .. .. .. .. .. .. .. .. .. .. .. .. ..
.. .. .. .. .. .. .. .. .. .. .. .. .. .. .. .. .. .. .. .. .. .. .. .. .. .. .. .. .. .. .. .. .. to ..
32
32
Re ference s ..••
AppendixAppendix
.. .. .. .. .. .. .. .. .. .. .. .. .. .. .. .. .. .. .. .. .. .. .. .. .. .. .. .. .. .. .. .. .. .. .. .. .. .. .. .. .. .. .. .. .. .. ..
A.B.
34
3538

PAGE 1
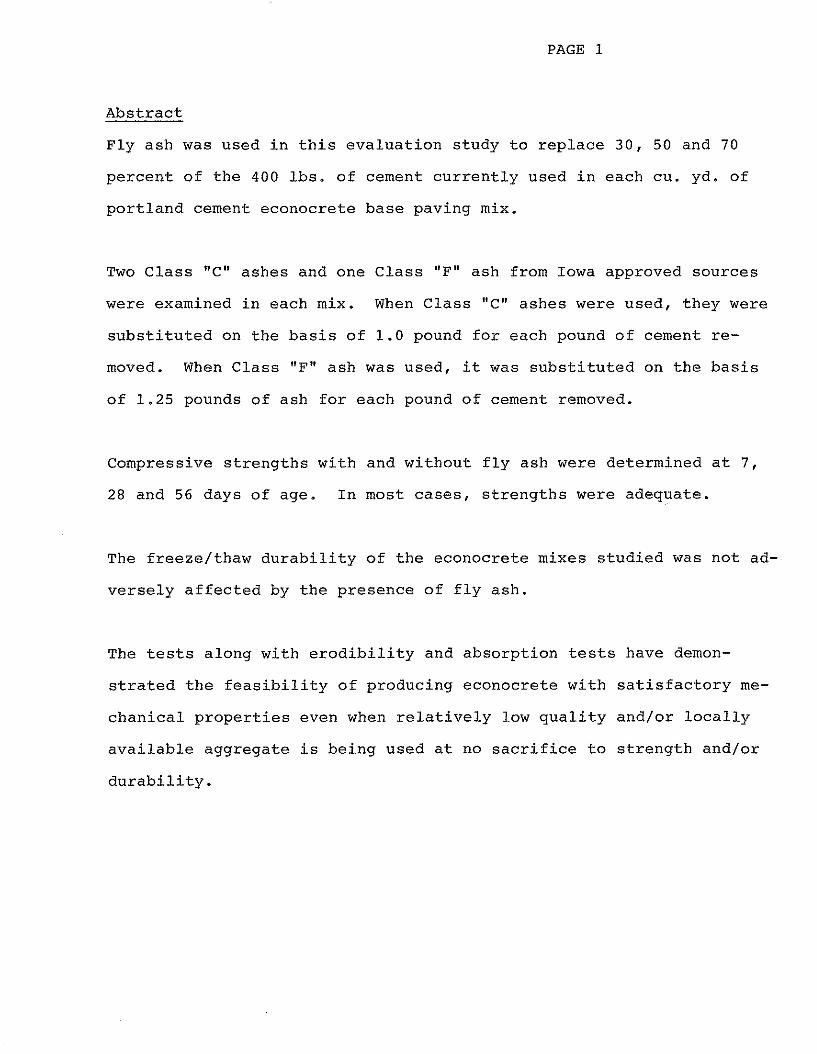
Abstract
Fly ash was used in this evaluation study to replace 30, 50 and 70
percent of the 400 1bs. of cement currently used in each cu. yd. of
portland cement econocrete base paving mix.
Two Class "c" ashes and one Class "F" ash from Iowa approved sources
were examined in each mix. When Class "c" ashes were used, they were
substituted on the basis of 1.0 pound for each pound of cement re
moved. When Class "F" ash was used, it was substituted on the basis
of 1.25 pounds of ash for each pound of cement removed.
Compressive strengths with and without fly ash were determined at 7,
28 and 56 days of age. In most cases, strengths were adequate.
The freeze/thaw durability of the econocrete mixes studied was not ad
versely affected by the presence of fly ash.
The tests along with erodibility and absorption tests have demon
strated the feasibility of producing econocrete with satisfactory me
chanical properties even when relatively low quality and/or locally
available aggregate is being used at no sacrifice to strength and/or
durability.

PAGE 2
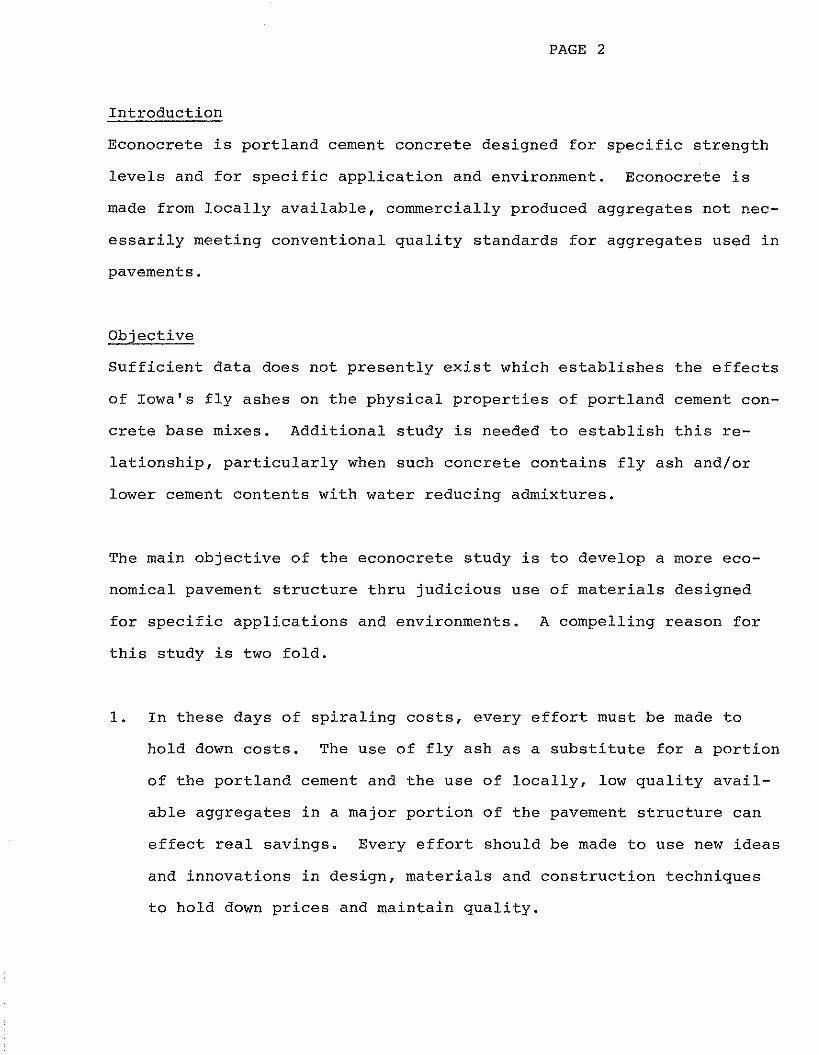
Introduction
Econocrete is portland cement concrete designed for specific strength
levels and for specific application and environment. Econocrete is
made from locally available, commercially produced aggregates not nec
essarily meeting conventional quality standards for aggregates used in
pavements.
Objective
Sufficient data does not presently exist which establishes the effects
of Iowa's fly ashes on the physical properties of portland cement con
crete base mixes. Additional study is needed to establish this re
lationship, particularly when such concrete contains fly ash and/or
lower cement contents with water reducing admixtures.
The main objective of the econocrete study is to develop a more eco
nomical pavement structure thru judicious use of materials designed
for specific applications and environments. A compelling reason for
this study is two fold.
1. In these days of spiraling costs, every effort must be made to
hold down costs. The use of fly ash as a substitute for a portion
of the portland cement and the use of locally, low quality avail
able aggregates in a major portion of the pavement structure can
effect real savings. Every effort should be made to use new ideas
and innovations in design, materials and construction techniques
to hold down prices and maintain quality.

PAGE 3
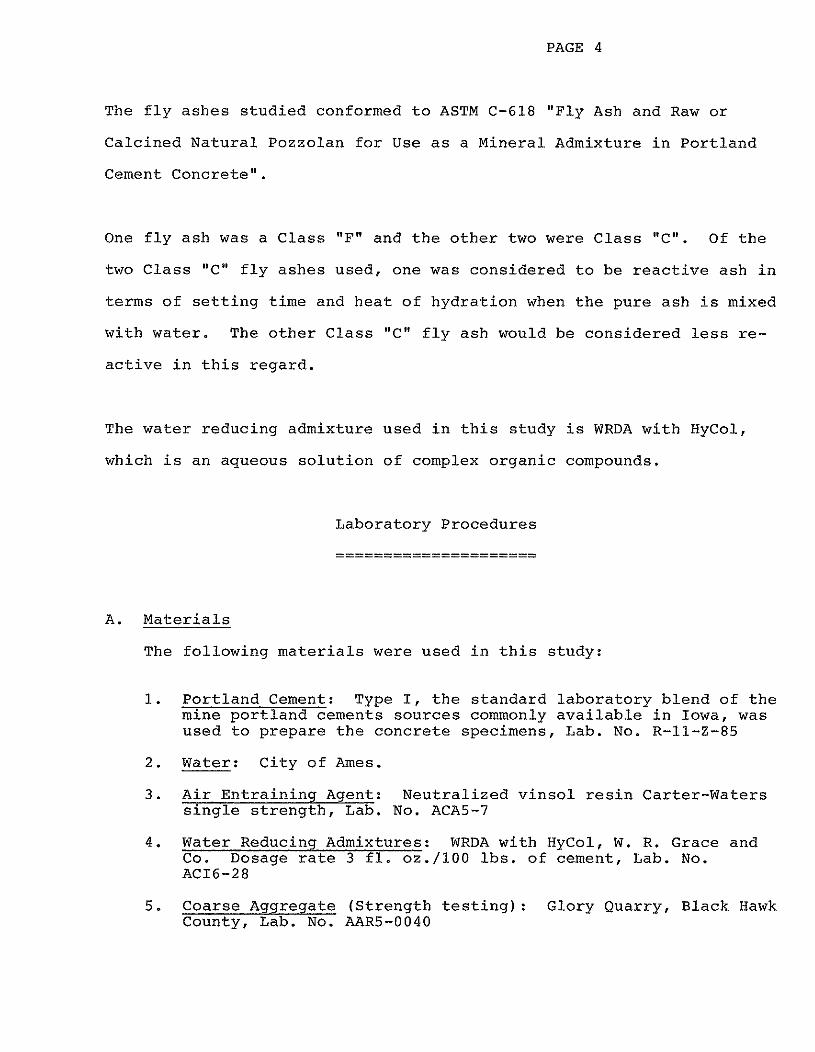
2. Many existing sources of good quality coarse aggregates are becom
ing depleted or becoming unavailable because of economic reasons
such as hauling, restrictive zoning, pollution control and rising
land values. Large quanti·ties of aggregates have been discarded
or rejected for use in the present or in the past due to restric
tive specification requirements or other reasons. Much of this
material can and should be used. When these aggregates are re
stricted to lower depth' in the composite structure, their former
defects become acceptable.
In summary, the purpose of using econocrete in subbases is to provide
a uniform, stable and permanent support for concrete pavement. Other
functions of econocrete in subbases are to reduce or eliminate joint
faulting, increase the subgrade support (K), prevent pumping of fine
grained soils and provide a working platform for construction equip
ment.
Scope
This study examines the effect on compressive strength, durability,
erodibility and absorption from the substitution of fly ash for cement
or reducing the cement contents in the econocrete class mix.
The econocrete mix has a cement factor of 400 pounds per cubic yard
and was studied in combination with three fly ashes currently used in
Iowa.

PAGE 4
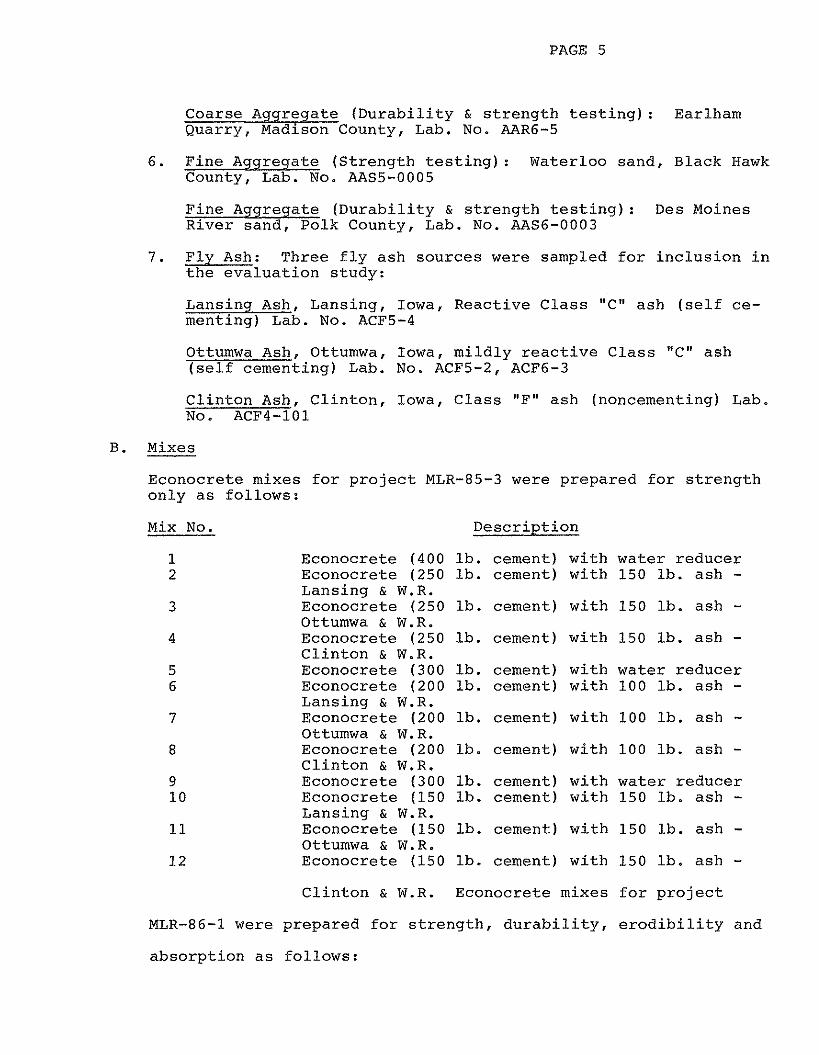
The fly ashes studied conformed to ASTM C-618 "Fly Ash and Raw or
Calcined Natural Pozzolan for Use as a Mineral Admixture in Portland
Cement Concrete".
One fly ash was a Class "F" and the other two were Class "C". Of the
two Class "c" fly ashes used, one was considered to be reactive ash in
terms of setting time and heat of hydration when the pure ash is mixed
with water. The other Class "c" fly ash would be considered less re-
active in this regard.
The water reducing admixture used in this study is WRDA with HyCol,
which is an aqueous solution of complex organic compounds.
Laboratory Procedures
=====================
A. Materials
The following materials were used in this study:
1. Portland Cement: Type I, the standard laboratory blend of themine portland cements sources commonly available in Iowa, wasused to prepare the concrete specimens, Lab. No. R-11-Z-85
2. Water: City of Ames.
3. Air Entraining Agent: Neutralized vinsol resin Carter-Waterssingle strength, Lab. No. ACA5-7
4. Water Reducing Admixtures: WRDA with HyCol, W. R. Grace andCo. Dosage rate 3 fl. oz./100 lbs. of cement, Lab. No.ACI6-28
5. Coarse Aggregate (Strength testing): Glory Quarry, Black HawkCounty, Lab. No. AAR5-0040

PAGE S
Coarse Aggregate (Durability & strength testing): EarlhamQuarry, Madison County, Lab. No. AAR6-S
6. Pine Aggregate (Strength testing): waterloo sand, Black HawkCounty, Lab. No. AASS-OOOS
Pine Aggregate (Durability & strength testing): Des MoinesRiver sand, Polk County, Lab. No. AAS6-0003
7. Ply Ash: Three fly ash sources were sampled for inclusion inthe evaluation study:
Lansing Ash, Lansing, Iowa, Reactive Class "c" ash (self cementing) Lab. No. ACPS-4
Ottumwa Ash, Ottumwa, Iowa, mildly reactive Class "c" ash(self cementing) Lab. No. ACPS-2, ACP6-3
Clinton Ash, Clinton, Iowa, Class "P" ash (noncementing) Lab.No. ACP4-101
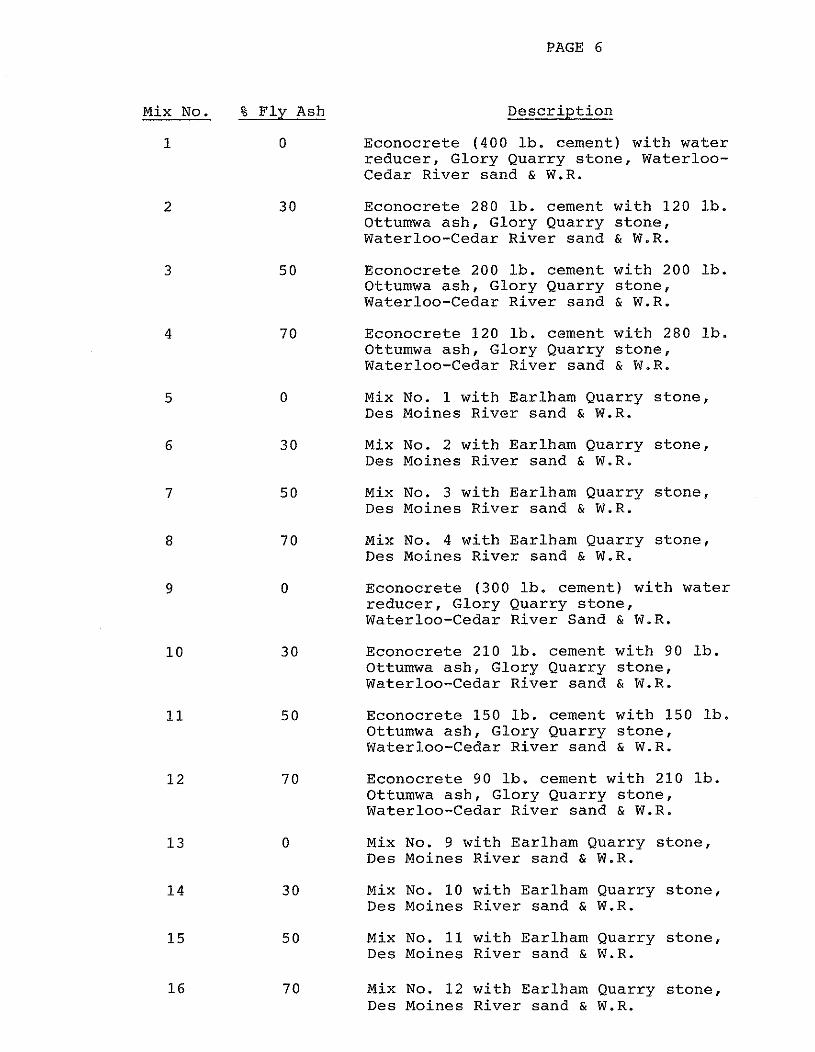
B. Mixes
Econocrete mixes for project MLR-8S-3 were prepared for strengthonly as follows:
Mix No. Description
1 Econocrete (400 lb. cement) with water reducer2 Econocrete (2S0 lb. cement) with lS0 lb. ash -
Lansing & W.R.3 Econocrete (2S0 lb. cement) with lS0 lb. ash -
Ottumwa & W.R.4 Econocrete (2S0 lb. cement) with lS0 lb. ash -
Clinton & W.R.S Econocrete (300 lb. cement) with water reducer6 Econocrete (200 lb. cement) with 100 lb. ash -
Lansing & W.R.7 Econocrete (200 lb. cement) with 100 lb. ash -
Ottumwa & W.R.8 Econocrete (200 lb. cement) with 100 lb. ash -
Clinton & W.R.9 Econocrete (300 lb. cement) with water reducer10 Econocrete (lS0 lb. cement) with lS0 lb. ash -
Lansing & W.R.11 Econocrete (lS0 lb. cement) with lS0 lb. ash -
Ottumwa & W.R.12 Econocrete (1S0 lb. cement) with lS0 lb. ash -
Clinton & W.R. Econocrete mixes for project
MLR-86-1 were prepared for strength, durability, erodibility and
absorption as follows:

Mix No.
1
2
3
4
5
6
7
8
9
10
11
12
13
14
15
16
% Fly Ash
o
30
50
70
o
30
50
70
o
30
50
70
o
30
50
70
PAGE 6
Description
Econocrete (400 lb. cement) with waterreducer, Glory Quarry stone, WaterlooCedar River sand & W.R.
Econocrete 280 lb. cement with 120 lb.Ottumwa ash, Glory Quarry stone,Waterloo-Cedar River sand & W.R.
Econocrete 200 lb. cement with 200 lb.Ottumwa ash, Glory Quarry stone,Waterloo-Cedar River sand & W.R.
Econocrete 120 lb. cement with 280 lb.Ottumwa ash, Glory Quarry stone,Waterloo-Cedar River sand & W.R.
Mix No. 1 with Earlham Quarry stone,Des Moines River sand & W.R.
Mix No. 2 with Earlham Quarry stone,Des Moines River sand & W.R.
Mix No. 3 with Earlham Quarry stone,Des Moines River sand & W.R.
Mix No. 4 with Earlham Quarry stone,Des Moines River sand & W.R.
Econocrete (300 lb. cement) with waterreducer, Glory Quarry stone,Waterloo-Cedar River Sand & W.R.
Econocrete 210 lb. cement with 90 lb.Ottumwa ash, Glory Quarry stone,Waterloo-Cedar River sand & W.R.
Econocrete 150 lb. cement with 150 lb.Ottumwa ash, Glory Quarry stone,Waterloo-Cedar River sand & W.R.
Econocrete 90 lb. cement with 210 lb.Ottumwa ash, Glory Quarry stone,Waterloo-Cedar River sand & W.R.
Mix No. 9 with Earlham Quarry stone,Des Moines River sand & W.R.
Mix No. 10 with Earlham Quarry stone,Des Moines River sand & W.R.
Mix No. 11 with Earlham Quarry stone,Des Moines River sand & W.R.
Mix No. 12 with Earlham Quarry stone,Des Moines River sand & W.R.

PAGE 7
C. Fly Ash Substitution Rates:
Fly ash was substituted for 30, 50 and 70%, by weight of the
portland cement in all cases. The substitution of Class "c" fly
ash was on a pound-for-pound basis. When Class "F" fly ash was
substituted, it was on the basis of adding 1.25 pounds of fly ash
for each pound of cement removed. The change in absolute volumes
due to the fly ash substitution, was applied to each aggregate in
its proper ratio. For the econocrete mix, in this evaluation
study, the volumes are 60% coarse aggregate and 40% fine aggre-
gate.
D. Aggregate Gradation:
The combined aggregate gradation was:
Sieve No.
3/4"1/2"3/8"No. 4No. 8No. 16No. 30No. 50No. 100No. 200
E. Econocrete Controls:
% Passing
100907758483827115.75.0
Econocrete mixes were controlled to a slump of 2.0" ± 1/2" and air
content of 6.5% ± 0.5%.

PAGE 8
F. Testing:
The investigation of the effects of aggregate and fly ash sources
on econocrete strength and durability was accomplished by prepar
ing test specimens in the laboratory. These specimens were made
from an econocrete mixes with a cement content of 400 and 300
Ib./yd. 3 • The variables in the mixes were aggregate source, fly
ash source, the substitution ratios (pounds of fly ash added for
each pound of portland cement removed).
The actual procedure, as to preparation and mixing of the ingredi
ents, was as outlined in ASTM C-192 1/ "Making and Curing Concrete
Test Specimens in the Laboratory".
The testing of the compressive test specimens was done in accord
ance with Iowa Test Method 403 ~J "Method of Test for Compressive
Strength of Molded Concrete Cylinders" (see Appendix A). This is
a test similar to AASHTO test Procedure T-22 1/. Total of nine
41"x9" horizontal cylinders were cast from each batch of
econocrete. Three cylinders were tested in compression at each
age of 7, 28 and 56 days. All specimens received standard moist
room curing.
The determination of the durability factor of the econocrete con
taining the various ashes was done in accordance with Iowa Test
Method 408A ~/ "Method of Test for Determining the Resistance of
Concrete to Rapid Freezing and Thawing" (see Appendix B). This
test is a modification of ASTM C-666 Procedure B 1/ in that the

PAGE 9
4"x4" concrete beams are 18" in length rather than 11" to 16" and
90-day moist room cure is substituted for the 14-day lime water
cure.
A total of three 4"x4"x18" beams were cast from each batch pre
pared for the durability testing. The beams were cured for 90
days in the moisture room.
Upon completion of the appropriate curing period, the beams were
subjected to cyclic freezing and thawing. Periodic sonic modulus
and change in length readings taken twice a week. This was con
tinued until the beams had undergone 300 cycles of freezing and
thawing or until the specimens' relative dynamic modulus of
elasticity reached 60% of the initial modulus, whichever occurs
first.
The coarse aggregates used in the econocrete currently are ap
proved as Class A crushed stone, which is that specified for use
in econocrete.
The erodibility testing of the econocrete was determined by the
water pressure method. The specimens were subjected to 1500 psi
water pressure from a spray nozzle situated 12 inches perpendic
ular from the face of a 4"x4"x18" beam. The stream of water pres
sure was spread on each beam for a period of 30 minutes, with a
periodic measurements of the depth of erosion taken at 15 and 30
minute intervals.

PAGE 10
The absorption test was accomplished by placing the test specimens
in an oven to a constant weight and then they were placed in water
at room temperature and soaked three days to full saturation.
Test Results and Interpretation
===============================
Compressive Strength & Durability
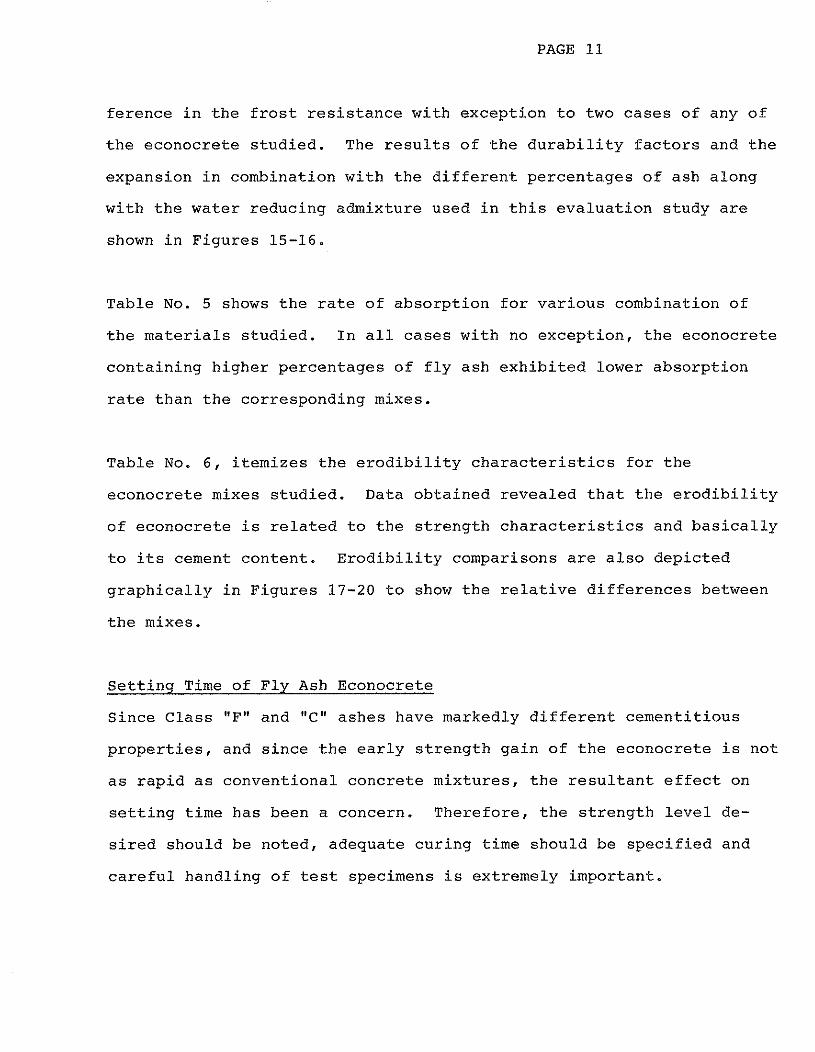
Table No. 1 shows the physical characteristics of the aggregate qual
ity testing, while Table No.2 & 3 show the econocrete mix character
istics and compressive strength test results. The strength values for
various combinations of materials are graphically presented in Figure
1-7. Each strength value indicated is the average of three cylinders.
In most cases, with few exceptions, the econocrete containing fly ash
exhibited equivalent compressive strengths with the corresponding con
trol econocrete mixes without the fly ash. The exceptions where the
compressive strengths were somewhat lower were the 7, 28 and 56 days
of the mixes containing the Class "F" ash from Clinton. In summary,
acceptable and adequate econocrete strengths can be produced using ei
ther Class "c" or "F" ash provided the proper substitution ratio and
percent replacement is used.
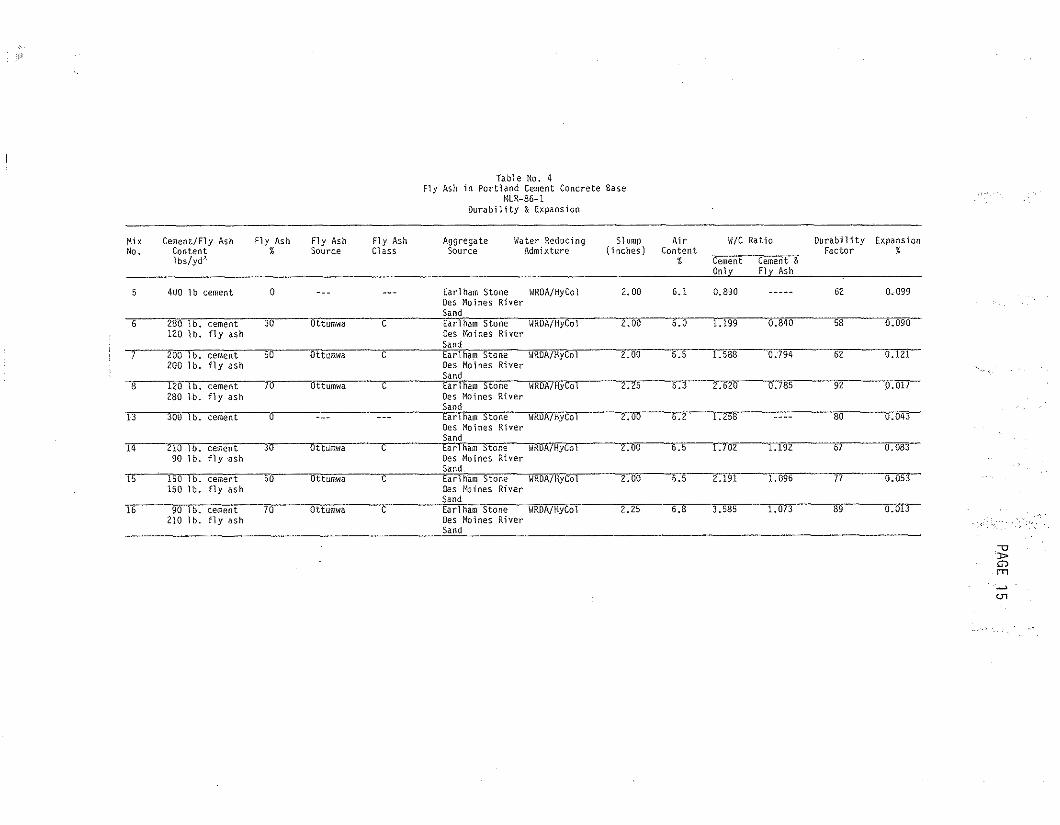
Table No. 4 itemized the freeze/thaw durability characteristics for
the econocrete studied. Earlham, coarse aggregate and Des Moines
River sand were used in the durability study. They were used with 400
lb. and 300 lb. cement per cubic yard. There was no significant dif-

PAGE 11
ference in the frost resistance with exception to two cases of any of
the econocrete studied. The results of the durability factors and the
expansion in combination with the different percentages of ash along
with the water reducing admixture used in this evaluation study are
shown in Figures 15-16.
Table No. 5 shows the rate of absorption for various combination of
the materials studied. In all cases with no exception, the econocrete
containing higher percentages of fly ash exhibited lower absorption
rate than the corresponding mixes.
Table No.6, itemizes the erodibility characteristics for the
econocrete mixes studied. Data obtained revealed that the erodibility
of econocrete is related to the strength characteristics and basically
to its cement content. Erodibility comparisons are also depicted
graphically in Figures 17-20 to show the relative differences between
the mixes.
Setting Time of Fly Ash Econocrete
Since Class "F" and "c" ashes have markedly different cementitious
properties, and since the early strength gain of the econocrete is not
as rapid as conventional concrete mixtures, the resultant effect on
setting time has been a concern. Therefore, the st r enqt.h level de
sired should be noted, adequate curing time should be specified and
careful handling of test specimens is extremely important.

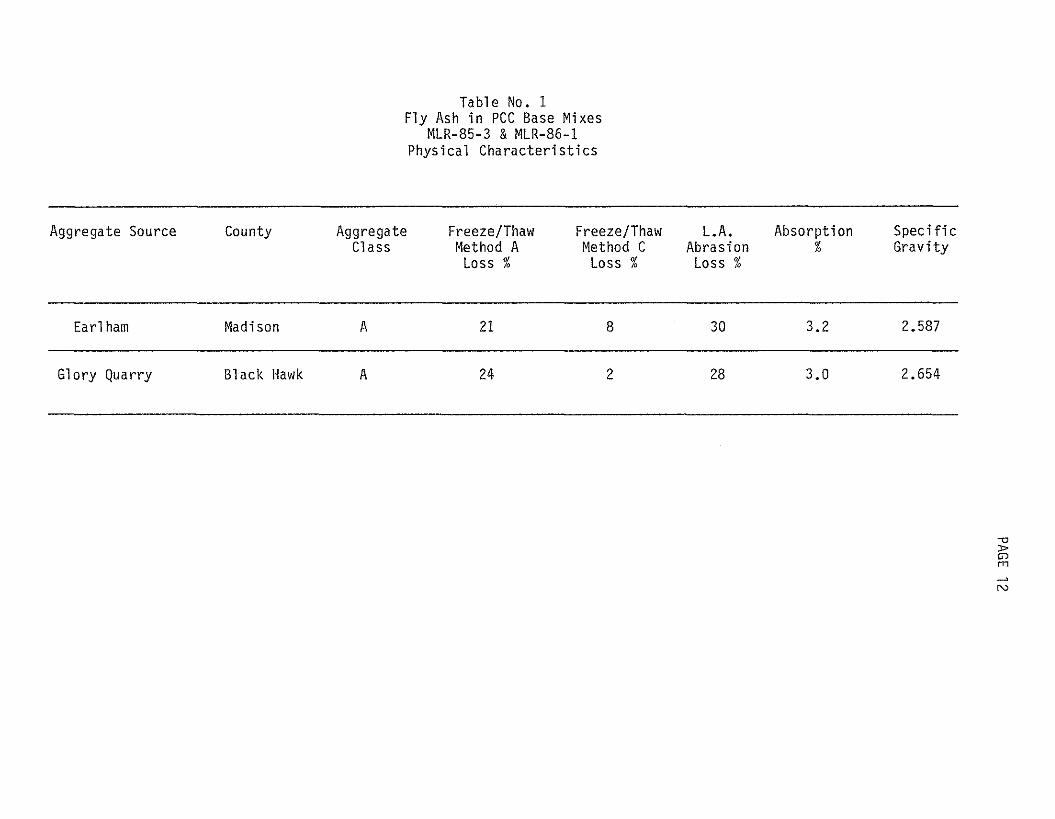
Table No.1Fly Ash in PCC Base Mixes
MLR-85-3 &MLR-86-1Physical Characteristics
Aggregate Source
Earlham
Glory Quarry
County
Madison
Black Hawk
AggregateClass
A
A
Freeze/ThawMethod ALoss %
21
24
Freeze/ThawMethod C
Loss %
8
2
L.A.AbrasionLoss %
30
28
Absorption%
3.2
3.0
Specifi cGravity
2.587
2.654
-0'>G)rn~
N

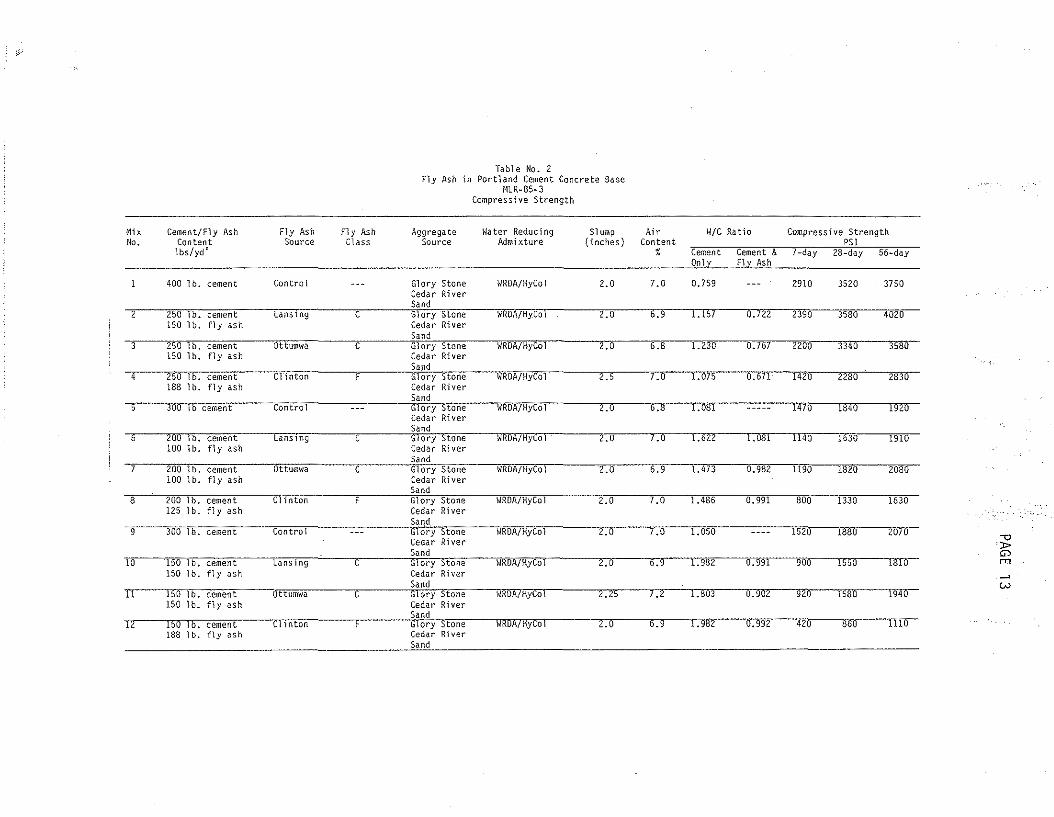
Table No.2Fly Ash in Portland Cement Concrete Base
f4LR-85-3Compressive Strength
14ixNo.
Cement/Fly AshContentlbs/yd'
Fly AshSource
fly AshClass
AggregateSource
\4ater ReducingAdmixture
Slump(inches)
AirContent
%
W/C Ratio Compressive StrengthPSI
Cement Cement & 7-day 28-day 56-dayOnly fly Ash
Ottumwa C Glory Stone HROA/HyCOI 2.25 1.2 l.stl3--------iJ:-90T-----n -'9'2Q 1580 1940Cedar RiverSand
6 ZUU lb. Cement LansTng-- C Glory Stone WROA/HyCol 2.0 1.0 1.622 1.081100 lb. fly ash Cedar River
Sand
11 150 lb. cement150 lb. fly ash
C Glory Stone WRD~A/HiCoi- 2.0 6.9 1. 41J----b.982--rf9'0 1820Cedar RiverSand
~
W
-0'»GOen
2bai:r
1920
I'3T6
2830
1030
3750
3"5130
4020
3520
1636
3580
r@D
11if(J
1330800
2390
1140
2910
2-Zo0
1520
0.767
0.991
O~T2Zl.lS)
r.-ZT6
0.759
1.486
I:OSo
7.0 1.075 0.671 142'0 2280
7.0
T.O
b.9
7.0
'-:-8
2.0
2.0
2:0
2.0 6.9 1.982 0.991 900 1550 1810
D
-2'~-0
2:0
WROA/HyCoT 2.0 6.8 1.081 ----- 1470 1840
WRDA/HyCol
WRDA/HyCol
WROA/HyCol
WRDA/HyCol
WROA/HyCol
WROA/Hyfol
w~1i-;\7Hyto-lGlory StoneCedar Ri verSand
Glory StoneCedar RiverSandGlory StoneCedar RiverSand
GloryStoneCedar RiverSandGloryStoneCedar RiverSand
GloryStoneCedar RiverSand
c
c
c
liT(lry StoneCedar RiverSand
~~- Glory StoneCedar RiverSand
Lansing
Ottumwa
Control
Clinton
Control
Contra1
CHnton
Lansing
-cittumwa
400 1b. cement
Jotr-T& -c"emenf
-250 1b. cement188 1b. fly ash
250 1b. cement150 1b. fly ash
300 lb. cement
150 1b. cement150 lb. fly ash
200 lb. cement125 lb. fly ash
-200---Yb. cement100 1b. fly ash
-t5tr 1b. cement150 1b. fly ash
7
9
4
j
8
fIT
12 150 lb. cement chnton F Glory stone WRDA/HyCOI 2.0 6.9 L'98'l il:'9'92 420---13"6-0 1110188 1b. fly ash Cedar River
Sand

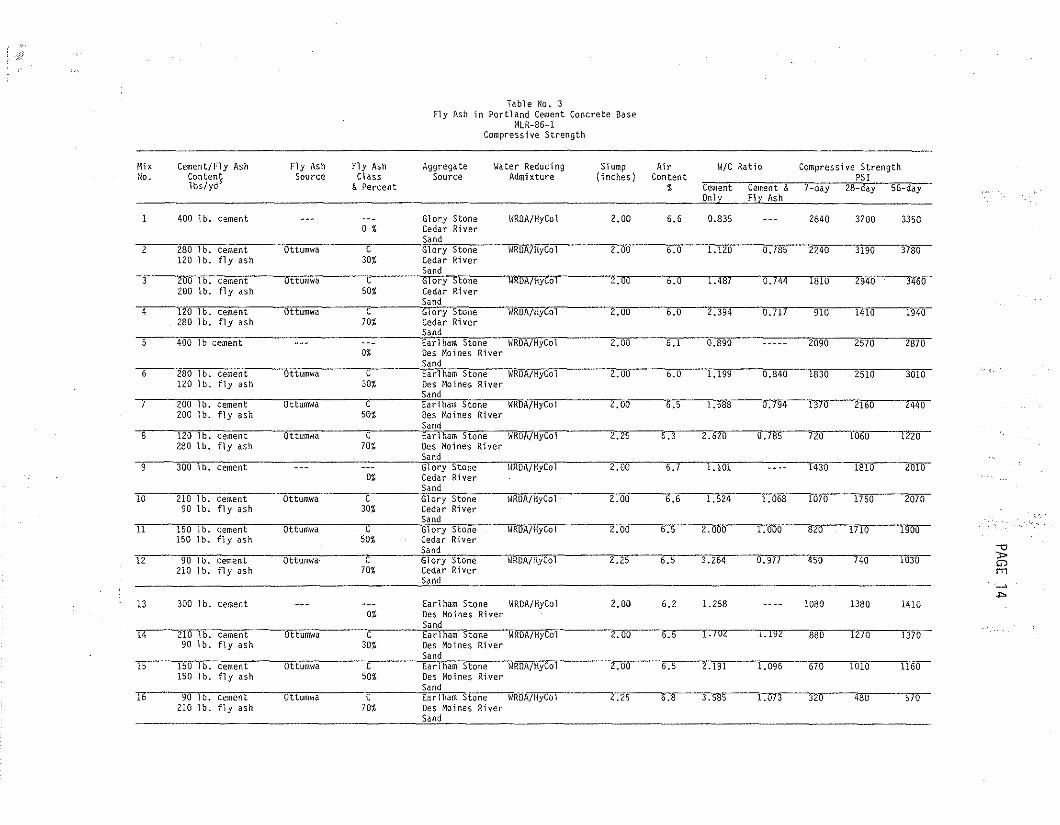
Table No.3Fly Ash in Portland Cement Concrete Base
t4LR-86-1Compressive Strength
MixNo.
Cement/Fly AshContentlbs!yd)
Fly AshSource
Fly AshClass
&Percent
AggregateSource
Water ReducingAdmixture
Slump(t nches)
AirContent
~
W/C Ratio Compressive StrengthPSI
Cerne-nt Cemenf--&-""- 7-day 28-day 56-dayOnly Fly Ash
2
400 lb. cement
280""Tb. cement120 lb. fly ash
Ottumwa
o %
C30%
Glory StoneCedar RiverSandGlory StoneCedar RiverSand
ViRDA/HyCol
WRDA/HyCol
2.00
Z.oo
6.6
6;-0
0.835
1 :12-6 0---:-1"85
2640
2240
3200
J190
3350
3-180
200 lb. cement Ottumwa C Glory Stone WRDA/HyCol 2.00 5.0 1.487 0.744 1810 2940 3460200 lb. fly ash 50% Cedar River
Sand
Earlham Stone WRDA/HyColDes Moines RiverSandEarl ham Stone WRDA/HyCo1Des Moines RiverSand
"Z~--"----"~~-JjQO-------l.000 820 1710 1900
2~----"-~--"T~----0.794 1370 2160
'":x>G),."
~
..".
301(1
2~r?0
1940
2010
-2440
2070-
1"220
!@
2510
[810
2570
1750
740
1060
1830
rota=
2090
450
0.840
1.068
0.977
2":394--- 0.717 910 1410
0.890
1.199
1.524
1.101
3.264
6~1Y
b.O
6:-1
'-:7
6.6
6.-'
2.00
2.00
2.00
e.zs
2.00
2~--~Z:-~-8.785 T20
2.00
WRDA/llyCo1
WRDA/HyCQl
WRDA/HyCol
\O/RDA/HyCo]
WRDA/HyCol
VlRDA/HyCol
wROA/Hy-CO:"'
Glory StoneCedar RiverSand
Earl ham SfoneDes Moines RiverSand
Glory StoneCedar RiverSand
Glory" StoneCedar RiverSand
Ear 1ham"S"foneDes Moines RiverSand
Glory $-toneCedar RiverSand
-Glory StoneCedar RiverSand
0%
C50%
0%
t30%
C70~
C30%
C70%
C70%
C50%
Ottumwa
Ottumwa
Ottumwa
Ottumwa
Ottumwa-
Ottumwa
"Ottumwa
400 1b cement
ZOO 1b. cement200 1b. fly ash
300 lb. cement
90 1b. cement210 1b. fly ash
280 lb. cement120 lb. fly ash
120 1b. cement280 1b. fly ash
150 lb. cement150 lb. fly ash
iiolb. cement90 lb. fly ash
12"0--1 b. cement280 lb. fly ash
9
4
8
,,
11
12
10
13 300 1b. cement --- --- Earl ham Stone WRDA/HyCo1 2.00 6.2 1.258 ---- 1080 1380 14100% Des Moines River
Sand14 210 lb. cement Ottumwa C Earlham Stone VlRDA/HyCo'l 2.00 6.5 1.) 02 1.192 880 1270 1370
90 lb. fly ash 30% Des Moines RiverSand
15 150 lb. cement Ottumwa C Earlham Stone WROA/HyCol 2.00 6.5 2.191 1.096 670 1010 1160150 lb. fly ash 50% Des Moines River
Sand16 90 lb. cement Ottumwa C Earlham Stone WRDA/HyCol 2.25 6.8 3.585 1.073 320 480 570
210 lb. fly ash 70% Des Moines RiverSand

Tabl e No. 4Fly Ash in Portland Cement Concrete Base
HLR-86-1Durability & Expansion
t>\ixNo.
Cement/Fly AshContentlbs!yd-',
Fly Ash%
Fly AshSOurce
Fly AshClass
AggregateSource
Water ReducingAdmixture
Slump Air W/C Ratio Durability Expansion(i nches ) Content Factor %
% Cement cement &Only Fly Ash
5 400 l b cement 0 --- --- Earlham Stone WRDA/HyCol 2.00 6.1 0.890 ----- 62 0,099Des Moines RiverSand
6 280 lb. cement 30 Ottumwa C Earlham Stone WRDA{HyCol 2.00 -~ ---r:T99---- 0.840-- ~~5if- ------O:O~f(f
120 lb. fly ash Des Hoines RiverSand
200 lb. cement 50 Ottumwa C Earlham Stone WRDA/HyCol 2.00 ~---~--- 0.'794 - 62 0.121'200 lb. fly ash Des Moines River
Sand8 120 lb. cement 70 Ottumwa C Earlham Stone \~RDA/HyCol 2.25 6.3 2.620 0.785 92 O.Of!
280 lb. fly ash Des Hoines RiverSand
13 300 lb. cement 0 --- n_ Earlham Stone WRDA/HyCol 2.00 6.2 1.258 ---- 80 0.04:1Des Moines RiverSand
14 210 lb. cement 30 Ottumwa C Earlham Stone \~RDA/HyCol 2.00 -~-----~--r:T9"L-n
- -~6T-----·--O____:_(fgJ
90 lb. fly ash Des Moines RiverSand
15 150 lb. cement 50 Ottumwa C Earlham Stone WROA/HyCol 2.00 6.5 ~---~-- ~-n--- ---0-.0-51150 lb. fly as-h Des Haines River
Sand16 90 lb. cement 70 Ottumwa C Earlham Stone WRDA/HyCol 2.25 6.8 3.585 ---r:013- ~-lrg-- ~-O~OH
210 lb. fly ash Des Moines RiverSand
-0»G)1"'1
~
o-r

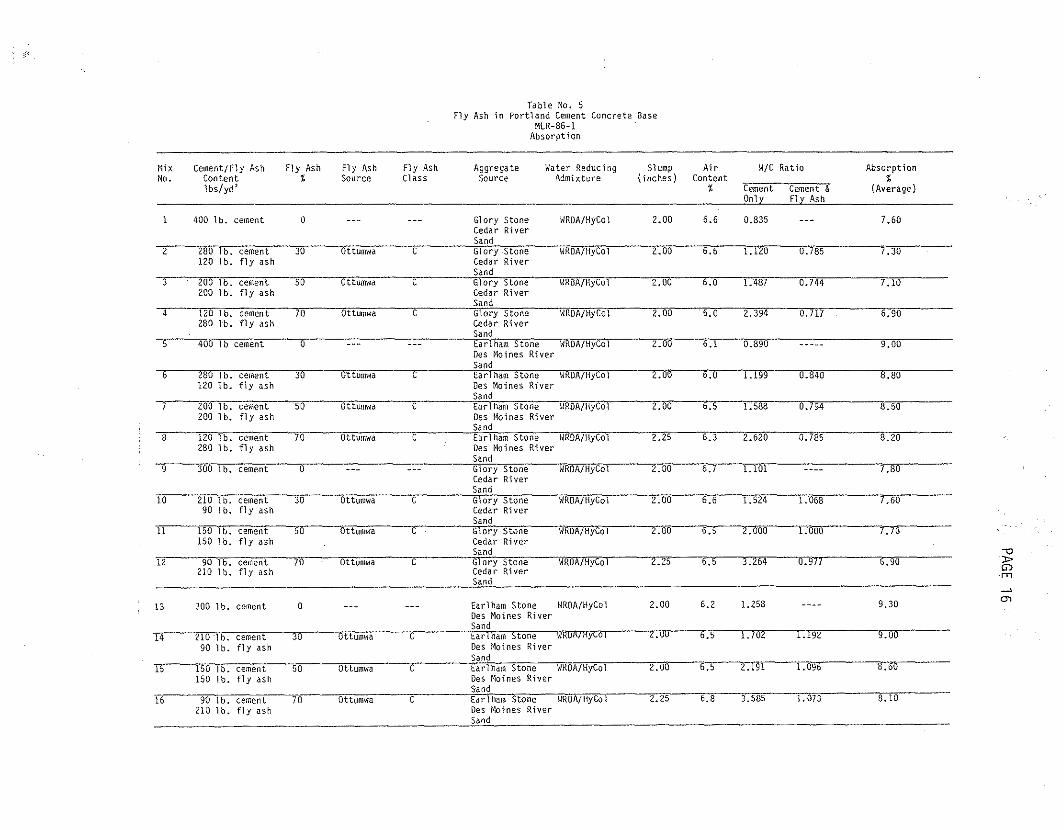
Table No.5Fly Ash in Portland Cement Concrete Base
MLR-86-1Absorpt i on
MixNo.
Cement/Fly AshContentlbs!yd'
FlY Ash%
Fly AshSource
Fly AshClass
AggregateSource
Hater ReducingAdmi xture
Slump Air W/C Ratio(inches) Content
% Cement Cement &Only Fly Ash
Absorption%
(Average)
400 lb. cement 0
280 lb. cement 30120 lb. fly ash
200 lb. cement 50200 1b. fly ash
120 1b. cement 70280 lb. fly ash
400 lb cement 0
280 1b. cement 30120 1b. fly ash
200 lb. cement 50200 1b. fly ash
1Z0 1b. cement 70280 1b. fly ash
300 lb. cement 0
210 lb. cement 3090 lb. fly ash
150 1b. cement 50150 lb. fly ash
90 1b. cement 70210 1b. fly ash
Glory Stone \4RDA/HyCol 2.00 6.6 0.835 --- 7.60Cedar RiverSand
Ottumwa C Glory Stone WROA/HyCol z.Z:r----~--~-_____u:_977 fJ.9UCedar RiverSand
--- --- Glory Stone WRDA/HyCol 2.00 6.7 1.101 ---- 7.80Cedar RiverSand
"»G)rrt
~
'"9.301.2586.2Z.ooHRDA/HyColEarlham StoneDes Moines RiverSand
bttumwa --- -t -Grii-ry$"tone WRDA/HyCor-- -z. 00 6~-6 L-524 --1.068 --- 7---:60Cedar RiverSand
Oftumwa ----C - -------EarTham St6-ii-e--W-ROA/HyCo-l- - -2-.00---6~ - 1.588 0.794 8.50Des Moines RiverSand
TItfumwa -----C- ----Earl ham Stone WI<OA/HyCo-l----z:-mJ----b.-O-- 1.199------cr:s40 8.80Des Moines RiverSand
ofEumwa ---C-----~lham Ston-e--WROA/HyCo-l--- --Z.25-- 6:-3- 2.620 --ifJSS-- ---- 8.20Des Moines RiverSand
Ottumwa - -C---- -- Glory Stone-----\-[RDA/HyCo-l----Z:00---IL-0--L487 - 0.744 7.10Cedar RiverSand
Ottumwa C Glory Stone WRDA/HyCol Z.OO 6.5 2.000 1.000 ~
Cedar RiverSand
Ottumwa C Glory Stone WRDA/HyCol 2.00 6.0 2.394 0.717 6.90Cedar RiverSandEarlham Stone WROA/HyCol 2.00 6.1 0.890 ----- 9.00Des Moines RiverSand
THtumwa c -GTii-rySlone WROA}liyCol- 2.00 6.-1) r.izo --(f:"7~ ---- -7~
Cedar RiverSand
o300 lb. cement
9
2
'3
8
5
"4
Ii
10
11
12
13
14 Z10 -lb. cement 30 Ottumwa C Earlham Stone WROA/HyCol 2.0U 6.5 1.702 1.192 iJ":OIT90 lb. fly ash Des Haines River
SandEarlham stone WROA7MyColOes Moines RiverSand
rs
16
150 lb. cement150 1b. fly ash
90 -1 b. cement210 lb. fly ash
"5""6
70
Ottumwa
Ottumwa
c
c £a-i)ham--StoneDes Moines RiverSand
I1RDA/ HyCo 1
2:00
2.25
D
,-:8
2.191
3:585"
1.096
L073
&:liO
-fiO

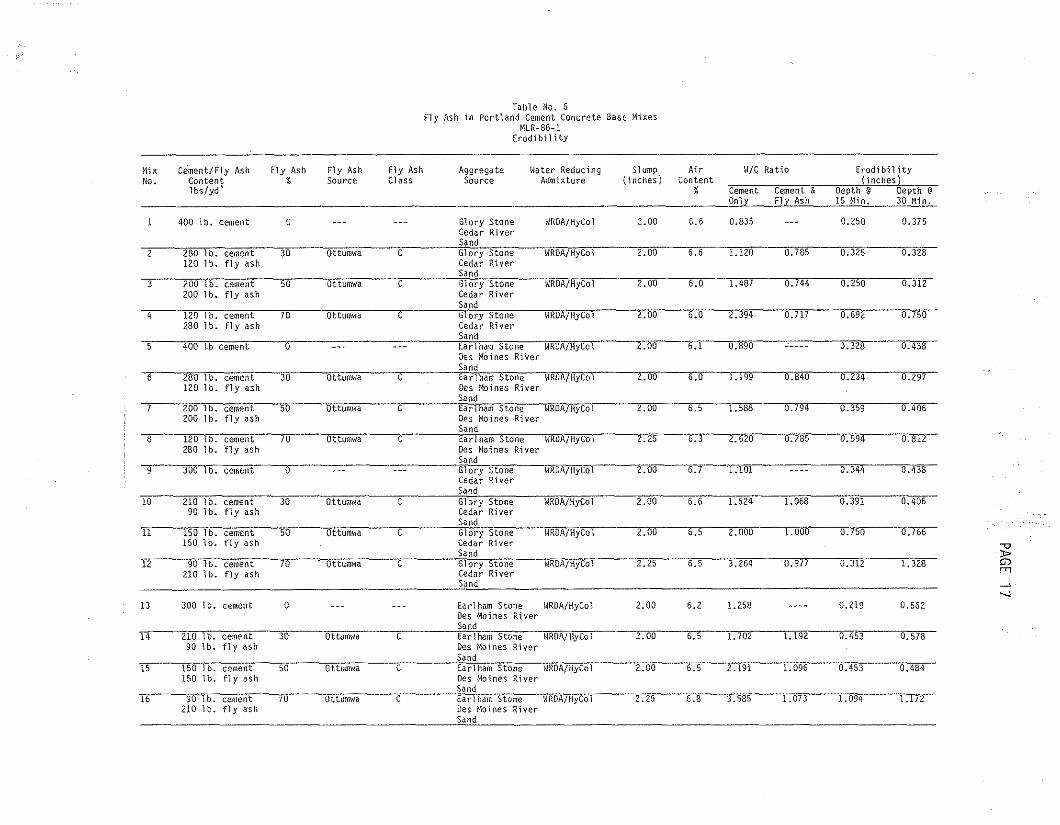
Table No.6Fly Ash in Portland Cement COncrete Base Mixes
I-llR-86-1Erodibility
NtxNo.
Cement/Fly AshContentlbs/yd'
fly Asht
Fly AshSource
Fly AshClass
AggregateSource
Wa ter Reduci ngAdmixture
Slump(inches)
Air W/C RatioContent
% Cement Cement;;Only Fly Ash
Erodtb i l ity(inches)
Depth @-- DepTIl-@15 Min. 30 Min.
120 lb. cement 70 Ottumwa C Earlham Stone WRDA/HyCol 2.25 6.3 2.620 0.785 0.594280 lb. fly ash Des Moines River
Sand
6 280 lb. cement 30 - Ottumwa ---C-------t:arlham Stone WRDA/HyCof- -L"~M ------iLO-120 lb. fly ash nes 11oine.s River
Sand
Glory Stone i~RDA/HyCol 2.25 6.5 3,264 0.977Cedar RiverSand
~ cement -~--- Ottumwa----C --------Glory Stone150 lb. fly ash Cedar River
Sand
Q.250
0.328
0-~-344
0.250
0.312
0.391
0.234
-0.325
0:692
0:-150
0.840
1.068
0.744
-0.785
r.-ooo
o:m
0.835
1.199
r.120
L-ir87
2.394
2.000
1.524
1.588 0.794 0.359
1.101
(L-890
6.6
6:0
1):-5
TJ
6.1
{L-6
6.6
b.5
,.0
2.00
2.00
2-;-00
2.00
2.00
-2";00
2.00
Loa
2.00
WROA/HyCo-l
WROAlHyCol
WRDA1HyCol
WROA/HyCol
WRDA/HyCol
WROA/HyCol
WRlJAjHyCol
Glory StoneCedar RiverSand
Glory StoneCedar RiverSand
Ear1ham Stone 14ROA/HyCo1Des Moines RiverSilnd
Glory StoneCedar RiverSandGlory StoneCedar RiverSand
Glory StoneCedar RiverSand
tarlham Stone WRDA/HyCOlDes Moines RiverSand
Gfory StoneCedar RiverSand
c
c
c
c
c
r
Ottumwa
Ottumwa
Ottum\~a
-ottumwa
-Ottumwa
Ottumwa
o
o
o
"td
30
~o
70
50
30
200---lb. cement200 lb. fly ash
400 l.b ce-ment
90 lb. -cement210 1b. fly ash
r21:r-l b. cement280 lb. fly ash
280 lb. cement120 1b. fly ash
210 1b. cement90 lb. fly ash
200 lb:--cement200 1b. fly ash
3Qlj"" lb. cement
400 1b. cement
2
3
5
4
8
,10
12
IT
13 300 lb. cement 0 --- --- Earlham Stone WRDA/HyCol 2.00 6.2 1.258 ---- 0.219Des Moines RiverSand
14 210 lb. cement 30 Ottumwa C Earlham Stone WRDA/HyCo 1 2.00 6.5 1.702 1. 192 0.45390 lb. fly ash Des Moines River
Sand15 150 1b. cement 50 Gttumwa C Earlham Stone \o/ROA/HyCo1 2.00 6.5 2.191 1.096 0.453
150 1b. fly ash Des Moines RiverSand
16 90 1b. cement 70 Ottumwa C Earl ham Stone '.4ROA/HyCo 1 2.25 6.8 3.585 1.073 1.094-210 lb. fly ash Des Moines River
Sand

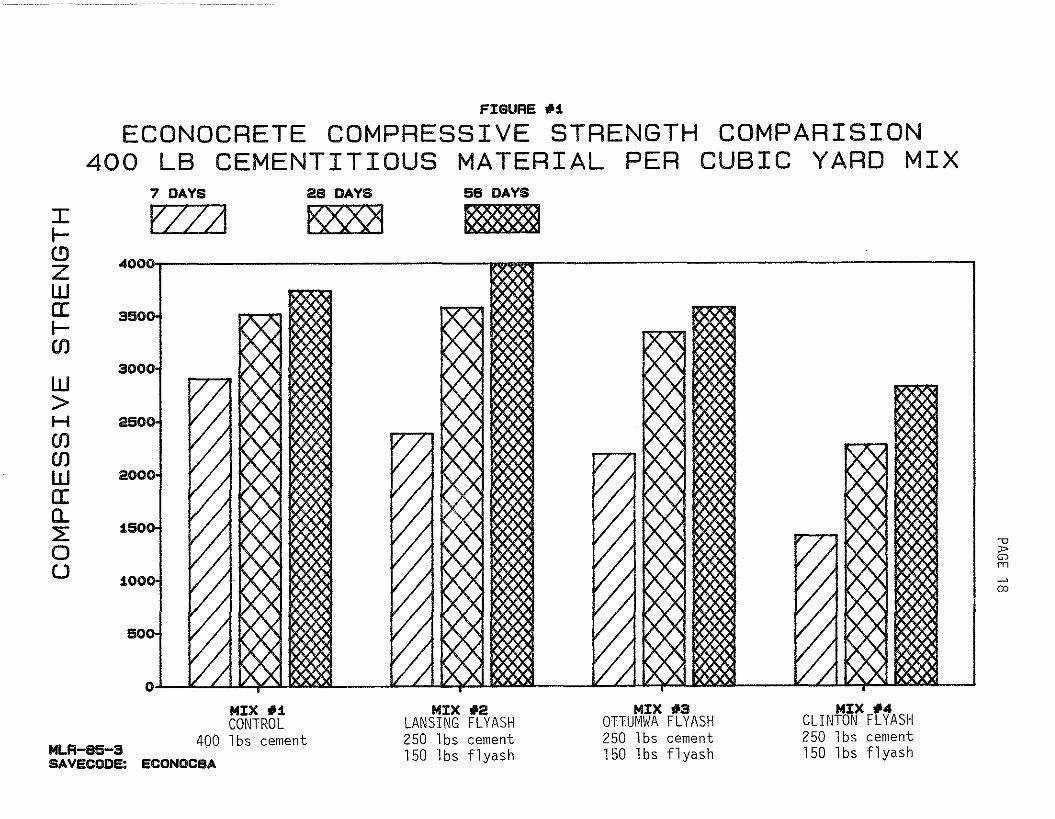
FIGURE #1
ECONOCRETE COMPRESSIVE STRENGTH COMPARISION400 LB CEMENTITIOUS MATERIAL PER CUBIC YARD MIX
-o»G)rn~
co
56 DAYS
W@28 DAYS
KXX?17 DAYS
VZ//1
2000
Ile!)ZWa:I00
W>H0000Wa:0..2:oU
MIX #4CLINTON FLYASH250 1bs cement150 Ibs f1yash
MIX #3OTTUt~WA FLYASH250 1bs cement150 1bs f1yash
MIX #2LANSING FLYASH250 1bs cement150 1bs f1yash
cMIX #1CONTROL
400 1bs cementECONOCSA
5001W1L18~~~~
MLR-85-aSAVECODE:

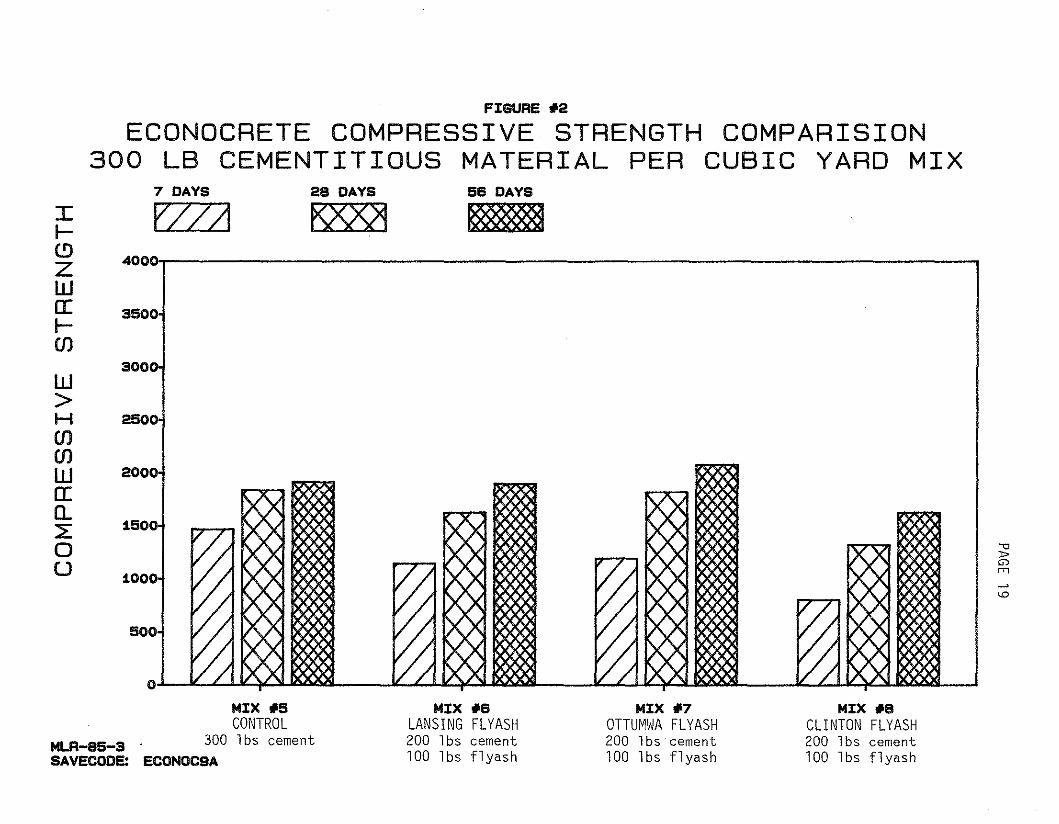
FIGURE .2
ECONOCRETE COMPRESSIVE STRENGTH COMPARISION300 LB CEMENTITIOUS MATERIAL PER CUBIC YARD MIX
S500
4000,.,'------------------------------------------1'
Irozwa:rOO
7 DAYS
VZ//128 DAYS
K>QQ156 DAYS
~
150I V / I V'IJ'\I IXX)(}G 1/'\./'\1 DOOO<l V'\./'\I 1>000<1 1>000<1 I
-0»G)
1000-1 1/ /IIX XI iOOOO 1/ /IIX XllOOOO 1/ /IIX XllOOOO IX XllOOOO I ::
""I V/JOO~ V/JOO~ V/JOO~ f7]OO~ I500
SOOw>H 250
0000W 200
a:Q.2oU
0.1 VA~ V/1~OO ~~OO VJ~~ I
MLR-85-SSAVECODE:
MIX .5CONTROL
300 lbs cementECONOC9A
MIX .6LANSING FLYASH200 lbs cement100 lbs flyash
MIX .7OTTUMWA FLYASH200 lbs cement100 1bs fl yash
MIX .13CLINTON FLYASH200 lbs cement100 lbs flyash

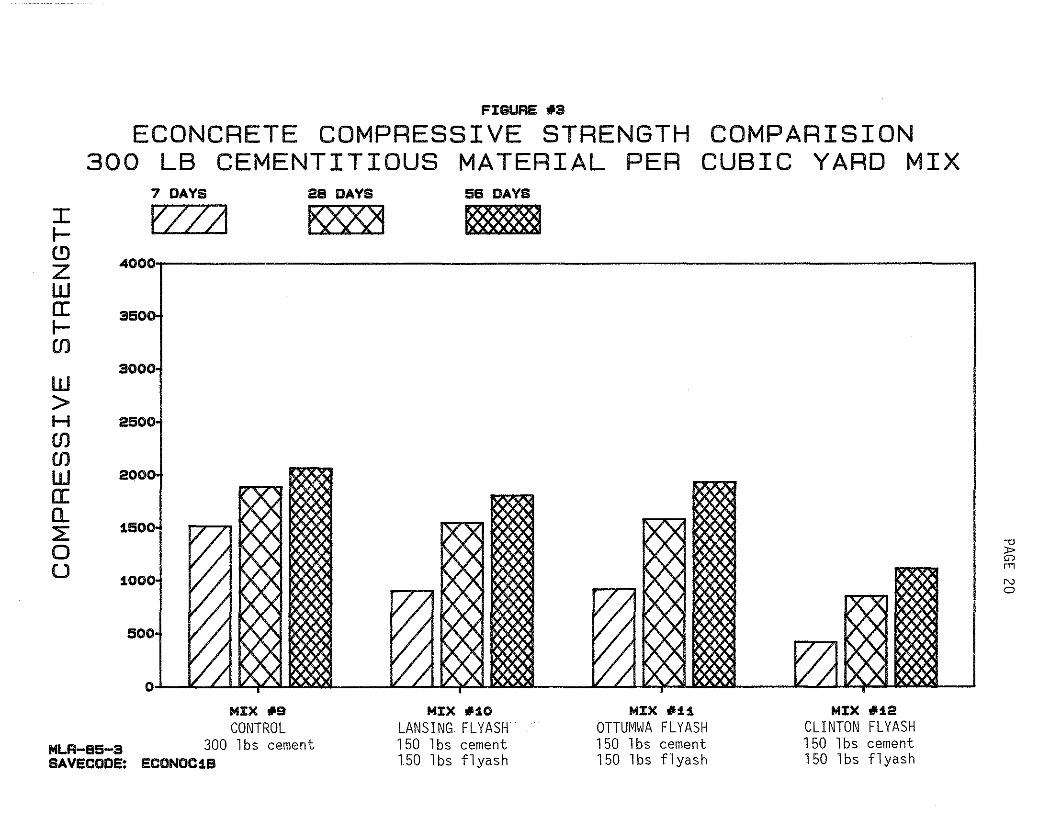
FIGURE ilia
ECONCRETE COMPRESSIVE STRENGTH COMPARISION300 LB CEMENTITIOUS MATERIAL PER CUBIC YARD MIX
"'0»G)rrT
No
56 DAYS
~26 DAYS
KXXt17 DAYS
VlZ/1
o
2500·
4000, i
Ile.!)
ZWa:Itn
w>Hcomwa:Q.~
ou
MIX *9CONTROL
MLR-S5-a 300 lbs cementSAVECODE: ECONOC1B
MIX *10LANSING FLYASH '150 1bs cement150 1bs flyash
MIX *:UOTTUMWA FLYASH150 lbs cement150 lbs flyash
MIX *12CLINTON FLYASH150 Ibs cement150 lbs flyash

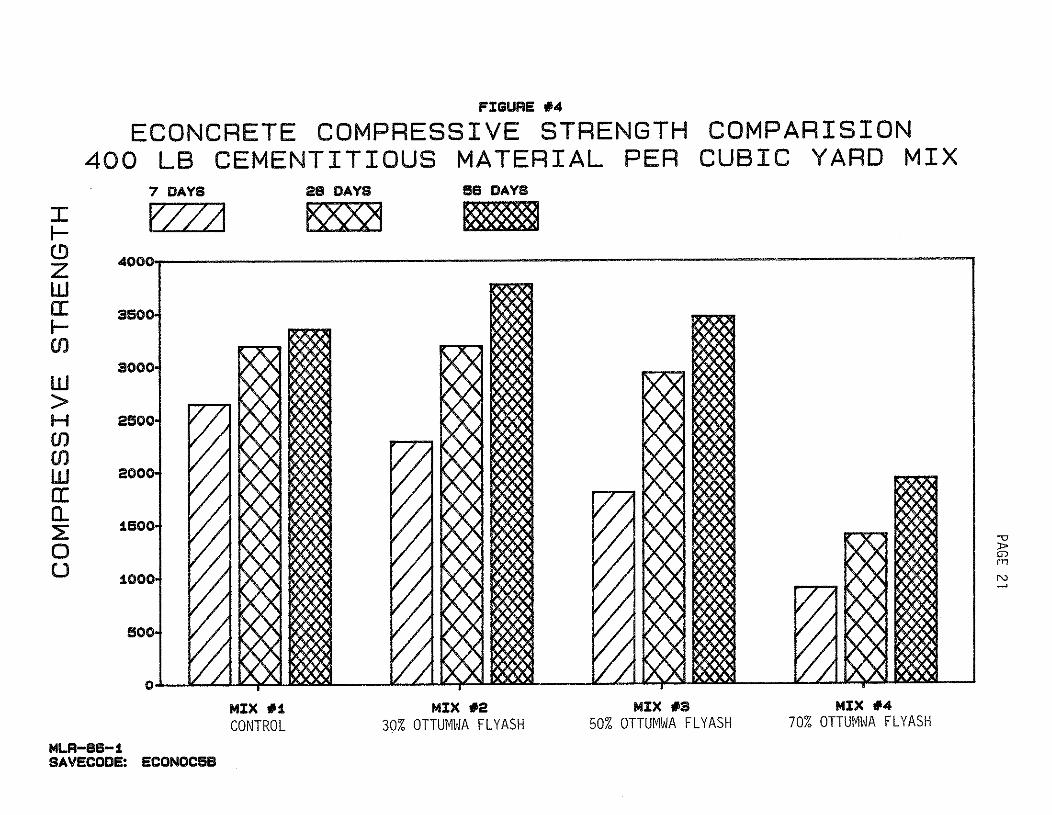
FIGURE #4
ECONCRETE COMPRESSIVE STRENGTH COMPARISION400 LB CEMENTITIOUS MATERIAL PER CUBIC YARD MIX
~OOi i
-0»G)1"'"1
N~
56 DAYS
~2S DAYS
KXX?17 DAYS
P7Z/1
c
1500
100
200
2500
3000
350
II(!)ZWIII(J)
W>H(J)(J)WIIll.~ou
MIX #1CONTROL
MIX #230% OTTUMWA FLYASH
MIX #350% OTTUMWA FLYASH
MIX #470% OTTUMWA FLYASH
Ml.R-S6-1SAVECODE: ECONOC5B

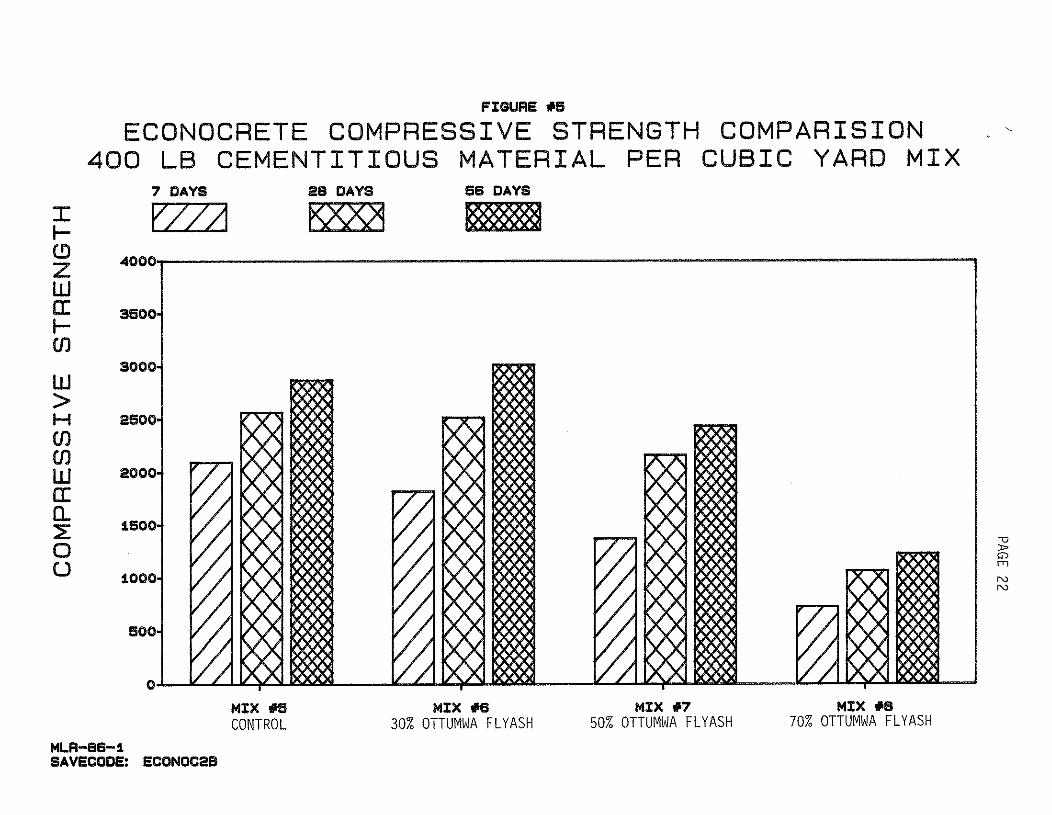
FIGURE *5ECONOCRETE COMPRESSIVE STRENGTH COMPARISION '
400 LB CEMENTITIOUS MATERIAL PER CUBIC YARD MIX
v)0G)rrt
NN
MIX *870% OTTUMWA FLYASH
MIX *750% OTTUMWA FLYASH
56 DAYS
~
MIX *630% OTTUMWA FLYASH
28 DAYS
~
MIX *5CONTROL
7 DAYS
P7Z/1
c
500
1000
~OOi I
2000
2500
3000
3500
Ilt!)ZlJJCCI(fJ
lJJ>HmcolJJCC0..:EoU
MLR-86-1SAVECODE: ECONOC2B

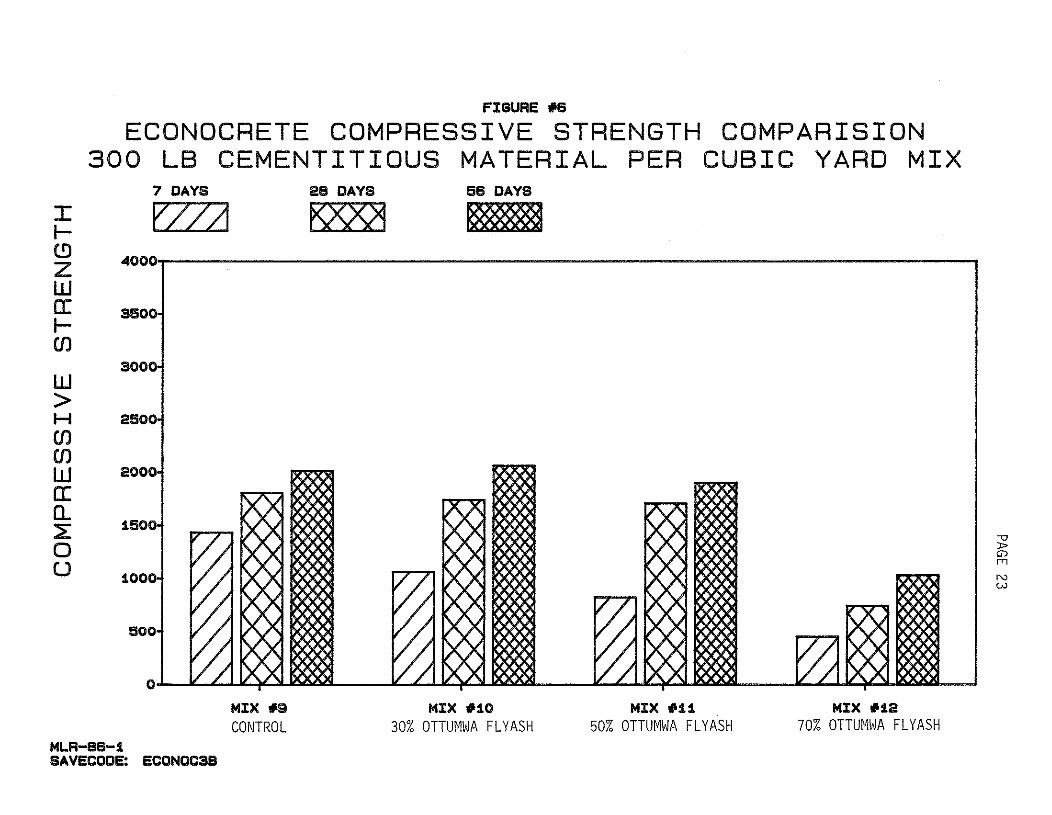
FIGURE *6
ECONOCRETE COMPRESSIVE STRENGTH COMPARISION300 LB CEMENTITIOUS MATERIAL PER CUBIC YARD MIX
-o»G)r-rt
NW
56 DAYS
~28 DAYS
K?Q<)17 DAYS
P77/1
o
500
1500
~~i i
1000
3500
Ilt!)ZW0:IUJ
W>HUJUJW0:Q.~ou
MLR-86-1SAVECODE: ECONOC3B
MIX *9CONTROL
MIX *1030% OTTUMWA FLYASH
MIX *U50% OTTUMWA FLYASH
MIX *1270% OTTUMWA FLYASH

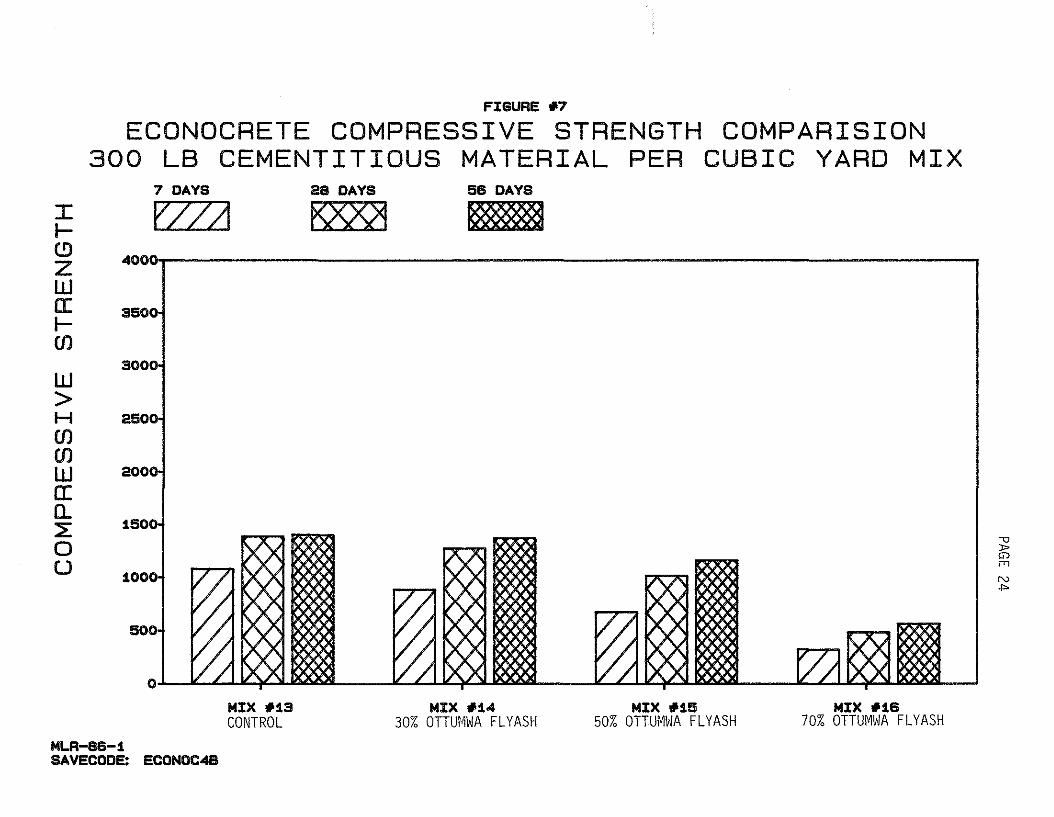
FIGURE #7
ECONOCRETE COMPRESSIVE STRENGTH COMPARISION300 LB CEMENTITIOUS MATERIAL PER CUBIC YARD MIX
7 DAYS 28 DAYS 56 DAYS
I V721 K(X)X(1 ~~(.I)
400ZUJa:~(J)
UJ>H(J)(J)UJa:a.~ ___J
17 7i~g K'5Clm I ~0U ~
N.".
I V/lM~ V/lM~ (7)jM~ I500
oU(LW~~~~~--~~~MIX #13CONTROL
MIX #1430% OTTUMWA FLYASH
MIX #1550% OTTUMWA FLYASH
MIX #1670% OTTUMWA FLYASH
MLR-ea-1SAVECOD~ ECONOC4B

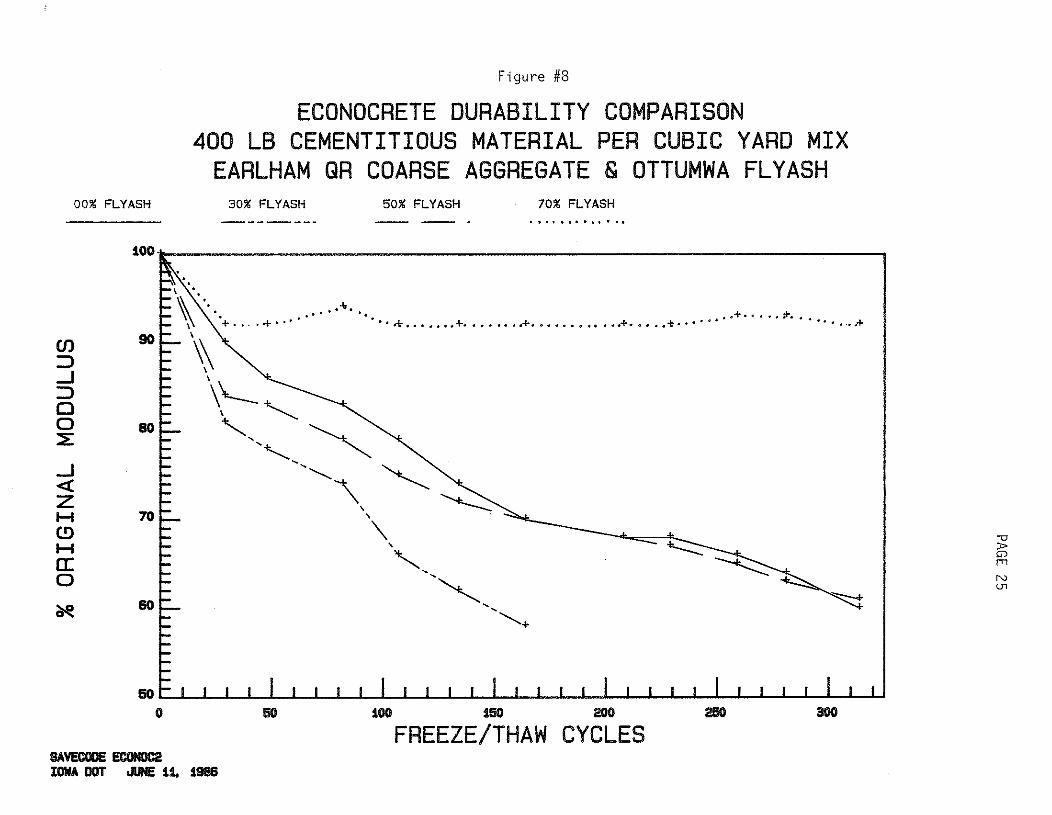
Figure #8
ECONOCRETE DURABILITY COMPARISON400 LB CEMENTITIOUS MATERIAL PER CUBIC YARD MIX
EARLHAM QR COARSE AGGREGATE & OTTUMWA FLYASH00% FLYASH 30% FLYASH 50% FLYASH 70% FLYASH
......... , . "
-0»'"enNU1
~
+...• . -J-••• " •• -0'+..+ . .. ...T· ... . .:'\'. • +••••••.•+ .\~.~.+ + .. , • .
\\\~~ .
~ ~"<, "<,
""'\ "<,~,''\,
'-,'~
" "+
80
en::::J...J::::Joo~
...J<CZHC!)HIIo~
3002liOtOO t50 200
FREEZE/THAW CYCLES50
50C I I I I I I I I I I I I I I I I I I J I I I I I I I I I I J I II
o
IlAVEClIDE ECOHllC2IOllA DOT JUNE U. t9t16

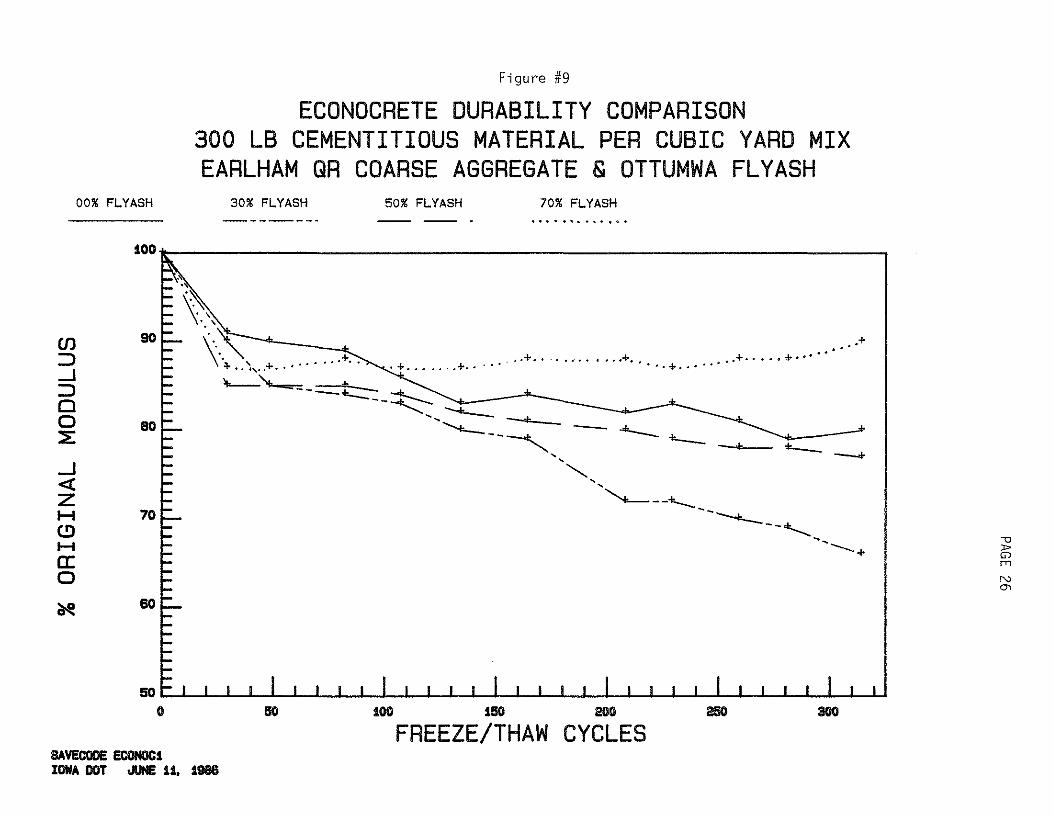
Figure #9
ECONOCRETE DURABILITY COMPARISON300 LB CEMENTITIOUS MATERIAL PER CUBIC YARD MIXEARLHAM QR COARSE AGGREGATE & OTTUMWA FLYASH
00% FLYASH 30% FLYASH 50% FLYASH 70% FLYASH.............
"""G)en
NC"I
.+...:4- •• ' ••
., ......\ .,\.\ ...~ +.,\ " .. , +.. . + .. , +..' -..........-"'---'1- •••". -4. -L,:~ ___
'---"-..,--=::-"'" -...--.. .. , -""-... "-- .. , "-- ~"~--~,
'",-
"~--.........._-~--<,
"'---... ...
90
80
70
60
10011: i
en:::::>-.J:::::>Clo::E
-.J«ZH(!)Ha:o~
300250100 150 200
FREEZE/THAW CYCLES50
SOC I I I I I I I I I I I I I I I I I I I I I I I , I I I I I I I "
o
SAVECODE ECONOC1lOlIA DOT .JUNE U. 1l1l16

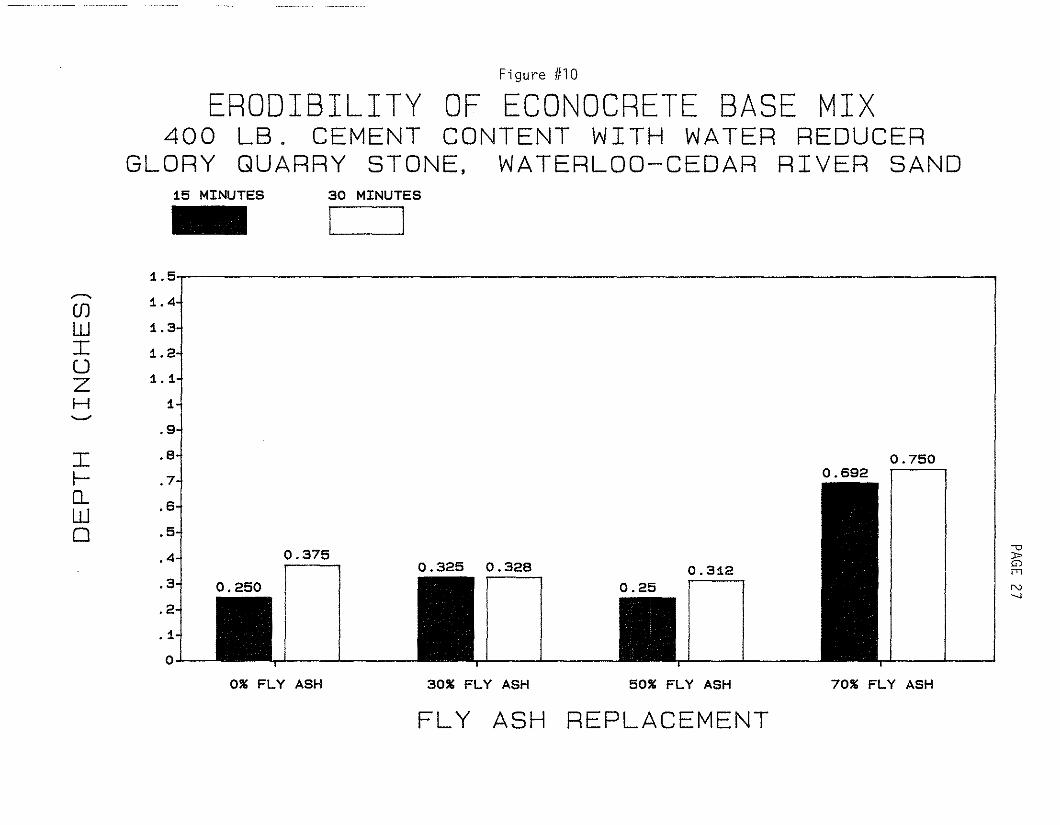
Figure #10
ERODIBILITY OF ECONOCRETE BASE MIX400 LB. CEMENT CONTENT WITH WATER REDUCER
GLORY QUARRY STONE, WATERLOO-CEDAR RIVER SAND15 MINUTES
-30 MINUTES
I I
30% FLY ASH
-0J>G)rrt
N-.J
0.750I
70% FLY ASH
0.692
0.312I
50% FLY ASH
0.25
0.325 0.328I
1.5---. 1.4CJ)
W 1.3
I 1.2UZ 1.1
H 1..........
.9
I .8
t- .70.. .6W0 .5
.4J 0.375
.31 0.250-.2
. 1
0
0% FLY ASH
FLY ASH REPLACEMENT

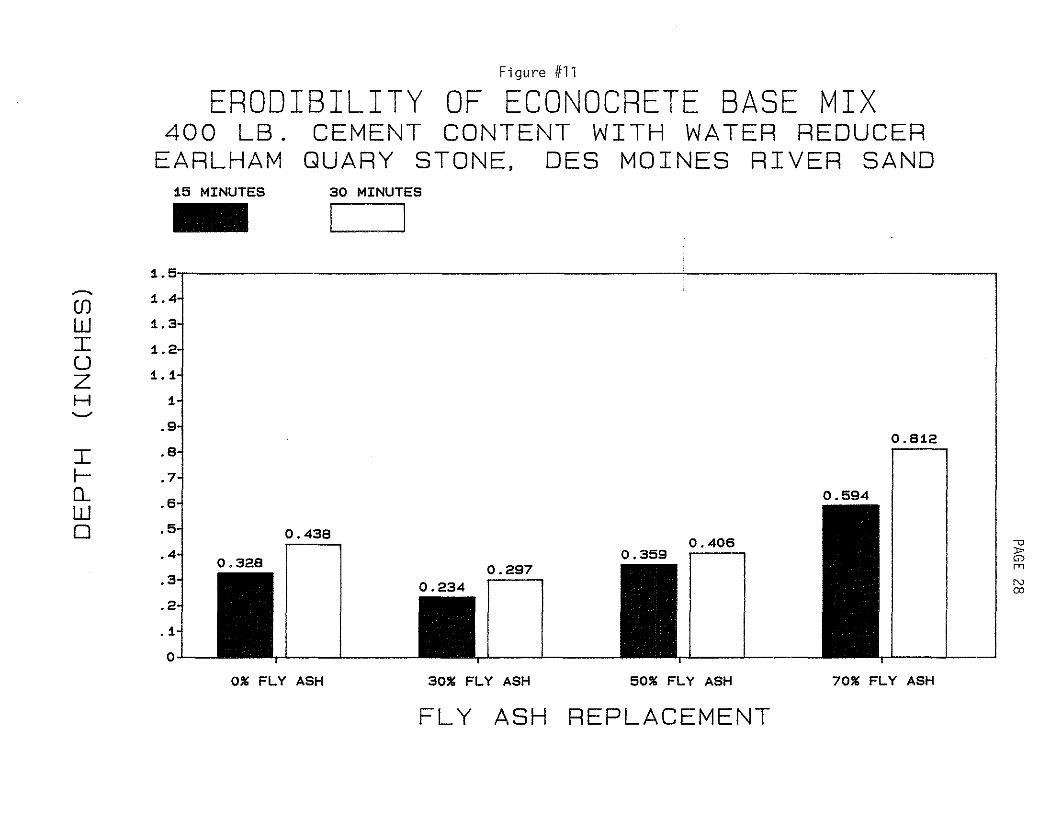
Figure #11
ERODIBILITY OF ECONOCRETE BASE MIX400 LB. CEMENT CONTENT WITH WATER REDUCER
EARLHAM QUARY STONE, DES MOINES RIVER SAND15 MINUTES
-30 MINUTES
I I
30% FLY ASH
-o»G)
en
Nco
0.812I
70% FLY ASH
0.594
0.406I
50% FLY ASH
0.3590.297i0.234
1.5
---- 1.4OJW 1.3
I 1.2UZ 1.1
H 1'--'
.9
I .8
I- .7G- .6W0 .5i 0.438
.40.328
.3
.2
. 1
0
0% FLY ASH
FLY ASH REPLACEMENT

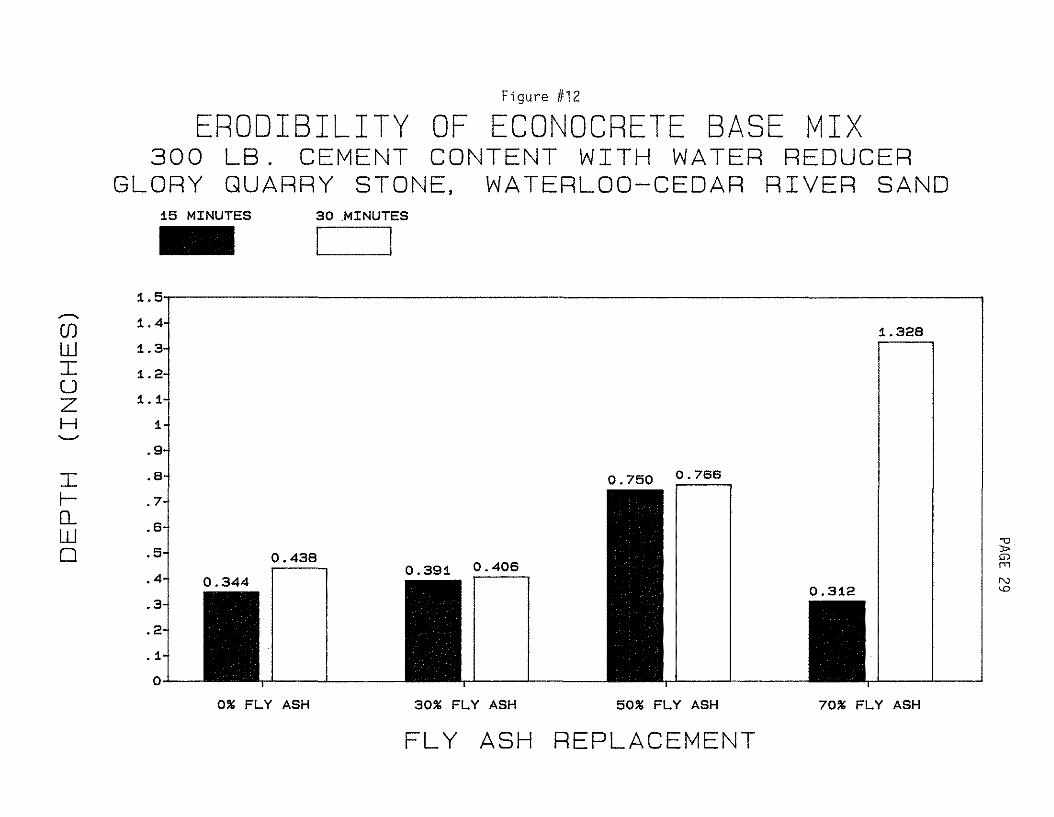
Figure #12
ERODIBILITY OF ECONOCRETE BASE MIX300 LB. CEMENT CONTENT WITH WATER REDUCER
GLORY QUARRY STONE, WATERLOO-CEDAR RIVER SAND15 MINUTES
-30 .MINUTES
I I
30% FLY ASH
-0»G)r-nN<.0
1.328I
70% FLY ASH
0.312
50% FLY ASH
0.750 0.766I
0.391 0.406I
1.5..-.. 1.4(J)
W 1.3
I 1.2UZ 1.1
H 1'-'
.9
I .8
f- .7D.. .6W0 .5i 0.438
~
.4 0.344-.3
.2
. 1
0
0% FLY ASH
FLY ASH REPLACEMENT

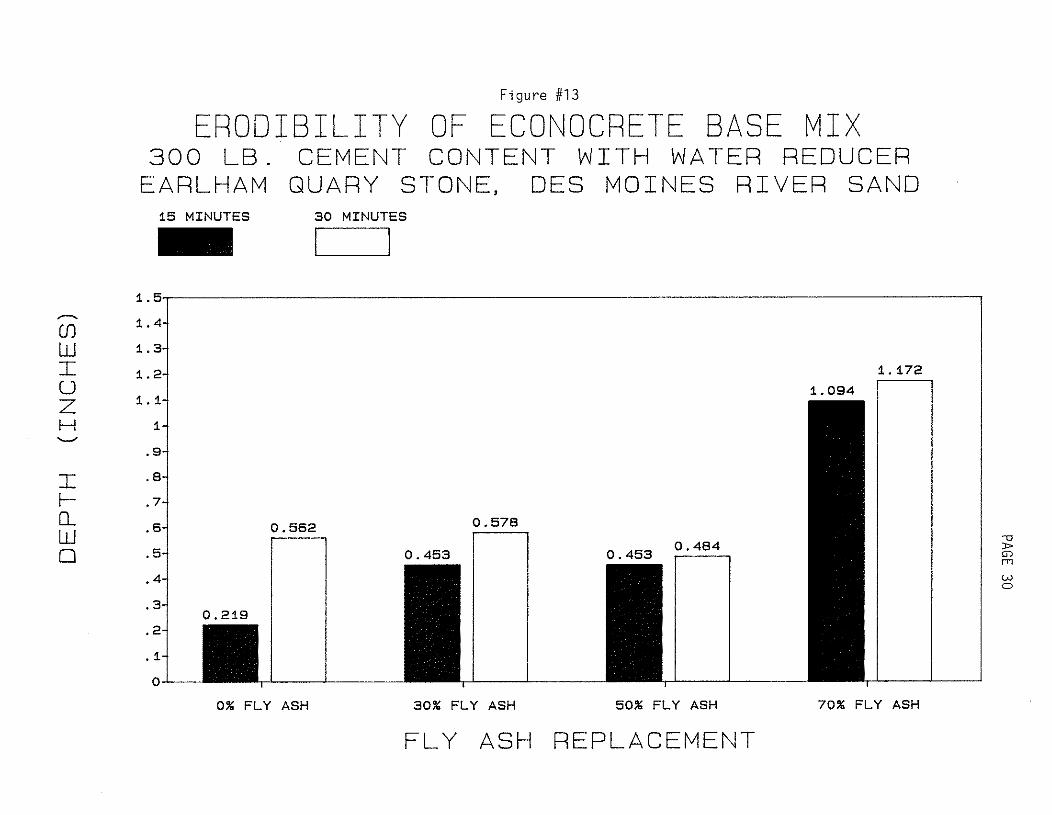
Figure #13
ERODIBILITY OF ECONOCRETE BASE MIX300 LB. CEMENT CONTENT WITH WATER REDUCER
EARLHAM QUARY STONE, DES MOINES RIVER SAND15 MINUTES
-30 MINUTES
I I1.5
----.(J) 1.4
W 1.3
I 1.2UZ 1.1
H 1'---'
.9
I .8
f- .70... .64W
0.562
0 .5
.4
.31 0.219
.2
. 1
0
0% FLY ASH
0.578I
0.453
30% FLY ASH
0.453 0.484I
50% FLY ASH
1.172,1.094
70% FLY ASH
-0»G)r-rt
Wo
FLY ASH REPLACEMENT

PAGE 31
Test Results & Discussion
The data gathered in this study supports the substitution of 30-50% of
the portland cement in the econocrete mixes with ASTM C-618 Class "c"
fly ash on a pound for pound basis, or Class "F" fly ash at a rate of
1.25 pound of ash added for each pound of cement deleted.
Compressive strengths obtained were more than adequate. A strength
level in the 1200-1500 psi range at 28 days will provide a subbase
with the physical properties required for performance under heavy duty
pavements. Specified strength levels of 1500 psi might fall in the
range of 300 lb. mix (contains 30-50% fly ash). Higher strength mix
tures may induce cracking in the overlaying pavement and may require
additional steps or measures to prevent reflective cracks. Subbases
are normally used for the purpose of providing a stable and a uniform
support for the surface pavement and further to reduce joint faulting.
The "AASHTO Guide Specifications for Highway Construction" specifies a
compressive strength range between 500 psi and 1500 psi at 28 days
(750 psi is the suggested strength for econocrete subbase course and
all air content between 4 & 9%).
Freeze-thaw durability testing was not included in the initial study
(MLR-85-3) because the possibility of water reducer-fly ash combina
tions causing reduced frost resistance was extremely remote. However,
in the second phase of the study (MLR-86-1), the laboratory work was
expanded to include not only the durability testing but also the ab
sorption and erodibility of the econocrete mixes. The durability
testing ended with very surprising results. In most cases, all

PAGE 32
econocrete mixes with and without fly ash exhibited durability far ex
ceeding what was expected of an econocrete mix with low cement factor
and low quality aggregate. It is suspected that the more dense grada
tion of the aggregate used in the econocrete mixes may be the reason.
It was also noted that as the fly ash content increased, the mixes be
came more cohesive, dense and homogeneous. This assumption proved to
be the same in the absorption test specimens with higher ash content
absorbing less water than the specimens with low ash or no ash con
tent.
Conclusion
In light of these investigations, it is logical to conclude that the
use of approved fly ashes in water reduced econocrete mixes would have
acceptable strength and durability. The water reducing admixture
makes significant low cost contribution to compressive strength. This
type of mix could make effective use of certain naturally graded ag
gregates. It is believed that such a subbase would be somewhat
nonerodible and add structural integrity and stability to some pave
ment sections. It is believed that it might increase the service life
by reducing the incidence of faulting. Econocrete mixes can be mixed
in existing central mix concrete plants and placed with conventional
or available concrete paving equipment.
Recommendation
Based on the test results, the addition of fly ash as a replacement to
econocrete containing water reducing admixtures can be accomplished
without detrimental effects to the strength or freeze/thaw durability
of econocrete.

PAGE 33
It is recommended that:
1. The substitution of fly ash from approved sources for up to 50% of
the portland cement in econocrete base mixes containing Class "A"
aggregates be allowed in the specifications.
2. The cement content of the econocrete mixes be reduced from 400 to
300 lb. of cement per cubic yard.

PAGE 34
References
1. ASTM (American Society for Testing and Materials) Annual Book ofStandards, Section 4, Volume 04.02, Concrete & Mineral AggregatesASTM 1985
2. Iowa Department of Transportation, Office of Materials, LaboratoryManual
3. AASHTO (American Association of State, Highway and TransportationOfficials) AASHTO Materials, Part II, Tests, AASHTO, 13th Edition1982-1985 I

Appendix A
Compressive Strength Testing
PAGE 35

IOWA STATE HIGHWAY COMMISSION
Materials Department
PAGE 36
Placing the speci.men
(b)
(a) Place the plain (lower) bearingplock; with its hardened face up,on the table or platen of thetesting machine directly underthe spherically seated (upper)bearing block.
Wipe clean the bearing faces ofthe upper and lower bearingblocks and of the test specimen.Place the test specimen on thelower bearing block.
(c) Carefully align the axis of thespecimen with the center ofthrust of the spherically seatedblock.
(d) As the spherically seated blockis brought to bear on the specimen) rotate its moveable portiongently by hand so that uniformseating is obtained.
i·
4. The cross-sectional area of specimens cast in'the steel-HaIled horj.zontal and vertical molds commonlyfurniShed2 may be assumed to be28.27 in. and 15.90 in. 2 respectLve Ly for the 6 in. and LJ..5 Ln .diameter cyl·inders
(c) Increase the load until the specimen yields; or' fails) and recordthe maximuhJ load carried by thespecimen during the test.
1.
2. Rate of Loading
(a) Apply the load continuously andwithout shock. Apply the loadat a constant rate Within therange of 20 to 50 psi. persecond. During the applicationof the first half of the estimated maximum load) a higherrate of loading may be permitted.
(b) Do not make any adjustment in thecontrols of the testing machinewhile the specimen is yieldingrapidly. immediately before failure,
C. Test Procedure
(b) The maximum diameter of thebearing face of the sphericallyseated block shall be 10 in. forcylinders from 4 in. through6 in. in diameter.
Test Method No. Iowa 403-AMarch 1973
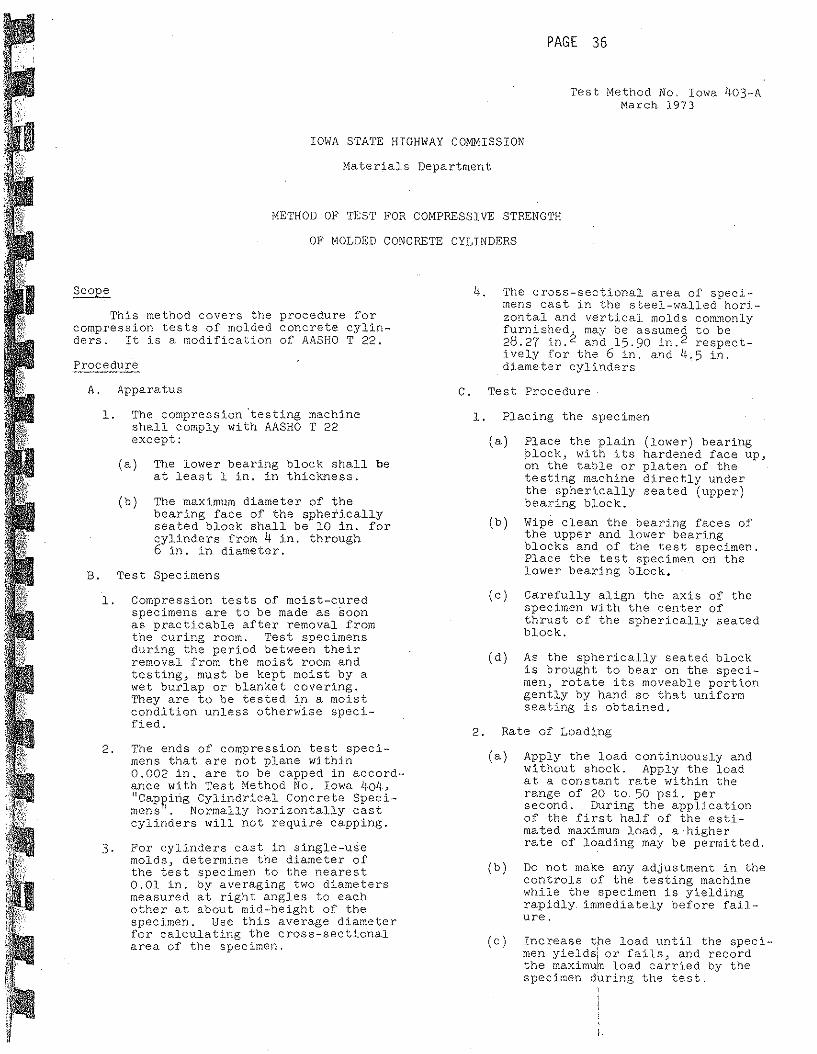
METHOD OF TEST FOR COMPRESSIVE STRENGTH
OF MOLDED CONCRETE CYLINDERS
(a) The lower bearing block shall beat least 1 in. in thickness.
Test Specimens
2. The ends of compression test specimens that are not plane Within0.002 in. are to be capped in accordance with Test Method No. Iowa 404,t1cap~irig Cylindrical Concrete Specimens 1. Normally horizontally castcylinders will not require capping.
3. For cylinders cast in single-usemolds) determine the diameter ofthe test specimen to the nearest0.01 in. by averaging two diametersmeasured at right angles to eachother at about mid-height of thespecimen. Use this average diameterfor calculating the cross-sectionalarea of the specimen.
1. Compression tests of moist-curedspecimens are to be made as soonas practicable after removal fromthe curing room. Test specimensduring the period between theirremoval from the moist room andtesting> must be kept moist by awet burlap or blanket covering.They are to be tested in a moistcondition unless otherwise specified.
A. Apparatus
1. The compression 'testing machineshall comply with AASHO T 22except:
B.
This method covers the procedure forcompression tests of molded concrete cylinders. It is a modification of AASHO T 22.
Procedur'e

8, •
PAGE 37
2 Te s t Method No. Iowa 403-AMarch 1973
(d) Note the type of failure andthe appearance of the c onc r'e t.eif the break appears to beabno rma.L,
D. Calculations
1. Calculate the compressive strengthof the specimen by dividing themaximum load carried by tr,c specimen during the test by the averagecross-sectional area as de s c r-Lbedin Section B, and express theresult to the nearest 10 psi.
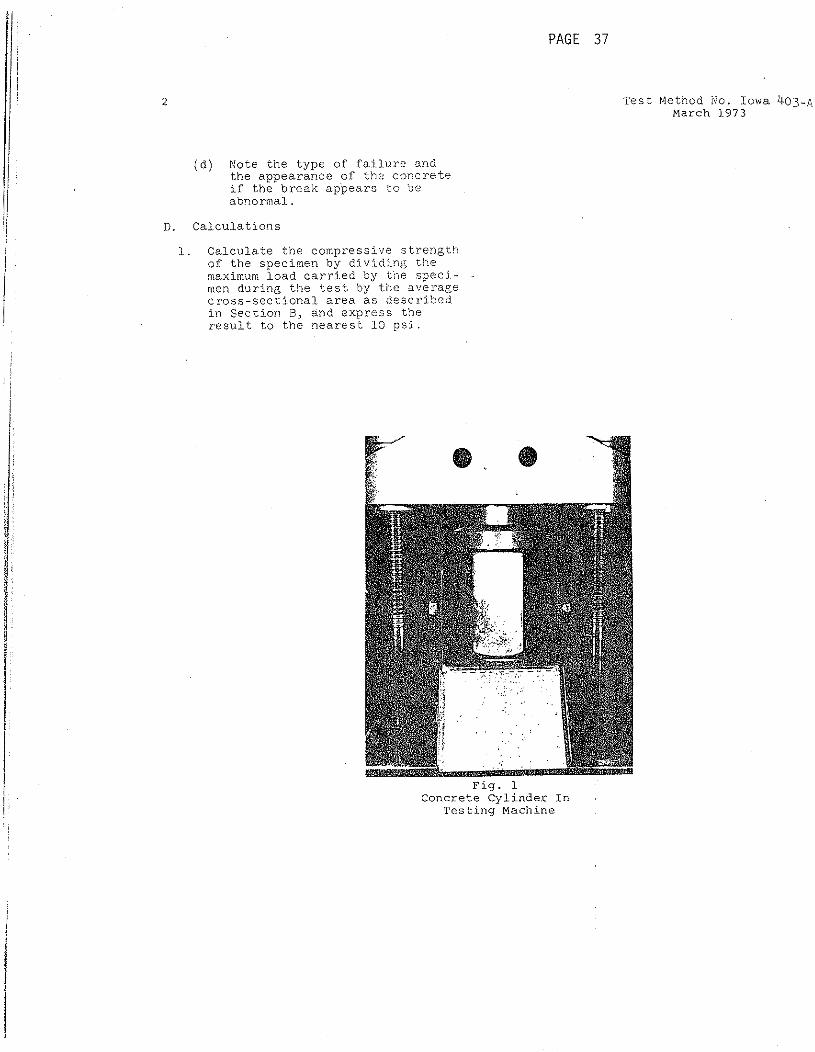
Fig. 1Concrete Cylinder In
Testing Machine


Appendix B
Durability Testing
PAGE 38

Page 1 of 5
PAGE 39
Test Method No. Iowa 408-AApril 1980
IOWA DEPARTMENT OF TRANSPORTATIONHIGHWAY DIVISION
0ffice of Materials
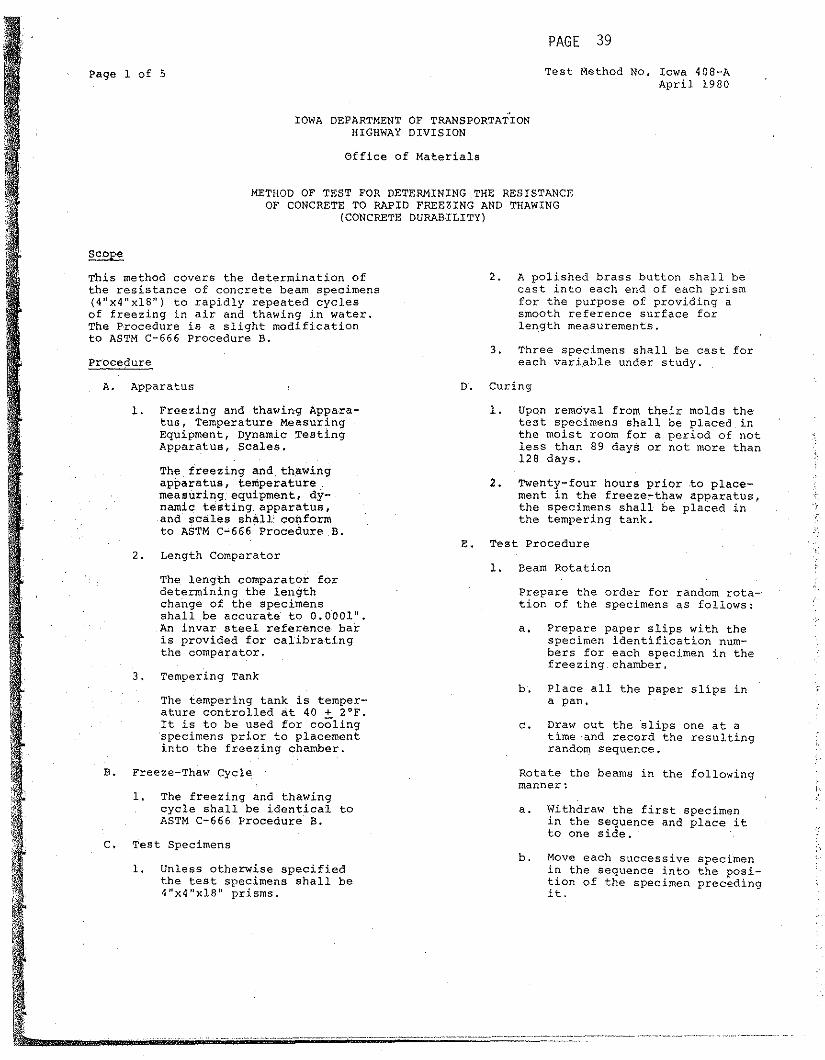
METHOD OF TEST FOR DETERMINING .THE RESISTANCEOF CONCRETE TO RAPID FREEZING AND THAWING
(CONCRETE DURABILITY)
This method covers the determination ofthe resistance of concrete beam specimens(4"x4"x18!t) to rapidly repeated cyclesof freezing in air and thawing in water.The Frocedure iaa slight modificationto ASTM C-666 Procedure B.
Procedure
2. A polished brass button shall becast into each end of each prismfor the purpose of providing asmooth reference surface forlength measurements.
3. Three specimens shall be cast foreach variable under study.
A. Apparatus
1. Freezing and thawing Apparatus, Temperature MeasuringEquipment, Dynamic TestingAppar~tus, Scales.
The freezing and, thawingapparatus, temperaturemeasuring, equipment, 'dynamic testing, apparatus,and scales shall' conformto ASTM C~666 Procedure B.
2. Length Comparator
The length comparator fordetermining the lengthchange of the specimensshall be accurate .eo O.OOOln.An invar steel- reference' baris provided for calibratingthe comparator.
3. Tempering Tank
The tempering tank is temperature controlled at 40 + 2°F.It is to be used for coolingspecimens prior to placementinto the freezing chamber.
D. Curing
1. Upon removal from their molds thetest specimens shall be placed inthe moist room for a period of notless than 89 days or not more than128 days.
2. Twenty-four hours prior to placement in the freeze-thaw apparatus,the specimens shall be placed inthe tempering tank.
E. Test Procedure
Beam Rotation
Prepare the order for random rota-ticn of the specimens as follows:
a. Prepare paper slips with thespecimen identification numbers for each specimen in thefreezing chamber.
b. Place all the paper slips ina pan.
c. Draw out the 'sLi.ps one at atime and record the resultingrando~ sequence.
Y.
B. Freeze-Thaw Cycle
C. Test Specimens
1. The freezing and thawingcycle shall be identical toASTM C-666 Procedure B.
,.
Move each successive specimenin the sequence into the position of the specimen precedingit.
b.
Rotate the beams in the followingmanner:
a. Withdraw the first specimenin the sequence and place itto one side.
Unless otherwise specifiedthe test specimens shall be4"x4"x18" prisms.
1.

PAGE 40Test Method No. Iowa 408-A Page 2 of 5April 1980
iII
IIII,I,
I•
b. 'Place the tone arm pickup onthe end of the specimen aboutmidway between the sides.
where:
c. On the oscilloscope, rotatethe large knob slowly backand forth until an elipseshape is formed on the cathoderay tube of the oscilloscope.
d. Set the "osc , Frequency" knobto " 1011 and read the frequencyfromXthe indicator on the oscil-·loscope. Add 1000 to this valueand record the number. obtained.
2.. From the recording charts, obtainthe number of, cycles completedsince the specimens were lastmeasured. (M~rk the date read andthe number of; cycles to that pointon the recording chart.) Add tothis number the number of cyclesat which the specimens were lastmeasured .. Record this cumulativevalue in the column ~_~e_~_~~9 1~_GygJ_§;_$_~_' ._
3. Subtract the" dial reading at zerocycles from the latest dial reading.Record this value in the columnlabeled "Gr'o . In'l.
driving 'oscillator is midwaybetween -t.he end of the specimen. Make sure the specimenis firmly against the backstops of the support.
4. Calculate the relative dynamic modulus of elasticity using the formula:
1. Record all the required data onthe "P.C. Concrete Durability" labworksheet.
7. continue each specimen in the testuntil it has been 'subjected to 300cycles or until' its' relative dynamic modulus reaches 60% of theinitial modulus, whichever occursfirst.
6. Repeat steps:2 through 5 for allof the specimens.
5. Replace the specimen in the freezechamber inve~ted from its originalposition.
F. Calculations
a. Place the specimen on thesupport such that the
Weigh the beam on the scale tothe nearest ~ -g'aam:s. Recordthe value obtalne .
c. Place· the specimen in thecomparator with the identification numbers facing upat the left end of the comparator. Care should beexe r-cLs ed to insure thatthe specimen is firmlyagainst the' back stopsand the right end of thecomparator.
e. If measuring three specimens at once, cover thoses pe_?_i.:rnen~ _irnrn_~c1.~__~_:t;g__bY..~9,.f__t_ex __r-emoviii~.rLr~om --the sub-zerounit with a towel soaked inthe thawing water.
b. Remove the specimen fromthe tempering tank or thefreezer depending uponwhether the beam is a newone or one with severalcycles on it.
d. Allow the dial indicatorto come to rest on thebrass button on the endof the specimen. Readthis value on the indicator to the nearest 0.0001".Record this value. Repeatthe measurement by completely removing the specimen from the comparator,replacing it, and remeasuring it until two successivereadings are equal.
a. Before any length measurement is taken, calibratethe beam comparator to0.0200 using the Invarsteel reference bar. Thisbar should be cooled forapproximately 30 minutesin water to 40°F. Adjustthe comparator dial ifneeded.
c. When the last specimen inthe sequence has been moved,replace it with the firstspecimen.
4. Dynamic Modulus
3. Weight Measurement
2. Length Measurements
iL .~--------------------

I PAGE 41
Page 3 of 5 Test Ne t hod No, Lowe 408-AApril 1980
n
relative dynamic modulusof elasticity after ccycles of freezing andthawing, percent
fundamental transversefrequency at 0 cycles offreezing and thawing
N number of cycles a t whLchP reaches the specifiedminimum valuE': for discontinuing the test or t hcspecified number of cyclesat which the exposure is tobe terminated, Whichever isless
,
!,5 .
fundamental transverseafter c cycles of freezing and thawing
Record this value in the columnlabeled "t of 017ig."
When all of the above calculations have been made for asimilar set of specimens, compute the average for the setfor the items "% of Orig." r
"cxo . %" I and "Gro . In".Compu.t;e "Gro . %" using theformula:
8.
~ specified number of cyclesat which exposure is to beterminated. (Three-hundredcycles in most cases.)
Report. The final report (worksheet) should be submit t ed to theGeology Section, and it shouldirtclude all data pertinent to ,thevariables or combination of variables studied in the evaluation.Also, any defects in each specimen which develop during tGstingand the number of cycles at whichsuch defects were noted should bedocumented on the worksr.eet.
where:
T the total number of specimens in the set.
G = average growth for the setof specimens in %.
s x 100TTl8T
G
S the sum of the growths foreach specimen.
6. Repeat the preceding steps foreach specimen.
DF = the durability factor ofthe specimen
Record these values in theappropriate columns on theworksheet.
I'
PNM
DF
where:
"T" should include only numberof specimens which showeda normal reading
7. Should it be desired to handcalcul?te the durability factor,use the following formula:
'i
P the relative dynamic modulus of elasticity at Ncycles, percent
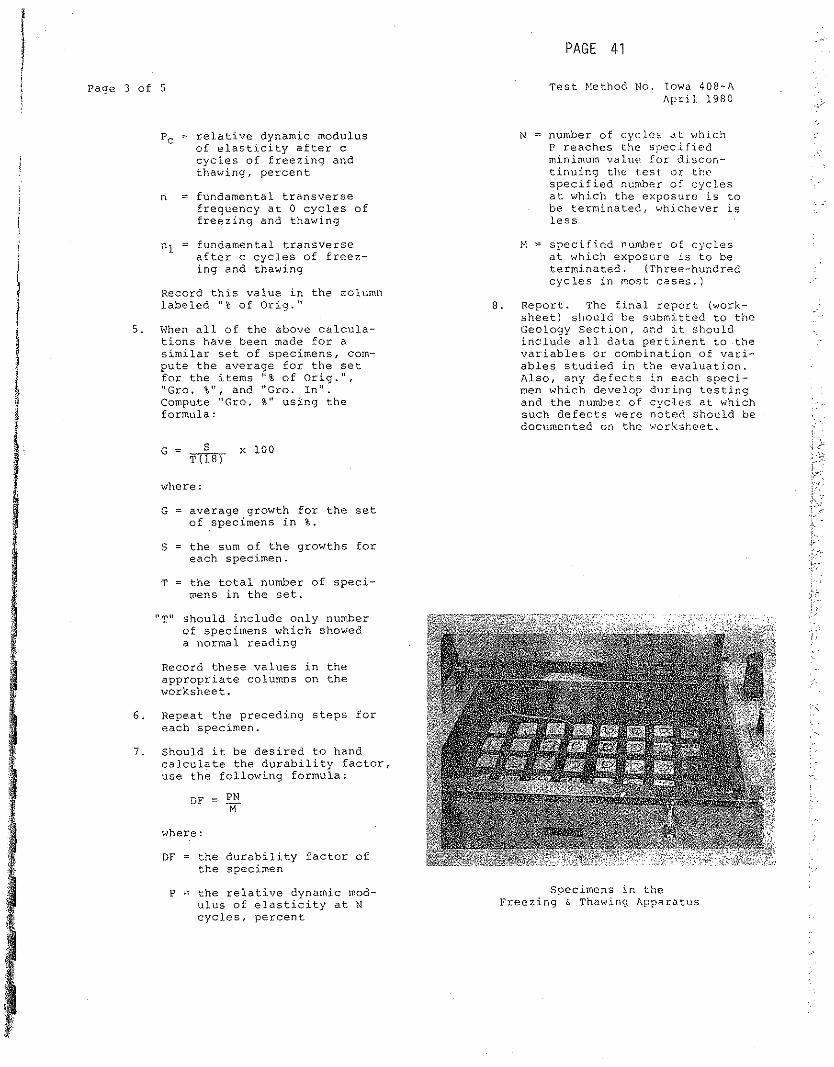
Specimens in theFreezing & Thawin0 Apparatus

PAGE 42Test Method No. Iowa 408-A
P.C. CONCRETE DURABILITYPage 5 of 5
w/c:
Cement:
Fine Agg. :
Coarse Agg. :
Mix:
r':'\.il. No.:
Date Mane:
Lab. Ne;,:
Cem. Content:
Sp. Gr.:
Sp , GX:.:
1-----
1----·----
Slump: . Air: _._._._.
Comments:
....•.---'-----------(0
fl. \)Z../sr:.
oz·/sk .
CYclesD~al
Rdq.
"---+----j----j---+---t-.----+----+-.-----