Evaluation of Fly Ash In Bridge Deck Concrete Project No ... · Evaluation of Fly Ash In Bridge...
49
Evaluation of Fly Ash In Bridge Deck Concrete Project No. MLR-84-2 Sam G. Moussalli Cement and Concrete Engineer Office of Materials Iowa Department of Transportation November 1985
-
Upload
truongliem -
Category
Documents
-
view
224 -
download
3
Transcript of Evaluation of Fly Ash In Bridge Deck Concrete Project No ... · Evaluation of Fly Ash In Bridge...

Evaluation of Fly Ash InBridge Deck Concrete
Project No. MLR-84-2
Sam G. MoussalliCement and Concrete Engineer
Office of MaterialsIowa Department of Transportation
November 1985
DISCLAIMER
The contents of this report reflectthe views of the author who isresponsible for the facts and theaccuracy of the data presentedherein. The contents do notnecessarily reflect the officialviews or policies of the IowaDepartment of Transportation. Thisreport does not constitute a standard, specification, or regulation.
Abstract
Fly ash was used in this evaluation study to replace 15% of the cement in
Class D-57 structural concrete containing ASTM C494 Type B, retarding
admixtures. Two Class "c" ashes and one Class "F" ash from Iowa approved
sources were examined in each mix. When Class "c" ashes were used, they were
substituted on the basis of 1.0 pound for each pound of cement removed. When
Class "F" ash was used, it was substituted on the basis of 1.25 pounds of ash
for each pound of cement removed.
Compressive strengths of the retarded mixes, with and without fly ash, were
determined at 7, 28 and 56 days of age. In most cases, with few exceptions,
the mixes containing the fly ash exhibited higher strengths than the same con
crete mix without the fly ash. The exceptions were the 7, 28, and 56 days of
the mixes containing Class F ash.
The freeze/thaw durability of the concrete studied was not affected by the
presence of fly ash. The data obtained suggested that the present Class D-57
structural concrete mix with retarding admixtures can be modified to allow the
substitution of 15% of the cement with an approved fly ash when Class III
coarse aggregates are used.
Setting times of the concretes were not materially changed due to the incorpo
ration of fly ash.
i
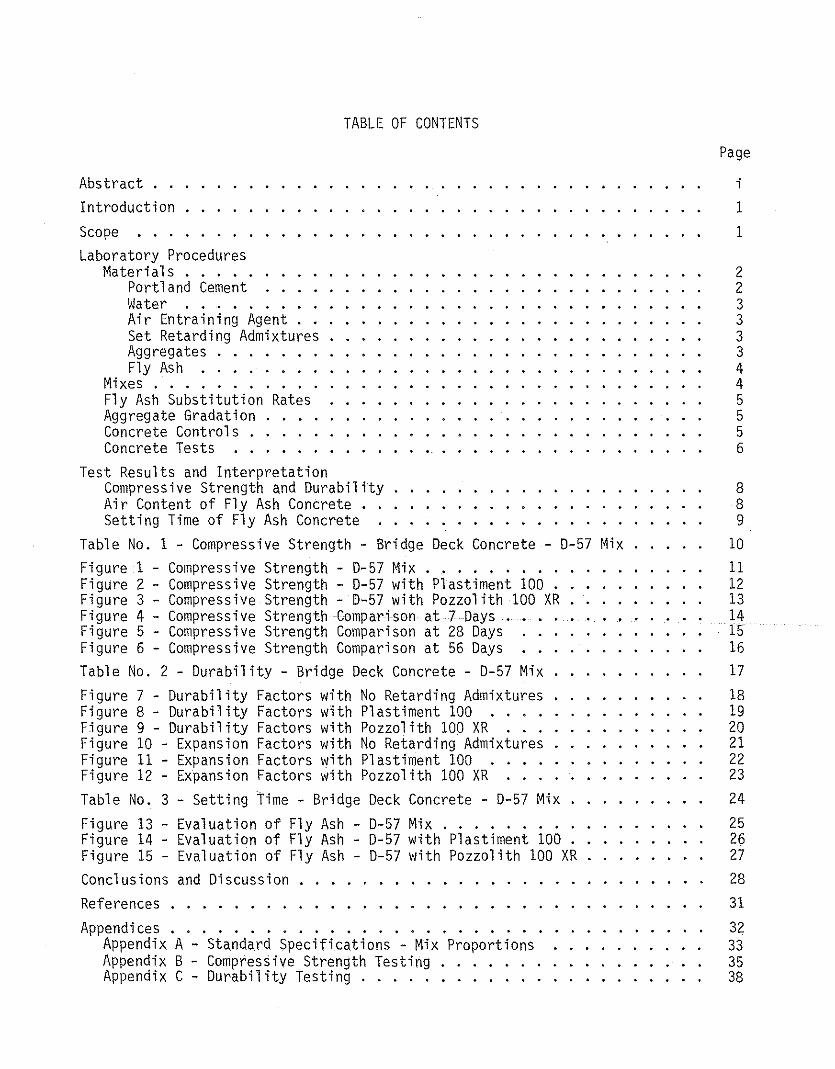
TABLE OF CONTENTS
Abstract ..IntroductionScopeLaboratory Procedures
Materials ...•.Portland CementWater . ., . . . •Air Entraining AgentSet Retarding AdmixturesAggregates . . . . . . .Fly Ash .
Mi xes . . . . . . . . . . .Fly Ash Substitution RatesAggregate GradationConcrete Controls .Concrete Tests .
Test Results and InterpretationCompress i ve Strength and Durabi 1ityAir Content of Fly Ash Concrete.Setting Time of Fly Ash Concrete
Table No. 1 - Compressive Strength - Bridge Deck Concrete - 0-57Figure 1 - Compressive Strength - 0-57 Mix . . . . . . ...Figure 2 - Compressive Strength - 0-57 with Plastiment 100 .Figure 3 - Compressive Strength - 0-57 with Pozzolith 100 XRFigure 4 - Compressive Strength Comparison at 7 Days .Figure 5 - Compressive Strength Comparison at 28 DaysFigure 6 - Compressive Strength Comparison at 56 DaysTable No.2 - Durability - Bridge Deck Concrete - 0-57 MixFigure 7 - Durability Factors with No Retarding AdmixturesFigure 8 - Durability Factors with Plastiment 100 ....Figure 9 - Durability Factors with Pozzolith 100 XRFigure 10 - Expansion Factors with No Retarding AdmixturesFigure 11 - Expansion Factors with Plastiment 100 ....Figure 12 - Expansion Factors with Pozzolith 100 XRTable No.3 - Setting Time - Bridge Deck Concrete - 0-57 MixFigure 13 - Evaluation of Fly Ash - 0-57 Mix .Figure 14 - Evaluation of Fly Ash - 0-57 with Plastiment 100Figure 15 - Evaluation of Fly Ash - 0-57 with Pozzolith 100 XRConclusions and DiscussionReferences . . . . . . .Appendi ces . . . . . . . . . . . . . . . . . . . .. .
Appendix A - Standard Specifications - Mix ProportionsAppendix B - Compressive Strength Testing ....•..Appendix C - Durability Testing .
Page
i11
223333445556
889
Mix 1011121314151617
18192021222324252627283132333538
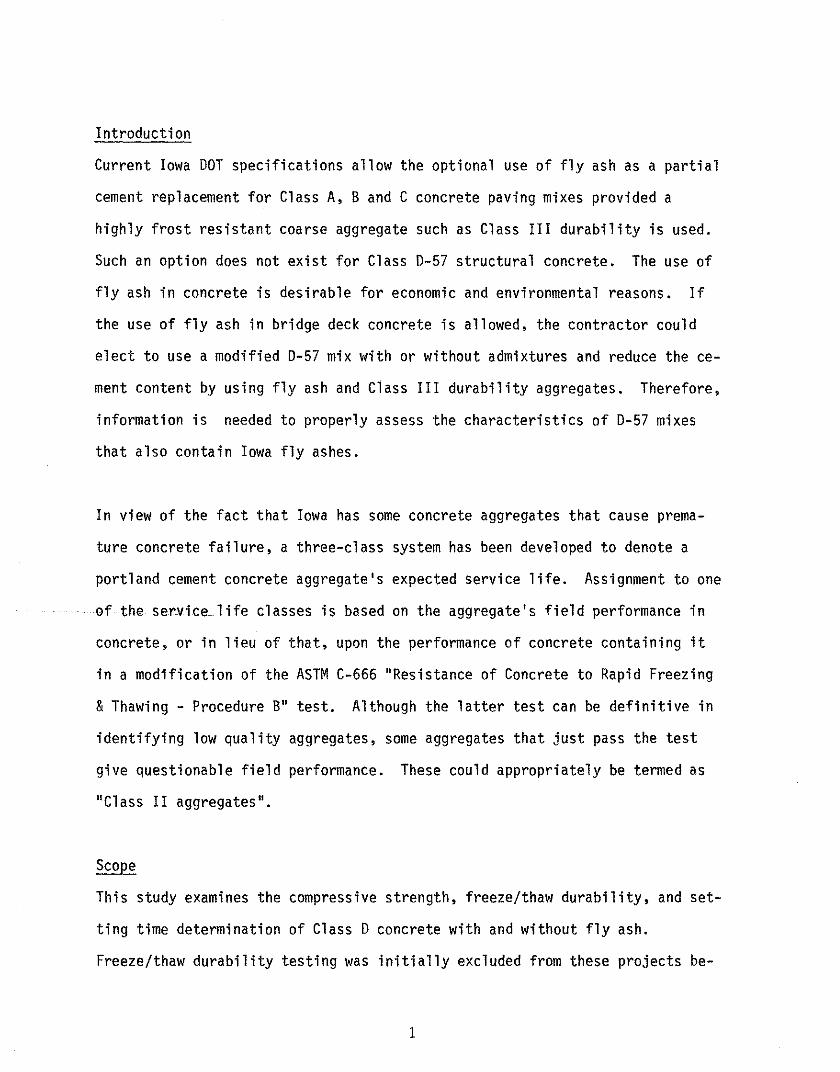
Introduction
Current Iowa OOT specifications allow the optional use of fly ash as a partial
cement replacement for Class A, Band C concrete paving mixes provided a
highly frost resistant coarse aggregate such as Class III durability is used.
Such an option does not exist for Class 0-57 structural concrete. The use of
fly ash in concrete is desirable for economic and environmental reasons. If
the use of fly ash in bridge deck concrete is allowed, the contractor could
elect to use a modified 0-57 mix with or without admixtures and reduce the ce
ment content by using fly ash and Class III durability aggregates. Therefore,
information is needed to properly assess the characteristics of 0-57 mixes
that also contain Iowa fly ashes.
In view of the fact that Iowa has some concrete aggregates that cause prema
ture concrete failure, a three-class system has been developed to denote a
portland cement concrete aggregate's expected service life. Assignment to one
of the servi£elife classes is based on the aggregate's field performance in
concrete, or in lieu of that, upon the performance of concrete containing it
in a modification of the ASTM C-666 "Resistance of Concrete to Rapid Freezing
& Thawing - Procedure B" test. Although the latter test can be definitive in
identifying low quality aggregates, some aggregates that just pass the test
give questionable field performance. These could appropriately be termed as
"Class II aggregates".
Scope
This study examines the compressive strength, freeze/thaw durability, and set
ting time determination of Class 0 concrete with and without fly ash.
Freeze/thaw durability testing was initially excluded from these projects be-
1
cause the likelihood of reduced durability when these combinations were used
with Class III aggregates was unlikely. The D-57 structural concrete mix has
a cement factor of 710 pounds per cubic yard and was studied in combination
with three fly ashes currently used in Iowa.
The fly ashes studied conformed to ASTM C-618, "Fly Ash and Raw or Calcined
Natural Pozzolan for Use as a Mineral Admixture in Portland Cement Concrete".
One fly ash was a Class "F" and the other two were Class "C". Of the two
Class "C" fly ashes used, one was considered to be a reactive ash in terms of
setting time and heat of hydration when the pure ash is mixed with water. The
other Class "C" fly ash would be considered less reactive in this regard.
The retarding admixtures used in this study belong to two major chemical cate
gories. The first of these are the metallic salt of hydroxylated carboxylic
acid. Included in this category is the Plastiment 100. The second category
is the modification and derivatives of carbohydrates and polyols. Included in
this category is the Pozzolith 100XR.
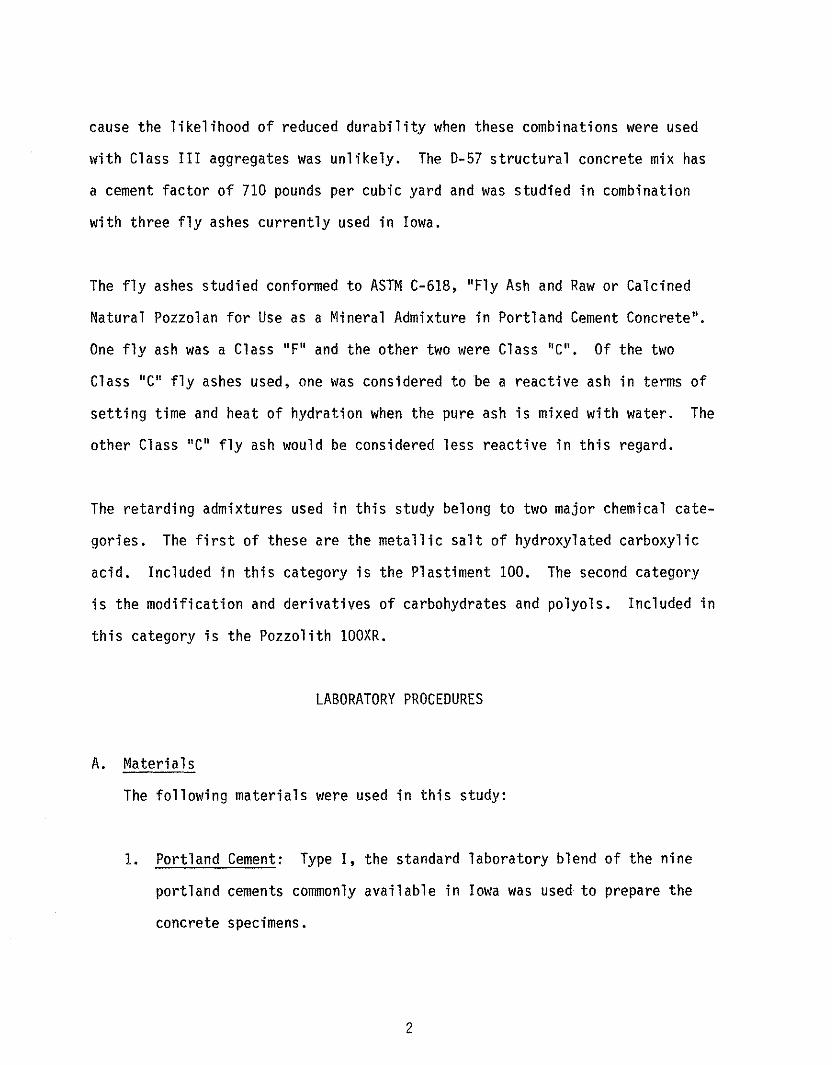
LABORATORY PROCEDURES
A. Materials
The following materials were used in this study:
1. Portland Cement: Type I, the standard laboratory blend of the nine
portland cements commonly available in Iowa was used to prepare the
concrete specimens.
2

2. Water: City of Ames.
3. Air Entraining Agent: Neutralized vinsol resin Carter-Waters single
strength, Lab No. ACA4-12.
4. Set Retarding Admixtures: Pozzolith 100XR, Master Builders, Dosage
Rate 3 fl. oz./100 lbs. of cement. Lab No. AC14-208.
Plastiment 100, Sika Chemical Corporation, Dosage Rate 3 fl. oz./100
lbs. of cement. Lab No. ACI4-209.
5. Coarse Aggregate (Strength Testing) Weaver Construction - Fort Dodge
Crushed Stone - Lab No. AAC4-0003.
Coarse Aggregate (Durability Testing) Weeping Water Mine - Martin
Marietta, Nebraska - Lab No. AAC4-0739.
6. Fine Aggregate (Strength Testing) Hallett Sand - Christensen Ames Pit
- Lab No. AAS4-0001.
Fine Aggregate (Durability Testing) Bellevue Sand &Gravel - Lab No.
AAS4-0015.
3

7. FlyAsh
Three fly ash sources were sampled for inclusion in the evaluation
study.
Lansing, Iowa - Reactive Class "C" ash (self cementing), Lab No.
ACF4-5
Ottumwa, Iowa - Mildly Reactive Class "C" ash (self cementing), Lab
No. ACF4-1
Clinton, Iowa - Class "F" ash (non cementing), Lab No. ACF4-4
B. Mixes
The following concrete mixes were prepared:
Approximate
Cement Content
Mix No. Description lb/yd 3
======= =========== ==============
1 D-57 710
2 Mix No. 1 with Lansing Fly Ash 604
3 Mix No. 1 with Ottumwa Fly Ash 604
4 Mix No. 1 with Clinton Fly Ash 604
5 D-57 with Plastiment 100 710
6 Mix No. 5 with Lansing Fly Ash 604
7 Mix No. 5 with Ottumwa Fly Ash 604
8 Mix No. 5 with Clinton Fly Ash 604
9 D-57 with Pozzolith 100XR 710
10 Mix No. 9 with Lansing Fly Ash 604
11 Mix No. 9 with Ottumwa Fly Ash 604
12 Mix No. 9 with Clinton Fly Ash 604
4

C. Fly Ash Substitution Rates:
Fly ash was substituted for 15%, by weight of the portland cement in all
cases. The sUbstitution of Class "C" fly ash was on a pound-for-pound ba
sis. When Class "F" fly ash was substituted, it was on the basis of add
ing 1.25 pounds of fly ash for each pound of cement removed. The change
in absolute volumes due to the fly ash substitution, was applied to each
aggregate in its proper ratio. For the D-57 mix, the volumes are 50% fine
aggregate, 50% coarse aggregate.
D. Aggregate Gradation
The coarse aggregate gradation was:
Sieve No.
=========
%Passing
=========
1.0" 100
3/4" 89
1/2" 40
3/8" 8.0
No. 4 0.8
No. 8 0.4
E. Concrete Controls
Concrete mixes were controlled to a slump of 2.0" ± 1/2" and air content
of 6.0% ± 0.5%.
5
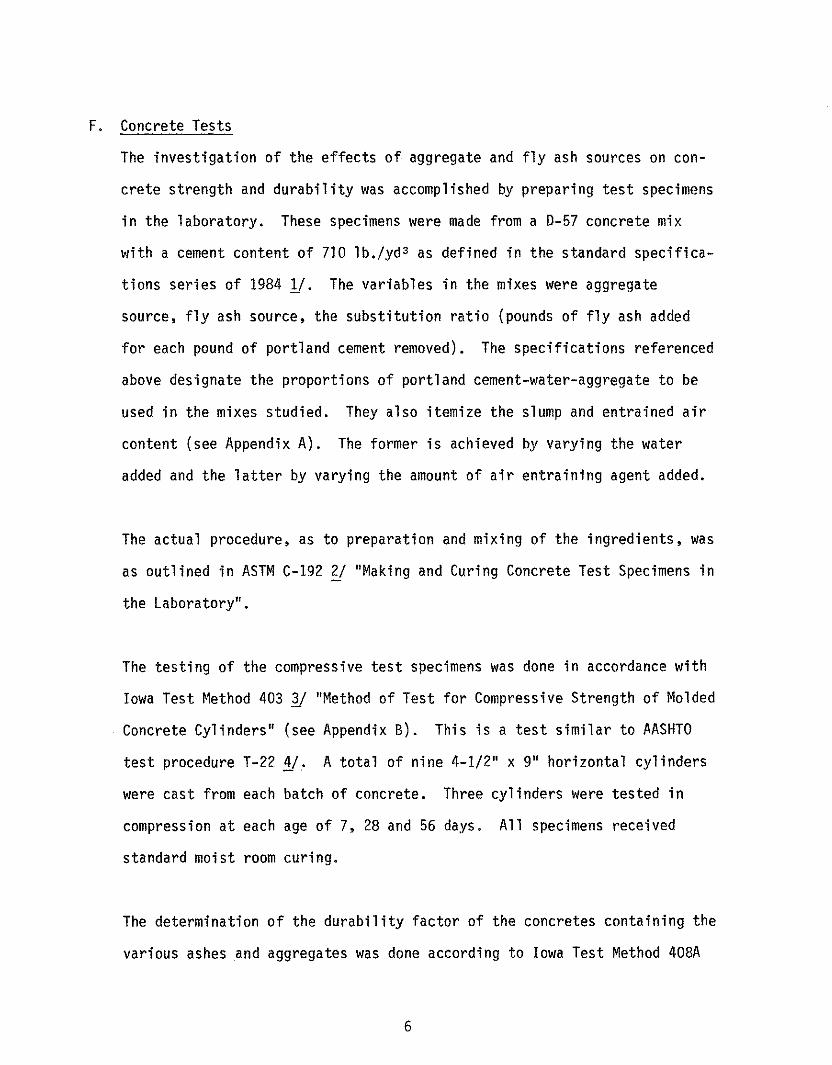
F. Concrete Tests
The investigation of the effects of aggregate and fly ash sources on con
crete strength and durability was accomplished by preparing test specimens
in the laboratory. These specimens were made from a D-57 concrete mix
with a cement content of 710 lb./yd 3 as defined in the standard specifica
tions series of 1984 1/. The variables in the mixes were aggregate
source, fly ash source, the sUbstitution ratio (pounds of fly ash added
for each pound of portland cement removed). The specifications referenced
above designate the proportions of portland cement-water-aggregate to be
used in the mixes studied. They also itemize the slump and entrained air
content (see Appendix A). The former is achieved by varying the water
added and the latter by varying the amount of air entraining agent added.
The actual procedure, as to preparation and mixing of the ingredients, was
as outlined in ASTM C-192 ~ "Making and Curing Concrete Test Specimens in
the Laboratory".
The testing of the compressive test specimens was done in accordance with
Iowa Test Method 403 3/ "Method of Test for Compressive Strength of Molded
Concrete Cylinders" (see Appendix B). This is a test similar to AASHTO
test procedure T-22 4/. A total of nine 4-1/2" x 9" horizontal cylinders
were cast from each batch of concrete. Three cylinders were tested in
compression at each age of 7, 28 and 56 days. All specimens received
standard moist room curing.
The determination of the durability factor of the concretes containing the
various ashes and aggregates was done according to Iowa Test Method 408A
6

~ "Method of Test for Determining the Resistance of Concrete to Rapid
Freezing and Thawing" (see Appendix C). This test is a modification of
ASTM C-666 Procedure B ?J in that the 4" x 4" concrete beams are 18" in
length rather than 11" to 16" and 90-day moist room cure is substituted
for the 14-day lime water cure.
A total of three 4" x 4" x 18" beams were cast from each batch prepared
for the durability testing. The beams were cured for 90 days in the
moisture room.
Upon completion of the appropriate curing period, the beams were subjected
to cyclic freezing and thawing with periodic sonic modulus and change in
length readings taken twice a week. This was continued until they had
undergone 300 cycles of freezing and thawing or until the specimen's rela
tive dynamic modulus of elasticity reached 60% of the initial modulus,
whichever occurs first.
The coarse aggregates used in the concrete currently are approved as Class
III durability aggregates which will produce concrete with an expected
maximum service life.
7

TEST RESULTS AND INTERPRETATION
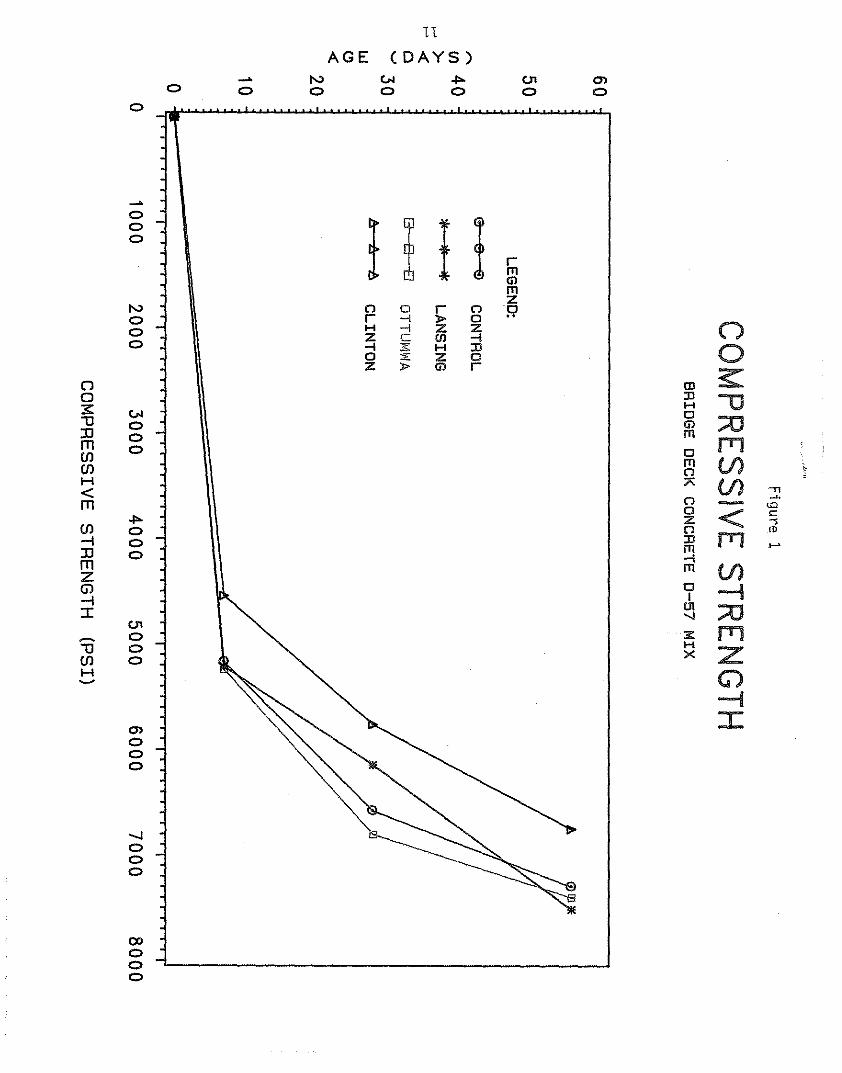
Compressive Strength and Durability
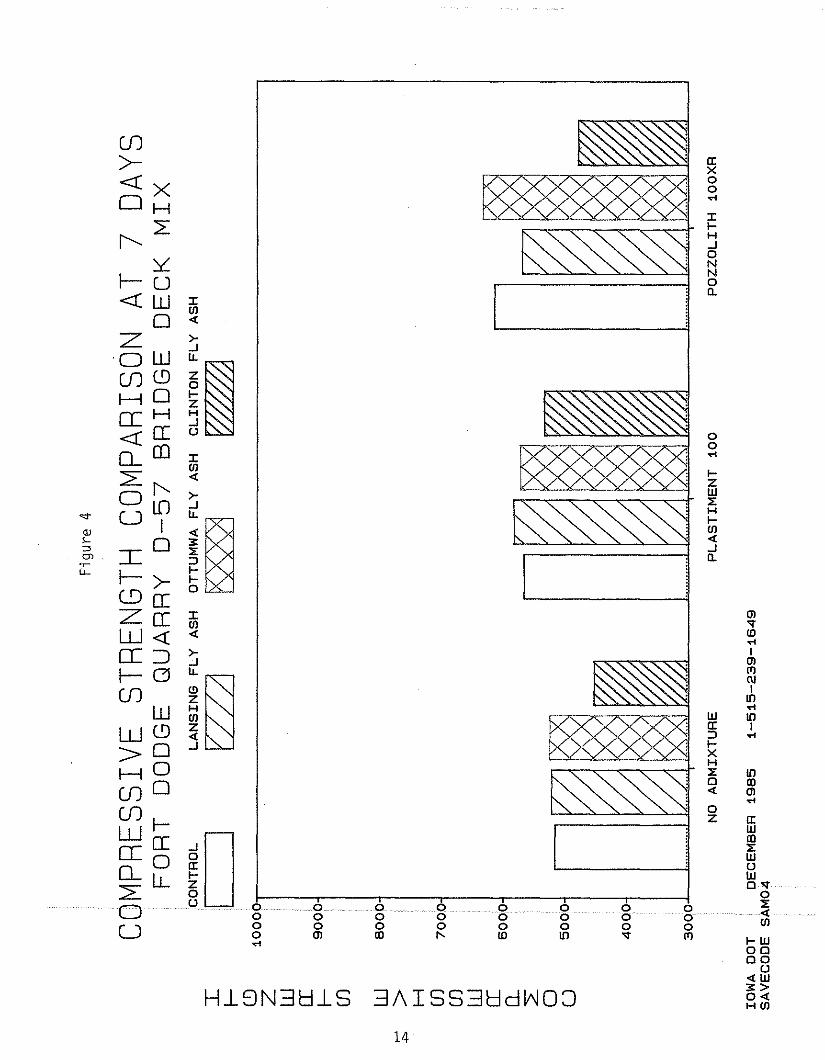
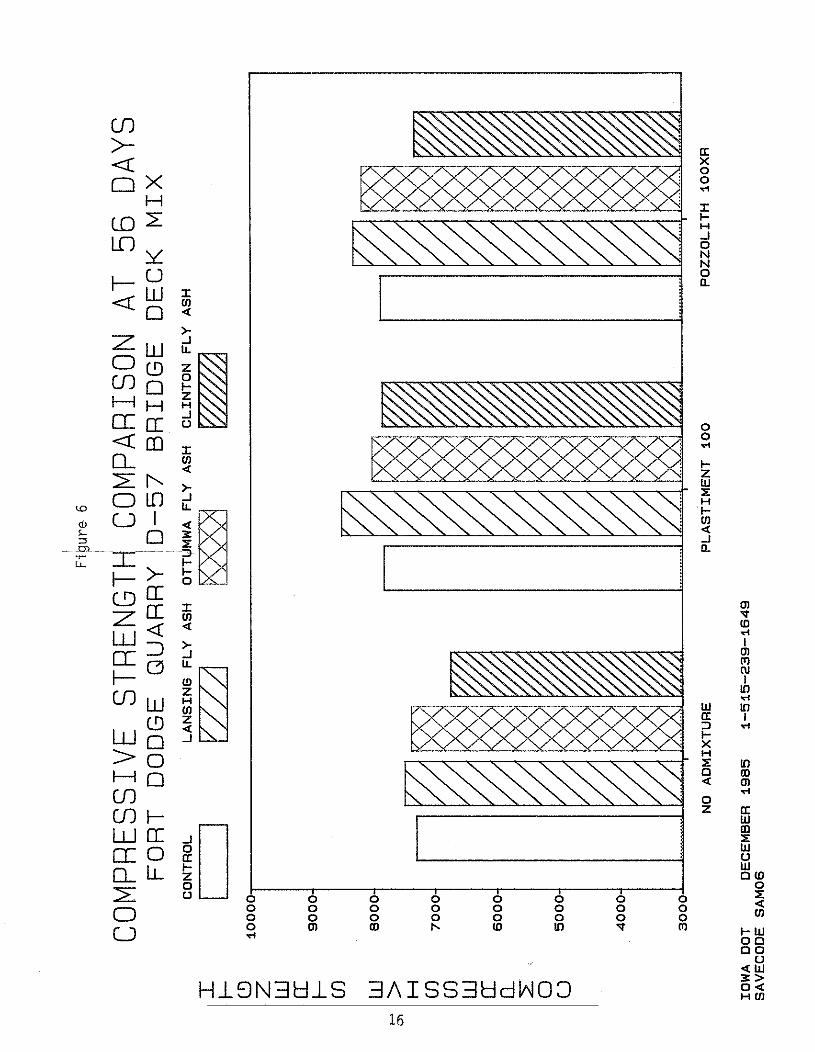
Table No. 1 shows the concrete mix characteristics and compressive strength
results for the 0-57 mix. The strength values for the various combinations of
materials are graphically presented in Figures 1-3. Each strength value indi
cated is the average of three cylinders. Strength comparisons are also de
picted graphically in Figures 4-6 to show the relative strengths of the mixes
at 7, 28 and 56 days. In most cases, with few exceptions, the concrete con
taining fly ash exhibited higher compressive strengths than the corresponding
control concretes without the fly ash. The exceptions were the 7, 28 and 56
days of the mixes containing the Class "F" ash from Clinton. In summary, ac
ceptable concrete strengths can be produced using either Class "c" or "F" ash
provided the proper substitution ratio and percent replacement is used.
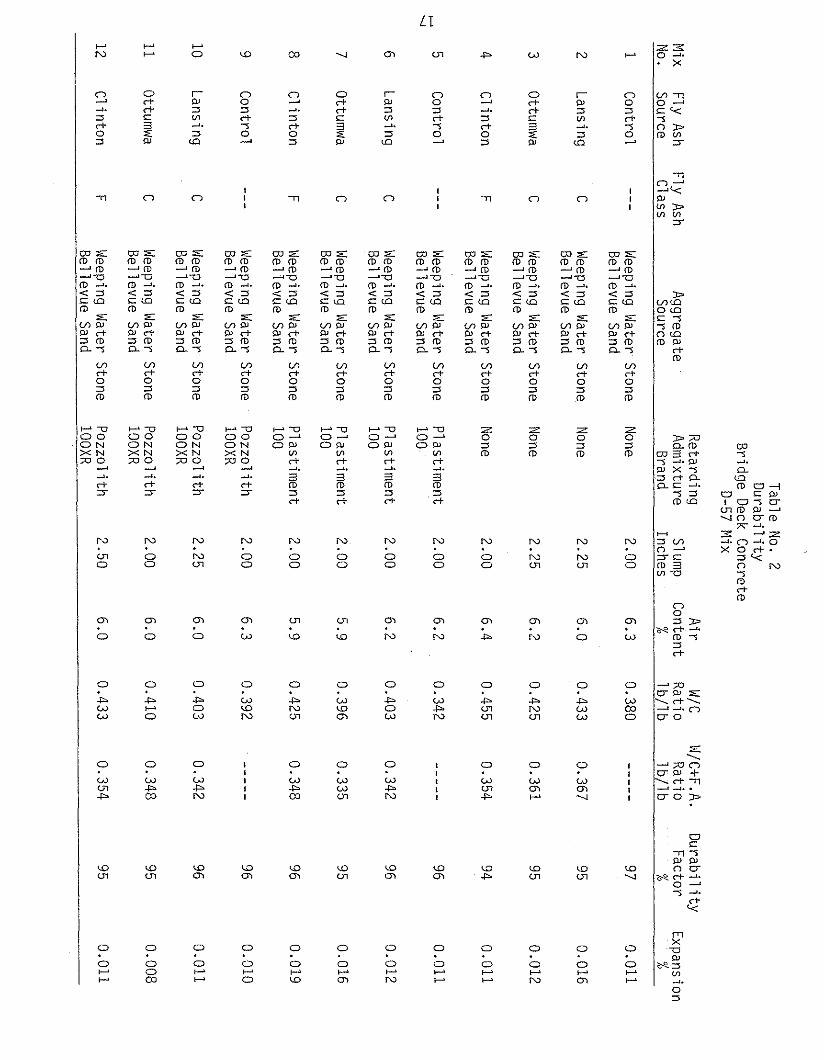
Table No.2 itemizes the freeze/thaw durability characteristics for the con
crete studied. There was no significant difference in the frost resistance of
any of the concretes studied. The results of the durability factors in combi
nation with the three ashes and retarding admixtures used in this evaluation
study are shown in Figures 7-9. The expansion factors of the same combina
tions are graphically presented in Figures 10-12.
Air Content of Fly Ash Concrete
It should be noted that one of the common problems which has been encountered
with the use of fly ash in concrete is the effect on entrained air content.
Failure to increase the amount of air entraining agent to compensate for the
negative effect of the presence of fly ash can produce concrete with a lower
8
than desired air content. This can then result in the premature failure of
concrete due to the action of freezing and thawing processes.
Observations made during the preparation of the concrete mixes discussed in
this report indicate that the necessary increase in air entraining agent is
less when using Class "C" ash than when using Class "F" ash. The actual re
quired increase in air entraining agent of the vinsol resin type varies pro
portionally with the amount of ash and cement in the concrete. In the case of
a 15% cement replacement, the necessary increase has been approximately 8-10%
for Class "F" ash and 5-8% for Class "C" ash.
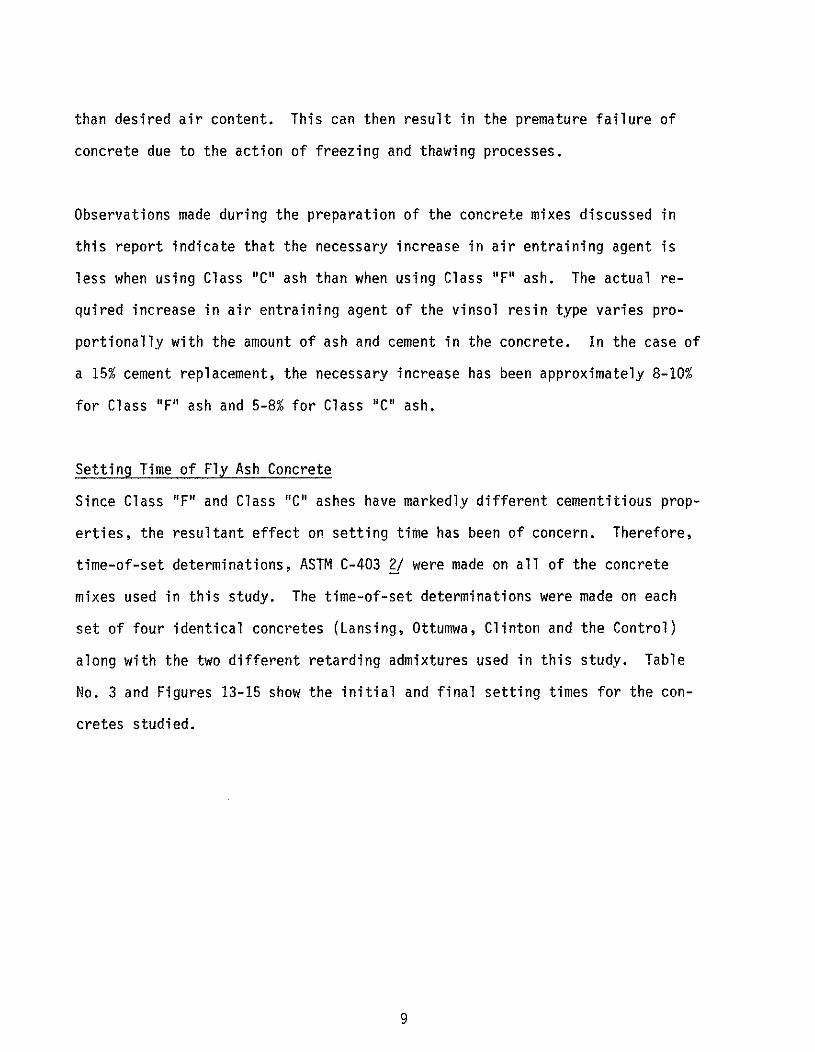
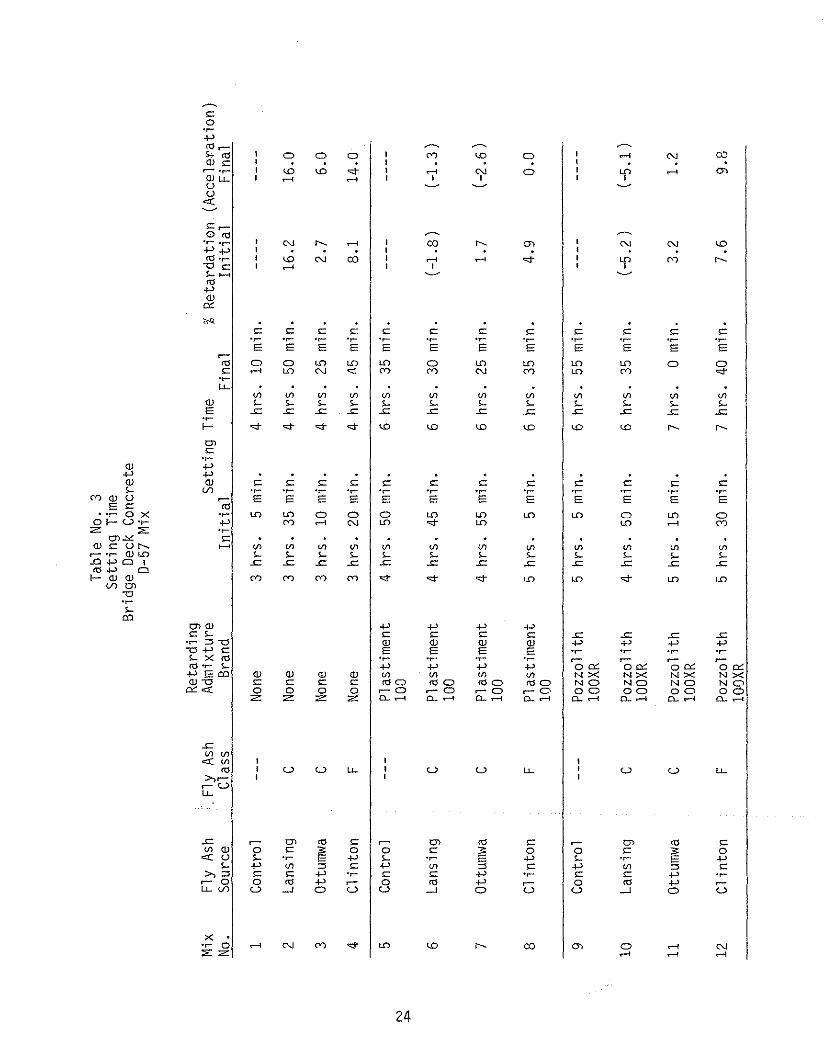
Setting Time of Fly Ash Concrete
Since Class "F" and Class "C" ashes have markedly different cementitious prop
erties, the resultant effect on setting time has been of concern. Therefore,
time-of-set determinations, ASTM C-403 f! were made on all of the concrete
mixes used in this study. The time-of-set determinations were made on each
set of four identical concretes (Lansing, Ottumwa, Clinton and the Control)
along with the two different retarding admixtures used in this study. Table
No.3 and Figures 13-15 show the initial and final setting times for the con
cretes studied.
9

Tab
leN
o.1
Com
pres
sive
Str
engt
hB
ridg
eD
eck
Con
cret
eD
-57
Mix
Ret
ardi
ngA
ir\4
/CW
/C+F
.A.
Com
pres
sive
Str
engt
hf·1i
xFl
yAs
hFl
yA
shA
ggre
gate
Adm
ixtu
reSl
ump
Con
tent
Rat
ioR
atio
.PSI
.N
o.So
urce
Clas
sSo
urce
Bra
ndIn
ches
%1b
/lb
1b/l
b7-
day
28~day
56-d
ay
1C
ontr
ol---
Ft.
Dod
geSt
one
Non
e2.
006.
30.
392
----
-51
7065
8073
00Ha
11ett
Sand
2L
ansi
ngC
Ft.
Dod
geSt
one
Non
e2.
256.
30.
437
0.37
152
1061
4075
10Ha
11ett
Sand
3O
ttum
wa
CFt
.D
odge
Ston
eN
one
2.25
6.0
0.44
40.
375
5240
6800
7400
Hal
lett
Sand
4C
linto
nF
Ft.
Dod
geSt
one
Non
e2.
256.
20.
463
0.36
745
4057
6067
50Ha
11ett
Sand
5C
ontr
ol--
-F
t.D
odge
Ston
eP
last
imen
t2.
006.
30.
370
----
-56
6068
4078
30.....
Ha11
ett
Sand
100
0
6L
ansi
ngC
Ft.
Dod
geSt
one
Pla
stim
ent
2.25
6.0
0.40
70.
346
5840
7700
8520
Hal
lett
Sand
100
7O
ttum
wa
CFt
.D
odge
Ston
eP
last
imen
t2.
506.
30.
407
0.34
657
2076
0080
40Ha
11ett
Sand
100
8C
lint
onF
Ft.
Dod
geSt
one
Pla
stim
ent
2.00
6.3
0.42
90.
352
5320
6820
7850
Hal
lett
Sand
100
9C
ontr
a1--
-Ft
.D
odge
Ston
ePo
zzol
ith
2.00
6.2
0.37
0--
---
6150
7620
7880
Ha11
ett
Sand
100X
R
10L
ansi
ngC
Ft.
Dod
geSt
one
Poz
zoli
th2.
256.
30.
407
0.34
657
0076
5083
20Ha
11ett
Sand
100X
R
11O
ttum
wa
CFt
.D
odge
Ston
ePo
zzo1
ith
2.00
6.0
0.41
00.
349
6340
7780
8200
Hal
lett
Sand
100X
R
12Cl
into
nF
Ft.
Dod
geSt
one
Poz
zoli
th2.
506.
00.
433
0.35
5.47
9070
4073
40H
alle
ttSa
nd10
0XR
·,/~"i
Figure
1
CO
MP
RE
SS
IVE
STR
EN
GTH
BRIDG
EDECK
CONCRETED
-57M
IX
6050LEGEND:
€Ie
eCONTROL
,.,III40
~:/I
>Itl!<
LAN
SING
......>-
OTTUMW
A......
«l
00
00....,
30b
AA
CLINTO
NW
~o-c
2010o~""""""""""",..,....",...,....,..:."
,,:
,,,,,,,,,,,,,,,,,,,,,,,,,,,Io
10002000
30004000
50006000
70008000
CO
MPR
ESSIVE
STRENG
TH(PSI)

60
Fig
ure
2
CO
MP
RE
SS
IVE
STR
EN
GTH
BR
IDG
ED
ECK
CON
CRET
E0
-57
MIX
WIT
HPL
AST
IMEN
T10
0
50LE
GEN
D:
ee
ElCO
NTR
OL
,... (J)
403
'"liE
'"LA
NS
ING
....>-
N-c
~o
00
OTT
UM
WA
0 'V30
Ae.
AC
LIN
TON
3w o -c
20 10 o
o20
0040
0060
0080
0010
000
CO
MPR
ESSI
VE
STRE
NG
TH(P
SI)
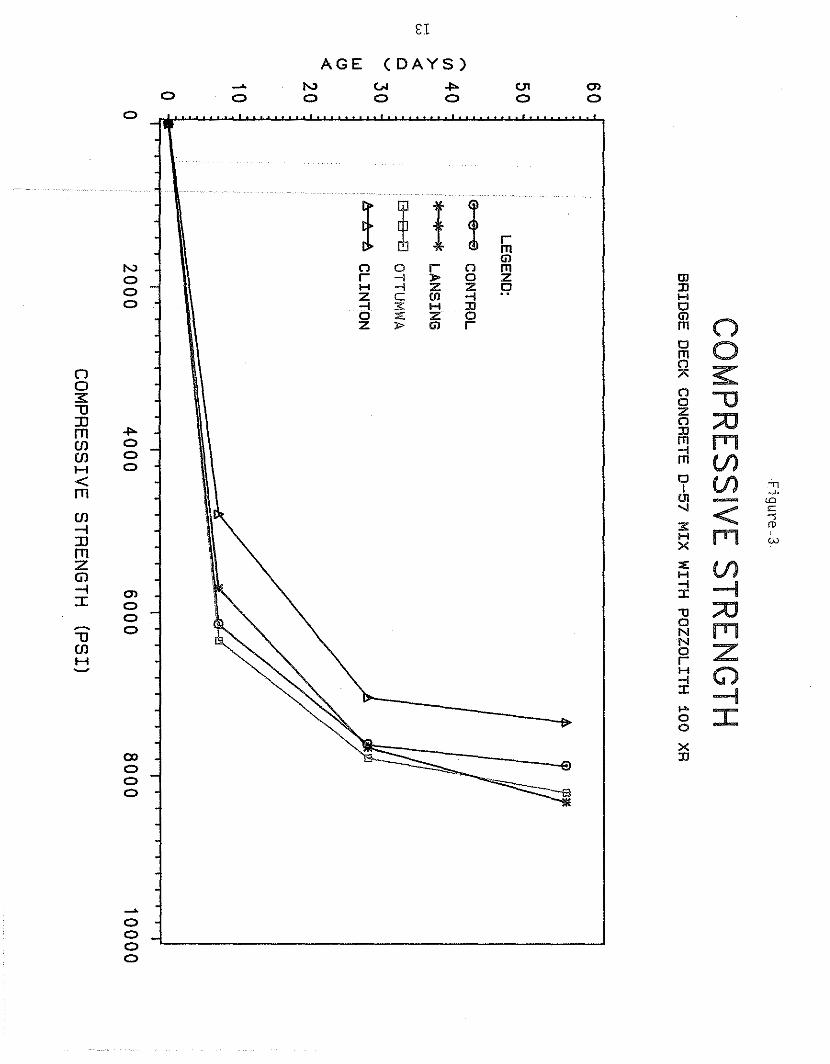
Figure3
CO
MP
RE
SS
IVE
STR
EN
GTH
BR
IDG
EDECK
CON
CRETED
-57M
IXW
ITHPO
ZZOLITH
100XR
6050
,...Ul40
>-'
>w
4:c.......30
wC>4:2010
LEGEN
D:
e€I
€ICO
NTRO
L
'"'1'*
LAN
SING
OD
DO
TTUM
WA
AA
t::.C
LINTO
N
ot""":"""""",,:"::,::,,,,,,,,,,,,,,,,,,Io
20004000
60008000
10000
CO
MPR
ESSIVE
STRENGTH
(PSI)
Figu
re4
DAYS
MIX
COM
PRES
SIV
EST
REN
GTH
COM
PARI
SON
AT7
FOR
TD
OD
GE
QU
AR
RY
0-5
7B
RID
GE
DEC
K
10
00
0.'--------------------------------------------l'
W&
j~
LA
NSI
NG
FLY
ASH
OTT
UM
WA
FLY
ASH
CL
INT
ON
FLY
ASH
PT//1
CO
NTR
OL
II
BOO
O
700.
0
40
00
90
00
50
00
60
00
3000
..l--
-...l
.
I f e..!) Z W IT f U1 W > H U1 U1 W IT o, 2: o U
......
.."
NOA
DM
IXTU
RE
PLA
STIM
EN
T1
00
POZ
ZO
LIT
H10
0XR
IOW
AD
OT
DEC
EMB
ER19
B5
1-5
15
-23
9-1
64
9SA
VEC
OD
ESA
M04

Figure5
COM
PRESSIVE
STRENGTHCOM
PARISONAT
28DAYS
FOR
TD
OD
GE
QU
AR
RY
0-5
7B
RID
GE
DEC
KM
IX
10
00
0,
I
OTTU
MW
AFL
YA
SHC
LIN
TO
NFL
YA
SH
PQQQ1W
&L
AN
SING
FLY
ASH
P77/1C
ON
TRO
L
II
30
00
I1...
11/...../.
.1I/...'\L
.'\IV
,LL
LI
I.".1
I/.:../.:...1IL
.'\L.'\I
[L.U
L'
1-1
1/.:.../.:..-11/,:,'\/","-1
IL:L
:?L
I!
iii
50
00
40
00
70
00
80
00
60
00
90
00
Ile.!)
ZWITIUJW~
>HUJUJWIT0..LoU
NO
AD
MIX
TU
RE
PLA
STIM
EN
T1
00
PO
ZZ
OL
ITH
100XR
IOW
AD
OT
DE
CE
M8E
R1
98
51
-51
5-2
39
-16
49
SAV
EC
OD
ESA
M05
Figu
re6
COM
PRES
SIV
EST
RENG
THCO
MPA
RISO
NAT
56DA
YSFO
RT
DO
DG
EQ
UA
RR
Y1
0-5
7B
RID
GE
DEC
KM
IXO
TTU
MW
AFL
YA
SHC
LIN
TO
NFL
YA
SH
K>QQ
1W
Mj
LA
NSI
NG
FLY
ASH
PT//1
CO
NTR
OL
II
70
00
50
00
30
00
II..
.1IL
.L
I,IL
:'../.
:'..i
rLL
LL
!I.
....
..!
ILL
.I1/
.:'../
..':\1
rLL
LL
!1
.1IL
./..
I1/
..>'/.
.\.1
ILL
??
!1
Ii
40
00
80
00
90
00
60
00
10
00
0,
I
I I (9 Z W [[
ן- m w
~I> H m co w [[ 0..
2: o U
NOA
OM
IXTU
RE
PLA
STIM
EN
T1
00
POZ
ZO
LIT
H10
0XR
IOW
AD
OT
DEC
EMB
ER1
98
51
-51
5-2
39
-16
49
SAV
ECO
DE
SAM
06
Table
No
.2D
urabilityB
ridgeD
eckC
oncrete0-57
~1ix
Retarding
Air
W/C
W/C+F.A
.D
urabilityM
ixFly
Ash
FlyA
shA
ggregateA
dmixture
Slump
Content
Ratio
Ratio
Factor
Expansion
No.
SourceClass
SourceB
randInches
%1b/lb
lb/lb
%%
1C
ontrol---
Weeping
Water
StoneN
one2.00
6.30.380
-----97
0.011Be11evue
Sand
2L
ansingC
Weeping
Water
StoneN
one2.25
6.00.433
0.36795
0.016Be11evue
Sand
3O
ttumw
aC
Weeping
Water
StoneN
one2.25
6.20.425
0.36195
0.012Be11evue
Sand
4Clinton
FW
eepingW
aterStone
None
2.006.4
0.4550.354
940.011
Be11evueSand
5C
ontrol---
Weeping
Water
StoneP
lastiment
2.006.2
0.342-----
960.011
......'-J
Bellevue
Sand100
6L
ansingC
Weeping
Water
StoneP
lastiment
2.006.2
0.4030.342
960.012
Be11evueSand
100
7O
ttumw
aC
Weeping
Water
StoneP
lastiment
2.005.9
0.3960.335
950.016
Be11evueSand
100
8C
lintonF
Weeping
Water
StoneP
lastiment
2.005.9
0.4250.348
960.019
Bellevue
Sand100
9C
ontrol---
Weeping
Water
StoneP
ozzolith2.00
6.30.392
-----
960.010
Bellevue
Sand100X
R
10L
ansingC
Weeping
Water
StonePozzolith
2.256.0
0.4030.342
960.011
Bellevue
Sand100XR
11O
ttumw
aC
Weeping
Water
StonePozzo
1ith2.00
6.00.410
0.34895
0.008Be11evue
Sand100XR
12C
lintonF
Weeping
Water
StoneP
ozzolith2.50
6.00.433
0.35495
0.011Be11evue
Sand100XR

Fig
ure
7
DU
RABI
LITY
FACT
ORS
WIT
HNO
RETA
RDIN
GAD
MIX
TURE
SW
EEPI
NGW
ATER
GUAR
RY0-
57BR
lPG
EDE
CKM
IXC
lli'fm
Ol.
LAN
SIN
GF
LYAS
HO
TTUM
WA
FLY
ASH
CLI
NTO
NF
LYAS
H_
._-
~~
i
a:: o I-,...
t.:l
co« u
,
)0
I H ..J H III « a:: ::J o
90
..-
"X
--~
•-
=-
:;011
300
100
200
FREE
ZE-T
HAW
CYCL
ES
80
'I
II
I
e
IOW
ACl
OTDE
CEl4B
ER19
851
-51
5-2
39
-16
49
SAVE
CODE
SAH
lIl
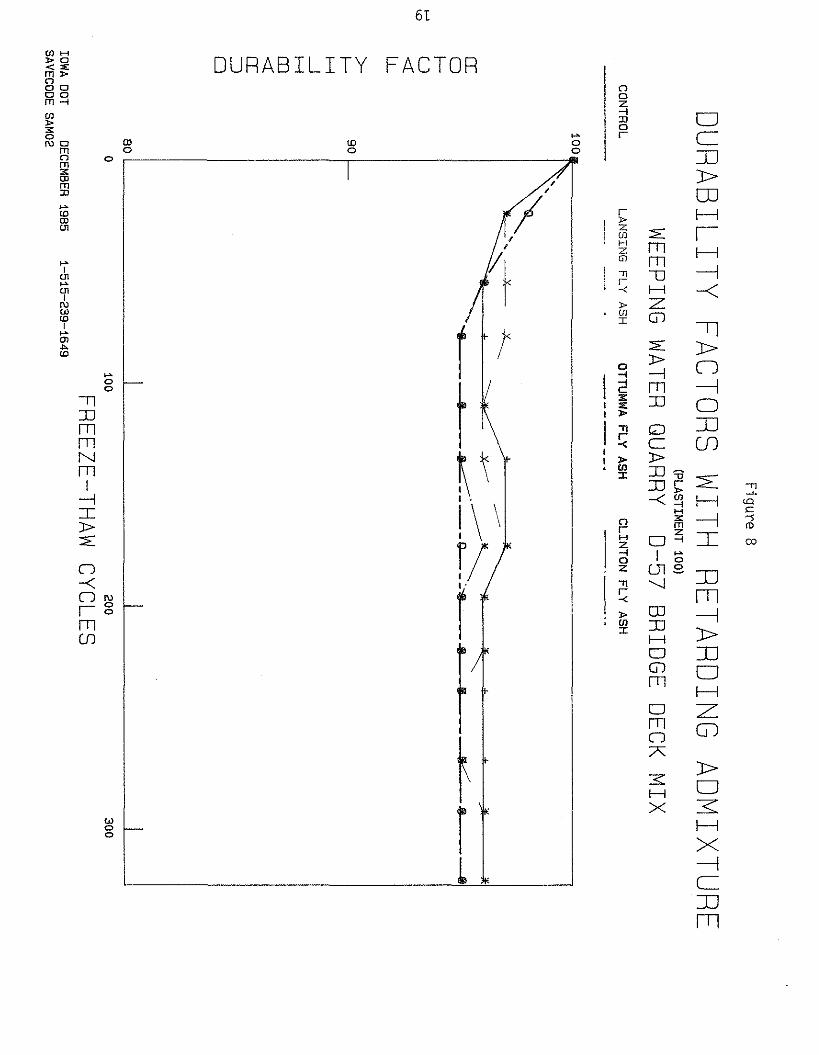
Fig
ure
8
DU
RABILITY
FACTORSW
ITHRETA
RDIN
GADM
IXTURE(PLASTIM
ENT100)
WEEPING
WATER
QUARRY0-57
BRIDG
EDECK
MIX
CONTROLLA
NSIN
GFLY
ASHOTTUM
WA
FLYASH
CLINTO
NFLY
ASH
..~
'"
..-
»>
~..x----
*---"'*,,+
+)Ii
*1~
~.
~$
I~----_--
G&
...
100~,
I~"
,"--_~
~+
-----0::oIU<
rLL>-
90I--
I-H-I
Hm<r:0:::Jo
.....to
I300I200
FREEZE-THA
WCYCLES
I10080
II
o
IOWA
OOTOECEM
BER1985
1-515-239-1649SAVECOOE
SAM02
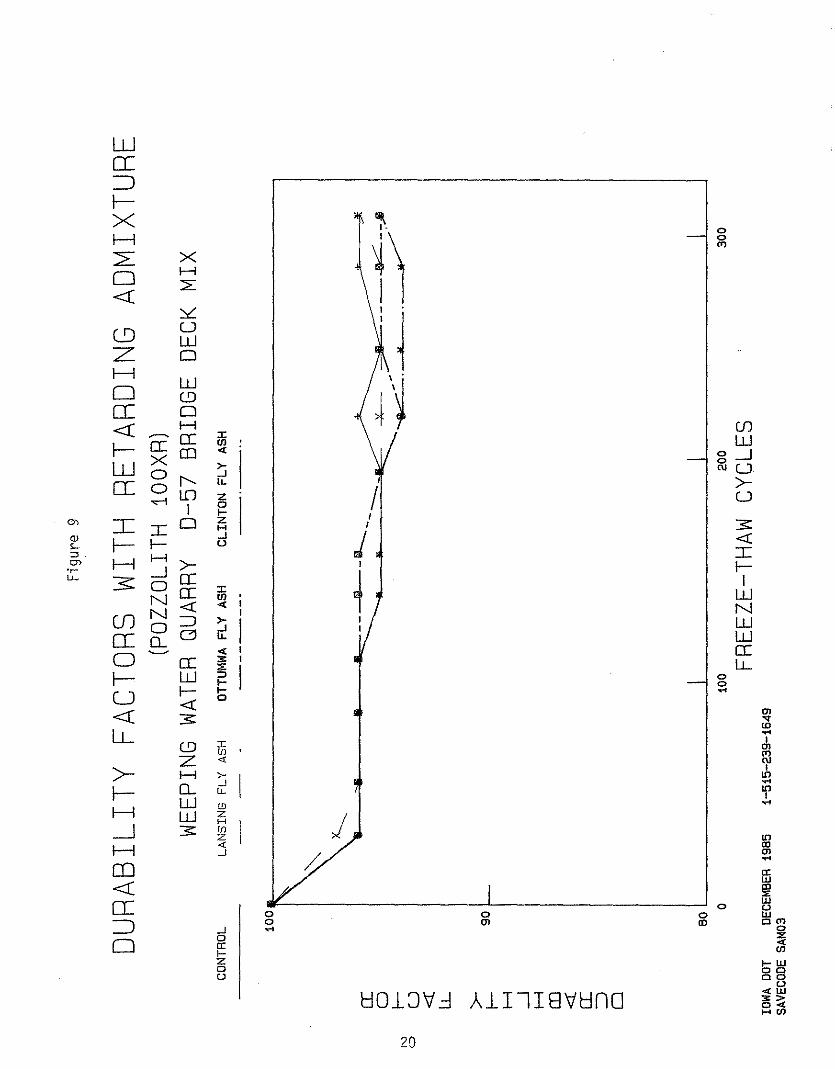
Fig
ure
9
DU
RABI
LITY
FACT
ORS
WIT
HRE
TARD
ING
ADM
IXTU
RE(P
OZZ
OLI
THiO
OXR)
WEE
PING
WAT
ERQU
ARRY
0-57
BRID
GE
DECK
MIX
CON
TRO
LLA
NSI
NG
FLY
ASH
OTTU
MW
AFL
YAS
HCL
INTO
NFL
YAS
H
l00~
I
~
<,
N o
[( o I U « u, > I H .-J
H CO « [(
:::) o
90
Ill--
-lil..
.....--
-..
.-
-----ji
~~>s-----~.
~~
.'f
l,c
300
200
FREE
ZE-T
HA
WCY
CLES
100
L_
_~_--;;-_
_~I
--"
II
80I a
IOW
ADO
TDE
CEM
8ER
1985
1-51
5-23
9-16
49SA
VECO
DESA
M03

Figu
re10
EXPANSIONFACTORS
WITH
NORETARDING
ADMIXTURES
WEEPING
WATER
QUARRY0-57
BRIDGEDECK
MIX
CONTROLLANSING
FLYASH
OTTUMW
AFLY
ASHCLINTON
FLYASH
.02
,,
X----
---X
'"-
----13
300
v~
iOO200
FREEZE-THAWCYCLES
/
J
o.
',
,,
o
.os
~
NZ
.....0HenZ«0..XL1J
IOllAocr
DECEMBER
i98
5H
ii5-2
39
-i64
9SAVECDDE
SAMOi

Fig
ure
11
EXPA
NSI
ON
FACT
ORS
WIT
HRE
TARD
ING
ADM
IXTU
RES
(PLA
STIM
ENT
100)
WEE
PING
WAT
ERQU
ARRY
0-57
BRID
GE
DECK
MIX
CONT
ROL
LANS
ING
FLY
ASH
OTTU
MW
AFL
YAS
HCL
INTO
NFL
YAS
H
.02
,~
300
200
100
01'
II
II
o
N
ZN
a HI
~~
(J)
~~~.
-j
VII
~../
<,
Z.0
1« D
.. x W ~
FREE
ZE-T
HAW
CYCL
ESIO
IIADO
TDE
CEM
BER
1985
1-51
5-23
9-16
49SA
VECO
DESA
M02

Figure
12
EXPA
NSIO
NFACTORS
WITH
RETARDINGADM
IXTURE(PO
ZZOLITH
100XR)
WEEPING
WATER
QUARRY0-57
BRIDGEDECK
MIX
CONTROLLANSING
FLYASH
OTTUMW
AFLY
ASHCLINTON
FLYASH
.02
,i
300
X----
/..--/'..Jl
~
200
~.~h/
~~-~Q----.Q
~...........~
~
/
'".fr
-
100
r--V
'
........~.
/'
~,
~:J;"''---
;//
or
,I
I,
o
N
Z'W
aHUJ
Z.0
1«0
-xU
J
~
FREEZE-THAWCYCLES
IOWA
OOTDECEM
BER'1985
1-51!H!39-1649
SAVECOOESAM
SROPZ
Tab
leN
o.3
Set
ting
Tim
eB
ridg
eD
eck
Con
cret
e0-
57M
ix
Ret
ardi
ngM
ixFl
yA
sh.F
lyA
shA
dmix
ture
Set
ting
Tim
e%
Ret
arda
tion
(Acc
eler
atio
n)N
o.So
urce
C1as
sB
rand
Init
ial
Fina
lIn
itia
lFi
nal
1C
ontr
ol--
-N
one
3hr
s.5
min
.4
hrs
.10
min
.
2L
ansi
ngC
Non
e3
hrs.
35m
in.
4h
rs.
50m
in.
16.2
16.0
3O
ttum
wa
CN
one
3hr
s.
10m
in.
4h
rs.
25m
in.
2.7
6.0
4C
lint
onF
Non
e3
hrs
.20
min
.4
hrs.
45m
in.
8.1
14.0
5C
ontr
ol--
-P1
astim
ent
4hr
s.50
min
.6
hrs
.35
min
.N
100
..",
6L
ansi
ngC
P1as
timen
t4
hrs
.45
min
.6
hrs.
30m
in.
(-1.
8)(-
1.3
)10
0
7O
ttum
wa
CP1
astim
ent
4h
rs.
55m
in.
6hr
s.25
min
.1.
7(-
2.6
)10
0
8C
lint
onF
P1as
timen
t5
hrs
.5
min
.6
hrs.
35m
in.
4.9
0.0
100
9C
ontr
ol--
-Po
zzo1
ith
5h
rs.
5m
in.
6h
rs.
55m
in.
100X
R
10L
ansi
ngC
Pozz
o1it
h4
hrs
.50
min
.6
hrs
.35
min
.(-
5.2
)(-
5.1
)10
0XR
11O
ttum
wa
CPo
zzo1
ith
5hr
s.15
min
.7
hrs
.o
min
.3.
21.
210
0XR
12C1
into
nF
Pozz
o1ith
5h
rs.
30m
in.
7hr
s.40
min
.7.
69.
810
0XR
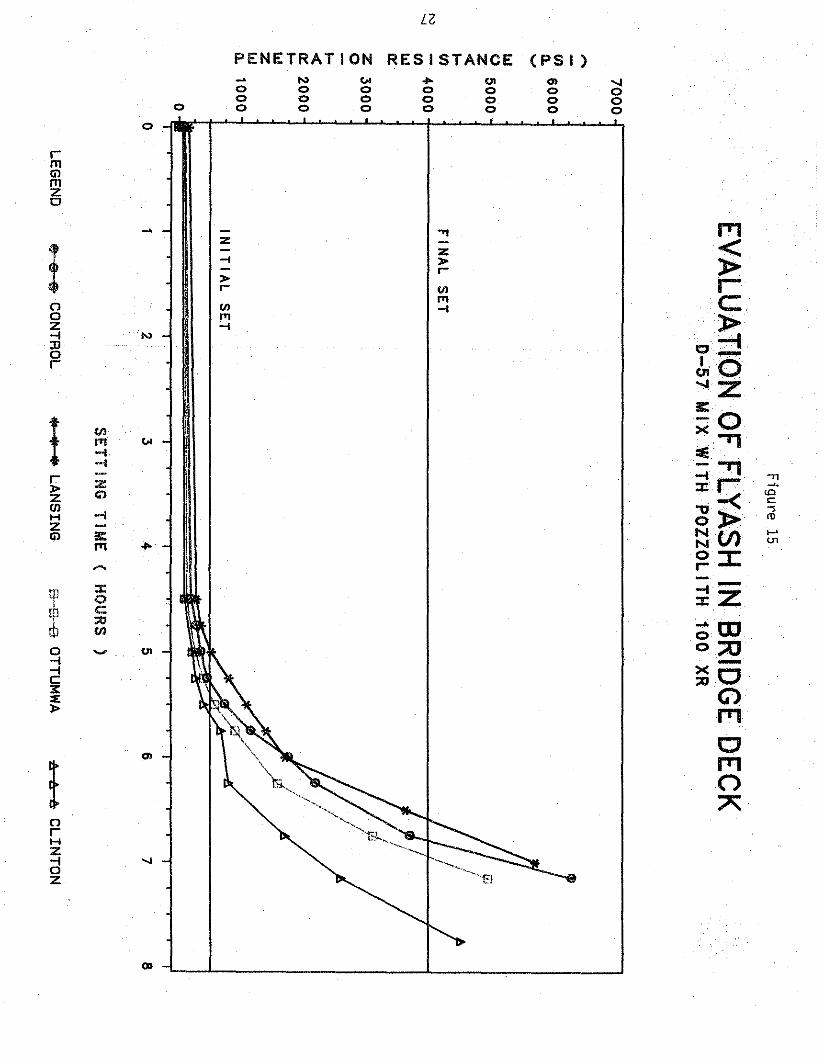
Figure15
EVA
LUA
TION
OF
FL.YA
SHIN
BRIDG
ED
ECK0
-"57
MIX
W.IT
HP
OZ
ZO
LIT
H1
00
XR
70
00
.....-~6
00
0
""w~5
00
0-eI-(f)
iFIN
AL
SETN
;;;4
00
0---J
WQ:
Z3
00
00-I--cQ
:2
00
0I-I.IJZWQ
.1
00
0IN
ITIA
LSET
oo
12
34
56
78
SETTING
TIME
(H
OU
RS)
LE
GE
ND
·$
$-&
CO
NT
RO
L0(0
0(0I~
LA
NSIN
Gtr-&
-£l
OTTU
MW
AA
AA
CL
INT
ON

Conclusions and Discussion
Based, On' the data. gathered in this study;'the following conclusions are ob
tained:
1. The class and source of the fly ash have a 1imited affect on the strength
of the concrete. When Class "C" ashes were used, the compressive
strengths were not affected and when Class "F" ash was used, the strengths
were s 1ightly lower.
2. The compressive strength and durabil i ty of Class D-57 bri dge deck concrete
mixes modified with fly ash· are equivalent to the standard D-57 mix when
15% of the portl and cement is replaced with ASTM C-618 quality, Class "C"
fly ash at the rate of 1: 1 (each pound of ash added for each pound of ce
ment dele.ted}.
3. The compressive strength and durability of Class D-57 bridge deck concrete
mixes modified with fly ash are approximately equivalent to the standard
D-57 mix when 15% of the portland cement is replaced with 1.25:1 ASTM
C-618 quality, Class "F" fly ash at the rate of (each 1-1/4 pounds of ash
added for each pound of cement deleted).
4. Class III durability aggregates should be specified when fly ash is to be
used. The. aggregate sources selected for this study were a representative
of the category of Class III aggregates. The satisfactory performance of'
these aggregates leads us to the conclusion that the test results obtained
support our present position of 15% substitution when good qual ity fly ash
is used with Class II 1 durabil ity aggregate. Previous studt es have shown
28
Figure
13
EVALUATIO
NO
FFLY
ASHIN
BRID
GE
DEC
K0-51
MIX
70
00
....-~6
00
0'VW~
50
00
-cI-iii1
NFIN
AL
SETU
1W
40
00
W~~3
00
0
-I--c~2
00
0I-WZWI:l.
1000IN
ITIA
LSET
o~iii
:iiiiii
i!:~~/~:
iiiiii
ii
,Io
12
3
SETTING
TIME
(H
OU
RS)
45
6
LEGEND
isEI
EICO
NTROL
>I<~,
•LA
NSIN
Ge-a
-sOTTUM
WA
AA
AC
LINTO
N
Figu
re14
EVAL
UAT
ION
OF
FLY
ASH
INBR
IDG
ED
ECK
D-5
7M
IXW
ITH
PlA
STIM
ENT
100
60
00
..... - ~5
00
0'V W 0 ~
40
00
FIN
AL
SE
T
l-
N!II
Q)
- !II
W
!
IX3
00
0
~
Z 0 - I- -e2
00
0IX I- W Z W c,
1000
INIT
IAL
SE
T
o
o1
23
45
67
SETT
ING
TIM
E(
HO
UR
S)
LEG
END
eEl
eCO
NTRO
LIf!
If!II!
LAN
SIN
Go
00
OTTU
MW
Ais
isis
CLI
NTO
N

Figure15
EV
ALU
ATIO
NO
FFLY
ASHIN
BRID
GE
DEC
KD
-51M
IXW
ITHPO
ZZ
OllT
H1
00
XR
70
00
....-~6
00
0....w~5000
-cI-mi
FINA
LSET
N;;;
40
00
'-J
W0::
Z3
00
00-I--c0::
20
00
I-WZWn..1000
INIT
IAL
SET
oo
12
34
56
78
SETTING
TIME
(H
OU
RS)
LEGEN
De
ee
CO
NTR
OL
'1''"
iloL
AN
SING
EJEJ
BO
TTUMW
Ais
isis
CL
INT
ON

Conclusions and Discussion
Based on the data gathered in this study, the following conclusions are ob
tained:
1. The class and source of the fly ash have a limited affect on the strength
of the concrete. When Class "C" ashes were used, the compressive
strengths were not affected and when Class "F" ash was used, the strengths
were slightly lower.
2. The compressive strength and durability of Class D-57 bridge deck concrete
mixes modified with fly ash are equivalent to the standard D-57 mix when
15% of the portland cement is replaced with ASTM C-618 quality, Class "C"
fly ash at the rate of 1:1 (each pound of ash added for each pound of ce
ment deleted).
3. The compressive strength and durability of Class D-57 bridge deck concrete
mixes modified with fly ash are approximately equivalent to the standard
D-57 mix when 15% of the portland cement is replaced with 1.25:1 ASTM
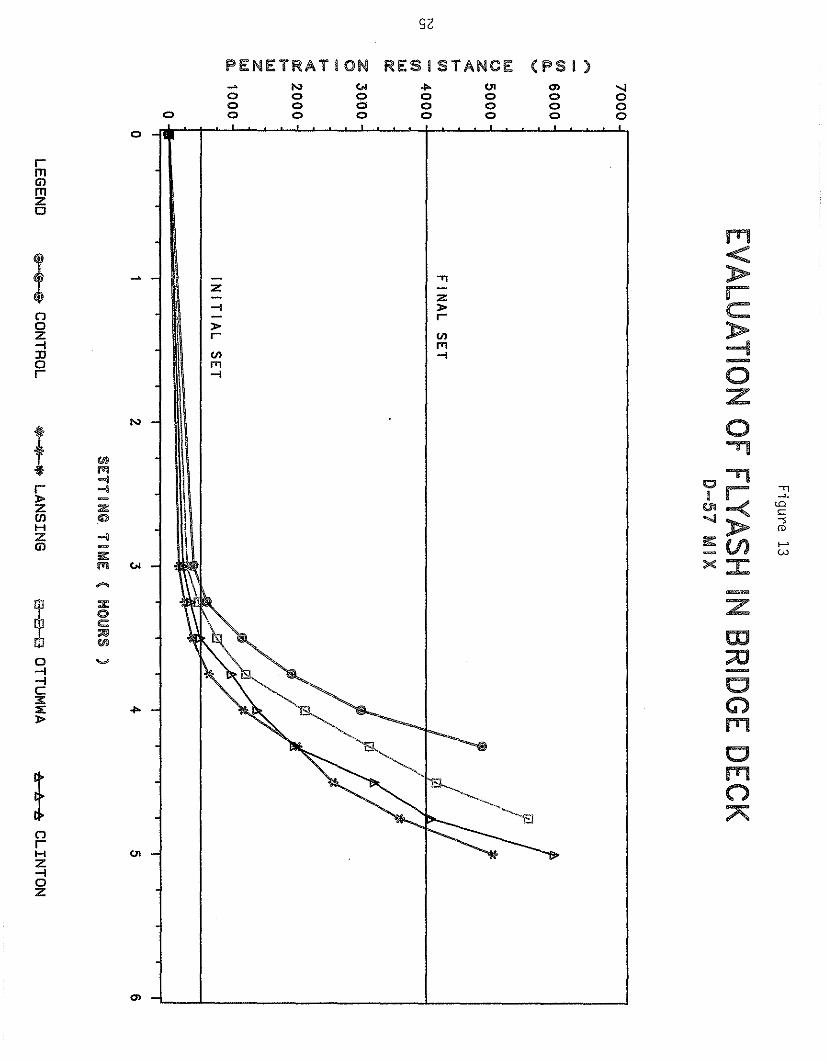
C-618 quality, Cl ass "F" fly ash at the rate of (each 1-114 pounds of ash
added for each pound of cement deleted).
4. Class III durability aggregates should be specified when fly ash is to be
used. The aggregate sources selected for this study were a representative
of the category of Class III aggregates. The satisfactory performance of
these aggregates leads us to the conclusion that the test results obtained
support our present position of 15% substitution when good quality fly ash
is used with Class III durability aggregate. Previous studies have shown
28
that the durability of fly ash concrete can be adversely affected when
certain coarse aggregates are used. The reasons for the potential accel
erated deterioration are not completely known and more studies are under
way to evaluate a larger cross-section of the present Class II aggregates
to either substantiate or refute our present position.
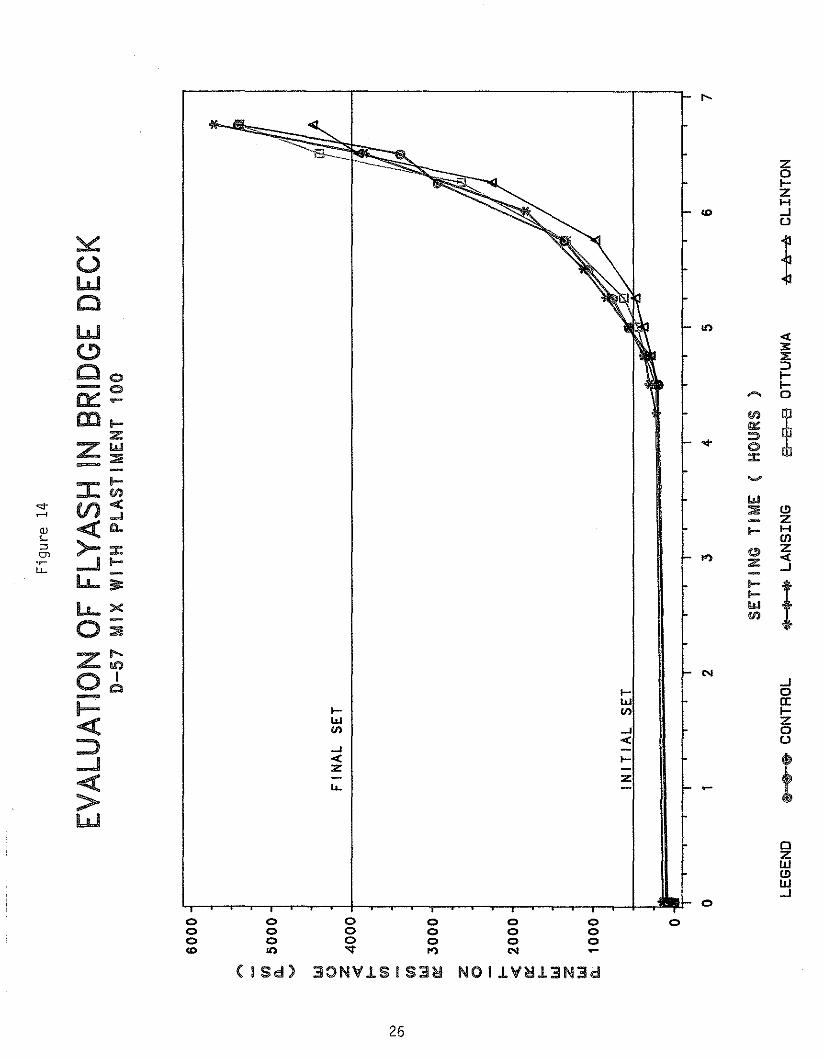
5. The use of retarding admixtures with fly ash in the D-57 mix had no sig
nificant effects. There is no reason to suspect that any reaction between
good quality fly ash and retarding admixtures meeting the ASTM C-494 Type
B will result in lowered durability factors nor will it affect the
strengths.
6. The freeze/thaw test, although expensive and time consuming, has proven
time after time to be extremely versatile since it can be used to evaluate
any type and combination of aggregate and each source may be judged by its
performance rather than its geologic origin or geographic location.
7. The setting time of the concrete without the chemical retarders was de
layed slightly by the use of fly ash. The setting times of the mixes con
taining the commercial retarders were altered slightly by the use of fly
ash. The setting times of the various mixes, while varying somewhat, were
not materially or consistently affected.
29

Recommendations
Based on the test results, the addition of fly ash as a replacement to con
crete containing admixtures Type A or Type B can be accomplished without det
rimental effects to the strength or freeze/thaw durability of concrete. This
holds true as long as good durable, high quality aggregates such as Class III
and the proper replacement percentages and substitution ratios are used.
These Class III aggregates are identified as superior aggregates that could be
used without reservation in fly ash concrete and in concrete places where ex
tended service life is required. Therefore, it is recommended that fly ash
can be substituted for up to 15% of the portland cement in bridge deck con
crete Class D-57 mixes; whether or not the mixes contain retarding admixtures
and the use be limited to mixes containing Class III durability coarse aggre
gate. Fly ashes should be limited to materials from approved sources.
30

References
1. Iowa Department of Transportation, Standard Specifications for Highway and
Bridge Construction, Series of 1984, Iowa Department of Transportation,
Section 2403 "Structural Concrete".
2. ASTM (American Society for Testing and Materials), Annual Book of Stand
ards, Section 4 Volume 04.02, Concrete and Mineral Aggregates ASTM 1984.
3. Iowa Department of Transportation, Office of Materials, Laboratory Manual.
4. AASHTO (American Association of State, Highway and Transportation Offi
cials) AASHTO Materials, Part II, Tests, AASHTO, 13th Edition 1982.
31

APPENDICES
32
Appendix A
Standard Specifications
Mix Proportions
33
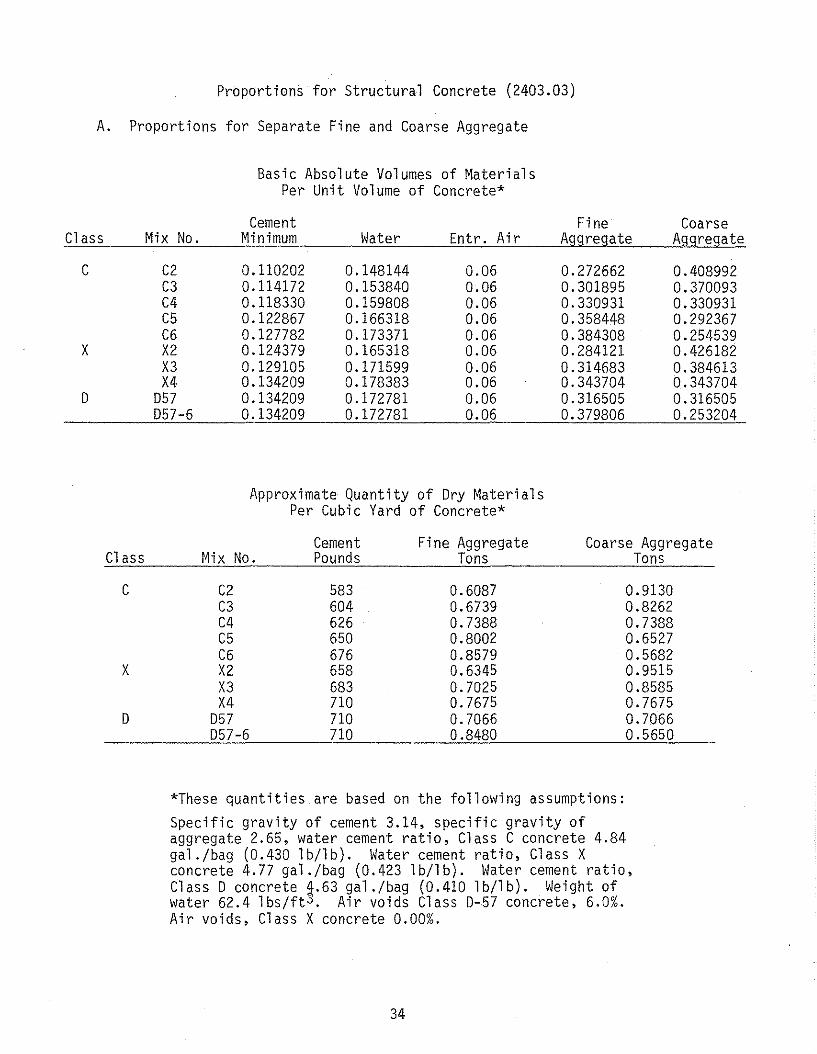
Proportions for Structural Concrete (2403.03)
A. Proportions for Separate Fine and Coarse Aggregate
Basic Absolute Volumes of MaterialsPer Unit Volume of Concrete*
Cement Fine CoarseClass Mix No. Minimum Water Entr. Air Aggregate Aggregate
C C2 0.110202 0.148144 0.06 0.272662 0.408992C3 0.114172 0.153840 0.06 0.301895 0.370093C4 0.118330 0.159808 0.06 0.330931 0.330931C5 0.122867 0.166318 0.06 0.358448 0.292367C6 0.127782 0.173371 0.06 0.384308 0.254539
X X2 0.124379 0.165318 0.06 0.284121 0.426182X3 0.129105 0.171599 0.06 0.314683 0.384613X4 0.134209 0.178383 0.06 0.343704 0.343704
D D57 0.134209 0.172781 0.06 0.316505 0.316505D57-6 0.134209 0.172781 0.06 0.379806 0.253204
Approximate Quantity of Dry MaterialsPer Cubic Yard of Concrete*
Cement Fine Aggregate Coarse AggregateCl ass Mix No. Pounds Tons Tons
C C2 583 0.6087 0.9130C3 604 0.6739 0.8262C4 626 0.7388 0.7388C5 650 0.8002 0.6527C6 676 0.8579 0.5682
X X2 658 0.6345 0.9515X3 683 0.7025 0.8585X4 710 0.7675 0.7675
D D57 710 0.7066 0.7066D57-6 710 0.8480 0.5650
*These quantities are based on the following assumptions:Specific gravity of cement 3.14, specific gravity ofaggregate 2.65, water cement ratio, Class C concrete 4.84gal./bag (0.430 l b/Jb ) . Water cement ratio, Class Xconcrete 4.77 gal./bag (0.423 lb/lb). Water cement ratio,Class D concrete 4.63 gal./bag (0.410 lb/lb). Weight ofwater 62.4 lbs/ft3 . Air voids Class D-57 concrete, 6.0%.Air voids, Class X concrete 0.00%.
34

Appendix B
Compressive Strength Testing
35
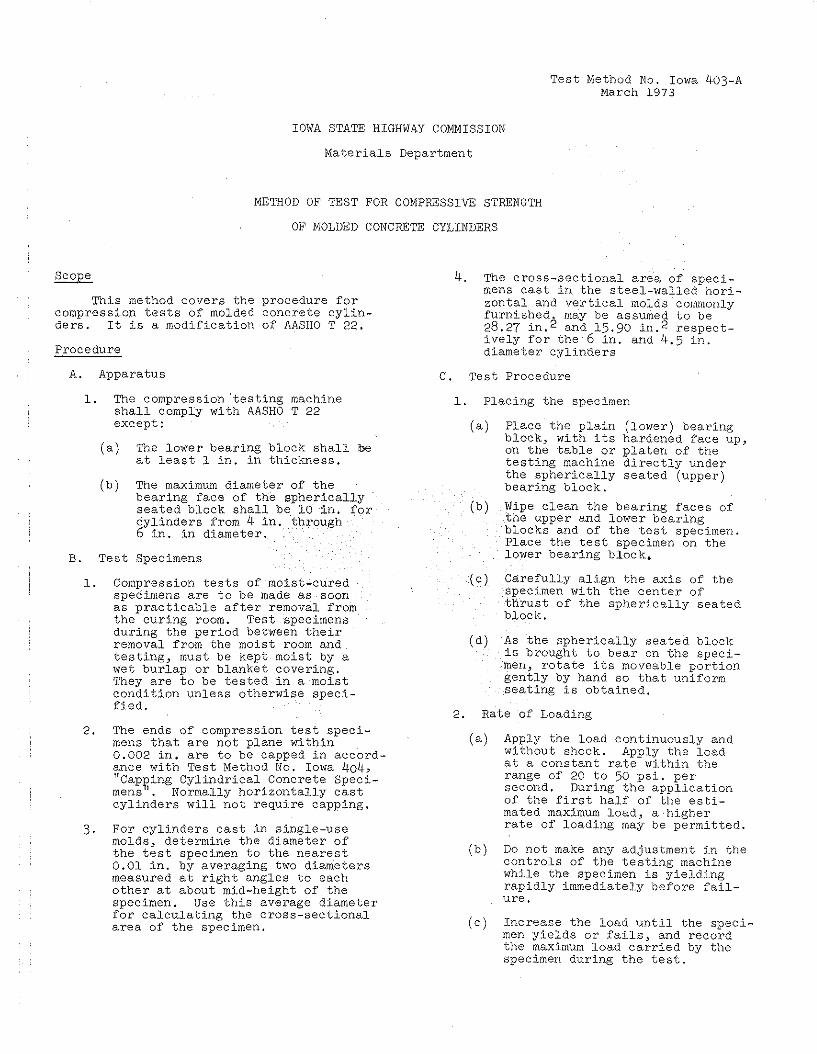
Test Method No. Iowa 403-AMarch 1973
IOWA STATE HIGHWAY COMMISSION
Materials Department
METHOD OF TEST FOR COMPRESSIVE STRENGTH
OF MOLDED CONCRETE CYLINDERS
Scope
This method covers the procedure forcompression tests of molded concrete cylinders. It is a modification of AASHO T 22.
Procedure
A. Apparatus
4. The cross-sectional area of specimens cast in the steel-walled horizontal and vertical molds commonlyfurnished may be assumed to be28.27 in. 2 and 15.90 in. 2 respectively for the 6 in. and 4.5 in.diameter cylinders
C. Test Procedure
B.
Placing the specimen
(lower) bearinghardened face up,platen of thedirectly underseated (upper)
1. The compression 'testing machineshall comply with AASHO T 22except:
(a) The lower bearing block shall beat least 1 in. in thickness.
(b) The maximum diameter of thebearing face of the sphericallyseated block shall be 10 in. forcylinders from 4 in. through6 in. in diameter.
Test Specimens
1.
(a)
(b)
Place the plainblock, with itson the table ortesting machinethe sphericallybear-Ing block.
Wipe clean the bearing faces ofthe upper and lower bearingblocks and of the test specimen.Place the test specimen on thelo~er bearing block.
1. Compression tests of moist-curedspecimens are to be made as soonas practicable after removal fromthe curing room. Test specimensduring the period between theirremoval from the moist room andtesting, must be kept moist by awet burlap or blanket covering.They are to be tested in a moistcondition unless otherwise specified.
2. The ends of compression test specimens that are not plane within0.002 in. are to be capped in accordance with Test Method No. Iowa 404,!lcap~ing Cylindrical Concrete Specimens '. Normally horizontally castcylinders will not require capping.
3. For cylinders cast in single-usemolds, determine the diameter ofthe test specimen to the nearest0.01 in. by averaging two diametersmeasured at right angles to eachother at about mid-height of thespecimen. Use this average diameterfor calculating the cross-sectionalarea of the specimen.
(c) Carefully align the axis of thespecimen with the center ofthrust of the spherically seatedblock.
(d) As the spherically seated blockis brought to bear on the specimen, rotate its moveable portiongently by hand so that uniformseating is obtained.
2. Rate of Loading
(a) Apply the load continuously andwithout shock. Apply the loadat a constant rate within therange of 20 to 50 psi. persecond. During the applicationof the first half of the estimated maXimum load, a'higherrate of loading may be permitted.
(b) Do not make any adjustment in thecontrols of the testing machinewhile the specimen is yieldingrapidly immediately before failure.
(c) Increase the load until the specimen yields or fails, and recordthe maximum load carried by thespecimen during the test.
2
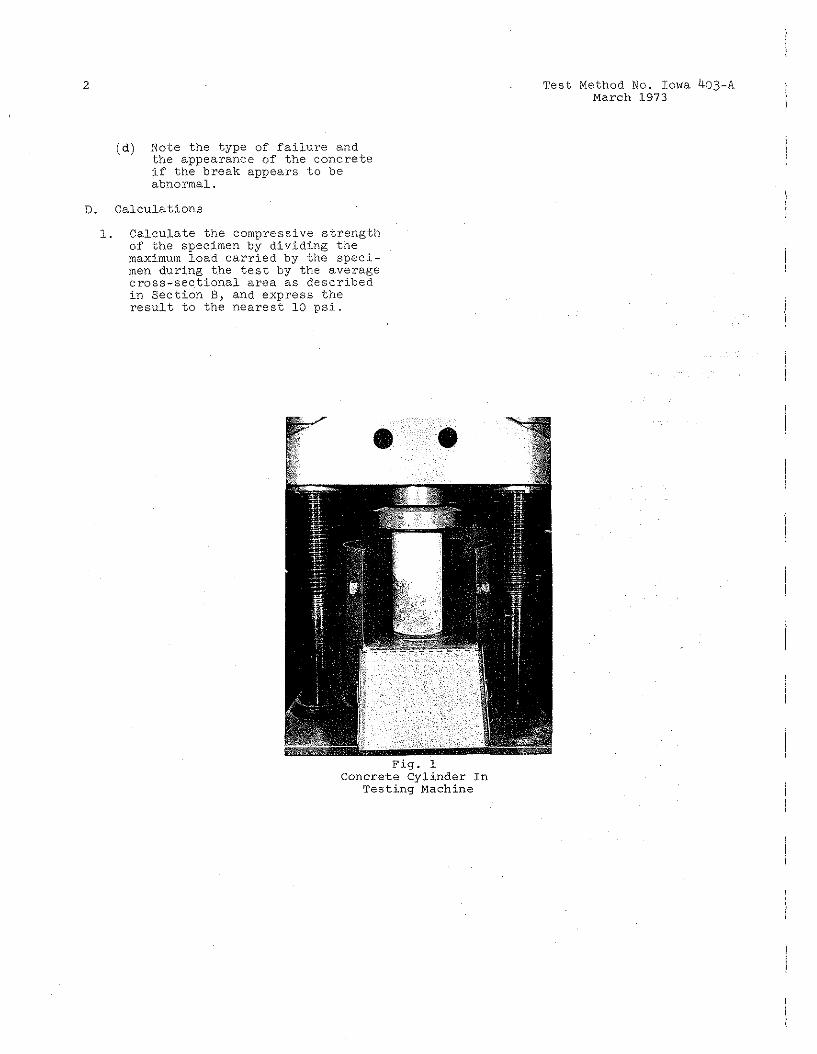
(d) Note the type of failure andthe appearance of the concreteif the break appears to beabnormal.
Test Method No. Iowa 403-AMarch 1973
D. Calculations
1. Calculate the compressive strengthof the specimen by dividing themaximum load carried by the specimen during the test by the averagecross-sectional area as describedin Section B, and express theresult to the nearest 10 psi.
• •
Fig. 1Concrete Cylinder In
Testing Machine

AppendiX C
Durability Testing
38
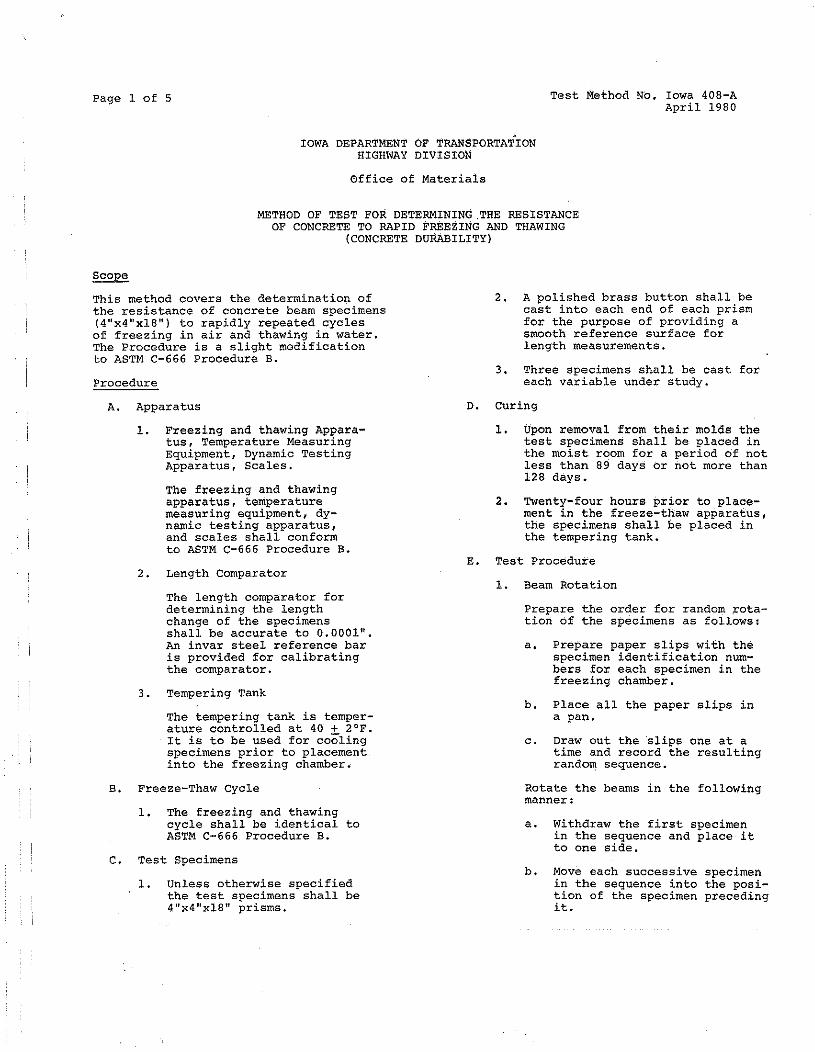
Page 1 of 5 Test method No. Iowa 408-AApril 1980
IOWA DEPARTMENT OF TRANSPORTATIONHIGHWAY DIVISION
0ffice of Materials
METHOD OF TEST FOR DET~RMINING.THE RESISTANCEOF CONCRETE TO RAPID FREEZING AND THAWING
(CONCRETE DURABILITY)
This method covers the determination ofthe resistance of concrete beam specimens(4"x4"x18") to rapidly repeated cyclesof freezing in air and thawing in water.The Procedure is a slight modificationto ASTM C-666 Procedure B.
Procedure
2. A polished brass button shall becast into each end of each prismfor the purpose of providing asmooth reference surface forlength measurements.
3. Three specimens shall be cast foreach variable under study.
E. ~est procedure
2. Twenty-four hours prior to placement in the freeze-thaw apparatus,the specimens shall be placed inthe tempering tank.
D. Curing
1. Upon removal from their molds thetest specimens shall be placed inthe moist room for a period of notless than 89 days or not more than128 days.
A. Apparatus
1. Freezing and thawing Apparatus, Temperature MeasuringEquipment, Dynamic TestingApparatus, Scales.
The freezing and thawingapparatus, temperaturemeasuring equipment, dynamic testing apparatus,and scales shall conformto ASTM C-666 Procedure B.
2. Length Comparator
The length comparator fordetermining the lengthchange of the specimensshall be accurate to 0.0001".An invar steel reference baris provided for calibratingthe comparator.
3. Tempering Tank
The tempering tank is temperature controlled at 40' + 2 of.It is to be used for coolingspecimens prior to placementinto the freezing chamber.
B. Freeze-Thaw Cycle
1. The freezing and thawingcycle shall be identical toASTM C-666 Procedure B.
C. Test Specimens
1. Unless otherwise specifiedthe test specimens shall be4"x4"x18" prisms.
1. Beam Rotation
Prepare the order for random rotation of the specimens as follows;
a. Prepare paper slips with thespecimen identification numbers for each specimen in thefreezing chamber.
b. Place all the paper slips ina pan.
c. Draw out the 'slips one at atime and record the resultingrando~ sequence.
Rotate the beams in the followingmanner:
a. Withdraw the first specimenin the sequence and place itto one side.
b. Move each successive specimenin the sequence into the position of the specimen precedingit.

Test Method No. Iowa 408-AApril 1980
c. When the last specimen inthe sequence has been moved,replace it with the firstspecimen.
2. Length Measurements
a. Before any length measurement is taken, calibratethe beam comparator to0.0200 using the Invarsteel reference bar. Thisbar should be cooled forapproximately 30 minutesin water to 40°F. Adjustthe comparator dial ifneeded.
b. Remove the specimen fromthe tempering tank or thefreezer depending uponwhether the beam is a newone or one with severalcycles on it.
c. Place the specimen in thecomparator with the identification numbers facing upat the left end of the comparator. Care should beexercised to insure thatthe specimen is firmlyagainst the back stopsand the right end of thecomparator.
d. Allow the dial indicatorto come to rest on thebrass button on the endof the specimen. Readthis value on the indicator to the nearest 0.0001".Record this value. Repeatthe measurement by completely removing the specimen from the comparator,replacing it, and remeasuring it until two successivereadings are equal.
e. If measuring three specimens at once, cover thosespecimens immediately afterremoving from the sub-zerounit with a towel soaked inthe thawing water.
3. Weight Measurement
Weigh the beam on the scale tothe nearest 'ten 'sa'arns. Recordthe value obtaine •
4. Dynamic Modulus
a. Place the specimen on thesupport such that the
Page 2 of 5
driving oscillator is midwaybetween the end of the specimen. Make sure the specimenis firmly against the backstops of the support.
b. "Place the tone arm pickup onthe end of the specimen aboutmidway between the sides.
c. On the oscilloscope, rotatethe large knob slowly backand forth until an elipseshape is formed on the cathoderay tube of the oscilloscope.
d. Set the II Osc. Frequency II knobto n 10" and read the frequencyfromXthe indicator on the oscil-"loscope. Add 1000 to this valueand record the number obtained.
5. Replace the specimen in the freezechamber inverted from its originalposition.
6. Repeat steps 2 through 5 for allof the specimens.
7. continue each specimen in the testuntil it has been subjected to 300cycles or until its relative dynamic modulus reaches 60% of theinitial modulus, whichever occursfirst.
Fo Calculations
1. Record all the required data onthe IIP.C. Concrete Durability" labworksheet.
2. From the recording charts, obtainthe number of cycles completedsince the specimens were lastmeasured. (Mark the date read andthe number of cycles to that pointon the recording chart.) Add tothis number the number of cyclesat which the specimens were lastmeasured. Record this cumulativevalue in the column labeled "Cycles".
3. Subtract the" dial reading at zerocycles from the latest dial reading.Record this value in the columnlabeled IIGro. In".
4. Calculate the relative dynamic modulus of elasticity using the formula:
Po = (n1 2;n2) x 100
where:
Page 3 of 5 Test Method No. Iowa 408-AApril 1980
n
relative dynamic modulusof elasticity after ccycles of freezing andthawing, percent
fundamental transversefrequency at 0 cycles offreezing and thawing
N number of cycles at whichP reaches the specifiedminimum value for discontinuing the test or thespecified number of cyclesat which the exposure is tobe terminated, whichever isless
B. Report. The final report (worksheet) should be submitted to theGeology Section, and it shouldinclude all data pertinent to thevariables or combination of variables studied in the evaluation.Also, any defects in each specimen which develop during testingand the number of cycles at whichsuch defects were noted should bedocumented on the worksheet.
fundamental transverseafter c cycles of freezing and thawing
Record this value in the'colttmnlabeled "% of Orig. 1I
5. When all of the above calculations have been made for asimilar set of specimens, compute the average for the setfor the items "% of Orig. ll
,
"Gro. %", and "Gro. In".Compute "Gro. %" using theformula:
M specified number of cyclesat which exposure is to beterminated. (Three-hundredcycles in most cases.)
G - S x 100.- TTI8T
where:
G = average growth for the setof specimens in %.
S the sum of the growths foreach specimen.
T the total number of specimens in the set.
DF = the durability factor ofthe specimen
6. Repeat the preceding steps foreach specimen.
Record these values in theappropriate columns on theworksheet.
PNM
DF
where:
liT" should include only numberof specimens which showeda normal reading
7. Should it be desired to handcalcul~te the durability factor,use the following formula:
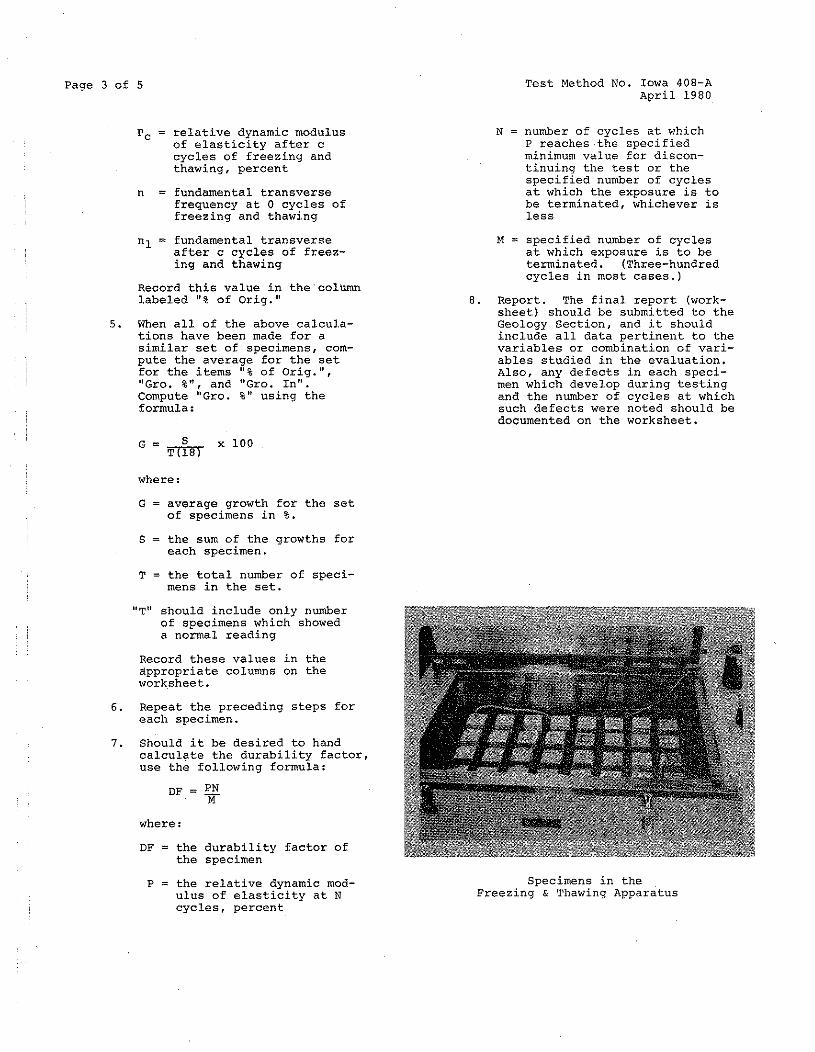
P the relative dynamic modulus of elasticity at Ncycles, percent
Specimens in theFreezing & Thawing Apparatus

Page 4 of 5
Freezing & Thawing Apparatus"CdncLrmat.L"
Beam Comparator
Test Method No. Iowa 40B-AApril 1980
Freezing & Thawing ApparatusllConrad ll
Dynamic Testing Apparatus

Page 5 of 5Form 8212882·75
Test Method No. Iowa 408-AP.C. CONCRETl!l DURABILITY
w/c: Mix: Date Made: Beam No. ----------
Cement: Lab. No .. : Cern. Content: 3______ sk/yd
Fine Agg. : Lal;, No.: Sp. Gr.:
Coarse Agg.: Lab. No.: Sp. Gr.:
k.
k.
Date Weight
Slump: Air:Grams
-------AEA @ fl. oz./s
Comments: I.Admixture @ flo oz·/s
".,'_"---' ---..._.--
---- Set Average
I--
D~al Gro. I_._-
% of % 'of Gro. Gro.DateCycles Remarks Orig.
,Read Rdg. In. , Freq. oria. % In.
,