
Evaluation of Field-Produced Warm Mix Stone - Illinois Tollway
17
Evaluation of Field-Produced Warm Mix Stone Matrix Asphalt (WMA-SMA) Mixtures Prepared By William R. Vavrik Applied Research Associates, Inc. Samuel H. Carpenter University of Illinois Steven Gillen Illinois State Toll Highway Authority Jay Behnke Fred Garrott S.T.A.T.E. Testing, LLC Illinois State Toll Highway Authority August 2010
Transcript of Evaluation of Field-Produced Warm Mix Stone - Illinois Tollway

Evaluation of Field-Produced Warm Mix Stone Matrix Asphalt (WMA-SMA) Mixtures
Prepared By
William R. Vavrik Applied Research Associates, Inc.
Samuel H. Carpenter University of Illinois
Steven Gillen Illinois State Toll Highway Authority
Jay Behnke Fred Garrott
S.T.A.T.E. Testing, LLC
Illinois State Toll Highway Authority
August 2010

i
Executive Summary
In the late fall of 2008, the Tollway had the opportunity to field test a warm mix asphalt (WMA) additive on an existing project at no additional construction cost. This opportunity allowed the Tollway to work with the construction industry, the consulting community, and academia to understand how WMA could be specified at the Tollway. Warm-mix asphalt (WMA) is a technology that allows the producers of the asphalt mix to lower the production and paving temperature. Traditional hot mix asphalt (HMA) is produced at temperatures from 290ºF to 335ºF while WMA technologies allow the production temperatures to be lowered by 30ºF to 80ºF. The benefits to the use of WMA include:
Reduced asphalt plant emissions. The Federal Highway Administration reports that expected reductions are 30 to 40 percent for carbon dioxide (CO2) and sulfur dioxide (SO2), 50 percent for volatile organic compounds (VOC), 10 to 30 percent for carbon monoxide (CO), 60 to 70 percent for nitrous oxide (NOx), and 20 to 25 percent for dust.
Reduced fuel and energy use. Due to the decrease in the amount of heat required to produce WMA there is a resulting fuel reduction of 11 to 35 percent.
Paving benefits. WMA allows paving to occur in cooler temperature and still obtain density, allows haul distance to increase while maintaining workability, allows the incorporation of high reclaimed asphalt paving (RAP) at reduced temperatures, and facilitates compaction.
Reduced worker exposure. While worker exposure is below acceptable limits, WMA reduces fumes and aerosols by 30 to 50 percent.
The goals of this project was to explore the following questions:
What changes to the mix design are required with WMA?
What changes to the production are required with WMA?
Is the use of WMA feasible for Tollway contractors given their equipment and capabilities?
Are the expected performance characteristics of the mixes the same or better than current materials?
This field evaluation set out to answer these questions for one SMA mix produced by one Tollway contractor at one location. Using these results, the results of research by other agencies, and the literature, the Tollway will investigate future uses of WMA technologies. The results and conclusions are that WMA technology should be considered for future projects as this technology improves sustainability is environmentally responsible, and material performance is similar to or better than traditional asphalt mixes. Specific conclusions include:
There were no difficulties or concerns in performing the mix design with WMA.
The plant modifications for WMA were manageable and did not create any noted problem or concern for the production.
The contractor was able to integrate WMA technology in all aspects of production, transportation, laydown, and compaction with existing equipment and personnel.
The performance testing of the WMA mixtures shows that the stiffnesses (modului) of the control mix and the WMA mixtures (both hot and warm) were similar, and these values were consistent with IDOT SMA mixes. The expected performance is as good as standard SMA mixtures.
The fatigue testing of the WMA mixtures shows that the fatigue performance improved with the addition of the WMA additive. This increase in fatigue performance occurred without a change in the fatigue modulus. This result indicates that there may be improved reflective crack resistance with the WMA.

ii
Table of Contents
INTRODUCTION ....................................................................................................................... 1 EVENTS SURROUNDING THIS RESEARCH PROJECT ..................................................................... 1 QUESTIONS TO BE ANSWERED ................................................................................................... 2
MATERIAL EVALUATED .......................................................................................................... 2
SUMMARY OF FIELD NOTES .................................................................................................. 3 MIX DESIGN ............................................................................................................................. 3 PRODUCTION NOTES ................................................................................................................ 3
PERFORMANCE EVALUATION METHODOLOGY .................................................................. 5
ASPHALT MIXTURE PERFORMANCE TESTS ........................................................................ 5
PERFORMANCE TEST DATA .................................................................................................. 6 MIX 1. CONTROL ..................................................................................................................... 6 MIX 2. WMA HOT ..................................................................................................................... 7 MIX 3. WMA WARM .................................................................................................................. 8
INTERPRETATION OF PERFORMANCE TEST RESULTS .....................................................10 DYNAMIC MODULUS ................................................................................................................10 FATIGUE .................................................................................................................................10 FLEXURAL BEHAVIOR ...............................................................................................................11
CONCLUSION ..........................................................................................................................11
APPENDIX A: MIX DESIGN AND MIX INFORMATION

1
INTRODUCTION
Warm-mix asphalt (WMA) is a technology that allows the producers of the asphalt mix to lower the production and paving temperature. Traditional hot mix asphalt (HMA) is produced at temperatures from 290ºF to 335ºF while WMA technologies allow the production temperatures to be lowered by 30ºF to 80ºF. The benefits to the use of WMA include:
Reduced asphalt plant emissions. The Federal Highway Administration reports that expected reductions are 30 to 40 percent for carbon dioxide (CO2) and sulfur dioxide (SO2), 50 percent for volatile organic compounds (VOC), 10 to 30 percent for carbon monoxide (CO), 60 to 70 percent for nitrous oxide (NOx), and 20 to 25 percent for dust.
Reduced fuel and energy use. Due to the decrease in the amount of heat required to produce WMA there is a resulting fuel reduction of 11 to 35 percent.
Paving benefits. WMA allows paving to occur in cooler temperature and still obtain density, allows haul distance to increase while maintaining workability, allows the incorporation of high reclaimed asphalt paving (RAP) at reduced temperatures, and facilitates compaction.
Reduced worker exposure. While worker exposure is below acceptable limits, WMA reduces fumes and aerosols by 30 to 50 percent.
The Tollway faces a significant rehabilitation/expansion program for its highway network. The financial demand, market conditions, and desire to improve as much of the network as possible require the evaluation of options for improved technologies. In the asphalt paving industry this includes optimizing the selection of materials used in the mixes. The Tollway has been looking at pieces of this puzzle—new liquid asphalts, different aggregates, and better performing mix designs. The Tollway has made significant efforts in recent years to increase the environmental aspects of asphalt mixes, including increasing the percentage of RAP and fractionated RAP in all asphalt mixtures, using ground tire rubber (GTR), and incorporating recycled asphalt shingles (RAS). One technology that has the ability to further enhance the environmental aspects of asphalt materials is the use of WMA. WMA addresses two primary Tollway requirements: improving the sustainability of asphalt mixtures and construction activities, and improving construction quality over a long construction season. The use of WMA has the potential to increase the construction season by allowing paving to continue later into the cold temperature months and improve construction practices through increasing the allowable haul distance between the plant and the construction site.
EVENTS SURROUNDING THIS RESEARCH PROJECT
In the late fall of 2008, the Tollway had the opportunity to field test a WMA additive on an existing project at no additional construction cost. This opportunity allowed the Tollway to work with the construction industry, the consulting community, and academia to understand how WMA could be specified at the Tollway. The WMA test section was located on the Jane Addams Tollway, I-39/I-90 Irene Road Ramp. The base asphalt mixture was a stone matrix asphalt (SMA) surface course mix that included GTR-modified asphalt binder, fractionated RAP, and diabase coarse aggregate. The WMA additive was Evotherm, provided by Mead Westvaco, which is a chemical that promotes
2
adhesion, coating, compaction, and workability of asphalt mixes at reduced temperatures. Evotherm is delivered as an asphalt emulsion that can be pumped directly off a tanker at the plant.
QUESTIONS TO BE ANSWERED
In exploring new technologies in pavements there are a number of questions that need to be answered. The goals of this project are to explore the following questions:
What changes to the mix design are required with WMA?
What changes to the production are required with WMA?
Is the use of WMA feasible for Tollway contractors given their equipment and capabilities?
Are the expected performance characteristics of the mixes the same or better than current materials?
This field evaluation set out to answer these questions for one SMA mix produced by one Tollway contractor at one location. Using these results, the results of research by other agencies, and the literature, the Tollway will investigate future uses of WMA technologies.
MATERIAL EVALUATED
The SMA mix selected for testing with WMA additive was the standard project mix used throughout the Jane Addams Tollway construction project. It was designed by Rock Road Companies and produced for placement on the I-39/I-90 Irene Road Ramp. Three mixtures were considered as part of the field trials:
Mix 1 (Control): Project standard SMA mix.
Mix 2 (Hot): SMA mix with the WMA additive, produced at normal mix temperature, 330°F, and normal compaction temperature, 305°F.
Mix 3 (Warm): SMA mix with the WMA additive, produced at warm mix temperature, 270°F, and warm mix compaction temperature, 230ºF.
The WMA additive used for this field trial is Evotherm, supplied by MeadWestvaco Corporation. It was included at a dosage rate of 5 gallons per ton of GTR asphalt cement. Evotherm is a chemical additive warm mix technology that incudes emulsification agents and anti-stripping agent additives to improve aggregate coating, mixture workability, and compaction. It decreases the viscosity of the binder at lower mixing temperatures, which leads to fully coated aggregates. It is delivered to the plant in the form of an asphalt emulsion, and the majority of the water in the emulsion flashes off as steam when the emulsion is mixed with the aggregates. Figure 1 shows the plant modifications for the WMA additives.

3
Figure 1. Photographs of plant modifications for WMA additive (photos by S.T.A.T.E. Testing)
SUMMARY OF FIELD NOTES
The following notes summarize the characteristics of the trial mixes and were compiled by S.T.A.T.E. Testing through their field observations of trial mix production and compaction. The complete mix design, mix design notes, and quality assurance (QA) data are provided in appendix A.
MIX DESIGN
The mix was a Tollway SMA mixture with diabase coarse aggregate, supplied by RME, local fine aggregate, and fine fractionated RAP. The asphalt binder was a PG 76-28 GTR modified materials from Seneca. The mix design was not complicated by the use of the Evotherm warm mix additive. The additive was simply added to the existing mix design and the resulting materials verified for their compliance with mix design requirements. There were no major changes required with the incorporation of the Evotherm warm mix additive. Three small test sections were produced and placed on the reconstructed ramp. The sections were approximately 300 tons each. Table 1 presents the mixture variables for the trial mixes.
Table 1. Field trial mix characteristics
Mix 1. Control
Mix 2. WMA Hot
Mix 3. WMA Warm
Evotherm Additive No Yes Yes Production Temp 335° 330° 270° Compaction Temp 305° 305° 230°
PRODUCTION NOTES
The Evotherm dosage rate was 5 gallons per ton of GTR asphalt cement. Daytime temperatures were between 70°F and 75°F. A growth curve was run on each of the two Evotherm mixes to evaluate any differences in compaction rate and compaction potential. As normal for this SMA mix, three rollers were used,

4
all in static mode. The growth curves were performed with a Sakai three wheel roller. The two temperature levels with WMA produced mildly different compaction results. The growth curve peak values were similar but occurred at a different number of passes. The hot-warm mix had a slightly higher peak value of 150.1 pcf at 16 passes. The warm-warm mix had a peak value of 149.7 pcf at 21 passes. This suggests that the warm mix was stiffer but still workable at the lower compaction temperature. There was little difference in the field density results among the mixes. All of the final average densities were between 93.5 and 94.3 percent of the running GMM. All QA and quality control (QC) comparisons between Rock Road (QC) and S.T.A.T.E. Testing (QA) were within project specifications. All of the mixes were produced within the specification limits and remained consistent throughout production. QC/QA precision limit results were within specification, except the GMM of the control mix. Table 2 presents a summary of the plant test results. Construction had no noted issues or concerns with the use of the WMA, and handling, hauling, and laydown operations occurred without incident. Figure 2 shows photographs from construction activities.
Table 2. Summary of plant test results
Mix 1. Control
Mix 2. WMA Hot
Mix 3. WMA Warm
QC GMM 2.561 2.576 2.594 QA GMM 2.604 2.586 2.581 QC GMB 2.484 2.505 2.503 QA GMB 2.500 2.516 2.498 V% QC/QA 3.0/4.0 2.8/2.7 3.5/3.2

5
Figure 2. Construction photographs from WMA placement
PERFORMANCE EVALUATION METHODOLOGY
A goal of this project is to verify through a laboratory testing program whether WMA will show similar pavement performance to currently specified materials. One means of performing this evaluation is to evaluate the material properties as they relate to pavement design. The design of full-depth HMA pavements relies on two primary HMA material properties, the fatigue performance curve and the HMA modulus (stiffness). The dynamic modulus determines how much the pavement section flexes under the load of a heavy truck, resulting in strain in the asphalt layer. This strain is then evaluated against the fatigue performance curve, which relates the strain to the allowable loads that the pavement section can carry. Other HMA material properties that are of concern include resistance to rutting and resistance to weathering. Relative rutting resistance is indicated by the dynamic modulus test, which is included in this testing program, and is controlled for most projects primarily through the mix design process and by the selection of raw materials.
ASPHALT MIXTURE PERFORMANCE TESTS
Laboratory testing of WMA materials was performed to measure laboratory material properties and determine the expected performance of these mixes in field applications. The laboratory program was conducted on plant-produced mix. The materials were sampled properly, and the WMA tests were performed without incident. All of the identified mixtures were sampled at the plant and taken to the Advanced Transportation Research and Engineering Laboratory (ATREL)

6
at the University of Illinois. Research staff from the Illinois Center for Transportation (ICT) reheated and split the mix, prepared test samples, and conducted flexural beam fatigue testing and dynamic modulus testing (AASHTO TP-321 and TP62-08, respectively). The test results are presented below.
PERFORMANCE TEST DATA
MIX 1. CONTROL
The dynamic modulus master curve for the 7% air void specimens is given in Figure 3, and the curve for the 4% specimens is given in Figure 4. There is nothing unusual in these curves.
Figure 3. Dynamic modulus master curve for 7% air void samples
Figure 4. Dynamic modulus curve for 4% air void samples
The fatigue curve is given in Figure 5. This curve is consistent with similar SMA mixes tested for the Tollway and IDOT. The test at the 300 micro strain level was terminated prior to completion, indicated by the arrow showing failure would not occur for many more load repetitions. The fatigue equation for this mixture is:
Nf = 3.498 E-11 (1/)4.862
y = -1.7987E-04x3 - 8.6053E-03x2 + 1.6569E-01x + 5.7495E+00 R² = 9.8194E-01
4
4.5
5
5.5
6
6.5
7
-2 -1 0 1 2 3 4 5 6 7
Log
E*
Log Reduced Freq.
y = 1.6735E-04x3 - 1.6063E-02x2 + 1.9011E-01x + 5.8484E+00 R² = 9.9654E-01
4
4.5
5
5.5
6
6.5
7
-2 -1 0 1 2 3 4 5 6
Log
E*,
psi
Log Reduced Freq.

7
Figure 5. Fatigue curve for warm asphalt mixture 1
MIX 2. WMA HOT
The dynamic modulus master curve for the 7% air void specimens is given in Figure 6, and the curve for the 4% specimens is given in Figure 7. There is nothing unusual in these curves.
Figure 6. Dynamic modulus master curve for 7% air void samples
y = 3.498E-11x-4.862E+00 R² = 9.779E-01
1,000
10,000
100,000
1,000,000
10,000,000
0.0001 0.001 0.01
Load
Re
pe
titi
on
s
Strain
y = 6.8934E-04x3 - 1.8863E-02x2 + 2.0840E-01x + 5.7577E+00 R² = 9.9774E-01
4
4.5
5
5.5
6
6.5
7
-2 -1 0 1 2 3 4 5 6
Log
E*
Log Reduced Freq.

8
Figure 7. Dynamic modulus curve for 4% air void samples
The fatigue curve is given in Figure 8. This curve is consistent with similar SMA mixes tested for the Tollway and IDOT, even to the 300 micro strain test level. The fatigue equation for this mixture is:
Nf = 4.011 E-15 (1/)6.129
Figure 8. Fatigue curve for warm asphalt mixture 2
MIX 3. WMA WARM
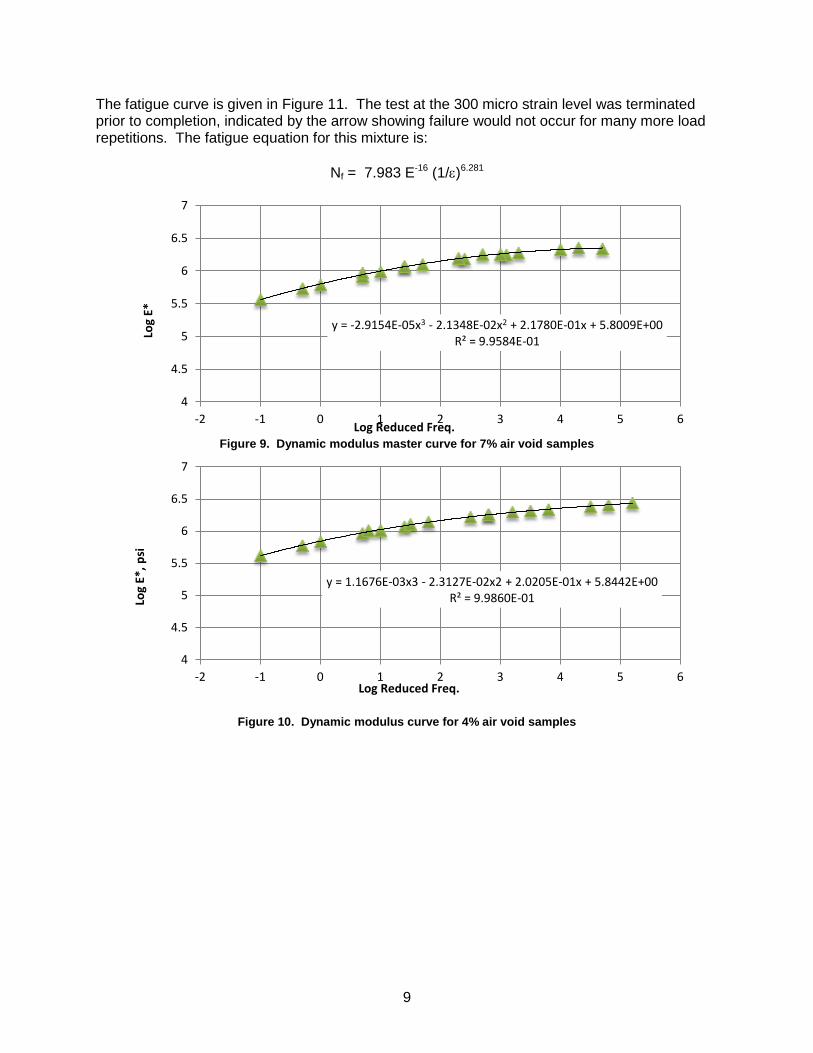
The dynamic modulus master curve for the 7% air void specimens is given in Figure 9, and the curve for the 4% specimens is given in Figure 10. There is nothing unusual in these curves.
y = -2.9608E-03x3 + 1.3144E-02x2 + 1.4893E-01x + 5.7493E+00 R² = 9.0181E-01
4
4.5
5
5.5
6
6.5
7
-2 -1 0 1 2 3 4 5 6 7
Log
E*,
psi
Log Reduced Freq.
y = 4.011E-15x-6.129E+00 R² = 9.809E-01
1,000
10,000
100,000
1,000,000
10,000,000
100,000,000
0.0001 0.001 0.01
Load
Re
pe
titi
on
s
Strain
9
The fatigue curve is given in Figure 11. The test at the 300 micro strain level was terminated prior to completion, indicated by the arrow showing failure would not occur for many more load repetitions. The fatigue equation for this mixture is:
Nf = 7.983 E-16 (1/)6.281
Figure 9. Dynamic modulus master curve for 7% air void samples
Figure 10. Dynamic modulus curve for 4% air void samples
y = -2.9154E-05x3 - 2.1348E-02x2 + 2.1780E-01x + 5.8009E+00 R² = 9.9584E-01
4
4.5
5
5.5
6
6.5
7
-2 -1 0 1 2 3 4 5 6
Log
E*
Log Reduced Freq.
y = 1.1676E-03x3 - 2.3127E-02x2 + 2.0205E-01x + 5.8442E+00 R² = 9.9860E-01
4
4.5
5
5.5
6
6.5
7
-2 -1 0 1 2 3 4 5 6
Log
E*,
psi
Log Reduced Freq.

10
Figure 11. Fatigue curve for warm asphalt mixture 3
INTERPRETATION OF PERFORMANCE TEST RESULTS
DYNAMIC MODULUS
The dynamic modulus values for the warm mixtures are similar to the values for a representative Illinois Department of Transportation (IDOT) District 1 SMA mixture. Figure 12 is the master curve for a District 1 SMA mixture with polymer and fiber. When comparing the three different curves to each other, they are all similar, indicating there is no significant difference in dynamic modulus between the three mixtures.
Figure 12. Dynamic modulus curve for IDOT District 1 SMA, 7% air voids
FATIGUE
The fatigue equation for this District 1 IDOT SMA with polymer and fibers is:
Nf = 5.83 E-13 (1/)5.507
y = 7.983E-16x-6.281E+00 R² = 9.770E-01
1,000
10,000
100,000
1,000,000
10,000,000
100,000,000
0.0001 0.001 0.01
Load
Re
pe
titi
on
s
Strain
1n80d-7
5
5.2
5.4
5.6
5.8
6
6.2
6.4
6.6
6.8
7
-2 0 2 4 6
Log Reduced Frequency, hZ
Lo
g E
*, p
si
T=20 C
T=4 C
T=-10 C

11
The important point of comparison is the exponent of each fatigue equation. The field trial mixtures have exponents of 4.862, 6.129, and 6.281 for mixtures 1, 2, and 3, respectively. These are typical values seen for nearly all IDOT mixtures tested. Mixture 1 is very comparable. Mixtures 2 and 3 are higher, indicating an improved fatigue resistance compared to mixture 1. While fatigue resistance is not normally a concern for surface SMA mixtures, this could translate to an improved reflection crack resistance, although the exact level of improvement cannot be discerned from the test data. Mixtures 2 and 3 do appear to have better fatigue resistance than mixture 1.
FLEXURAL BEHAVIOR
Normally, mixtures exhibiting different fatigue behavior will show different stiffness values. These three mixtures all show similar dynamic modulus values at 10 hz, 20ºC. These dynamic modulus and flexural modulus values from the fatigue test and the ratio of flexural to dynamic modulus are shown in table 3.
Table 3. Dynamic and flexural modulus data
Mix 1. Control
Mix 2. WMA Hot
Mix 3. WMA Warm
Dynamic Modulus E* - mPa 6,145 6,894 7,735 Flexural Modulus Ef - mPa 3,958 3,983 4,295 Flexural/Dynamic Ratio 0.640 0.58 0.56
Previously, when fatigue and dynamic modulus testing have been conducted on the same mixture at the same 7% air voids, a consistent relationship was found between the dynamic and flexural modulus. The flexural modulus is between 0.5 and 0.6 of the dynamic modulus in all mixtures tested to date. The ratios for these warm mixtures are within the expected range, as are the modulus values themselves.
CONCLUSION
The Illinois Tollway field trials of WMA with SMA mixtures are a success. The goal of these field trials was to understand the mix design, production, construction, and performance changes associated with using WMA. The results and conclusions are that WMA technology should be considered for future projects. Specific conclusions include:
There were no difficulties or concerns in performing the mix design with WMA.
The plant modifications for WMA were manageable and did not create any noted problem or concern for the production.
The contractor was able to integrate WMA technology in all aspects of production, transportation, laydown, and compaction with existing equipment and personnel.
The performance testing of the WMA mixtures shows that the stiffnesses (modului) of the control mix and the WMA mixtures (both hot and warm) were similar, and these values were consistent with IDOT SMA mixes. The expected performance is as good as standard SMA mixtures.
The fatigue testing of the WMA mixtures shows that the fatigue performance improved with the addition of the WMA additive. This increase in fatigue performance occurred without a change in the fatigue modulus. This result indicates that there may be improved reflective crack resistance with the WMA.

12
Because of the limited scope of this preliminary study, further research and technology demonstrations will need to be performed before WMA is recommended for routine use. Questions regarding the moisture susceptibility of WMA will need to be reviewed and understood, particularly the impact on performance. Further, since the Tollway has high volume roadways, understanding the initial hardening of WMA is key to establishing criteria on opening WMA materials to traffic.

A-1
APPENDIX A. MIX DESIGN AND FIELD DENSITY DATA

A-2