EVALUATION OF DUAL FREQUENCY IDENTIFICATION SONAR …
78
Technical Report 2013-5 EVALUATION OF DUAL FREQUENCY IDENTIFICATION SONAR (DIDSON) FOR MONITORING PACIFIC LAMPREY PASSAGE BEHAVIOR AT FISHWAYS OF BONNEVILLE AND JOHN DAY DAMS, 2012 by E. L. Johnson 1 , T. S. Clabough 1 , M. L. Keefer 1 , C. C. Caudill 1 , P. N. Johnson 2 , M. A. Kirk 1 , and M. A. Jepson 1 1 Department of Fish and Wildlife Sciences, University of Idaho, Moscow, ID 83844-1136 2 LGL Environmental Research Associates, P.O. Box 771, Stevenson, WA 98648 for U.S. Army Corps of Engineers Portland District 2013
Transcript of EVALUATION OF DUAL FREQUENCY IDENTIFICATION SONAR …
Technical Report 2013-5
EVALUATION OF DUAL FREQUENCY IDENTIFICATION SONAR (DIDSON) FOR MONITORING PACIFIC LAMPREY PASSAGE BEHAVIOR AT FISHWAYS OF
BONNEVILLE AND JOHN DAY DAMS, 2012
by
E. L. Johnson1, T. S. Clabough1, M. L. Keefer1, C. C. Caudill1, P. N. Johnson2, M. A. Kirk1, and M. A. Jepson1
1Department of Fish and Wildlife Sciences, University of Idaho, Moscow, ID 83844-1136 2LGL Environmental Research Associates, P.O. Box 771, Stevenson, WA 98648
for
U.S. Army Corps of Engineers Portland District
2013
i
Technical Report 2013-5
EVALUATION OF DUAL FREQUENCY IDENTIFICATION SONAR (DIDSON) FOR MONITORING PACIFIC LAMPREY PASSAGE BEHAVIOR AT FISHWAYS OF
BONNEVILLE AND JOHN DAY DAMS, 2012
by
E. L. Johnson1, T. S. Clabough1, M. L. Keefer1, C. C. Caudill1, P. N. Johnson2, M. A. Kirk1, and M. A. Jepson1
1Department of Fish and Wildlife Sciences, University of Idaho, Moscow, ID 83844-1136 2LGL Environmental Research Associates, P.O. Box 771, Stevenson, WA 98648
for
U.S. Army Corps of Engineers Portland District
2013

ii
Acknowledgements
This project was financed by the U.S. Army Corps of Engineers, Portland District and was facilitated by Sean Tackley. We would like to thank Miro Zyndol and the project biologists at Bonneville and John Day dams. We thank Ralph Budwig and Bob Basham at the University of Idaho Center for Ecohydraulics Research who designed and manufactured some of the deployment systems for the DIDSON. We would like to thank Chris Noyes, Dan Joosten, Steve Lee, and Theresa Tillson from the University of Idaho and William Nagy from the Bonneville Dam Fish Field Unit who provided valuable field assistance for this study. The work reported here was conducted under a Cooperative Ecosystems Study Unit (CESU) agreement W912HZ-10-SOI-0003 with the assistance of Sean Tackley, Glen Rhett, and Benjamin Smithhart.

iii
Table of Contents
Acknowledgements ................................................................................................................... ii Executive summary .................................................................................................................. iv Introduction ................................................................................................................................1 Methods......................................................................................................................................2 DIDSON deployment and set-up .........................................................................................2 Sonar orientation ..................................................................................................................3 Camera depth .......................................................................................................................4 Deployment locations at Bonneville and John Day dams ...................................................5 Data review and analysis .....................................................................................................7 Among-viewer comparison: Quality control evaluation ......................................................9 Sturgeon and lamprey distributions .....................................................................................9 Lateral distribution estimation ...........................................................................................10 Depth estimation ................................................................................................................11 Environmental variables ....................................................................................................11 Results .....................................................................................................................................12 Among-viewer comparison-Bonneville Dam ....................................................................12 Among-viewer comparison-John Day Dam ......................................................................12 Bonneville Dam .................................................................................................................15 Sampling effort ............................................................................................................15 Lamprey events and confidence levels ........................................................................15 Fishway discharge patterns ..........................................................................................16 Event rates by depth .....................................................................................................17 Upstream-downstream movement ...............................................................................19 Event rate by fishway operation ..................................................................................21 Lateral distribution .......................................................................................................23 Portrait mode lamprey depth data ................................................................................26 Associations with sturgeon ..........................................................................................27 Prevalence of attachments ............................................................................................31 John Day Dam ....................................................................................................................31 Sampling effort ............................................................................................................31 Lamprey events and confidence levels ........................................................................31 Lamprey behavior in the bollard field .........................................................................33 Event rate – cross sections ...........................................................................................34 Upstream-downstream movement – cross sections .....................................................35 Lateral distribution – cross sections .............................................................................35 Portrait mode lamprey depth data ................................................................................40 Associations with sturgeon ..........................................................................................42 North wall deployments ...............................................................................................44 Attachments .................................................................................................................44 Discussion ................................................................................................................................44

iv
References ................................................................................................................................54 Appendix A: DIDSON camera deployment parameters .........................................................58 Appendix B: DIDSON camera site configurations .................................................................64
v
Executive Summary
Adult Pacific lamprey (Entosphenus tridentatus) passage efficiency in fishway entrances and through fishway transition pools has often been low in Columbia River basin radiotelemetry studies. In the summer of 2012, we conducted a Dual-Frequency Identification Sonar (DIDSON) study at Bonneville and John Day dams to evaluate Pacific lamprey passage behavior at fine scales (1-5 m). Our broad objectives were to collect pre-modification behavior data at the Bonneville Dam north downstream entrance (where a lamprey passage system is being installed in 2013) and pre- and post-modification data at the John Day north fishway where a bollard field was installed in early 2012 and a lamprey passage system (LPS) is being installed in 2013. Additional objectives included evaluations of upstream and downstream lamprey movements, lateral and vertical distributions of lamprey in the fishway entrance, junction pool, and transition pool areas, and lamprey response to white sturgeon (Acipenser transmontanus) and to reduced night-time flow operations at Bonneville Dam.
A DIDSON camera was used to monitor horizontal depth strata by placing at different depths
or by using an automatic tilting program from 13 June to 18 July at two locations at Bonneville Dam (Powerhouse 2 north downstream and Washington-shore junction pool). The DIDSON camera was then deployed at John Day Dam using a tilting program from 26 July to 30 August at four locations (near the north fishway entrance, upstream from the entrance, at the turnpool, and at the transition pool). Data were collected in high frequency mode at each location for approximately 24 hours per deployment cycle. DIDSON images were primarily collected in landscape mode, with the long axis of the sample volume parallel to the ground to obtain information on upstream and downstream movements and to assess horizontal distribution. Images were also collected in portrait mode to characterize lamprey depth distributions and distance from the camera.
In total, we collected 658 h of DIDSON imagery at Bonneville Dam, of which 180 h were
viewed (27% of total collected) using a randomized sub-sampling approach. At John Day Dam we collected 776 h of DIDSON imagery and viewed 177 h (23% of the total collected). A total of 2,293 and 508 lamprey events were scored at Bonneville and John Day dams, respectively. About two-thirds of the imagery viewed was from night-time hours, which were preferentially sub-sampled given the higher nocturnal activity of the species. We used a set of morphological and behavioral criteria that were developed in 2011 to identify acoustic targets as adult lamprey.
In a quality control evaluation, eight trained technicians watched a total of 129 10-min files
(21.5 h) from Bonneville and John Day dams. There was considerable variability in lamprey event scoring among viewers and among deployment sites. Among-viewer agreement increased with the confidence level for the target, which was primarily a function of how long lamprey were visible. Scoring differences among viewers indicated that adequate DIDSON training and careful post-processing quality control evaluations are needed in DIDSON studies.
At Bonneville Dam the majority (91%) of lamprey events were observed at night and the
highest event rates (e.g., lampreys viewed per hour) were generally observed near the water surface, somewhat contrary to expectations. Most lamprey moved upstream at night at all sites, but there was considerable downstream movement as well and there was behavioral variability
vi
among depth strata. During the daytime, movement was predominantly upstream at the Bonneville entrance deployment but was downstream at both junction pool deployments. Lamprey were generally distributed across the fishway channel at all Bonneville sites, though there were differences in lateral distributions among depth strata. Event rates varied considerably between fishway flow operations at each site but were generally associated with higher rates of downstream movement during standby flow operations. At the north downstream entrance (NDE), reduced night-time velocity was associated with more upstream movement but fewer events compared to normal velocities. Comparisons among operations were more difficult at the junction pool site because of low event rates (north deployment) and lack of events during normal operations (west deployment).
We found considerable circumstantial evidence that lamprey avoided areas where white
sturgeon were concentrated. Few lamprey were observed in the same depth strata as sturgeon at the Bonneville entrance area and in one of two junction pool deployments. At these sites, lamprey were more frequently observed in middle and surface strata whereas sturgeon were mainly near the bottom. Patterns were generally similar at John Day Dam, where most sturgeon were observed near the bottom half of the water column (especially in the transition pool, where few lamprey were detected). In the channel between the fishway entrance and the transition area, most lamprey events were also observed near the bottom half of the water column, but there were relatively few sturgeon observed in these deployments. This suggested that lamprey were more substrate-oriented inside the fishways when sturgeon were absent.
The majority of lamprey events at John Day Dam were observed at the entrance near the
bollard field, and event rates decreased with increasing up-channel distance from the entrance area. Lamprey event rates at John Day Dam were highest at night and more lamprey were observed near the bottom half of the water column than near the surface. During the day and night, movement was generally downstream in the upper half of the water column, whereas movement was generally upstream in the bottom half of the water column. The lateral distribution of lamprey in the cross-section deployments varied widely between sites and tilt angles, but there was a tendency for movements near the fishway walls in some cases.
Overall, we observed very few lamprey that attached to substrates using their oral discs in
2012. At Bonneville, 23 attachments were observed (1% of the total events), all at the north downstream entrance on the fishway wall. At John Day Dam, 73 attachments (14% of the total events) were almost exclusively in the bollard field. Only four lamprey attachments were observed in the John Day fishway upstream of the bollard field.
The 2012 study results provided qualitative and quantitative information on the movements
and behaviors of adult Pacific lamprey in confined fishway environments without collecting or tagging fish. More specifically the study improved our understanding of the lateral and vertical position of fish in the sample volumes and identified behavioral responses to environmental and operational conditions. Furthermore, these results indicate that we can infer adult lamprey swimming direction, enumerate attachment events, and quantify lamprey distribution in relation to predatory fish. The DIDSON was an effective monitoring tool for specific tasks when applied at appropriate scales (such as monitoring behavior at fine-scale fishway locations). However, the ability to extend the technology to calculate passage metrics like entrance or passage efficiency

vii
is limited because the sample range and sample volume limit the spatial inference of the technology and because individual fish cannot be identified. Nonetheless, DIDSON evaluations can provide important information that complements PIT tag and radiotelemetry studies.
1
Introduction
Runs of Pacific lamprey (Entosphenus tridentatus) in the Columbia River Basin have declined considerably over the past several decades. Given the cultural and ecological value of the species, it has been a recent priority to identify and address potential causes for the declines. Many dams in the Pacific Northwest have been associated with reduced upstream escapement by adult Pacific lamprey. Most fishways at these dams were originally designed to facilitate passage of adult salmonids that have different swimming capabilities and higher burst speeds than adult lamprey. In fact, the poor passage success of adult lampreys at large dams (often <50%, Moser et al. 2002; Mesa et al. 2010; Johnson et al. 2011; Keefer et al. 2013b), particularly when compared to adult salmonids (i.e., often >90%, Caudill et al. 2007) is almost certainly a contributor to population declines.
Past radiotelemetry studies indicated that adult lamprey have difficulty entering fishways,
passing transition pool areas and areas of the fishway with diffuser gratings, near count stations, and in the serpentine weir sections of fish ladders (Moser et al. 2002; Keefer et al. 2011; Johnson et al. 2012a). Radiotelemetry provides spatial resolution of fish position within 5-10 m of underwater antennas and past telemetry studies have successfully identified the general areas of poor passage. However, these studies have been unable to precisely identify the specific structures, locations, or conditions responsible for adult lamprey passage failure inside fishways. Consequently, there is a need for finer-scale assessments to identify the relationships between lamprey behavior and fishway features associated with poor or failed passage. Such assessments will help to guide future fishway modifications and designs to improve adult lamprey passage.
The availability of sonar has provided efficient, effective, and passive monitoring of adult and juvenile fish (primarily salmonids) during migration (Ransom 1991; Thorne and Johnson 1993; Ransom and Steig 1994; Steig 1994; Ransom et al. 1996; Steig and Iverson 1998). Generally, these studies monitored and enumerated fish passing weirs in large unregulated systems or at sites that were too turbid for visual counts. More recently, sonar imaging has been used to monitor fish behavior and movement upstream and downstream from hydropower dams, enumerate salmonid redds, help develop bioenergetic models, and study diel spawning patterns (Tiffan et al. 2004, 2005; Boswell et al. 2008; Mueller et al. 2010). Sonar imaging provides a non-invasive, ‘mesoscale’ tool in the fish monitoring toolbox. The high resolution and multi-beam Dual Frequency Identification Sonar (DIDSON) occupies a niche between short-range optical cameras and low-resolution, long-range radio and acoustic telemetry systems. The visual range of optical and infrared video is typically 0.5-2 m (defined here as microscale) depending on turbidity, whereas the spatial resolution of radiotelemetry and acoustic telemetry is generally > 10 m (macroscale). DIDSON also has advantages over traditional, single and split-beam echo sounders because it shows the size and general shape of the fish, providing behavioral and species identification information.
We conducted a pilot study in 2011 to evaluate the feasibility of DIDSON acoustic imaging
as a sampling tool to monitor adult Pacific lamprey near fishway openings and inside fishways at Bonneville Dam (Johnson et al. 2012b). We found that adult lamprey could be distinguished using DIDSON imagery from other species by their distinctive, anguilliform swimming motion. Results from the study demonstrated that we could estimate lamprey passage metrics,
2
characterize adult lamprey behavior at fishway entrances, behavior inside fishways at known passage obstacles, and behavior in the presence of predatory fish (white sturgeon, Acipenser transmontanus). We also developed methodologies for reviewing and scoring imagery that could be used for the development of training protocols and for quantitatively assessing among-viewer consistency in scoring lamprey behaviors and abundance from DIDSON imagery.
The overall goal of the 2012 DIDSON study was to refine and expand upon the monitoring
conducted in 2011. The 2012 study sites included the north downstream entrance (NDE) to the Washington-shore fishway and the Washington-shore junction pool at Bonneville Dam and a series of locations inside the lower north-shore fishway at John Day Dam. The key monitoring objectives at Bonneville included: (1) characterizing the vertical and lateral distribution of adult lamprey in the fishways, (2) identifying associations between lamprey behavior and white sturgeon , (3) examining the relationships among fishway operations (i.e., normal versus reduced versus standby night-time water velocity) and lamprey behaviors, and (4) estimating the upstream and downstream movements of lamprey. Key objectives for monitoring at John Day included: (1) qualitatively evaluating lamprey behavior in relation to the recently installed bollard field near the fishway entrance, (2) quantifying the vertical, lateral, and longitudinal distribution of lamprey inside the fishway, and (3) qualitatively assessing lamprey behavior at the transition pool, a potential passage bottleneck.
Methods
The DIDSON camera was developed by the University of Washington’s Applied Physics Laboratory (Belcher et al. 1999, 2001; Tiffan et al. 2004) and uses a high resolution acoustic lens to produce images of the underwater environment. It has conventionally been used where underwater cameras would be limited by low light levels and/or high turbidity. In past studies, the images within 8-10 m of the sonar camera were of high enough resolution to identify fish orientation, heading, and direction of movement (Moursund et al. 2003; Holmes et al. 2006). Johnson et al. (2011) recently demonstrated the effectiveness of DIDSON for assessing lamprey behavior at fishway entrances. The multibeam nature of the DIDSON makes it robust in the acoustically noisy environments commonly encountered at hydropower facilities and the operating frequencies are beyond the range known to affect fish behavior (Fay and Simmonds 1999).
DIDSON deployment and set-up
We deployed a DIDSON from 13 June to 18 July at Bonneville Dam and from 26 July to 30
August at John Day Dam in 2012 (model 300 M, Sound Metrics Corp., Bothel, WA). The DIDSON consisted of a transducer array, acoustic lens, and electronics contained in a waterproof housing. The DIDSON transmitted data to a topside control box using a data cable. A laptop was used to control the DIDSON settings and displayed images in real-time. The DIDSON camera was mounted to a 2-axis X2 Rotator (Sound Metrics Corps) that the operator could remotely control for panning and tilting the camera using the laptop. The DIDSON sonar and rotator were mounted to an aluminum I-beam trolley and deployed and retrieved using a portable
3
davit crane (Series 5122, Thern, Inc., Winona, MN) with a 500 lb capacity that was positioned at each deployment location. The laptop computer, DIDSON topside control box, and battery backup were housed in waterproof storage units near the I-beams. A 1 TB removable storage drive (Western Digital, Irvine, CA) was used to transfer data to a larger 10 TB network drive (Netgear ReadyNAS, San Jose, CA) for continuous storage.
The DIDSON had low- (1.0 MHz) and high-frequency (1.8 MHz) modes. In the high
frequency mode, each beam was 0.3° in the horizontal and 14° in elevation. There were 96 beams spanning 29° in the horizontal direction for a total field of view of 29° (horizontal) x 14° (vertical). A spreader lens was used to “double” the sample volume for a total field of view of 29° (horizontal) x 28° (vertical) at Bonneville Dam. We did not use the spreader lens at John Day Dam since the total desired sample volume could be captured without it. We note that while the sample volume is three dimensional, the imagery produced by the DIDSON integrates the vertical dimension, resulting in no resolution of vertical position in the sample volume. The high frequency mode was the most useful for our deployments as it provided higher resolution images that allowed us to distinguish shape, movement, size, and orientation of adult Pacific lamprey.
High resolution files were saved in 10-min increments to facilitate data review with the
sampling location, date, time and camera orientation (portrait vs. landscape) linked directly to the data files. The data were set to record at a rate of 10 frames/sec. This frame rate allowed us to effectively differentiate the unique shape and swimming motion of lamprey from other targets. The sonar was typically positioned to sample perpendicular to the lateral plane (side) of the fish (i.e., the sample volume spread across the water column in a near-horizontal orientation instead of vertically through the water column). This configuration maximized the potential for insonifying fish perpendicularly along the longitudinal plane (in a side-aspect) as they swam through the acoustic field. Although the sonar was usually aimed across the fishway channel, perpendicular to the flow, the DIDSON direction varied by location depending upon the specific deployment objectives. We found it useful to have some structure in the field of view for spatial reference both for confirming the placement of the camera, as well as determining the fish’s orientation within the fishway and swimming direction. Sonar orientation
The depth, heading, and orientation of the DIDSON varied across the different deployments depending upon the objectives for each location. Most of the monitoring in 2012 was conducted with the DIDSON in ‘landscape mode’ with the camera oriented so that the pan axis of the rotator moved the camera along the horizon and the 29° component of the sample volume spread laterally (Figure 1). When oriented perpendicular to the flow field (as in Figure 1) the landscape orientation provided information on the upstream and downstream movements of fish (angle or bearing) and their distance from the camera (range). The landscape images appear as a “top view” or plan view of the sample area.
To monitor a larger portion of the vertical plane, the pan axis of the DIDSON was rotated 90°
into ‘portrait mode’ by mounting the rotator directly to the I-beam. Portrait mode provided information on the depth of fish within the water column with a “side-view” or elevation view of the sample area. A disadvantage of portrait mode was that the direction of flow and the direction
4
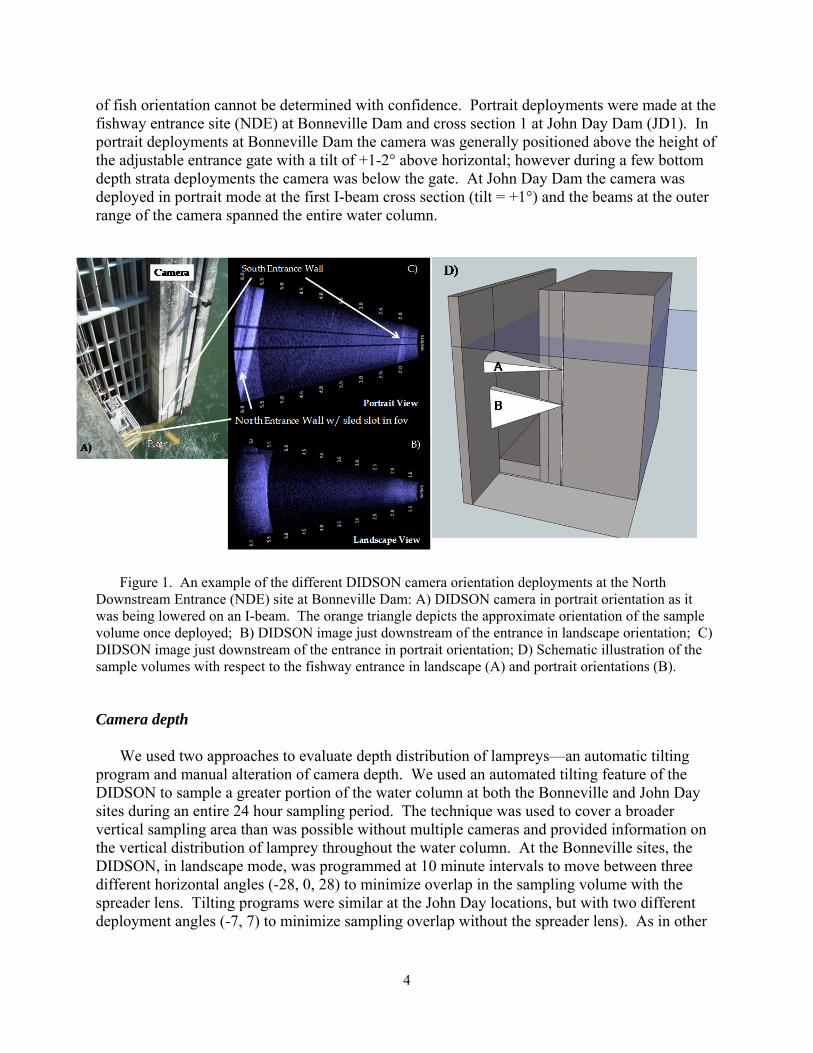
of fish orientation cannot be determined with confidence. Portrait deployments were made at the fishway entrance site (NDE) at Bonneville Dam and cross section 1 at John Day Dam (JD1). In portrait deployments at Bonneville Dam the camera was generally positioned above the height of the adjustable entrance gate with a tilt of +1-2° above horizontal; however during a few bottom depth strata deployments the camera was below the gate. At John Day Dam the camera was deployed in portrait mode at the first I-beam cross section (tilt = +1°) and the beams at the outer range of the camera spanned the entire water column.
Figure 1. An example of the different DIDSON camera orientation deployments at the North Downstream Entrance (NDE) site at Bonneville Dam: A) DIDSON camera in portrait orientation as it was being lowered on an I-beam. The orange triangle depicts the approximate orientation of the sample volume once deployed; B) DIDSON image just downstream of the entrance in landscape orientation; C) DIDSON image just downstream of the entrance in portrait orientation; D) Schematic illustration of the sample volumes with respect to the fishway entrance in landscape (A) and portrait orientations (B).
Camera depth
We used two approaches to evaluate depth distribution of lampreys—an automatic tilting program and manual alteration of camera depth. We used an automated tilting feature of the DIDSON to sample a greater portion of the water column at both the Bonneville and John Day sites during an entire 24 hour sampling period. The technique was used to cover a broader vertical sampling area than was possible without multiple cameras and provided information on the vertical distribution of lamprey throughout the water column. At the Bonneville sites, the DIDSON, in landscape mode, was programmed at 10 minute intervals to move between three different horizontal angles (-28, 0, 28) to minimize overlap in the sampling volume with the spreader lens. Tilting programs were similar at the John Day locations, but with two different deployment angles (-7, 7) to minimize sampling overlap without the spreader lens). As in other
5
deployments, we found it useful to have some structure in the field of view for spatial reference to help determine fish orientation within the fishway and swimming direction.
At Bonneville Dam, where the water was deeper than at John Day Dam, we also used a
vertical depth sampling protocol where the camera was deployed near the surface, middle, and bottom of the water column (See Appendix A for depths). Data collected using this sampling technique were somewhat easier to interpret than were data from the tilting program because: 1) depth strata did not overlap, and 2) fish were insonified perpendicularly along the longitudinal plane (in a side-aspect). This was in contrast to the overlapping strata and steeper angles in the tilting program deployment, which insonified lamprey at oblique angles. However, the tilting deployment allowed us to sample more than one depth strata within night, which was advantageous in terms of statistical interpretation (i.e., different strata were observed on the same night). In contrast, the vertical strata approach could only sample one depth strata per deployment.
Deployment locations at Bonneville and John Day dams
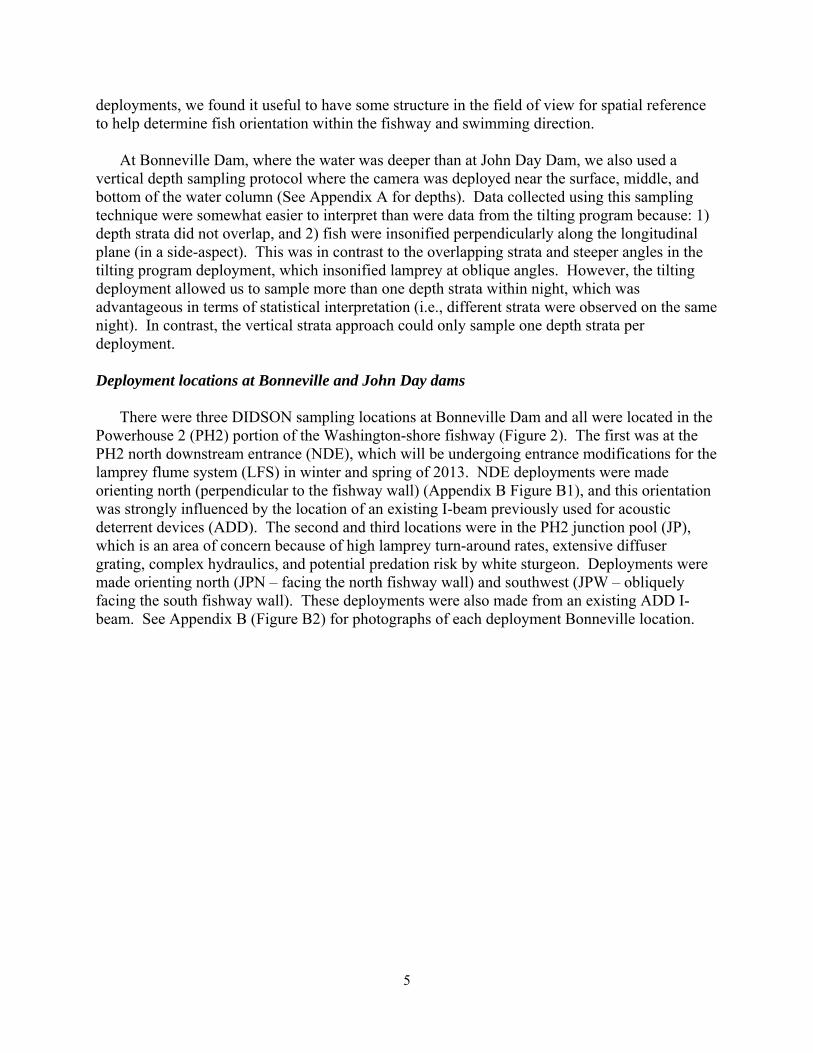
There were three DIDSON sampling locations at Bonneville Dam and all were located in the
Powerhouse 2 (PH2) portion of the Washington-shore fishway (Figure 2). The first was at the PH2 north downstream entrance (NDE), which will be undergoing entrance modifications for the lamprey flume system (LFS) in winter and spring of 2013. NDE deployments were made orienting north (perpendicular to the fishway wall) (Appendix B Figure B1), and this orientation was strongly influenced by the location of an existing I-beam previously used for acoustic deterrent devices (ADD). The second and third locations were in the PH2 junction pool (JP), which is an area of concern because of high lamprey turn-around rates, extensive diffuser grating, complex hydraulics, and potential predation risk by white sturgeon. Deployments were made orienting north (JPN – facing the north fishway wall) and southwest (JPW – obliquely facing the south fishway wall). These deployments were also made from an existing ADD I-beam. See Appendix B (Figure B2) for photographs of each deployment Bonneville location.
6
Figure 2. Locations of DIDSON deployments at the Powerhouse 2 Washington-shore fishway at Bonneville Dam in 2012. (1) North Downstream Entrance (NDE) and (2) Junction Pool (JPN and JPW).
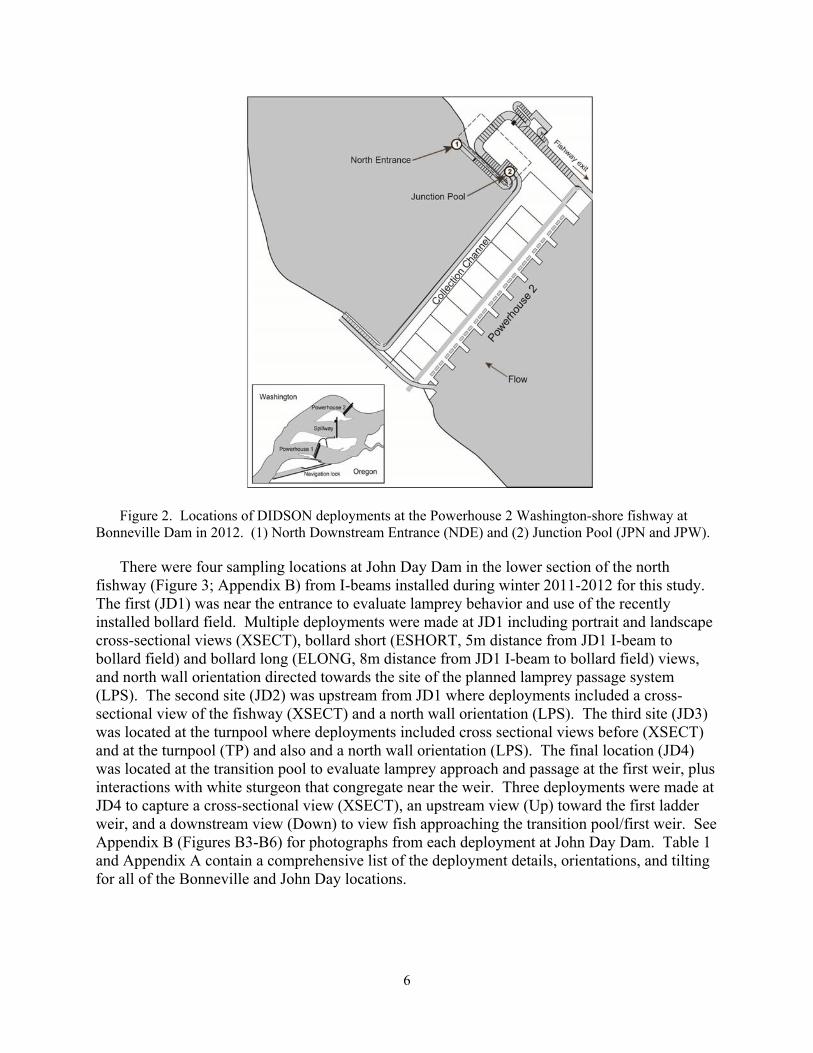
There were four sampling locations at John Day Dam in the lower section of the north
fishway (Figure 3; Appendix B) from I-beams installed during winter 2011-2012 for this study. The first (JD1) was near the entrance to evaluate lamprey behavior and use of the recently installed bollard field. Multiple deployments were made at JD1 including portrait and landscape cross-sectional views (XSECT), bollard short (ESHORT, 5m distance from JD1 I-beam to bollard field) and bollard long (ELONG, 8m distance from JD1 I-beam to bollard field) views, and north wall orientation directed towards the site of the planned lamprey passage system (LPS). The second site (JD2) was upstream from JD1 where deployments included a cross-sectional view of the fishway (XSECT) and a north wall orientation (LPS). The third site (JD3) was located at the turnpool where deployments included cross sectional views before (XSECT) and at the turnpool (TP) and also and a north wall orientation (LPS). The final location (JD4) was located at the transition pool to evaluate lamprey approach and passage at the first weir, plus interactions with white sturgeon that congregate near the weir. Three deployments were made at JD4 to capture a cross-sectional view (XSECT), an upstream view (Up) toward the first ladder weir, and a downstream view (Down) to view fish approaching the transition pool/first weir. See Appendix B (Figures B3-B6) for photographs from each deployment at John Day Dam. Table 1 and Appendix A contain a comprehensive list of the deployment details, orientations, and tilting for all of the Bonneville and John Day locations.
7
Figure 3. Locations of DIDSON cross-section (XSECT) deployments in the lower north fishway of John Day Dam in 2012. The newly-installed bollard field was located between the entrance weir and I-beam 1. ‘LPS’ deployments were oriented along the north wall at sites JD1, JD2, and JD3. Data review and analysis
Raw data files were processed by trained University of Idaho fisheries personnel using DIDSON v5.25.25 software (Sound Metrics Corp., Lake Forest Park, WA). We have established several criteria to aid in the identification of adult lamprey, including:
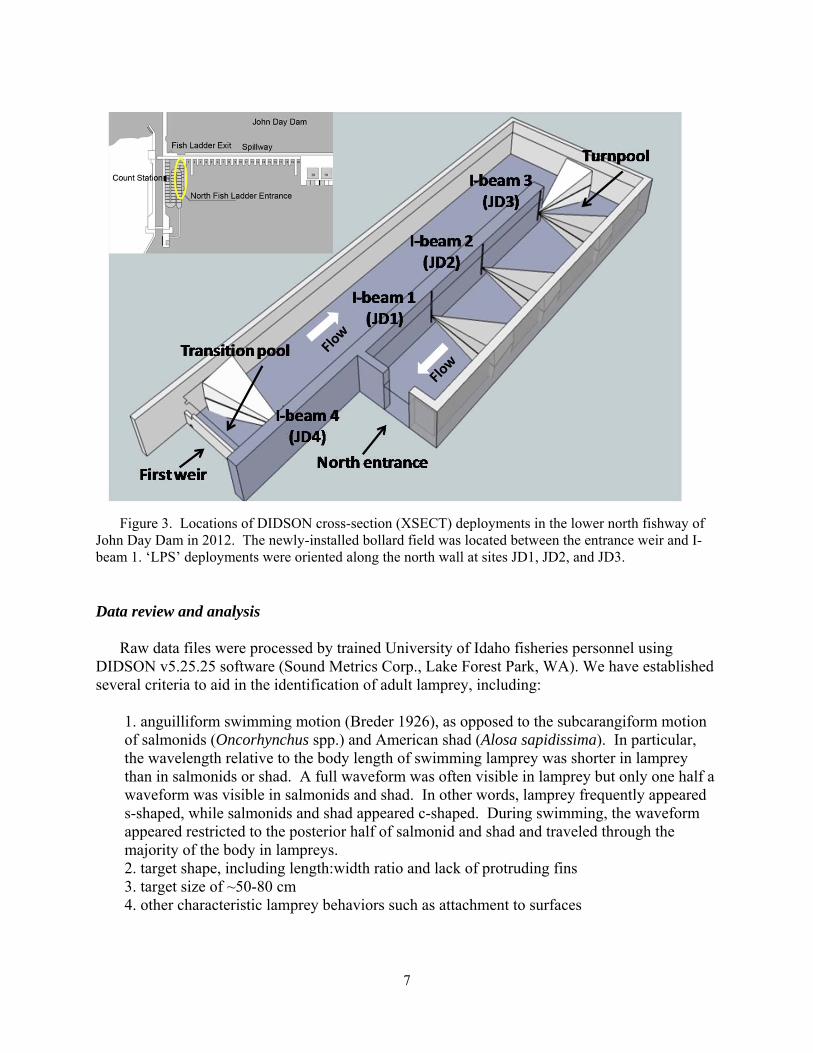
1. anguilliform swimming motion (Breder 1926), as opposed to the subcarangiform motion of salmonids (Oncorhynchus spp.) and American shad (Alosa sapidissima). In particular, the wavelength relative to the body length of swimming lamprey was shorter in lamprey than in salmonids or shad. A full waveform was often visible in lamprey but only one half a waveform was visible in salmonids and shad. In other words, lamprey frequently appeared s-shaped, while salmonids and shad appeared c-shaped. During swimming, the waveform appeared restricted to the posterior half of salmonid and shad and traveled through the majority of the body in lampreys. 2. target shape, including length:width ratio and lack of protruding fins 3. target size of ~50-80 cm 4. other characteristic lamprey behaviors such as attachment to surfaces
8
We developed a protocol in our 2011 study to standardize lamprey identification and scoring of DIDSON files that we continued to use in 2012. Inexperienced viewers independently watched and scored lamprey detection events from a common set of training files. All viewers then collectively reviewed the common files and event scoring with an experienced DIDSON technician. Because there was considerable among-viewer variability in the initial scoring and variability in the duration and quality of individual target images, we used confidence levels (low, medium, high) to classify each lamprey event. ‘High’ confidence was assigned to events that met most or all of the lamprey identification criteria. ‘Medium’ confidence was assigned to events that had one or two of the characteristics, and ‘low’ confidence was assigned to events that were potentially lamprey but had few conclusive characteristics. These scores were necessarily qualitative given considerable variability in the time lamprey were in the field of view (i.e., often < 1 sec; <10 frames), the number of other fish present, and image differences related to the deployment mode (landscape, portrait) and orientation of lamprey to the camera.
Once a target was identified, we used tools in the reviewing software to measure the image
range (distance from camera) and image angle (location in the horizontal plane in landscape mode or in the vertical plane in portrait mode) with respect to the camera. Range and angle were recorded for the first and last image of each individual lamprey target. Viewers also recorded lamprey heading (i.e., facing upstream or facing downstream), whether the lamprey attached to substrate, attachment location, and details of the DIDSON file (filename, site, date, review rate [frames/sec], review date). Review rates ranged from 10-15 frames/sec. Display threshold and intensity settings were manually adjusted to optimize the contrast of the targets. Data for each event were entered into spreadsheets and events recorded by all viewers were compiled into a master database.
We scored the number sturgeon events as an index of white sturgeon activity for each
location and deployment. The index was a relative measure only and was calculated by counting the number of white sturgeon sightings per ten minute file. A single sighting was defined as an individual sturgeon in the viewing field until the time it left the viewing field. Hence, the index should not be considered a measure of abundance since it likely overestimates the number of sturgeon actually present (i.e., individual sturgeon were counted more than once) and rather should be considered an estimate of sturgeon activity. Viewers recorded the number of sturgeon events for each file viewed.
Because far more data files were collected than could be processed (Tables 1-2), we used
random subsampling to select files for review. Initially, all sites and deployments were equally represented. The a priori subsampling scheme favored night-time files over day-time files due to the primarily nocturnal activity of lamprey at fishways (Keefer et al. 2013a) and favored landscape mode files over portrait mode files because reviewers could identify lampreys with greater confidence in landscape mode (Johnson et al. 2012). The selected subsample was randomly distributed among viewers as much as possible. Viewer availability and minor shifts in viewing priority based on preliminary results precluded strictly random assignment.
9
Among-viewer comparison: Quality control evaluation In addition to the common set of training files, we evaluated the consistency of scoring
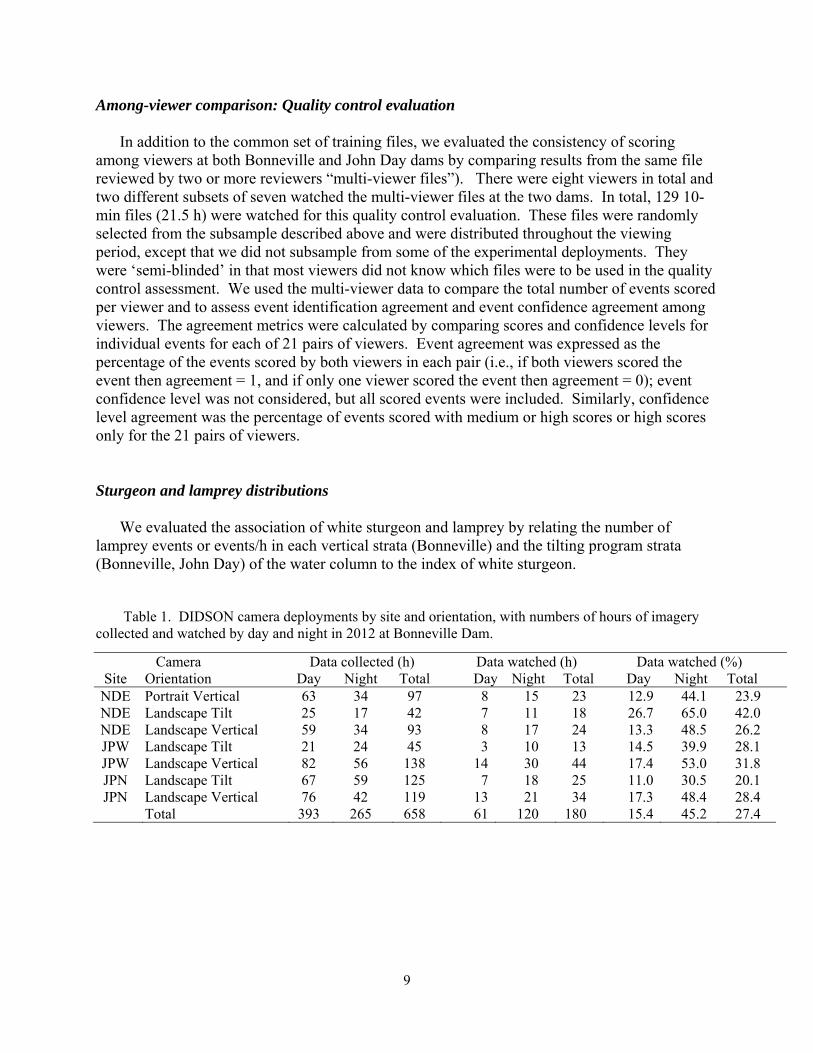
among viewers at both Bonneville and John Day dams by comparing results from the same file reviewed by two or more reviewers “multi-viewer files”). There were eight viewers in total and two different subsets of seven watched the multi-viewer files at the two dams. In total, 129 10-min files (21.5 h) were watched for this quality control evaluation. These files were randomly selected from the subsample described above and were distributed throughout the viewing period, except that we did not subsample from some of the experimental deployments. They were ‘semi-blinded’ in that most viewers did not know which files were to be used in the quality control assessment. We used the multi-viewer data to compare the total number of events scored per viewer and to assess event identification agreement and event confidence agreement among viewers. The agreement metrics were calculated by comparing scores and confidence levels for individual events for each of 21 pairs of viewers. Event agreement was expressed as the percentage of the events scored by both viewers in each pair (i.e., if both viewers scored the event then agreement = 1, and if only one viewer scored the event then agreement = 0); event confidence level was not considered, but all scored events were included. Similarly, confidence level agreement was the percentage of events scored with medium or high scores or high scores only for the 21 pairs of viewers. Sturgeon and lamprey distributions
We evaluated the association of white sturgeon and lamprey by relating the number of lamprey events or events/h in each vertical strata (Bonneville) and the tilting program strata (Bonneville, John Day) of the water column to the index of white sturgeon.
Table 1. DIDSON camera deployments by site and orientation, with numbers of hours of imagery collected and watched by day and night in 2012 at Bonneville Dam.
Camera Data collected (h) Data watched (h) Data watched (%) Site Orientation Day Night Total Day Night Total Day Night Total
NDE Portrait Vertical 63 34 97 8 15 23 12.9 44.1 23.9 NDE Landscape Tilt 25 17 42 7 11 18 26.7 65.0 42.0 NDE Landscape Vertical 59 34 93 8 17 24 13.3 48.5 26.2 JPW Landscape Tilt 21 24 45 3 10 13 14.5 39.9 28.1 JPW Landscape Vertical 82 56 138 14 30 44 17.4 53.0 31.8 JPN Landscape Tilt 67 59 125 7 18 25 11.0 30.5 20.1 JPN Landscape Vertical 76 42 119 13 21 34 17.3 48.4 28.4
Total 393 265 658 61 120 180 15.4 45.2 27.4
10
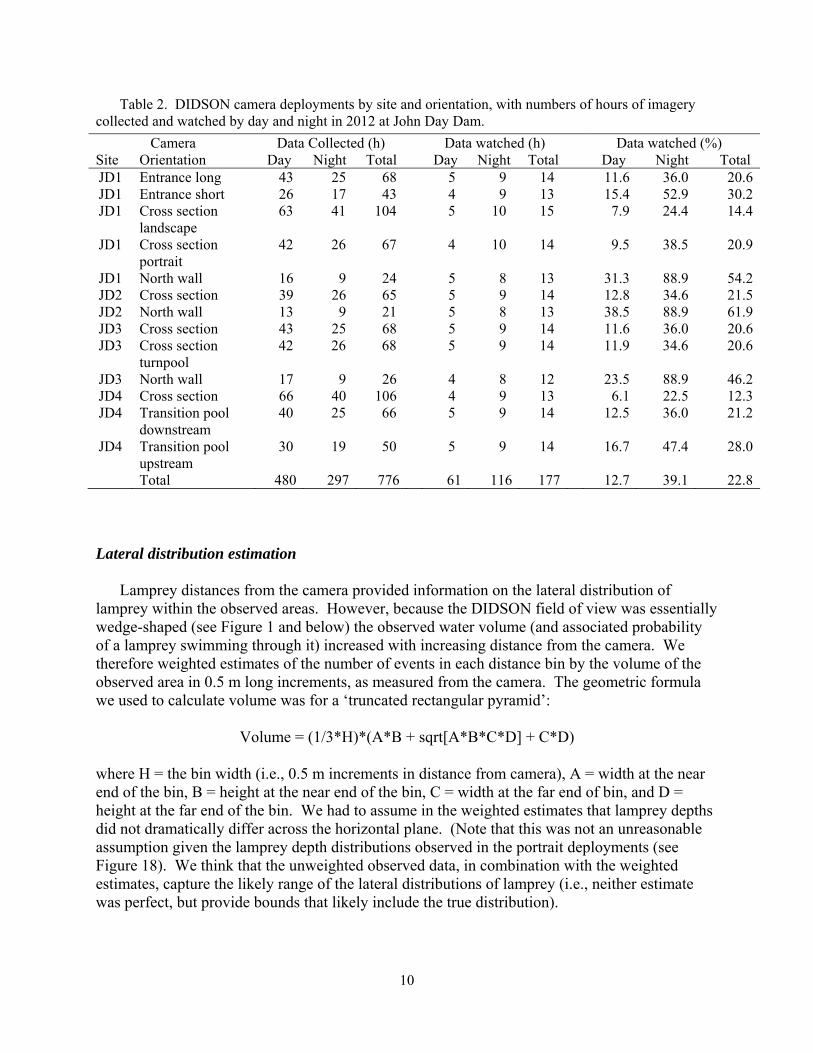
Table 2. DIDSON camera deployments by site and orientation, with numbers of hours of imagery collected and watched by day and night in 2012 at John Day Dam.
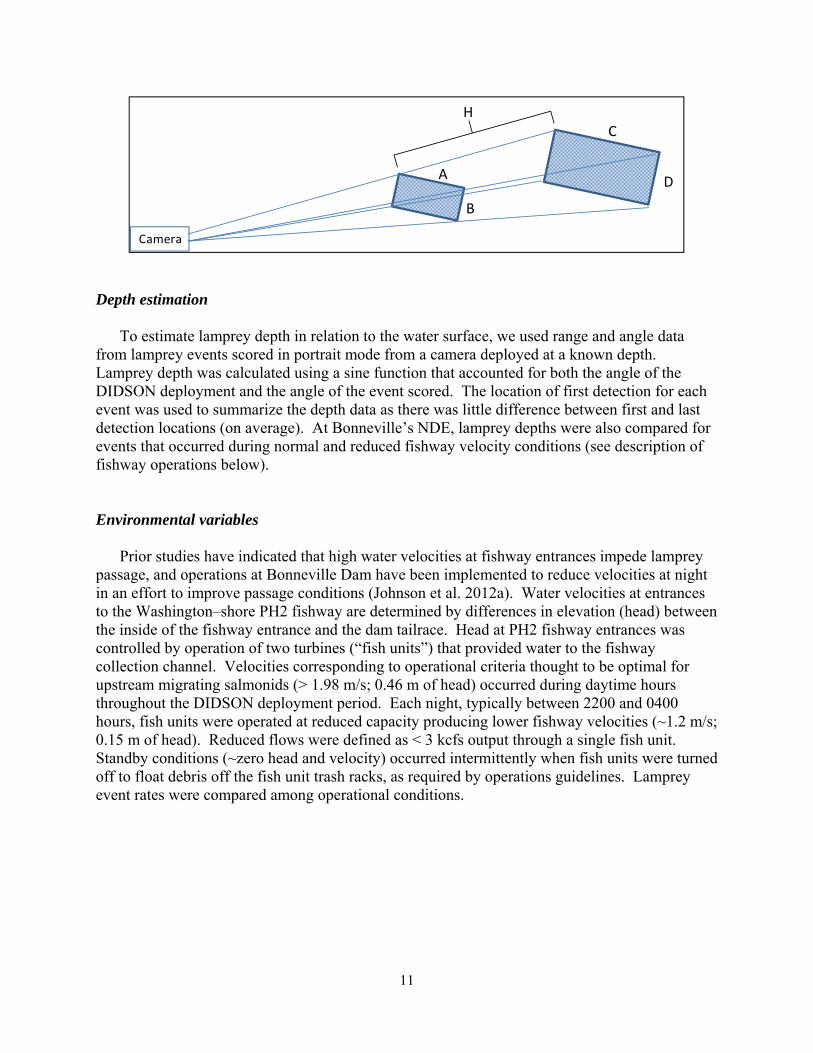
Lateral distribution estimation
Lamprey distances from the camera provided information on the lateral distribution of lamprey within the observed areas. However, because the DIDSON field of view was essentially wedge-shaped (see Figure 1 and below) the observed water volume (and associated probability of a lamprey swimming through it) increased with increasing distance from the camera. We therefore weighted estimates of the number of events in each distance bin by the volume of the observed area in 0.5 m long increments, as measured from the camera. The geometric formula we used to calculate volume was for a ‘truncated rectangular pyramid’:
Volume = (1/3*H)*(A*B + sqrt[A*B*C*D] + C*D) where H = the bin width (i.e., 0.5 m increments in distance from camera), A = width at the near end of the bin, B = height at the near end of the bin, C = width at the far end of bin, and D = height at the far end of the bin. We had to assume in the weighted estimates that lamprey depths did not dramatically differ across the horizontal plane. (Note that this was not an unreasonable assumption given the lamprey depth distributions observed in the portrait deployments (see Figure 18). We think that the unweighted observed data, in combination with the weighted estimates, capture the likely range of the lateral distributions of lamprey (i.e., neither estimate was perfect, but provide bounds that likely include the true distribution).
Site
Camera Orientation
Data Collected (h) Data watched (h) Data watched (%) Day Night Total Day Night Total Day Night Total
JD1 Entrance long 43 25 68 5 9 14 11.6 36.0 20.6JD1 Entrance short 26 17 43 4 9 13 15.4 52.9 30.2JD1 Cross section
landscape 63 41 104 5 10 15 7.9 24.4 14.4
JD1 Cross section portrait
42 26 67 4 10 14 9.5 38.5 20.9
JD1 North wall 16 9 24 5 8 13 31.3 88.9 54.2JD2 Cross section 39 26 65 5 9 14 12.8 34.6 21.5JD2 North wall 13 9 21 5 8 13 38.5 88.9 61.9JD3 Cross section 43 25 68 5 9 14 11.6 36.0 20.6JD3 Cross section
turnpool 42 26 68 5 9 14 11.9 34.6 20.6
JD3 North wall 17 9 26 4 8 12 23.5 88.9 46.2JD4 Cross section 66 40 106 4 9 13 6.1 22.5 12.3JD4 Transition pool
downstream 40 25 66 5 9 14 12.5 36.0 21.2
JD4 Transition pool upstream
30 19 50 5 9 14 16.7 47.4 28.0
Total 480 297 776 61 116 177 12.7 39.1 22.8
11
Depth estimation
To estimate lamprey depth in relation to the water surface, we used range and angle data
from lamprey events scored in portrait mode from a camera deployed at a known depth. Lamprey depth was calculated using a sine function that accounted for both the angle of the DIDSON deployment and the angle of the event scored. The location of first detection for each event was used to summarize the depth data as there was little difference between first and last detection locations (on average). At Bonneville’s NDE, lamprey depths were also compared for events that occurred during normal and reduced fishway velocity conditions (see description of fishway operations below). Environmental variables
Prior studies have indicated that high water velocities at fishway entrances impede lamprey passage, and operations at Bonneville Dam have been implemented to reduce velocities at night in an effort to improve passage conditions (Johnson et al. 2012a). Water velocities at entrances to the Washington–shore PH2 fishway are determined by differences in elevation (head) between the inside of the fishway entrance and the dam tailrace. Head at PH2 fishway entrances was controlled by operation of two turbines (“fish units”) that provided water to the fishway collection channel. Velocities corresponding to operational criteria thought to be optimal for upstream migrating salmonids (> 1.98 m/s; 0.46 m of head) occurred during daytime hours throughout the DIDSON deployment period. Each night, typically between 2200 and 0400 hours, fish units were operated at reduced capacity producing lower fishway velocities (~1.2 m/s; 0.15 m of head). Reduced flows were defined as < 3 kcfs output through a single fish unit. Standby conditions (~zero head and velocity) occurred intermittently when fish units were turned off to float debris off the fish unit trash racks, as required by operations guidelines. Lamprey event rates were compared among operational conditions.
Camera
A
C
B
D
H
12
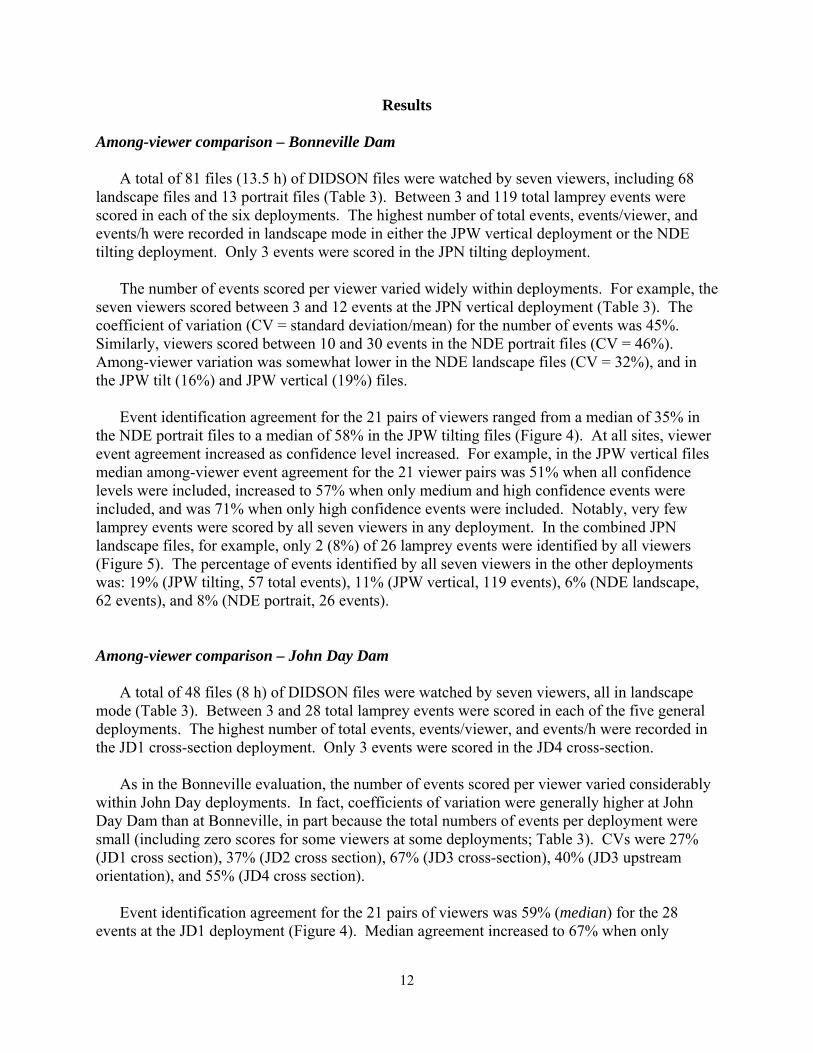
Results Among-viewer comparison – Bonneville Dam
A total of 81 files (13.5 h) of DIDSON files were watched by seven viewers, including 68 landscape files and 13 portrait files (Table 3). Between 3 and 119 total lamprey events were scored in each of the six deployments. The highest number of total events, events/viewer, and events/h were recorded in landscape mode in either the JPW vertical deployment or the NDE tilting deployment. Only 3 events were scored in the JPN tilting deployment.
The number of events scored per viewer varied widely within deployments. For example, the
seven viewers scored between 3 and 12 events at the JPN vertical deployment (Table 3). The coefficient of variation (CV = standard deviation/mean) for the number of events was 45%. Similarly, viewers scored between 10 and 30 events in the NDE portrait files (CV = 46%). Among-viewer variation was somewhat lower in the NDE landscape files (CV = 32%), and in the JPW tilt (16%) and JPW vertical (19%) files.
Event identification agreement for the 21 pairs of viewers ranged from a median of 35% in
the NDE portrait files to a median of 58% in the JPW tilting files (Figure 4). At all sites, viewer event agreement increased as confidence level increased. For example, in the JPW vertical files median among-viewer event agreement for the 21 viewer pairs was 51% when all confidence levels were included, increased to 57% when only medium and high confidence events were included, and was 71% when only high confidence events were included. Notably, very few lamprey events were scored by all seven viewers in any deployment. In the combined JPN landscape files, for example, only 2 (8%) of 26 lamprey events were identified by all viewers (Figure 5). The percentage of events identified by all seven viewers in the other deployments was: 19% (JPW tilting, 57 total events), 11% (JPW vertical, 119 events), 6% (NDE landscape, 62 events), and 8% (NDE portrait, 26 events).
Among-viewer comparison – John Day Dam
A total of 48 files (8 h) of DIDSON files were watched by seven viewers, all in landscape mode (Table 3). Between 3 and 28 total lamprey events were scored in each of the five general deployments. The highest number of total events, events/viewer, and events/h were recorded in the JD1 cross-section deployment. Only 3 events were scored in the JD4 cross-section.
As in the Bonneville evaluation, the number of events scored per viewer varied considerably
within John Day deployments. In fact, coefficients of variation were generally higher at John Day Dam than at Bonneville, in part because the total numbers of events per deployment were small (including zero scores for some viewers at some deployments; Table 3). CVs were 27% (JD1 cross section), 37% (JD2 cross section), 67% (JD3 cross-section), 40% (JD3 upstream orientation), and 55% (JD4 cross section).
Event identification agreement for the 21 pairs of viewers was 59% (median) for the 28
events at the JD1 deployment (Figure 4). Median agreement increased to 67% when only
13
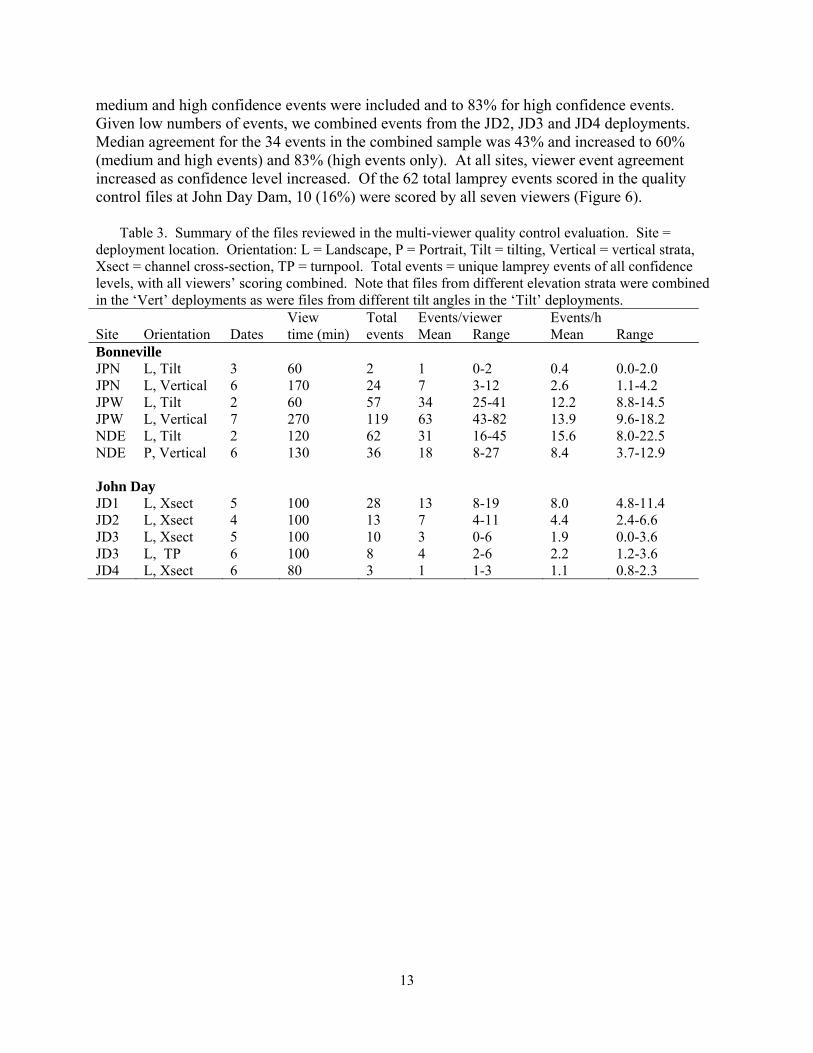
medium and high confidence events were included and to 83% for high confidence events. Given low numbers of events, we combined events from the JD2, JD3 and JD4 deployments. Median agreement for the 34 events in the combined sample was 43% and increased to 60% (medium and high events) and 83% (high events only). At all sites, viewer event agreement increased as confidence level increased. Of the 62 total lamprey events scored in the quality control files at John Day Dam, 10 (16%) were scored by all seven viewers (Figure 6).
Table 3. Summary of the files reviewed in the multi-viewer quality control evaluation. Site =
deployment location. Orientation: L = Landscape, P = Portrait, Tilt = tilting, Vertical = vertical strata, Xsect = channel cross-section, TP = turnpool. Total events = unique lamprey events of all confidence levels, with all viewers’ scoring combined. Note that files from different elevation strata were combined in the ‘Vert’ deployments as were files from different tilt angles in the ‘Tilt’ deployments. View Total Events/viewer Events/h Site Orientation Dates time (min) events Mean Range Mean Range Bonneville JPN L, Tilt 3 60 2 1 0-2 0.4 0.0-2.0 JPN L, Vertical 6 170 24 7 3-12 2.6 1.1-4.2 JPW L, Tilt 2 60 57 34 25-41 12.2 8.8-14.5 JPW L, Vertical 7 270 119 63 43-82 13.9 9.6-18.2 NDE L, Tilt 2 120 62 31 16-45 15.6 8.0-22.5 NDE P, Vertical 6 130 36 18 8-27 8.4 3.7-12.9 John Day JD1 L, Xsect 5 100 28 13 8-19 8.0 4.8-11.4 JD2 L, Xsect 4 100 13 7 4-11 4.4 2.4-6.6 JD3 L, Xsect 5 100 10 3 0-6 1.9 0.0-3.6 JD3 L, TP 6 100 8 4 2-6 2.2 1.2-3.6 JD4 L, Xsect 6 80 3 1 1-3 1.1 0.8-2.3
14
Site
JPN JPW-T JPW-V NDE-L NDE-P JD1 JD-2,3,4
Am
ong
-vie
wer
eve
nt a
gree
men
t
0.00
0.25
0.50
0.75
1.00
Bonneville John Day
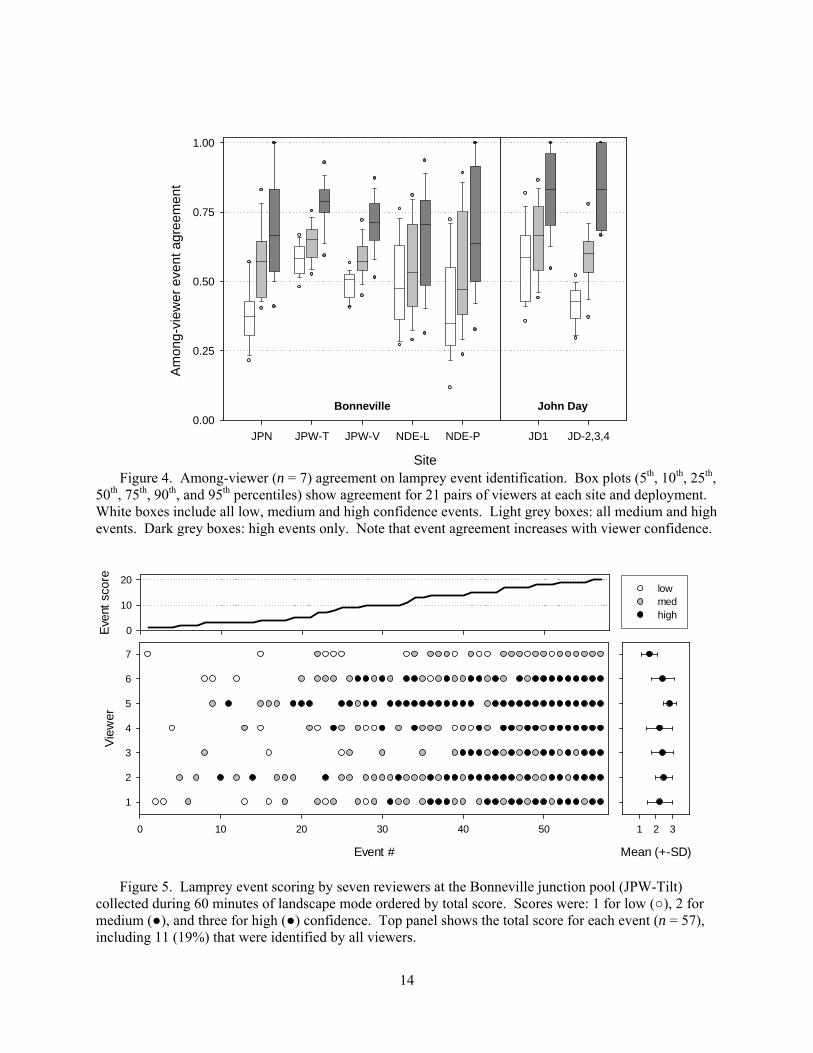
Figure 4. Among-viewer (n = 7) agreement on lamprey event identification. Box plots (5th, 10th, 25th,
50th, 75th, 90th, and 95th percentiles) show agreement for 21 pairs of viewers at each site and deployment. White boxes include all low, medium and high confidence events. Light grey boxes: all medium and high events. Dark grey boxes: high events only. Note that event agreement increases with viewer confidence.
Event #
0 10 20 30 40 50
Vie
wer
1
2
3
4
5
6
7
low med high
Mean (+-SD)
1 2 3
Eve
nt s
core
0
10
20
Figure 5. Lamprey event scoring by seven reviewers at the Bonneville junction pool (JPW-Tilt)
collected during 60 minutes of landscape mode ordered by total score. Scores were: 1 for low (○), 2 for medium (●), and three for high (●) confidence. Top panel shows the total score for each event (n = 57), including 11 (19%) that were identified by all viewers.
15
Event #
0 10 20 30 40 50 60
Vie
wer
1
2
3
4
5
6
7
low med high
Mean (+-SD)
1 2 3
Eve
nt s
core
0
10
20
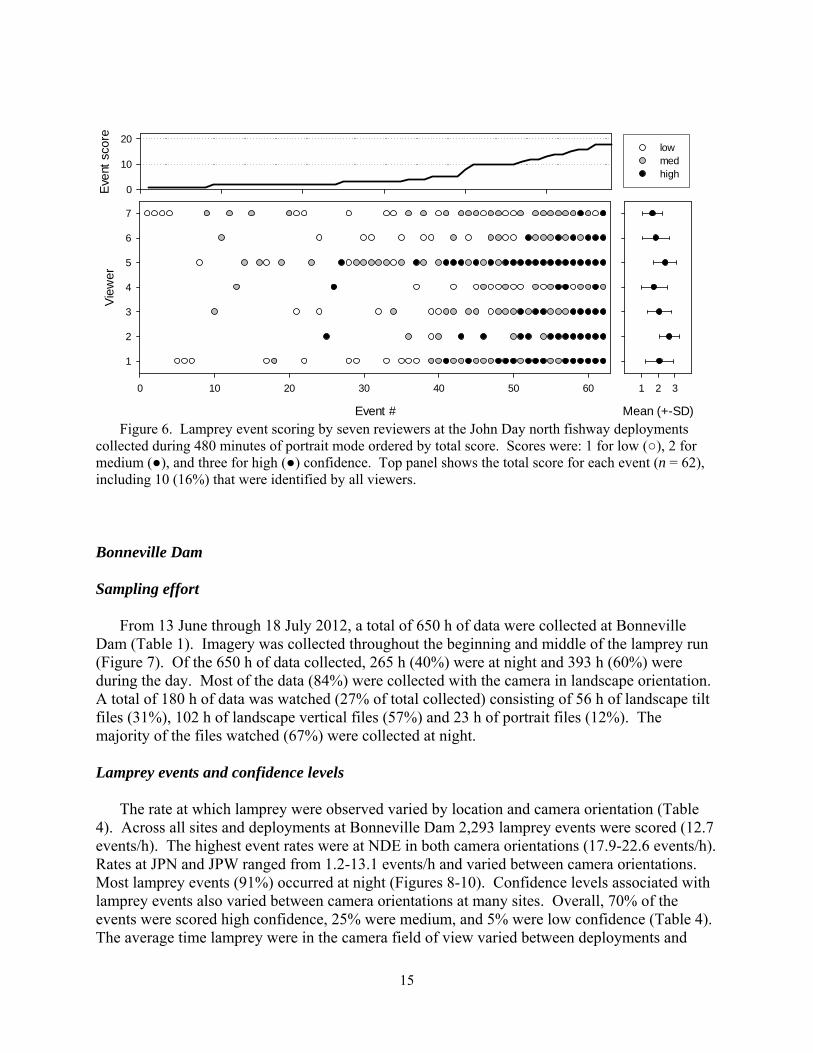
Figure 6. Lamprey event scoring by seven reviewers at the John Day north fishway deployments collected during 480 minutes of portrait mode ordered by total score. Scores were: 1 for low (○), 2 for medium (●), and three for high (●) confidence. Top panel shows the total score for each event (n = 62), including 10 (16%) that were identified by all viewers. Bonneville Dam Sampling effort
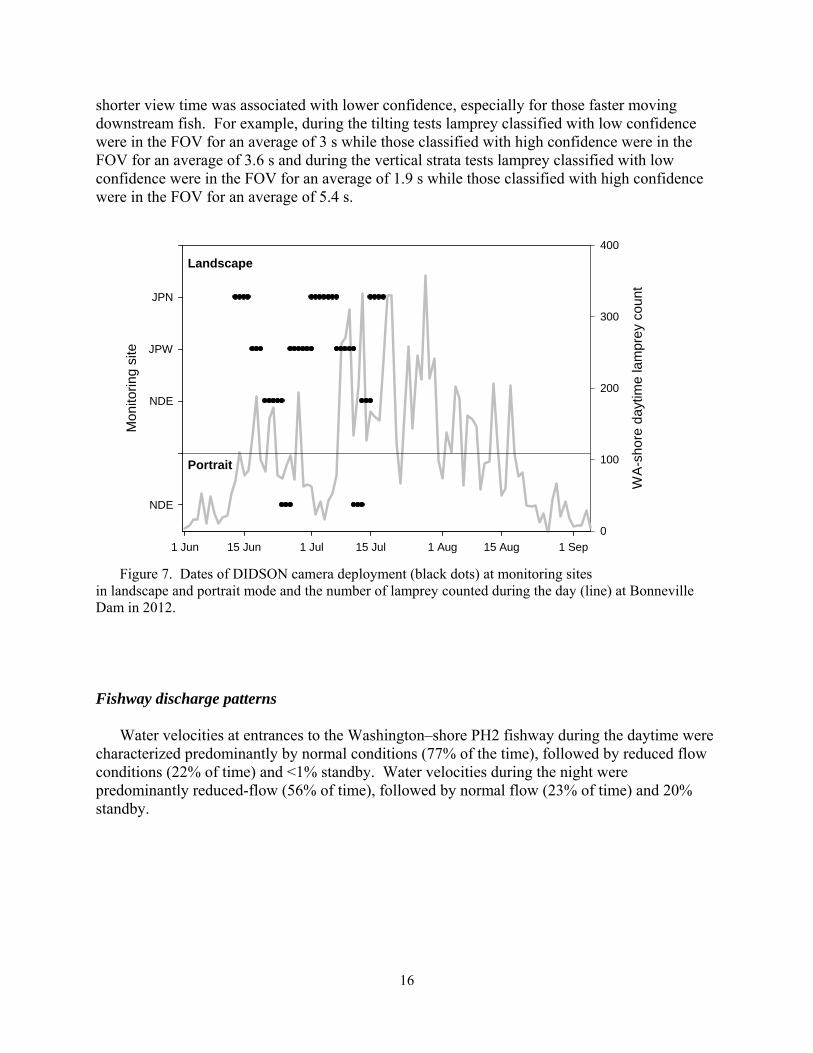
From 13 June through 18 July 2012, a total of 650 h of data were collected at Bonneville Dam (Table 1). Imagery was collected throughout the beginning and middle of the lamprey run (Figure 7). Of the 650 h of data collected, 265 h (40%) were at night and 393 h (60%) were during the day. Most of the data (84%) were collected with the camera in landscape orientation. A total of 180 h of data was watched (27% of total collected) consisting of 56 h of landscape tilt files (31%), 102 h of landscape vertical files (57%) and 23 h of portrait files (12%). The majority of the files watched (67%) were collected at night.
Lamprey events and confidence levels
The rate at which lamprey were observed varied by location and camera orientation (Table 4). Across all sites and deployments at Bonneville Dam 2,293 lamprey events were scored (12.7 events/h). The highest event rates were at NDE in both camera orientations (17.9-22.6 events/h). Rates at JPN and JPW ranged from 1.2-13.1 events/h and varied between camera orientations. Most lamprey events (91%) occurred at night (Figures 8-10). Confidence levels associated with lamprey events also varied between camera orientations at many sites. Overall, 70% of the events were scored high confidence, 25% were medium, and 5% were low confidence (Table 4). The average time lamprey were in the camera field of view varied between deployments and
16
shorter view time was associated with lower confidence, especially for those faster moving downstream fish. For example, during the tilting tests lamprey classified with low confidence were in the FOV for an average of 3 s while those classified with high confidence were in the FOV for an average of 3.6 s and during the vertical strata tests lamprey classified with low confidence were in the FOV for an average of 1.9 s while those classified with high confidence were in the FOV for an average of 5.4 s.
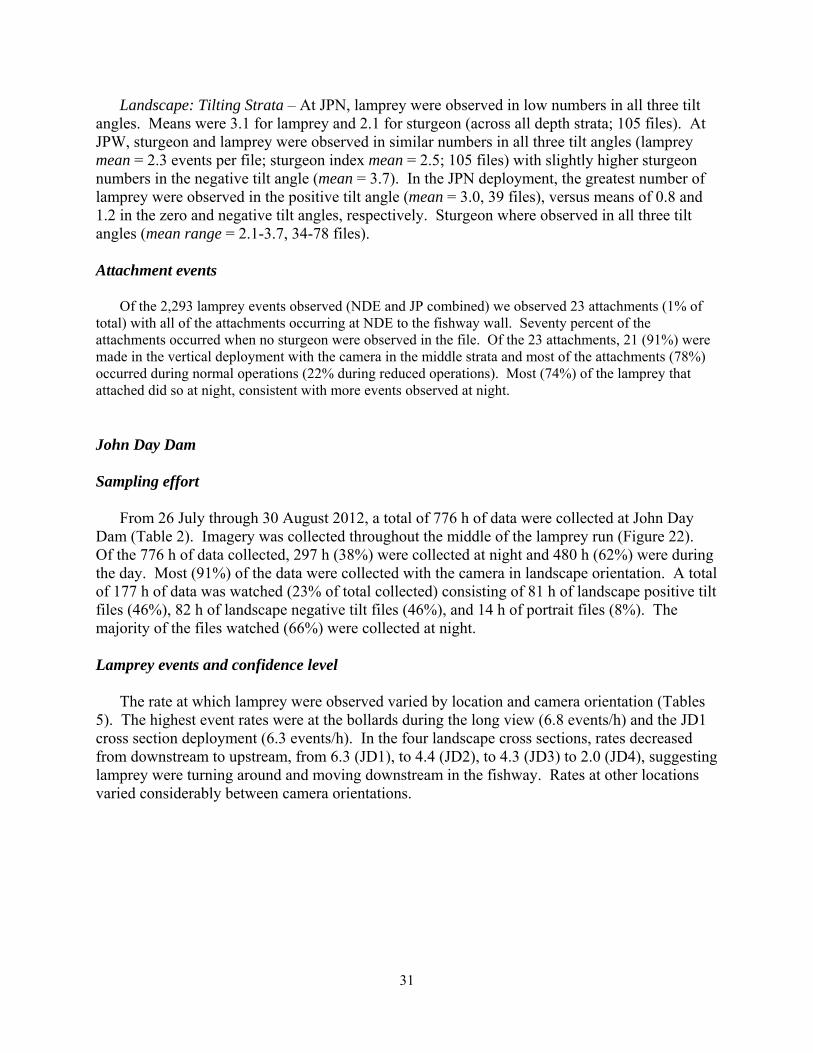
Figure 7. Dates of DIDSON camera deployment (black dots) at monitoring sites in landscape and portrait mode and the number of lamprey counted during the day (line) at Bonneville Dam in 2012. Fishway discharge patterns
Water velocities at entrances to the Washington–shore PH2 fishway during the daytime were characterized predominantly by normal conditions (77% of the time), followed by reduced flow conditions (22% of time) and <1% standby. Water velocities during the night were predominantly reduced-flow (56% of time), followed by normal flow (23% of time) and 20% standby.
1 Jun 15 Jun 1 Jul 15 Jul 1 Aug 15 Aug 1 Sep
WA
-sho
re d
aytim
e la
mpr
ey
coun
t
0
100
200
300
400
Mon
itorin
g si
te
NDE
NDE
JPW
JPN
Landscape
Portrait
17
Table 4. Numbers of hours watched, total lamprey events, events/h and events by confidence class during landscape and portrait DIDSON deployments in 2012 at Bonneville Dam.
Event rates by depth
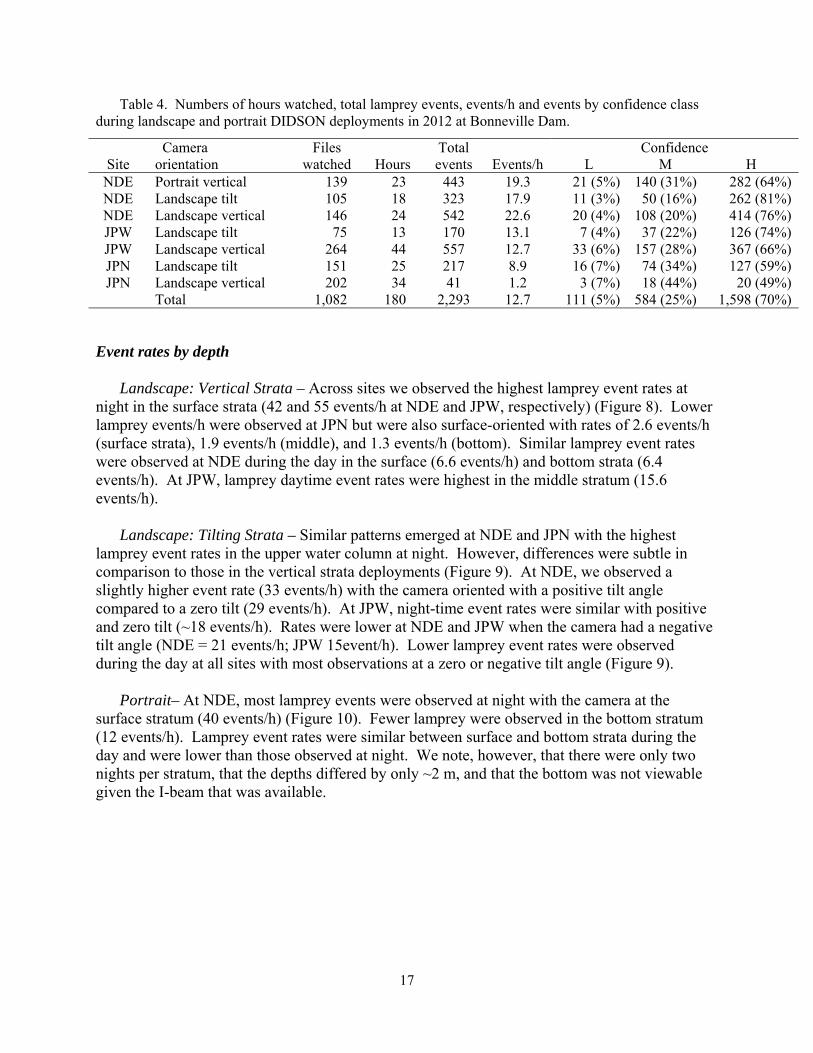
Landscape: Vertical Strata – Across sites we observed the highest lamprey event rates at night in the surface strata (42 and 55 events/h at NDE and JPW, respectively) (Figure 8). Lower lamprey events/h were observed at JPN but were also surface-oriented with rates of 2.6 events/h (surface strata), 1.9 events/h (middle), and 1.3 events/h (bottom). Similar lamprey event rates were observed at NDE during the day in the surface (6.6 events/h) and bottom strata (6.4 events/h). At JPW, lamprey daytime event rates were highest in the middle stratum (15.6 events/h).
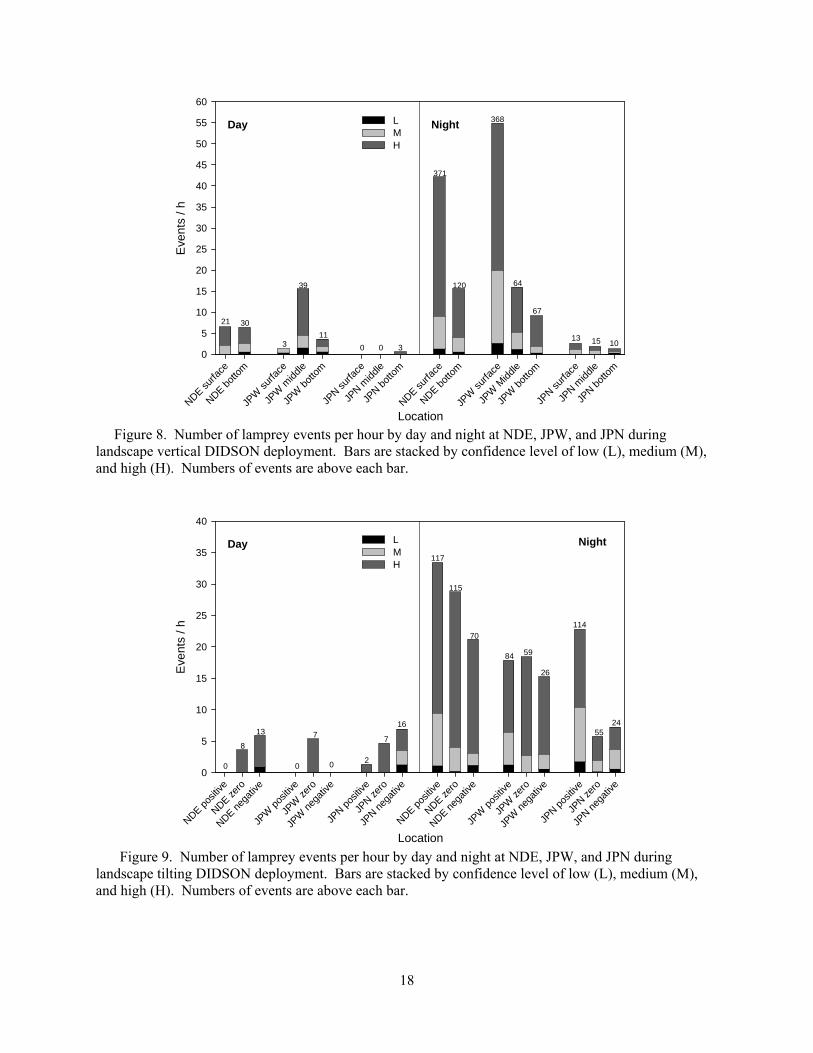
Landscape: Tilting Strata – Similar patterns emerged at NDE and JPN with the highest
lamprey event rates in the upper water column at night. However, differences were subtle in comparison to those in the vertical strata deployments (Figure 9). At NDE, we observed a slightly higher event rate (33 events/h) with the camera oriented with a positive tilt angle compared to a zero tilt (29 events/h). At JPW, night-time event rates were similar with positive and zero tilt (~18 events/h). Rates were lower at NDE and JPW when the camera had a negative tilt angle (NDE = 21 events/h; JPW 15event/h). Lower lamprey event rates were observed during the day at all sites with most observations at a zero or negative tilt angle (Figure 9).
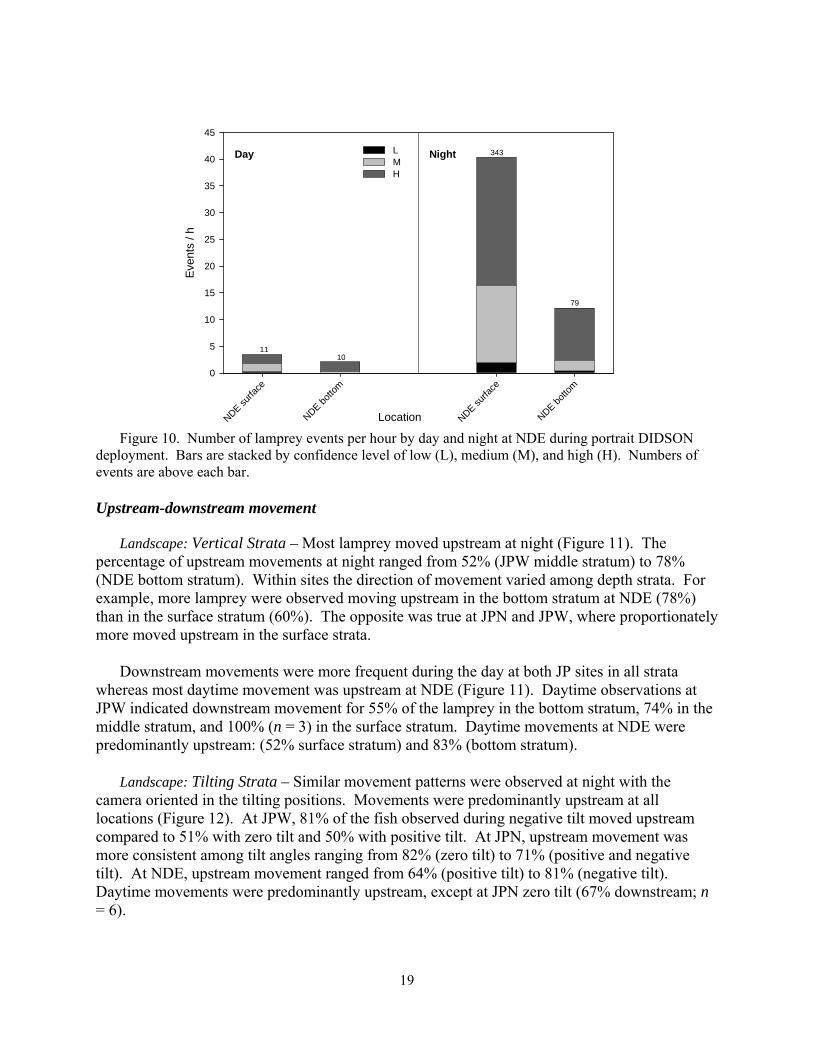
Portrait– At NDE, most lamprey events were observed at night with the camera at the
surface stratum (40 events/h) (Figure 10). Fewer lamprey were observed in the bottom stratum (12 events/h). Lamprey event rates were similar between surface and bottom strata during the day and were lower than those observed at night. We note, however, that there were only two nights per stratum, that the depths differed by only ~2 m, and that the bottom was not viewable given the I-beam that was available.
Site Camera orientation
Files watched
Hours
Total events Events/h
Confidence L M H
NDE Portrait vertical 139 23 443 19.3 21 (5%) 140 (31%) 282 (64%)NDE Landscape tilt 105 18 323 17.9 11 (3%) 50 (16%) 262 (81%)NDE Landscape vertical 146 24 542 22.6 20 (4%) 108 (20%) 414 (76%)JPW Landscape tilt 75 13 170 13.1 7 (4%) 37 (22%) 126 (74%)JPW Landscape vertical 264 44 557 12.7 33 (6%) 157 (28%) 367 (66%)JPN Landscape tilt 151 25 217 8.9 16 (7%) 74 (34%) 127 (59%)JPN Landscape vertical 202 34 41 1.2 3 (7%) 18 (44%) 20 (49%)
Total 1,082 180 2,293 12.7 111 (5%) 584 (25%) 1,598 (70%)
18
Figure 8. Number of lamprey events per hour by day and night at NDE, JPW, and JPN during landscape vertical DIDSON deployment. Bars are stacked by confidence level of low (L), medium (M), and high (H). Numbers of events are above each bar.
Figure 9. Number of lamprey events per hour by day and night at NDE, JPW, and JPN during landscape tilting DIDSON deployment. Bars are stacked by confidence level of low (L), medium (M), and high (H). Numbers of events are above each bar.
LocationNDE su
rface
NDE bot
tom
JPW
surfa
ce
JPW
midd
le
JPW
bot
tom
JPN su
rface
JPN m
iddle
JPN b
otto
m
NDE surfa
ce
NDE bot
tom
JPW
surfa
ce
JPW
Midd
le
JPW
bot
tom
JPN su
rface
JPN m
iddle
JPN b
otto
m
Eve
nts
/ h
0
5
10
15
20
25
30
35
40
45
50
55
60
L M H
Day Night
21 30
3
39
3
11
371
120 64
368
0 0
67
13 15 10
Location
NDE pos
itive
NDE zero
NDE neg
ative
JPW
pos
itive
JPW
zero
JPW
neg
ative
JPN p
ositiv
e
JPN ze
ro
JPN n
egat
ive
NDE pos
itive
NDE zero
NDE neg
ative
JPW
pos
itive
JPW
zero
JPW
neg
ative
JPN p
ositiv
e
JPN ze
ro
JPN n
egat
ive
Eve
nts
/ h
0
5
10
15
20
25
30
35
40
L M H
Day Night
8
13
2
16
117
7
70
84 59
115
0 0
26
114
2455
0
7
19
LocationNDE surfa
ce
NDE bot
tom
NDE surfa
ce
NDE bot
tom
Eve
nts
/ h
0
5
10
15
20
25
30
35
40
45
L M H
Day Night
1011
79
343
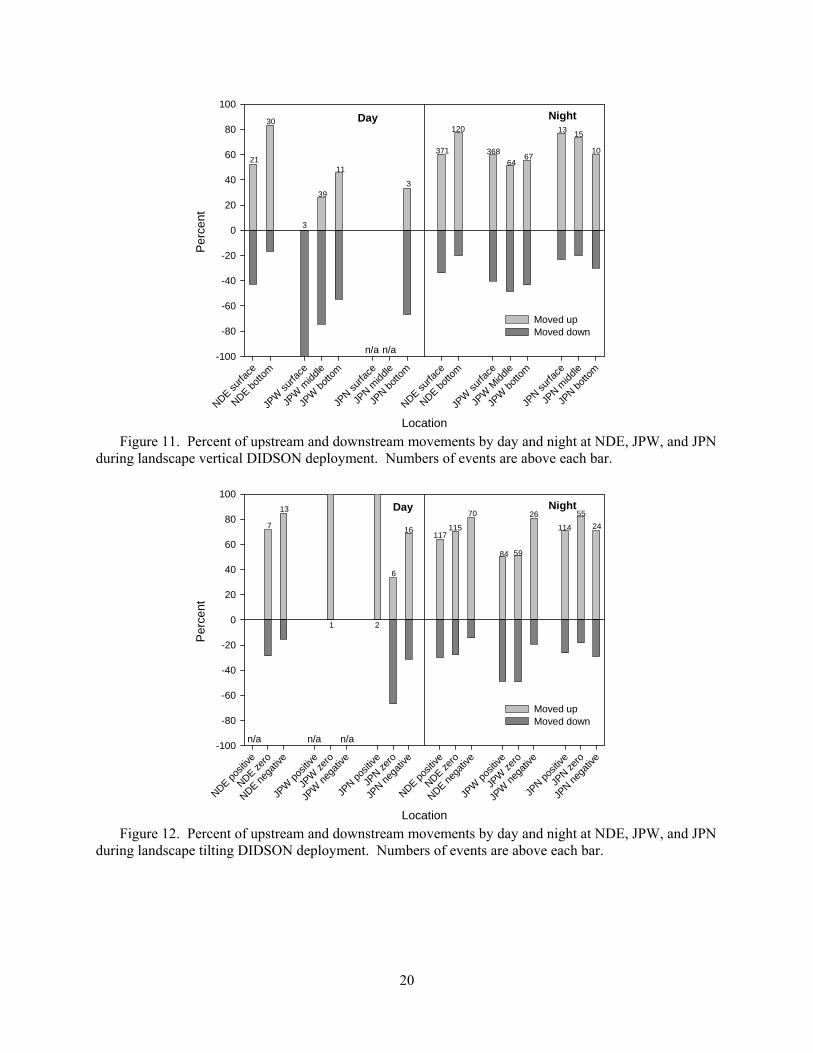
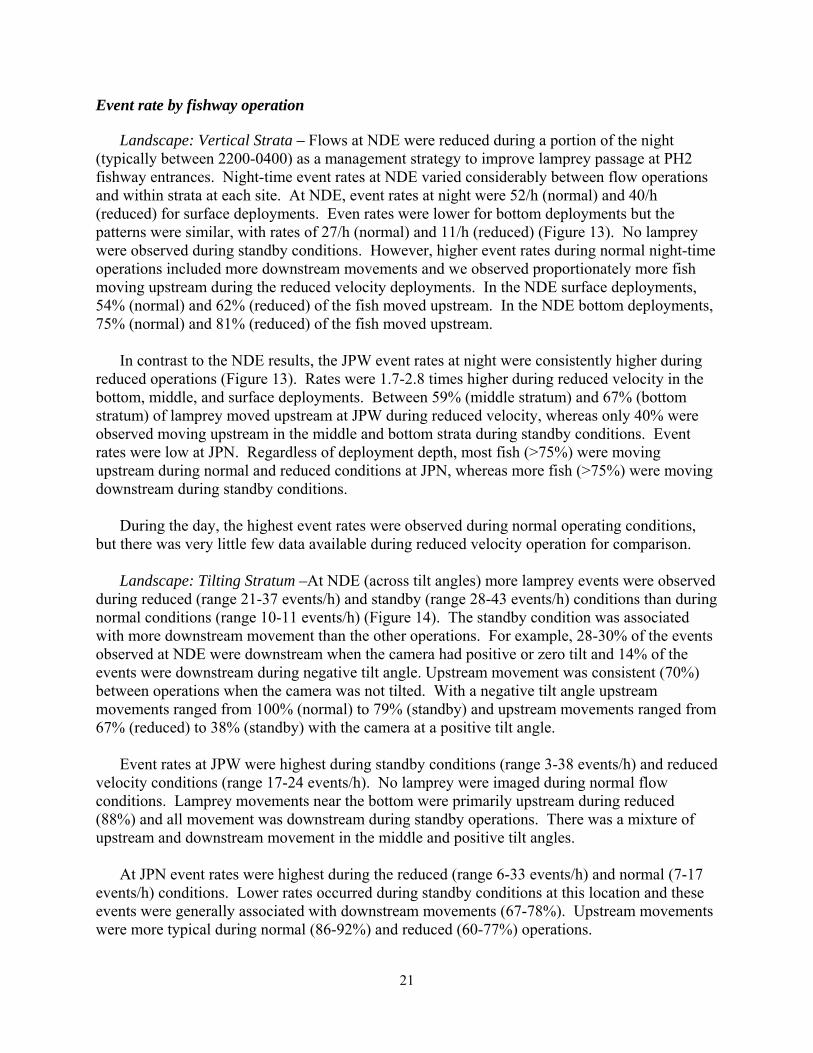
Figure 10. Number of lamprey events per hour by day and night at NDE during portrait DIDSON deployment. Bars are stacked by confidence level of low (L), medium (M), and high (H). Numbers of events are above each bar. Upstream-downstream movement Landscape: Vertical Strata – Most lamprey moved upstream at night (Figure 11). The percentage of upstream movements at night ranged from 52% (JPW middle stratum) to 78% (NDE bottom stratum). Within sites the direction of movement varied among depth strata. For example, more lamprey were observed moving upstream in the bottom stratum at NDE (78%) than in the surface stratum (60%). The opposite was true at JPN and JPW, where proportionately more moved upstream in the surface strata.
Downstream movements were more frequent during the day at both JP sites in all strata
whereas most daytime movement was upstream at NDE (Figure 11). Daytime observations at JPW indicated downstream movement for 55% of the lamprey in the bottom stratum, 74% in the middle stratum, and 100% (n = 3) in the surface stratum. Daytime movements at NDE were predominantly upstream: (52% surface stratum) and 83% (bottom stratum). Landscape: Tilting Strata – Similar movement patterns were observed at night with the camera oriented in the tilting positions. Movements were predominantly upstream at all locations (Figure 12). At JPW, 81% of the fish observed during negative tilt moved upstream compared to 51% with zero tilt and 50% with positive tilt. At JPN, upstream movement was more consistent among tilt angles ranging from 82% (zero tilt) to 71% (positive and negative tilt). At NDE, upstream movement ranged from 64% (positive tilt) to 81% (negative tilt). Daytime movements were predominantly upstream, except at JPN zero tilt (67% downstream; n = 6).
20
Figure 11. Percent of upstream and downstream movements by day and night at NDE, JPW, and JPN
during landscape vertical DIDSON deployment. Numbers of events are above each bar.
Figure 12. Percent of upstream and downstream movements by day and night at NDE, JPW, and JPN
during landscape tilting DIDSON deployment. Numbers of events are above each bar.
Location
NDE surfa
ce
NDE bot
tom
JPW
surfa
ce
JPW
midd
le
JPW
bot
tom
JPN su
rface
JPN m
iddle
JPN b
otto
m
NDE surfa
ce
NDE bot
tom
JPW
surfa
ce
JPW
Midd
le
JPW
bot
tom
JPN su
rface
JPN m
iddle
JPN b
otto
m
Per
cent
-100
-80
-60
-40
-20
0
20
40
60
80
100
Moved up Moved down
Day Night
n/a n/a
21
30
3
39
11
3
371
120
368
6467
1315
10
Location
NDE pos
itive
NDE zero
NDE neg
ative
JPW
pos
itive
JPW
zero
JPW
neg
ative
JPN p
ositiv
e
JPN ze
ro
JPN n
egat
ive
NDE pos
itive
NDE zero
NDE neg
ative
JPW
pos
itive
JPW
zero
JPW
neg
ative
JPN p
ositiv
e
JPN ze
ro
JPN n
egat
ive
Per
cent
-100
-80
-60
-40
-20
0
20
40
60
80
100
Moved up Moved down
Day Night
n/a n/a
7
13
1 2
6
16117
115
70
84 59
26
114
55
24
n/a
21
Event rate by fishway operation
Landscape: Vertical Strata – Flows at NDE were reduced during a portion of the night (typically between 2200-0400) as a management strategy to improve lamprey passage at PH2 fishway entrances. Night-time event rates at NDE varied considerably between flow operations and within strata at each site. At NDE, event rates at night were 52/h (normal) and 40/h (reduced) for surface deployments. Even rates were lower for bottom deployments but the patterns were similar, with rates of 27/h (normal) and 11/h (reduced) (Figure 13). No lamprey were observed during standby conditions. However, higher event rates during normal night-time operations included more downstream movements and we observed proportionately more fish moving upstream during the reduced velocity deployments. In the NDE surface deployments, 54% (normal) and 62% (reduced) of the fish moved upstream. In the NDE bottom deployments, 75% (normal) and 81% (reduced) of the fish moved upstream.
In contrast to the NDE results, the JPW event rates at night were consistently higher during
reduced operations (Figure 13). Rates were 1.7-2.8 times higher during reduced velocity in the bottom, middle, and surface deployments. Between 59% (middle stratum) and 67% (bottom stratum) of lamprey moved upstream at JPW during reduced velocity, whereas only 40% were observed moving upstream in the middle and bottom strata during standby conditions. Event rates were low at JPN. Regardless of deployment depth, most fish (>75%) were moving upstream during normal and reduced conditions at JPN, whereas more fish (>75%) were moving downstream during standby conditions.
During the day, the highest event rates were observed during normal operating conditions,
but there was very little few data available during reduced velocity operation for comparison.
Landscape: Tilting Stratum –At NDE (across tilt angles) more lamprey events were observed during reduced (range 21-37 events/h) and standby (range 28-43 events/h) conditions than during normal conditions (range 10-11 events/h) (Figure 14). The standby condition was associated with more downstream movement than the other operations. For example, 28-30% of the events observed at NDE were downstream when the camera had positive or zero tilt and 14% of the events were downstream during negative tilt angle. Upstream movement was consistent (70%) between operations when the camera was not tilted. With a negative tilt angle upstream movements ranged from 100% (normal) to 79% (standby) and upstream movements ranged from 67% (reduced) to 38% (standby) with the camera at a positive tilt angle.
Event rates at JPW were highest during standby conditions (range 3-38 events/h) and reduced
velocity conditions (range 17-24 events/h). No lamprey were imaged during normal flow conditions. Lamprey movements near the bottom were primarily upstream during reduced (88%) and all movement was downstream during standby operations. There was a mixture of upstream and downstream movement in the middle and positive tilt angles.
At JPN event rates were highest during the reduced (range 6-33 events/h) and normal (7-17
events/h) conditions. Lower rates occurred during standby conditions at this location and these events were generally associated with downstream movements (67-78%). Upstream movements were more typical during normal (86-92%) and reduced (60-77%) operations.

22
Location
NDE surfa
ce
NDE bot
tom
JPW
surfa
ce
JPW
midd
le
JPW
bot
tom
JPN su
rface
JPN m
iddle
JPN b
otto
m
Eve
nts
/ h
0
20
40
60
80
Normal Reduced Standby
Night
Figure 13. Number of events per hour at night at NDE, JPW, and JPN during landscape vertical DIDSON deployment. Bars are stacked by flow condition. Numbers of events are above each bar.
Location
NDE pos
itive
NDE zero
NDE neg
ative
JPW
pos
itive
JPW
zero
JPW
neg
ative
JPN p
ositiv
e
JPN ze
ro
JPN n
egat
ive
Eve
nts
/ h
0
10
20
30
40
50
Normal Reduced Standby
Night
Figure 14. Number of events per hour at night at NDE, JPW, and JPN during landscape tilting DIDSON deployment. Bars are stacked by flow condition. Numbers of events are above each bar.
23
Lateral distribution
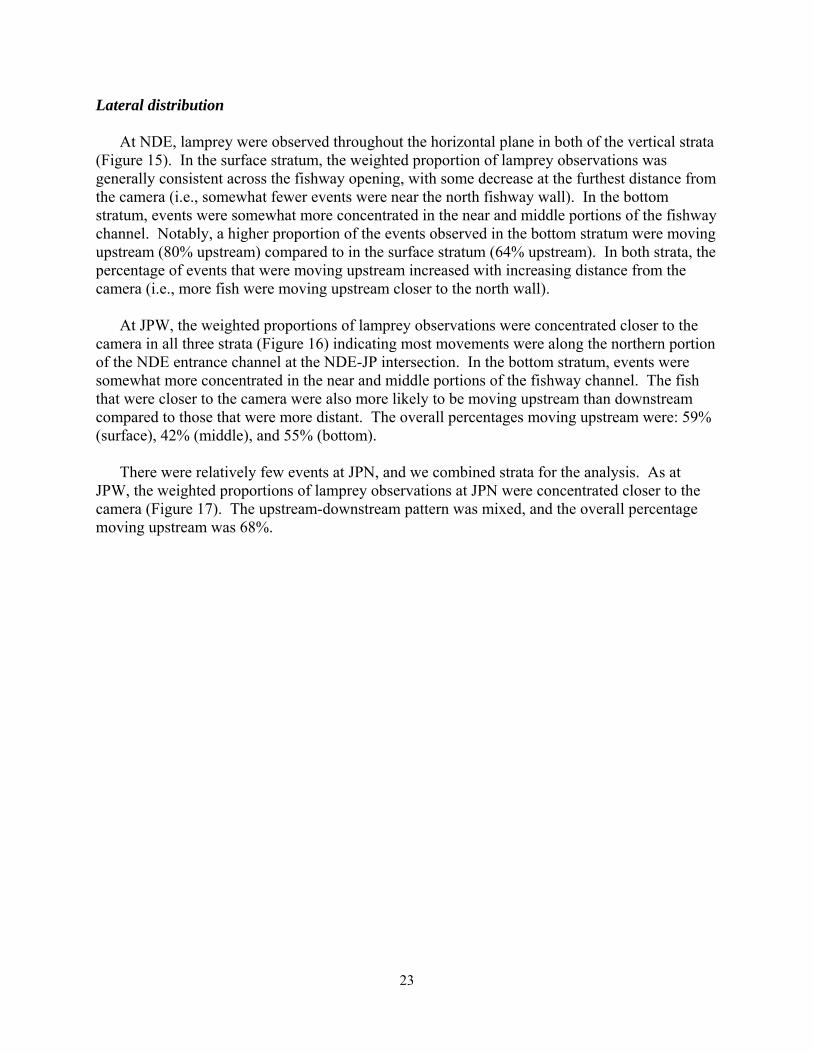
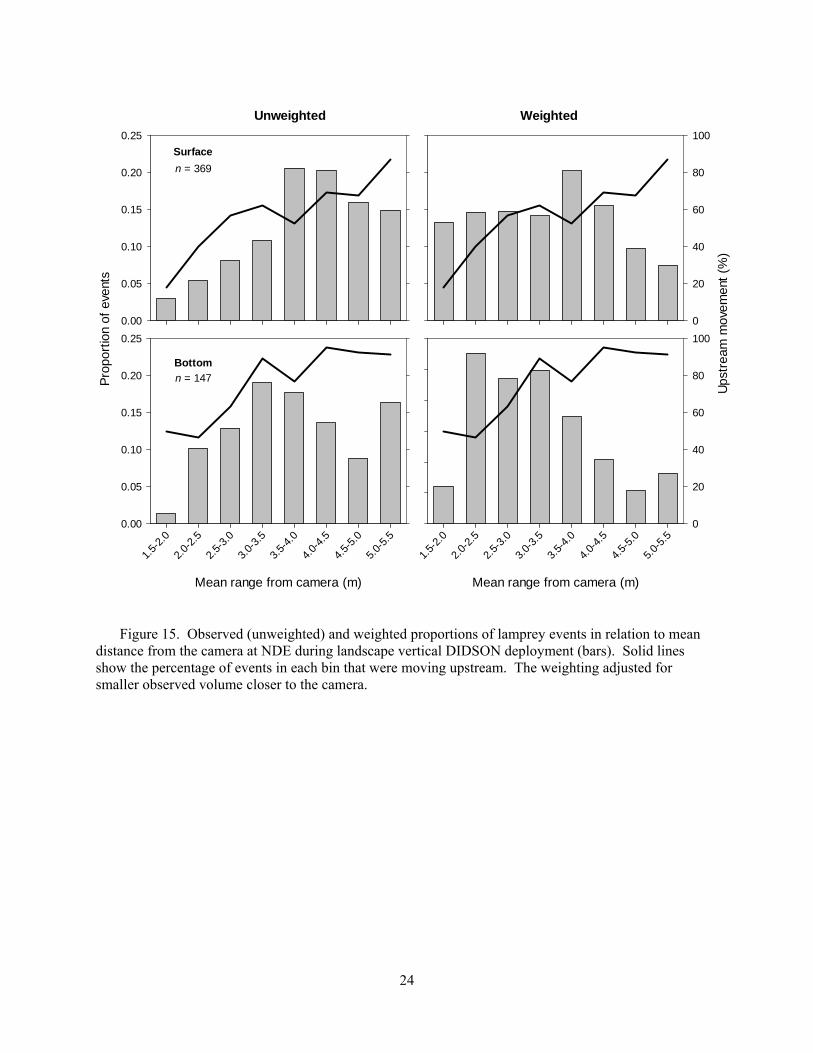
At NDE, lamprey were observed throughout the horizontal plane in both of the vertical strata (Figure 15). In the surface stratum, the weighted proportion of lamprey observations was generally consistent across the fishway opening, with some decrease at the furthest distance from the camera (i.e., somewhat fewer events were near the north fishway wall). In the bottom stratum, events were somewhat more concentrated in the near and middle portions of the fishway channel. Notably, a higher proportion of the events observed in the bottom stratum were moving upstream (80% upstream) compared to in the surface stratum (64% upstream). In both strata, the percentage of events that were moving upstream increased with increasing distance from the camera (i.e., more fish were moving upstream closer to the north wall).
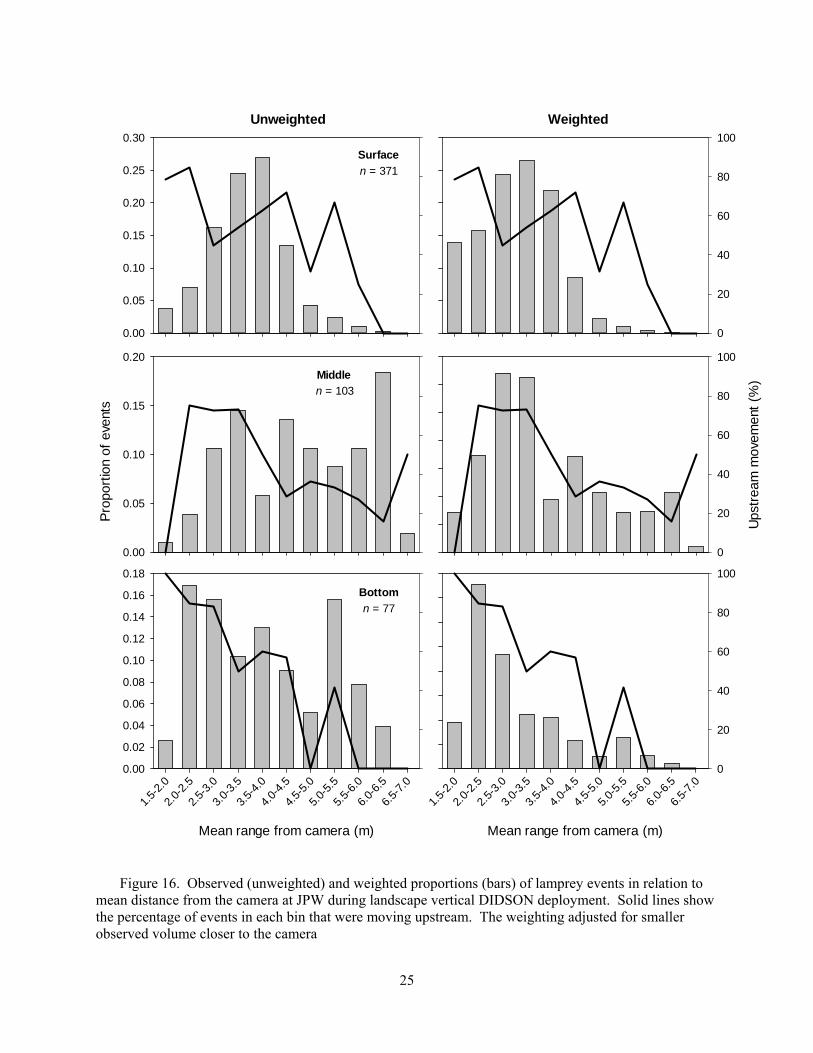
At JPW, the weighted proportions of lamprey observations were concentrated closer to the
camera in all three strata (Figure 16) indicating most movements were along the northern portion of the NDE entrance channel at the NDE-JP intersection. In the bottom stratum, events were somewhat more concentrated in the near and middle portions of the fishway channel. The fish that were closer to the camera were also more likely to be moving upstream than downstream compared to those that were more distant. The overall percentages moving upstream were: 59% (surface), 42% (middle), and 55% (bottom).
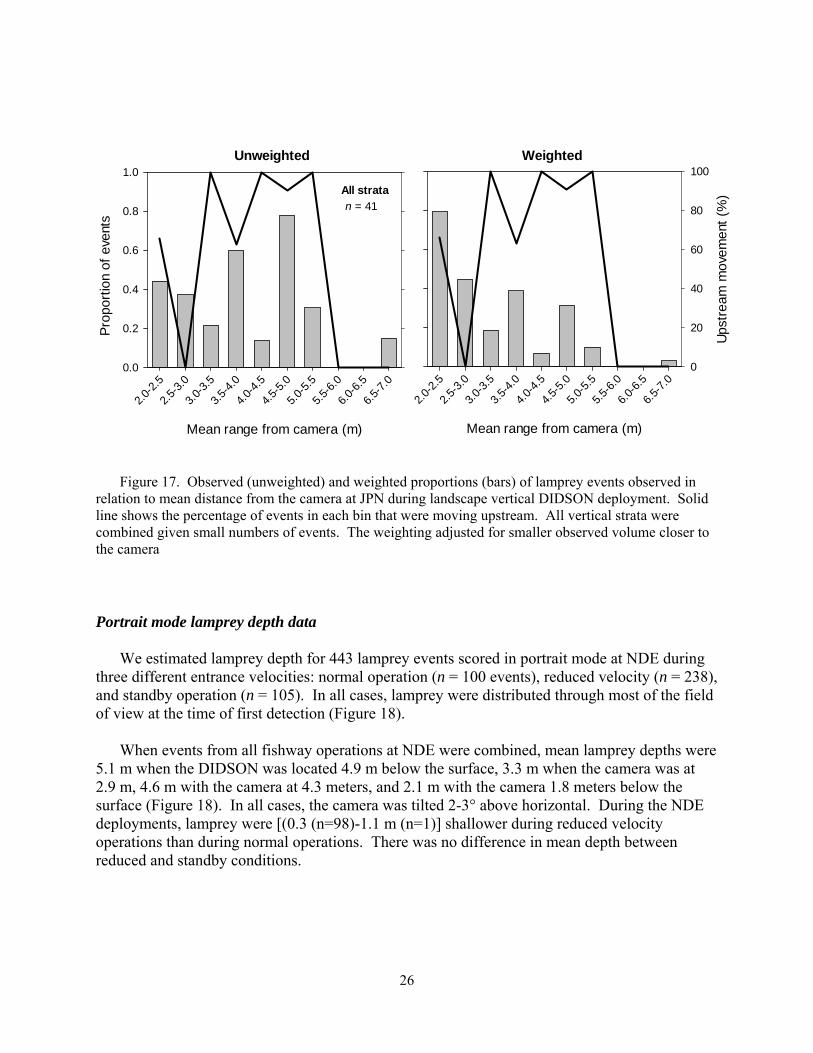
There were relatively few events at JPN, and we combined strata for the analysis. As at
JPW, the weighted proportions of lamprey observations at JPN were concentrated closer to the camera (Figure 17). The upstream-downstream pattern was mixed, and the overall percentage moving upstream was 68%.
24
Mean range from camera (m)
1.5-
2.0
2.0-
2.5
2.5-
3.0
3.0-
3.5
3.5-
4.0
4.0-
4.5
4.5-
5.0
5.0-
5.5
Pro
port
ion
of e
vent
s
0.00
0.05
0.10
0.15
0.20
0.25
0.00
0.05
0.10
0.15
0.20
0.25
Bottom
n = 147
Surface
n = 369
Mean range from camera (m)
1.5-
2.0
2.0-
2.5
2.5-
3.0
3.0-
3.5
3.5-
4.0
4.0-
4.5
4.5-
5.0
5.0-
5.5
Ups
trea
m m
ovem
ent
(%)
0
20
40
60
80
100
0
20
40
60
80
100
Unweighted Weighted
Figure 15. Observed (unweighted) and weighted proportions of lamprey events in relation to mean distance from the camera at NDE during landscape vertical DIDSON deployment (bars). Solid lines show the percentage of events in each bin that were moving upstream. The weighting adjusted for smaller observed volume closer to the camera.
25
Mean range from camera (m)
1.5-
2.0
2.0-
2.5
2.5-
3.0
3.0-
3.5
3.5-
4.0
4.0-
4.5
4.5-
5.0
5.0-
5.5
5.5-
6.0
6.0-
6.5
6.5-
7.0
Pro
port
ion
of e
vent
s
0.00
0.02
0.04
0.06
0.08
0.10
0.12
0.14
0.16
0.18
Ups
trea
m m
ovem
ent
(%)
0.00
0.05
0.10
0.15
0.20
0.00
0.05
0.10
0.15
0.20
0.25
0.30
Surface
n = 371
Middle
n = 103
Bottom
n = 77
Unweighted Weighted
Mean range from camera (m)
1.5-
2.0
2.0-
2.5
2.5-
3.0
3.0-
3.5
3.5-
4.0
4.0-
4.5
4.5-
5.0
5.0-
5.5
5.5-
6.0
6.0-
6.5
6.5-
7.0
Ups
trea
m m
ovem
ent
(%)
0
20
40
60
80
100
Ups
trea
m m
ovem
ent
(%)
0
20
40
60
80
100
0
20
40
60
80
100
Figure 16. Observed (unweighted) and weighted proportions (bars) of lamprey events in relation to
mean distance from the camera at JPW during landscape vertical DIDSON deployment. Solid lines show the percentage of events in each bin that were moving upstream. The weighting adjusted for smaller observed volume closer to the camera
26
Mean range from camera (m)
2.0-
2.5
2.5-
3.0
3.0-
3.5
3.5-
4.0
4.0-
4.5
4.5-
5.0
5.0-
5.5
5.5-
6.0
6.0-
6.5
6.5-
7.0
Pro
port
ion
of e
vent
s
0.0
0.2
0.4
0.6
0.8
1.0
All strata
n = 41
Unweighted Weighted
Mean range from camera (m)
2.0-
2.5
2.5-
3.0
3.0-
3.5
3.5-
4.0
4.0-
4.5
4.5-
5.0
5.0-
5.5
5.5-
6.0
6.0-
6.5
6.5-
7.0
Ups
trea
m m
ovem
ent
(%)
0
20
40
60
80
100
Figure 17. Observed (unweighted) and weighted proportions (bars) of lamprey events observed in
relation to mean distance from the camera at JPN during landscape vertical DIDSON deployment. Solid line shows the percentage of events in each bin that were moving upstream. All vertical strata were combined given small numbers of events. The weighting adjusted for smaller observed volume closer to the camera Portrait mode lamprey depth data
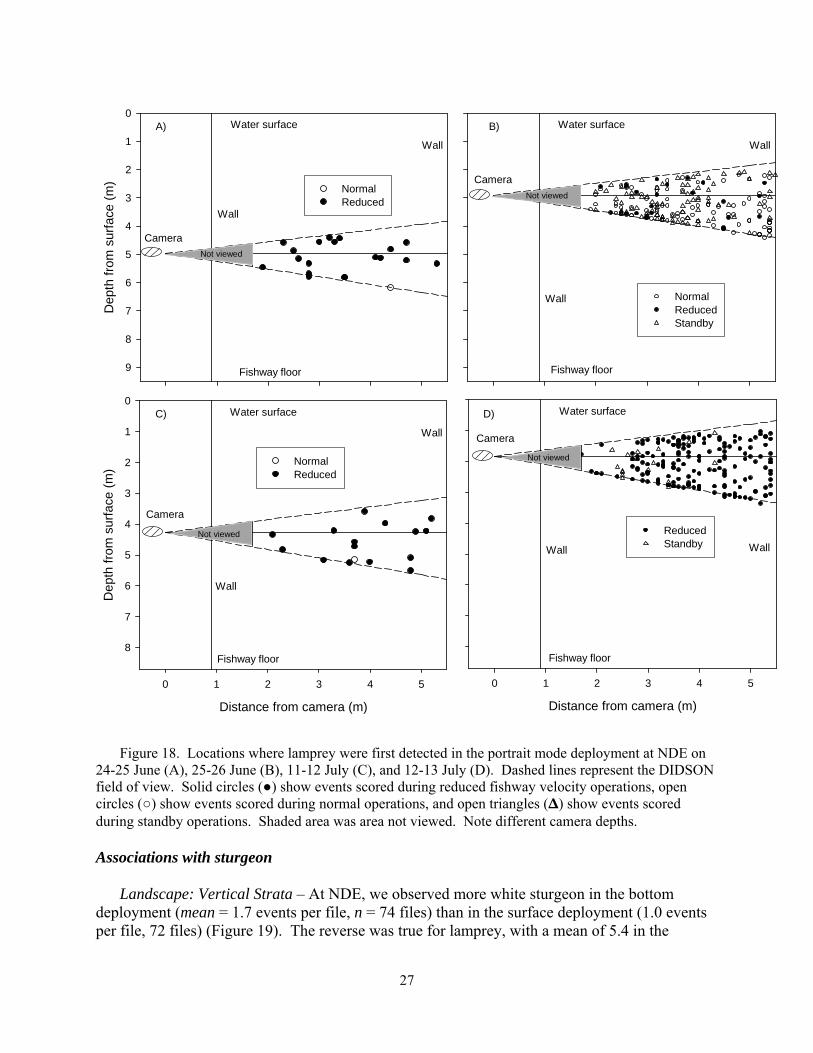
We estimated lamprey depth for 443 lamprey events scored in portrait mode at NDE during three different entrance velocities: normal operation (n = 100 events), reduced velocity (n = 238), and standby operation (n = 105). In all cases, lamprey were distributed through most of the field of view at the time of first detection (Figure 18).
When events from all fishway operations at NDE were combined, mean lamprey depths were
5.1 m when the DIDSON was located 4.9 m below the surface, 3.3 m when the camera was at 2.9 m, 4.6 m with the camera at 4.3 meters, and 2.1 m with the camera 1.8 meters below the surface (Figure 18). In all cases, the camera was tilted 2-3° above horizontal. During the NDE deployments, lamprey were [(0.3 (n=98)-1.1 m (n=1)] shallower during reduced velocity operations than during normal operations. There was no difference in mean depth between reduced and standby conditions.
27
Figure 18. Locations where lamprey were first detected in the portrait mode deployment at NDE on
24-25 June (A), 25-26 June (B), 11-12 July (C), and 12-13 July (D). Dashed lines represent the DIDSON field of view. Solid circles (●) show events scored during reduced fishway velocity operations, open circles (○) show events scored during normal operations, and open triangles (Δ) show events scored during standby operations. Shaded area was area not viewed. Note different camera depths. Associations with sturgeon
Landscape: Vertical Strata – At NDE, we observed more white sturgeon in the bottom deployment (mean = 1.7 events per file, n = 74 files) than in the surface deployment (1.0 events per file, 72 files) (Figure 19). The reverse was true for lamprey, with a mean of 5.4 in the
Distance from camera (m)
0 1 2 3 4 5
Dep
th f
rom
sur
face
(m
)
0
1
2
3
4
5
6
7
8
NormalReduced
Dep
th f
rom
sur
face
(m
)0
1
2
3
4
5
6
7
8
9
NormalReduced
Water surface
Wall
Wall
Fishway floor
Camera
NormalReducedStandby
Water surface
Wall
Wall
Fishway floor
Camera
Water surface
Wall
Wall
Fishway floor
Camera
Distance from camera (m)
0 1 2 3 4 5
ReducedStandby
Water surface
Wall Wall
Fishway floor
Camera
A) B)
C) D)
Not viewed
Not viewed
Not viewed
Not viewed

28
surface deployment and 2.0 events per file in the bottom deployment. The number of lamprey/file was negatively associated with the sturgeon index in both strata.
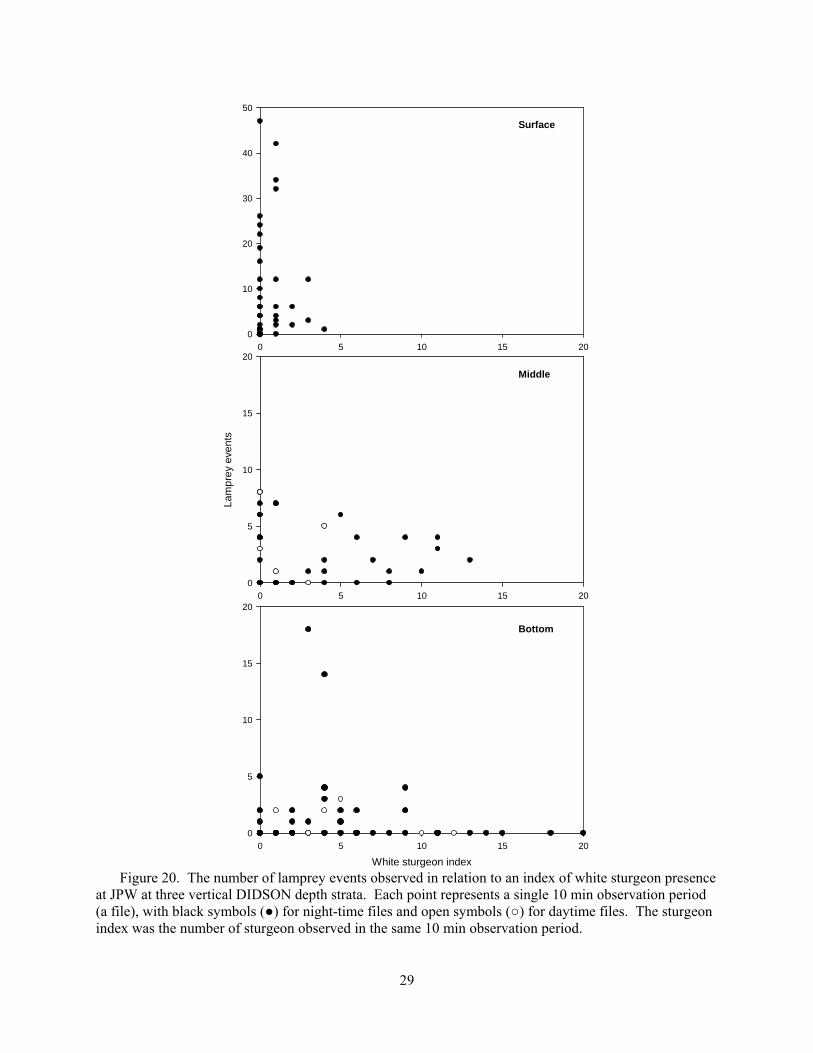
In the junction pool west (JPW) deployment, we observed similar results with a majority of
lamprey near the surface (mean = 6.9 events, 54 files) and middle (mean= 2.6, 39 files) water column and few near the bottom (mean= 1.6, 62 files) where the majority of sturgeon (index mean = 4.8) were observed (Figure 20). Mean sturgeon index values were 0.4 and 3.2 in the surface and middle strata, respectively. At JPN only a few lamprey were observed in each depth strata while many sturgeon were present (Figure 21) and sturgeon were approximately evenly distributed in the water column.
Figure 19. The number of lamprey events observed in relation to an index of white sturgeon presence
at NDE at two vertical DIDSON depth strata. Each point represents a single 10 min observation period (a file), with black symbols (●) for night-time files and open symbols (○) for daytime files. The sturgeon index was the number of sturgeon observed in the same 10 min observation period.
0 2 4 6 8 10 12 14 16
Lam
pre
y e
ven
ts
0
10
20
30
40
White sturgeon index
0 2 4 6 8 10 12 14 16
0
10
20
30
40
Surface
Bottom
29
Figure 20. The number of lamprey events observed in relation to an index of white sturgeon presence
at JPW at three vertical DIDSON depth strata. Each point represents a single 10 min observation period (a file), with black symbols (●) for night-time files and open symbols (○) for daytime files. The sturgeon index was the number of sturgeon observed in the same 10 min observation period.
0 5 10 15 20
0
10
20
30
40
50
0 5 10 15 20
La
mp
rey
eve
nts
0
5
10
15
20
White sturgeon index
0 5 10 15 20
0
5
10
15
20
Surface
Middle
Bottom
30
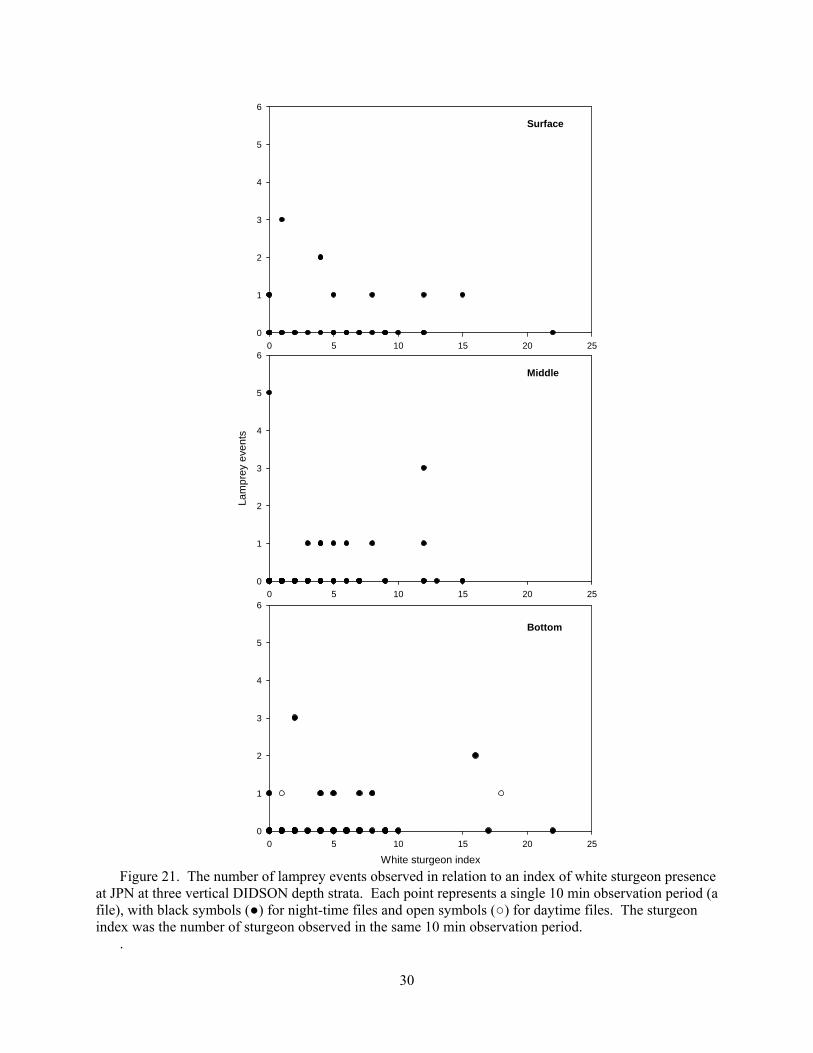
Figure 21. The number of lamprey events observed in relation to an index of white sturgeon presence
at JPN at three vertical DIDSON depth strata. Each point represents a single 10 min observation period (a file), with black symbols (●) for night-time files and open symbols (○) for daytime files. The sturgeon index was the number of sturgeon observed in the same 10 min observation period.
.
0 5 10 15 20 25
0
1
2
3
4
5
6
0 5 10 15 20 25
Lam
pre
y e
ven
ts
0
1
2
3
4
5
6
White sturgeon index
0 5 10 15 20 25
0
1
2
3
4
5
6
Surface
Middle
Bottom
31
Landscape: Tilting Strata – At JPN, lamprey were observed in low numbers in all three tilt angles. Means were 3.1 for lamprey and 2.1 for sturgeon (across all depth strata; 105 files). At JPW, sturgeon and lamprey were observed in similar numbers in all three tilt angles (lamprey mean = 2.3 events per file; sturgeon index mean = 2.5; 105 files) with slightly higher sturgeon numbers in the negative tilt angle (mean = 3.7). In the JPN deployment, the greatest number of lamprey were observed in the positive tilt angle (mean = 3.0, 39 files), versus means of 0.8 and 1.2 in the zero and negative tilt angles, respectively. Sturgeon where observed in all three tilt angles (mean range = 2.1-3.7, 34-78 files). Attachment events
Of the 2,293 lamprey events observed (NDE and JP combined) we observed 23 attachments (1% of
total) with all of the attachments occurring at NDE to the fishway wall. Seventy percent of the attachments occurred when no sturgeon were observed in the file. Of the 23 attachments, 21 (91%) were made in the vertical deployment with the camera in the middle strata and most of the attachments (78%) occurred during normal operations (22% during reduced operations). Most (74%) of the lamprey that attached did so at night, consistent with more events observed at night.
John Day Dam Sampling effort
From 26 July through 30 August 2012, a total of 776 h of data were collected at John Day Dam (Table 2). Imagery was collected throughout the middle of the lamprey run (Figure 22). Of the 776 h of data collected, 297 h (38%) were collected at night and 480 h (62%) were during the day. Most (91%) of the data were collected with the camera in landscape orientation. A total of 177 h of data was watched (23% of total collected) consisting of 81 h of landscape positive tilt files (46%), 82 h of landscape negative tilt files (46%), and 14 h of portrait files (8%). The majority of the files watched (66%) were collected at night. Lamprey events and confidence level
The rate at which lamprey were observed varied by location and camera orientation (Tables 5). The highest event rates were at the bollards during the long view (6.8 events/h) and the JD1 cross section deployment (6.3 events/h). In the four landscape cross sections, rates decreased from downstream to upstream, from 6.3 (JD1), to 4.4 (JD2), to 4.3 (JD3) to 2.0 (JD4), suggesting lamprey were turning around and moving downstream in the fishway. Rates at other locations varied considerably between camera orientations.
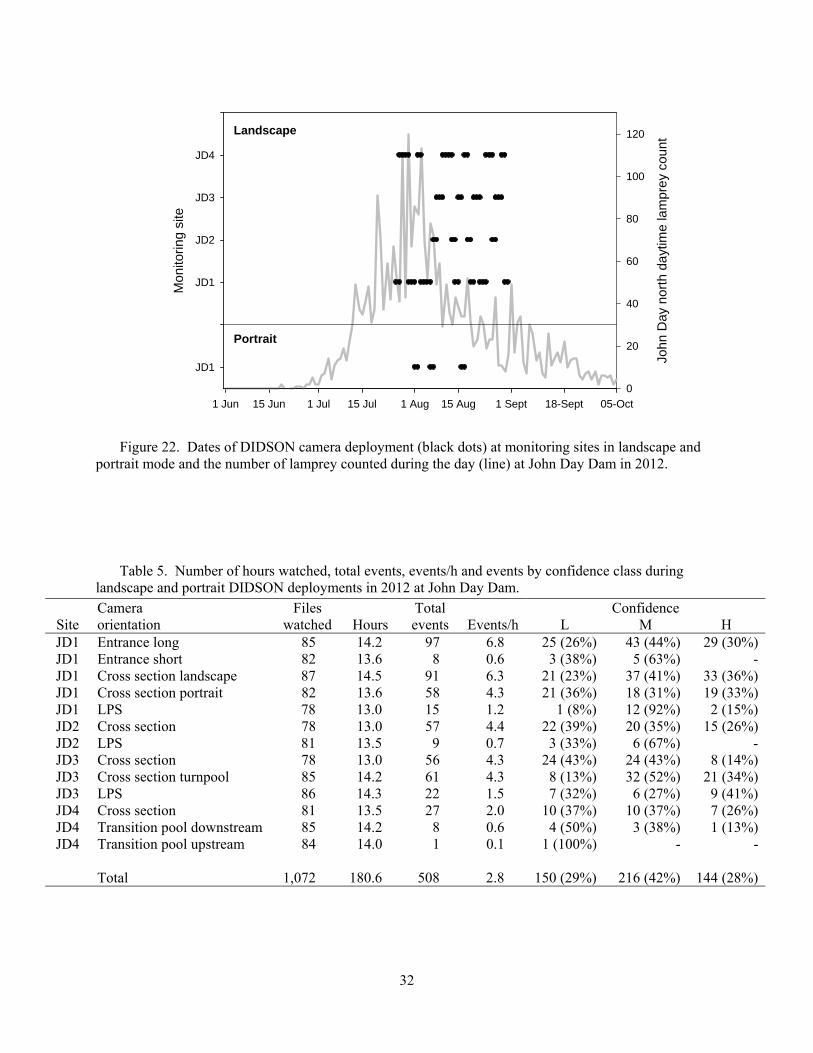
32
Figure 22. Dates of DIDSON camera deployment (black dots) at monitoring sites in landscape and portrait mode and the number of lamprey counted during the day (line) at John Day Dam in 2012.
Table 5. Number of hours watched, total events, events/h and events by confidence class during
landscape and portrait DIDSON deployments in 2012 at John Day Dam.
1 Jun 15 Jun 1 Jul 15 Jul 1 Aug 15 Aug 1 Sept 18-Sept 05-Oct
John
Day
no
rth
dayt
ime
lam
pre
y co
unt
0
20
40
60
80
100
120
Mon
itorin
g si
te
JD1
JD1
JD2
JD3
JD4
Landscape
Portrait
Site
Camera orientation
Files Hours
Total events
Events/h
Confidence watched L M H
JD1 Entrance long 85 14.2 97 6.8 25 (26%) 43 (44%) 29 (30%)JD1 Entrance short 82 13.6 8 0.6 3 (38%) 5 (63%) -JD1 Cross section landscape 87 14.5 91 6.3 21 (23%) 37 (41%) 33 (36%)JD1 Cross section portrait 82 13.6 58 4.3 21 (36%) 18 (31%) 19 (33%)JD1 LPS 78 13.0 15 1.2 1 (8%) 12 (92%) 2 (15%)JD2 Cross section 78 13.0 57 4.4 22 (39%) 20 (35%) 15 (26%)JD2 LPS 81 13.5 9 0.7 3 (33%) 6 (67%) -JD3 Cross section 78 13.0 56 4.3 24 (43%) 24 (43%) 8 (14%)JD3 Cross section turnpool 85 14.2 61 4.3 8 (13%) 32 (52%) 21 (34%)JD3 LPS 86 14.3 22 1.5 7 (32%) 6 (27%) 9 (41%)JD4 Cross section 81 13.5 27 2.0 10 (37%) 10 (37%) 7 (26%)JD4 Transition pool downstream 85 14.2 8 0.6 4 (50%) 3 (38%) 1 (13%)JD4 Transition pool upstream 84 14.0 1 0.1 1 (100%) - -
Total 1,072 180.6 508 2.8 150 (29%) 216 (42%) 144 (28%)
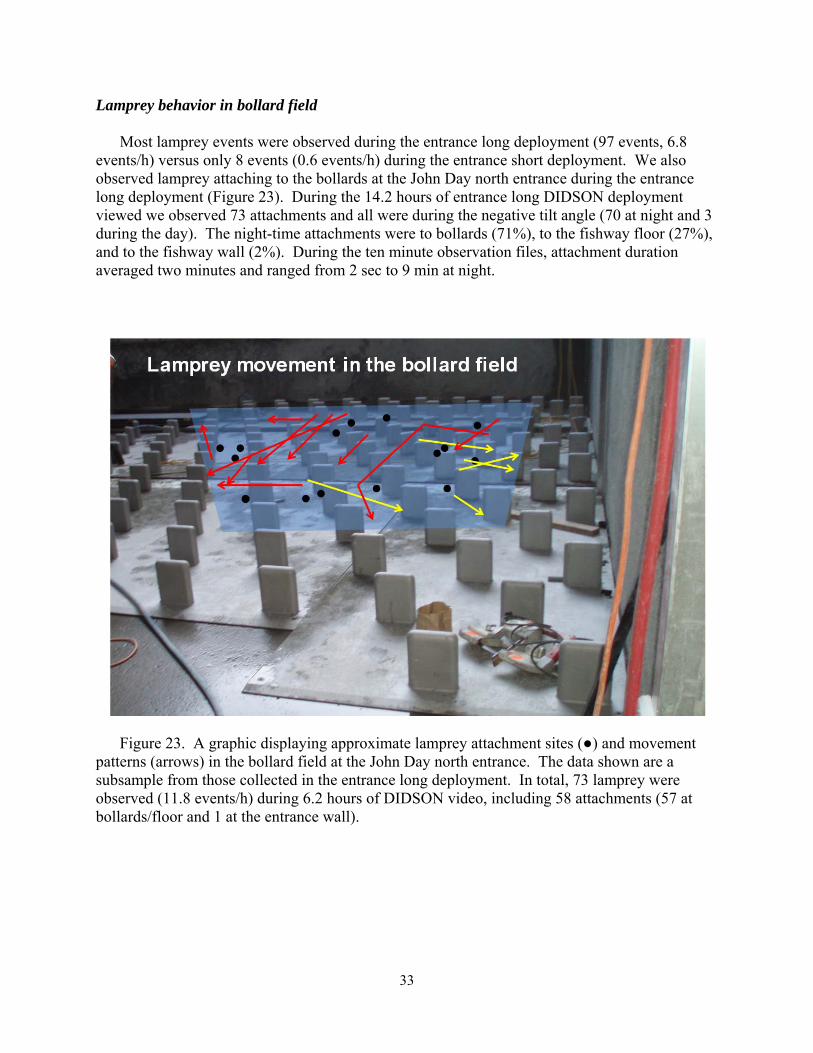
33
Lamprey behavior in bollard field Most lamprey events were observed during the entrance long deployment (97 events, 6.8 events/h) versus only 8 events (0.6 events/h) during the entrance short deployment. We also observed lamprey attaching to the bollards at the John Day north entrance during the entrance long deployment (Figure 23). During the 14.2 hours of entrance long DIDSON deployment viewed we observed 73 attachments and all were during the negative tilt angle (70 at night and 3 during the day). The night-time attachments were to bollards (71%), to the fishway floor (27%), and to the fishway wall (2%). During the ten minute observation files, attachment duration averaged two minutes and ranged from 2 sec to 9 min at night.
Figure 23. A graphic displaying approximate lamprey attachment sites (●) and movement patterns (arrows) in the bollard field at the John Day north entrance. The data shown are a subsample from those collected in the entrance long deployment. In total, 73 lamprey were observed (11.8 events/h) during 6.2 hours of DIDSON video, including 58 attachments (57 at bollards/floor and 1 at the entrance wall).
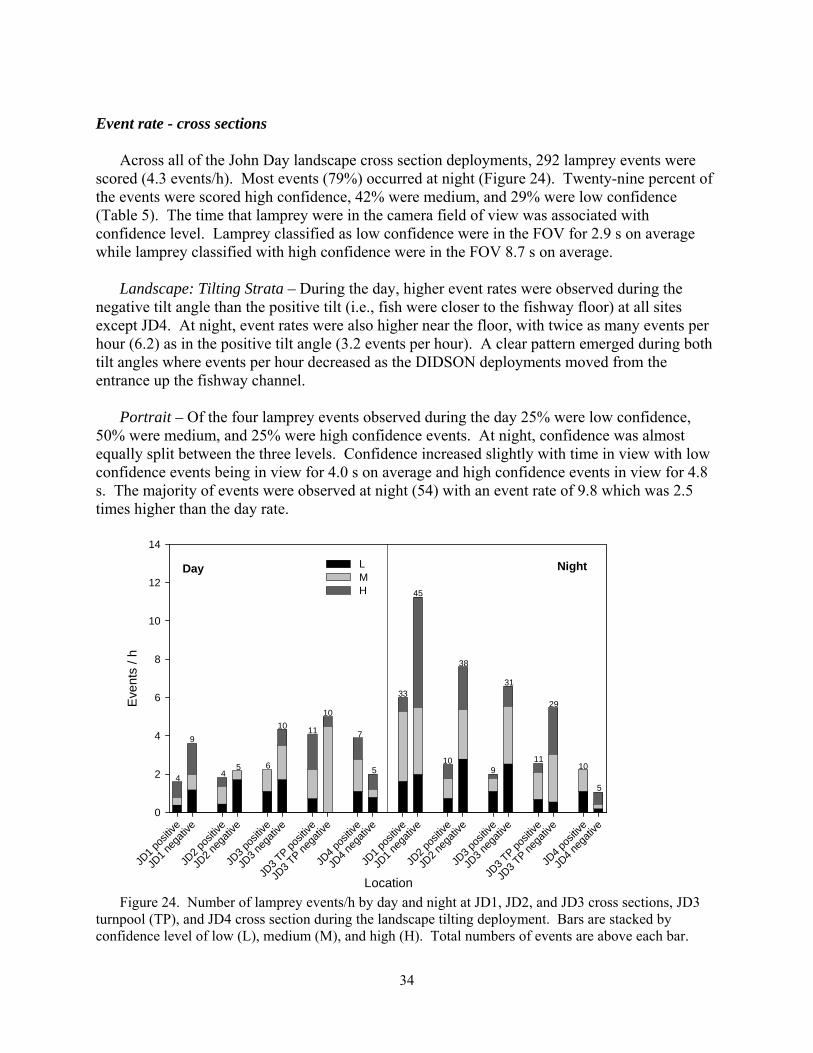
34
Event rate - cross sections
Across all of the John Day landscape cross section deployments, 292 lamprey events were scored (4.3 events/h). Most events (79%) occurred at night (Figure 24). Twenty-nine percent of the events were scored high confidence, 42% were medium, and 29% were low confidence (Table 5). The time that lamprey were in the camera field of view was associated with confidence level. Lamprey classified as low confidence were in the FOV for 2.9 s on average while lamprey classified with high confidence were in the FOV 8.7 s on average.
Landscape: Tilting Strata – During the day, higher event rates were observed during the
negative tilt angle than the positive tilt (i.e., fish were closer to the fishway floor) at all sites except JD4. At night, event rates were also higher near the floor, with twice as many events per hour (6.2) as in the positive tilt angle (3.2 events per hour). A clear pattern emerged during both tilt angles where events per hour decreased as the DIDSON deployments moved from the entrance up the fishway channel.
Portrait – Of the four lamprey events observed during the day 25% were low confidence,
50% were medium, and 25% were high confidence events. At night, confidence was almost equally split between the three levels. Confidence increased slightly with time in view with low confidence events being in view for 4.0 s on average and high confidence events in view for 4.8 s. The majority of events were observed at night (54) with an event rate of 9.8 which was 2.5 times higher than the day rate.
Figure 24. Number of lamprey events/h by day and night at JD1, JD2, and JD3 cross sections, JD3 turnpool (TP), and JD4 cross section during the landscape tilting deployment. Bars are stacked by confidence level of low (L), medium (M), and high (H). Total numbers of events are above each bar.
Location
JD1
posit
ive
JD1
nega
tive
JD2
posit
ive
JD2
nega
tive
JD3
posit
ive
JD3
nega
tive
JD3
TP pos
itive
JD3
TP neg
ative
JD4
posit
ive
JD4
nega
tive
JD1
posit
ive
JD1
nega
tive
JD2
posit
ive
JD2
nega
tive
JD3
posit
ive
JD3
nega
tive
JD3
TP pos
itive
JD3
TP neg
ative
JD4
posit
ive
JD4
nega
tive
Eve
nts
/ h
0
2
4
6
8
10
12
14
L M H
Day Night
9
4
11
10
45
38
9
31
10
45
11
5
10
29
10
6
7
5
33
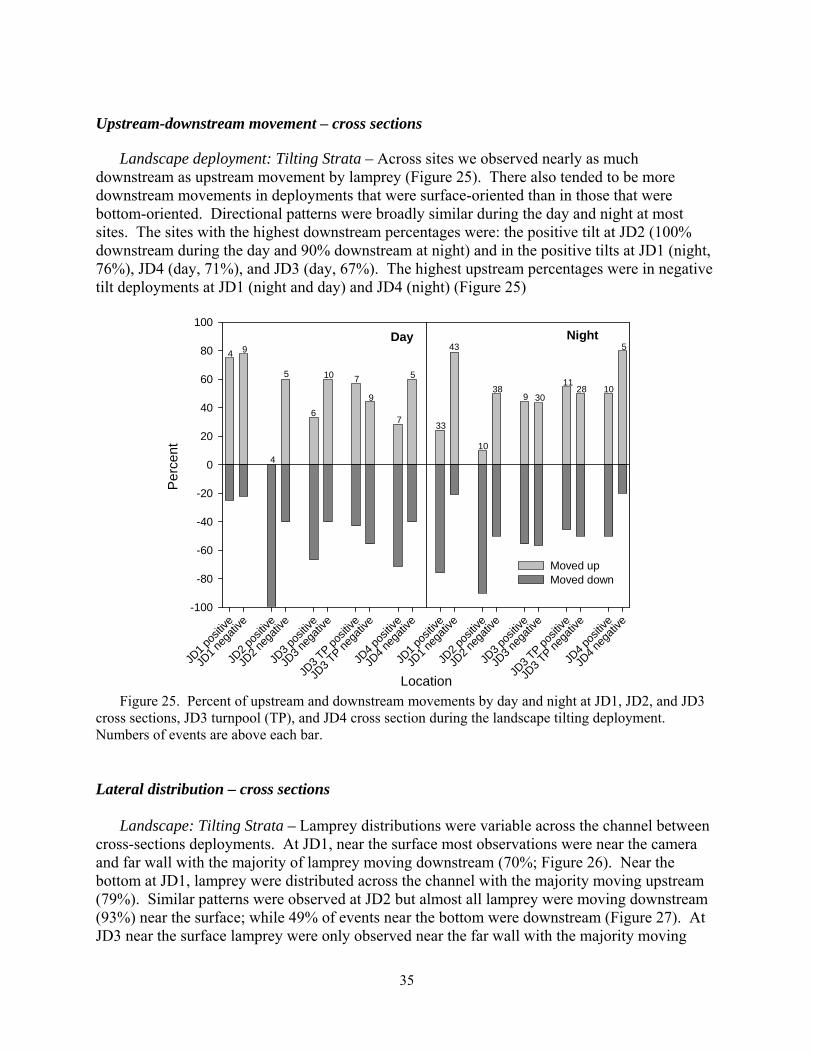
35
Upstream-downstream movement – cross sections Landscape deployment: Tilting Strata – Across sites we observed nearly as much downstream as upstream movement by lamprey (Figure 25). There also tended to be more downstream movements in deployments that were surface-oriented than in those that were bottom-oriented. Directional patterns were broadly similar during the day and night at most sites. The sites with the highest downstream percentages were: the positive tilt at JD2 (100% downstream during the day and 90% downstream at night) and in the positive tilts at JD1 (night, 76%), JD4 (day, 71%), and JD3 (day, 67%). The highest upstream percentages were in negative tilt deployments at JD1 (night and day) and JD4 (night) (Figure 25)
Figure 25. Percent of upstream and downstream movements by day and night at JD1, JD2, and JD3
cross sections, JD3 turnpool (TP), and JD4 cross section during the landscape tilting deployment. Numbers of events are above each bar. Lateral distribution – cross sections
Landscape: Tilting Strata – Lamprey distributions were variable across the channel between
cross-sections deployments. At JD1, near the surface most observations were near the camera and far wall with the majority of lamprey moving downstream (70%; Figure 26). Near the bottom at JD1, lamprey were distributed across the channel with the majority moving upstream (79%). Similar patterns were observed at JD2 but almost all lamprey were moving downstream (93%) near the surface; while 49% of events near the bottom were downstream (Figure 27). At JD3 near the surface lamprey were only observed near the far wall with the majority moving
Location
JD1
posit
ive
JD1
nega
tive
JD2
posit
ive
JD2
nega
tive
JD3
posit
ive
JD3
nega
tive
JD3
TP pos
itive
JD3
TP neg
ative
JD4
posit
ive
JD4
nega
tive
JD1
posit
ive
JD1
nega
tive
JD2
posit
ive
JD2
nega
tive
JD3
posit
ive
JD3
nega
tive
JD3
TP pos
itive
JD3
TP neg
ative
JD4
posit
ive
JD4
nega
tive
Per
cent
-100
-80
-60
-40
-20
0
20
40
60
80
100
Moved up Moved down
Day Night4 9
4
5 10
6
43
33
10
389 30
1128 10
7
9
7
5
5
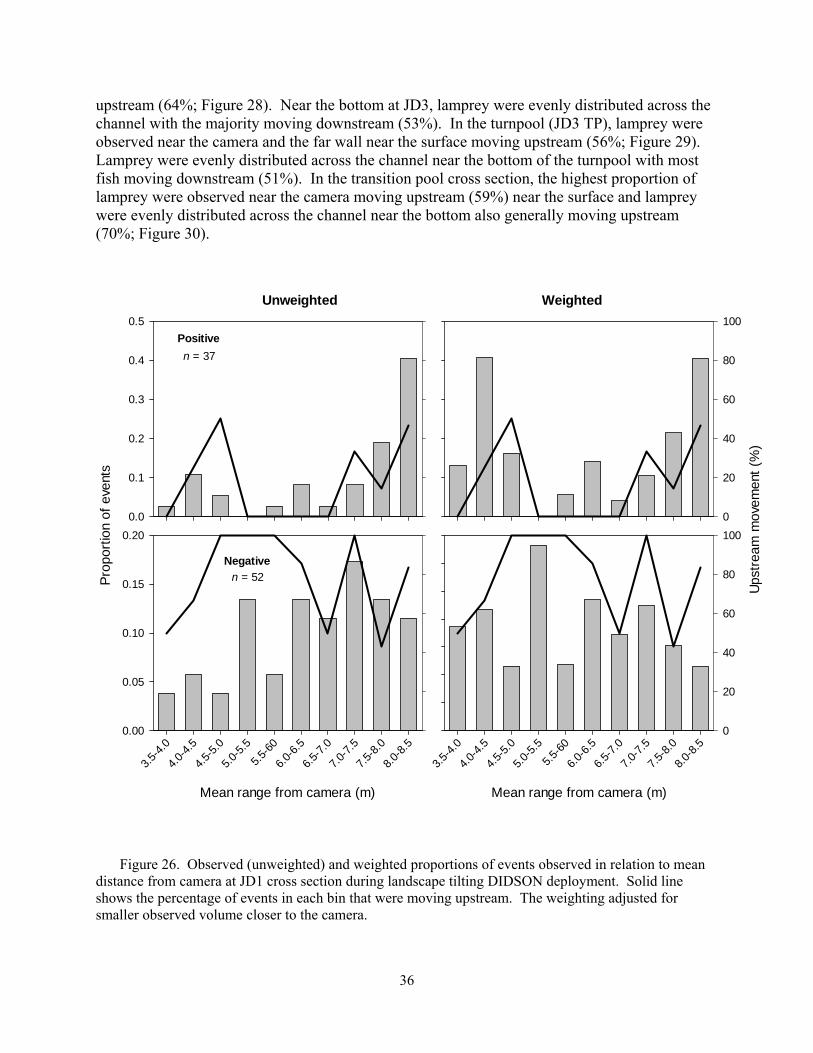
36
upstream (64%; Figure 28). Near the bottom at JD3, lamprey were evenly distributed across the channel with the majority moving downstream (53%). In the turnpool (JD3 TP), lamprey were observed near the camera and the far wall near the surface moving upstream (56%; Figure 29). Lamprey were evenly distributed across the channel near the bottom of the turnpool with most fish moving downstream (51%). In the transition pool cross section, the highest proportion of lamprey were observed near the camera moving upstream (59%) near the surface and lamprey were evenly distributed across the channel near the bottom also generally moving upstream (70%; Figure 30).
Mean range from camera (m)
3.5-
4.0
4.0-
4.5
4.5-
5.0
5.0-
5.5
5.5-
60
6.0-
6.5
6.5-
7.0
7.0-
7.5
7.5-
8.0
8.0-
8.5
Pro
port
ion
of e
vent
s
0.00
0.05
0.10
0.15
0.20
0.0
0.1
0.2
0.3
0.4
0.5
Negative
n = 52
Positive
n = 37
Mean range from camera (m)
3.5-
4.0
4.0-
4.5
4.5-
5.0
5.0-
5.5
5.5-
60
6.0-
6.5
6.5-
7.0
7.0-
7.5
7.5-
8.0
8.0-
8.5
Ups
trea
m m
ovem
ent
(%)
0
20
40
60
80
100
0
20
40
60
80
100
Unweighted Weighted
Figure 26. Observed (unweighted) and weighted proportions of events observed in relation to mean distance from camera at JD1 cross section during landscape tilting DIDSON deployment. Solid line shows the percentage of events in each bin that were moving upstream. The weighting adjusted for smaller observed volume closer to the camera.
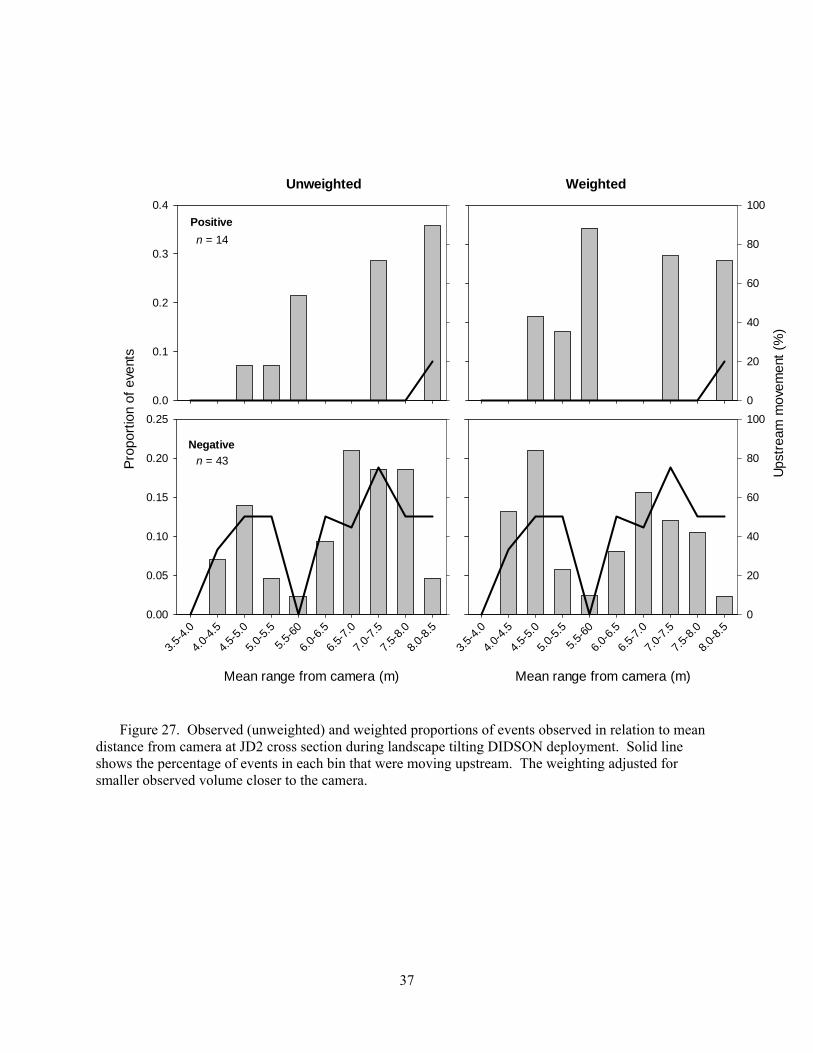
37
Mean range from camera (m)
3.5-
4.0
4.0-
4.5
4.5-
5.0
5.0-
5.5
5.5-
60
6.0-
6.5
6.5-
7.0
7.0-
7.5
7.5-
8.0
8.0-
8.5
Pro
port
ion
of e
vent
s
0.00
0.05
0.10
0.15
0.20
0.25
0.0
0.1
0.2
0.3
0.4
Negative
n = 43
Positive
n = 14
Mean range from camera (m)
3.5-
4.0
4.0-
4.5
4.5-
5.0
5.0-
5.5
5.5-
60
6.0-
6.5
6.5-
7.0
7.0-
7.5
7.5-
8.0
8.0-
8.5
Ups
trea
m m
ovem
ent
(%)
0
20
40
60
80
100
0
20
40
60
80
100
Unweighted Weighted
Figure 27. Observed (unweighted) and weighted proportions of events observed in relation to mean distance from camera at JD2 cross section during landscape tilting DIDSON deployment. Solid line shows the percentage of events in each bin that were moving upstream. The weighting adjusted for smaller observed volume closer to the camera.
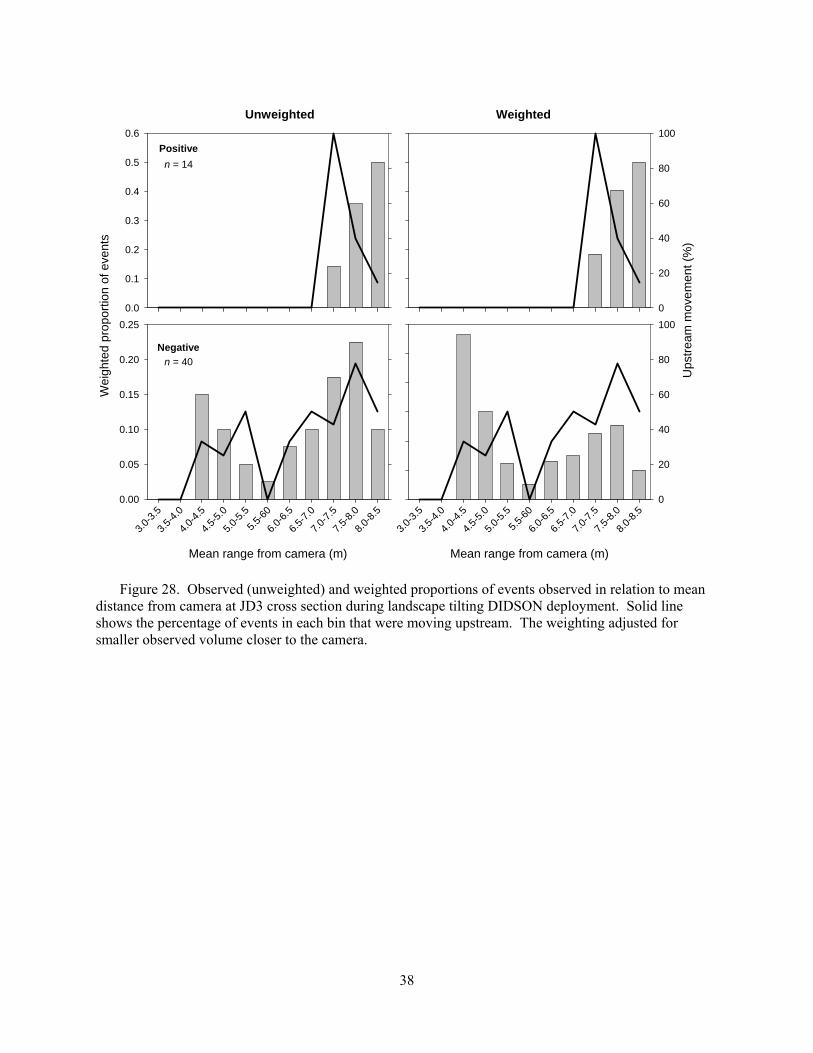
38
Mean range from camera (m)
3.0-
3.5
3.5-
4.0
4.0-
4.5
4.5-
5.0
5.0-
5.5
5.5-
60
6.0-
6.5
6.5-
7.0
7.0-
7.5
7.5-
8.0
8.0-
8.5
Wei
ghte
d pr
opor
tion
of e
vent
s
0.00
0.05
0.10
0.15
0.20
0.25
0.0
0.1
0.2
0.3
0.4
0.5
0.6
Negative
n = 40
Positive
n = 14
Mean range from camera (m)
3.0-
3.5
3.5-
4.0
4.0-
4.5
4.5-
5.0
5.0-
5.5
5.5-
60
6.0-
6.5
6.5-
7.0
7.0-
7.5
7.5-
8.0
8.0-
8.5
Ups
trea
m m
ovem
ent (
%)
0
20
40
60
80
100
0
20
40
60
80
100
Unweighted Weighted
Figure 28. Observed (unweighted) and weighted proportions of events observed in relation to mean distance from camera at JD3 cross section during landscape tilting DIDSON deployment. Solid line shows the percentage of events in each bin that were moving upstream. The weighting adjusted for smaller observed volume closer to the camera.
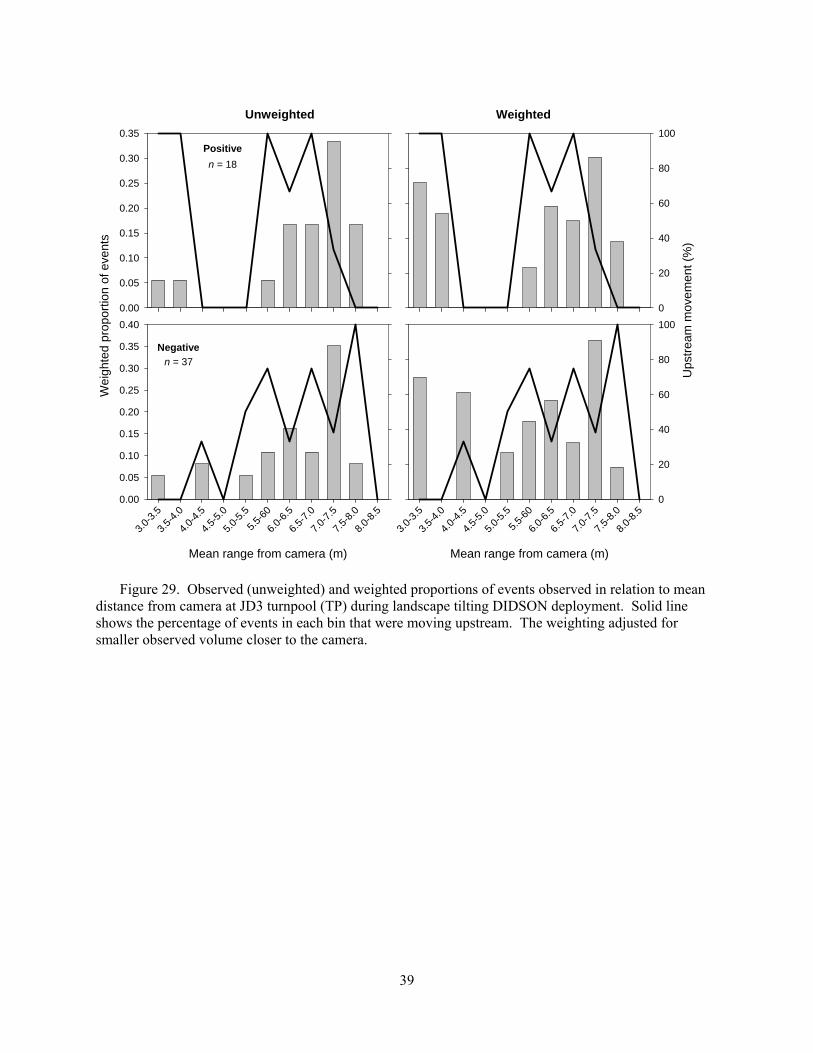
39
Mean range from camera (m)
3.0-
3.5
3.5-
4.0
4.0-
4.5
4.5-
5.0
5.0-
5.5
5.5-
60
6.0-
6.5
6.5-
7.0
7.0-
7.5
7.5-
8.0
8.0-
8.5
Wei
ghte
d pr
opor
tion
of e
vent
s
0.00
0.05
0.10
0.15
0.20
0.25
0.30
0.35
0.40
0.00
0.05
0.10
0.15
0.20
0.25
0.30
0.35
Negative
n = 37
Positive
n = 18
Mean range from camera (m)
3.0-
3.5
3.5-
4.0
4.0-
4.5
4.5-
5.0
5.0-
5.5
5.5-
60
6.0-
6.5
6.5-
7.0
7.0-
7.5
7.5-
8.0
8.0-
8.5
Ups
trea
m m
ovem
ent (
%)
0
20
40
60
80
100
0
20
40
60
80
100
Unweighted Weighted
Figure 29. Observed (unweighted) and weighted proportions of events observed in relation to mean distance from camera at JD3 turnpool (TP) during landscape tilting DIDSON deployment. Solid line shows the percentage of events in each bin that were moving upstream. The weighting adjusted for smaller observed volume closer to the camera.
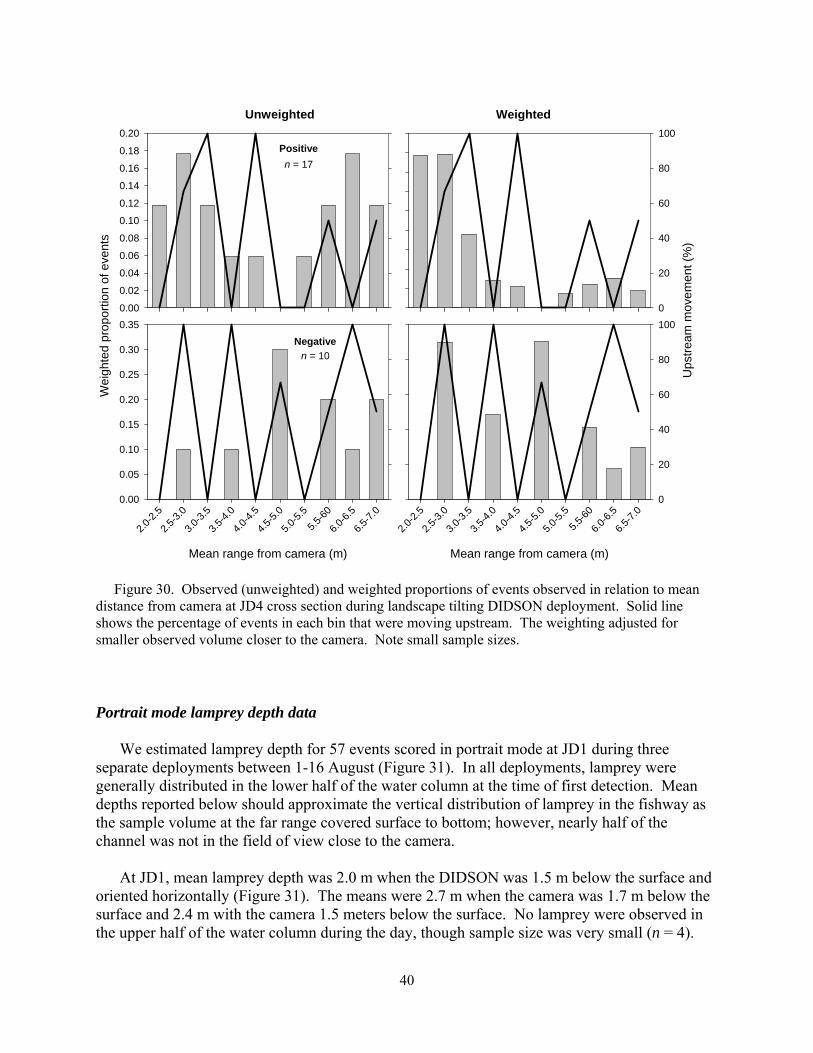
40
Mean range from camera (m)
2.0-
2.5
2.5-
3.0
3.0-
3.5
3.5-
4.0
4.0-
4.5
4.5-
5.0
5.0-
5.5
5.5-
60
6.0-
6.5
6.5-
7.0
Wei
ghte
d pr
opor
tion
of e
vent
s
0.00
0.05
0.10
0.15
0.20
0.25
0.30
0.35
0.00
0.02
0.04
0.06
0.08
0.10
0.12
0.14
0.16
0.18
0.20
Negative
n = 10
Positive
n = 17
Mean range from camera (m)
2.0-
2.5
2.5-
3.0
3.0-
3.5
3.5-
4.0
4.0-
4.5
4.5-
5.0
5.0-
5.5
5.5-
60
6.0-
6.5
6.5-
7.0
Ups
trea
m m
ovem
ent (
%)
0
20
40
60
80
100
0
20
40
60
80
100
Unweighted Weighted
Figure 30. Observed (unweighted) and weighted proportions of events observed in relation to mean distance from camera at JD4 cross section during landscape tilting DIDSON deployment. Solid line shows the percentage of events in each bin that were moving upstream. The weighting adjusted for smaller observed volume closer to the camera. Note small sample sizes. Portrait mode lamprey depth data
We estimated lamprey depth for 57 events scored in portrait mode at JD1 during three separate deployments between 1-16 August (Figure 31). In all deployments, lamprey were generally distributed in the lower half of the water column at the time of first detection. Mean depths reported below should approximate the vertical distribution of lamprey in the fishway as the sample volume at the far range covered surface to bottom; however, nearly half of the channel was not in the field of view close to the camera.
At JD1, mean lamprey depth was 2.0 m when the DIDSON was 1.5 m below the surface and
oriented horizontally (Figure 31). The means were 2.7 m when the camera was 1.7 m below the surface and 2.4 m with the camera 1.5 meters below the surface. No lamprey were observed in the upper half of the water column during the day, though sample size was very small (n = 4).
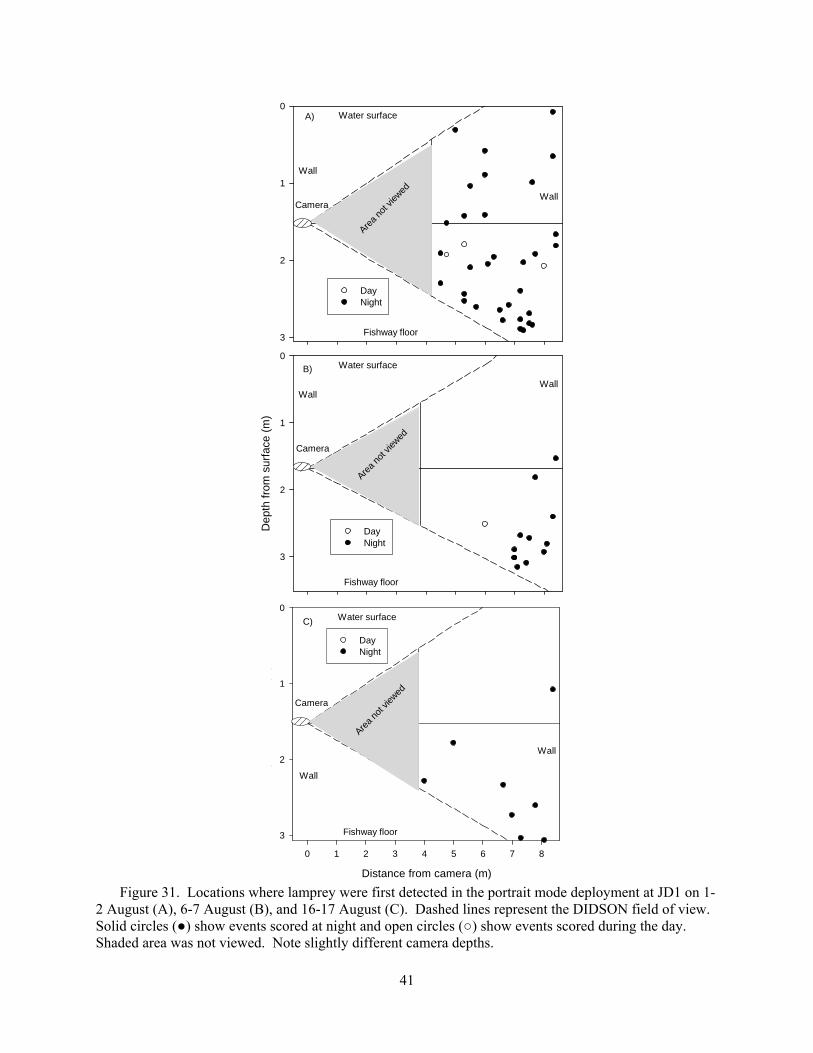
41
Figure 31. Locations where lamprey were first detected in the portrait mode deployment at JD1 on 1-
2 August (A), 6-7 August (B), and 16-17 August (C). Dashed lines represent the DIDSON field of view. Solid circles (●) show events scored at night and open circles (○) show events scored during the day. Shaded area was not viewed. Note slightly different camera depths.
Distance from camera (m)
0 1 2 3 4 5 6 7 8
De
pth
fro
m s
urf
ace
(m
)
0
1
2
3
DayNight
Water surface
Wall
Wall
Fishway floor
Camera
Area
not v
iewed
0
1
2
3
DayNight
Camera
Water surface
Wall
Wall
Fishway floor
De
pth
from
sur
face
(m
)
0
1
2
3
DayNight
Water surface
WallWall
Fishway floor
Camera
Area
not v
iewed
Area
not v
iewed
Area
not v
iewed
A)
B)
C)
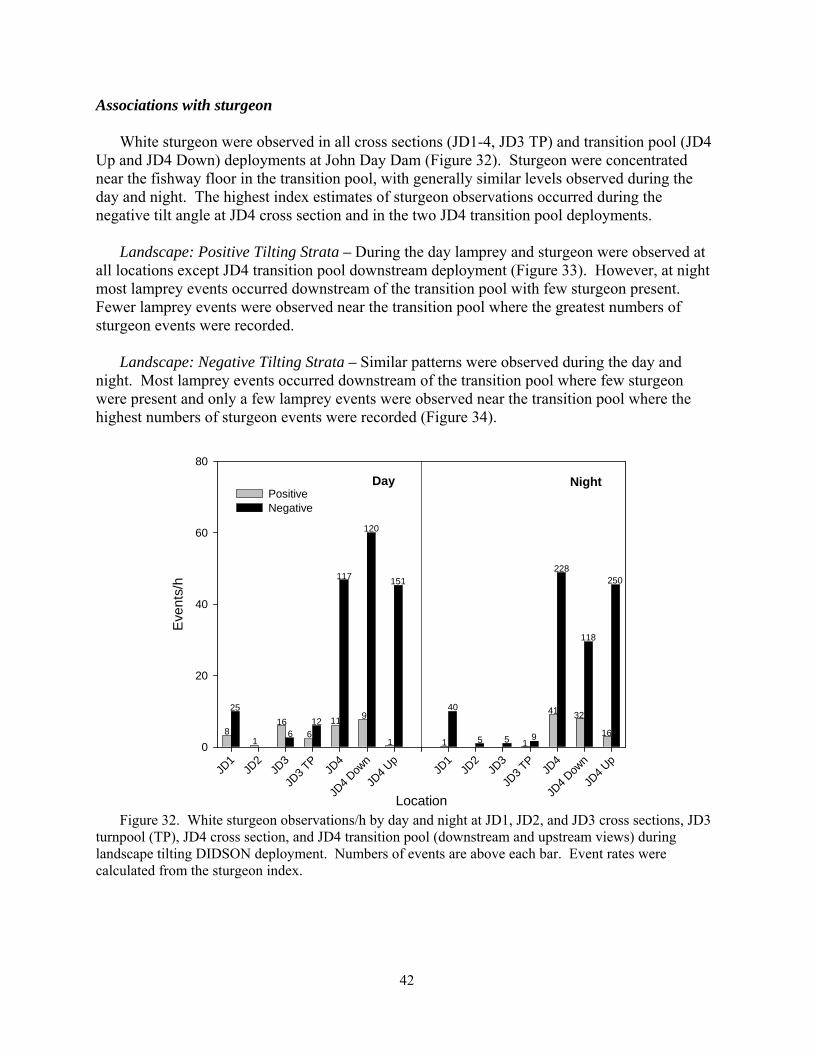
42
Associations with sturgeon White sturgeon were observed in all cross sections (JD1-4, JD3 TP) and transition pool (JD4 Up and JD4 Down) deployments at John Day Dam (Figure 32). Sturgeon were concentrated near the fishway floor in the transition pool, with generally similar levels observed during the day and night. The highest index estimates of sturgeon observations occurred during the negative tilt angle at JD4 cross section and in the two JD4 transition pool deployments. Landscape: Positive Tilting Strata – During the day lamprey and sturgeon were observed at all locations except JD4 transition pool downstream deployment (Figure 33). However, at night most lamprey events occurred downstream of the transition pool with few sturgeon present. Fewer lamprey events were observed near the transition pool where the greatest numbers of sturgeon events were recorded. Landscape: Negative Tilting Strata – Similar patterns were observed during the day and night. Most lamprey events occurred downstream of the transition pool where few sturgeon were present and only a few lamprey events were observed near the transition pool where the highest numbers of sturgeon events were recorded (Figure 34).
Figure 32. White sturgeon observations/h by day and night at JD1, JD2, and JD3 cross sections, JD3 turnpool (TP), JD4 cross section, and JD4 transition pool (downstream and upstream views) during landscape tilting DIDSON deployment. Numbers of events are above each bar. Event rates were calculated from the sturgeon index.
Location
JD1
JD2
JD3
JD3
TPJD
4
JD4
Down
JD4
UpJD
1JD
2JD
3
JD3
TPJD
4
JD4
Down
JD4
Up
Eve
nts/
h
0
20
40
60
80
Positive Negative
Day Night
8
25
1
166 6
12 11
117
9
120
151
1
40
5 5 91
41
228
32
118
16
250
1
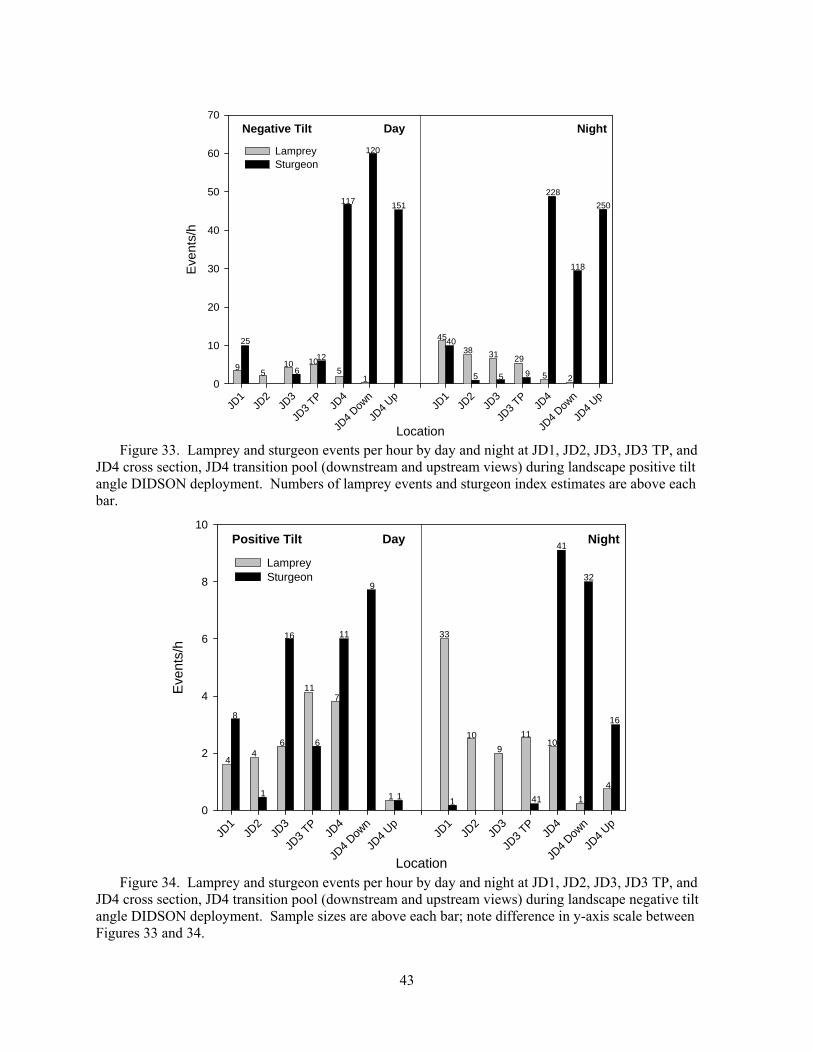
43
Figure 33. Lamprey and sturgeon events per hour by day and night at JD1, JD2, JD3, JD3 TP, and JD4 cross section, JD4 transition pool (downstream and upstream views) during landscape positive tilt angle DIDSON deployment. Numbers of lamprey events and sturgeon index estimates are above each bar.
Figure 34. Lamprey and sturgeon events per hour by day and night at JD1, JD2, JD3, JD3 TP, and JD4 cross section, JD4 transition pool (downstream and upstream views) during landscape negative tilt angle DIDSON deployment. Sample sizes are above each bar; note difference in y-axis scale between Figures 33 and 34.
Location
JD1
JD2
JD3
JD3
TPJD
4
JD4
Down
JD4
UpJD
1JD
2JD
3
JD3
TPJD
4
JD4
Down
JD4
Up
Eve
nts/
h
0
10
20
30
40
50
60
70
Lamprey Sturgeon
Day NightNegative Tilt
9
25
510
61012
5
151
120
1
117
454038
5
31
5
29
9 5
228
2
118
250
Location
JD1
JD2
JD3
JD3
TPJD
4
JD4
Down
JD4
UpJD
1JD
2JD
3
JD3
TPJD
4
JD4
Down
JD4
Up
Eve
nts/
h
0
2
4
6
8
10
Lamprey Sturgeon
Day NightPositive Tilt
4
8
4
1
6
16
11
6
7
11
9
1 1
33
1
10
9
11
41
10
41
32
1
4
16
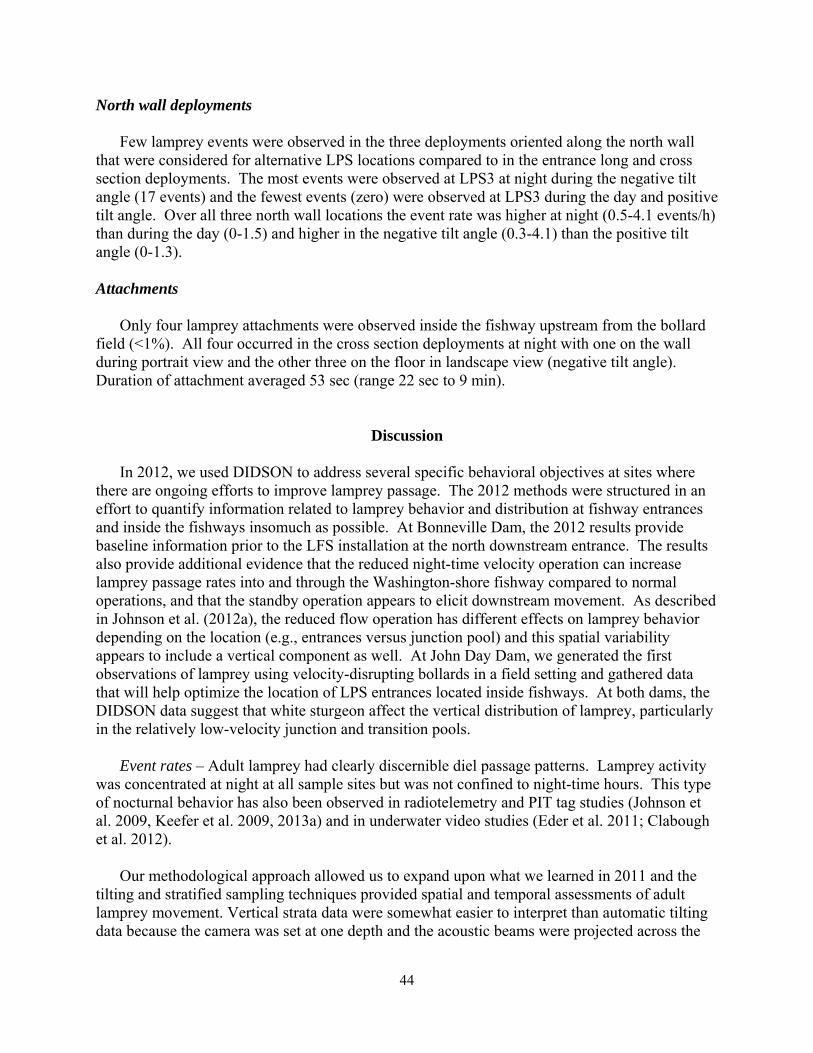
44
North wall deployments Few lamprey events were observed in the three deployments oriented along the north wall that were considered for alternative LPS locations compared to in the entrance long and cross section deployments. The most events were observed at LPS3 at night during the negative tilt angle (17 events) and the fewest events (zero) were observed at LPS3 during the day and positive tilt angle. Over all three north wall locations the event rate was higher at night (0.5-4.1 events/h) than during the day (0-1.5) and higher in the negative tilt angle (0.3-4.1) than the positive tilt angle (0-1.3). Attachments
Only four lamprey attachments were observed inside the fishway upstream from the bollard field (<1%). All four occurred in the cross section deployments at night with one on the wall during portrait view and the other three on the floor in landscape view (negative tilt angle). Duration of attachment averaged 53 sec (range 22 sec to 9 min).
Discussion
In 2012, we used DIDSON to address several specific behavioral objectives at sites where there are ongoing efforts to improve lamprey passage. The 2012 methods were structured in an effort to quantify information related to lamprey behavior and distribution at fishway entrances and inside the fishways insomuch as possible. At Bonneville Dam, the 2012 results provide baseline information prior to the LFS installation at the north downstream entrance. The results also provide additional evidence that the reduced night-time velocity operation can increase lamprey passage rates into and through the Washington-shore fishway compared to normal operations, and that the standby operation appears to elicit downstream movement. As described in Johnson et al. (2012a), the reduced flow operation has different effects on lamprey behavior depending on the location (e.g., entrances versus junction pool) and this spatial variability appears to include a vertical component as well. At John Day Dam, we generated the first observations of lamprey using velocity-disrupting bollards in a field setting and gathered data that will help optimize the location of LPS entrances located inside fishways. At both dams, the DIDSON data suggest that white sturgeon affect the vertical distribution of lamprey, particularly in the relatively low-velocity junction and transition pools.
Event rates – Adult lamprey had clearly discernible diel passage patterns. Lamprey activity was concentrated at night at all sample sites but was not confined to night-time hours. This type of nocturnal behavior has also been observed in radiotelemetry and PIT tag studies (Johnson et al. 2009, Keefer et al. 2009, 2013a) and in underwater video studies (Eder et al. 2011; Clabough et al. 2012).
Our methodological approach allowed us to expand upon what we learned in 2011 and the
tilting and stratified sampling techniques provided spatial and temporal assessments of adult lamprey movement. Vertical strata data were somewhat easier to interpret than automatic tilting data because the camera was set at one depth and the acoustic beams were projected across the
45
channel (i.e., the viewing angle was not oblique). However, the automatic tilting program had the advantage of sampling different strata within individual days and nights, which reduced the potentially confounding effects of differences in lamprey activity on different dates. In both deployment methods we observed differences in lamprey vertical distribution among sites with lamprey being more floor-oriented in higher velocity John Day fishway sections, and more frequent at shallower depths in lower velocity areas at Bonneville Dam, particularly the junction pool. We caution that some of the variability among sites may have been an artifact of non-random sampling (date effects) or the orientation of the camera relative to the fish (aspect angle) resulting in variable detection probabilities. Contrary to our expectations, we observed the highest lamprey event rates near the surface in some deployments at Bonneville Dam. For example, event rates for near-surface deployments at NDE were triple those observed deeper in the water column. However, it is important to note that the lowest portion of the fishway, including the floor, was not observed at NDE, so there continues to be a gap in our understanding with regards to where lamprey are distributed in relation to the LFS site. Lower event rates for the deeper deployments at NDE may be a result of sampling a volume of the water beneath the adjustable gate where unfavorable flows deter lamprey from congregating or lamprey were more attracted to higher velocities above the gate. Similar patterns were observed at JPW and JPN (both vertical strata and tilting deployments) where lamprey were concentrated higher in the water column suggesting surface preference. However, the mechanism(s) may be different between the two locations because of high sturgeon densities near the fishway floor in the junction pool.
Our primary aim in using the portrait orientation was to estimate lamprey depth distributions.
Broadly, the distributions paralleled those inferred using vertical strata and titling landscape deployments. Swimming depths within our sample volumes did not indicate a strong depth preference within the individual sampled FOV during the day or night in the Bonneville Dam fishway (see Figure 18) but lamprey clearly were concentrated deeper in the fishway at John Day Dam. We also observed an important relationship between depth and lamprey movement direction, with more downstream movement near the surface and more upstream movement in deeper strata at John Day Dam. This pattern suggested that some fish, when they turn around, drift downstream in the upper water column. Downstream movement in the upper water column is presumably an efficient way to move downstream as water velocities tend to be higher in the thalweg away from the fishway floor and walls and may also reduce exposure to potential sturgeon predators during downstream movements.
Adult lamprey are known to be cryptic and are often structure oriented, using habitats near the bottom, hiding under boulders or other structures (Moser et al. 2007b). We have observed similar substrate orientation by adults in an experimental fishway (Keefer et al. 2010, 2011) and at fish counting stations at Bonneville and The Dalles dams (Clabough et al. 2012). The 2012 DIDSON results from the vertical strata and portrait deployments were therefore somewhat unexpected given previous observations. We hypothesize that substrate orientation including attachment is strongly affected by water velocity, with increasing substrate orientation and attachment at higher velocities. High sturgeon densities, particularly in the junction pool at Bonneville Dam and the transition pool at John Day Dam, may have also altered lamprey distributions at these sites. We also could not monitor the full water column at most sites, and hence there was likely some measurement error in comparisons of vertical strata. It is perhaps

46
noteworthy that the John Day portrait data, which provided the most straightforward evaluation of vertical lamprey distribution, consistently showed that adults were concentrated near the bottom and near the fishway walls. Additionally, most events at the John Day entrance were observed in the negative tilt angles, and nearly all attachment events at John Day were observed in the bollard field. Collectively, these results suggest that substrate orientation and attachment are more common in high velocity locations during upstream movement. In lower velocity areas, attachment was rare and depth distributions were more variable and closer to the surface when sturgeon were present.
In addition to differences in lamprey numbers across vertical strata within deployments, differences were also observed across sites. At Bonneville, fewer lamprey were observed at JPN than at JPW, for example. This likely reflected differences in the numbers of lamprey originating from the collection channels leading into the junction pool. The camera position at JPN primarily monitored fish entering from the north upstream entrance (NUE) channel whereas JPW monitored fish originating from the NDE entrance (the third, northernmost channel entering the JP leads from the Powerhouse collection channel). The high event rates at NDE in 2012 support the idea that many fish entered the junction pool via this route. Fewer lamprey appeared to have entered the junction pool via NUE, and we could not estimate activity associated with the third channel that entered the pool from the Powerhouse collection channel (note that the I-beam used to monitor the powerhouse collection channel route in the 2011 pilot study was moved for the 2012 study).
Upstream-downstream movements – The DIDSON allowed us to characterize upstream and downstream movements and the orientation of lamprey as they passed through the acoustic beams. The highest percent of downstream movement was observed at Bonneville in the JPW deployment. This site was just downstream from the first submerged weirs at the base of the Washington-shore ladder. We have hypothesized that confusing attraction cues or other hydraulic features at the weirs deter lamprey passage or that sturgeon concentrated near the weirs prompt the downstream movements by lamprey. Downstream moving adults may be guided to the southern NDE channel (the area monitored by the JPW deployment) by flow cues and/or by the southern wall of the fishway (see Figure 35). In contrast, the NDE and JPN deployments were associated with relatively high percentages of fish moving upstream. JPN was further downstream and north of the primary flow path in the junction pool, and it is certainly possible that lamprey moving upstream through the JPN deployment subsequently reach the submerged weirs and joined the group of downstream-moving fish past JPW. Downstream movements observed at JPW may have also included adults moving downstream after entering the junction pool from the northern-most powerhouse collection channel.
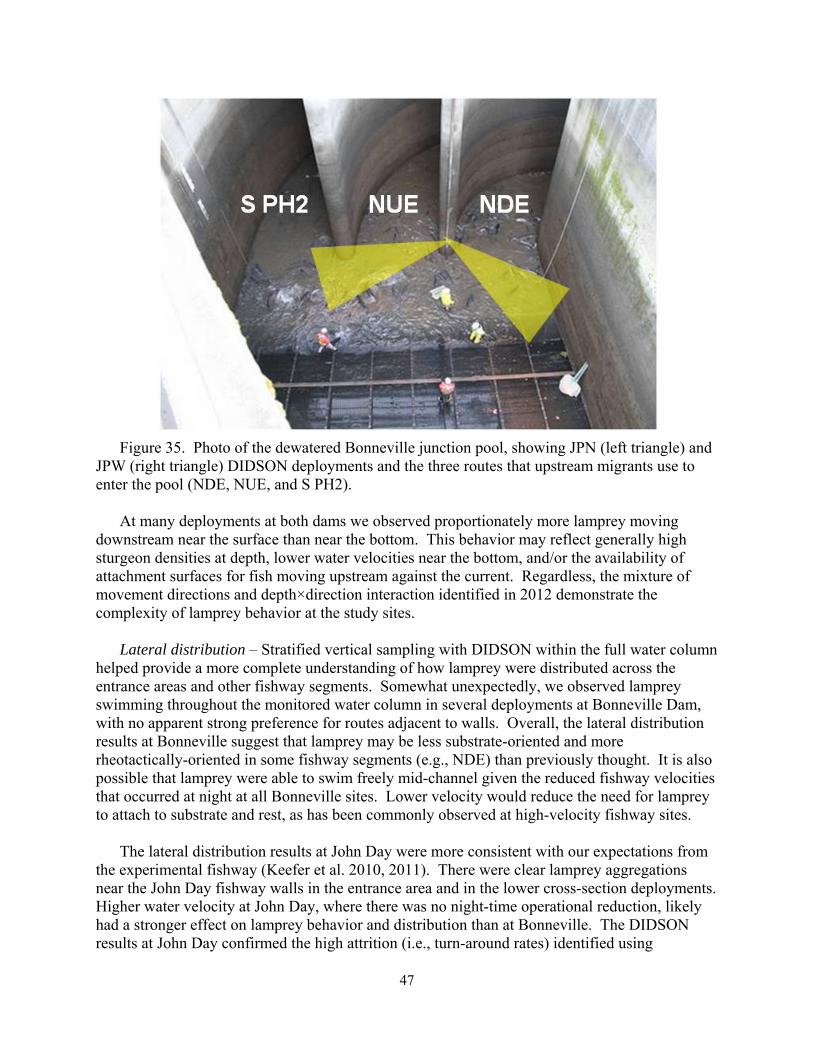
47
Figure 35. Photo of the dewatered Bonneville junction pool, showing JPN (left triangle) and JPW (right triangle) DIDSON deployments and the three routes that upstream migrants use to enter the pool (NDE, NUE, and S PH2).
At many deployments at both dams we observed proportionately more lamprey moving
downstream near the surface than near the bottom. This behavior may reflect generally high sturgeon densities at depth, lower water velocities near the bottom, and/or the availability of attachment surfaces for fish moving upstream against the current. Regardless, the mixture of movement directions and depth×direction interaction identified in 2012 demonstrate the complexity of lamprey behavior at the study sites.
Lateral distribution – Stratified vertical sampling with DIDSON within the full water column helped provide a more complete understanding of how lamprey were distributed across the entrance areas and other fishway segments. Somewhat unexpectedly, we observed lamprey swimming throughout the monitored water column in several deployments at Bonneville Dam, with no apparent strong preference for routes adjacent to walls. Overall, the lateral distribution results at Bonneville suggest that lamprey may be less substrate-oriented and more rheotactically-oriented in some fishway segments (e.g., NDE) than previously thought. It is also possible that lamprey were able to swim freely mid-channel given the reduced fishway velocities that occurred at night at all Bonneville sites. Lower velocity would reduce the need for lamprey to attach to substrate and rest, as has been commonly observed at high-velocity fishway sites.
The lateral distribution results at John Day were more consistent with our expectations from
the experimental fishway (Keefer et al. 2010, 2011). There were clear lamprey aggregations near the John Day fishway walls in the entrance area and in the lower cross-section deployments. Higher water velocity at John Day, where there was no night-time operational reduction, likely had a stronger effect on lamprey behavior and distribution than at Bonneville. The DIDSON results at John Day confirmed the high attrition (i.e., turn-around rates) identified using
48
radiotelemetry in this section of the fishway (Keefer et al. 2013c). Our observations suggest that high water velocity was a lamprey deterrent in the bollard area and in the cross-sections upstream.
At both dams, the wider lateral distribution in the low-velocity junction and transition pools
may indicate that lamprey were not strongly orienting to fishway walls or other structures and there were not strong lateral gradients in other potential cues (e.g., hydraulic cues). Unfortunately the location of cameras during 2012 did not allow us to directly image behavior at the junction pool transition area at Bonneville. We installed an I-beam at Bonneville in winter 2012-2013 that should allow collection of better information on lamprey behavior and distribution at the first submerged weirs at the head of the junction pool in 2013. At John Day Dam, only a handful of lampreys were observed at the first submerged weir and there was no clear trend in behavior among those observed, limiting our ability to make inferences about potential bottlenecks at this location. Overall, the distribution of lamprey in the lower fishway channel at John Day and low numbers reaching the transition pool (i.e., XSECT 4) suggests that the number of lamprey approaching the transition pool may be as large a factor as any structural or hydrodynamic issues at the transition pool. The presence of sturgeon may also contribute to turn-arounds if lampreys detect and respond to olfactory or other cues indicating predation risk. A better understanding of the mechanisms that affect behavior and distribution at transition pool sites is needed because transition pools throughout the Hydrosystem have been linked to high lamprey turn-around rates (Keefer et al. 2013c).
Fish behavior and fishway operations – Lamprey behaviors in relation to nighttime fishway
water velocity at Bonneville were mixed but largely consistent with previously reported results (e.g., Johnson et al. 2010, 2012a). Results also varied somewhat between sites, within depth strata at each site, and between the two DIDSON deployment methods (vertical strata vs. tilting). Overall, normal and reduced velocities generally resulted in higher event rates with more fish moving upstream compared to standby operations. For example, the vertical strata results suggested higher lamprey activity during normal and reduced velocity operations at NDE with more upstream movement in the bottom stratum. During the tilting experiments event rates were higher during the reduced and standby flow conditions and more fish were observed moving downstream during standby operations. Trends were similar at JPW: event rates were consistently higher during the reduced velocities (vertical strata) and reduced and standby (tilting). More fish moved downstream during standby conditions or when the camera was positioned or pointed in the upper water column. Similarly, high downstream movements were observed at JPN during standby operations. Previous telemetry studies suggested entrance efficiencies, guidance and attraction were consistently higher during reduced velocity conditions at all of the PH2 entrances evaluated with radiotelemetry (Johnson et al. 2010, 2012a). The DIDSON results were consistent with these findings (i.e., we generally observed higher event rates during normal and reduced operations than during standby), but the DIDSON also helped quantify higher rates of upstream movements during the reduced velocities.
Direct comparisons of DIDSON results with radiotelemetry-based results continue to be
challenging. The 2012 DIDSON results clearly showed that movement directions differed among depth strata, and thus estimating efficiency (i.e., approaches:entries, exits:entries, upstream:downstream, etc.) was difficult because the DIDSON cannot be used to monitor most
49
fishway cross-sections in their entirety. Furthermore, the DIDSON sampling cannot be used to identify individual fish, and individual-based metrics are required for many standard passage metrics (e.g., entrance efficiency, passage time), particularly in areas where multiple routes are possible. For example, fishway velocity test metrics were calculated for only unique radio-tagged individuals that approached and entered at the same Bonneville Powerhouse 2 site during the same velocity treatment (Johnson et al. 2012a).
Estimating passage metrics using DIDSON may be more plausible at smaller-scale fishway
segments like those at John Day north. In a single DIDSON deployment at the John Day cross-sections we were able to view approximately half of the horizontal and vertical aspects of the fishway channel. This may be a good location to evaluate a night-time velocity experiment using DIDSON, but estimation of metrics will require substantial assumptions about unmonitored areas of the fishway channel.
DIDSON orientations – Overall, lamprey behavior and distribution patterns were similar
between the two landscape deployments (vertical strata and automatic tilting). Differences in data interpretation between the two techniques were likely the result of overlap in sample volume during the tilting deployments, because only the far outer ranges were representing the desired depth strata with the camera at a fixed depth. Date effects related to differences in passage rate between sampling days in the vertical strata observations and differences in the ability to detect lamprey at the steeper tiling angles may have also influenced the results.
In general, we recommend use of landscape orientation over portrait orientation for lamprey
studies. In landscape, the lamprey moved perpendicularly across the FOV which maximized target detection probability and the confidence of identifications. We also recommend the use of stratified sampling in landscape orientation as preferable to portrait mode for characterizing depth distributions where the water column depth cannot be covered entirely with the available sample volume in portrait mode. The use of automated tilting programs provided information on distribution over a greater area during short time intervals (i.e., same date), but the use of this approach should be weighed against the potential effects of changes in camera orientation on detection of lamprey.
Lamprey bollards and prevalence of attachments – We observed many lamprey attaching in the bollard field at the John Day entrance (accounted for about 15% of the total lamprey events observed at in the John Day fishway) but very few lamprey (1%) attaching upstream of the entrance area. Turbulence and acoustic shadowing and echoing from the bollards made viewing difficult but it appeared most of the attached lamprey (71%) were attached to a bollard. Movement patterns through the bollard field tended to be upstream and lateral (i.e., across the channel more than directly upstream). The bollards did not appear from this study to negatively impact lamprey movements. We note that most adults were observed near the substrate (few were observed in the positive tilt angle sampling above the bollards), consistent with the hypothesis that lowered bulk velocities in the bollard field improved upstream passage conditions. However, from qualitative observations, it was not clear that a benefit was provided because adults appeared to be subjected to high turbulence in the bollard field. Hence, there may be a tradeoff between reduced velocity and increased turbulence, a hypothesis that we plan to address in experiments in 2013.
50
The fishway environment affected the acoustic environment and image quality particularly at
the John Day entrance so the numbers reported were likely underestimates of the number of lamprey that used the bollard field. The hard, smooth surface of the steel bollards inside a fishway produced an acoustic boundary and was an ideal environment to reflect sound that often produced bright echoes appearing as arcs or lines (“crosstalk”) making lamprey difficult to see.
Unexpectedly, given the exposure to high water velocities, we observed very few lamprey attached to substrate or walls at the Bonneville Dam fishway entrance (NDE) or in the John Day fishway upstream of the entrance bollards. Lamprey movement in areas with high water velocities has been described as “intermittent locomotion” where movement is interspersed with frequent attachments (Kent et al. 2009; Keefer et al. 2010). However, this behavior may differ in areas with predators, or perhaps water velocities were slow enough that fish did not need to attach (this was most likely a factor during reduced velocity operations at Bonneville). Attachment estimates were also conservative because attached fish were near the outer range of the camera (typically the far wall) and were often difficult to see; the near wall and floor were not monitored in most deployments. Furthermore, the target strength of an attached lamprey was often weaker and simultaneous acoustic returns often degraded lamprey images near walls and in the bollard field.
Associations with Sturgeon– Sturgeon presence was generally associated with lower lamprey activity and our results suggest lamprey may avoid areas where sturgeon congregate. At the NDE at Bonneville Dam the number of lamprey per file viewed was negatively associated with the sturgeon index in both depth strata. In the JPW we observed similar results with most lamprey near the surface and sturgeon near the bottom. In the JPN deployment sturgeon were observed in all three depth strata, and few lamprey were observed at any depth. At John Day, sturgeon were concentrated near the transition pool area whereas most lamprey were observed downstream of the transition pool. It is possible that lamprey may be near the surface of the water column for reasons other than predator avoidance, such as water velocity, turbulence, or orientation behaviors, but we were unable to separate these potential effects given the observational nature of DIDSON.
We think it was likely that adult lamprey modified their behavior in response to white
sturgeon presence. The mechanisms of this response are currently unknown, but may involve chemoreception (i.e., lamprey response to sturgeon odors or to lamprey alarm cues) or other detection systems (i.e., vibration, electrical, or visual cues). This result, in conjunction with observations at the margin of the diffuser grating suggest that predators or hydraulic effects upstream may be responsible for lamprey turnarounds in the Bonneville junction pool area, rather than the immediate effects of water upwelling through diffusers that adults first encounter within the monitored FOV.
John Day north wall deployments – Few lamprey were observed in the JD north wall deployments when compared to the cross-section deployments or deployments into the bollard field. In all cases, event rates were higher at night with the camera tilted downward toward the fishway floor. However, event rates for the north wall deployments were likely a gross underestimate of actual numbers since more fish were observed during the cross section
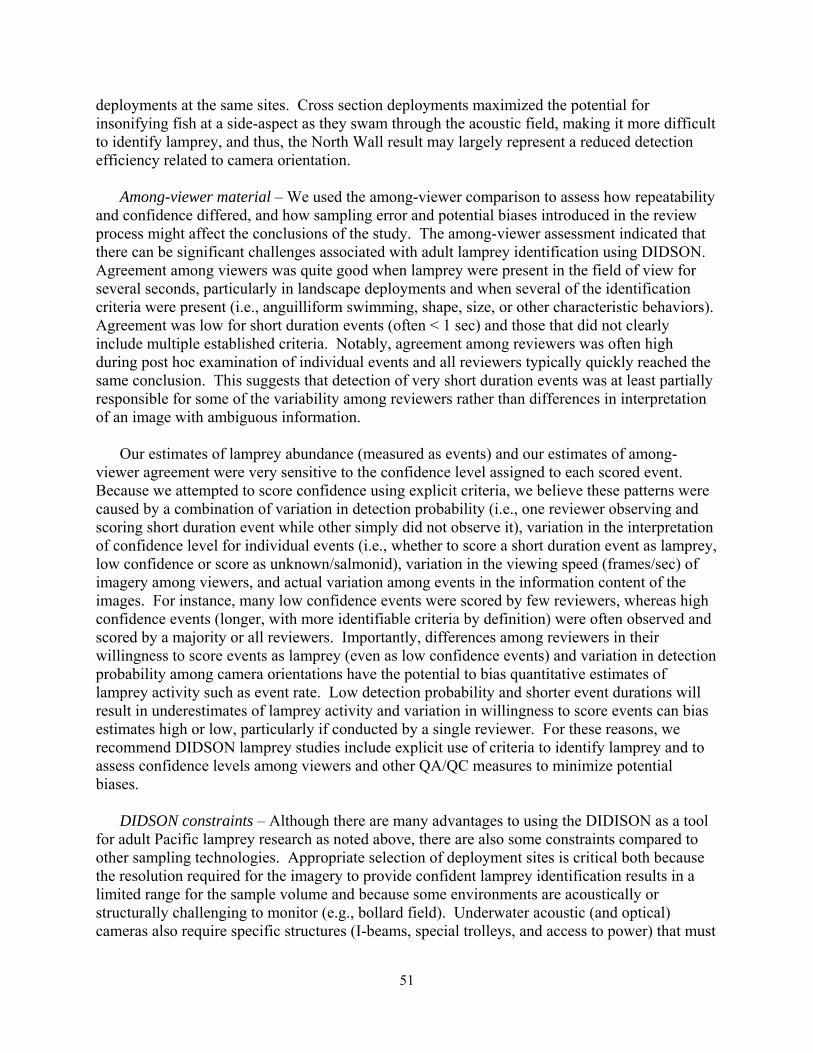
51
deployments at the same sites. Cross section deployments maximized the potential for insonifying fish at a side-aspect as they swam through the acoustic field, making it more difficult to identify lamprey, and thus, the North Wall result may largely represent a reduced detection efficiency related to camera orientation.
Among-viewer material – We used the among-viewer comparison to assess how repeatability and confidence differed, and how sampling error and potential biases introduced in the review process might affect the conclusions of the study. The among-viewer assessment indicated that there can be significant challenges associated with adult lamprey identification using DIDSON. Agreement among viewers was quite good when lamprey were present in the field of view for several seconds, particularly in landscape deployments and when several of the identification criteria were present (i.e., anguilliform swimming, shape, size, or other characteristic behaviors). Agreement was low for short duration events (often < 1 sec) and those that did not clearly include multiple established criteria. Notably, agreement among reviewers was often high during post hoc examination of individual events and all reviewers typically quickly reached the same conclusion. This suggests that detection of very short duration events was at least partially responsible for some of the variability among reviewers rather than differences in interpretation of an image with ambiguous information.
Our estimates of lamprey abundance (measured as events) and our estimates of among-
viewer agreement were very sensitive to the confidence level assigned to each scored event. Because we attempted to score confidence using explicit criteria, we believe these patterns were caused by a combination of variation in detection probability (i.e., one reviewer observing and scoring short duration event while other simply did not observe it), variation in the interpretation of confidence level for individual events (i.e., whether to score a short duration event as lamprey, low confidence or score as unknown/salmonid), variation in the viewing speed (frames/sec) of imagery among viewers, and actual variation among events in the information content of the images. For instance, many low confidence events were scored by few reviewers, whereas high confidence events (longer, with more identifiable criteria by definition) were often observed and scored by a majority or all reviewers. Importantly, differences among reviewers in their willingness to score events as lamprey (even as low confidence events) and variation in detection probability among camera orientations have the potential to bias quantitative estimates of lamprey activity such as event rate. Low detection probability and shorter event durations will result in underestimates of lamprey activity and variation in willingness to score events can bias estimates high or low, particularly if conducted by a single reviewer. For these reasons, we recommend DIDSON lamprey studies include explicit use of criteria to identify lamprey and to assess confidence levels among viewers and other QA/QC measures to minimize potential biases.
DIDSON constraints – Although there are many advantages to using the DIDISON as a tool for adult Pacific lamprey research as noted above, there are also some constraints compared to other sampling technologies. Appropriate selection of deployment sites is critical both because the resolution required for the imagery to provide confident lamprey identification results in a limited range for the sample volume and because some environments are acoustically or structurally challenging to monitor (e.g., bollard field). Underwater acoustic (and optical) cameras also require specific structures (I-beams, special trolleys, and access to power) that must
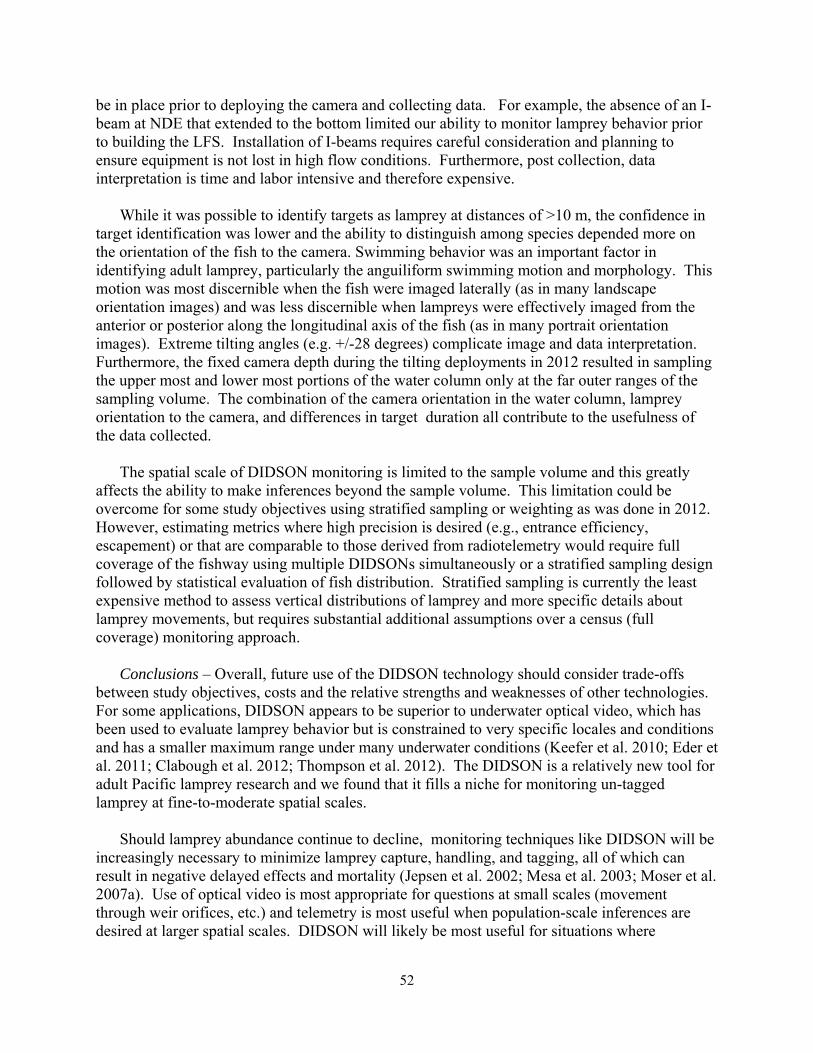
52
be in place prior to deploying the camera and collecting data. For example, the absence of an I-beam at NDE that extended to the bottom limited our ability to monitor lamprey behavior prior to building the LFS. Installation of I-beams requires careful consideration and planning to ensure equipment is not lost in high flow conditions. Furthermore, post collection, data interpretation is time and labor intensive and therefore expensive.
While it was possible to identify targets as lamprey at distances of >10 m, the confidence in
target identification was lower and the ability to distinguish among species depended more on the orientation of the fish to the camera. Swimming behavior was an important factor in identifying adult lamprey, particularly the anguiliform swimming motion and morphology. This motion was most discernible when the fish were imaged laterally (as in many landscape orientation images) and was less discernible when lampreys were effectively imaged from the anterior or posterior along the longitudinal axis of the fish (as in many portrait orientation images). Extreme tilting angles (e.g. +/-28 degrees) complicate image and data interpretation. Furthermore, the fixed camera depth during the tilting deployments in 2012 resulted in sampling the upper most and lower most portions of the water column only at the far outer ranges of the sampling volume. The combination of the camera orientation in the water column, lamprey orientation to the camera, and differences in target duration all contribute to the usefulness of the data collected.
The spatial scale of DIDSON monitoring is limited to the sample volume and this greatly
affects the ability to make inferences beyond the sample volume. This limitation could be overcome for some study objectives using stratified sampling or weighting as was done in 2012. However, estimating metrics where high precision is desired (e.g., entrance efficiency, escapement) or that are comparable to those derived from radiotelemetry would require full coverage of the fishway using multiple DIDSONs simultaneously or a stratified sampling design followed by statistical evaluation of fish distribution. Stratified sampling is currently the least expensive method to assess vertical distributions of lamprey and more specific details about lamprey movements, but requires substantial additional assumptions over a census (full coverage) monitoring approach.
Conclusions – Overall, future use of the DIDSON technology should consider trade-offs between study objectives, costs and the relative strengths and weaknesses of other technologies. For some applications, DIDSON appears to be superior to underwater optical video, which has been used to evaluate lamprey behavior but is constrained to very specific locales and conditions and has a smaller maximum range under many underwater conditions (Keefer et al. 2010; Eder et al. 2011; Clabough et al. 2012; Thompson et al. 2012). The DIDSON is a relatively new tool for adult Pacific lamprey research and we found that it fills a niche for monitoring un-tagged lamprey at fine-to-moderate spatial scales.
Should lamprey abundance continue to decline, monitoring techniques like DIDSON will be
increasingly necessary to minimize lamprey capture, handling, and tagging, all of which can result in negative delayed effects and mortality (Jepsen et al. 2002; Mesa et al. 2003; Moser et al. 2007a). Use of optical video is most appropriate for questions at small scales (movement through weir orifices, etc.) and telemetry is most useful when population-scale inferences are desired at larger spatial scales. DIDSON will likely be most useful for situations where

53
qualitative behavioral responses to structures or other conditions (e.g., fishway operations) are needed, but where video is inappropriate because of spatial scale or optical conditions.
54
References
Belcher, E. O., H. Q. Dinh, D. C. Lynn and T. J. Laughlin. 1999. Beamforming and imaging with acoustic lenses in small, high-frequency sonars. OCEANS, 1999. MTS/IEEE Conference and Exhibition.
Belcher, E., B. Matsuyama and G. Trimble. 2001. Object identification with acoustic lenses.
OCEANS, 2001. MTS/IEEE Conference and Exhibition. Boswell, K. M., M. P. Wilson, J. H. Cowan, Jr. 2008. A semi automated approach to estimating
fish size, abundance, and behavior from dual-frequency identifications sonar (DIDSON) data. North American Journal of Fisheries Management 28:799-807.
Breder, C. M. 1926. The locomotion of fishes. Zoologica 4:159-256. Caudill, C. C., W. R. Daigle, M. L. Keefer, C. T. Boggs, M. A. Jepson, B. J. Burke, R. W. Zabel,
T. C. Bjornn, and C. A. Peery. 2007. Slow dam passage in Columbia River salmonids associated with unsuccessful migration: delayed negative effects of passage obstacles or condition–dependent mortality? Canadian Journal of Fisheries and Aquatic Sciences 64:979–995.
Clabough, T. S., M. L. Keefer, C. C. Caudill, E. L. Johnson, and C. A. Peery. 2012. Use of night video to enumerate adult Pacific lamprey passage at hydroelectric dams: challenges and opportunities for improved escapement estimation. North American Journal of Fisheries Management 32:687-695. Eder, K., D. Thompson, C. Caudill, and F. Loge. 2011. Video Monitoring of Adult Fish Ladder
Modifications to Improve Pacific Lamprey Passage at the McNary Dam Oregon Shore Fishway, 2010. Report for the U.S. Corps of Engineers, Walla Walla District, Walla Walla, Washington.
Fay, R. R., and A. M. Simmonds. 1999. The sense of hearing in fishes and amphibians. In:
Comparative hearing: fishes and amphibians. Pp. 269-318. In: Fay, R.R. and A.N. Popper (eds). Springer-Verlag, New York.
Holmes, J. A., G. M. W. Cronkite, H. J. Enzenhofer, and T. J. Mulligan. 2006. Accuracy and
precision of fish-count data from a “dual-frequency identification sonar” (DIDSON) imaging system. ICES Journal of Marine Science 63:543-555.
Jepsen, N., A. Koed, E. B. Thorstad, and E. Baras. 2002. Surgical implantation of telemetry
transmitters in fish: how much have we learned? Hydrobiologia 483:239-248. Johnson, E. L., T. S. Clabough, M. L. Keefer, C. C. Caudill, C. A. Peery, and M. L. Moser.
2009. Effects of lowered nighttime velocities on fishway entrance success by Pacific lamprey at Bonneville Dam and fishway use summaries for lamprey at Bonneville and The
55
Dalles dams, 2008. Technical report 2009-10 of Idaho Cooperative Fish and Wildlife Research Unit to U.S. Army Corps of Engineers, Portland District.
Johnson, E. L., C. C. Caudill, T. S. Clabough, M. L. Keefer, M.A. Jepson, and M. L. Moser.
2010. Effects of lowered fishway water velocity on fishway entrance success by adult Pacific lamprey at Bonneville Dam, 2007-2009. Technical report 2010-4 of Idaho Cooperative Fish and Wildlife Research Unit to U.S. Army Corps of Engineers, Portland District.
Johnson, P. N. and B. Le. 2011. Assessment of adult Pacific Lamprey response to velocity
reductions at Wells Dam fishway entrances (DIDSON Study Report). Wells Hydroelectric Project, FERC NO. 2149. Final technical report submitted to Douglas County Public Utility District No. 1, East Wenatchee, Wash.
Johnson, E. L., C. C. Caudill, M. L. Keefer, T. S. Clabough, M. A. Jepson, and M. L. Moser.
2012a. Movement of radio-tagged adult Pacific lamprey during a large-scale fishway velocity experiment. Transactions of the American Fisheries Society 141:571-579.
Johnson, E. L, T. S. Clabough, M. L. Keefer, C. C. Caudill, P. N. Johnson, W. T. Nagy, and M.
A. Jepson. 2012b. Evaluation of Dual Frequency Identification Sonar (DIDSON) for Monitoring Pacific Lamprey Passage Behavior at Fishways of Bonneville Dam, 2011. Technical Report 2012-5 of Idaho Cooperative Fish and Wildlife Research Unit to U.S. Army Corps of Engineers, Portland District.
Keefer, M. L, C. A. Peery, C. C. Caudill, E. L. Johnson, C. T. Boggs, B. Ho, and M. L. Moser.
2009. Adult Pacific lamprey migration in the lower Columbia River: 2008 radiotelemetry and half-duplex PIT tag studies. Technical Report 2009-8 of Idaho Cooperative Fish and Wildlife Research Unit to U.S. Army Corps of Engineers, Portland District.
Keefer, M. L., W. R. Daigle, C. A. Peery, H. T. Pennington, S. R. Lee, and M. L. Moser. 2010.
Testing adult Pacific lamprey performance at structural challenges in fishways. North American Journal of Fisheries Management 30:376-385.
Keefer, M. L., C. A. Peery, S. R. Lee, W. R. Daigle, E. L. Johnson, and M. L. Moser. 2011.
Behavior of adult Pacific lampreys in near–field flow and fishway design experiments. Fisheries Management and Ecology 18:177–189.
Keefer, M. L., C. C. Caudill, C. A. Peery, and M. L. Moser. 2013a. Context-dependent diel
behavior of upstream-migrating anadromous fishes. Environmental Biology of Fishes DOI 10.1007/s10641-012-0059-5.
Keefer, M. L., C. T. Boggs, C. A. Peery, and C. C. Caudill. 2013b. Factors affecting dam
passage and upstream distribution of adult Pacific lamprey in the interior Columbia River basin. Ecology of Freshwater Fish 22:1-10.
56
Keefer, M. L., T. C. Clabough, M. A. Jepson, E. L. Johnson, C. T. Boggs, and C. C. Caudill. 2013c. Adult Pacific lamprey passage: data synthesis and fishway improvement prioritization tools. Technical Report 2012-8 of the Fish and Wildlife Sciences Department to U.S. Army Corps of Engineers, Portland District.
Kent, P.S., T. Tsuzaki, and M. L. Moser. 2009. Linking behavior and performance: intermittent
locomotion in a climbing fish. Journal of Zoology 277:171-178. Mesa, M. G., J. M. Bayer, and J. G. Seelye. 2003. Swimming performance and physiological response to exhaustive exercise in radio-tagged and untagged Pacific lamprey. Transactions
of the American Fisheries Society 132:483-492. Mesa, M. G., R. J. Magie, and E. S. Copeland. 2010. Passage and behavior of radio-tagged adult
Pacific lampreys (Entosphenus tridentatus) at the Willamette Falls Project, Oregon. Northwest Science 84:233-242.
Moser, M. L., P. A. Ocker, L. C. Stuehrenberg, and T. C. Bjornn. 2002. Passage efficiency of
adult Pacific lamprey at hydropower dams on the lower Columbia River, USA. Transactions of the American Fisheries Society 131:956–965.
Moser, M. L., D. A. Ogden, and B. P. Sanford. 2007a. Effects of surgically implanted
transmitters on anguilliform fishes: lessons from lamprey. Journal of Fish Biology 71:1847-1852.
Moser, M. L., J. M. Butzerin, and D. B. Dey. 2007b. Capture and collection of lampreys: the
state of the science. Reviews in Fish Biology and Fisheries 17:45-56. Moursund, R. A., T. J. Carlson, and R. D. Peters. 2003. A fisheries application of a dual-
frequency identification sonar acoustic camera. ICES Journal of Marine Science 60:678-683. Mueller, A., D. L. Burwen, K. M. Boswell, and T. Mulligan. 2010. Tail-beat patterns in dual-
frequency identification sonar echograms and their potential use for species specific identification and bioenergetics studies. Transactions of the American Fisheries Society 139:900-910.
Ransom, B .H. 1991. Using sound waves to monitor fish entrainment. Hydro Review. 10(4). Ransom, B. H., and T. W. Steig. 1994. Using hydroacoustics to monitor fish at hydropower
dams. Lake and Reservoir Management 9(1):163-169. Ransom, B. H., T. W. Steig, and P. A. Nealson. 1996. Comparison of hydroacoustic and net
catch estimates of Pacific salmon smolt (Oncorhynchus spp.) passage at hydropower dams in the Columbia River Basin. ICES Journal of Marine Science 53:477-481.
Sound Metrics Corp. DIDSON Sonar 101: Getting good images with DIDSON.
Available: http://www.didson.com/SONAR101/sn_sonar101.html. (2012).
57
Steig, T. W. 1994. Review of spring and summer spill effectiveness for juvenile salmon and
steelhead at various Columbia and Snake river dams 1983-1992. Lake and Reservoir Management 9(1):154-162.
Steig, T. W., and T. K. Iverson. 1998. Acoustic monitoring of salmonid density, target strength,
and trajectories at two dams on the Columbia River, using a split-beam scanning system. River Research 35:43-53.
Thompson, D., C.C. Caudill, C. Negrea, and F. Loge. 2012. Monitoring Fish Ladder
Modifications Designed to Improve Pacific Lamprey Passage Using Underwater Video at McNary and Ice Harbor Dams, 2011. Draft report to the US Army Corps of Engineers, Walla Walla District.
Thorne, R. E., and G. E. Johnson. 1993. A review of hydroacoustic studies for estimation of
salmonid downriver migration past hydroelectric facilities on the Columbia and Snake rivers in the 1980’s. Reviews in Fisheries Science 1(1):27-56.
Tiffan, K. F., D. W. Rondorf, and J. J. Skalicky. 2004. Imaging fall Chinook salmon redds in
the Columbia River with a dual-frequency identification sonar. North American Journal of Fisheries Management 24:1421-1426.
Tiffan, K. F., D. W. Rondorf, and J. J. Skalicky. 2005. Diel spawning behavior of chum salmon
in the Columbia River. Transactions of the American Fisheries Society 134:892-900.
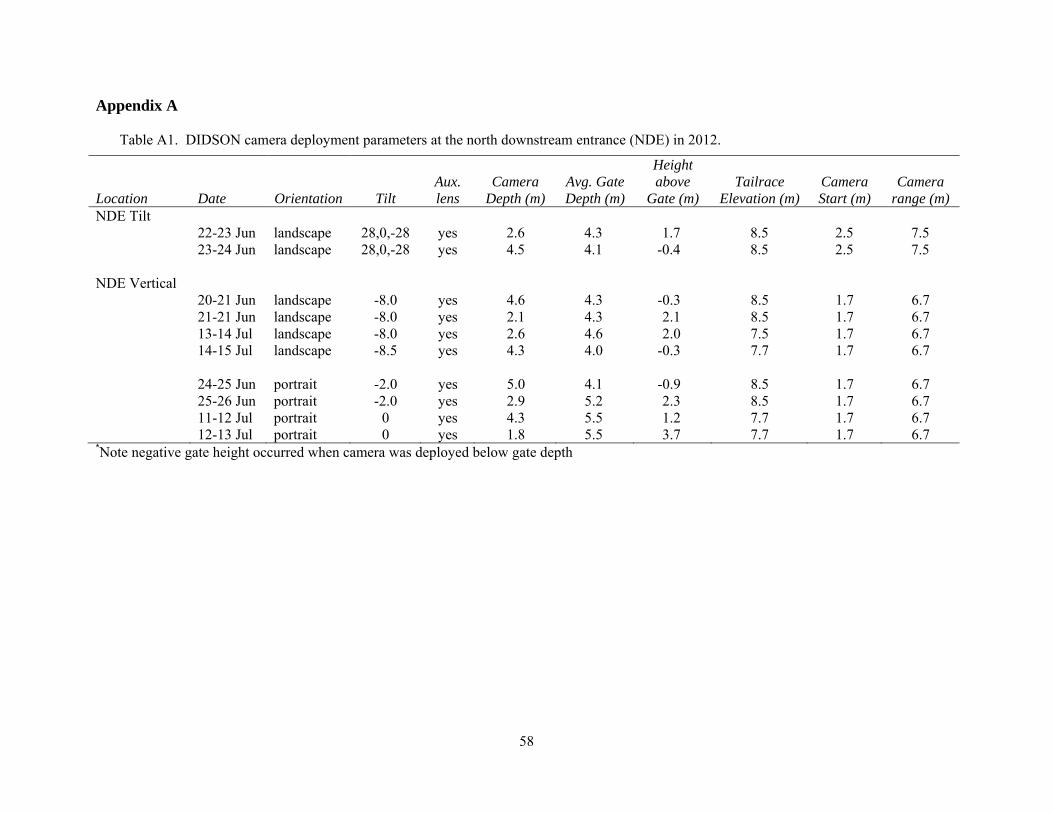
58
Appendix A Table A1. DIDSON camera deployment parameters at the north downstream entrance (NDE) in 2012.
*Note negative gate height occurred when camera was deployed below gate depth
Location
Date
Orientation
Tilt Aux. lens
Camera Depth (m)
Avg. Gate Depth (m)
Height above
Gate (m) Tailrace
Elevation (m) Camera Start (m)
Camera range (m)
NDE Tilt 22-23 Jun landscape 28,0,-28 yes 2.6 4.3 1.7 8.5 2.5 7.5 23-24 Jun landscape 28,0,-28 yes 4.5 4.1 -0.4 8.5 2.5 7.5 NDE Vertical 20-21 Jun landscape -8.0 yes 4.6 4.3 -0.3 8.5 1.7 6.7 21-21 Jun landscape -8.0 yes 2.1 4.3 2.1 8.5 1.7 6.7 13-14 Jul landscape -8.0 yes 2.6 4.6 2.0 7.5 1.7 6.7 14-15 Jul landscape -8.5 yes 4.3 4.0 -0.3 7.7 1.7 6.7 24-25 Jun portrait -2.0 yes 5.0 4.1 -0.9 8.5 1.7 6.7 25-26 Jun portrait -2.0 yes 2.9 5.2 2.3 8.5 1.7 6.7 11-12 Jul portrait 0 yes 4.3 5.5 1.2 7.7 1.7 6.7 12-13 Jul portrait 0 yes 1.8 5.5 3.7 7.7 1.7 6.7
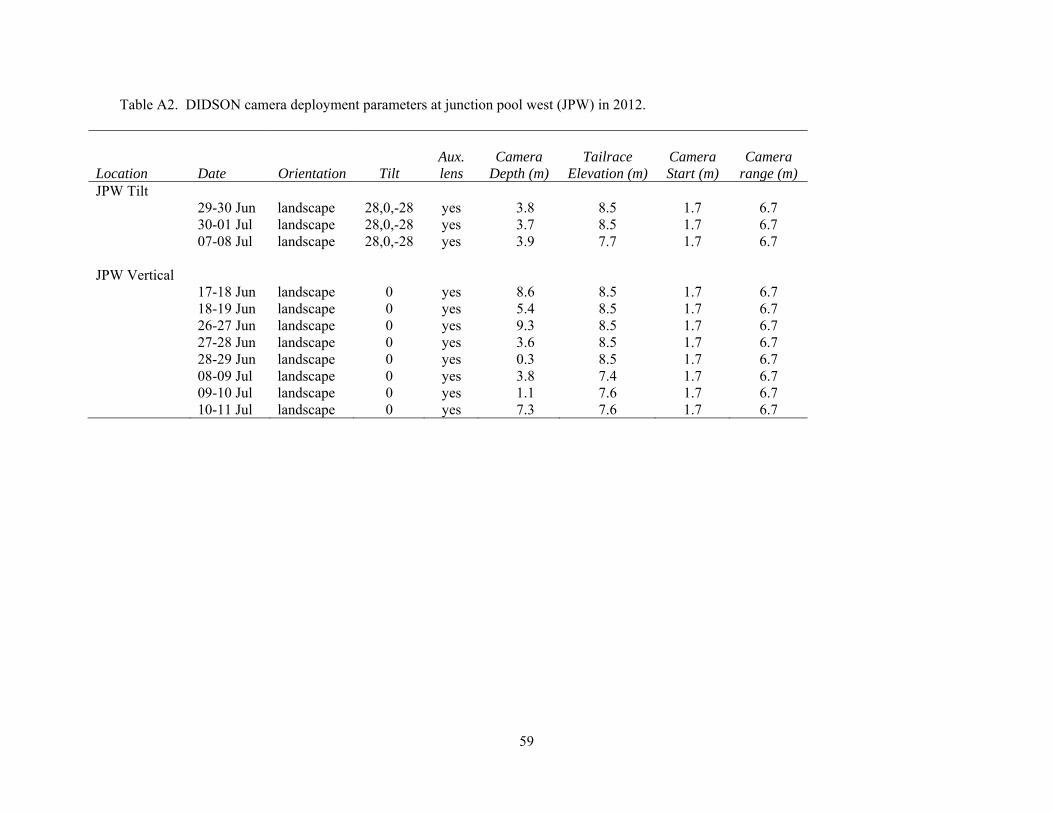
59
Table A2. DIDSON camera deployment parameters at junction pool west (JPW) in 2012.
Location
Date
Orientation
Tilt Aux. lens
Camera Depth (m)
Tailrace Elevation (m)
Camera Start (m)
Camera range (m)
JPW Tilt 29-30 Jun landscape 28,0,-28 yes 3.8 8.5 1.7 6.7 30-01 Jul landscape 28,0,-28 yes 3.7 8.5 1.7 6.7 07-08 Jul landscape 28,0,-28 yes 3.9 7.7 1.7 6.7 JPW Vertical 17-18 Jun landscape 0 yes 8.6 8.5 1.7 6.7 18-19 Jun landscape 0 yes 5.4 8.5 1.7 6.7 26-27 Jun landscape 0 yes 9.3 8.5 1.7 6.7 27-28 Jun landscape 0 yes 3.6 8.5 1.7 6.7 28-29 Jun landscape 0 yes 0.3 8.5 1.7 6.7 08-09 Jul landscape 0 yes 3.8 7.4 1.7 6.7 09-10 Jul landscape 0 yes 1.1 7.6 1.7 6.7 10-11 Jul landscape 0 yes 7.3 7.6 1.7 6.7
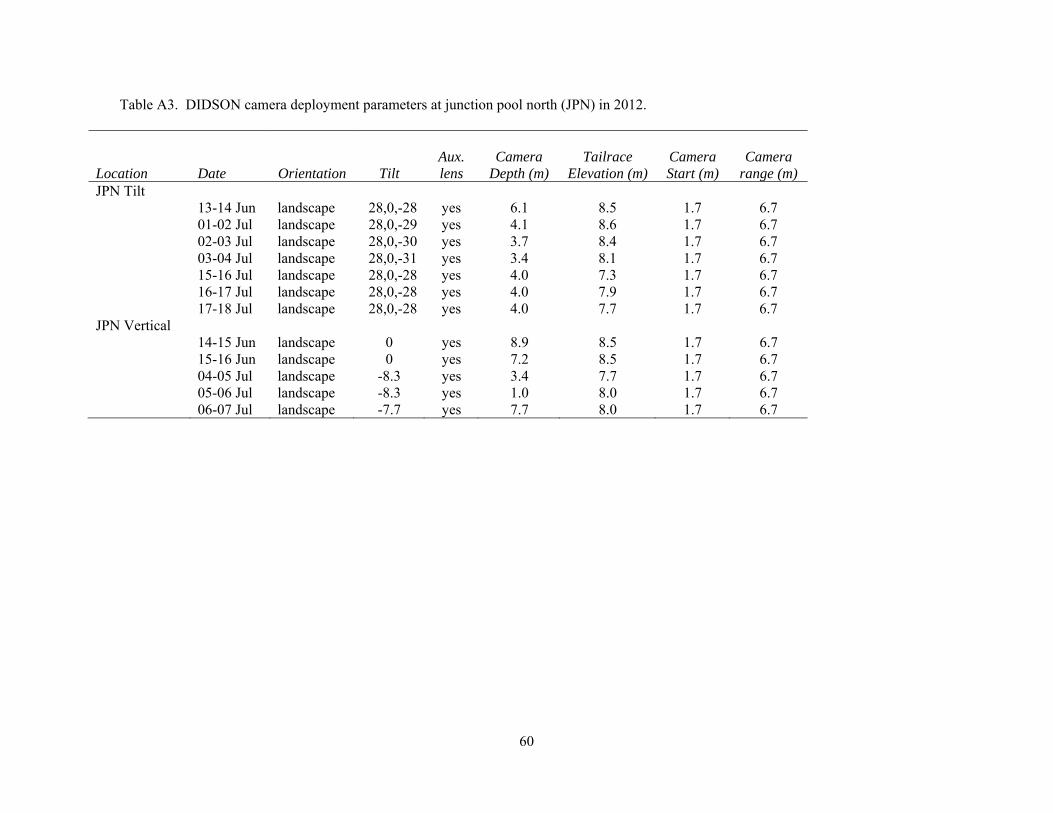
60
Table A3. DIDSON camera deployment parameters at junction pool north (JPN) in 2012.
Location
Date
Orientation
Tilt Aux. lens
Camera Depth (m)
Tailrace Elevation (m)
Camera Start (m)
Camera range (m)
JPN Tilt 13-14 Jun landscape 28,0,-28 yes 6.1 8.5 1.7 6.7 01-02 Jul landscape 28,0,-29 yes 4.1 8.6 1.7 6.7 02-03 Jul landscape 28,0,-30 yes 3.7 8.4 1.7 6.7 03-04 Jul landscape 28,0,-31 yes 3.4 8.1 1.7 6.7 15-16 Jul landscape 28,0,-28 yes 4.0 7.3 1.7 6.7 16-17 Jul landscape 28,0,-28 yes 4.0 7.9 1.7 6.7 17-18 Jul landscape 28,0,-28 yes 4.0 7.7 1.7 6.7 JPN Vertical 14-15 Jun landscape 0 yes 8.9 8.5 1.7 6.7 15-16 Jun landscape 0 yes 7.2 8.5 1.7 6.7 04-05 Jul landscape -8.3 yes 3.4 7.7 1.7 6.7 05-06 Jul landscape -8.3 yes 1.0 8.0 1.7 6.7 06-07 Jul landscape -7.7 yes 7.7 8.0 1.7 6.7
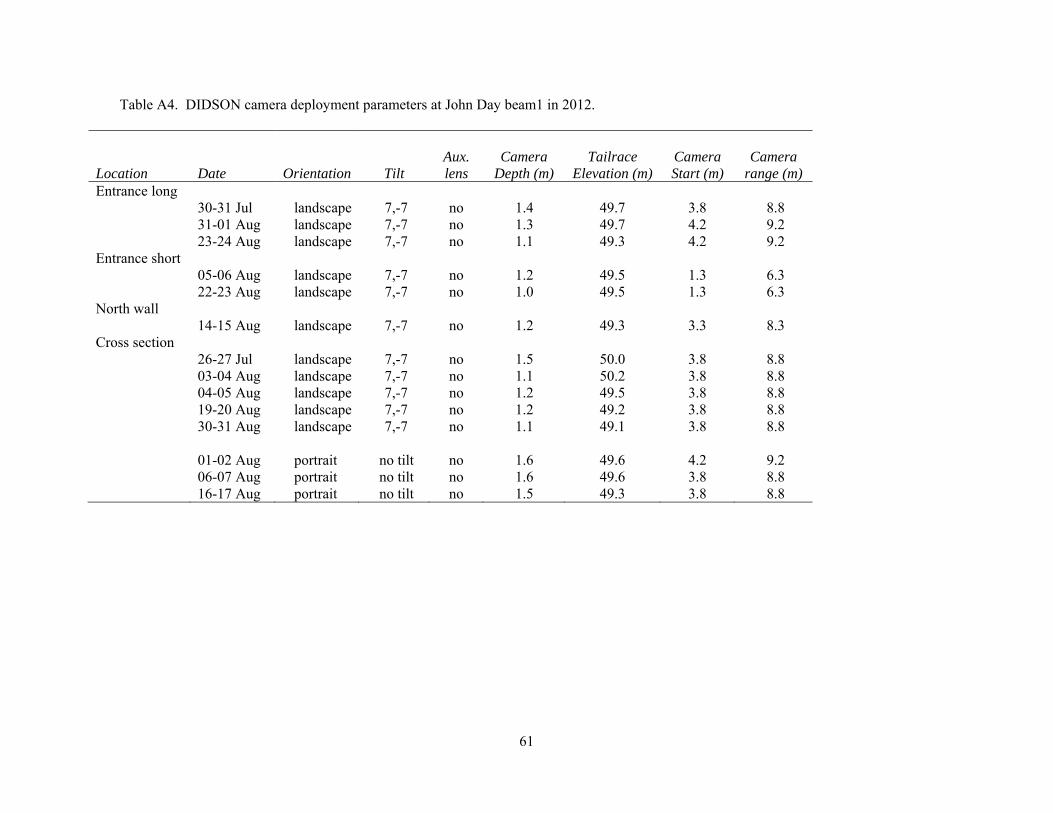
61
Table A4. DIDSON camera deployment parameters at John Day beam1 in 2012.
Location
Date
Orientation
Tilt Aux. lens
Camera Depth (m)
Tailrace Elevation (m)
Camera Start (m)
Camera range (m)
Entrance long 30-31 Jul landscape 7,-7 no 1.4 49.7 3.8 8.8 31-01 Aug landscape 7,-7 no 1.3 49.7 4.2 9.2 23-24 Aug landscape 7,-7 no 1.1 49.3 4.2 9.2 Entrance short 05-06 Aug landscape 7,-7 no 1.2 49.5 1.3 6.3 22-23 Aug landscape 7,-7 no 1.0 49.5 1.3 6.3 North wall 14-15 Aug landscape 7,-7 no 1.2 49.3 3.3 8.3 Cross section 26-27 Jul landscape 7,-7 no 1.5 50.0 3.8 8.8 03-04 Aug landscape 7,-7 no 1.1 50.2 3.8 8.8 04-05 Aug landscape 7,-7 no 1.2 49.5 3.8 8.8 19-20 Aug landscape 7,-7 no 1.2 49.2 3.8 8.8 30-31 Aug landscape 7,-7 no 1.1 49.1 3.8 8.8 01-02 Aug portrait no tilt no 1.6 49.6 4.2 9.2 06-07 Aug portrait no tilt no 1.6 49.6 3.8 8.8 16-17 Aug portrait no tilt no 1.5 49.3 3.8 8.8

62
Table A5. DIDSON camera deployment parameters at John Day beam2 in 2012.
Table A6. DIDSON camera deployment parameters at John Day beam3 in 2012.
Location
Date
Orientation
Tilt Aux. lens
Camera Depth (m)
Tailrace Elevation (m)
Camera Start (m)
Camera range (m)
North wall 13-14 Aug landscape 7,-7 no 1.1 49.5 3.3 8.3 Cross section 07-08 Aug landscape 7,-7 no 1.1 49.5 3.8 8.8 18-19 Aug landscape 7,-7 no 1.1 49.3 3.8 8.8 26-27 Aug landscape 7,-7 no 1.1 49.1 3.8 8.8
Location
Date
Orientation
Tilt Aux. lens
Camera Depth (m)
Tailrace Elevation (m)
Camera Start (m)
Camera range (m)
North wall 15-16 Aug landscape 7,-7 no 1.2 49.4 3.3 8.3 Cross section 09-10 Aug landscape 7,-7 no 1.4 49.4 3.8 8.8 20-21 Aug landscape 7,-7 no 1.2 49.5 3.8 8.8 27-28 Aug landscape 7,-7 no 1.3 49.3 3.8 8.8 Cross section turnpool 08-09 Aug landscape 7,-7 no 1.4 49.5 2.9 7.9 21-22 Aug landscape 7,-7 no 1.1 49.2 2.9 7.9 28-29 Aug landscape 7,-7 no 1.2 49.1 2.9 7.9
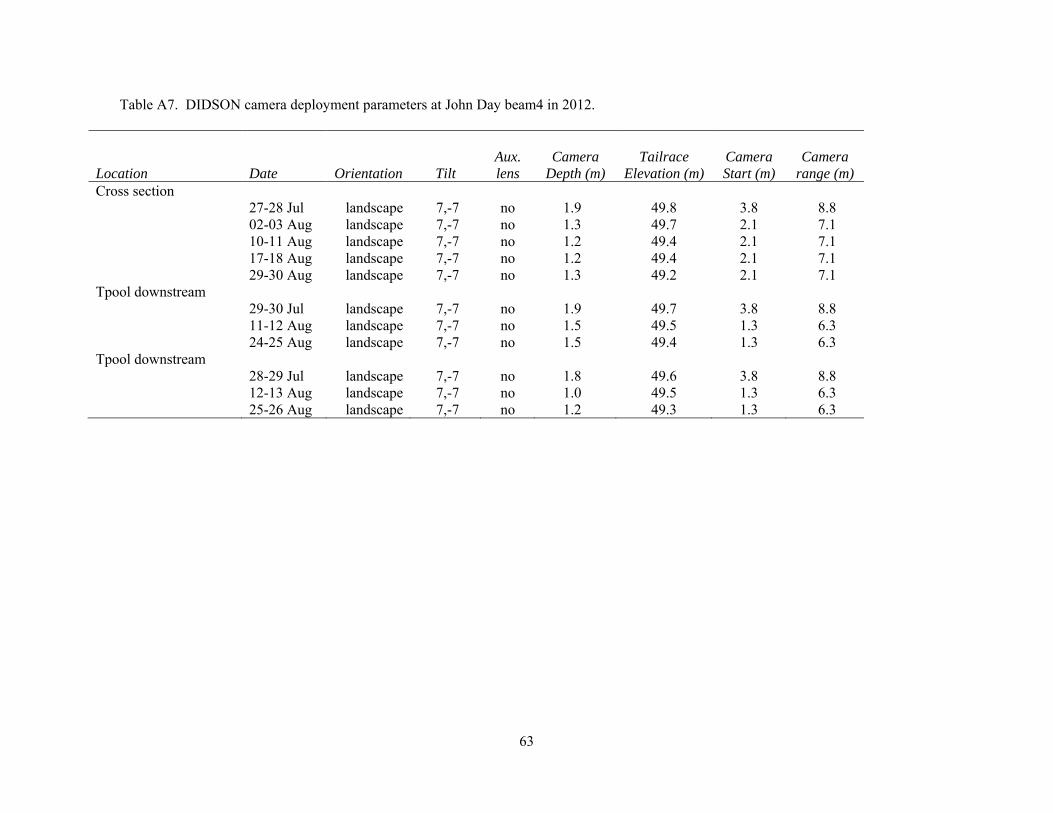
63
Table A7. DIDSON camera deployment parameters at John Day beam4 in 2012.
Location
Date
Orientation
Tilt Aux. lens
Camera Depth (m)
Tailrace Elevation (m)
Camera Start (m)
Camera range (m)
Cross section 27-28 Jul landscape 7,-7 no 1.9 49.8 3.8 8.8 02-03 Aug landscape 7,-7 no 1.3 49.7 2.1 7.1 10-11 Aug landscape 7,-7 no 1.2 49.4 2.1 7.1 17-18 Aug landscape 7,-7 no 1.2 49.4 2.1 7.1 29-30 Aug landscape 7,-7 no 1.3 49.2 2.1 7.1 Tpool downstream 29-30 Jul landscape 7,-7 no 1.9 49.7 3.8 8.8 11-12 Aug landscape 7,-7 no 1.5 49.5 1.3 6.3 24-25 Aug landscape 7,-7 no 1.5 49.4 1.3 6.3 Tpool downstream 28-29 Jul landscape 7,-7 no 1.8 49.6 3.8 8.8 12-13 Aug landscape 7,-7 no 1.0 49.5 1.3 6.3 25-26 Aug landscape 7,-7 no 1.2 49.3 1.3 6.3
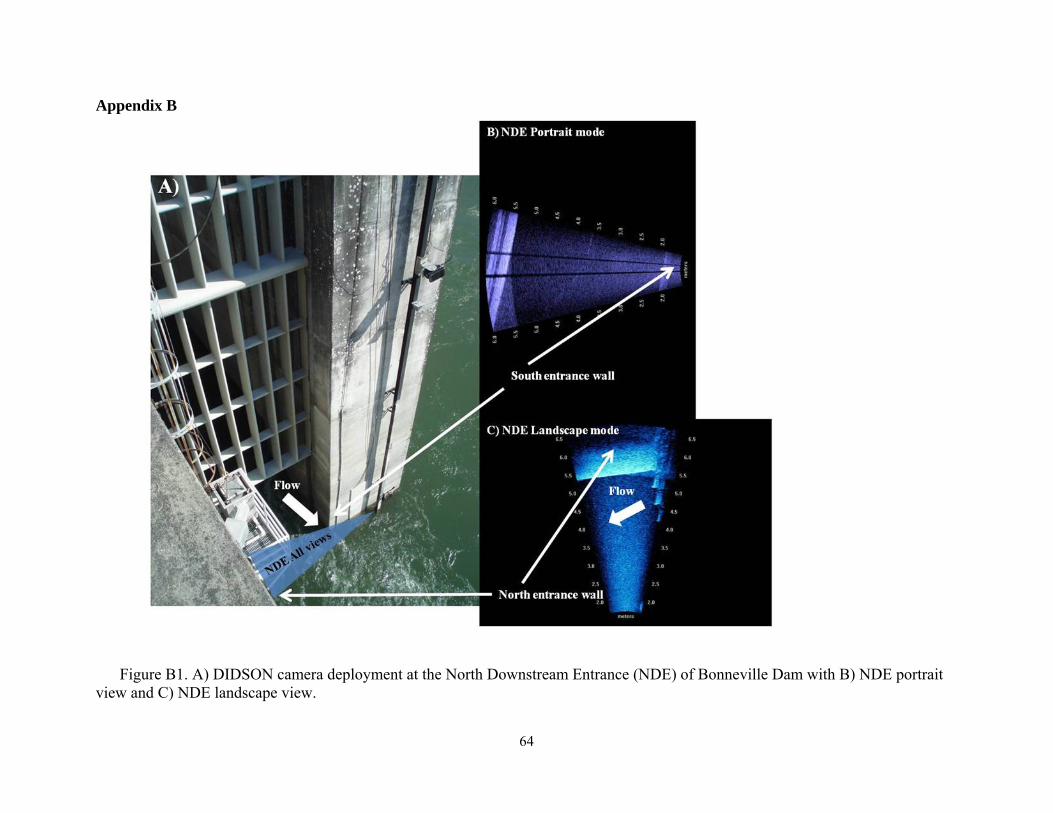
64
Appendix B
Figure B1. A) DIDSON camera deployment at the North Downstream Entrance (NDE) of Bonneville Dam with B) NDE portrait view and C) NDE landscape view.
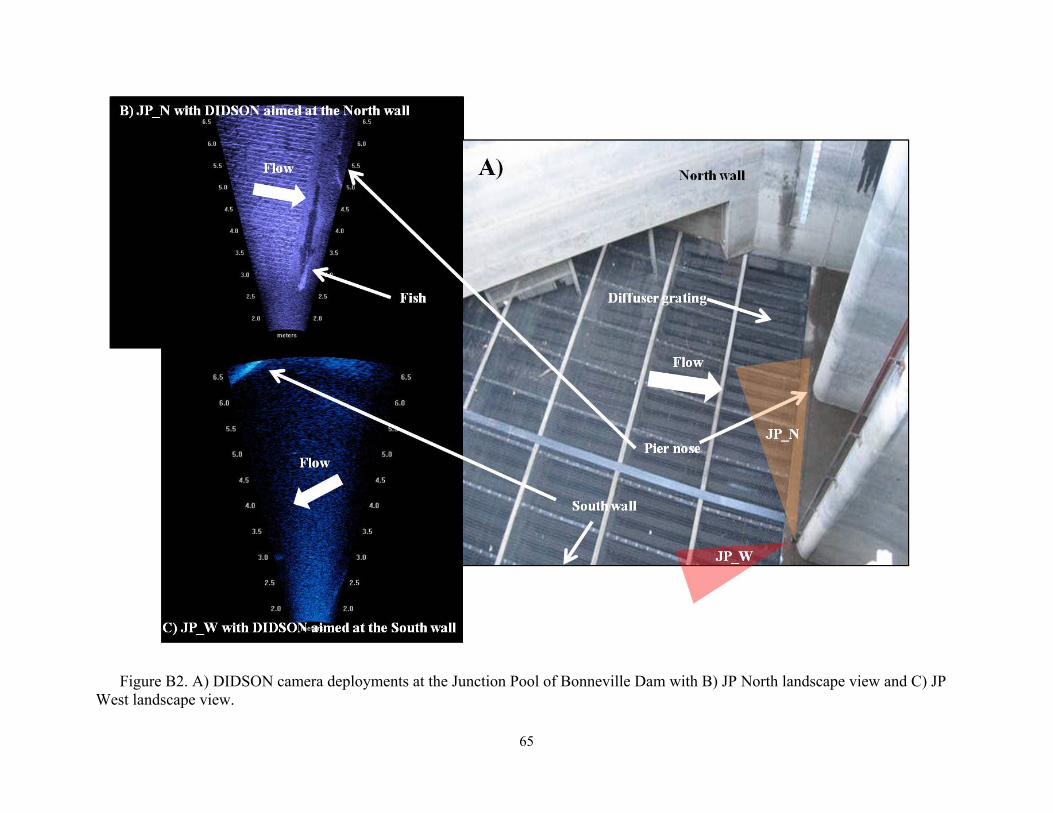
65
Figure B2. A) DIDSON camera deployments at the Junction Pool of Bonneville Dam with B) JP North landscape view and C) JP
West landscape view.
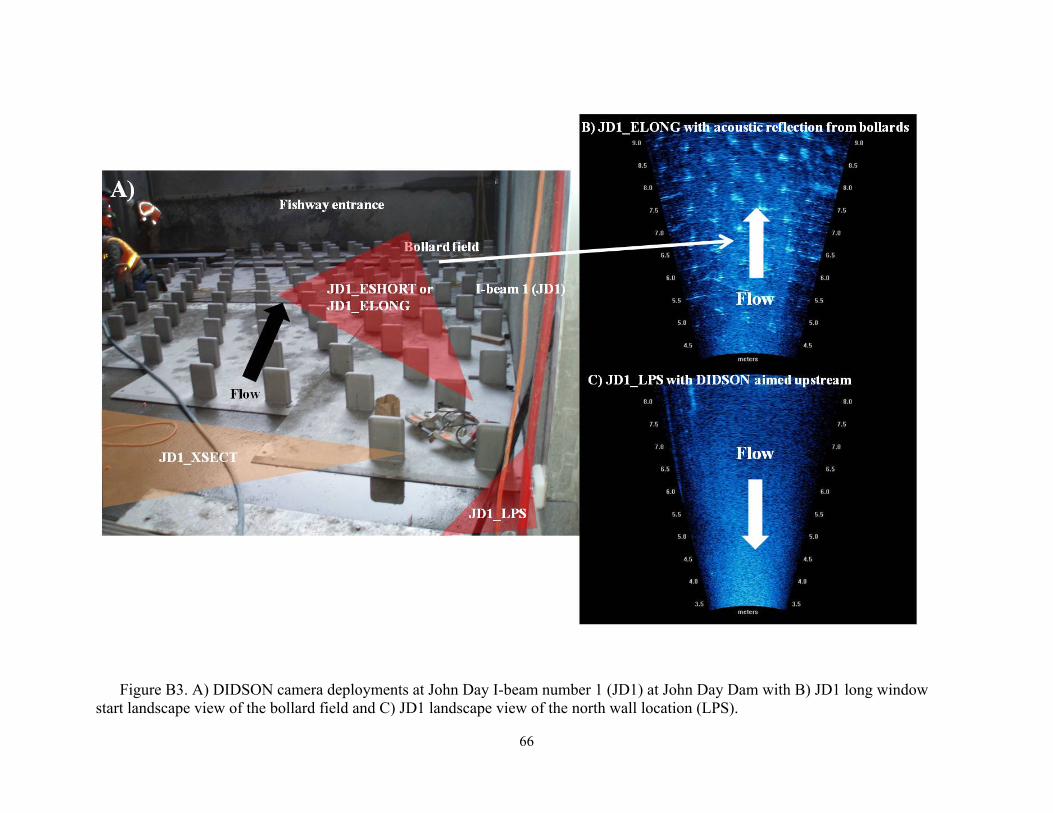
66
Figure B3. A) DIDSON camera deployments at John Day I-beam number 1 (JD1) at John Day Dam with B) JD1 long window start landscape view of the bollard field and C) JD1 landscape view of the north wall location (LPS).
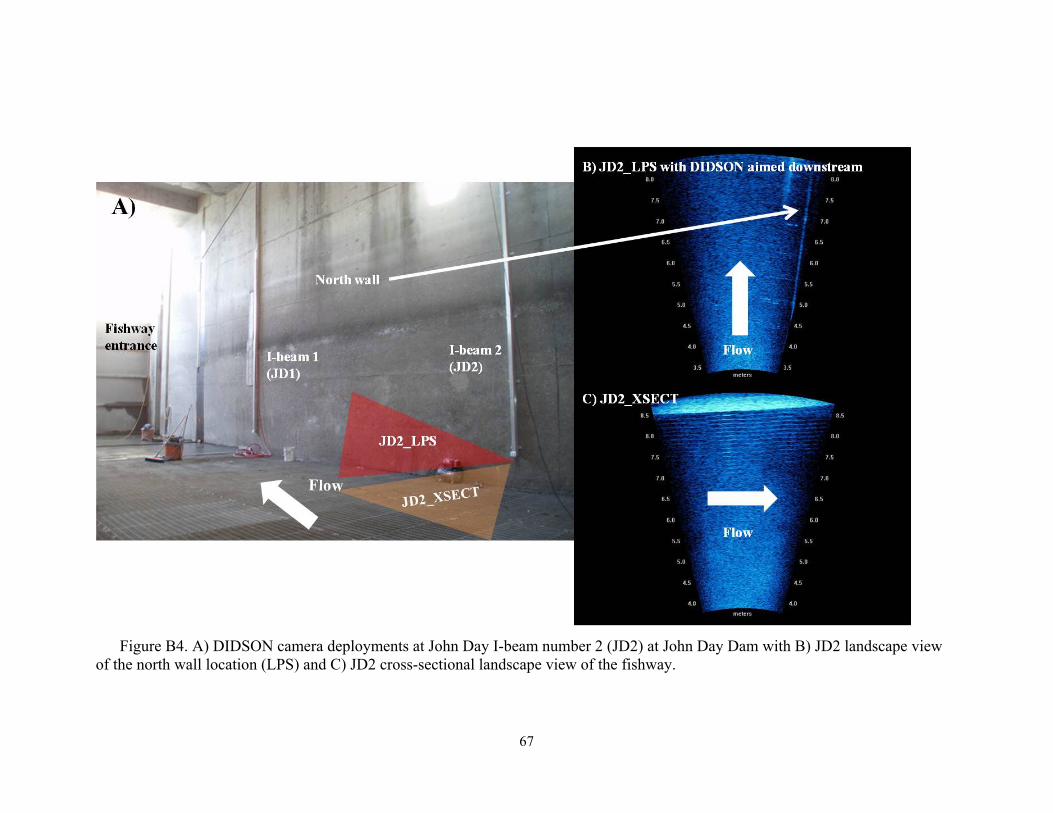
67
Figure B4. A) DIDSON camera deployments at John Day I-beam number 2 (JD2) at John Day Dam with B) JD2 landscape view
of the north wall location (LPS) and C) JD2 cross-sectional landscape view of the fishway.
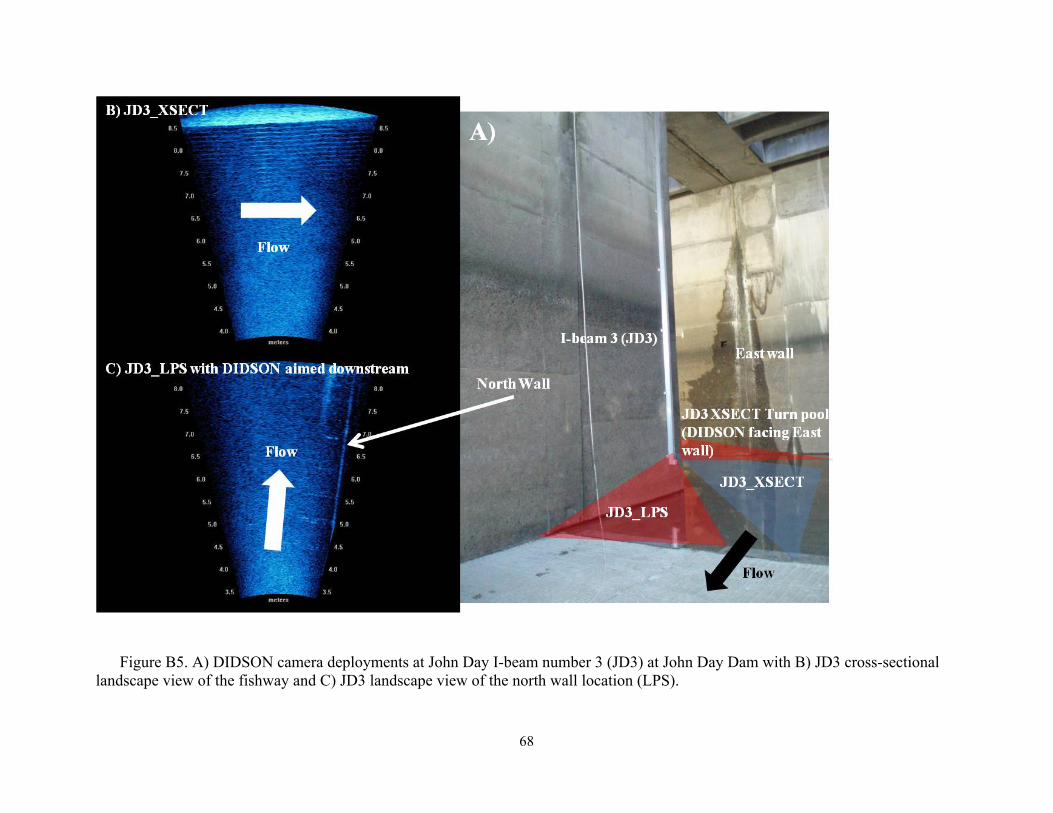
68
Figure B5. A) DIDSON camera deployments at John Day I-beam number 3 (JD3) at John Day Dam with B) JD3 cross-sectional landscape view of the fishway and C) JD3 landscape view of the north wall location (LPS).
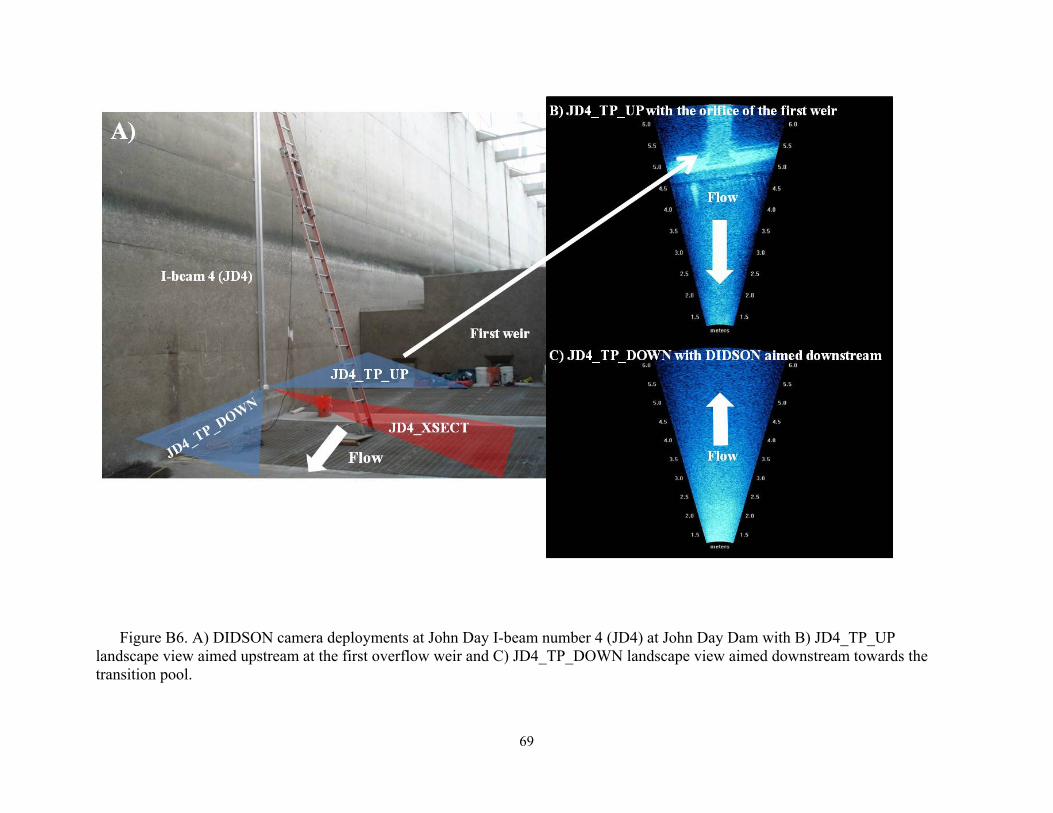
69
Figure B6. A) DIDSON camera deployments at John Day I-beam number 4 (JD4) at John Day Dam with B) JD4_TP_UP
landscape view aimed upstream at the first overflow weir and C) JD4_TP_DOWN landscape view aimed downstream towards the transition pool.
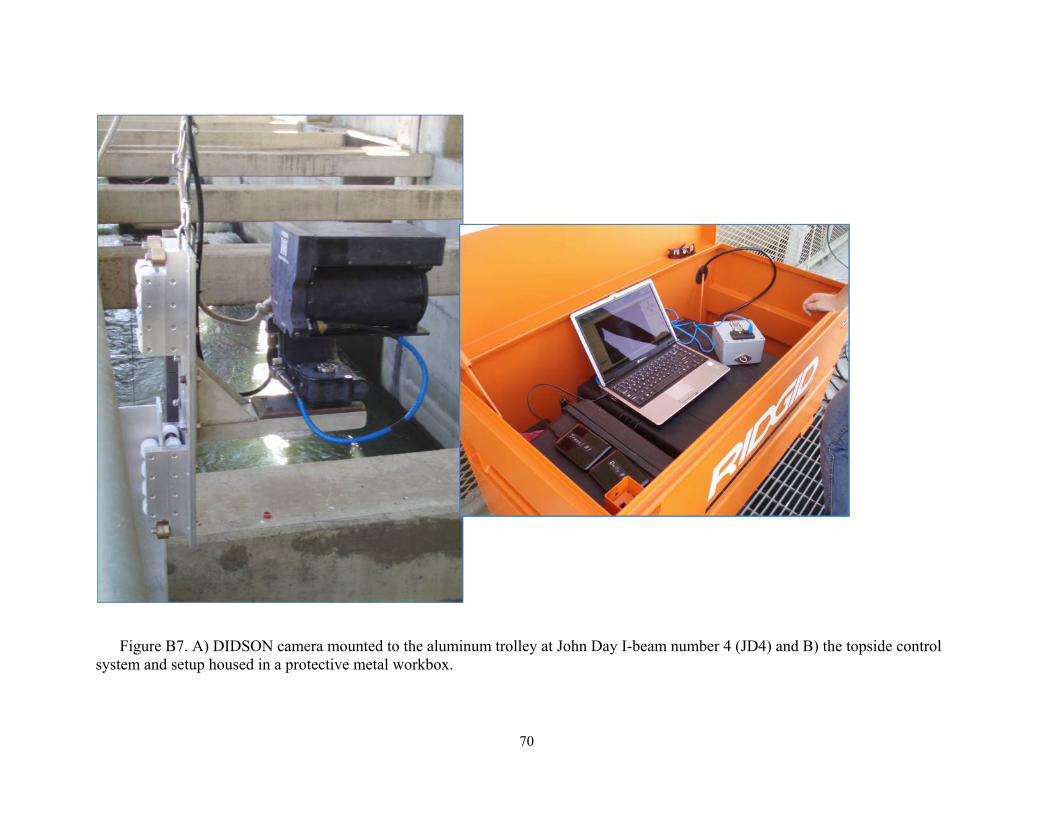
70
Figure B7. A) DIDSON camera mounted to the aluminum trolley at John Day I-beam number 4 (JD4) and B) the topside control
system and setup housed in a protective metal workbox.