EVALUATION OF CYP2D6 PHENOTYPE IN A YORUBA NIGERIAN …
177
i EVALUATION OF CYP2D6 PHENOTYPE IN A YORUBA NIGERIAN POPULATION A DISSERTATION SUBMITTED TO THE NATIONAL POSTGRADUATE MEDICALCOLLEGE OF NIGERIA (NPMCN) IN PARTIAL FULFILMENT OF THE REQUIREMENTS FOR THE AWARD OF FELLOWSHIP IN CLINICAL PHARMACOLOGY & THERAPEUTICS (CPT) OF THE FACULTY OF INTERNAL MEDICINE. BY DR. WAHEED ADEOLA ADEDEJI MBBS (Ogbomoso) 2004, MSc Pharmacology& Therapeutics (Ibadan) 2014 AF/009/11/001/812 DEPARTMENT OF CLINICAL PHARMACOLOGY, UNIVERSITY COLLEGE HOSPITAL, IBADAN, NIGERIA NOVEMBER 2016
Transcript of EVALUATION OF CYP2D6 PHENOTYPE IN A YORUBA NIGERIAN …
i
EVALUATION OF CYP2D6 PHENOTYPE IN A YORUBA
NIGERIAN POPULATION
A DISSERTATION SUBMITTED TO THE NATIONAL POSTGRADUATE
MEDICALCOLLEGE OF NIGERIA (NPMCN) IN PARTIAL FULFILMENT OF THE
REQUIREMENTS FOR THE AWARD OF FELLOWSHIP IN CLINICAL
PHARMACOLOGY & THERAPEUTICS (CPT) OF THE FACULTY OF
INTERNAL MEDICINE.
BY
DR. WAHEED ADEOLA ADEDEJI
MBBS (Ogbomoso) 2004, MSc Pharmacology& Therapeutics (Ibadan) 2014
AF/009/11/001/812
DEPARTMENT OF CLINICAL PHARMACOLOGY,
UNIVERSITY COLLEGE HOSPITAL, IBADAN, NIGERIA
NOVEMBER 2016

ii
DECLARATION
I hereby declare that this dissertation is the result of my research findings and has not been
presented elsewhere for the award of any degree or diploma.
………………………………………… …………………………………
Dr. Waheed Adeola Adedeji Date
iii
CERTIFICATION BY SUPERVISOR
I certify that this work was carried out by Dr. Waheed Adeola Adedeji in the Department of
Clinical Pharmacology, University College Hospital, Ibadan, under my supervision.
……………………………………………………….
Supervisor
Professor F. A. Fehintola
MBBS (Ib), M.Sc. (Pharmacology &Therapeutics), FMCP (Clinical Pharmacology)
Department of Clinical Pharmacology, University College Hospital,
Ibadan Nigeria
iv
CERTIFICATION BY THE HEAD OF DEPARTMENT
I certify that Dr. Waheed Adeola Adedeji of the Department of Clinical Pharmacology,
University College Hospital, Ibadan undertook the dissertation work under the guidance of the
above supervisor.
………………………………………… ………………………………
Professor Catherine O. Falade Date
MBBS, MSc, FMCP, FWACP
Head,
Department of Clinical Pharmacology,
University College Hospital, Ibadan, Nigeria.

v
DEDICATION
This work is dedicated to all my teachers, and my mother, Chief (Mrs.) Silifat Nike Aleem
Adedeji for her sacrifice towards my education.
vi
ACKNOWLEDGEMENT
All praises and adorations belong to Almighty Allah. May His peace and blessing be upon the
noble soul of the Prophet Muhammad (SAW).
The CMD, Prof. T.O. Alonge and the management of the University College Hospital, Ibadan is
appreciated for the enabling environment provided for my training.
I wish to express my profound gratitude to my supervisor and mentor, Prof. F.A. Fehintola for
his mentorship. I equally appreciate the Head of Department, Prof. Catherine O. Falade for her
encouragement and support. I appreciate my other trainers in the Department, Prof. A. Sowumi,
and Dr. Aduragbenro D. Adedapo. Also, to my teachers, Prof. Adekunle O. George, Prof. Bola
Ogunbiyi, Prof. Adesola Ogunniyi, Prof B.L. Salako, Dr. Arinola Esan, Dr. A.M. Adeoye, Dr.
Yemi R. Raji and all other Consultants in the Department of Medicine for the opportunity to
learn under your tutelage.
Dr. Titi Fakeye of the Department of Clinical Pharmacy and Dr. Ibrahim Oladosu of the
Department of Chemistry, University of Ibadan are appreciated for their immense contribution
towards the completion of my research work. I sincerely appreciate Dr. Sharon Igbinoba of the
Department of Clinical Pharmacy, Obafemi Awolowo University (OAU), Ile-Ife, for her support
and contribution that ensured the completion of my research work.
The Director, Prof. C.A. Obafemi, Mr. M. Adegoke, Mr. Akinola, and other staff of the Central
Science Laboratory, OAU, Ile-Ife are appreciated for providing me with enabling environment
that led to the eventual analysis of my work.
I am grateful to Prof. Jan Juřica, Clinical Pharmacology Department, Faculty of Medicine, Brno,
Czech Republic for the detailed methods of Zinova et. al and her own, despite the former was
written in Czech. This information was a turning point in my work.
I appreciate Mr and Mrs. Olomu of Haematology and Medicine laboratory Departments for their
assistance in the haematological and biochemical analysis of the samples.
Mr. Rotimi Olatunde, Department of Pharmacology and Therapeutics, University of Ibadan
contributed immensely in samples handling. My appreciation also goes to Mr. Nathaniel K.

vii
Afolabi, Department of Paediatrics for supporting the sample storage. Staff of Clinical
Pharmacology Department UCH, represented by Mr. M. Lateef, Mrs. J. Ekwesianya, Mrs. Tawa
Adediran and Mrs. Alake are appreciated for their support during the enrolment stage. I
appreciate Mr. Isa Muideen for his assistance during the enrolment stage and for data entry.
I must acknowledge Mrs. Korede and other staff of Multidisciplinary Central Research
Laboratory, University of Ibadan for introducing me to the HPLC. Drs Ismail and Bolarinwa are
appreciated for their hospitality during my stay in Ile-Ife.
I want to thank Dr. Tunde Adedokun and Dr. Bidemi Yusuf of the Epidemiology and Medical
Statistics Department, University of Ibadan for their assistance in the statistical analysis of this
work. Drs Nurain Azeez and Abdullah Akinniran are appreciated for their prayer and support.
My participants are appreciated for their contribution because without them I would not have had
the opportunity of completing this research work.
Prof. Ambrose Isa is appreciated for his fatherly care especially for the trainee in the Clinical
Pharmacology and Therapeutics subspecialty.
My special appreciation goes to my parents, Chief (Mrs.) Silifat Nike Aleem-Adedeji and Mr.
Moyosade Aleem Adedeji for their care and love. I equally thank my siblings, Mrs. D.O. Sulola,
Mr. Ismail Aleem, Miss Rukayat Ajebola Aleem and Mrs. Awawu Opeyemi Seidu for their
support and prayer.
I wish to thank Alhaja Saudat Fehintola for words of encouragement and support. To my
brothers, AbdulBasit and Rafiq, I appreciate you all.
I sincerely appreciate my love and soulmate, Princess Bilikisu Oluwakemi Adedeji (nee
Oladunmoye) for her care, love, sacrifice and support. To our children, Abdul Rahman Adeoye,
Khadijah Adebukola, Taofeekah Adeola, Maryam Aderinsola and Hafsah Igbayilola, I appreciate
your sacrifice and support.
Waheed Adeola Adedeji
January 2016
viii
TABLE OF CONTENTS
CONTENT PAGE
Title Page…………………………………………………………………………………..........i
Declaration……………………………………………………………………………………...ii
Certification by Supervisor…………………………………………………………..................iii
Certification by Head of Department…….…………………………………………..................iv
Dedication………….. ……………………………………………………………………….......v
Acknowledgement……………………………………………………………….........................vi
Table of Contents………………………………………………………………………….........viii
List of Tables…………………………………………………………………............................xii
List of Figures…………………………………………………………………...........................xiv
List of Appendices………………………………………………………………………………xvi
List of
Abbreviations………………………………………………………………....................xvii
Abstract………………………………………………………………………………………......xx
CHAPTER ONE: INTRODUCTION ……………………………………………………………1
1.1 Statement of problem……………………………………………………………..3
1.2 Rationale………………………………………………………………………….4
1.3 Aims and Objectives……………………………………………………………...5
CHAPTER TWO: LITERATURE REVIEW…………………………………………………….6
2.1 Background………………………………………………………………………..6
2.2 Racial/individual variation in drug
handling……………………………………..11

ix
2.3 Pharmacogenomics, Pharmacovigilance and Pharmacoepidemiology…………..12
2.4 Clinical Application of Pharmacogenetics……………………………………….15
2.5 Challenges…………………………………………………………………….18
2.6 Drug Metabolism……………………………………………………………..20
2.6.1. Enzymes involved in Drug Metabolism………………………………………24
2.6.2. Phase 1 Metabolism…………………..………………………………………..27
2.6.2.1. Oxidation Reactions involving Cytochrome P450 Enzyme System…..27
2.6.2.2. Oxidation Reactions not catalyzed by Cytochrome P450 Enzyme
System…………………………………………………………………..28
2.6.2.3. Reductive Metabolism………………………………………………….28
2.6.2.4. Hydrolytic Reaction…………………………………………………….28
2.6.3. Phase II Metabolism…………………………………………………………….31
2.6.4. Cytochrome P-450 Super families……………………………………………...34
2.6.4.1. CYP-Drug-Disease Interactions………………………………………...38
2.6.4.2. Pharmacogenetics testing of CYPs……………………………………...41
2.6.4.2.1 Genotyping……………………………………………………………...41
2.6.4.2.2 Phenotyping……………………………………………………………..43
2.6.4.3. Cytochrome P-450 2D6 (CYP2D6)…………………………………….47
2.6.4.3.1. CYP2D6 probe drugs……………………………………………………50
2.6.4.3.2. Dextromethorphan as CYP2D6 probe drug……………………………..50
2.6.4.3.3. Metabolic Ratio (MR) in biological matrices……………………………55
2.6.4.3.4. CYP2D6 Phenotyping with Dextromethorphan using urinary
Assay……57
2.6.4.3.5. CYP2D6 Phenotyping with Dextromethorphan using
plasma/serum…….58

x
2.6.4.3.6. Analytical methods for Dextromethorphan and
Dextrorphan…………….59
CHAPTER THTREE: METHODOLOGY………………………………………………………61
3.1. Setting…………………………………………………………………………....61
3.2. Location of the study……………………………………………………………61
3.3. Ethical approval…………………………………………………………………62
3.4. Design and Study population……………………………………………………62
3.5. Sample size determination………………………………………………………63
3.6. Eligibility/Inclusion Criteria…………………………………………………….64
3.7. Exclusion criteria………………………………………………………………..64
3.8.1. Chemicals and drugs…………………………………………………………….64
3.8.2. Equipment……..…………………………………………………………………64
3.9. Conduct of the study……………………………………………………………..67
3.9.1. Analytical methods for dextromethorphan and Dextrorphan……………………68
3.9.2. Preparation of Standard solution and solvent system……………………………68
3.9.3. Calibration curve for dextromethorphan and Dextrorphan in urine and plasma...69
3.9.4. Chromatographic
condition………………………………………………………70
3.9.5. Precision studies for dextromethorphan and
dextrorphan………………………..70
3.9.6. Recovery studies for dextromethorphan and dextrorphan from plasma…………71
3.9.7. Determination of dextromethorphan and dextrorphan in the plasma and urine....71
3.9.8. Data analysis……………………………………………………………………..72
CHAPTER FOUR: RESULTS…………………………………………………………………..74
xi
4.1. Socio-demographic Characteristics of the
participants…………………………...74
4.2. Haematological parameter of the
participants……………………………………78
4.3. Biochemical parameters of the participants………………………………..…….80
4.4. Analysis of dextromethorphan and
Dextrorphan…………………………………82 4.5. Dextromethorphan, dextrorphan and
MR urine…………………………………..93
4.6. Dextromethorphan, dextrorphan and MR
plasma………………………………...97
4.7. Comparison of the plasma and urinary metabolic ratio
dextromethorphan/dextrorphan............................................................................100
4.8. The sociodemographic characteristics of Poor and Extensive
metabolizers……102
CHAPTER FIVE: DISCUSSION………………………………………………………………104
5.1. Discussion……………………………………………………………………....104
5.2. Limitations……………………………………………………………………...108
CHAPTER SIX: CONCLUSION AND RECOMMENDATIONS…………………………….109
6.1. Conclusion……………………………………………………………………...109
6.2. Recommendation……………………………………………………………….110
REFERENCES………………………………………………………………………………....111
APPENDICES……………………………………………………………………………….…136

xii

xiii
LIST OF TABLES
Table 2.1: Examples of altered drug response…………………………………………………….9
Table 2.2: History/Evolution of
pharmacogenetics/pharmacogenomics…………………………10
Table 2.3: Reaction classed as phase I and phase II reactions
……………………………………22
Table 2.4: Differences between phase I and Phase II
reactions……………………………………23
Table 2.5: Examples of selected phase I reactions by microsomal mixed oxidase
system………30
Table 2.6: Examples of established probe drugs for selected CYPs……………………………..46
Table 2.7: Prevalence of CYP2D6 phenotype among races of the
world………………………..49
Table 2.8: Drug substrates for CYP2D6 phenotyping and their metabolic
ratios…..……………56
Table 3.1: The Chemicals, sources and quality………………………………………………….65
Table 3.2: The equipment and their sources……………………………………………………..66
Table 4.1: Frequency distribution of socio-demographic characteristics of 89
participants……..75
Table 4.2: The gender differences in age (years), weight (Kg), Height (meter) and BMI (kg/m2)
of the 89 participants…………………………………………………………………77
Table 4.3: Haematological parameters of the 89
participants…………………………………….79
Table 4.4: Biochemical parameters of the 89 participants……………………………………….81

xiv
Table 4.5: Results of Precision for Dextromethorphan and dextrorphan
………………………....90
Table 4.6: Results of accuracy and recovery for dextromethorphan and Dextrorphan in
plasma…91
Table 4.7: Limit of detection (LOD) and Limit of quantitation (LOQ) for dextromethorphan
and Dextrorphan………………………………………………………………………92
Table 4.8: Plasma and urine concentrations of dextromethorphan and dextrorphan in 89
Yoruba Nigerian participants………………………………………………………...94
Table 4.9: Correlation of the 8-hour urinary MR, 3-hour plasma MRs, age
and body mass index……………………………………………………………….101
Table 4.10: Some Socio-demographics of the identified PMs and
EMs………………………..103
xv
LIST OF FIGURES
Figure 2.1: Phase I and phase II metabolism of a lipophilic
xenobiotics…………………………21
Figure 2.2: Pie chart showing the distribution of human phase I enzymes of drug
metabolism….25
Figure 2.3: Human phase II enzymes of drug
metabolism………………………………………26
Figure 2.4: Examples of phase I reactions……………………………………………………….29
Figure 2.5: Examples of phase II reactions………………………………………………………33
Figure .2.6: Structure of Cytochrome P450 enzyme reaction………………………...………….37
Figure 2.7 a: The metabolic pathway of
dextromethorphan………………………...…………….53
Figure 2.7b: The metabolic pathway of dextromethorphan……………………………………...54
Figure 4.1: Pie chart showing the frequency distribution of the state of origin
of the 89 participants………………………………………………………………...76
Figure 4.2: Chromatogram of plasma sample of one participant showing Dextrorphan,
xvi
Internal standard and
dextromethorphan…………………………………………….83
Figure 4.3: Neat calibration curve of
Dextrorphan……………………………………………….84
Figure 4.4: Neat calibration curve of
dextromethorphan…………………………………………85
Figure 4.5: Calibration curve of dextromethorphan in
plasma……………………………………86
Figure 4.6: Calibration curve of dextrorphan in
plasma……………………………………..……87
Figure 4.7: Calibration curve of dextromethorphan in
urine……………………………………..88
Figure 4.8: Calibration curve of dextrorphan in
urine…………………………………………….89
Figure 4.9. Histogram showing the frequency distribution of the log MR in 8-hour
urine……….95
Figure 4.10: Probit plot representation of metabolic ratio (n=89) in 8-hour urine
samples……….96
Figure 4.11. Histogram showing the frequency distribution of the log MR in 3-hour
plasma……98
Figure 4.12. Probit plot representation of metabolic ratio (n=89) in 3-hour plasma
samples……..99
xvii
LIST OF APPENDICES
Appendix 1. UI/UCH Ethical
Approval………………………………………………136
Appendix 2. Registration of title of
Dissertation……………………………………...137
Appendix 3. Informed Consent……………………………………………………….138
Appendix 4. Chromatogram of blank plasma………………………………………...142
Appendix 5. Chromatogram of plasma spiked with 3µg/ml of
Dextrorphan………….143
Appendix 6. Chromatogram of plasma spiked with standard solution of 1µg/ml of
Levallorphan…………………………………………………………...144
Appendix 7. Chromatogram of plasma spiked with standard solution of 3µg/ml
of dextromethorphan……………………………………………………145
Appendix 8. Chromatogram of plasma spiked with standard solution of 3µg/ml of
Dextrorphan, and dextromethorphan, and 1 µg/ml of
levallorphan…….146
Appendix 9. Questionnaire…………………………………………………………..147
xviii
LIST OF ABBREVIATIONS
3-MOM 3-Methoxymorphinan
3-OHM 3-Hydroxylmorphinan
ACE Angiotensin Converting Enzyme
ADH Alcohol dehydrogenase
ADRs Adverse Drug Reactions
AFLPD Amplified Fragment Length Polymorphism Detection
ALDH Aldehyde dehydrogenase
ALT Alanine Amino Transferase
AST Aspartate Amino Transferases
ASO Allele Specific Oligonucleotide
BRCA Breast Cancer Susceptibility gene
CNV Copy Number Variations
COMT Catechol-O-Methyltransferase
CPIC Clinical Pharmacogenetics Implementation Consortium (CPIC)
CSL Central Science Laboratory
CYP2D6 Cytochrome P450 2D6
CYPs Cytochrome P450
DEX Dextromethorphan
DNA Deoxyribonucleic Acid
DOR Dextrorphan
DPD Dihydropyridine dehydrogenase

xix
DPWG Dutch Pharmacogenetics Working Group
EGFR Epidermal Growth Factor Receptor
EMs Extensive Metabolizers
FAD Flavin Adenine Dinucleotide
FDA Food and Drug Administration
FMN Flavin Mononucleotide
G6PD Glucose-6-Phosphate Dehydrogenase
GSH Glutathione
GST Glutathione-S-Transferase
HER2 Human Epidermal Growth Factor Receptor 2
Hb Haemoglobin
HLA Human Leucocyte Antigen
HMT Histamine methyltransferase
HPLC High Performance Liquid Chromatography
IMs Intermediate Metabolizers
LC-MS/MS Liquid Chromatography-Mass Spectrometry/Mass Spectrometry
LOD Limit of Detection
LOQ Limit of Quantitation
MR Metabolic Ratio
NADPH Nicotinamide Adenine Dinucleotide Phosphate
NMDA N-methyl-D-Aspartate
PCV Packed Cell Volume
PCR Polymerase Chain Reaction
RELPI Restriction Fragment Length Polymorphism Identification
SJS-TENS Steven-Johnson Syndrome and Toxic Epidermal Necrolysis

xx
ROC Receiver Operating Characteristics
SNPs Single Nucleotide Polymorphism
ST Sulfotransferase
TMPT Thiopurine-S-Methyltransferase
UDPGT Uridine Diphosphate Glucuronosyltransferase
UGT Uridine-Glucuronosyl-S-Transferase
UMs Ultra rapid Metabolizers
UV-VIS Ultraviolet Visible Spectrophotometry

xxi
ABSTRACT
Background: Twenty five percent of all clinically used drugs are metabolized by CYP2D6.
CY2D6 is highly polymorphic and more than 140 alleles have been identified. It is responsible
for marked inter-individual and interethnic variation in drug response. The consequences range
from adverse drug reactions in poor metabolizers to therapeutic failure in ultra rapid
metabolizers. Only scanty information exist about the many Nigerian and Africa ethnic
nationalities including the Yoruba Nigerian. The use of dextromethorphan as a probe drug and 8-
hour urine collection has become popular in the recent times. Single 3-hour plasma sample has
been shown to be adequate in the determination of CYP2D6 phenotype. The objective of this
study was to determine the CYP2D6 phenotype of Yoruba Nigerian using dextromethorphan as
probe in both urine and plasma matrices.
Methodology: Unrelated healthy Nigerians of Yoruba descent were invited to participate in the
study and history, complete physical examination and laboratory investigation were done. Each
participant received 30 mg of Dextromethorphan hydrobromide orally after an overnight fast and
were observed for more than eight hours. Peripheral venous blood sample collected 3 hour post
dose, immediately separated and plasma stored at -20oC. Prior to administration of the
dextromethorphan, participants completely emptied their bladder, subsequently all the urine were
collected for 8 hours and an aliquot stored at -20oC. Both plasma and urine samples were later
moved to -80oC freezer until analysis. Assay of Dextromethorphan (DEX) and Dextrorphan
(DOR) were done at the Central Science Laboratory, OAU, Ile-Ife using reversed phase HPLC
with UV detector. Sample separation was achieved on C18 column (100 x 4.6 mm, 3.5 µm
particle size) using a mobile phase of 30% Acetonitrile: 20% Methanol: 0.06% Triethylamine:
49.94% KH2PO4 (0.01 mol/litre), PH 3.2, flow rate: 1.5ml/min and then measured with UV
detection at 230 nm wavelength. Log of DEX/DOR(metabolic ratio) at 3 hour for plasma and at
8 hour for urine plotted on probit and antimode obtained that separates poor (PMs) and extensive
metabolizers (EMs).
Results: Fifty-eight (65.3%) male and 31(34.8%) female participated, with mean age of 36.1±9.5
years. The log MR that separated PMs from EMs was 0.28 (anti-mode 1.91) for urine and 0.75
(anti-mode 5.6) for plasma. Two male participants, aged 25 and 27 years, exhibited poor
metabolizer phenotypes, with mean MR of 17±13.4 in plasma and 3.2±1.4 in urine, which were

xxii
significantly higher than that of EMs, 2.5± 0.7 and 0.7± 0.4, respectively, (p<0.0001). The two
PMs were identified with 3-hour plasma and 8-hour urine MRs. There was strong positive
correlation between 8-hour urine and 3-hour plasma metabolic ratios {r2 =0.8, p<0.0001, 95% CI
(0.2, 0.9)}.
Conclusion: Two (2.3%) of the participants studied were found to be poor metabolizers. Both 8-
hour urine and 3-hour post dose plasma metabolic ratios of dextromethorphan/dextrorphan
differentiated poor and extensive metabolizers, and there was strong positive correlation between
urine and plasma metabolic ratios.

xxiii
CHAPTER ONE
1.0 INTRODUCTION
The human Cytochrome P450 enzymes are the predominant phase 1 metabolizing enzymes
involved in the biotransformation of 70-80% of clinically used drugs.(1) It has three main
families and several isoforms. Many isoforms of this group of enzymes have been identified
including CYP2D6 which is known to be responsible for the metabolism of about 25% of all
currently available clinically used drugs.(2) Notable among such drugs are antidepressants
(amitriptyline, imipramine, and paroxetine), beta adrenergic receptor blockers (metoprolol,
timolol, and propranolol), antipsychotics (risperidone, haloperidol), antiarrhythmic (flecainide,
encainide, propafenone) and miscellaneous drugs including: codeine, debrisoquine,
dextromethorphan, phenformin, tramadol, tamoxifen, which are also useful in the management
of many diseases.(3, 4)
CYP2D6 is highly polymorphic and more than 140 variants of its alleles have been
identified.The gene is located on chromosome 22q13. CYP2D6 genotype of an individual is
based on inheritance of wild or mutant alleles. Extensive metabolizers (EMs) inherit one or two
normal (or wild) alleles, e.g. CYP2D6*1, CYP2D6*2, whereas poor metabolizers (PMs) are
homozygous for two recessive null alleles e.g.CYP2D6*3, CYP2D6*4. Individuals that inherit
one wild and one null alleles are intermediate metabolizers (IMs), while those that possess
duplicated wild or normal genes (≥ 2 copies) are ultra rapid metabolizers (UMs).(4, 5) The
frequencies and distributions of the alleles in various populations vary widely throughout the
world, and among different races and ethnic groups.
Phenotypic expression of the combinations of the CYP2D6 alleles have been broadly divided
into four distinct groups by evaluating the capacity of individuals to metabolize such probe drugs
xxiv
as sparteine, debrisoquine, dextromethorphan and metoprolol. Thus, ultra-rapid metabolizers
(UMs) possess an increased activity; extensive metabolizers (EMs) possess normal activity;
intermediate metabolizers (IMs) and poor metabolizers (PMs) have reduced to negligible
capacity to metabolise the CYP2D6 substrates. (6-9) Studies among Caucasians indicate an
aggregate prevalence of 7-10% for PMs, 10-15% for IMs, 70-80% for EMs and 3-5% for UMs.
(10)The prevalence of PM in Asians is 1- 2%. (7, 11) The frequency distribution of PMs is
between 1 and 4%, in Africans. (12-16) Prevalence rate of up to 29% of ultra-rapid metabolisers
have been documented among blacks in Ethopia. (11, 17) In Nigeria, only few studies are
available, and the prevalence of CYP2D6 PMs phenotypes was reported as between 1 and 3.5%.
(8, 18, 19)
The clinical consequence of CYP2D6 polymorphism may include dose-related adverse events
due to poor drug clearance, or therapeutic failure in case the drug requires activation as in the
conversion of Codeine to Morphine in PMs. (17) Also, there may be absence of response
expected from the medications in UMs because of low and thus ineffective plasma
concentrations as could be inferred from non-response to an antidepressant(nortriptyline), (20-
22) or adverse drug reactions because of excessive formation of active metabolite (morphine) in
UM treated with codeine.(23)
Pharmacogenetics provides a veritable tool for the individualization of therapy with respect to
the choice and dose of the specific drug aiming at improving the efficacy of drugs and preventing
adverse drug reactions. Genotyping provides direct tools in the identification of specific
isoenzymes and therefore understanding of enzyme polymorphism, whereas phenotyping
evaluates the attendant biochemical effect taking into consideration, the influence of
environmental factors on the activity of the target enzymes. Phenotyping is necessary to obtain a

xxv
precise picture of an individual actual enzymatic activity via administration of appropriate probe
drug followed by measurement of its concentration and those of the specific CYP dependent
metabolites in the body fluid .(24)
Nigeria is the largest country in Africa comprising many ethnic nationalities. The 2006 census
conducted by the Nigerian National Population Commission put the country’s population at more
than 154 million. (25) Of the over 154 million people counted in 2006, Yoruba, a major ethnic
nationality, had a population of over 32 million, that is, 21%. (www.mapsofworld.com/Nigerian)
The Yoruba Nigerians are indigenous to the Southwestern Nigeria and are believed to share a
common ancestry. This study aimed at evaluating CYP2D6 phenotype among this group of
people using dextromethorphan as probe drug.
1.1 Statement of problem
Adverse drug reactions was the 4th to 6th leading cause of death in USA. (26) In PMs, the
benefits a drug offers may be denied by adverse drug reactions. Therapeutic failure results in
avoidable physical economic burden. There is high morbidity and mortality from therapeutic
failure and adverse drug reactions which is understood to be partly due to inappropriate dosage
and dosing as currently practiced. There is scanty information on the CYP2D6 status of Nigeria
ethnic nationalities despite their disparate ancestry.
xxvi
1.2 Rationale
Evidence of elevated plasma levels have been demonstrated and established in poor metabolizers
for risperidone (antipsychotics), amitriptylline (antidepressant), propafenone (antiarrhythmic
agent) and metoprolol (β-blocker).(4, 27-30) Low plasma levels and rapid clearance of
amitriptylline (antidepressants) and metoprolol (β-blockers) have also been demonstrated in
ultra-rapid metabolizers.(31-33)
Available literatures have shown that CYP2D6 polymorphisms are, at least, partly responsible
for this variability and have been well researched among the Caucasians, African-Americans and
Oriental populations. However, only paltry information exists about the many Nigeria and
Africa ethnic nationalities including the Yoruba Nigerians. (34, 35)There is need for concerted
efforts to bridge the information gap, especially considering recent advances in the area of
personalized medicine.
Validation criteria have shown that dextromethorphan and debrisoquine are the best CYP2D6
probes.(4, 36) The preference for dextromethorphan as a CYP2D6 probe is because of the
potential of the latter for causing clinically significant hypotension; particularly in poor
metabolizers.
Few attempts have so far been made at determining metabolic ratio (MR) in plasma samples. In
Nigeria, CYP2D6 phenotyping with dextromethorphan as probe drug was evaluated with
DEX/DOR ratio in urine. (8) Also, there is a need to assess the appropriateness or otherwise of
using plasma MR by comparing with the urine MR. There is total lack or, at least, scanty
information on the foregoing among the many Nigerian nationalities.

xxvii

xxviii
1.3 Aims and Objectives
Broad Objectives
To determine the CYP2D6 phenotype of healthy volunteers in a Yoruba Nigerian population of
ethnic origin using dextromethorphan
Specific Objectives
1. To assess the metabolic ratio (MR) of dextromethorphan/dextrorphan in the urine.
2. To assess the metabolic ratio (MR) of dextromethorphan/dextrorphan in the plasma.
3. To compare the plasma and urinary metabolic ratios of dextromethorphan/dextrorphan in
the determination of CYP2D6 phenotype among healthy volunteers.
xxix
CHAPTER TWO
LITERATURE REVIEW
2.1 Background
Drugs have revolutionized modern medicine and this has led to the significant reduction in
morbidity and mortality associated with both communicable and non-communicable
diseases.(37) The effect of drugs varies from normal response, adverse drug reactions, which
may be life threatening to therapeutic failure. Variations in drug response occur within and
between individuals. Factors known to be responsible for the variations in responses to drugs
include genetics, age, sex, nutrition, other drugs co-administered and underlying diseases
especially liver and kidney diseases. Of these, genetics is an important factor responsible for
most of the variations in drug response. (38)
Pharmacogenetics is the study of the variability in drug response due to heredity. (39) It provides
explanation for the inter-individual differences in responses to pharmaceutical agents.(40)
Pharmacogenomics is the study of the human genome, and its structure as relates to genes
involved in drug absorption, action and elimination. (41) It was introduced in the late 1990s and
it studies how genetic inheritance of individual affects the body response to drugs. Unlike in
pharmacogenetics, where investigations in specific genes are related to individual differences in
drug response, pharmacogenomics use information from the entire genome of an individual to
study the variability in drug response.(42)The two terms are often used interchangeably but the
latter became more popular after the completion of the Human Genome project in 2003, in which
development of novel drugs from the newly discovered genes are given priority.(43)
Contextually, both terms enunciate personalized medicine. On the contrary, Ecogenetics or

xxx
‘environmental genetics’, represents the entire field of gene-environment interactions, for
example, ionizing radiation, heavy metals, herbicides, foods, drugs, and alcohol. (44)
Genetic variations can be divided broadly into somatic mutations as occur in tumour tissue and
germ-line genetic variations.(45) The different somatic mutations in cancer on the other hand
have allowed the development of new anti-cancer agents aimed at treating patients whose cancer
cells carry the target mutation (target therapies). The germ-line genetic variants are heritable and
include variations in gene encoding drug metabolizing enzymes, drug transporters, drug targets
and human leucocyte antigen (HLA).(45, 46) Genetic variations may result from genomic
insertions, deletions, genetic copy number variations (CNVs) or single nucleotide
polymorphisms (SNPs). However, single nucleotide polymorphisms (SNPs) are the most
frequent sequence variations that affect drug metabolism, as they constitute approximately 90%
of all human genome variations and occurring in every 100 to 300 base pairs.(47)
Allele is one of two or more alternative forms of a gene that arise by mutation and are found at
the same place on a chromosome, and it results in genetic variations. The resultant genetic
variations are known as sequence variants if the alleles are present in less than one percent of
heterozygous individuals in a given population and polymorphism if the alleles are present in
more than one percent of heterozygous individuals in a given population. However, most of the
genetic variations that affect pharmacokinetics and pharmacodynamics are due to genetic
polymorphism. (38)
Genetic variations in drug metabolism influence pharmacokinetics-absorption, distribution,
metabolism and excretion; and pharmacodynamics-receptors interactions, ion channel
interactions, enzyme interactions, signaling pathway interactions and immune system
xxxi
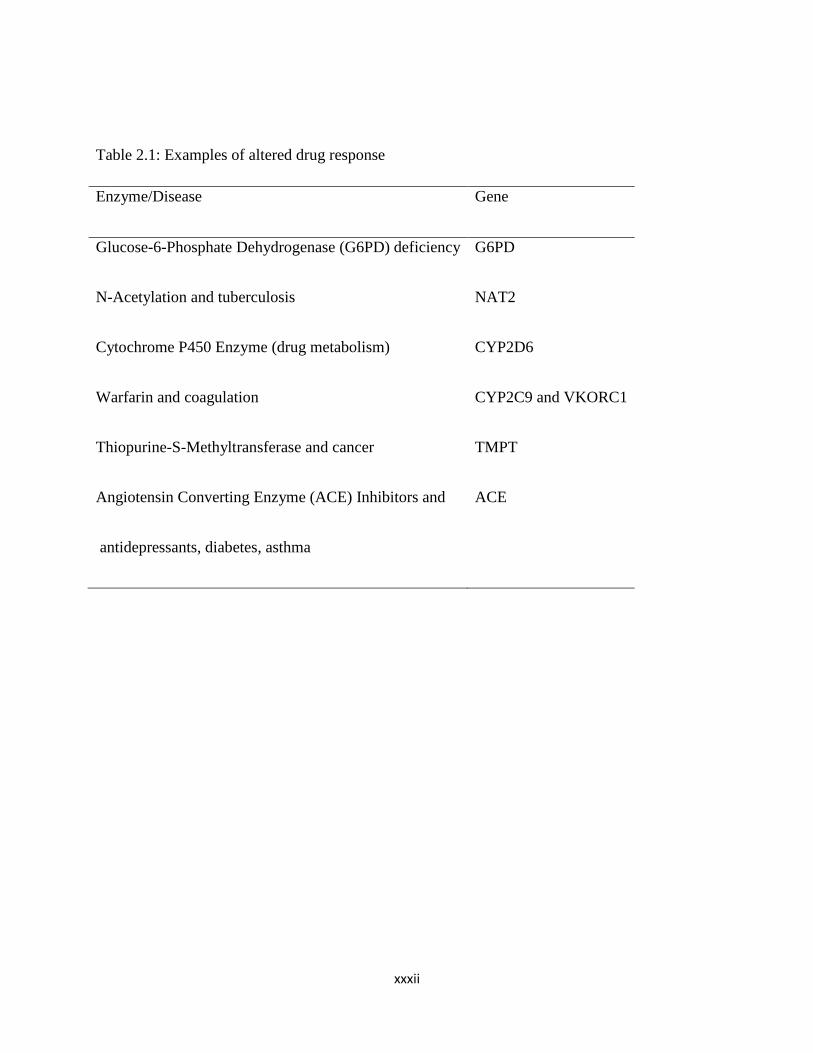
interactions. Examples of altered drug response and the implicated genes are shown in table 2.1.
However, of all the altered drug responses due to genetic variations, cytochrome P450 enzyme
system is the most important one affecting drug metabolism.
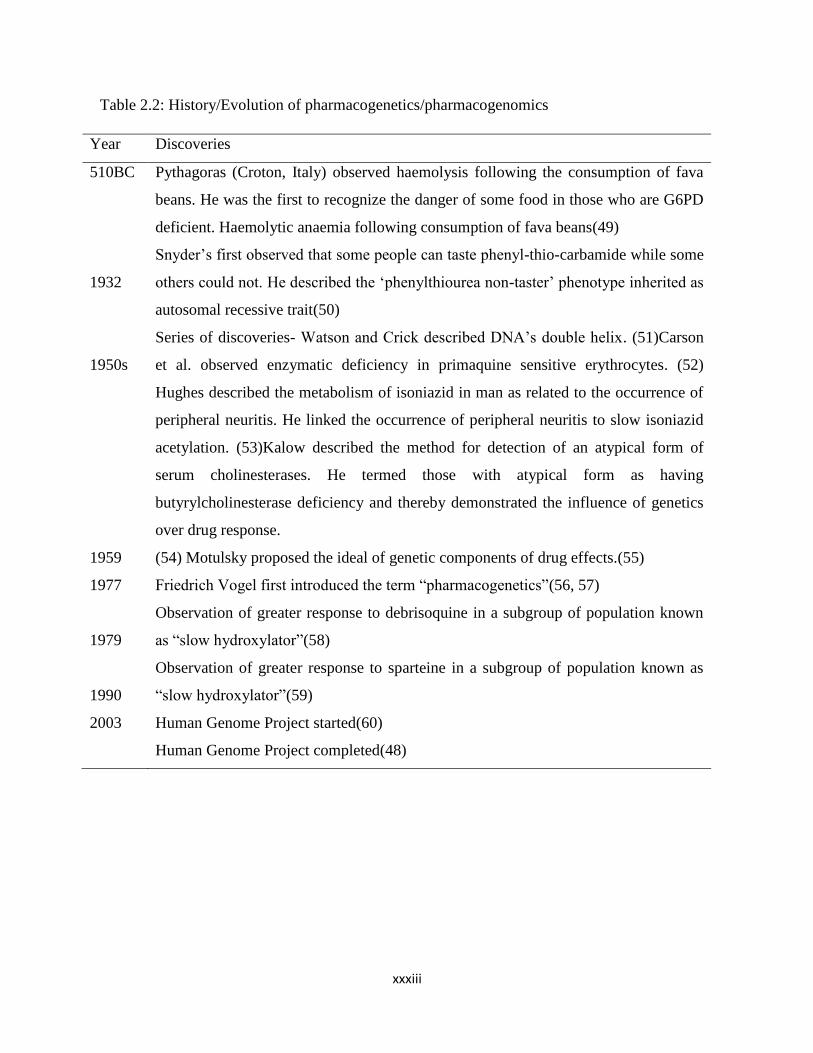
The landmark discoveries in the field of pharmacogenomics are summarized in table 2.2. The
genomic evaluation, more importantly, after the human genomic project in 2003(48) has given
scientists the opportunity of having access to large quantities of genomic data that can be used in
the development of novel drugs/pharmaceuticals. (43) This revolution promises to provide many
potent and effective drugs for treatment of diseases and for the individualization of therapy
(personalized medicine).
xxxii
Table 2.1: Examples of altered drug response
Enzyme/Disease Gene
Glucose-6-Phosphate Dehydrogenase (G6PD) deficiency
N-Acetylation and tuberculosis
Cytochrome P450 Enzyme (drug metabolism)
Warfarin and coagulation
Thiopurine-S-Methyltransferase and cancer
Angiotensin Converting Enzyme (ACE) Inhibitors and
antidepressants, diabetes, asthma
G6PD
NAT2
CYP2D6
CYP2C9 and VKORC1
TMPT
ACE
xxxiii
Table 2.2: History/Evolution of pharmacogenetics/pharmacogenomics
Year Discoveries
510BC
1932
1950s
1959
1977
1979
1990
2003
Pythagoras (Croton, Italy) observed haemolysis following the consumption of fava
beans. He was the first to recognize the danger of some food in those who are G6PD
deficient. Haemolytic anaemia following consumption of fava beans(49)
Snyder’s first observed that some people can taste phenyl-thio-carbamide while some
others could not. He described the ‘phenylthiourea non-taster’ phenotype inherited as
autosomal recessive trait(50)
Series of discoveries- Watson and Crick described DNA’s double helix. (51)Carson
et al. observed enzymatic deficiency in primaquine sensitive erythrocytes. (52)
Hughes described the metabolism of isoniazid in man as related to the occurrence of
peripheral neuritis. He linked the occurrence of peripheral neuritis to slow isoniazid
acetylation. (53)Kalow described the method for detection of an atypical form of
serum cholinesterases. He termed those with atypical form as having
butyrylcholinesterase deficiency and thereby demonstrated the influence of genetics
over drug response.
(54) Motulsky proposed the ideal of genetic components of drug effects.(55)
Friedrich Vogel first introduced the term “pharmacogenetics”(56, 57)
Observation of greater response to debrisoquine in a subgroup of population known
as “slow hydroxylator”(58)
Observation of greater response to sparteine in a subgroup of population known as
“slow hydroxylator”(59)
Human Genome Project started(60)
Human Genome Project completed(48)
xxxiv
2.2. Racial/Individual Variation in drug handling
As widely known, factors affecting response to drugs are genetic constitution, age, sex, co-
morbidities, environmental factors including diet and lifestyle (e.g. smoking and alcohol intake)
and drug related factors including drug interactions. Genetic variation is the most important as it
can lead to more than 1000 fold change in plasma drug level in response to the same medication
among individuals of the same sex, weight and same drug dosage. (61)Responses to medications
are often compared among populations that are divided according to the traditional racial
divisions.(62) The opinion of some of the biomedical scientists about race differs as some
described it as “biologically meaningless”(63) or not “based on scientific evidence”(64).
However, some supported the uses of race “in designing research studies and taking medical
decisions”.(65-67) Scientists that see race as biologically meaningless claims there is more
genetic variation within the group as compared to between them. And that there is more subtle
and complex description of an individual genetic make-up in ancestry than the race. (68)
Evolutionary studies have divided humans into three main groups, Europeans, Asians and Africa.
The evolutionary relationship shows that the overall genetic distance between Europeans and
Asians is significantly lower than that between Europeans and Africans, and that between Asians
and Africans. Such observations appear to support the notion that Asians and Europeans have a
common descent from Africans.(69, 70) Studies have shown that an approximately 85-90% of
genetic variation are found in a collection of individuals from a single continent and only an
additional 10-15% of variation are found in the collection of Europeans, Asians and
Africans.(62, 71, 72) Barbujani et al. then concluded that “the differences among continents

xxxv
represents roughly 1-10% of human molecular diversity and does not suggest that the racial
subdivision of our species reflects any major discontinuity in our genome”. (72)
However, race may provide some useful information as other factors affecting variation in drug
response because individuals living together, or constituting a particular race, share some of the
other environmental conditions including culture, religion, climate and tradition. This affects
attitude to treatment and response to drug. Obviously, it is not all the inter-ethnic differences to
drug response that are genetic. Starvation, malnutrition and protein deficiency may all cause
differences in the way the response to drug. Climate is a chief determinant of food production
and therefore determines the racial characteristics of nutrition.
2.3. Pharmacogenomics, pharmacovigilance and Pharmacoepidemiology
The availability of many drugs means increased exposure to the potential risks associated with
their use. A meta-analysis of 39 prospective studies among hospitalized patients in the US
showed that the overall incidence of serious adverse drug reactions (ADRs) was 6.7% and that of
fatal ADRs was 0.32% of all hospitalized patients, making these ADRs to be fourth to sixth
leading cause of deaths.(26) In England, the reported prevalence of ADRs related to hospital
admission was 6.5%, increased hospital stay and overall fatality was 0.15%.(73) In US, there
was an increase in the serious adverse drug events reported to FDA between 1998 and 2007.(74)
Drugs are only approved for human consumption after requisite investigations through clinical
trials. These clinical trials are limited by strict selection criteria of few thousand individuals
relative to the number of people and populations that will eventually take the drug after approval.
It highlights the importance of post-marketing surveillance since some of these ADRs will only
xxxvi
be detected after full approval. Therefore there is need for early detection and or prevention of
ADRs.
Pharmacoepidemiology is the application of epidemiological methods to the clinical use and
effects of drugs in a large population of people. It is primarily concerned with post- marketing
studies of drug safety, often based on large health care utilization databases using non
experimental study of intended and unintended drug effects outside of randomized controlled
trials. In addition to identifying adverse events, one of the goals of pharmacoepidemiology is to
identify reasons that may explain the adverse events. (75)
Pharmacovigilance is the science and activities relating to the detection, assessment,
understanding and prevention of adverse effects or any other possible drug-related problems.
(76) Many drugs have been withdrawn from the market following reporting of suspected ADRs
through pharmacovigilance. For about 33 years, between 1969 and 2002, more than 75
drugs/drug products were removed from the market due to safety problems and 11 drugs have
special requirements for prescriptions or have restricted distribution programmes by FDA. (77)
This highlight the importance of pharmacovigilance as the primary surveillance database used
for the identification of safety problems of marketed drugs. Apart from the problem of
underdeveloped pharmacovigilance system in developing nations, other limitations include
underreporting, (78-80) differential reporting, and uneven quality of reporting. In addition,
causality assessment is difficult and therefore, the underlying mechanism of the reported ADRs
are not known in most cases. Besides the key mechanism of the ADRs, it is difficult to
extrapolate the detected signals to other countries or geographical region in a faster and accurate
manner. (81) There is need for better design in pharmacovigilance in which the ADRs, drug
xxxvii
resistance and treatment failure can be detected early with the possible mechanism of ADRs, and
with the potential of extrapolation to other populations or geographical region.
One of the most challenging areas of research in pharmacoepidemiology is to understand why
individuals respond differently to drug therapy, both in terms of beneficial and adverse effects.
Pharmacogenetics focuses on the question to what extent variability in genetic make-up is
responsible for these observed differences.(82) The pharmacogenomics and pharmacovigilance
aim is to understand heterogeneity and population substructure in the distribution of drug
efficacy and safety signals, and Sardas have proposed a term, pharmacogenovigilance, as a
convergence of the two. He defined “pharmacogenovigilance as pharmacovigilance activities
informed and guided by accompanying pharmacogenomics analysis”.(82) And studies have
shown the beneficial effect of this convergence including extrapolation of early signals on drug
related events from one population to another using pharmacogenomics biomarkers and
understanding of pharmacokinetics and pharmacodynamics performance of drugs in poor and
ultra rapid metabolizers.(83-86) Pharmacogenomics analysis can assist in the determination of
mechanisms of ADRs and contribute to causality assessment. This improves the reporting
standard by making it more scientific and mechanism oriented, and the pharmacovigilance can
then be generalized to other population.
This synergistic relationship can also be applied right from the early phase of the clinical trial.
For example, if the early clinical trial phase pharmacogenomics analysis suggests toxicity in
rapid acetylators, then the post-marketing surveillance will focus on rapid acetylators. This
should also assist in approval process of drug by the regulatory agencies. In addition, patients
can be selected for genotyping based on spontaneous ADRs reports, and this form of genomic
analysis have been found useful. (84, 87)

xxxviii
The synergistic interaction between pharmacoepidemiology and pharmacogenomics will provide
opportunities including the application of molecular biology and pharmacogenetics (molecular
pharmacoepidemiology) to population studies and well-designed large scale clinical trials in less
contrived settings. This will eventually leads to more efficient drug development and a better
post-marketing surveillance. (88)
xxxix
2.4. Clinical Application of Pharmacogenetics
The overall goal and the main driving force for pharmacogenetics research is the optimization of
pharmacotherapy. Fully developed pharmacogenomics system will permit the identification of
“at risk” individuals thus avoiding or, at least, reduce drug-associated morbidity and mortality.
(89) The following are some of the specific clinical applications of pharmacogenomics.
1. Development of novel drugs: The pharmaceutical companies will be able to develop
drugs based on the proteins, enzymes and RNA molecules associated with gene and
diseases. That is drug discovery and therapy are targeted for specific diseases. This will
reduce the damaging effects of the drugs on healthy tissue and cells. For examples,
trastuzumab (Herceptin) used in the treatment of breast cancer targets HER2
receptor;(90) imatinib (Gleevec) used in the treatment of Chronic myeloid leukaemia,
targets tyrosine kinase receptor (91) and cetuximab (Erbitux) targets epidermal growth
factor receptor (EGFR) and is used to treat metastatic colorectal cancer.(92)
2. Better and safer drugs: The clinician uses the genetic profile of the patients to prescribe
the best available drug from the beginning instead of traditional trial and error methods of
matching. This will speeds recovery time and increase safety.
3. Optimization of dosages and dosing regimens: The dose of drugs will be based on the
individual genetic make-up rather than currently practiced generalization. It maximises
therapeutic value and reduces the likelihood of over dosage.(93)
4. Screening for diseases: With the completion of the Human genomic project and by
knowing the genetic code of an individual, it is possible to screen for diseases early and
ensure adequate life style and environmental modification. This will reduce the
occurrence and or the severity of genetic disease. In addition, it allows for the careful
xl
monitoring and introduction of treatment at the appropriate stage. (94) The following are
examples of diseases in which genetic screening are found useful.
a. Hypersensitivity reaction to Abacavir: Abacavir is nucleoside reverse
transciptase inhibitor and an effective antiretroviral drug. An important
limiting factor to its use is the hypersensitivity reaction. The immunologically
mediated hypersensivity reaction affects 5-8% of patients on abacavir and
occurs during the first 6 weeks of treatment. (95, 96)This hypersensitivity
reaction is strongly associated with the presence of HLA-B*5701.
Pharmacogenetic screening for HLA-B*5701 are been used to prevent the
toxic effect of the drug.(97, 98)
b. Tamoxifen and breast cancer: Tamoxifen is a selective oestrogen receptor
modulator and effective in the treatment of oetrogen positive early and
advanced breast cancer. Women with mutation of BRCA1 and BRCA2 have a
higher risk of developing breast cancer and of contralateral breast cancer after
the initial diagnosis of breast cancer. (99) Tamoxifen use decreases the risk of
development of contralateral breast cancer in women with mutation of
BRCA1 and BRCA2. (99)The reduction is more among premopausal or
women who had undergone natural menopause. (100).
In addition, tamoxifen is metabolized by CYP2D6 and individual who are
poor and intermediate metabolizers may not have the full benefit because of
slow metabolism of tamoxifen prodrug to its active metabolites, 4-
hydroxytamoxifen. (101, 102) Guideline for CYP2D6 pharmacogenetics
testing before using tamoxifen have been provided. (103)

xli
c. Carbamazepine-induced toxic effects: Carbamazepine is an anticonvulsant
and effective in treatment of seizure disorders. An important factor that may
limit its use is the carbamazepine induced Steven-Johnson syndrome and toxic
epidermal necrolysis (SJS-TENs). Carbamazepine induced SJS-TENs are
strongly associated with HLA-B*1502 allele. Screening of HLA-B*1502 and
avoidance of carbamazepine therapy is associated with reduction in
carbamazepine induced SJS-TENs. (104)
d. Warfarin induced bleeding: CYP2C9 and VKORC are enzymes that
metabolize warfarin, an important anticoagulant with narrow therapeutic
index. Individual who are poor metabolizers like CYP2C9*2 or CYP2C9*3 or
VKORC1 (g-1639G>A) are warfarin sensitive and therefore require a lower
dose to achieve optimal anticoagulation.(105) Genetic testing for CYP2C9*2
or CYP2C9*3 or VKORC1 (g-1639G>A) may allow for selection of patients
that will benefit from dose reduction and prevent the occurrence of fatal
adverse drug reaction. (106, 107)
5. Pharmacogenomics into DNA/RNA vaccines: Vaccination involves the introduction of
an infectious agents or component of an infectious agent to stimulate the immune system
to produce antibodies that neutralizes the organism anytime it invade the host. Traditional
vaccination are effected either by introducing a specific antigen or live attenuated
infectious agent. Pharmacogenomics recently allow introduction of appropriate tissues of
plasmid containing the DNA sequence encoding the antigen(s) against which an
immunity is achieved and relies on in situ production of the target antigen. Besides RNA
or complexes of nucleic acid molecules can be used.
xlii
(www.who.int/biologicals/ares/vaccines/dna/en). The advantage of the vaccines include
the ability to activate the immune system in the absence of infectious agents, provision of
both humoral and cell mediated immunity, and improved stability. Besides, the vaccines
are cheaper, easy to store, capable of being engineered to carry several strains of
pathogen at once and retain the traditional benefits of vaccine without risk. (108)
Examples include hepatitis B and West Nile virus vaccines.
6. Drug discovery: The pharmaceutical companies will be able to discover potential
therapies more easily and quickly using genomic targets. It may be possible to revisit
previously failed drug candidates and matching them with the niche population they
serve. The clinical trial will target specific genetic population and therefore increases the
degree of success. This will facilitate the drug approval process, reduces the cost and risk
of clinical trials.(93)
7. Reduction in the cost of healthcare: In addition to the ill health, adverse drug reactions
(ADRS) is associated with high cost of treatment. (73) Pharmacogenomics provides an
avenue to ensure reduction in number of ADRs, drug resistance and therapeutic failures.
And may also reduce the number of failed drug trials, the time it takes to obtain drug
approval, the duration of medication for effective therapy and increase in the range of
possible drug targets. All these will ultimately reduce cost of health care.(93)
2.5. Challenges
Pharmacogenomics is a rapidly growing specialty but is faced with some challenges
including the following:

xliii
1. Gene variations: SPNs are DNA sequence variations and occur every 100 to 300
bases along the 3-billion base human genome. Thus, millions of SNPs must be
identified and analyzed to determine their involvement (if any) in drug response.
Besides, the process of obtaining the impact of gene variations that affect each drug
response is time-consuming and complicated since many genes may influence
response.(93)
2. Drug alternatives: Genetic screening may exclude some patients from taking certain
drugs because of possibility of life-threatening adverse drug reactions or therapeutic
failure. However, in such a situation, the patient may be left without alternative
treatment if there is only one or two available approved drugs for the treatment of the
condition.
3. Education: The traditional method of prescribing is simple. To implement
personalized medicine, there is need for the training of the prescriber since the
introduction of multiple pharmacogenomics to treat similar conditions for different
population subsets may complicate the process of prescribing and dispensing drugs.
4. Limited facilities: There is limited facilities and expertise for pharmacogenomics,
especially in developing countries.

xliv
2.6. Drug Metabolism
Metabolism is the biochemical modification of pharmaceutical substances (or xenobiotics) by
living organism usually through an enzymatic products. It often leads to the conversion of
lipophilic chemical substances into readily excreted water soluble products by the kidney. The
aim of drug metabolism is to make drugs more water soluble, and more easily excreted from the
body.
The major site of drug metabolism is the liver in which the hepatic microsomal enzyme system
play an important role. Other sites of drug metabolism include the kidney, lung, intestinal
mucosa, plasma and nervous tissue. The routes of metabolism varies and determines the ultimate
pharmacological or toxicological activity of the drug. The routes include oxidation, reduction,
hydrolysis, hydration, conjugation and condensation.
Drug metabolism is divided into two major phases namely, phase I (or functionalization reaction)
and phase II (or conjugative reactions). Phase I prepare the drug for phase II by producing or
uncovering the chemically reactive functional group while phase II detoxify the drug, produce
inactive product that are excreted by the kidney and other organ of excretion. Figure 2.1 shows
the schematic representation of the phases of drug metabolism while table 2.3 shows the various
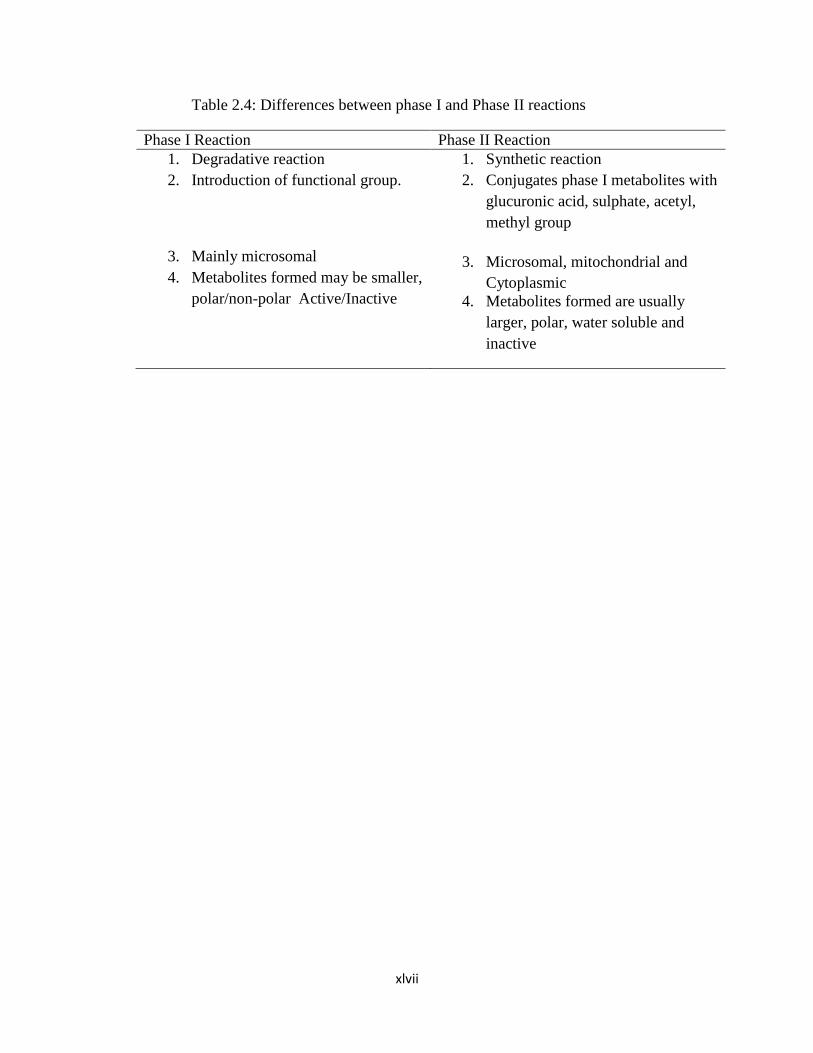
routes of metabolism under the 2 major phases of drug metabolism. The major differences
between phase I and Phase II reactions are shown in table 2.4.

xlv
Figure 2.1: Phase I and phase II metabolism of a lipophilic xenobiotics

xlvi
Table 2.3: Reaction classed as phase I and phase II reactions (109)
Phase I reactions Phase II reactions
Oxidation
Reduction
Hydrolysis
Dethioacetylation
Isomerization
Glucuronidation/glycosidation
Sulfation
Methylation
Acetylation
Amino acid conjugation
Glutathione conjugation
Fatty acid conjugation
Condensation
xlvii
Table 2.4: Differences between phase I and Phase II reactions
Phase I Reaction Phase II Reaction
1. Degradative reaction
2. Introduction of functional group.
3. Mainly microsomal
4. Metabolites formed may be smaller,
polar/non-polar Active/Inactive
1. Synthetic reaction
2. Conjugates phase I metabolites with
glucuronic acid, sulphate, acetyl,
methyl group
3. Microsomal, mitochondrial and
Cytoplasmic
4. Metabolites formed are usually
larger, polar, water soluble and
inactive
xlviii
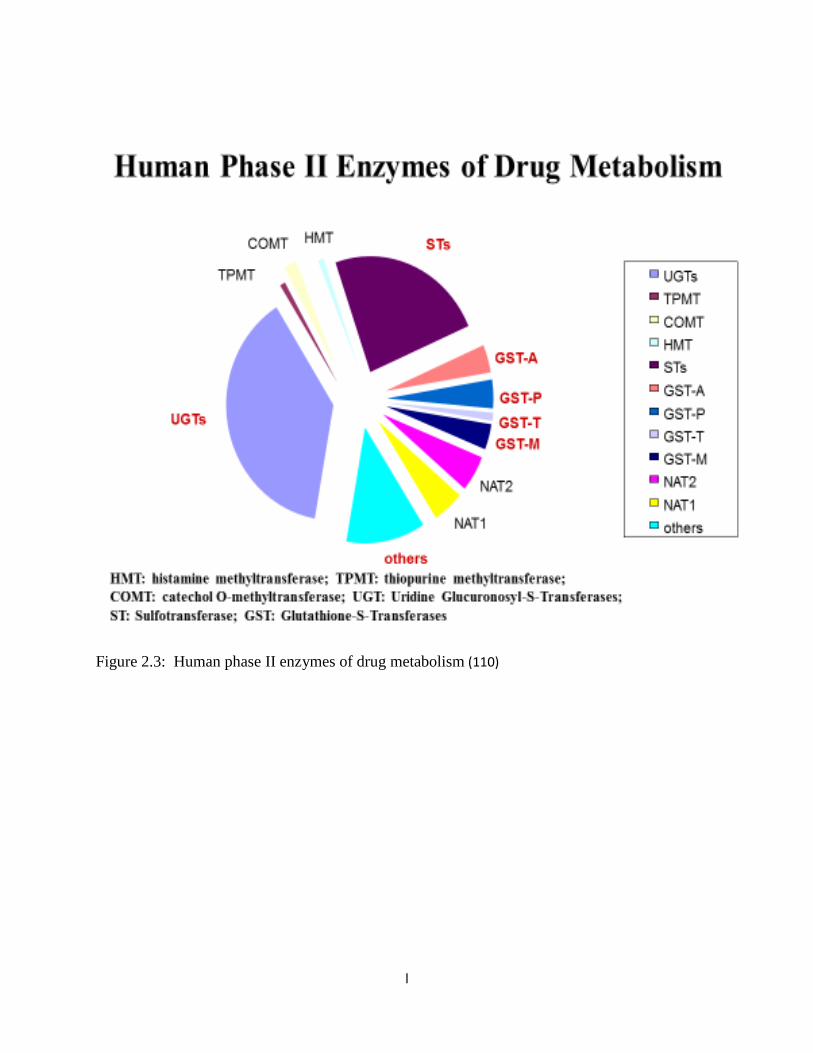
2.6.1. Enzymes involved in drug metabolism
The enzymes involved in drug metabolism are classified as either phase I (functionalisation) or
phase II (conjugative). They complement each other because phase II metabolizing enzymes act
on the products of phase I reactions. The various phase I and II human metabolizing enzymes are
shown in figure 2.2 and 2.3 below.

xlix
Figure 2.2: Pie chart showing distribution of the human phase I enzymes of drug metabolism
(110)
l
Figure 2.3: Human phase II enzymes of drug metabolism (110)
li
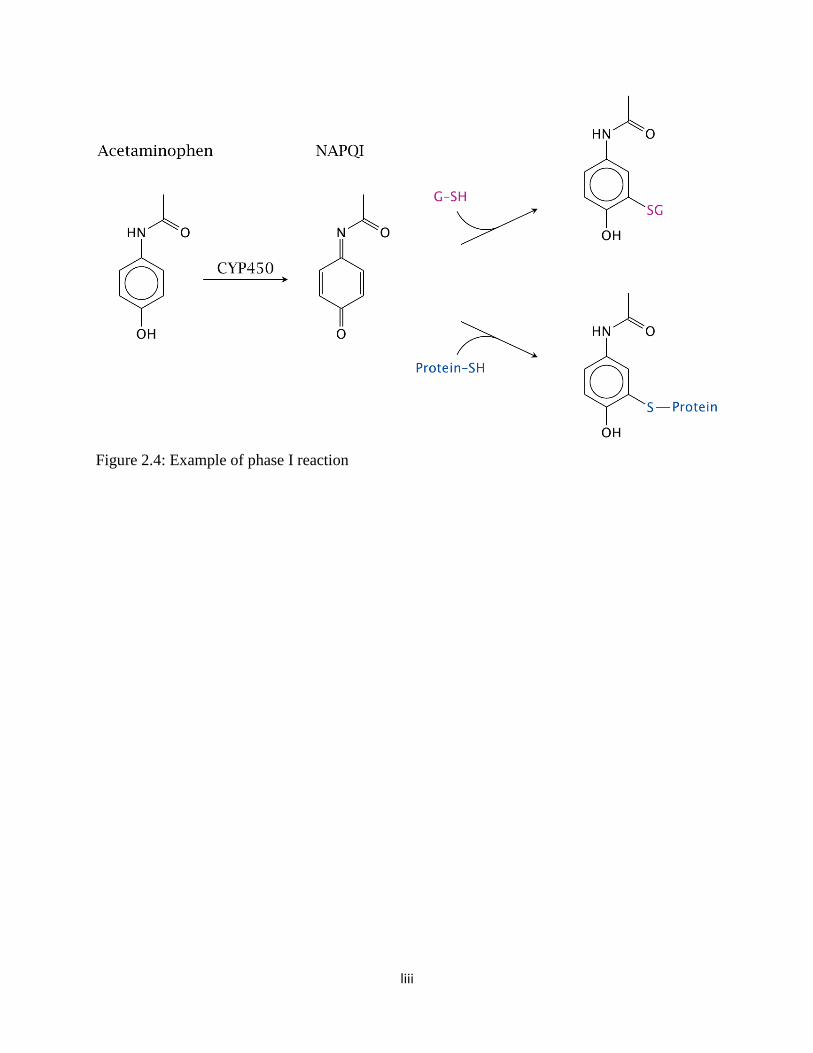
2.6.2. Phase I (or functionalization) reaction
This is a non-synthetic reaction and it involves a change in the drug molecule by introduction of
reactive and polar groups into their substrate. The reactions include oxidation, reduction,
hydrolysis and hydration. This may results in activation, change or inactivation of the drug.
Figure 2.4 shows an example of type I reaction.
Phase I reactions can be sub-classified into the following reactions. (109)
1. Oxidation reactions involving cytochrome P450 enzyme system
2. Oxidation reactions involving other enzyme systems
3. Reduction reactions
4. Hydrolysis reactions
5. Isomerization reactions
6. Miscellaneous reactions
2.6.2.1. Oxidation reactions involving Cytochrome P450 enzyme system (the
microsomal mixed- function oxidases)
These enzymes system are found in the endoplasmic reticulum of many cells most
importantly the liver, but also in the kidney, lung and intestine. They are the most
important phase I metabolizing enzyme as they are involved in the metabolism of 70-
80% of clinically used drugs. (1) All the reactions require the presence of molecular
oxygen, NADPH and complete mixed function oxidase system. The reactions involve the
initial insertion of a single oxygen atom into the drug molecule, followed by
rearrangement and /or decomposition of this product and leading to the formation of the
lii
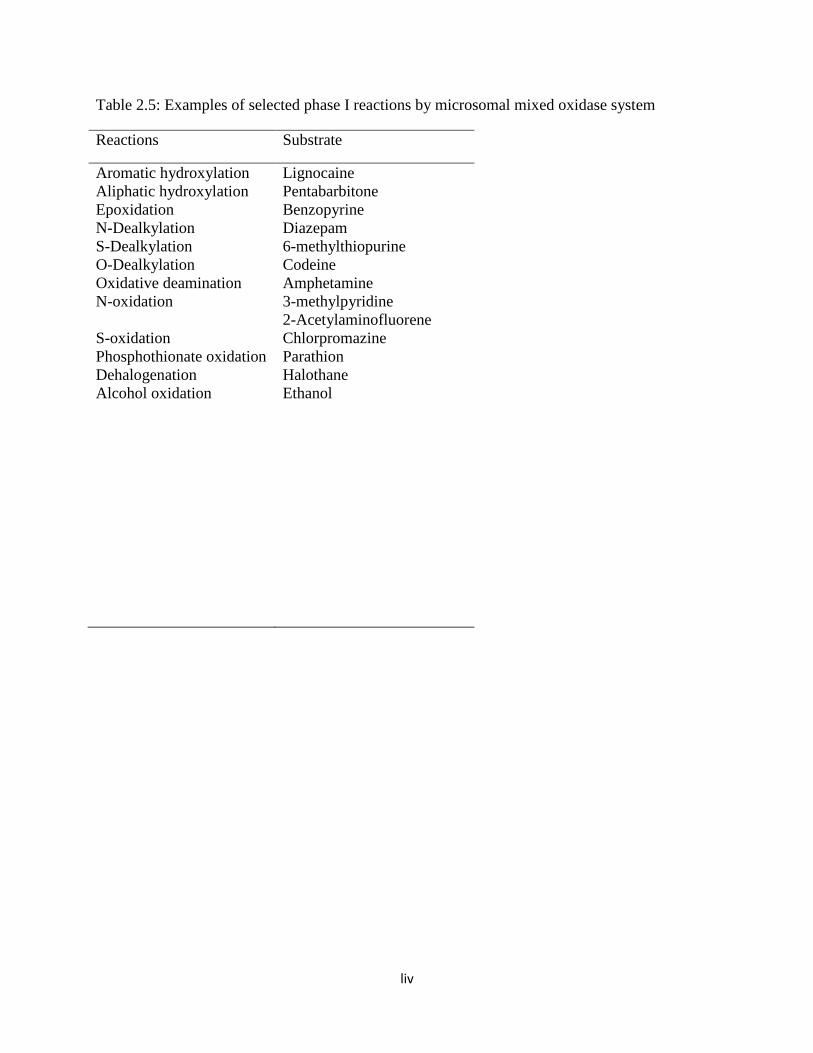
final product. Table 2.4 shows examples of reaction perform by microsomal mixed
oxidase system. (109)
2.6.2.2. Oxidation reactions not catalyze by cytochrome P450
These are phase I oxidation reactions not catalyze by cytochrome P450 mixed oxidase
system. Examples of the enzymes (substrate) involved are alcohol dehydrogenase
(ethanol), aldehyde dehydrogenase (aldehyde), xanthine oxidase (caffeine, theophylline,
and purine), amine oxidase (dietary tyramine, endogenous catecholamine, histamine, and
imipramine) and alkyl-hydrazine oxidase (carbidopa)
2.6.2.3. Reductive metabolism
The reduction reactions take place in the liver catalyzed by hepatic microsomal enzymes.
They require NADPH but are inhibited by oxygen. Examples of compounds that undergo
reduction include azo compounds (sulfanilamide/sulphonamide), nitro-compounds
(chloramphenicol), epoxides, heterocyclic ring compounds and halogenated hydrocarbon.
2.6.2.4. Hydrolytic reaction
This involve ester hydrolysis and occur in different part of the body. Examples include
plasma pseudocholinesterases (e.g. procaine) and liver specific esterases (e.g. pethidine,
meperidine).
liii
Figure 2.4: Example of phase I reaction
liv
Table 2.5: Examples of selected phase I reactions by microsomal mixed oxidase system
Reactions Substrate
Aromatic hydroxylation
Aliphatic hydroxylation
Epoxidation
N-Dealkylation
S-Dealkylation
O-Dealkylation
Oxidative deamination
N-oxidation
S-oxidation
Phosphothionate oxidation
Dehalogenation
Alcohol oxidation
Lignocaine
Pentabarbitone
Benzopyrine
Diazepam
6-methylthiopurine
Codeine
Amphetamine
3-methylpyridine
2-Acetylaminofluorene
Chlorpromazine
Parathion
Halothane
Ethanol

lv
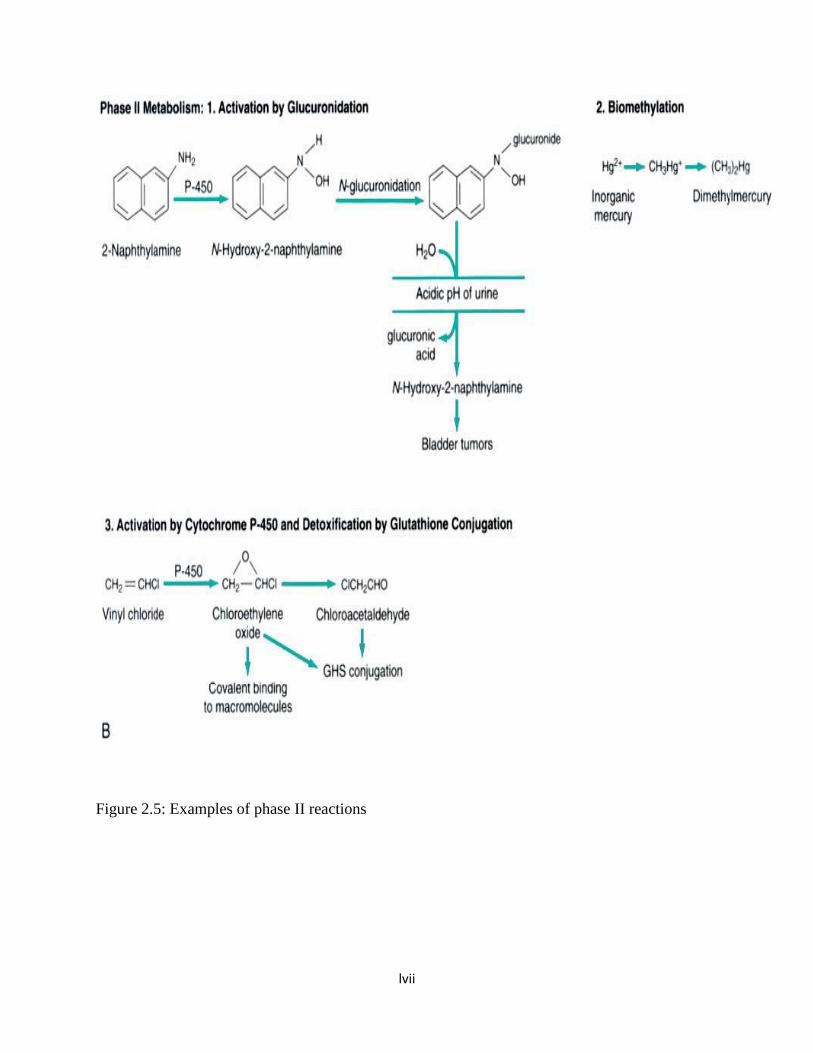
2.6.3. Phase II metabolism (Synthetic reactions)
The conjugation or synthetic reactions involves chemical combination (covalent linkage)
of a parent compound or phase I metabolite with a molecule provided by the body
(usually a carbohydrate, amino acids or compound derived from them).The end products
of phase II reaction are highly water soluble and can be excreted in the bile or urine.
Figure 2.2 shows an examples of phase II reaction. The end products are usually inactive,
exception is morphine-6-glucuronide. The major phase II reactions are glucuronidation,
sulphation, acetylation, and conjugation with glutathione or amino acids. (111)
1. Glucuronidation: This is the most frequently occurring conjugation for drugs and
endogenous compounds. It involves the conjugation of glucuronide by UDP-glucuronic
acid in the hepatocytes. The enzyme for the reaction is UDP-glucuronosyl transferase,
and the glucuronic acid for the conjugation results from the breakdown of glycogen. The
glucuronide are highly polar and are easily secreted in urine and bile.
2. Sulphation: This involves conjugation with sulphate groups from phosphate-adenosyl-1-
phosphosulphate by sulphokinase to aliphatic or aromatic hydroxyl-containing
compounds and amines. Examples of compounds that are metabolizes by sulphation are
isoprenaline, chloramphenicol and serotonin.
3. Acetylation: This is a reaction of amino groups, and it involves the transfer of acetyl-
coenzyme A (acetyl CoA) to an aromatic primary or aliphatic amine, amino acid,
hydrazine, or sulphonamide group. Acetyl-coenzyme A is obtained from the glycolysis
pathway, catabolism of fatty acids or amino acids, or through direct interaction of acetate
and coenzyme A. The major site of acetylation is the liver. Other extrahepatic sites
include spleen, lung and gut. The enzyme involved in the acetylation is the acetyl

lvi
transferases, and genetic polymorphism affecting the reactions of these enzymes has
important consequences in drug therapy and tumorigenicity of certain xenobiotics. (111).
Examples of drugs that utilizes acetylation are isoniazid and hydralazine.
4. Glutathione (GSH) Conjugation: This involves the formation of thioether link between
the glutathione and electrophilic compounds. It results in detoxication of the electrophilic
compounds by preventing their reaction with nucleophilic centres in macromolecules
such as proteins and nucleic acids. The glutathione (GSH) is an endogenous compound
known to be protective by removing potentially toxic electrophilic compounds. The
highest concentration of GSH are found in the liver but are also found in the cortex,
medulla, cytosol, mitochondrial, nucleus and blood. The conjugates may be excreted in
the urine or bile but more commonly undergo further metabolism.(111)
lvii
Figure 2.5: Examples of phase II reactions
lviii
2.6.4. The Cytochrome P-450 Super Families (the CYPs)
The Cytochrome P450 is a large super family of haem-thiolate proteins involved in the
metabolism of a wide variety of both exogenous and endogenous compounds. (112) The
cytochrome P450 enzymes in families 1-3 are generally polymorphic and responsible for
70-80% of all phase I-dependent metabolism of clinically used drugs.(1) CYPs are
located in the smooth endoplasmic reticulum of cells throughout the body but the highest
concentrations are found in the liver. They were first discovered in 1955 in rat liver
microsomes, and are characterized by an intense absorption of light at wavelength of 450
nm in the presence of Carbon monoxide. (113) CYPs contain three domains, namely:
NADH or NADPH – dependent Flavin Adenine Dinucleotide (FAD) containing
reductase (FAD domain); an iron-sulfur protein or Flavin Mononucleotide (FMN) –
binding domain; and P 450 domain (haem domain).The haem is non-covalently bound to
the polypeptide chain. The haem contains one atom of iron in a hydrocarbon cage that
functions to bind oxygen in the CYP active site as part of the catalytic cycle of the
enzyme. CYPs use oxygen and hydrogen ion derived from the co-factor nicotinamide
adenine dinucleotide phosphate (NADPH) to carry out the oxidation of substrates. The
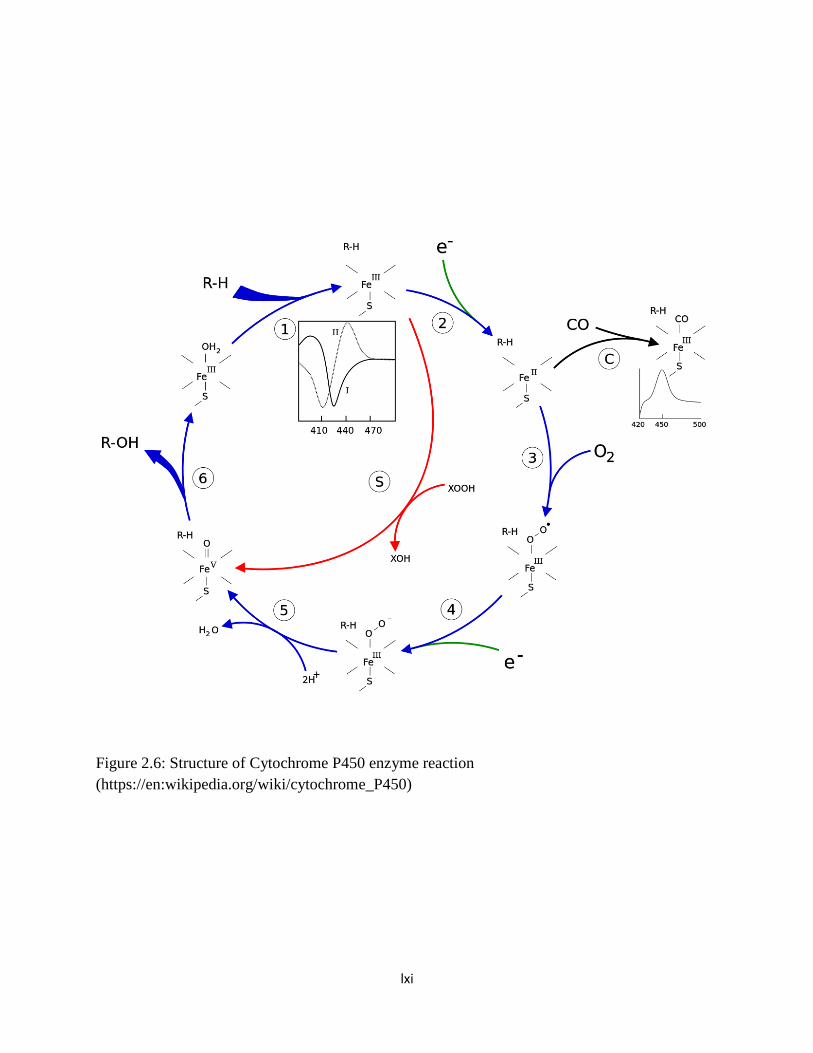
structure of Cytochrome P450 enzyme reaction is shown in figure 2.6.
Genomic sequencing has revealed the existence of 57 putatively functional genes and 58
pseudogenes in humans. At least 12 CYP gene families have been identified in humans,
although 3 families are involved in the majority of the drug biotransformation. These are
1, 2 and 3 (or CYP1, CYP2 and CYP3). These genes are grouped based on amino acid
sequence similarity into a super family composed of families and subfamilies with
increasing similarity. An enzyme belongs to a family when the amino acid sequence

lix
possesses more than 40% homology while enzymes with more than 55% homology form
a super family. (114) Genes encoding CYP enzymes, and the enzymes themselves, are
designated with the abbreviation CYP, followed by a number indicating the gene family,
a capital letter indicating the subfamily, and another numeral for the individual gene. For
example, CYP2D6 belongs to family 2, sub-family D and gene number 6. (3) In humans,
12 CYPs (CYP1A1, 1A2, 1B1, 2A6, 2B6, 2C8, 2C9, 2C19, 2D6, 2E1, 3A4 and 3A5) are
known to be important for the metabolism of xenobiotics. The most active CYPs for drug
metabolism are those in the CYP2C, CYP2D and CYP3A subfamilies. CYP3A is the
most abundant and it is involved in the metabolism of over 50% of clinically used drugs.
The CYP1A, CYP1B, CYP2A and CYP2E subfamilies are not significantly involved in
the metabolism of therapeutic drugs but catalyze the metabolic activation of many
protoxins and procarcinogens to their ultimate reactive metabolites .(3)
The CYPs that catalyze steroid and bile acid synthesis have specific substrate
preferences. However, the CYPs that catalyze xenobiotics metabolism have the capacity
to metabolize diverse chemicals. There is an extensive overlapping of substrate
specificity among CYPs, and they can therefore metabolize multiple substrates. These
features of CYPs may explain the prolonged half-lives, and the predominant drug-drug
interactions of their substrates. (3)
The expression of the different CYPs can differ markedly as a result of diet;
environmental exposure to inducers or inhibitors; inter-individual changes resulting from
heritable polymorphic differences in gene structure (genetic polymorphism); disease; and
age. Infants do not develop a mature enzyme system until more than 2 weeks after birth
lx
while elderly people have age related decreases in liver mass, hepatic enzyme activity,
hepatic blood flow, and therefore the overall metabolic capacity of the liver is decreased.
Genetic polymorphism can be defined as the presence within a population of at least two
groups with distinctly different abilities to metabolize drugs and xenobiotics. Individual
can be categorized as extensive (rapid), poor (slow), or ultra-rapid metabolizers. Thus,
individual who are PM may have adverse drug reactions whereas there may be lack of
effect in UM with normal dose of medication respectively. Genetic polymorphism and
differences in gene regulation are responsible for the largest inter-individual variability in
CYPs expression. Several human CYP genes exhibit polymorphisms including CYP2A6,
CYP2C9, CYP2C19 and CYP2D6. Low frequencies allelic variants are found in the
CYP1B1 and CYP3A4 but have little role in inter-individual variability in their
expression. (3)
lxi
Figure 2.6: Structure of Cytochrome P450 enzyme reaction
(https://en:wikipedia.org/wiki/cytochrome_P450)

lxii
2.6.4.1. CYP-Drug-Disease interactions: particular reference to CYP2D6–influenced
drugs
The ultimate goal of pharmacogenetics is individualization of therapy to reduce drug-associated
morbidity and mortality. However, as simple as it appears, only few drugs have simple or single
pathway of elimination process. In addition, metabolic pathways and mechanism of action of
substantial numbers of clinically used drugs are yet to be fully elucidated further increasing the
challenges to achieving individualized therapy. The fact that some drugs have active metabolites
or enantiomers with different activities and pathway of elimination poses a great problem. There
will be need for changing the dosage only if genotype or phenotype predictably affects the active
moieties at site of action of the drug. In addition, the therapeutic index of the drug and the
benefits of the prospective tests need when compared with the cost implication must be assessed
before recommending any pharmacogenetics tests/guidelines. (38)
It has been established that pharmacogenetics testing in relation to drug metabolizing enzymes
for certain drugs will enhance case management. Dosing regimens have also been provided for
such drugs.
1. Selective Serotonin Reuptake inhibitors (e.g. paroxetine, fluvoxamine): The Clinical
Pharmacogenetics Implementation Consortium (CPIC) dosing guideline for paroxetine
recommends an alternative drug not predominantly metabolized by CYP2D6 for CYP2D6
ultra rapid metabolizers and for CYP2D6 poor metabolizers. For CYP2D6 poor
metabolizers, if paroxetine use is warranted, consider a 50% reduction of recommended
starting dose and titrate to response.(115) For fluvoxamine, the CPIC recommends a 25-
lxiii
50% reduction of recommended starting dose and titrate to response or use an alternative
drug not metabolized by CYP2D6 for CYP2D6 poor metabolizers.(115)
2. Tricyclic antidepressants (e.g. amitriptyline, nortriptyline, clomipramine, imipramine,
trimipramine, doxepin, and desipramine): For amitriptyline and nortriptyline, the CPIC
guidelines recommends an alternative drug for CYP2D6 or CYP2C19 ultra rapid
metabolizers and for CYP2D6 poor metabolizers. Also, to consider a 50% dose reduction
for CYP2C19 poor metabolizers and a 25% dose reduction for CYP2D6 intermediate
metabolizers. In addition, it was suggested that the same dosing guideline be applied to
other tricyclic antidepressants since they have comparable pharmacokinetic
properties.(116)
3. Atypical antipsychotics (e.g. risperidone): The Dutch pharmacogenetics Working Group
(DPWG) guidelines recommends selecting an alternative drug or be extra alert to adverse
drug events for patients who are CYP2D6 poor metabolizers, intermediate metabolizers,
or ultra-rapid metabolizers with risperidone. Also to adjust risperidone dose to clinical
response.(103)
4. Codeine: Poor metabolism impedes the conversion of codeine to active morphine and
hence no or reduced analgesic activity. Also there is rapid formation and accumulation of
active metabolites in ultra-rapid metabolizers with the possibility of adverse drug
reactions. The Clinical Pharmacogenetics Implementation Consortium (CPIC)
recommends an alternative analgesics for CYP2D6 ultra-rapid and poor metabolizers.
And a label recommended age-or weight specific codeine dose is warranted for CYP2D6
extensive and intermediate metabolizers.(47, 117)
lxiv
5. Tramadol: For CYP2D6 poor metabolizers, the Dutch Pharmacogenetics Working Group
DPWG recommends selection of an alternative to tramadol (not oxycodone or codeine)
and be alert for symptoms of insufficient pain relief. For CYP2D6 intermediate
metabolizers, the prescriber should be alert for symptoms of insufficient pain relief, and
consider dose increase or select an alternative to tramadol (not oxycodone or codeine).
For CYP2D6 ultra rapid metabolizers, use a 30% decreased dose and be alert for adverse
drug events, or use an alternative to tramadol (not oxycodone or codeine).(103)
6. Tamoxifen: For CYP2D6 poor and intermediate metabolizers, the DPWG recommends
using an aromatase inhibitors for postmenopausal women due to increased risk for
relapse of breast cancer with tamoxifen. And to avoid concomitant use of CYP2D6
inhibitors in intermediate metabolizer.(103)
7. Metoprolol: To select another drug or reduce the dose of metoprolol for CYP2D6 poor
and intermediate metabolizers’ patients. And to use a dose titration of metoprolol for
CYP2D6 ultra rapid metabolizers or select an alternative drug.(103)

lxv
2.6.4.2. Pharmacogenetics testing of CYPs
Generally, two approaches are employed in the determination of variations in enzymatic
activities or allelic variants; genotyping and phenotyping. It may help in predicting the right dose
for the patients, and anticipating toxicities or therapeutic inefficacies.
2.6.4.2.1. Genotyping
Genotyping involves the determination of an individual’s DNA sequence and analysis of
functional genetic mutations coding for specific enzymes. It is possible to predict the phenotype
based on the alleles identified. It reveals the specific alleles that an individual has inherited
which may in turn affect the activity of drug metabolizing enzymes. Genotyping begins with
DNA extraction from (nucleated) cells of blood, oral mucosa and other easily accessible tissues
and organs of an individual using various standardized methods such as phenol-chloroform
method (118) or commercially available DNA isolation kits. The specific alleles are then
identified from the extracted DNA using genotyping methods such as restriction fragment length
polymorphism identification (RFLPI) of genomic DNA, random amplified polymorphic
detection (RAPD) of genomic DNA, amplified fragment length polymorphism detection
(AFLPD), polymerase chain reaction (PCR), DNA sequencing, allele specific oligonucleotide
(ASO) probes and hybridization to DNA microarrays or beads. Although it provides direct tools
in the identification of specific isozymes and therefore understanding of enzyme polymorphism,
it does not take the influence of environmental factors on the activity of the target enzymes into
consideration. Other advantages and disadvantages of genotyping are discussed below.
lxvi
Advantages of Genotyping
1. Intra-individual variability is not significant. This is because the genetic composition of
an individual is relatively constant and the same results is expected if the genotyping is
repeated severally. Therefore there is no need to repeat the genotype of an individual
once it is done.
2. The current genotyping methodologies are simple PCR-based assay and requires small
amount of whole blood and the techniques are easily adaptable in any molecular
laboratory.
3. Easier to use than biochemical measurements in a clinical setting. This is because it
requires only a single sample e.g. finger prick or buccal swab unlike in phenotyping
where you need venous blood, biopsies or saliva as the case may be.
4. Rapid bedside test. Genotyping can be done at the bedside of patients as there exist some
rapid diagnostic kits that can be used.
5. Sample can be obtained at the screening visit and results obtained before the washout
period is over.
6. Genotype is very useful in the early part of clinical trial for proper selections of
participants.
7. Retrospectively, post-marketing issues can be addressed by post-marketing collection of
DNA samples and subsequent pharmacogenomics analysis.
Disadvantages of Genotyping
1. Genotyping is not yet available for all CYPs.
lxvii
2. The presence or absence of a particular alleles may not absolutely determine the
phenotype. This is because some alleles may not be expressed.
3. It cannot measure the influence of the environmental factors such as drug-drug
interactions on the activities of the enzyme.
4. The facilities and expertise are not readily available especially in the developing
countries.
5. It is challenging for drugs with narrow therapeutic indices as intermediate metabolizer
cannot be readily identified.
6. Specific drug-drug interactions can convert extensive metabolizers to poor metabolizers
7. Ethical issues surrounding genotyping including fear of invasion of privacy, fear of
employer/insurance companies getting access to the genotype data
2.6.4.2.2. Phenotyping
Phenotyping consists of the administration of a probe drug metabolized by an individual specific
enzyme. It affords direct assessment of a person’s actual enzymatic activity by consecutive
measurement of their metabolites in body fluids. The commonly used body fluids include urine
and blood. Example of documented probe drugs for some CYPs are found on table 2.6.
There are two in vivo methods usually employed for identifying phenotypes, namely, the
selective (CYP-specific) and mixed (or cocktail) methods. The selective method of phenotyping
involves administering one probe drug. (119) The mixed or cocktail method involves the
simultaneous administration of multiple probe drugs specific for individual cytochrome P450.
The latter offers an economic advantage because many enzymes are evaluated at the same
time.(120, 121) Usually the metabolic ratio (MR) of the parent compound and its CYP-mediated
lxviii
metabolite is calculated after quantification by adequate analytical methods such as high
performance liquid chromatography (HPLC) or liquid chromatography mass spectrometry/mass
spectrometry (LCMS/MS) assays. The concentration of specific substrate and its identified major
metabolite in the body fluids (a ratio of molar concentrations; metabolic ratio) serves as a
measure of the individual’s CYP activity. Histograms of log-transformed metabolic ratios may
show cut-off values of MR which distinguish EMs from PMs, UMs or IMs. Phenotyping is
necessary because environmental factors may have influence on enzymatic activity. Other
advantages and disadvantages of phenotyping are discussed below.
Advantages of phenotyping
1. The influence of environmental factors can be evaluated.
2. It is possible to determine the activities of several enzymes (e.g. CYP) in a single test.
3. It provides information on the real-time (in-vivo) activity of the enzymes and may
therefore provide the most clinically relevant information as it reflects a combination
of genetic, environment and endogenous factors.
4. It may be helpful in drug-drug interactions studies of novel therapeutics because of
inherent interpatient variability in safety or efficacy
Disadvantages of phenotyping
1. Intra individual variability may be significant. Susceptibility to environmental
changes, unlike genotyping which is not.
2. The length of time it takes to determine metabolic states delays administration of
the test drug.

lxix
3. The involvement of other CYP isoform in the metabolism of the probe drug may
confound the interpretation of results.(122)
4. In patients on maintenance therapy, withholding treatment to permit phenotyping
would not be practical.(122)
5. Careful drug screening must be used as there may be significant drug-drug
interaction with inhibitors or inducers that may leads to inaccurate metabolic
measurements. For example, patients taking drugs that inhibit CYPs may have
reduced metabolite formation and misclassified as poor metabolizer.(122)
6. Rate of metabolism of the probe drug may not be a reflection of that of the test
drug.
7. Occurrence of side effects and pharmacokinetics-pharmacodynamics interactions
between the probes when therapeutic doses of probes are used.
8. Limited information is available about phenotyping in special groups including
children, elderly and patients with impaired function of the liver and kidney.(122)
9. Tedious sample collection, in terms of multiple sample (blood, urine etc.) and time
that patients have to wait for phenotyping.
The present lack of comprehensive knowledge of genotype-phenotype correlations represents a
limitation of the application of genotyping for pharmacogenomics decision making. The
phenotype is what is important to the physicians and unfortunately, present DNA-based tests can
fail to reflect the full range of phenotypic variation. As a result, a major challenge for companies
designing DNA-based tests is to develop dependable, economical, high-throughput genotyping
platforms, and a major challenge for pharmacogenomics science is to determine comprehensive,
clinically useful genotype-phenotype correlation .(123)

lxx
Table 2.6: Examples of established probe drugs for selected CYPs
CYPs Probe drug(s)
CYP2D6
CYP2C19
CYP1A2
CYP2A6
CYP3A
CYP2C9
CYP2B6
Debrisoquine, Sparteine, dextromethorphan, metoprolol
Omeprazole
Caffeine
Nicotine
Erythromycin, dapsone, endogenous cortisol, midazolam
Warfarin, tolbutamide, losartan, flurbiprofen
Bupropion
lxxi
2.6.4.3. Cytochrome P450 2D6 (CYP2D6)
CYP2D6 gene is located on chromosome 22q13.The enzyme is largely non-inducible and
represents about 1-5% of the total cytochrome P450 in the liver. (124, 125)The enzymatic action
of CYP2D6 is genetically determined and has a polymorphic distribution in most populations.
This can result in 30-40 fold differences in substrate drug clearance resulting in concentration
outside both sides of the therapeutic range in a fraction of treated patients.(23, 32) Human inherit
two alleles for CYP2D6 gene, one from each parent. Each allele may be normal or wild
(designated ‘wt’) or variant type (designated ‘vt’). Hence, genotypically, an individual may be
homozygous wild type (wt/wt), heterozygous (wt/vt), or homozygous variants (vt/vt). (126)The
following are examples of the alleles with different activities based on inheritance. (127)
1. CYP2D6 with non-functional or null alleles (vt/vt): CYP2D6*3, CYP2D6*4, CYP2D6*5,
CYP2D6*6, CYP2D6*7, CYP2D6*8, CYP2D6*11, CYP2D6*12, CYP2D6*13, CYP2D6*14,
CYP2D6*15, CYP2D6*16, CYP2D6*18, CYP2D6*19, CYP2D6*20, CYP2D6*21,
CYP2D6*31, CYP2D6*36, CYP2D6*38, CYP2D6*40, CYP2D6*42, CYP2D6*44,
CYP2D6*47, CYP2D6*51, CYP2D6*56, CYP2D6*62
2. CYP2D6 with increased or normal alleles (wt/wt): CYP2D6*1, CYP2D6*2, CYP2D6*27,
CYP2D6*33, CYP2D6*35, CYP2D6*48, CYP2D6*53
3. CYP2D6 with alleles with reduced activity (wt/vt): The individuals possess one wild and one
null alleles (wt/vt) e.g. CYP2D6*10, CYP2D6*17, CYP2D6*29, CYP 2D6*41, CYP2D6*49,
CYP2D6*50, CYP2D6*54, CYP2D6*55, CYP2D6*59, CYP2D6*72
4. CYP2D6 with functionally undetermined alleles: CYP2D6*22 to *26, CYP2D6*28,
CYP2D6*30, CYP2D6*32, CYP2D6*34, CYP2D6*37, CYP2D6*39, CYP2D6*43,

lxxii
CYP2D6*45, CYP2D6*46, CYP2D6*52, CYP2D6*68, CYP2D6*70, CYP2D6*71,
CYP2D6*73, CYP2D6*74, CYP2D6*75, CYP2D6*82
Depending on the combination of CYP2D6 alleles present, an individual may be classified as
poor metabolizers (PMs), intermediate metabolizers (IMs), extensive metabolizers (EMs) and
ultra-rapid metabolizers (UMs). In UMs there is duplication of the wild alleles (≥ 2 wt) and it is
autosomally inherited.
The CYP2D6 genotype and phenotype vary greatly among populations of different racial origin
in the world. The most common alleles among the different races are Caucasians (CYP2D6*2,
CYP2D6*3, CYP2D6*4, CYP2D6*5, CYP2D6*6, CYP2D6*10, CYP2D6*41) (128), Asians
(CYP2D6*10, CYP2D6*36) (128, 129) and African (CYP2D6*17, CYP2D6*2) (128, 130, 131).
The prevalence of the CYP2D6 phenotypes among races are shown in table 2.7.
To assess the CYP2D6 phenotype of an individual, the clearance of a substance exclusively
metabolized by the CYP2D6 would be the most appropriate. However, this may not be feasible
all the time because of environmental factors and renal excretion. Therefore, to accurately assess
its enzymatic activity, it will be necessary to determine the partial clearance of a compound
which it metabolizes to its dependent metabolite. The metabolic ratios of some CYP2D6 probe
drugs have been established e.g. debrisoquine, dextromethorphan, metoprolol, sparteine and
tramadol. (132-135)
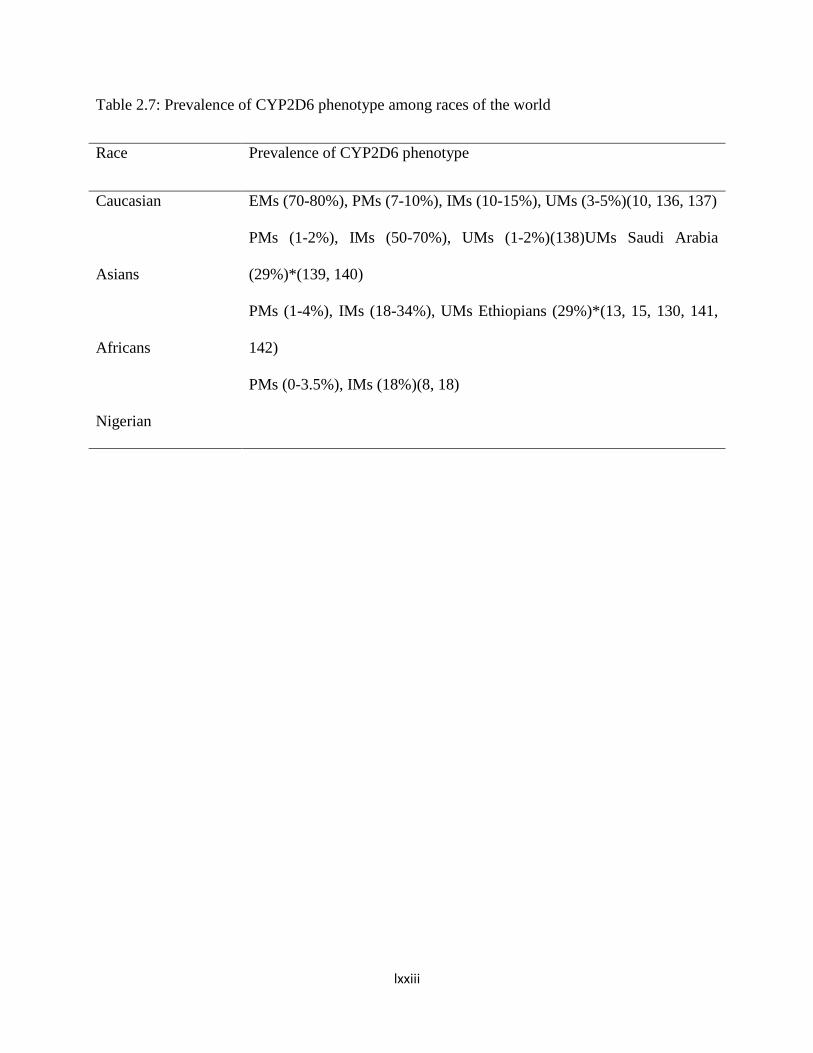
lxxiii
Table 2.7: Prevalence of CYP2D6 phenotype among races of the world
Race Prevalence of CYP2D6 phenotype
Caucasian
Asians
Africans
Nigerian
EMs (70-80%), PMs (7-10%), IMs (10-15%), UMs (3-5%)(10, 136, 137)
PMs (1-2%), IMs (50-70%), UMs (1-2%)(138)UMs Saudi Arabia
(29%)*(139, 140)
PMs (1-4%), IMs (18-34%), UMs Ethiopians (29%)*(13, 15, 130, 141,
142)
PMs (0-3.5%), IMs (18%)(8, 18)
lxxiv
2.6.4.3.1. CYP2D6 Probe Drugs
The commonly used suitable probe drugs for CYP2D6 phenotyping are debrisoquine, sparteine,
tramadol, metoprolol and dextromethorphan. (143, 144)
Both debrisoquine and sparteine are considered appropriate probe drugs but concern about
safety, as they cause clinically significant hypotension, and availability make them inferior
compared with other worldwide available and approved probe drugs such as
dextromethorphan.(121, 135, 145)Besides, there is little correlation between the metabolic ratios
of debrisoquine, sparteine and dextromethorphan with that of metoprolol for some non-
Caucasian populations.(6) Fux et al showed that in addition to hypotension caused by metoprolol
in some cases, there was no association between CYP2D6 genotype derived phenotype and
adverse effects during a 6-week course of treatment with metoprolol .(10)Tramadol use as probe
drug is limited because of its poor tolerability. It may cause nausea, vomiting, tiredness or
drowsiness. In addition, large doses are needed for a reliable assay. (146)
2.6.4.3.2. Dextromethorphan (D-3-methoxy-N-methyl morphinan) as CYP2D6 probe
Dextromethorphan is a synthetic analog of codeine. It is normally used in the treatment of cough
as an antitussive by elevating the threshold of cough reflex. (3) It has no analgesic or addiction
proneness and does not act through the opioid receptor. Its potency is nearly equal to that of
codeine but produces fewer subjective and gastrointestinal side effects. It is well established as a
probe drug.(6) It fulfills the criteria for the validation of phenotyping probe drugs and assay used
for cytochrome P450 2D6. Some of the criteria include, wide safety margin and availability, it is
predominantly metabolized by CYP2D6 and can be safely administered to human. (119, 121) It
is well absorbed from the gastrointestinal tract after oral administration. The maximum serum

lxxv
concentration level of the dextromethorphan occurs at about 2.5 hours (147) while that of its
major metabolite (dextrorphan) occur at about 1.6 to 1.7 hours. (148) Other metabolites of
dextromethorphan are 3-hydroxymorphinan and 3-methoxymorphinan. The onset of action is
rapid, often beginning between 15 to 30 minutes after administration. It is widely distributed and
does not bind to plasma protein. It has a half-life of between 2 and 4 hours in individuals with
normal metabolism (EMs) and between 21.1 and 37.9 hours in PMs. The dextromethorphan
metabolic pathway (figure 2.7a&b) is mediated by θ-demethylation to dextrorphan (DOR), its
major active metabolite, by CYP2D6, and N-demethylation to 3-methoxy-morphinan (3-MEM)
via CYP3A4/5. (149, 150) 3-Methoxymorphinan (3-MEM) is further metabolized to 3-
hydroxymorphinan (3-OHM) by CYP2D6. Dextrorphan and 3-hydroxymorphinan may undergo
glucuronidation by uridine diphosphate glucuronosyltransferase (UDP-glucuronosyltransferase,
UDPGT) enzyme and are then eliminated via the kidneys. (151) Less than 0.1% is excreted
through the faeces.
It mediates its action through multiple mechanisms including the opioid sigma 1 and sigma 2
receptors agonist, the serotonin reuptake pump inhibitor (non-selective serotonin reuptake
inhibitor), α3/β4 nicotinic receptor blockers and N-methyl-D-aspartate (NMDA) glutaminergic
receptor antagonist(non-competitive channel blocker) in the central nervous system.(152) It is
contraindicated in patients taking selective serotonin reuptake inhibitors (e.g. fluoxetine,
paroxetine), monoamine oxidase inhibitors; atopic children; people with persistent or chronic
cough (e.g. smoking, emphysema, asthma) or when cough is accompanied by excessive
secretion; and history of hypersensitivity reaction to the drug. It is avoided in individuals taking
alcohol and other central nervous system depressants, because it increases the central nervous
system side effects, including dizziness, drowsiness, difficulty concentration, impairment in
lxxvi
thinking and judgement. Adverse effects are very uncommon at therapeutic doses. However,
dizziness, drowsiness, central nervous depression, nausea, vomiting and abdominal pain may be
precipitated at extremely high doses. (3)
In addition to the CYP34 that is involved in the metabolic pathway of dextromethorphan as
shown in figure 2.6, another enzyme that metabolizes the drug is CYP2C9, although it only
contributes to the formation of dextrorphan (DOR) at increasing dextromethorphan (DEX)
concentration, above the recommended dose for CYP2D6 phenotyping.CYP3A contributes only
minimally to individual variability of the metabolic ratios,(153) and several isoenzymes of
cytochrome P450 including CYP3A/4, CYP3A5, CYP3A7, CYP2C9, and CYP2C19 catalyze the
alternative pathway of dextromethorphan (DEX) metabolism to 3-methoxymorphinan.(154-156)
The specificity of the metabolic step DEX/DOR was evaluated as high enough and reliable for
measuring the activity of CYP2D6 in humans.(148, 157-159) Dextromethorphan has been
validated as the best probe drug using the proposed validation criteria and it remains the most
widely used probe for CYP2D6 metabolic activity assessment in vivo. It supersedes other probe
drugs because of its worldwide availability, good tolerability and well characterized metabolic
profiles. (143, 145, 160, 161) It can be used for detecting CYP2D6 activity in a variety of body
fluids including urine, blood and saliva.
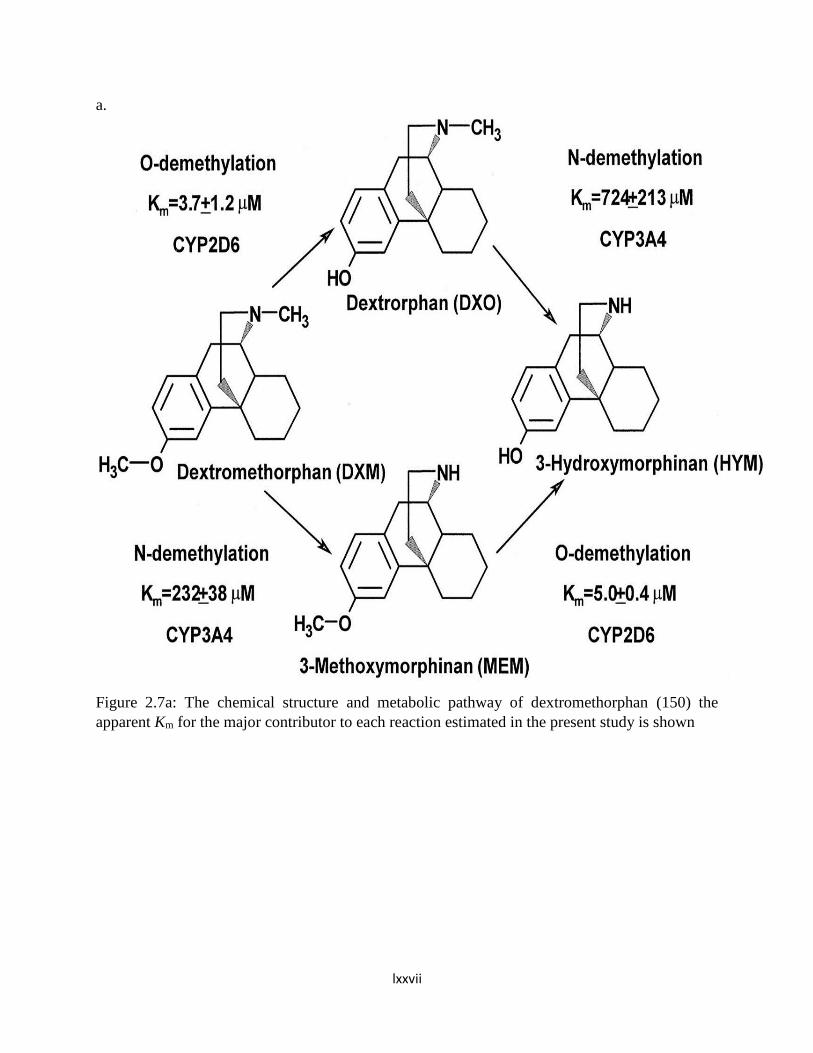
lxxvii
a.
Figure 2.7a: The chemical structure and metabolic pathway of dextromethorphan (150) the
apparent Km for the major contributor to each reaction estimated in the present study is shown

lxxviii
Figure 2.7b: The chemical structure and metabolic pathway of dextromethorphan (162)
lxxix
2.6.4.3.3. Metabolic Ratio (MR) in biological matrices
Metabolic ratio is the differences in the metabolic ability of enzymes, and can be obtained
indirectly by relating the ratio of the molar concentration of the unchanged drug to that of its
dependent metabolite collected in the biological fluid (drug/metabolite). It has been employed in
CYP2D6 phenotyping with different probes including debrisoquine (debrisoquine/4-
hydroxydebrisoquine), (13, 58, 163) sparteine (sparteine/2- +5-dehyrosparteine), (18, 59)
metoprolol (metoprolol/α-hydroxymetoprolol) (18, 164) and dextromethorphan (DEX/DOR).
(165-167)
In determining the CYP2D6 phenotyping, 8-hour urine collection is known to match the 24-hour
collection hitherto 8-hour urinary metabolic ratios of the probe drugs are employed for
debrisoquine, sparteine, metoprolol and dextromethorphan. And inter-individual variability in
CYP2D6 activity are obtained by finding the appropriate cut off points (antimode) in the
logarithm transformed metabolic ratio (log MR). This cut off point can be used to separate
individuals into extensive, intermediate, poor and ultra rapid metabolizers depending on the
sensitivity of the analytical methods employed. Although the antimode may differ from one race
to another and differences in the laboratory methods/techniques, certain antimode have been
validated for the different probe drugs in differentiating poor from extensive metabolizers. For
example studies have categorized PMs as individual with an MR greater than 12.6, (165)20,
(166, 167) 1.10(164) and 0.3(168) for debrisoquine, sparteine, metoprolol and dextromethorphan
respectively (table 2.8).
The methods that are employed in determining the appropriate cut off metabolic ratio for
separating different phenotypes, in addition to values from literature, are receiver operating
characteristics (ROC),(169) histogram and probit plots.(170)
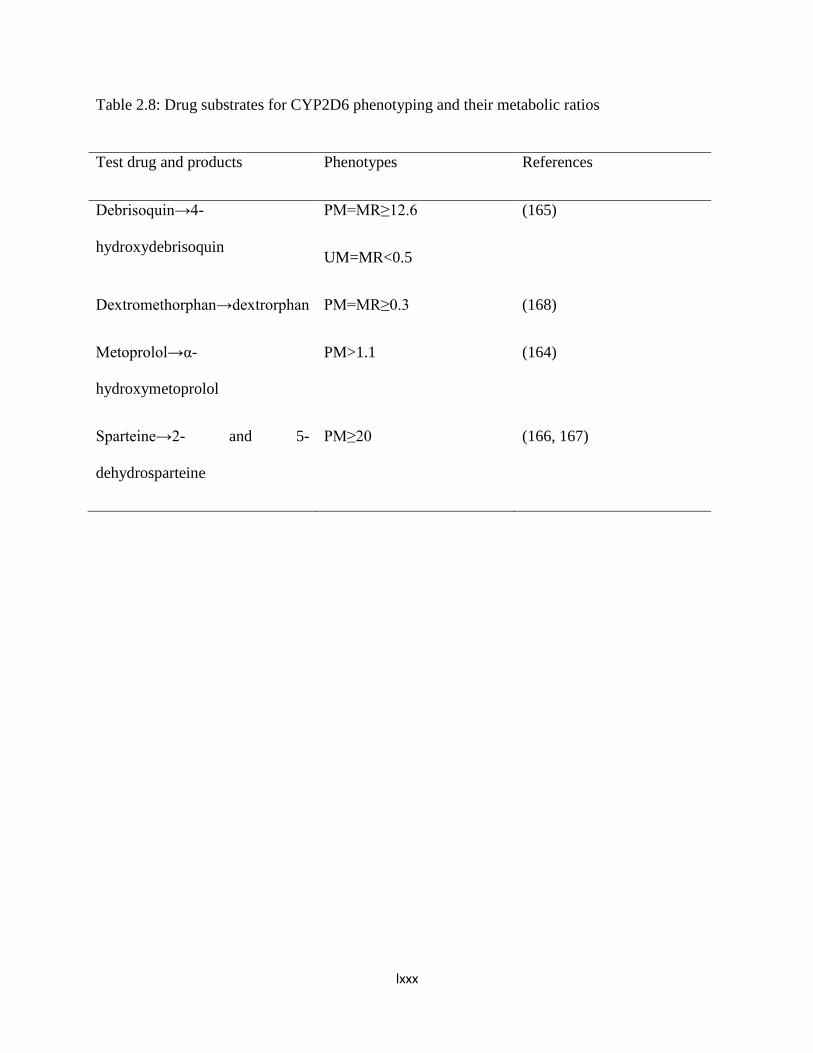
lxxx
Table 2.8: Drug substrates for CYP2D6 phenotyping and their metabolic ratios
Test drug and products Phenotypes References
Debrisoquin→4-
hydroxydebrisoquin
PM=MR≥12.6
UM=MR<0.5
(165)
Dextromethorphan→dextrorphan PM=MR≥0.3 (168)
Metoprolol→α-
hydroxymetoprolol
PM>1.1 (164)
Sparteine→2- and 5-
dehydrosparteine
PM≥20 (166, 167)

lxxxi
2.6.4.3.4. CYP2D6 Phenotyping with Dextromethorphan using Urinary Assay
The urinary metabolic ratio of DEX/DOR is widely used to assess CYP2D6 because of
its non-invasiveness. Study has shown that the metabolic ratios obtained with 24 hours
urine were highly correlated with those in either the 8hour (r=0.967, p<0.0001) or 4 hours
urines (r=0.946, p=0.0001).(171) Advantages of urinary matrix include its non-
invasiveness, convenience, reliability and has been widely validated for CYP2D6
phenotyping. However, it may not be possible in children, psychiatric patients and even
some non-psychiatric adults may not completely empty their bladder. Normally, urine
samples are de-conjugated with B-glucuronidase before measurement in order to include
the entire amount of unbound DOR and 3-hydroxymorphinan (3-OHM). Study has shown
a significant inverse relationship between physiologic urinary PH and sequential
DEX/DOR metabolic ratio, and may lead to a 20 fold variation in urinary DEX/DOR
metabolic ratio.(172) Lower recoveries of dextrorphan were found in patients with
impaired renal function.(173) However, this lower recovery may be corrected by
increasing the collection period.(174) Most phenotyping studies are carried out with the
urinary DEX/DOR metabolic ratio of the 0- to 8 hour collection interval. The correlation
between the metabolic ratios of the different urine collection intervals for CYP2D6
phenotyping were investigated and found to be suitable for the 4-hour, 6-hour, 8-hour and
12-hour but not for 2-hour interval.(175) Chladek et al also found good correlation
between the urinary DEX/DOR metabolic ratio of the 4-h and 8-h samples with 24-h
interval.(171)In addition, Anna Wojkczak et al found 10-hour urine collection interval
suitable for CYP2D6 phenotyping following administration of 40 mg dextromethorphan
lxxxii
among healthy volunteers of Polish origin.(176) Studies in Africa also found good
correlation with 8 hours urine collection using 30 mg of dextromethorphan.(8, 177)
Urinary MRs of DEX/DOR of the 0-8 hour sample can be regarded as an appropriate
metric with its advantage being shorter collection time compared with the MRs of the 12-
and 24-h collection intervals. However, the discomfort of having to stay for longer period
of time for urinary collection, effect of urinary PH and renal impairment necessitated the
need for the validation of other body fluids for phenotyping with DEX.
2.6.4.3.5. CYP2D6 Phenotyping with Dextromethorphan using plasma/ serum
This is one of the alternative procedures developed because of the highly demanding
nature of the 8-h sampling urine, effect of urinary pH and renal impairment. It is more
representative, requires only one sample collection and not time consuming. However,
limitations are mainly due to the low analyte concentrations, thus sensitive analytical
methods are needed for the purpose of phenotyping using plasma/serum.
Kӧhler et al showed that the 1-hour sample was able to differentiate between EM and PM
and suggested a value of 0.126 using the 1-h post-dose metabolic ratio of
DEX/DOR.(178)Shiran et al. suggested a value of 0.1 for differentiating between EM and
PM using 3-hour post-dose MR of DEX/DOR (179) whereas Jurica et al. in a recent
study conducted among Caucasians indicated a cut-off (determined by receiver operating
characteristics (ROC)) of 0.215- 0.742 discriminating IM from PM and the cut-off value
for discriminating PM from IM +EM was 0.21-0.742 3-hour post-dose MR of
DEX/DOR.(169) This finding corroborate the need to determine the antimode of MR for
separating phenotypes in different races unless it has been validated. Jurica et al. also

lxxxiii
demonstrated a good correlation between serum and urinary metabolic ratio of
DEX/DOR. (169) The MRs of the 3-, 4-, 6- and 8-h serum samples were compared with
oral clearance of dextromethorphan and its AUC for 10 subjects. The correlation were
r=0.60-0.74, p<0.003 between serum MRs and oral clearance, and r=0.79-0.88 between
the MRs and the AUC of DEX respectively.(180) It was concluded from the above study
that samples at 2, 3, 4, 5 and 8 h after drug administration serves well for phenotyping
purposes.(181)
2.6.4.3.6. Analytical Methods for Dextromethorphan and Dextrorphan in Biological
Matrices
The various analytical methods that have been employed for the determination of
dextromethorphan and Dextrorphan in the biological fluids include direct fluorescence
spectrometry,(182) radioimmunoassay,(183) gas-liquid chromatography,(168) high-performance
liquid chromatography (HPLC)(153, 184-186) and Liquid Chromatography–Mass
Spectrometry/Mass Spectrometry (LC-MS/MS). (151, 187, 188) LC-MS/MS is considered as the
most preferred method because of its high sensitivity but cost and availability limit its usage.
High performance liquid chromatography (HPLC) with fluorescence detector is the most
commonly employed analytical technique for dextromethorphan and its metabolites in biological
matrices.
Reversed phase HPLC is the most commonly used, and though it makes use of column with
similar size with normal phase, the silica-based column is modified to non-polar, “reversed”, by
attaching long hydrocarbon chains to its surface (either 8 or 18 carbon atoms). Also a polar

lxxxiv
solvent is used e.g. water and methanol, and this allow for faster movement of polar molecules
through the non-polar stationary phase.
In separating dextromethorphan and its metabolites, reversed phase HPLC is commonly used and
different types of column have been used, though with different sensitivities and recoveries.
Example of such column include phenyl column, (153, 169, 189-191) cyano column (192) and
C18 column. (186, 193, 194). However, phenyl column is preferred as it produces adequate
separation. (195)
Of all the established detectors used in HPLC, Ultraviolet Visible spectrophotometry (UV-VIS),
photo diode Array, fluorescence, mass spectroscopy, electrochemical detector, refractive index
and light scattering detector, the most commonly used detectors for dextromethorphan and
Dextrorphan are UV-VIS detector and fluorescence detector.(153, 171, 184) In the assay of DEX
and DOR, fluorescence detector offers greater sensitivity over UV-VIS detector. (191)

lxxxv
CHAPTER THREE
MATERIALS AND METHODS
3.1. Setting
According to the 2006 population census, Nigeria has a population of over 154 million, (25)
across the 36 states, and the Federal capital territory. Nigeria is divided into six geopolitical
zones namely; South-west, South-east, South-south, North-east, North-west and North-central
zones. There are about 371 ethnic groups in the Country, and Yoruba ethnic group is one of the
major ones. Together with the two other major ethnic groups, Hausa and Ibo represent about
68% of Nigerian population (24, 25). The Yoruba Nigerians inhabit the Southwestern and some
part of the North central Nigeria. Historically, the Yoruba people were said to have migrated
from Mecca, Saudi Arabia under the leadership of Oduduwa, and have settled in the present day
Ile-Ife, Osun State, Southwest Nigeria at about 600 BCE. Yorubas are also found in the Republic
of Benin and Togo, West Africa. (196) They constitute about 21% of the total population of
Nigeria, that is about 32.34 million.
3.2. Location of the Study
The study was coordinated at the University College Hospital (UCH), Ibadan located in Oyo
State, Southwestern Nigeria (Longitude 3.916667°E, Latitude 7.396389°N). Ibadan is the capital
of Oyo State. It has accommodated the central of administration of regional and subsequently
State government since the pre-independence era. The population of Ibadan is 2,338,659

lxxxvi
according to 2006 census. The University College hospital (UCH) was established by an act of
parliament in November, 1952 in response to the need for the training of medical personnel and
other healthcare professionals for the country and the West African Sub-Region. It serves as an
apex referral center for patients from every part of Nigeria and neighbouring West African
countries. The hospital provides health services at all levels, from primary to tertiary particularly
for residents of Ibadan and its environs. It is an 850- bed space hospital. It provides services in
all subspecialties of Internal Medicine, Surgery, Obstetrics & Gynecology, Pediatrics,
Otorhinolaryngology, Ophthalmology, Anesthesia, Laboratory Medicine, Psychiatry,
Community Medicine, General Medical Practice, Radiology, Radiotherapy and Dentistry.
Medical patients in all subspecialties, including Cardiology, Clinical Pharmacology,
Dermatology, neurology, Nephrology, Gastroenterology, Endocrinology, Respiratory and
Infectious diseases.
3.3.Ethical approval
Ethical approval was obtained from University of Ibadan/University College Hospital (UI/UCH)
Ethical Review Committee (Appendix 1).
Each participant gave a written informed consent (Appendix 3) following the explanation of the
nature and procedure involved in the study. They were also informed about the voluntary nature
of the study, and the obligations of the investigators including the observance of strict
confidentiality.
3.4.Design and Study Population
There was no formal advertisement but adult Nigerians of Yoruba ethnic group were informally
invited to participate in the study by visiting social functions, community meetings where the

lxxxvii
study was introduced. Individuals of Yoruba descent were thereafter requested to come to the
Clinical Pharmacology ward at the University College Hospital. They were instructed to abstain
from taking any natural remedy or over-the-counter drugs two weeks before the test. The
participants were enrolled in batches of between 10 and 12 on each of the recruiting days
between 2 September and 30 September, 2014. Full cognizance was taken of the convenience of
the participants in determining their schedule for enrolment.
The study design was quasi-experimental involving healthy participants. It was ensured that no
two participants were blood relations. The minimum sample size was calculated using the
prevalence of poor metabolisers obtained in a similar study conducted at Ile-Ife.
The assay of dextromethorphan and dextrorphan took place at the Central Science Laboratory
(CSL) of the Obafemi Awolowo University (OAU), Ile-Ife with High Performance Liquid
Chromatography (HPLC) with UV detector.
3.5.Sample Size Determination
Minimal sample size was determined using Fisher’s statistical formula.
n=Zα2 x p (1-p)
d2 Where n = sample size
Z = 1.96, that is standard normal deviate at 95% confidence interval
P = expected prevalence or proportion of the outcome of interest =0.035(the expected
proportion of poor metabolizers in Nigeria is 3.5% in recent study conducted in Ile-Ife (8)
d = precision (if 5%, d = 0.05)

lxxxviii
n=1.962X 0.035(1-0.035) =52
0.052
The minimum sample size, n=52
3.6.Eligibility/ Inclusion Criteria
Male or female Yoruba-Nigerians aged 18 - 50 years
Informed consent of the participant
Non-smoking
Not on any medication at enrolment or the two weeks preceding enrolment
3.7.Exclusion criteria
Persons with any chronic illness, for example, hypertension, chronic kidney disease,
diabetes mellitus
Chronic use of alcohol or any other recreational drugs
Oral contraceptives
Pregnancy
Lactation
Allergy to dextromethorphan and related drugs
3.8.1.Chemicals and drugs
The chemicals and drugs used are shown in table 3.1
3.8.2. Equipment

lxxxix
The equipment and their source are shown in table 3.2
Table 3.1: The chemicals, source and quality
Chemicals Source Quality
Dextrorphan tartrate Toronto Research Chemical HPLC grade
Dextromethorphan hydro
bromide Sigma-Aldrich chemical company,
Steinheim, Germany HPLC grade
Levallorphan tartrate Sigma-Aldrich chemical company,
Steinheim, Germany
HPLC grade
Acetonitrile Sigma-Aldrich chemical company,
Steinheim, Germany
HPLC grade
Methanol Sigma-Aldrich chemical company,
Steinheim, Germany HPLC grade
β-glucuronidase (Helix
Pomata) Sigma-Aldrich chemical company,
Steinheim, Germany HPLC grade
Anhydrous sodium carbonate BDH Chemical limited, England Analytical grade
Anhydrous sodium acetate BDH Chemical limited, England Analytical grade
Orthophosphoric acid BDH Chemical limited, England Analytical grade
Potassium dihydrogen
orthophosphate (KH2PO4
BDH Chemical limited, England Analytical grade
Hydrochloric acid BDH Chemical limited, England Analytical grade
Ascorbic acid BDH Chemical limited, England Analytical grade
Hexane and n-Butanol Scharlau SL Gato Parez, Spain Analytical grade
Triethylamine Burgoyne reagents, India Analytical grade
Dextromethorphan
hydrobromide syrup
(Tussipect), Belgien
1.5mg/mL
Benjamin Michael Pharmacy, Lagos
Table 3.2: The Equipment and their sources

xc
Equipment Sources
Agilent 1260 series HPLC system Agilent Technologies, Germany
Quaternary pump VL (model G1311C) Agilent Technologies, Germany
A gradient mixer with a system purge Agilent Technologies, Germany
The injector (manual injector valve with a 20 µl sample
loop)
Rheodyne, USA
Online vacuum degasser Agilent, Japan
Sample detector with a variable wavelength (VWD)
(190-600nm) standard version (model G1311B)
Agilent Technologies, Germany
LC3D Chemstation software and window 2007 Agilent Technologies, Germany
Eclipse plus C-18 reverse phase HPLC column (3.5 µm
particle size and 100 x 4.6 mm, i.d.)
Agilent, USA.
xci
3.9. Conduct of the Study
Subsequently the participants were interviewed with respect to their medical history and were
physically examined including blood pressure, height and weight. Thereafter samples were
collected for laboratory investigations such as full blood count, liver function tests, serum
electrolyte, urea and creatinine, and urinalysis for purpose of determining vital organs functions.
The participants were instructed to fast overnight. Similarly, prior to the administration of
dextromethorphan, participants were instructed to completely empty their bladder. Thereafter, 30
mg of dextromethorphan hydrobromide syrup was given orally followed by about 200 mls of
water intake. Three hours following the administration of dextromethorphan, another 5 mls of
blood was collected, immediately centrifuged for 10 minutes (4000 rpm) and plasma were
transferred to separate sterile plasma tubes. Participants’ urine were collected for an 8 hour
period. Each container for the urine collection contained 2 g of ascorbic acid to acidify the urine.
The total urine volume collected was recorded for each participant and 15 mls aliquots were
taken into containers containing 20 mg ascorbic acid. The plasma and urine samples were stored
at -20oC initially for four weeks and later transferred to -80oC freezer until analysis. Samples
were moved into liquid nitrogen for transportation and final storage prior to analyses at the
Central Science Laboratory (CSL) of the Obafemi Awolowo University, Ile-Ife.
The participants were observed for between 15 and 30 minutes after the urine collection to
observe for occurrence of adverse drug reaction before been allowed to go home.

xcii
3.9.1. Analytical methods (Determination of Dextromethorphan/Dextrorphan in
plasma and urine)
Concentrations of dextromethorphan and dextrorphan were determined in the plasma and urine
by a reversed-phase Agilent HPLC with UV detection with some modification of the method of
Zimova et al. (184) Briefly, 1 ml urine with addition of 0.4 ml sodium acetate (0.2 mol per liter)
and 600-1000 units/sample β-glucuronidase incubated in water bath at 37 oC for 18 hours. 1 ml
of the mixture was subjected to extraction: 0.4 ml Na2CO3 (0.5 mol/liter) was added, 0.1 ml of
internal standard (betaxolol). And 4 ml of mixture hexane: n-butanol, 9:1 v/v), 15 minutes
vortex, centrifugation 2200 rpm for 15 minutes. Then, sample were frozen at -20oC, organic
layer was transferred into conical shaped glass tube and water phase extracted once again. Both
organic phases were subjected to re-extraction: 0.3 ml KHSO4 (0.01 mol/liter) was added, 15
minutes vortex, centrifugation 2200 rpm for 15 minutes. Then, samples were frozen at -20oC,
organic layer was discarded. Water phase was used for HPLC analysis (50 ul). Mobile phase
Acetonitrile: KH2PO4 (0.01 mol/liter), 3:2(v/v), trimethylamine (350 µl/l), PH 3.6 (adjusted by
H3PO4 0.1 mol/liter). Flow rate 0.7 ml/min, column temperature 30 oC, column Tessek phenyl
(150x 3mm, 5 µm), detection: fluorescence detector lambda ex 280, lambda em. 310nm.
Standard curves were analyzed in the concentration range of 0.2 to 5µg/ml for dextromethorphan
and dextrorphan. The internal standard (levallorphan tartrate, LP) in a final concentration of
1µg/ml was added before incubation with β-glucuronidase.
3.9.2. Preparation of Standard Solutions and Solvent System
1. Standard solution of dextromethorphan (1000µg/ml)
1.3mg of dextromethorphan hydrobromide powder (1 mg of dextromethorphan base) was
accurately weighed in an Eppendorf tube on an analytical balance and dissolved in
xciii
1 ml of distilled water.
2. Stock solution of Dextrorphan (1000µg/ml)
1.6 mg of Dextrorphan tartrate powder (1 mg Dextrorphan base) was accurately weighed
in an Eppendorf tube on an analytical balance and dissolved in 1 ml of distilled water.
3. Stock solution of Levallorphan (1000 µg/ml):
1.53 mg of Levallorphan tartrate powder (1mg levallorphan base) was accurately
weighed in an Eppendorf tube and dissolved in 1ml distilled water.
4. Another set of stock solutions of 500 µg/ml, 400µg/ml, 200µg/ml, 100 µg/ml, 50µg/ml and
20µg/ml were prepared from the stocks of dextromethorphan and Dextrorphan. A stock of
25µg/ml solution was prepared from the stock solution (1000 ug/ml) of levallorphan.
3.9.3. Calibration Curve for dextromethorphan and Dextrorphan in urine and plasma
Blank urine (1 ml) sample was each placed in six different extraction tubes and varying amount
of the stock solutions of dextromethorphan ad dextrorphan were added to give concentrations of
0.2µg/ml, 0.5µg/ml, 1.0µg/ml, 2.0µg/ml, 4.0µg/ml and 5.0µg/ml for both dextromethorphan and
Dextrorphan.One ml each of the mixture was pipetted into a 10-ml screw-capped, tapered glass
tube to which were added 0.4 ml Na2CO3 (0.5 mol/litre), 20µL of 25µg/ml levallorphan and 4
ml of mixture, hexane: n-butanol, 9:1(v/v). The mixture was vortexed for 5 minutes and
centrifuged at 4000 rpm for 10 minutes. Then, the organic layer was transferred into another 10
ml screw capped extraction tube and re-extracted by addition of 0.3 mls 0.1M HCL, vortexed for
5 minutes and centrifuged at 4000 rpm for 10 minutes. Then, samples were frozen at -20°C,
organic layer was discarded. The water phase was used for HPLC analysis by injection of 20 µl.
For the plasma, the samples were handled in exactly the same way as urine. The peak area ratio

xciv
was plotted against the concentration of each of the compounds injected. The regression analysis
was done with Microsoft Excel Version 2013.
3.9.4. Chromatographic conditions
The composition of the gradient mobile phase was 30% Acetonitrile: 20% Methanol: 0.06%
Triethylamine: 49.94% KH2PO4 (0.01 mol/litre), vol/vol/vol/vol, adjusted to PH of 3.2 by
orthophosphoric acid (0.1 mol/litre). The flow rate was set 1.5ml/min at the ambient
temperature.The wavelength of the Ultraviolet Visible spectrophotometry (UV-VIS) detector
used was 230nm.
3.9.5. Precision studies for Dextromethorphan and dextrophan in plasma
Intra-day run precision: Three sets, each set consisting of six centrifuge tubes, were used. Each
tube in the first set contained 1 ml of plasma sample spiked with the stock solution of the
dextromethorphan and dextrorphan to give concentration of 0.5µg/ml. The second set contained
1 ml of plasma spiked with stock solution of dextromethorphan and dextrorphan to give a
concentration of 2 µg/ml each, while the third set contained 1 ml of plasma spiked with stock
solution of the dextromethorphan and dextrorphan to give a concentration of 5µg/ml. All the
samples were spiked with 20µL of the 25 µg/ml levallorphan. The extraction was done as
described above and 20µL was injected into HPLC. The coefficient of variation of each set was
computed.
Inter-day run precision: This followed as above for intra-day but a sample for each set was
analyzed daily for 3 days.
xcv
3.9.6. Recovery studies for dextromethorphan and dextrorphan from plasma
Three sets, each set consisting of six centrifuge tubes were used. Each tube in the first set
contained 1 ml of blank plasma spiked with the stock solution of dextromethorphan and
dextrorphan to give a concentration of 0.5µg/ml. The second and third contained the same
amount of blank plasma spiked with the stock solution of dextromethorphan and dextrorphan to
give a concentration of 2µg/ml and 5 µg/ml. All the samples were spiked with 20µl of 25 µg/ml
levallophan and then extracted as described above.
In another sets of centrifuge tubes, the stock solutions were diluted in such a way as to obtain
concentration of 0.5µg/ml, 2µg/ml and 5µg/ml for dextromethorphan and dexrorphan. The three
tubes were spiked with 20 µl of the internal standard solution.
In order to determine the recovery, the peak area ratio of the extraction method and direct
injection method were compared.
3.9.7. Determination of dextromethorphan and Dextrorphan in the plasma and urine
Analysis of test urine samples: To 1 ml of urine sample in an extraction tube, 20 µl of the stock
solution (25 µg/ml) of the internal standard was added. Then 0.4 ml sodium acetate (0.2 mol.l-1)
and 0.4 ml of β-glucuronidase (4000 IU) in 0.14 M sodium acetate buffer (PH=5) was added.
The mixture was incubated in a thermostatic box at 37°C for 18 hours. After the incubation, the
mixture was extracted as above and 20 µl was injected onto the HPLC. The same procedure was
repeated for the plasma including the addition of β-glucuronidase.
xcvi
The metabolic ratio (MR) was calculated as the molar concentration of the dextromethorphan
and dextrorphan in a 0-8-hour urine collection, and 3-hour post dose plasma sample. The
metabolic ratios were used to estimate the activity of CYP2D6.
3.9.8. Data Analysis
The statistical analysis was performed using IBM SPSS Statistics for Windows, version 22 and
Microsoft Excel 2013. Data were double entered and cleaned.The socio-demographic variables
were summarized using descriptive statistics (frequency and percentage). The age, height, weight
and Body Mass Index (BMI) were summarized with mean ± standard deviation. The molar
concentration of dextromethorphan and dextrorphan in the plasma and urine samples were
measured and summarized with mean, median, range and standard deviation. The metabolic ratio
of dextromethorphan/dextrorphan (MRDEX/DOR) was calculated by dividing the molar
concentration of dextromethorphan (µg/ml) by the molar concentration of dextrorphan (µg/ml).
The log MRDEX/DOR at 3 hour for plasma and 8-hour for urine were calculated and used as the
index of CYP2D6 activity.
A probit plot of log MR was constructed for plasma and urine, and the anti-mode (cut-off points)
that separated the phenotypes (poor and extensive metabolizers) were obtained from the graph.
The probit plot was constructed with Microsoft excel 2013, with log MR on the X-axis and
probability % on Y-axis on semi-logarithm graph. The probability % was calculated for each
sample (plasma and urine) using the equation: (197)
Probability %, P=100(i-0.5)
T
Where i= rank of the participant log MR (from 1-89) and T=total number of participants (i.e. 89)
Trend lines were added to the probit plot to get the best line of fit. Based on the best line of fit, a
polynomial equation of regression was obtained and intercept at X-axis was considered as the
xcvii
anti-mode. Individuals with log MR greater than the anti-mode were classified as poor
metabolizers (PMs) while those with the log MR that is lower than the anti-mode were classified
as extensive metabolizers (EMs).
Pearson’s correlation was used to compare the quantitative variables (plasma and urinary
metabolic ratios, age, body mass index) while the independent t test was used to compare mean
values in two groups such as male and female, PMs and EMs. The P value was set at <0.05 for
statistical significance.
xcviii
CHAPTER FOUR
RESULTS
4.1. Socio-demographic Characteristics of the 89 participants
One hundred and four (104) accepted the invitation but after preliminary screening including
ancestry, blood relationship and presence of proteinuria, a total of 93 individuals met the
inclusion criteria and were enrolled. Missing samples (3) and/or incomplete urine sample
collection (1) accounted for non-inclusion of the remaining four participants. Of 89 participants
for whom complete data were obtained, 58(65.2%) were males and 31(34.8%) were females. The
mean age of these participants was 36.1±9.5years. The mean weight, height and Body Mass
Index (BMI) were 64±13.4 kg, 1.69±0.1m and 22.4±4.2 kg/m2 respectively. The gender
differences in age, weight, height and BMI are shown in table 4.2. Other socio-demographic
characteristics of the participants are shown in table 4.1. and fiqure 4.1. One participant reported
mild drowsiness one hour post dose but resolved spontaneously without any intervention. It
could not be ascertained if this was due to dextromethorphan or the “unusual environment and
restriction”
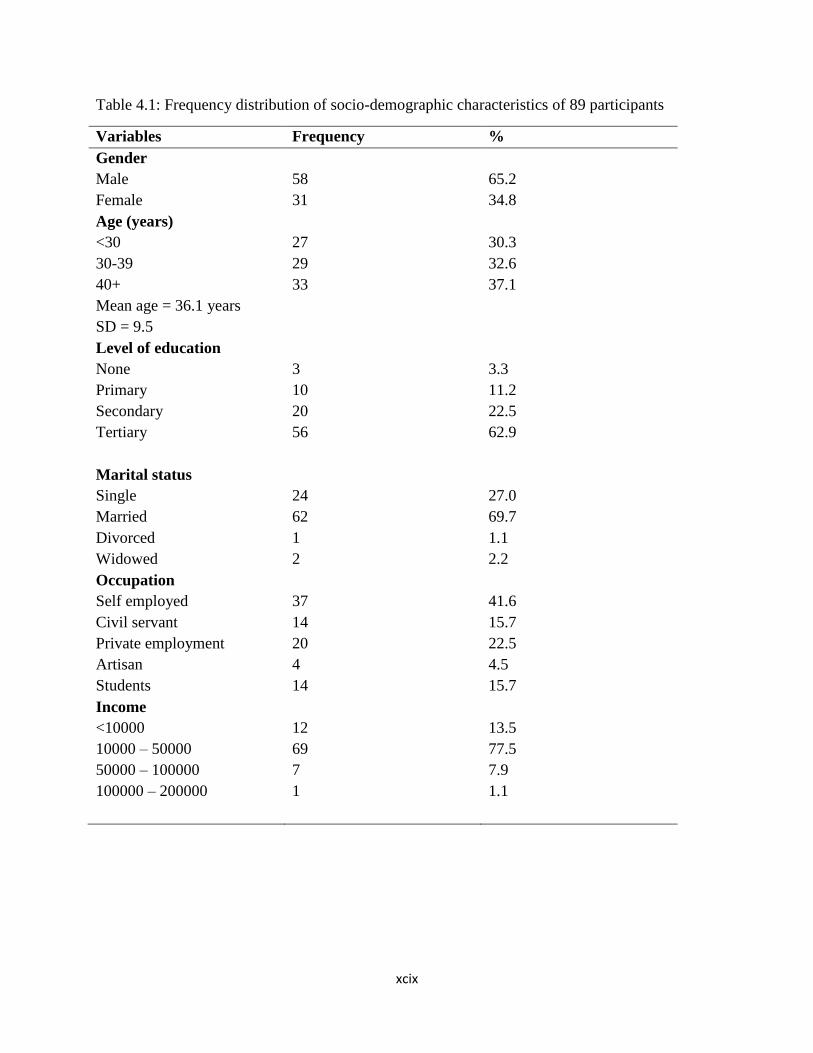
xcix
Table 4.1: Frequency distribution of socio-demographic characteristics of 89 participants
Variables Frequency %
Gender
Male
Female
58
31
65.2
34.8
Age (years)
<30
30-39
40+
Mean age = 36.1 years
SD = 9.5
27
29
33
30.3
32.6
37.1
Level of education
None
Primary
Secondary
Tertiary
3
10
20
56
3.3
11.2
22.5
62.9
Marital status
Single
Married
Divorced
Widowed
24
62
1
2
27.0
69.7
1.1
2.2
Occupation
Self employed
Civil servant
Private employment
Artisan
Students
37
14
20
4
14
41.6
15.7
22.5
4.5
15.7
Income
<10000
10000 – 50000
50000 – 100000
100000 – 200000
12
69
7
1
13.5
77.5
7.9
1.1
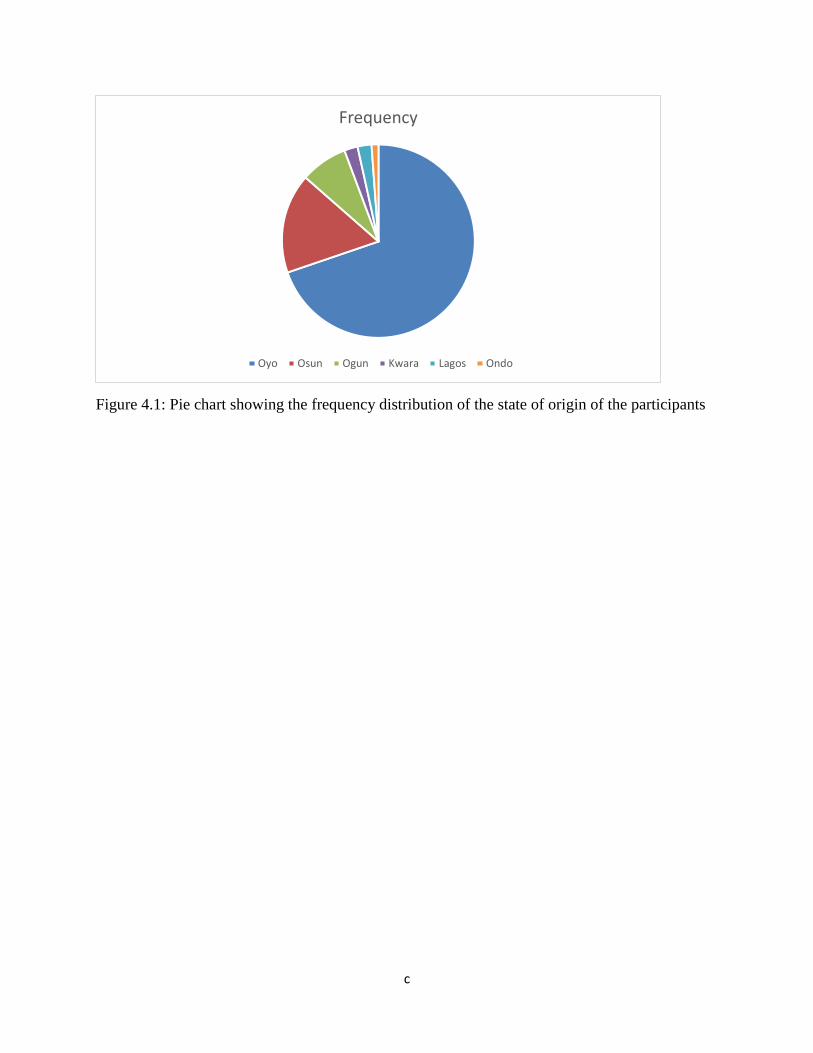
c
Figure 4.1: Pie chart showing the frequency distribution of the state of origin of the participants
Frequency
Oyo Osun Ogun Kwara Lagos Ondo
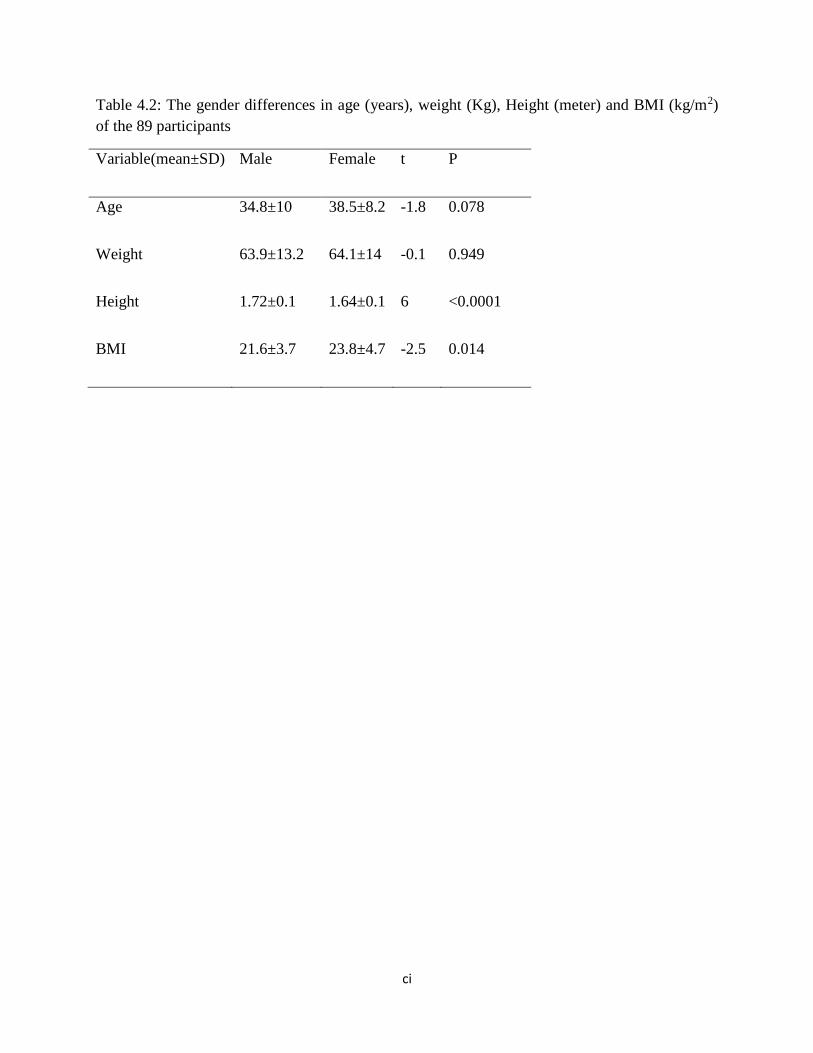
ci
Table 4.2: The gender differences in age (years), weight (Kg), Height (meter) and BMI (kg/m2)
of the 89 participants
Variable(mean±SD) Male Female t P
Age 34.8±10 38.5±8.2 -1.8 0.078
Weight 63.9±13.2 64.1±14 -0.1 0.949
Height 1.72±0.1 1.64±0.1 6 <0.0001
BMI 21.6±3.7 23.8±4.7 -2.5 0.014

cii
4.2.Haematological parameter of the 89 participants
Generally, all the haematological parameters of the participants were within normal limits. The
mean packed cell volume (PCV), haemoglobin concentration, total white blood cell count counts
are shown in table 4.3.There was a significant mean difference in the PCV, Hb concentration
and total white blood cell count between male and female( p<0.05).
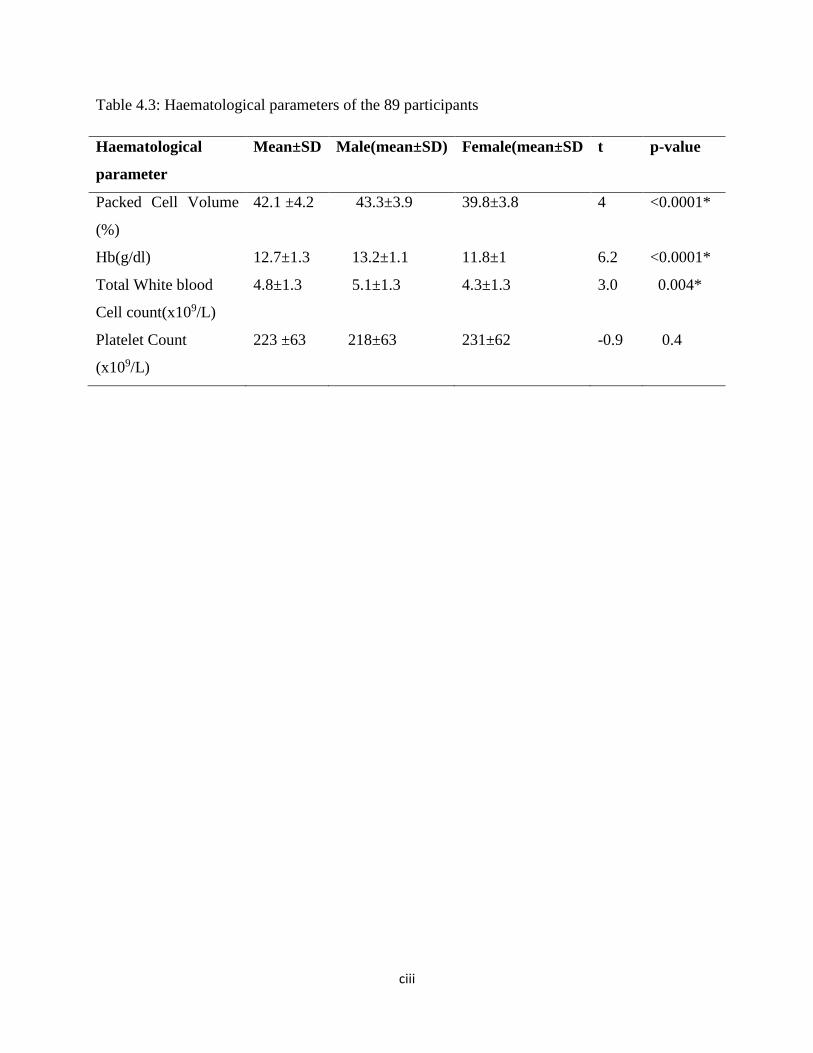
ciii
Table 4.3: Haematological parameters of the 89 participants
Haematological
parameter
Mean±SD Male(mean±SD) Female(mean±SD t p-value
Packed Cell Volume
(%)
42.1 ±4.2 43.3±3.9 39.8±3.8 4 <0.0001*
Hb(g/dl) 12.7±1.3 13.2±1.1 11.8±1 6.2 <0.0001*
Total White blood
Cell count(x109/L)
4.8±1.3 5.1±1.3 4.3±1.3 3.0 0.004*
Platelet Count
(x109/L)
223 ±63 218±63 231±62 -0.9 0.4
civ
4.3. Biochemical parameters of the 89 participants
The results of plasma urea, creatinine, AST, ALT, total protein and albumin were within normal
limits as shown in Table 4.4.There was significant gender difference in mean value of plasma
urea and creatinine(p<0.05).

cv
Table 4.4: Biochemical parameters of the 89 participants
*statistically significant
Biochemical
parameters
Mean±SD Male(mean±SD) Female(mean±SD) T p-value
Urea(mg/dl) 20.1±10 22.3±11.4 17.5±6.8 2.1 0.04*
Creatinine(mg/dl) 1±0.3 1±0.4 0.9±0.2 2.5 0.016*
ALT(iu/L) 12±5.3 12±5.7 12.2±4.7 -0.24 0.815
AST(iu/L) 20.4±7.5 21±7 19.5±8.5 0.84 0.403
Total
Protein(mg/dl)
7.4±1.3 7.3±1.4 7.5±0.9 -0.73 0.465
Albumin(mg/dl) 3.5±0.6 3.5±0.7 3.6±0.5 -0.37 0.714

cvi
4.4. Analysis of dextromethorphan and Dextrorphan
The typical chromatograms of the blank plasma, plasma spiked with standard solutions of
3µg/ml of dextrorphan, 1µg/ml levallorphan (internal standard), 3µg/ml of dextromethorphan
and the three combined are shown in appendices 4-8. There were no interference from the
endogenous components of the biological fluid. Dextrorphan, levallorphan and
dextromethorphan were distinctly resolved eluting after a retention time of 1.3 minutes, 1.7
minutes and 3.5 minutes respectively. Figure 4.2 shows an example of a chromatogram of a
participant’s plasma sample displaying dextrorphan, internal standard and dextromethorphan.
Figure 4.3 to 4.8 show the calibration curve of the neat, plasma and urine obtained by plotting
the Peak Area Ratio (PAR) of dextromethorphan and levallorphan versus dextromethorphan
concentration, and the PAR of dextrorphan and levallorphan versus dextrorphan concentration.
Linear curves were obtained over a range of 0.2µg/ml to 5µg/ml for the neat, plasma and urine
calibration curves. The correlation coefficient (r) values were over 0.995 for each of the six
standard curves. Data obtained from the validation studies of two different concentrations
(0.5µg/ml and 2µg/ml) are shown in Table 4.5. The coefficient of variation obtained for both the
intra- and inter day runs were less than 6% indicating a good precision of the analytical method.
Table 4.6 shows the results of accuracy and recovery for dextromethorphan and dextrorphan in
the plasma while table 4.7 shows the limit of detection (LOD) and limit of quantitation for
dextromethorphan and dextrorphan.
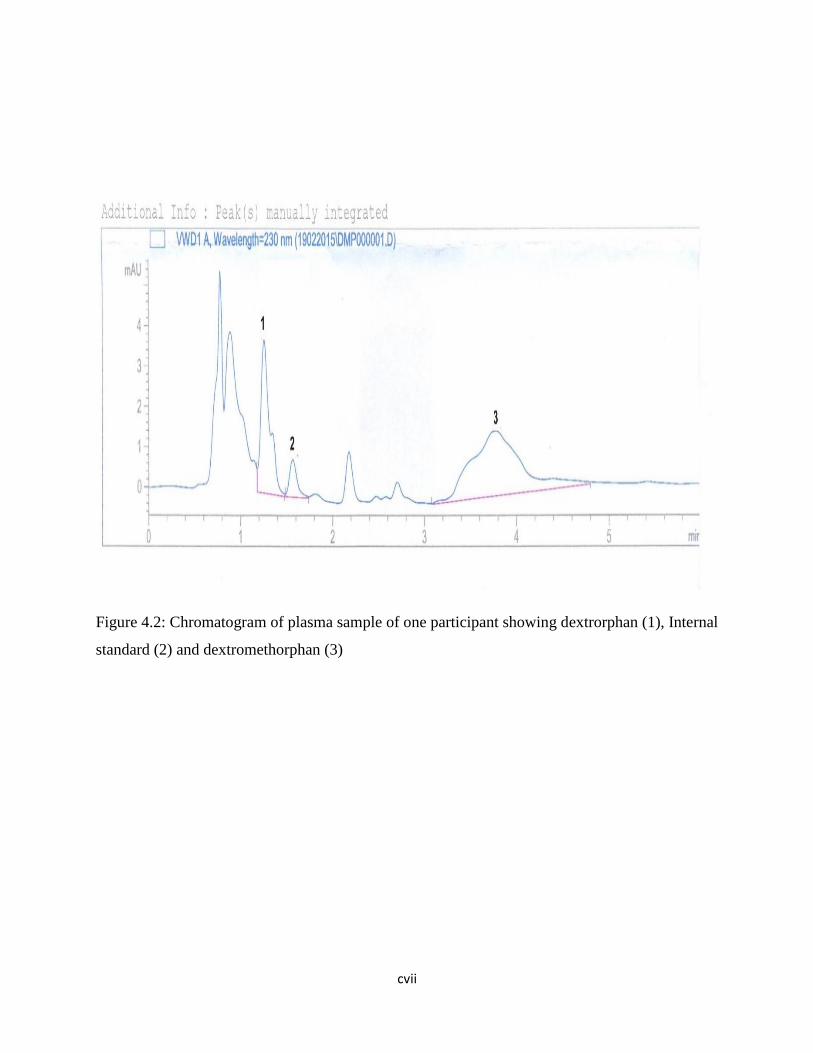
cvii
Figure 4.2: Chromatogram of plasma sample of one participant showing dextrorphan (1), Internal
standard (2) and dextromethorphan (3)

cviii
Figure 4.3: Neat calibration curve of Dextrorphan
PAR Met=Peak Area Ratio Metabolite (Dextrorphan)
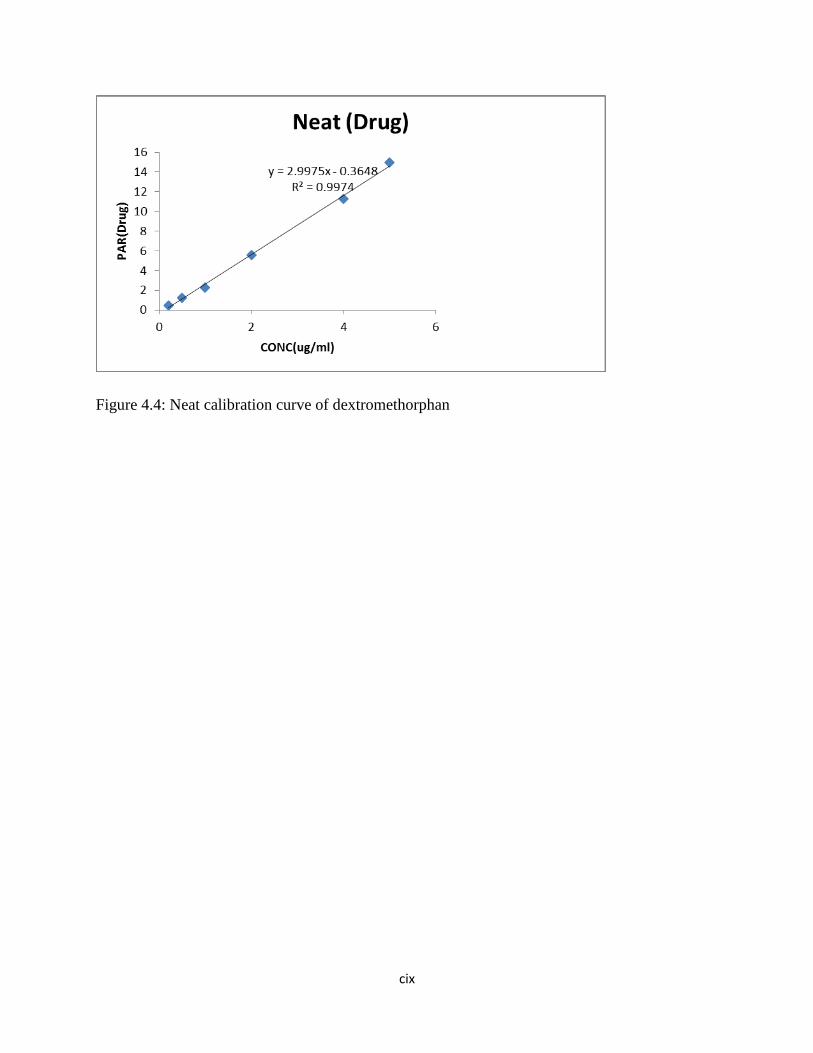
cix
Figure 4.4: Neat calibration curve of dextromethorphan
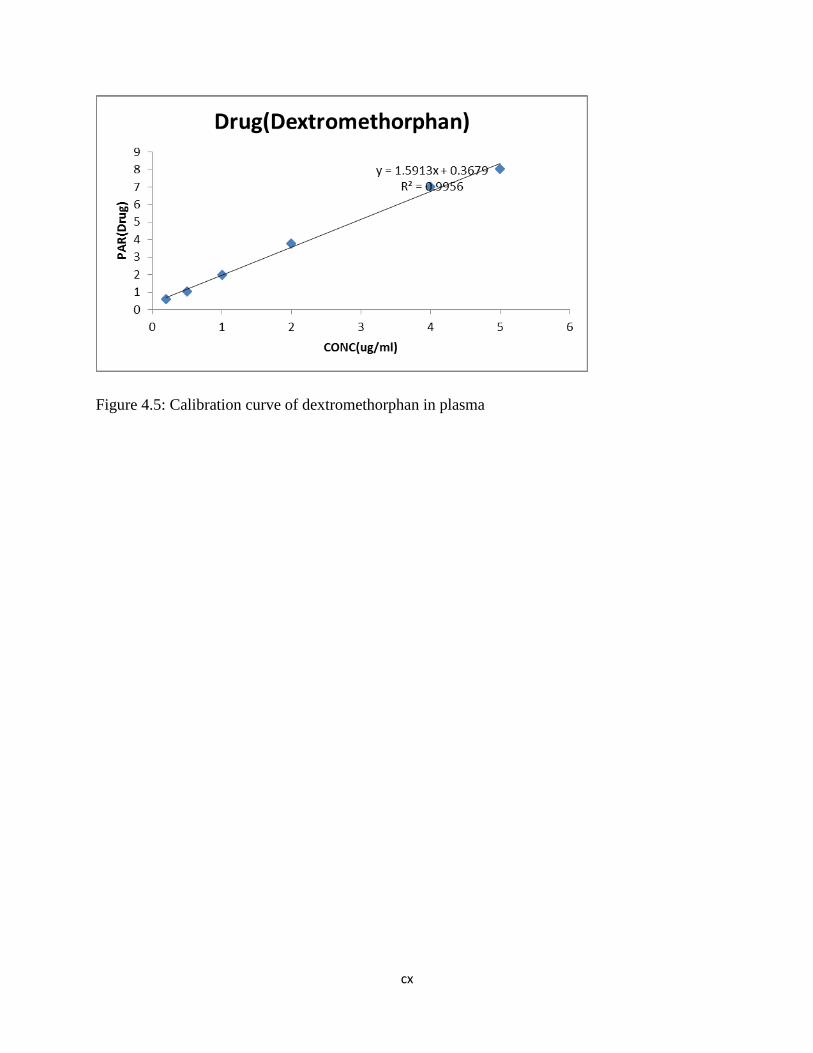
cx
Figure 4.5: Calibration curve of dextromethorphan in plasma
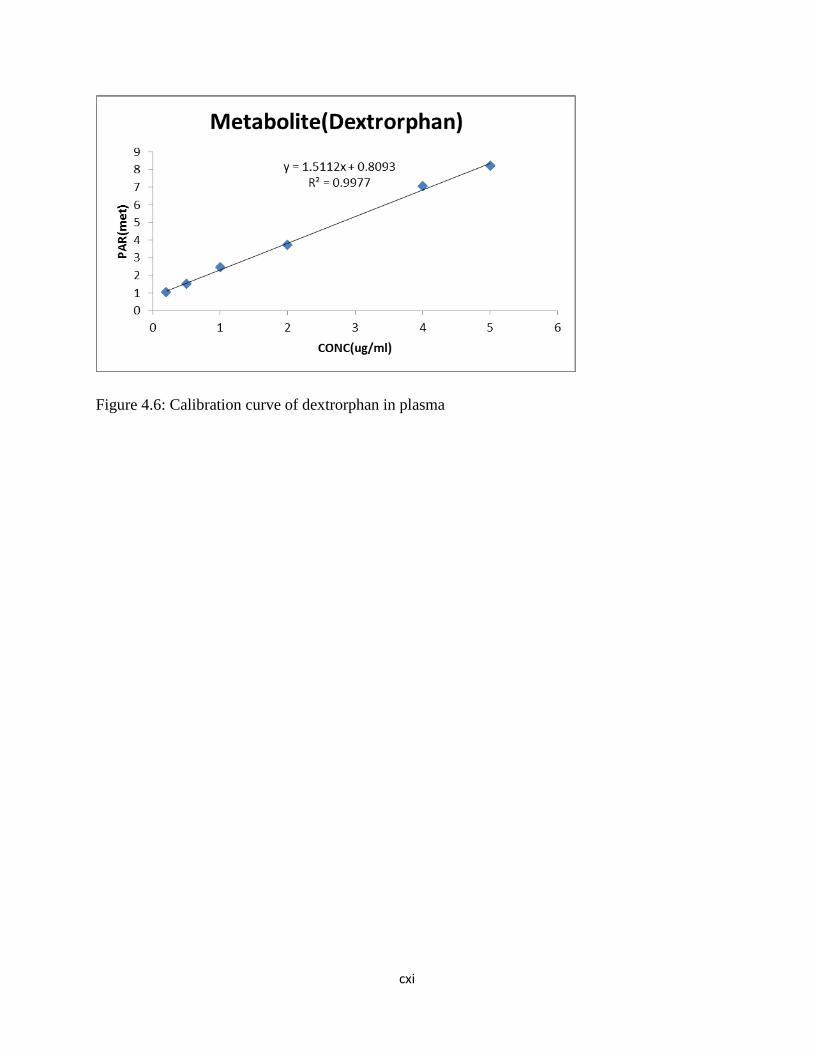
cxi
Figure 4.6: Calibration curve of dextrorphan in plasma

cxii
Figure 4.7: Calibration curve of dextromethorphan in urine
y = 2.0928x + 1.0222R² = 0.9964
0
2
4
6
8
10
12
14
0 1 2 3 4 5 6
PA
R(D
EXTR
OM
ETH
OR
PH
AN
)
CONC UG/ML
PAR(DEXTROMETHORPHAN)
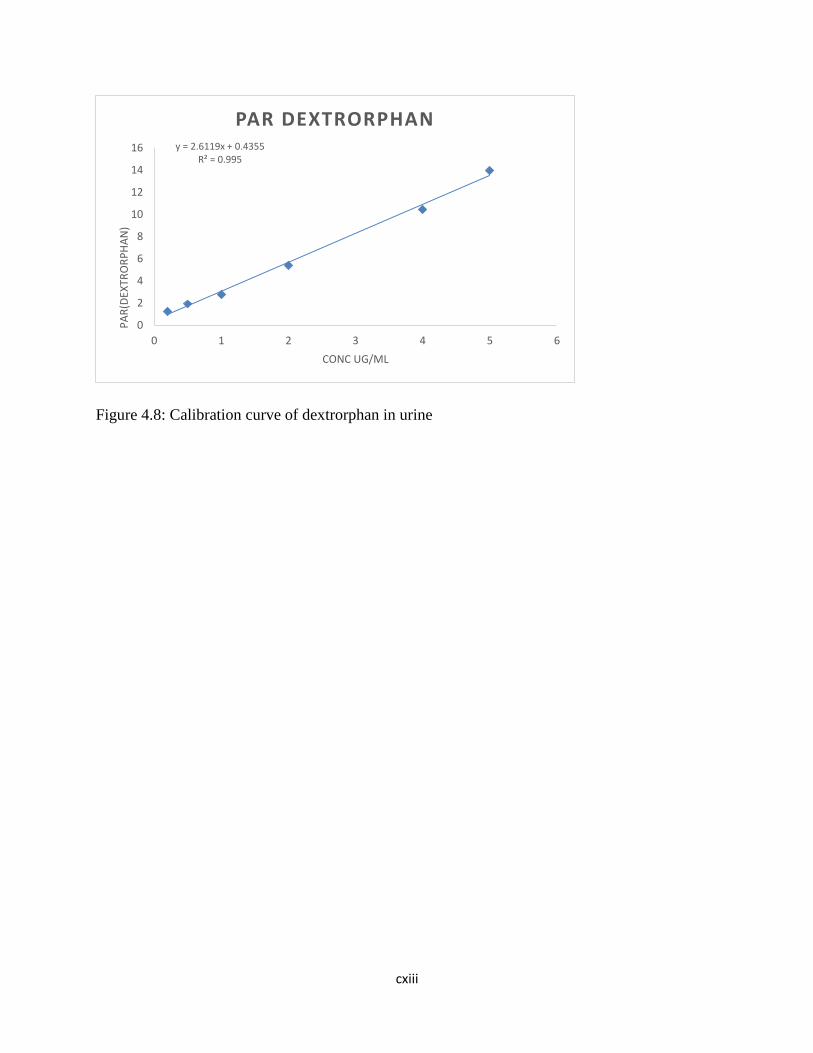
cxiii
Figure 4.8: Calibration curve of dextrorphan in urine
y = 2.6119x + 0.4355R² = 0.995
0
2
4
6
8
10
12
14
16
0 1 2 3 4 5 6
PA
R(D
EXTR
OR
PH
AN
)
CONC UG/ML
PAR DEXTRORPHAN
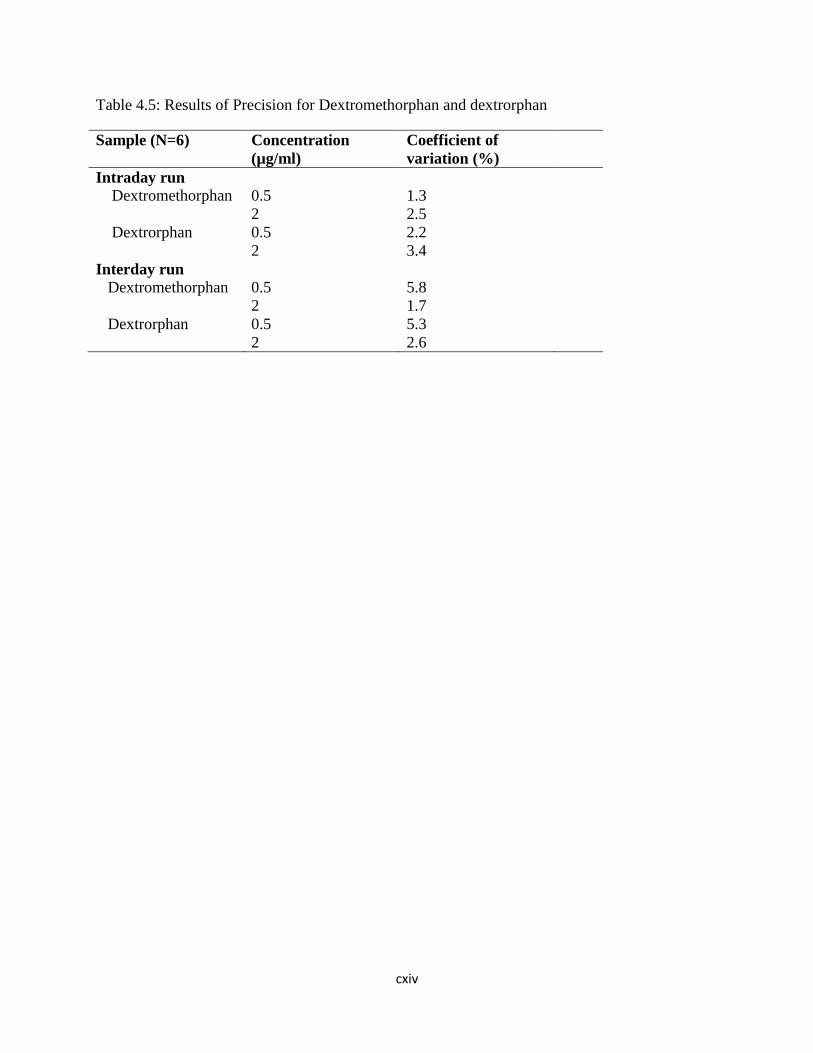
cxiv
Table 4.5: Results of Precision for Dextromethorphan and dextrorphan
Sample (N=6) Concentration
(µg/ml)
Coefficient of
variation (%)
Intraday run
Dextromethorphan 0.5 1.3
2 2.5
Dextrorphan 0.5 2.2
2 3.4
Interday run
Dextromethorphan 0.5 5.8
2 1.7
Dextrorphan 0.5 5.3
2 2.6
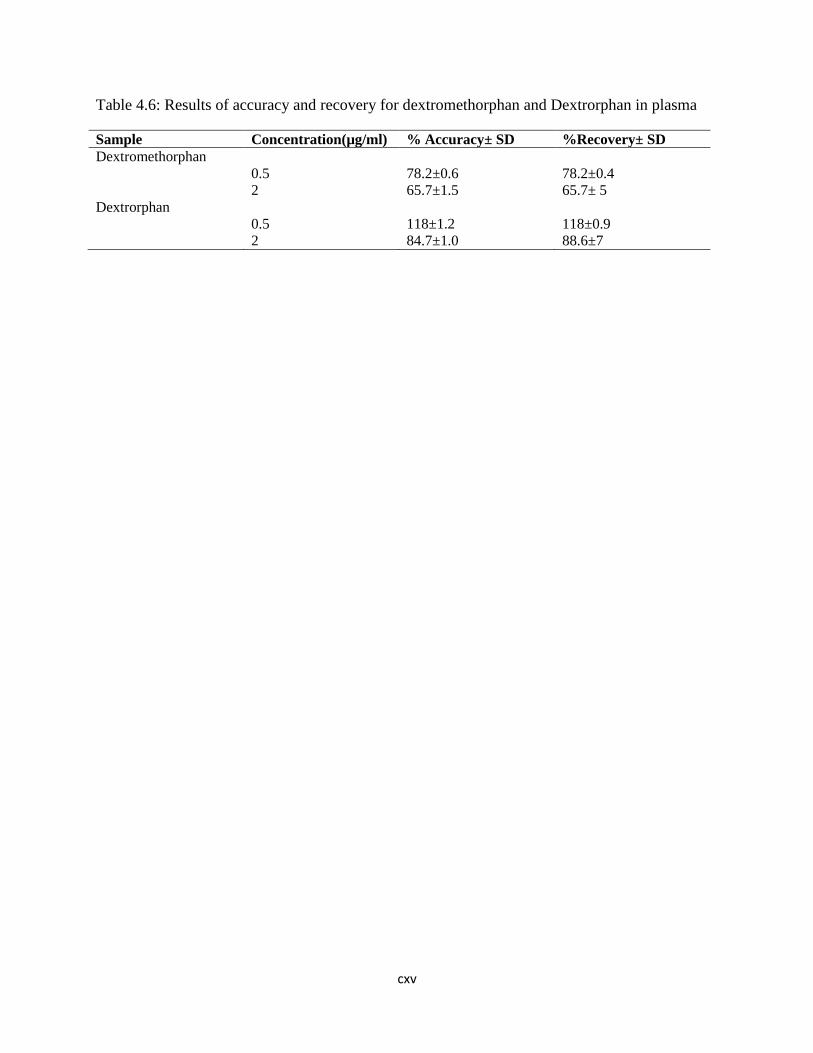
cxv
Table 4.6: Results of accuracy and recovery for dextromethorphan and Dextrorphan in plasma
Sample Concentration(µg/ml) % Accuracy± SD %Recovery± SD
Dextromethorphan
0.5 78.2±0.6 78.2±0.4
2 65.7±1.5 65.7± 5
Dextrorphan
0.5 118±1.2 118±0.9
2 84.7±1.0 88.6±7
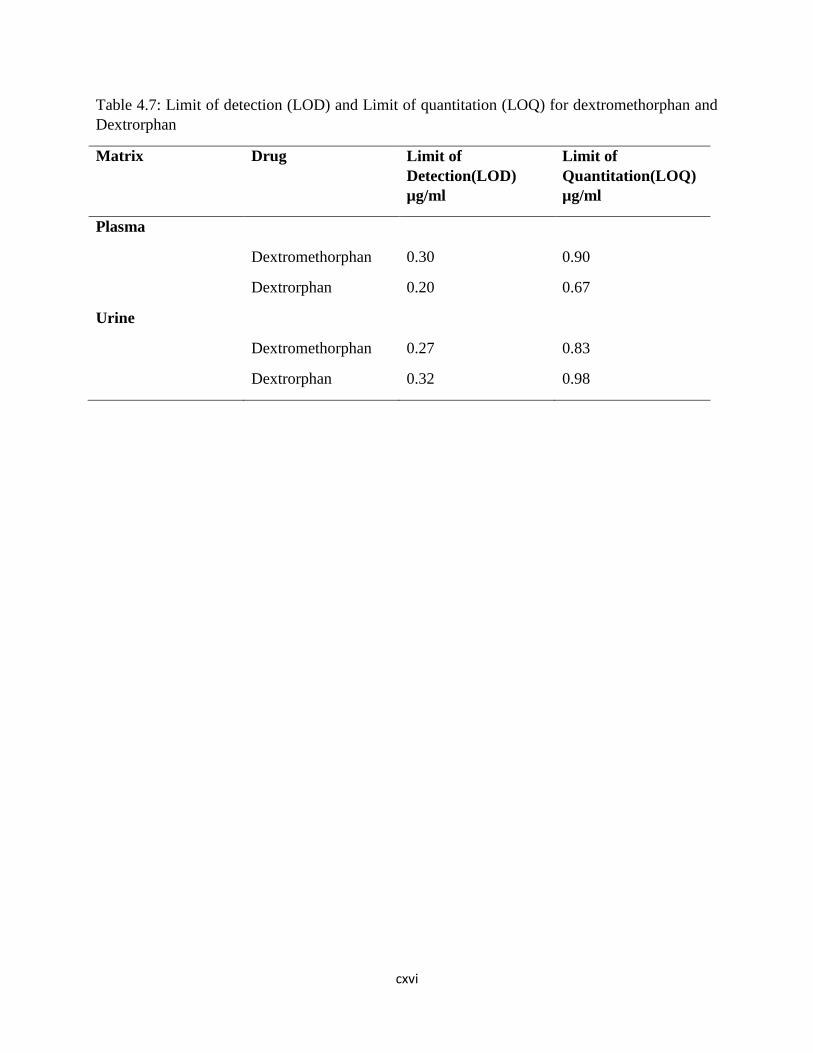
cxvi
Table 4.7: Limit of detection (LOD) and Limit of quantitation (LOQ) for dextromethorphan and
Dextrorphan
Matrix Drug Limit of
Detection(LOD)
µg/ml
Limit of
Quantitation(LOQ)
µg/ml
Plasma
Dextromethorphan 0.30 0.90
Dextrorphan 0.20 0.67
Urine
Dextromethorphan 0.27 0.83
Dextrorphan 0.32 0.98
cxvii
4.5. Dextromethorphan, dextrorphan and MR in urine of 89 participants
The retention time for dextrorphan, levallorphan (internal standard) and dextromethorphan were
1.3, 1.7 and 3.7 minutes respectively. The mean concentration of the dextromethorphan and
dextrorphan in the 8-hour urine were0.75±0.54µg/ml and 1.01±0.51µg/ml respectively. Other
details about the urine concentration of dextromethorphan and dextrorphan are shown in table
4.8.
The median (range) metabolic ratio and logMR in the 8-hour urine were 0.74(0-4.2) and -0.13(-
2.9- 0.6) respectively. There was no statistically significant gender differences in the mean MR
urine (t=1.8, p=0.072). Figure 4.9. shows the histogram of the frequency distribution of the
metabolic ratio of the participants in the 8-hour urine.
The probit plot with best fit trend line of the log MR for 8-hour urine samples (figure 4.10)
intercepts the X axis at 0.28, setting the cut-off between the extensive metabolizers (EM) and
the poor metabolizers (PM) at log 0.28 (anti-mode of 1.91). Two (2.3%) participants with MR
greater than the cut-off were classified as poor metabolizers.
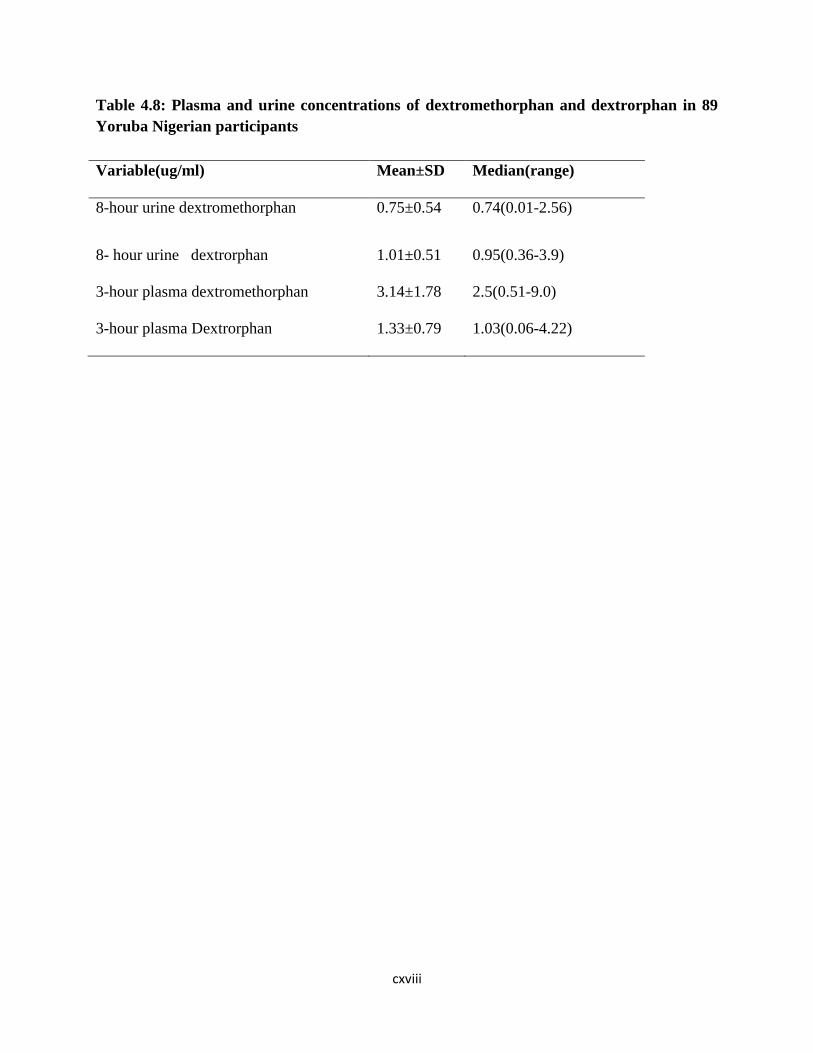
cxviii
Table 4.8: Plasma and urine concentrations of dextromethorphan and dextrorphan in 89
Yoruba Nigerian participants
Variable(ug/ml) Mean±SD Median(range)
8-hour urine dextromethorphan 0.75±0.54 0.74(0.01-2.56)
8- hour urine dextrorphan 1.01±0.51 0.95(0.36-3.9)
3-hour plasma dextromethorphan 3.14±1.78 2.5(0.51-9.0)
3-hour plasma Dextrorphan 1.33±0.79 1.03(0.06-4.22)

cxix
Figure 4.9. Histogram showing the frequency distribution of the log MR in 8-hour urine

cxx
Figure 4.10: Probit plot representation of metabolic ratio (n=89) in 8-hour urine samples
The probit graph plotted using semi log graph of probability percent (probability %) against the
logMR. The trend line best fit line plotted and the log MR when the line crosses the x axis was
chosen as the anti-mode by converting back to MR i.e. the antilog of log MR. The cut-off was
0.28 with anti-mode of 1.91.
y = -28.08x2 - 100.04x + 31.61R² = 0.8376
0.1
1
10
100
1000
-3.5 -3 -2.5 -2 -1.5 -1 -0.5 0 0.5 1
PR
OB
AB
ILIT
Y %
LOG MR URINE
Urine probit plot on semi logarithm graph
cxxi
4.6. Dextromethorphan, dextrorphan and MR in plasma of 89 participants
The mean concentration of dextromethorphan in the 3-hour plasma was 3.4±1.78µg/ml while
that of the dextrorphan was 1.33±0.79µg/ml. Other details about the obtained plasma
concentration of dextromethorphan and dextrorphan are found in table 4.8.
The median (range) of the metabolic ratio of the participants in the 3-hour plasma was 2.36 (1.4-
26.5) while the median log MR was 0.37(0.1-1.4). MR plasma was not significantly different
between genders (p=0.072). Figure 4.11. shows the histogram of the frequency distribution of
the log MR of the 3-hour plasma samples. As shown in probit plot in figure 4.12, the log MR that
separated the extensive metabolizers from poor metabolizers was 0.75 and the anti-mode was
5.6. Two participants (2.3%) whose MR were greater than the anti-mode were classified as poor
metabolizers.
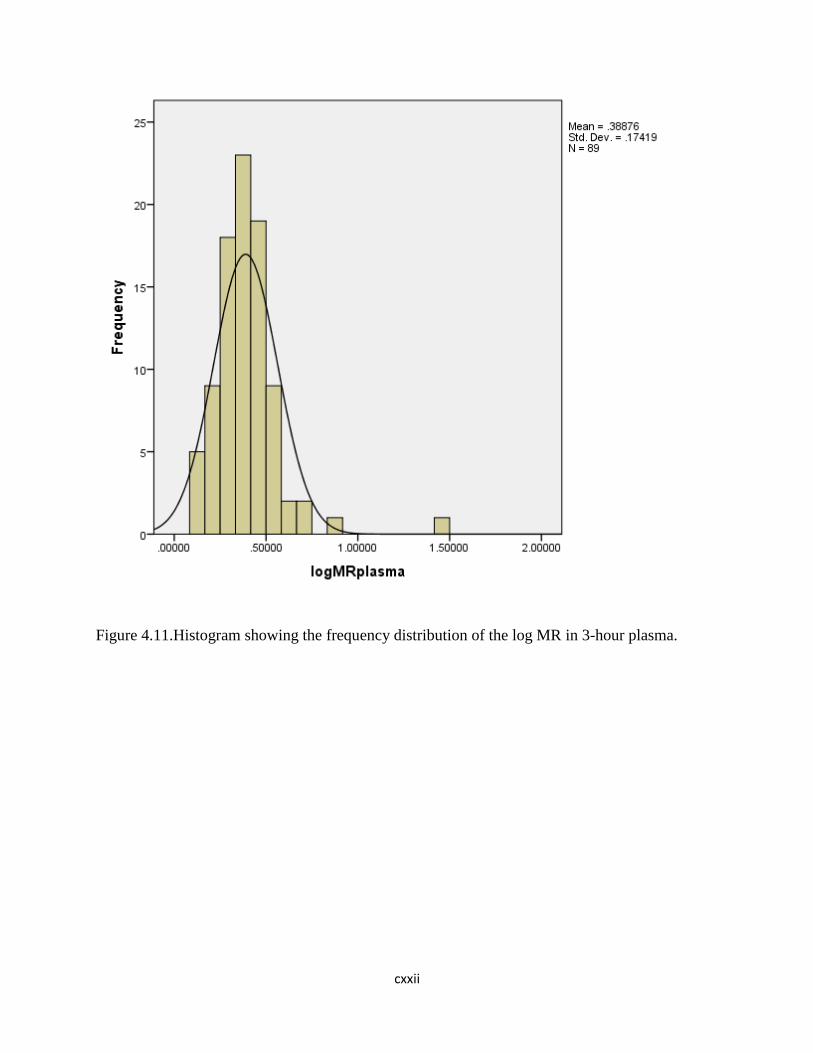
cxxii
Figure 4.11.Histogram showing the frequency distribution of the log MR in 3-hour plasma.
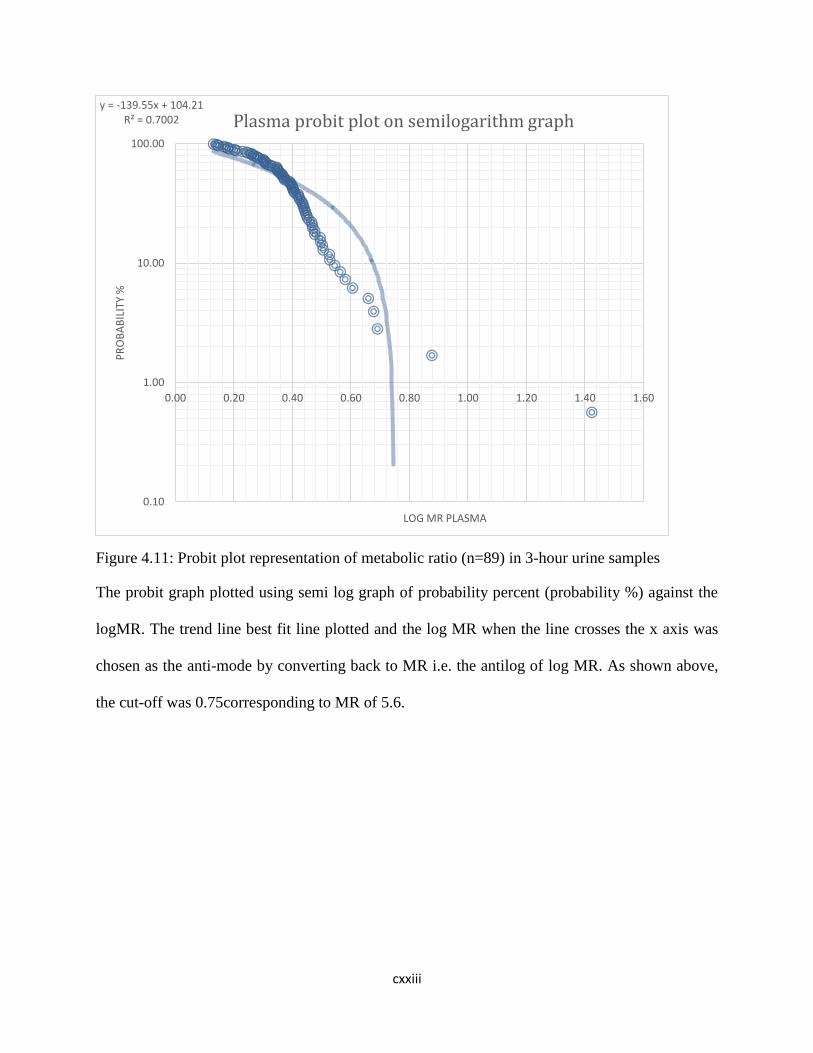
cxxiii
Figure 4.11: Probit plot representation of metabolic ratio (n=89) in 3-hour urine samples
The probit graph plotted using semi log graph of probability percent (probability %) against the
logMR. The trend line best fit line plotted and the log MR when the line crosses the x axis was
chosen as the anti-mode by converting back to MR i.e. the antilog of log MR. As shown above,
the cut-off was 0.75corresponding to MR of 5.6.
y = -139.55x + 104.21R² = 0.7002
0.10
1.00
10.00
100.00
0.00 0.20 0.40 0.60 0.80 1.00 1.20 1.40 1.60
PR
OB
AB
ILIT
Y %
LOG MR PLASMA
Plasma probit plot on semilogarithm graph
cxxiv
4.7. Comparison of the plasma and urine metabolic ratio of dextromethorphan/dextrorphan
in the determination of CYP2D6 phenotype
Two participants (2.3%) were classified as poor metabolizers by both the 8-hour urine (0.28) and
3-hour plasma (0.75) metabolic ratio of dextromethorphan and dextrorphan. The metabolic ratio
of one of the PMs was 26.11 in the plasma. The two PMs identified were male, but there was no
statistically significant relationship between gender and phenotype (p=0.541). There was strong
positive correlation between 8-hour urinary and 3-hour plasma metabolic ratios [r=0.772,
p<0.01, CI (0.22, 0.891)] but no significant correlation between age, body mass index and
metabolic ratios as shown in table 4.9
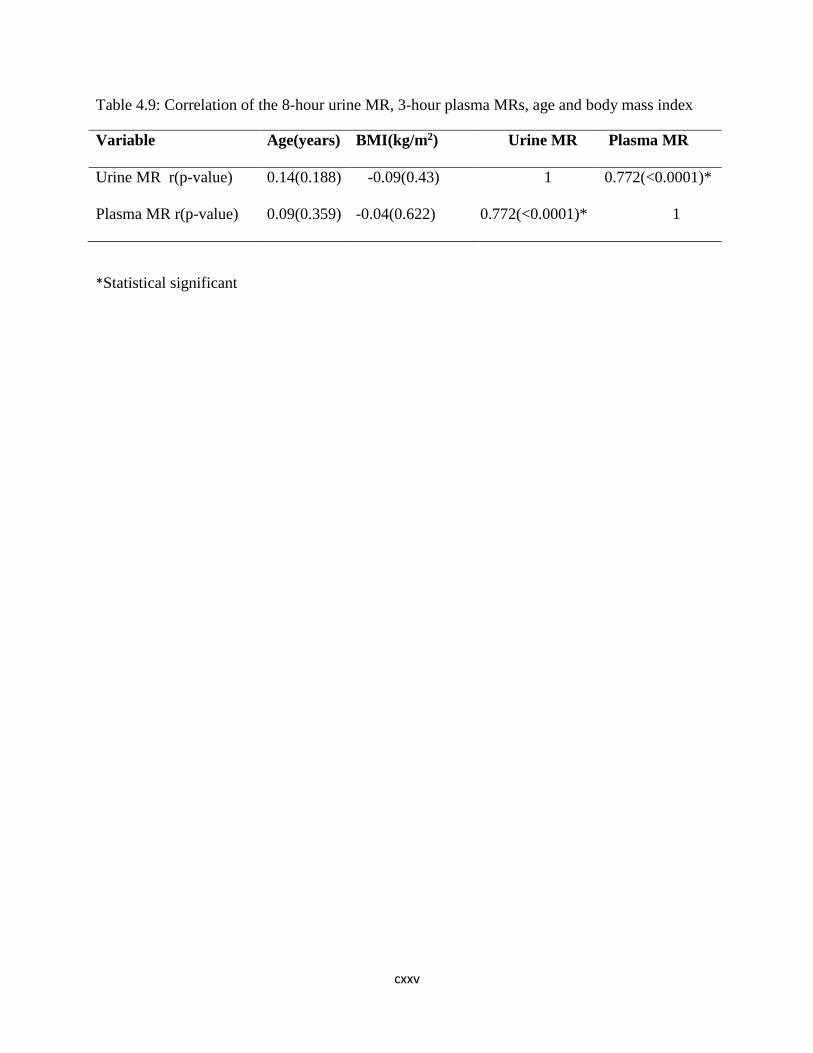
cxxv
Table 4.9: Correlation of the 8-hour urine MR, 3-hour plasma MRs, age and body mass index
Variable Age(years)
BMI(kg/m2)
Urine MR Plasma MR
Urine MR r(p-value)
0.14(0.188)
-0.09(0.43) 1 0.772(<0.0001)*
Plasma MR r(p-value)
0.09(0.359)
-0.04(0.622)
0.772(<0.0001)* 1
*Statistical significant

cxxvi
4.8.The sociodemographic characteristics of identified PMs and EMs
The two identified PMs were both males and from Osun State (Ila-Orangun and Iree). The
median (range) plasma MR for the PMs was 17(7.5-26.5) while the median (range) plasma MR
for the EMs was 2.4(1.4-4.9). There was statistically significant mean difference between the
plasma MR of PMs and EMs (t = -12.6, p<0.0001). The median (range) urine MR for the PMs
was 3.2(2.2-4.2) while that of the EMs was 0.7(0-1.8). There was statistically significant mean
difference between the urine MR of PMs and EMs (t = -8.9 p<0.0001). Other socio-
demographics of the identified PMs and EMs are shown in table 4.10.

cxxvii
Table 4.10: Some Socio-demographics of the identified PMs and EMs
Variable PMs EMs T P-value 95%
Confidence
Interval
Age(years)
(mean ± SD)
27±2.8 36.3±9.5 1.374 0.173 (-4.15, 22.75)
BMI(Kg/m2)
(mean ± SD)
19.6±1.4 22.4±4.2 0.949 0.345 (-3.1, 8.8)
MR Plasma
(mean ± SD)
17±13.4 2.5±0.7 -12.631 <0.0001* (-12.3, -16.9)
MR Urine
(mean ± SD)
3.2±1.4 0.7±0.4 -8.868 <0.0001* (-19.2, -3.04)
cxxviii
CHAPTER FIVE
DISCUSSION
5.1. Discussion
In this study, dextromethorphan O-demethylation polymorphism was studied among unrelated
89 healthy volunteers of Yoruba ethnic origin in Nigeria using both 8-hour urinary and 3-hour
post dosing plasma samples. The study only enrolled individuals whose grandparents were of
Yoruba extraction, an attempt to ensure that all the participants were of the same ancestry. (189)
Studies based on specific ethnic nationalities in Nigeria are rare but few studies on CYP2D6
phenotype, particularly using urine MR have been reported. (8)
The study involved mostly young adult males and females in line with standard practice and in
recognition of potential influence of age on the rate and extent metabolism. Within the age range
of the participants there was a lack of correlation between age and the metabolic ratios of the
participants. This is not unexpected because of the exclusion of the elderly individuals. It is also
noteworthy that the two poor metabolizers that were identified were aged 25 and 27 years. The
age range in this study was similar to previous studies aiming at determining the CYP2D6
phenotype. (8, 18, 186, 198).
Relevant cutoff(s) may be obtained by subjecting data to a probit analysis or Receiver Operating
Characteristics (ROC) or other similar statistical analysis. (169, 170, 194) On the other hand
extrapolations from similar studies may inform the cutoff. (160, 176, 199, 200) The former
option was chosen in this case for, at least, two reasons: 1.There is no immediate record of an
identical study, that is, determination of CYP2D6 phenotype in the Yoruba Nigerians. Secondly,
use of plasma for the purpose is evolving and has not been previously investigated in Nigeria
cxxix
before now. Further, some researchers have argued against the use a “universal” cutoff as it may
be misleading.(169, 201) It is also noteworthy that very few studies have used DEX in Nigerians
in the past.(8) A close look at the histogram reveals the bimodal distribution and same was
reinforced by the probit plot similar to Gogtay et al. in India (194) and Othman et al in
Yemen.(201) There is no doubting the fact that large sample size would enhance deductions of
histogram and probit plots.
The choice of DEX has gained ground recently for a number reasons including good safety
profile. Only one patient indicated mild transient drowsiness which reinforces the foregoing.
Previous studies in Nigeria and abroad have recorded similar good tolerance.(8, 153, 169, 194)
The use of saliva as an alternative to plasma/serum, requires higher dose of dextromethorphan,
which may increase the likelihood of adverse drug reactions, is needed for phenotyping using
saliva. (200, 202)
There were some challenges with the assay of DEX and DOR, particularly for resource-poor
countries where sophisticated analytic facilities may be lacking. Indeed, most well-resourced
facilities use the LC-MS/MS or HPLC with fluorescent detection as the HPLC with UV
detection is not well suited for dextromethorphan and dextrorphan. However, the method
described by Zimova et al with modification (184) was found to be adequate at present time. The
lower limit of quantitation and detection would not have been perfectly representative in this
study, however, it is thought that both the parent drug and the major metabolite, dextrorphan,
would be equally affected, thus the same relative concentrations may be maintained. Further
studies would be necessary to address this, perhaps, same samples should be subjected to the
various analytical techniques.

cxxx
Hitherto, a 24-hour urine collection was required for the determination of MR. However, recent
studies that used 8-hour urinary assay have been established as an effective option. (169, 171) In
addition, a single 3 hour plasma sample have equally been found useful alternative. This study
employed both options and found a clear correlation. Both the plasma and the urinary
DEM/DOR identified two (2.3%) individuals with poor metabolic phenotype. Should these
findings be replicated in similar and larger studies it may be possible to avoid keeping patients
for long hours for a prolonged urine collections which is fraught with some challenges including
incomplete sample collection and inconvenience to subjects. The inference of 2.3% PMs from
this study is similar to the reported prevalence of PM phenotype among black Africans (8, 15,
141, 142)
For emphasis, plasma matrix for phenotyping with dextromethorphan have been found to be
accurate, convenient and more rapid than the standard urine approach. Besides, varying
glucuronidation, preferential accumulation of metabolites due to impaired renal function and
variability in metabolic ratio due to urinary PH are prevented in 3-hour post dose plasma
sample,(203) and it has been found to correlate well with the much validated urinary metabolic
ratio.(169, 200)
CYP2D6 poor metabolizers in this study is similar to previous studies in Nigeria and other
African countries. Iyun et al obtained a prevalence of less than one percent among heterogeneous
population using debrisoquine and metoprolol urinary metabolic ratio.(204) A prevalence of
3.5% poor metabolizers with urinary dextromethorphan/dextrorphan metabolic ratio among
heterogeneous Nigerians was obtained by Ebeshi et al.(8) Other studies in African also showed a
poor metabolizers prevalence of 1.2% in South Africa, (198) 1-4% in other African countries,
(14-16, 141) and 1-4% in Asian countries.(7, 11, 194) However, poor metabolizers’ phenotype in

cxxxi
this study is lower than that of African American (ranges between 5.3% and 7.7%)(128, 205,
206) and Caucasians (7-10%). (10, 169) Also, there is strong positive correlation between the
urine and plasma metabolic ratios at determining the CYP2D6 phenotypes, similar to findings
from other studies. (169, 178, 181)
The clinical implications of poor metabolisers include slow drug metabolism with potential for
drug-drug interactions and adverse drug reactions. Besides, there may be slower conversion of
pro drug to active metabolites with potential lower efficacy.(207, 208) As a result, dose
adjustment or alternate drugs have been recommended for poor metabolisers by Clinical
Pharmacogenetics Implementation Consortium (CPIC) dosing guidelines and Dutch
Pharmacogenetics Working Group (DPWG) for drugs like paroxetine, amitriptyline, risperidone,
codeine, tramadol and tamoxifen.(47, 103, 115, 117, 209) Consequently, the use of these
commonly prescribed drugs among Yoruba, Nigerian can be guided by CYP2D6 phenotyping
with dextromethorphan using 3-hour post dose plasma sample, which can be done routinely in
the hospital.
cxxxii
5.2 Limitations
1. The use of Ultraviolet detector and C-18 column as against the fluorescence detector and
phenyl column or LC/MS –MS with higher sensitivity and analyte recovery.
2. A larger sample size might also allow for the identification of phenotypes that are present
in the population but rare.
3. The study was conducted among healthy individuals and the applications in the general
population may be limited because of the concomitant drugs and disease states that may
contraindicate or have interaction with dextromethorphan.
4. The samples were stored in optimum temperature but for long period before the analysis.
This might have affected the recoveries of the dextromethorphan and Dextrorphan.

cxxxiii
CHAPTER SIX
CONCLUSION AND RECOMMENDATIONS
6.1. Conclusion
The study recorded a poor metabolizer phenotype of 2.3% among the 89 Yoruba ethnic
Nigerians studied. The 8-hour urinary and 3-hour post dose plasma metabolic ratio of
dextromethorphan/dextrorphan were able to differentiate between poor and extensive
metabolizers, and there was strong positive correlation between urine and plasma metabolic
ratio.
cxxxiv
6.2.Recommendations
1. There is need for further studies with larger sample populations with more sensitive
analytical methods.
2. Independent validation of the plasma metabolic ratio should be determined before its
wide use.
3. Suggests clinical trial randomizing patients to prescribing using CYP2D6 phenotyping
and traditional methods of prescribing.
4. Needs for CYP2D6 genotyping for phenotyping-genotyping matching.
5. Despite the above some patients will benefits from CYP2D6 phenotyping especially for
substrate of CYP2D6 with narrow therapeutic index.

cxxxv
REFERENCES
1. Bertz RJ, Granneman GR. Use of in vitro and in vivo data to estimate the likelihood of
metabolic pharmacokinetic interactions. Clinical pharmacokinetics. 1997;32(3):210-58.
2. Ingelman-Sundberg M. Pharmacogenetics of cytochrome P450 and its applications in
drug therapy: the past, present and future. Trends in pharmacological sciences. 2004;25(4):193-
200.
3. Brunton LL, Lazo JS, Parker KL. Goodman & Gilman's the pharmacological basis of
therapeutics. McGrawHill, New York. 2006;11:737-8.
4. Bertilsson L, Dahl ML, Dalén P, Al‐Shurbaji A. Molecular genetics of CYP2D6: clinical
relevance with focus on psychotropic drugs. British journal of clinical pharmacology.
2002;53(2):111-22.
5. Qumsieh RY, Ali BR, Abdulrazzaq YM, Osman O, Akawi NA, Bastaki S. Identification
of new alleles and the determination of alleles and genotypes frequencies at the CYP2D6 gene in
Emiratis. PloS one. 2011;6(12):e28943.
6. Masimirembwa C, Hasler J, Bertilssons L, Johansson I, Ekberg O, Ingelman-Sundberg
M. Phenotype and genotype analysis of debrisoquine hydroxylase (CYP2D6) in a black
Zimbabwean population Reduced enzyme activity and evaluation of metabolic correlation of
CYP2D6 probe drugs. European journal of clinical pharmacology. 1996;51(2):117-22.
7. Kim K, Johnson JA, Derendorf H. Differences in drug pharmacokinetics between East
Asians and Caucasians and the role of genetic polymorphisms. The Journal of Clinical
Pharmacology. 2004;44(10):1083-105.
8. Ebeshi BU, Bolaji OO, Masimirembwa C. Cytochrome P450 2D6 (CYP2D6) genotype
and phenotype determination in the Nigerian population. Asian J Pharm Hea Sci. 2011;1:47-54.
cxxxvi
9. Cai W, Nikoloff D, Pan R, De Leon J, Fanti P, Fairchild M, et al. CYP2D6 genetic
variation in healthy adults and psychiatric African-American subjects: implications for clinical
practice and genetic testing. The pharmacogenomics journal. 2006;6(5):343-50.
10. Fux R, Mörike K, Pröhmer AM, Delabar U, Schwab M, Schaeffeler E, et al. Impact of
CYP2D6 genotype on adverse effects during treatment with metoprolol: a prospective clinical
study. Clinical Pharmacology & Therapeutics. 2005;78(4):378-87.
11. Xie H-G, Kim RB, Wood AJ, Stein CM. Molecular basis of ethnic differences in drug
disposition and response. Annual review of pharmacology and toxicology. 2001;41(1):815-50.
12. Griese E, Asante-Poku S, Ofori-Adjel D, Mikus G, Eichelbaum M. Analysis of the
CYP2D6 gene mutations and their consequences for enzyme function in a West African
population. Pharmacogenetics and Genomics. 1999;9(6):715-24.
13. Aklillu E, Persson I, Bertilsson L, Johansson I, Rodrigues F, Ingelman-Sundberg M.
Frequent distribution of ultrarapid metabolizers of debrisoquine in an ethiopian population
carrying duplicated and multiduplicated functional CYP2D6 alleles. Journal of Pharmacology
and Experimental Therapeutics. 1996;278(1):441-6.
14. Wan Y-JY, Poland RE, Han G, Konishi T, Zheng Y-P, Berman N, et al. Analysis of the
CYP2D6 gene polymorphism and enzyme activity in African-Americans in southern California.
Pharmacogenetics and Genomics. 2001;11(6):489-99.
15. Dandara C, Masimirembwa CM, Magimba A, Sayi J, Kaaya S, Sommers DK, et al.
Genetic polymorphism of CYP2D6 and CYP2C19 in east-and southern African populations
including psychiatric patients. European journal of clinical pharmacology. 2001;57(1):11-7.
16. Wennerholm A, Johansson I, Hidestrand M, Bertilsson L, Gustafsson LL, Ingelman-
Sundberg M. Characterization of the CYP2D6* 29 allele commonly present in a black Tanzanian
cxxxvii
population causing reduced catalytic activity. Pharmacogenetics and Genomics. 2001;11(5):417-
27.
17. Aklillu E, Persson I, Bertilsson L, Johansson I, Rodrigues F, Ingelman-Sundberg M.
Frequent distribution of ultrarapid metabolizers of debrisoquine in an ethiopian population
carrying duplicated and multiduplicated functional CYP2D6 alleles. J Pharmacol Exp Ther.
1996;278(1):441-6.
18. Iyun AO, Lennard MS, Tucker GT, Woods HF. Metoprolol and debrisoquin metabolism in
Nigerians: lack of evidence for polymorphic oxidation. Clinical pharmacology and therapeutics.
1986;40(4):387-94.
19. Lennard MS, Iyun AO, Jackson PR, Tucker GT, Woods HF. Evidence for a dissociation
in the control of sparteine, debrisoquine and metoprolol metabolism in Nigerians.
Pharmacogenetics. 1992;2(2):89-92.
20. Breil F, Verstuyft C, Orostegui L, Buhl C, Alvarez J-C, Chouinard G, et al. Non-response
to consecutive antidepressant therapy caused by CYP2D6 ultrarapid metabolizer phenotype.
International Journal of Neuropsychopharmacology. 2008;11(5):727-8.
21. Kawanishi C, Lundgren S, Ågren H, Bertilsson L. Increased incidence of CYP2D6 gene
duplication in patients with persistent mood disorders: ultrarapid metabolism of antidepressants
as a cause of nonresponse. A pilot study. European journal of clinical pharmacology.
2004;59(11):803-7.
22. Rau T, Wohlleben G, Wuttke H, Thuerauf N, Lunkenheimer J, Lanczik M, et al.
CYP2D6 genotype: impact on adverse effects and nonresponse during treatment with
antidepressants—a pilot study. Clinical Pharmacology & Therapeutics. 2004;75(5):386-93.
cxxxviii
23. Gasche Y, Daali Y, Fathi M, Chiappe A, Cottini S, Dayer P, et al. Codeine intoxication
associated with ultrarapid CYP2D6 metabolism. New England Journal of Medicine.
2004;351(27):2827-31.
24. Sakuyama K, Sasaki T, Ujiie S, Obata K, Mizugaki M, Ishikawa M, et al. Functional
Characterization of 17 CYP2D6 Allelic Variants (CYP2D6. 2, 10, 14A–B, 18, 27, 36, 39, 47–51,
53–55, and 57). Drug Metabolism and Disposition. 2008;36(12):2460-7.
25. Commission NP. National population census. Abuja, Nigeria: National Population
Commission. 2006.
26. Lazarou J, Pomeranz BH, Corey PN. Incidence of adverse drug reactions in hospitalized
patients: a meta-analysis of prospective studies. Jama. 1998;279(15):1200-5.
27. Blake CM, Kharasch E, Schwab M, Nagele P. Meta-analysis of CYP2D6 metabolizer
phenotype and metoprolol pharmacokinetics. Clinical pharmacology and therapeutics.
2013;94(3).
28. Hendset M, Haslemo T, Rudberg I, Refsum H, Molden E. The complexity of active
metabolites in therapeutic drug monitoring of psychotropic drugs. Pharmacopsychiatry.
2006;39(4):121-7.
29. D’empaire I, Guico-Pabia CJ, Preskorn SH. Antidepressant treatment and altered
CYP2D6 activity: are pharmacokinetic variations clinically relevant? Journal of Psychiatric
Practice®. 2011;17(5):330-9.
30. Cai W, Chen B, Cai M, Zhang Y. CYP2D6 phenotype determines pharmacokinetic
variability of propafenone enantiomers in 16 HAN Chinese subjects. Zhongguo yao li xue bao=
Acta pharmacologica Sinica. 1999;20(8):720-4.

cxxxix
31. Bertilsson L, Dahl M, Sjöqvist F, Åberg-Wistedt A, Humble M, Johansson I, et al.
Molecular basis for rational megaprescribing in ultrarapid hydroxylators of debrisoquine. The
Lancet. 1993;341(8836):63.
32. Kirchheiner J, Heesch C, Bauer S, Meisel C, Seringer A, Goldammer M, et al. Impact of
the ultrarapid metabolizer genotype of cytochrome P450 2D6 on metoprolol pharmacokinetics
and pharmacodynamics. Clinical Pharmacology & Therapeutics. 2004;76(4):302-12.
33. Daly A. Pharmacogenetics of the major polymorphic metabolizing enzymes.
Fundamental & clinical pharmacology. 2003;17(1):27-41.
34. Masimirembwa C, Hasler J. Pharmacogenetics in Africa, an opportunity for appropriate
drug dosage regimens: On the road to personalized healthcare. CPT: Pharmacometrics &
Systems Pharmacology. 2013;2(5):1-4.
35. Matimba A, Oluka MN, Ebeshi BU, Sayi J, Bolaji OO, Guantai AN, et al. Establishment
of a biobank and pharmacogenetics database of African populations. Eur J Hum Genet.
2008;16(7):780-3.
36. Frank D, Jaehde U, Fuhr U. Evaluation of probe drugs and pharmacokinetic metrics for
CYP2D6 phenotyping. European journal of clinical pharmacology. 2007;63(4):321-33.
37. Jayachandran S, Lleras-Muney A, Smith KV. Modern Medicine and the 20th Century
Decline in Mortality: Evidence on the Impact of Sulfa Drugs. National Bureau of Economic
Research, 2009.
38. Gardiner SJ, Begg EJ. Pharmacogenetics, drug-metabolizing enzymes, and clinical
practice. Pharmacol Rev. 2006;58(3):521-90.
39. Nebert DW. Pharmacogenetics and pharmacogenomics: why is this relevant to the
clinical geneticist? Clinical genetics. 1999;56(4):247-58.
cxl
40. Nebert DW. Pharmacogenetics: 65 candles on the cake. Pharmacogenetics and
Genomics. 1997;7(6):435-40.
41. Flockhart D. CYP2D6 genotyping and the pharmacogenetics of tamoxifen. Clin Adv
Hematol Oncol. 2008;6(7):493-4.
42. Kalow W. Pharmacogenetics and pharmacogenomics: origin, status, and the hope for
personalized medicine. The pharmacogenomics journal. 2006;6(3):162-5.
43. Weinshilboum R, Wang L. Pharmacogenetics: inherited variation in amino acid sequence
and altered protein quantity. Clin Pharmacol Ther. 2004;75(4):253-8.
44. Kalow W. Pharmacogenetics: its biologic roots and the medical challenge. Clin
Pharmacol Ther. 1993;54(3):235-41.
45. Wei C-Y, Lee M-TM, Chen Y-T. Pharmacogenomics of adverse drug reactions:
implementing personalized medicine. Human molecular genetics. 2012;21(R1):R58-R65.
46. Savonarola A, Palmirotta R, Guadagni F, Silvestris F. Pharmacogenetics and
pharmacogenomics: role of mutational analysis in anti-cancer targeted therapy.
Pharmacogenomics J. 2012;12(4):277-86.
47. Crews KR, Gaedigk A, Dunnenberger HM, Klein TE, Shen DD, Callaghan JT, et al.
Clinical Pharmacogenetics Implementation Consortium (CPIC) guidelines for codeine therapy in
the context of cytochrome P450 2D6 (CYP2D6) genotype. Clin Pharmacol Ther.
2012;91(2):321-6.
48. Collins FS, Morgan M, Patrinos A. The Human Genome Project: lessons from large-scale
biology. Science. 2003;300(5617):286-90.
49. Nebert DW. Pharmacogenetics and pharmacogenomics: why is this relevant to the
clinical geneticist? Clin Genet. 1999;56(4):247-58.
cxli
50. Snyder LH. Studies in Human Inheritance. IX, The Inheritance of Taste Deficiency in
Man. 1932.
51. Watson JD, Crick FH, editors. The structure of DNA. Cold Spring Harbor Symposia on
Quantitative Biology; 1953: Cold Spring Harbor Laboratory Press.
52. Carson PE, Flanagan CL, Ickes C, Alving AS. Enzymatic deficiency in primaquine-
sensitive erythrocytes. Science. 1956;124(3220):484-5.
53. Hughes HB, Biehl J, Jones A, Schmidt L. Metabolism of isoniazid in man as related to
the occurrence of peripheral neuritis. American review of tuberculosis. 1954;70(2):266.
54. Kalow W, Genest K. A method for the detection of atypical forms of human serum
cholinesterase. Determination of dibucaine numbers. Canadian journal of biochemistry and
physiology. 1957;35(6):339-46.
55. Motulsky AG. Drug reactions, enzymes, and biochemical genetics. Journal of the
American Medical Association. 1957;165(7):835-7.
56. Vogel F. Moderne probleme der humangenetik. Ergebnisse der inneren medizin und
kinderheilkunde: Springer; 1959. p. 52-125.
57. Motulsky A. From pharmacogenetics and ecogenetics to pharmacogenomics. Med Secoli.
2002;14(3):683-705.
58. Mahgoub A, Idle JR, Dring LG, Lancaster R, Smith RL. Polymorphic hydroxylation of
Debrisoquine in man. Lancet. 1977;2(8038):584-6.
59. Eichelbaum M, Spannbrucker N, Steincke B, Dengler HJ. Defective N-oxidation of
sparteine in man: a new pharmacogenetic defect. Eur J Clin Pharmacol. 1979;16(3):183-7.
60. Watson JD. The human genome project: past, present, and future. Science.
1990;248(4951):44-9.
cxlii
61. Ingelman-Sundberg M. Pharmacogenetics: an opportunity for a safer and more efficient
pharmacotherapy. J Intern Med. 2001;250(3):186-200.
62. Jorde LB, Wooding SP. Genetic variation, classification and'race'. Nature genetics.
2004;36:S28-S33.
63. Schwartz RS. Racial profiling in medical research. N Engl J Med. 2001;344(18):1392-3.
64. Haga SB, Venter JC. Genetics. FDA races in wrong direction. Science.
2003;301(5632):466.
65. Wood AJ. Racial differences in the response to drugs--pointers to genetic differences. N
Engl J Med. 2001;344(18):1394-6.
66. Risch N, Burchard E, Ziv E, Tang H. Categorization of humans in biomedical research:
genes, race and disease. Genome biology. 2002;3(7):comment2007.
67. Burchard EG, Ziv E, Coyle N, Gomez SL, Tang H, Karter AJ, et al. The importance of
race and ethnic background in biomedical research and clinical practice. N Engl J Med.
2003;348(12):1170-5.
68. Feldman MW, Lewontin RC, King M-C. Race: a genetic melting-pot. Nature.
2003;424(6947):374-.
69. Nei M, Livshits G. Genetic relationships of Europeans, Asians and Africans and the
origin of modern Homo sapiens. Human heredity. 1989;39(5):276-81.
70. Cavalli-Sforza LL, Bodmer WF. The genetics of human populations: Courier
Corporation; 1999.
71. Jorde LB, Watkins WS, Bamshad MJ, Dixon ME, Ricker CE, Seielstad MT, et al. The
distribution of human genetic diversity: a comparison of mitochondrial, autosomal, and Y-
chromosome data. Am J Hum Genet. 2000;66(3):979-88.
cxliii
72. Barbujani G, Magagni A, Minch E, Cavalli-Sforza LL. An apportionment of human DNA
diversity. Proc Natl Acad Sci U S A. 1997;94(9):4516-9.
73. Pirmohamed M, James S, Meakin S, Green C, Scott AK, Walley TJ, et al. Adverse drug
reactions as cause of admission to hospital: prospective analysis of 18 820 patients. Bmj.
2004;329(7456):15-9.
74. Moore TJ, Cohen MR, Furberg CD. Serious adverse drug events reported to the Food and
Drug Administration, 1998-2005. Archives of Internal Medicine. 2007;167(16):1752-9.
75. Strom BL, Kimmel SE, Hennessy S. Textbook of Pharmacoepidemiology: Wiley; 2013.
76. World Health Organization (WHO). The importance of pharmacovigilance.Geneva;
2002.
77. Wysowski DK, Swartz L. Adverse drug event surveillance and drug withdrawals in the
United States, 1969-2002: the importance of reporting suspected reactions. Archives of internal
medicine. 2005;165(12):1363-9.
78. Lopez-Gonzalez E, Herdeiro MT, Figueiras A. Determinants of under-reporting of
adverse drug reactions. Drug safety. 2009;32(1):19-31.
79. Hazell L, Shakir SA. Under-reporting of adverse drug reactions. Drug Safety.
2006;29(5):385-96.
80. Okezie EO. Adverse drug reactions reporting by physicians in Ibadan, Nigeria.
Pharmacoepidemiology and drug safety. 2008;17(5):517-22.
81. Şardaş S. Pharmacogenovigilance–An idea whose time has come. 2010.
82. Maitland-van der Zee AH, de Boer A, Leufkens HG. The interface between
pharmacoepidemiology and pharmacogenetics. Eur J Pharmacol. 2000;410(2-3):121-30.
cxliv
83. van Puijenbroek E, Conemans J, van Grootheest K. Spontaneous reports and
pharmacogenetics: the role of the pharmacovigilance centre. Drug Saf. 2009;32(4):357-8.
84. van Puijenbroek E, Conemans J, van Grootheest K. Spontaneous ADR reports as a trigger
for pharmacogenetic research. Drug Safety. 2009;32(3):255-64.
85. van Puijenbroek E, Conemans J, van Grootheest K. Spontaneous Reports and
Pharmacogenetics. Drug safety. 2009;32(4):357-8.
86. Sardas S, Endrenyi L, Gursoy UK, Hutz M, Lin B, Patrinos GP, et al. A call for
pharmacogenovigilance and rapid falsification in the age of big data: why not first road test your
biomarker? Omics. 2014;18(11):663-5.
87. Toh DS, Tan LL, Aw DC, Pang SM, Lim SH, Thirumoorthy T, et al. Building
pharmacogenetics into a pharmacovigilance program in Singapore: using serious skin rash as a
pilot study. Pharmacogenomics J. 2014;14(4):316-21.
88. Jones JK. Clinical pharmacology and pharmacoepidemiology: synergistic interactions. Int
J Clin Pharmacol Ther Toxicol. 1992;30(11):421-4.
89. Evans WE, Johnson JA. Pharmacogenomics: the inherited basis for interindividual
differences in drug response. Annual review of genomics and human genetics. 2001;2(1):9-39.
90. Lindpaintner K. Pharmacogenetics and the future of medical practice: conceptual
considerations. Pharmacogenomics J. 2001;1(1):23-6.
91. Druker BJ, Guilhot F, O'Brien SG, Gathmann I, Kantarjian H, Gattermann N, et al. Five-
year follow-up of patients receiving imatinib for chronic myeloid leukemia. New England
Journal of Medicine. 2006;355(23):2408-17.
92. Hamburg MA, Collins FS. The path to personalized medicine. New England Journal of
Medicine. 2010;363(4):301-4.

cxlv
93. Puri A. Pharmacogenomics: Benefits of personalized medicines. International Journal of
Medicine and Medical Sciences. 2009;1(4):091-6.
94. Rothstein MA. Pharmacogenomics: Social, ethical, and clinical dimensions: John Wiley
& Sons; 2003.
95. Cutrell A, Hernandez J, Edwards M, Fleming J, Powell W, Scott T, editors. Clinical risk
factors for hypersensitivity reactions to abacavir: retrospective analysis of over 8000 subjects
receiving abacavir in 34 clinical trials. 43rd Interscience Conference on Antimicrobial Agents
and Chemotherapy; 2003.
96. Hetherington S, McGuirk S, Powell G, Cutrell A, Naderer O, Spreen B, et al.
Hypersensitivity reactions during therapy with the nucleoside reverse transcriptase inhibitor
abacavir. Clinical therapeutics. 2001;23(10):1603-14.
97. Mallal S, Phillips E, Carosi G, Molina J-M, Workman C, Tomažič J, et al. HLA-B* 5701
screening for hypersensitivity to abacavir. New England Journal of Medicine. 2008;358(6):568-
79.
98. Saag M, Balu R, Phillips E, Brachman P, Martorell C, Burman W, et al. High sensitivity
of human leukocyte antigen-b* 5701 as a marker for immunologically confirmed abacavir
hypersensitivity in white and black patients. Clinical infectious diseases. 2008;46(7):1111-8.
99. Narod SA, Brunet J-S, Ghadirian P, Robson M, Heimdal K, Neuhausen SL, et al.
Tamoxifen and risk of contralateral breast cancer in BRCA1 and BRCA2 mutation carriers: a
case-control study. The Lancet. 2000;356(9245):1876-81.
100. Gronwald J, Tung N, Foulkes WD, Offit K, Gershoni R, Daly M, et al. Tamoxifen and
contralateral breast cancer in BRCA1 and BRCA2 carriers: an update. International Journal of
Cancer. 2006;118(9):2281-4.
cxlvi
101. Goetz MP, Rae JM, Suman VJ, Safgren SL, Ames MM, Visscher DW, et al.
Pharmacogenetics of tamoxifen biotransformation is associated with clinical outcomes of
efficacy and hot flashes. Journal of Clinical Oncology. 2005;23(36):9312-8.
102. Beverage JN, Sissung TM, Sion AM, Danesi R, Figg WD. CYP2D6 polymorphisms and
the impact on tamoxifen therapy. Journal of pharmaceutical sciences. 2007;96(9):2224-31.
103. Swen JJ, Nijenhuis M, de Boer A, Grandia L, Maitland-van der Zee AH, Mulder H, et al.
Pharmacogenetics: from bench to byte--an update of guidelines. Clin Pharmacol Ther.
2011;89(5):662-73.
104. Chen P, Lin J-J, Lu C-S, Ong C-T, Hsieh PF, Yang C-C, et al. Carbamazepine-induced
toxic effects and HLA-B* 1502 screening in Taiwan. New England Journal of Medicine.
2011;364(12):1126-33.
105. Scott SA, Edelmann L, Kornreich R, Desnick RJ. Warfarin pharmacogenetics: CYP2C9
and VKORC1 genotypes predict different sensitivity and resistance frequencies in the Ashkenazi
and Sephardi Jewish populations. Am J Hum Genet. 2008;82(2):495-500.
106. Johnson JA, Gong L, Whirl‐Carrillo M, Gage BF, Scott SA, Stein C, et al. Clinical
Pharmacogenetics Implementation Consortium Guidelines for CYP2C9 and VKORC1 genotypes
and warfarin dosing. Clinical Pharmacology & Therapeutics. 2011;90(4):625-9.
107. Klein TE, Altman RB, Eriksson N, Gage BF, Kimmel SE, Lee MT, et al. Estimation of
the warfarin dose with clinical and pharmacogenetic data. The New England journal of medicine.
2009;360(8):753-64.
108. McLeod HL, Evans WE. Pharmacogenomics: unlocking the human genome for better
drug therapy. Annual review of pharmacology and toxicology. 2001;41(1):101-21.
109. Gibson GG, Skett P. Introduction to drug metabolism: Nelson Thornes; 2001.

cxlvii
110. Evans WE, Relling MV. Pharmacogenomics: translating functional genomics into
rational therapeutics. science. 1999;286(5439):487-91.
111. Caira MR, Ionescu C. Drug metabolism: current concepts: Springer Science & Business
Media; 2006.
112. Degtyarenko KN. Structural domains of P450-containing monooxygenase systems.
Protein Engineering. 1995;8(8):737-47.
113. Brodie BB, Axelrod J, Cooper JR, Gaudette L, La Du BN, Mitoma C, et al. Detoxication
of drugs and other foreign compounds by liver microsomes. Science. 1955;121(3147):603-4.
114. Nebert DW, Nelson DR, Coon MJ, Estabrook RW, Feyereisen R, Fujii-Kuriyama Y, et
al. The P450 superfamily: update on new sequences, gene mapping, and recommended
nomenclature. DNA and cell biology. 1991;10(1):1-14.
115. Hicks JK, Bishop JR, Sangkuhl K, Muller DJ, Ji Y, Leckband SG, et al. Clinical
Pharmacogenetics Implementation Consortium (CPIC) Guideline for CYP2D6 and CYP2C19
Genotypes and Dosing of Selective Serotonin Reuptake Inhibitors. Clin Pharmacol Ther.
2015;98(2):127-34.
116. Hicks JK, Swen JJ, Thorn CF, Sangkuhl K, Kharasch ED, Ellingrod VL, et al. Clinical
Pharmacogenetics Implementation Consortium guideline for CYP2D6 and CYP2C19 genotypes
and dosing of tricyclic antidepressants. Clin Pharmacol Ther. 2013;93(5):402-8.
117. Crews KR, Gaedigk A, Dunnenberger HM, Leeder JS, Klein TE, Caudle KE, et al.
Clinical Pharmacogenetics Implementation Consortium guidelines for cytochrome P450 2D6
genotype and codeine therapy: 2014 update. Clin Pharmacol Ther. 2014;95(4):376-82.
cxlviii
118. Naveen AT, Adithan C, Soya SS, Gerard N, Krishnamoorthy R. CYP2D6 genetic
polymorphism in South Indian populations. Biological and Pharmaceutical Bulletin.
2006;29(8):1655-8.
119. Streetman DS, Bertino Jr JS, Nafziger AN. Phenotyping of drug-metabolizing enzymes in
adults: a review of in-vivo cytochrome P450 phenotyping probes. Pharmacogenetics and
Genomics. 2000;10(3):187-216.
120. Fuhr U, Jetter A, Kirchheiner J. Appropriate phenotyping procedures for drug
metabolizing enzymes and transporters in humans and their simultaneous use in the “cocktail”
approach. Clinical Pharmacology & Therapeutics. 2007;81(2):270-83.
121. Tanaka E, Kurata N, Yasuhara H. How useful is the ‘cocktail approach’for evaluating
human hepatic drug metabolizing capacity using cytochrome P450 phenotyping probes in vivo?
Journal of clinical pharmacy and therapeutics. 2003;28(3):157-65.
122. Kivisto KT, Kroemer HK. Use of probe drugs as predictors of drug metabolism in
humans. J Clin Pharmacol. 1997;37(1 Suppl):40s-8s.
123. Weinshilboum R, Wang L. Pharmacogenomics: bench to bedside. Nature Reviews Drug
Discovery. 2004;3(9):739-48.
124. Linder MW, Prough RA, Valdes R. Pharmacogenetics: a laboratory tool for optimizing
therapeutic efficiency. Clinical Chemistry. 1997;43(2):254-66.
125. Daly AK. Molecular basis of polymorphic drug metabolism. Journal of molecular
medicine (Berlin, Germany). 1995;73(11):539-53.
126. Hartman AR, Helft P. The ethics of CYP2D6 testing for patients considering tamoxifen.
Breast cancer research : BCR. 2007;9(2):103.

cxlix
127. Linder MW, Prough RA, Valdes R, Jr. Pharmacogenetics: a laboratory tool for
optimizing therapeutic efficiency. Clin Chem. 1997;43(2):254-66.
128. Gaedigk A, Bradford LD, Marcucci KA, Leeder JS. Unique CYP2D6 activity distribution
and genotype-phenotype discordance in black Americans. Clinical pharmacology and
therapeutics. 2002;72(1):76-89.
129. Johansson I, Oscarson M, Yue QY, Bertilsson L, Sjoqvist F, Ingelman-Sundberg M.
Genetic analysis of the Chinese cytochrome P4502D locus: characterization of variant CYP2D6
genes present in subjects with diminished capacity for debrisoquine hydroxylation. Molecular
pharmacology. 1994;46(3):452-9.
130. Wennerholm A, Dandara C, Sayi J, Svensson JO, Abdi YA, Ingelman-Sundberg M, et al.
The African-specific CYP2D617 allele encodes an enzyme with changed substrate specificity.
Clinical pharmacology and therapeutics. 2002;71(1):77-88.
131. Bertilsson L. Geographical/interracial differences in polymorphic drug oxidation. Current
state of knowledge of cytochromes P450 (CYP) 2D6 and 2C19. Clin Pharmacokinet.
1995;29(3):192-209.
132. Abdel‐Rahman S, Leeder J, Wilson J, Gaedigk A, Gotschall R, Medve R, et al.
Concordance between Tramadol and Dextromethorphan Parent/Metabolite Ratios: The Influence
of CYP2D6 and Non‐CYP2D6 Pathways on Biotransformation. The Journal of Clinical
Pharmacology. 2002;42(1):24-9.
133. Subrahmanyam V, Renwick AB, Walters DG, Young PJ, Price RJ, Tonelli AP, et al.
Identification of cytochrome P-450 isoforms responsible for cis-tramadol metabolism in human
liver microsomes. Drug Metabolism and Disposition. 2001;29(8):1146-55.

cl
134. Johnson JA, Burlew BS. Metoprolol metabolism via cytochrome P4502D6 in ethnic
populations. Drug metabolism and disposition. 1996;24(3):350-5.
135. Özdemir M, Crewe KH, Tucker GT, Rostami‐Hodjegan A. Assessment of in vivo
CYP2D6 activity: differential sensitivity of commonly used probes to urine pH. The Journal of
Clinical Pharmacology. 2004;44(12):1398-404.
136. Nakamura K, Goto F, Ray WA, McAllister CB, Jacqz E, Wilkinson GR, et al. Interethnic
differences in genetic polymorphism of debrisoquin and mephenytoin hydroxylation between
Japanese and Caucasian populations. Clinical pharmacology and therapeutics. 1985;38(4):402-8.
137. Bertilsson L, Lou YQ, Du YL, Liu Y, Kuang TY, Liao XM, et al. Pronounced differences
between native Chinese and Swedish populations in the polymorphic hydroxylations of
debrisoquin and S-mephenytoin. Clinical pharmacology and therapeutics. 1992;51(4):388-97.
138. Bathum L, Johansson I, Ingelman-Sundberg M, Hørder M, Brøsen K. Ultrarapid
metabolism of sparteine: frequency of alleles with duplicated CYP2D6 genes in a Danish
population as determined by restriction fragment length polymorphism and long polymerase
chain reaction. Pharmacogenetics. 1998;8(2):119-23.
139. McLellan RA, Oscarson M, Seidegard J, Evans DA, Ingelman-Sundberg M. Frequent
occurrence of CYP2D6 gene duplication in Saudi Arabians. Pharmacogenetics. 1997;7(3):187-
91.
140. Qin S, Shen L, Zhang A, Xie J, Shen W, Chen L, et al. Systematic polymorphism
analysis of the CYP2D6 gene in four different geographical Han populations in mainland China.
Genomics. 2008;92(3):152-8.
cli
141. Griese EU, Asante-Poku S, Ofori-Adjei D, Mikus G, Eichelbaum M. Analysis of the
CYP2D6 gene mutations and their consequences for enzyme function in a West African
population. Pharmacogenetics. 1999;9(6):715-23.
142. Dandara C, Swart M, Mpeta B, Wonkam A, Masimirembwa C. Cytochrome P450
pharmacogenetics in African populations: implications for public health. Expert Opin Drug
Metab Toxicol. 2014;10(6):769-85.
143. Zanger UM, Raimundo S, Eichelbaum M. Cytochrome P450 2D6: overview and update
on pharmacology, genetics, biochemistry. Naunyn-Schmiedeberg's archives of pharmacology.
2004;369(1):23-37.
144. Zhou S-F. Polymorphism of human cytochrome P450 2D6 and its clinical significance.
Clinical pharmacokinetics. 2009;48(12):761-804.
145. Granvil CP, Krausz KW, Gelboin HV, Idle JR, Gonzalez FJ. 4-Hydroxylation of
debrisoquine by human CYP1A1 and its inhibition by quinidine and quinine. Journal of
Pharmacology and Experimental Therapeutics. 2002;301(3):1025-32.
146. Paar W, Frankus P, Dengler H. The metabolism of tramadol by human liver microsomes.
The clinical investigator. 1992;70(8):708-10.
147. Barnhart JW, Massad EN. Determination of dextromethorphan in serum by gas
chromatography. Journal of Chromatography B: Biomedical Sciences and Applications.
1979;163(4):390-5.
148. Silvasti M, Karttunen P, Tukiainen H, Kokkonen P, Hänninen U, Nykänen S.
Pharmacokinetics of dextromethorphan and dextrorphan: a single dose comparison of three
preparations in human volunteers. International journal of clinical pharmacology, therapy, and
toxicology. 1987;25(9):493-7.
clii
149. Yu A, Dong H, Lang D, Haining RL. Characterization of Dextromethorphan O-andN-
Demethylation Catalyzed by Highly Purified Recombinant Human CYP2D6. Drug metabolism
and disposition. 2001;29(11):1362-5.
150. Yu A, Haining RL. Comparative contribution to dextromethorphan metabolism by
cytochrome P450 isoforms in vitro: can dextromethorphan be used as a dual probe for both
CYP2D6 and CYP3A activities? Drug Metabolism and Disposition. 2001;29(11):1514-20.
151. Lutz U, Völkel W, Lutz RW, Lutz WK. LC–MS/MS analysis of dextromethorphan
metabolism in human saliva and urine to determine CYP2D6 phenotype and individual
variability in N-demethylation and glucuronidation. Journal of Chromatography B.
2004;813(1):217-25.
152. Hernandez SC, Bertolino M, Xiao Y, Pringle KE, Caruso FS, Kellar KJ.
Dextromethorphan and its metabolite dextrorphan block alpha3beta4 neuronal nicotinic
receptors. J Pharmacol Exp Ther. 2000;293(3):962-7.
153. Chladek J, Zimova G, Beranek M, Martinkova J. In-vivo indices of CYP2D6 activity:
comparison of dextromethorphan metabolic ratios in 4-h urine and 3-h plasma. European journal
of clinical pharmacology. 2000;56(9-10):651-7.
154. Moltke LL, Greenblatt DJ, Grassi JM, Granda BW, Venkatakrishnan K, Schmider J, et al.
Multiple Human Cytochromes Contribute to Biotransformation of Dextromethorphan In‐vitro:
Role of CYP2C9, CYP2C19, CYP2D6, and CYP3A. Journal of pharmacy and pharmacology.
1998;50(9):997-1004.
155. Schmider J, Greenblatt DJ, Fogelman SM, Von Moltke LL, Shader RI. Metabolism of
dextromethorphan in vitro: involvement of cytochromes P450 2D6 and 3A3/4, with a possible
role of 2E1. Biopharmaceutics & drug disposition. 1997;18(3):227-40.

cliii
156. Gorski JC, Jones DR, Wrighton SA, Hall SD. Characterization of dextromethorphan N-
demethylation by human liver microsomes: contribution of the cytochrome P450 3A (CYP3A)
subfamily. Biochemical pharmacology. 1994;48(1):173-82.
157. Alvan G, Bechtel P, Iselius L, Gundert-Remy U. Hydroxylation polymorphisms of
debrisoquine and mephenytoin in European populations. European journal of clinical
pharmacology. 1990;39(6):533-7.
158. Jacqz-Aigrain E, Funck-Brentano C, Cresteil T. CYP2D6-and CYP3A-dependent
metabolism of dextromethorphan in humans. Pharmacogenetics and Genomics. 1993;3(4):197-
204.
159. Dayer P, Leemann T, Striberni R. Dextromethorphan O‐demethylation in liver
microsomes as a prototype reaction to monitor cytochrome P‐450 db1 activity. Clinical
Pharmacology & Therapeutics. 1989;45(1):34-40.
160. Ito T, Kato M, Chiba K, Okazaki O, Sugiyama Y. Estimation of the interindividual
variability of cytochrome 2D6 activity from urinary metabolic ratios in the literature. Drug
metabolism and pharmacokinetics. 2010;25(3):243-53.
161. Streetman DS, Ellis RE, Nafziger AN, Leeder JS, Gaedigk A, Gotschall R, et al. Dose
dependency of dextromethorphan for cytochrome P450 2D6 (CYP2D6) phenotyping. Clin
Pharmacol Ther. 1999;66(5):535-41.
162. Lowry J, Pearce R, Gaedigk V, Talib N, Shaw P, Leeder J, et al. Lead and its effects on
cytochromes P450. Journal of Drug Metabolism & Toxicology. 2013;2012.
163. Wanwimolruk S, Patamasucon P, Lee E. Evidence for the polymorphic oxidation of
debrisoquine in the Thai population. British journal of clinical pharmacology. 1990;29(2):244-7.

cliv
164. Sohn D-R, Shin S, Park C-W, Kusaka M, Chiba K, Ishizaki T. Metoprolol oxidation
polymorphism in a Korean population: comparison with native Japanese and Chinese
populations. British journal of clinical pharmacology. 1991;32(4):504-7.
165. Evans D, Mahgoub A, Sloan T, Idle J, Smith R. A family and population study of the
genetic polymorphism of debrisoquine oxidation in a white British population. Journal of
Medical Genetics. 1980;17(2):102-5.
166. Eichelbaum M, Bertilsson L, Sawe J, Zekorn C. Polymorphic oxidation of sparteine and
debrisoquine: related pharmacogenetic entities. Clinical pharmacology and therapeutics.
1982;31(2):184-6.
167. Eichelbaum M, Woolhouse N. Inter-ethnic difference in sparteine oxidation among
Ghanaians and Germans. European journal of clinical pharmacology. 1985;28(1):79-83.
168. Schmid B, Bircher J, Preisig R, Küpfer A. Polymorphic dextromethorphan metabolism:
Co‐segregation of oxidative O‐demethylation with debrisoquin hydroxylation. Clinical
Pharmacology & Therapeutics. 1985;38(6):618-24.
169. Jurica J, Bartecek R, Zourkova A, Pindurová E, Sulcova A, Kasparek T, et al. Serum
dextromethorphan/dextrorphan metabolic ratio for CYP2D6 phenotyping in clinical practice.
Journal of clinical pharmacy and therapeutics. 2012;37(4):486-90.
170. Jackson P, Tucker G, Woods H. Testing for bimodality in frequency distributions of data
suggesting polymorphisms of drug metabolism‐histograms and probit plots. British journal of
clinical pharmacology. 1989;28(6):647-53.
171. Chládek J, Zimová G, Martínková J, Tůma I. Intra‐individual variability and influence of
urine collection period on dextromethorphan metabolic ratios in healthy subjects. Fundamental &
clinical pharmacology. 1999;13(4):508-15.
clv
172. Labbé L, Sirois C, Pilote S, Arseneault M, Robitaille NM, Turgeon J, et al. Effect of
gender, sex hormones, time variables and physiological urinary pH on apparent CYP2D6 activity
as assessed by metabolic ratios of marker substrates. Pharmacogenetics and Genomics.
2000;10(5):425-38.
173. Rostami-Hodjegan A, Kroemer HK, Tucker GT. In-vivo indices of enzyme activity: the
effect of renal impairment on the assessment of CYP2D6 activity. Pharmacogenetics and
Genomics. 1999;9(3):277-86.
174. Kashuba AD, Nafziger AN, Kearns GL, Leeder JS, Shirey CS, Gotschall R, et al.
Quantification of intraindividual variability and the influence of menstrual cycle phase on
CYP2D6 activity as measured by dextromethorphan phenotyping. Pharmacogenetics and
Genomics. 1998;8(5):403-10.
175. Hu OY-P, Tang H-S, Lane H-Y, Chang W-H, Hu T-M. Novel single-point plasma or
saliva dextromethorphan method for determining CYP2D6 activity. Journal of Pharmacology
and Experimental Therapeutics. 1998;285(3):955-60.
176. Wojtczak A, Rychlik-Sych M, Krochmalska-Ulacha E, Skrêtkowicz J. CYP2D6
phenotyping with dextromethorphan. Pharmacological Reports. 2007;59(6):734.
177. Panserat S, Sica L, Gerard N, Mathieu H, Jacqz-Aigrain E, Krishnamoorthy R. CYP2D6
polymorphism in a Gabonese population: contribution of the CYP2D6* 2and CYP2D6*
17alleles to the high prevalence of the intermediate metabolic phenotype. British journal of
clinical pharmacology. 1999;47(1):121.
178. Köhler D, Härtter S, Fuchs K, Sieghart W, Hiemke C. CYP2D6 genotype and
phenotyping by determination of dextromethorphan and metabolites in serum of healthy controls

clvi
and of patients under psychotropic medication. Pharmacogenetics and Genomics. 1997;7(6):453-
61.
179. Shiran M, Chowdry J, Rostami‐Hodjegan A, Ellis S, Lennard M, Iqbal M, et al. A
discordance between cytochrome P450 2D6 genotype and phenotype in patients undergoing
methadone maintenance treatment. British journal of clinical pharmacology. 2003;56(2):220-4.
180. Borges S, Li L, Hamman MA, Jones DR, Hall SD, Gorski JC. Dextromethorphan to
dextrorphan urinary metabolic ratio does not reflect dextromethorphan oral clearance. Drug
metabolism and disposition. 2005;33(7):1052-5.
181. Tamminga WJ, Wemer J, Oosterhuis B, Brakenhoff JP, Gerrits MG, de Zeeuw RA, et al.
An optimized methodology for combined phenotyping and genotyping on CYP2D6 and
CYP2C19. European journal of clinical pharmacology. 2001;57(2):143-6.
182. Ramachander G, Williams FD, Emele JF. Determination of dextrorphan in plasma and
evaluation of bioavailability of dextromethorphan hydrobromide in humans. Journal of
pharmaceutical sciences. 1977;66(7):1047-8.
183. Dixon R, Carbone J, Mohacsi E, Perry C. Dextromethorphan: radioimmunoassay and
pharmacokinetics in the dog. Research communications in chemical pathology and
pharmacology. 1978;22(2):243-55.
184. Zimova G, Chladek J, Martinkova J, Beranek M. HPLC determination of
dextromethorphan and its metabolites in urine. Chemicke Listy, 2000;94:132-135.
185. Antunes MV, Staudt DE, Raymundo S, de Oliveira V, Gossling G, Pirolli R, et al.
Development, validation and clinical application of a HPLC-FL method for CYP2D6
phenotyping in South Brazilian breast cancer patients. Clin Biochem. 2014;47(12):1084-90.
clvii
186. Afshar M, Rouini M, Ala S. Dextromethorphan metabolic phenotyping in an Iranian
population. European journal of clinical pharmacology. 2005;60(12):849-54.
187. Liang X, Li Y, Barfield M, Ji QC. Study of dried blood spots technique for the
determination of dextromethorphan and its metabolite dextrorphan in human whole blood by
LC–MS/MS. Journal of Chromatography B. 2009;877(8):799-806.
188. Vengurlekar SS, Heitkamp J, McCush F, Velagaleti PR, Brisson JH, Bramer SL. A
sensitive LC-MS/MS assay for the determination of dextromethorphan and metabolites in human
urine—application for drug interaction studies assessing potential CYP3A and CYP2D6
inhibition. Journal of pharmaceutical and biomedical analysis. 2002;30(1):113-24.
189. Lopez M, Guerrero J, Jung-Cook H, Alonso ME. CYP2D6 genotype and phenotype
determination in a Mexican Mestizo population. Eur J Clin Pharmacol. 2005;61(10):749-54.
190. Chladek J, Zimova G, Beranek M, Martinkova J. In-vivo indices of CYP2D6 activity:
comparison of dextromethorphan metabolic ratios in 4-h urine and 3-h plasma. Eur J Clin
Pharmacol. 2000;56(9-10):651-7.
191. Lam YW, Rodriguez SY. High-performance liquid chromatography determination of
dextromethorphan and dextrorphan for oxidation phenotyping by fluorescence and ultraviolet
detection. Ther Drug Monit. 1993;15(4):300-4.
192. Chen ZR, Somogyi AA, Bochner F. Simultaneous determination of dextromethorphan
and three metabolites in plasma and urine using high-performance liquid chromatography with
application to their disposition in man. Therapeutic drug monitoring. 1990;12(1):97-104.
193. Scholz W. [Clinical significance of pharmacogenetics]. Dtsch Med Wochenschr.
1967;92(18):852-6.
clviii
194. Gogtay NJ, Mali NB, Iyer K, Kadam PP, Sridharan K, Shrimal D, et al. Evaluation of
cytochrome P450 2D6 phenotyping in healthy adult Western Indians. Indian journal of
pharmacology. 2014;46(3):266-9.
195. Lin SY, Chen CH, Ho HO, Chen HH, Sheu MT. Simultaneous analysis of
dextromethorphan and its three metabolites in human plasma using an improved HPLC method
with fluorometric detection. Journal of chromatography B, Analytical technologies in the
biomedical and life sciences. 2007;859(1):141-6.
196. Akintoye SA. A history of the Yoruba people: Amalion Publishing; 2010.
197. Burgess C. Valid analytical methods and procedures: Royal Society of Chemistry; 2000.
198. Dodgen TM, Labuschagne CJ, van Schalkwyk A, Steffens FE, Gaedigk A, Cromarty AD,
et al. Pharmacogenetic comparison of CYP2D6 predictive and measured phenotypes in a South
African cohort. Pharmacogenomics J. 2015.
199. Härtter S, Baier D, Dingemanse J, Ziegler G, Hiemke C. Automated determination of
dextromethorphan and its main metabolites in human plasma by high-performance liquid
chromatography and column switching. Therapeutic drug monitoring. 1996;18(3):297-303.
200. Yeh GC, Tao PL, Ho HO, Lee YJ, Chen JY, Sheu MT. Analysis of pharmacokinetic
parameters for assessment of dextromethorphan metabolic phenotypes. J Biomed Sci.
2003;10(5):552-64.
201. Othman AM, Kadi HO, Thabit AA. Prevalence of CYP2D6 Phenotypess in a Yemen
Popultaion .World Journal of Pharmaceutical Research. 2014;
202. Hou ZY, Pickle LW, Meyer PS, Woosley RL. Salivary analysis for determination of
dextromethorphan metabolic phenotype. Clinical pharmacology and therapeutics.
1991;49(4):410-9.

clix
203. Dodgen TM, Cromarty AD, Pepper MS. Quantitative plasma analysis using automated
online solid-phase extraction with column switching LC-MS/MS for characterising cytochrome
P450 2D6 and 2C19 metabolism. Journal of separation science. 2011;34(10):1102-10.
204. Iyun AO, Lennard MS, Tucker GT, Woods HF. Metoprolol and debrisoquin metabolism
in Nigerians: lack of evidence for polymorphic oxidation. Clinical pharmacology and
therapeutics. 1986;40(4):387-94.
205. Yee MM, Josephson C, Hill CE, Harrington R, Castillejo MI, Ramjit R, et al.
Cytochrome P450 2D6 polymorphisms and predicted opioid metabolism in African American
children with sickle cell disease. Journal of pediatric hematology/oncology. 2013;35(7):e301-5.
206. Relling MV, Cherrie J, Schell MJ, Petros WP, Meyer WH, Evans WE. Lower prevalence
of the debrisoquin oxidative poor metabolizer phenotype in American black versus white
subjects. Clinical pharmacology and therapeutics. 1991;50(3):308-13.
207. Bernard S, Neville KA, Nguyen AT, Flockhart DA. Interethnic differences in genetic
polymorphisms of CYP2D6 in the US population: clinical implications. The oncologist.
2006;11(2):126-35.
208. Rau T, Wohlleben G, Wuttke H, Thuerauf N, Lunkenheimer J, Lanczik M, et al.
CYP2D6 genotype: impact on adverse effects and nonresponse during treatment with
antidepressants-a pilot study. Clin Pharmacol Ther. 2004;75(5):386-93.
209. Hicks JK, Swen JJ, Thorn CF, Sangkuhl K, Kharasch ED, Ellingrod VL, et al. Clinical
Pharmacogenetics Implementation Consortium guideline for CYP2D6 and CYP2C19 genotypes
and dosing of tricyclic antidepressants. Clin Pharmacol Ther. 2013;93(5):402-8.

clx
APPENDICES
Appendix 1: UI/UCH Ethical approval for the study

clxi
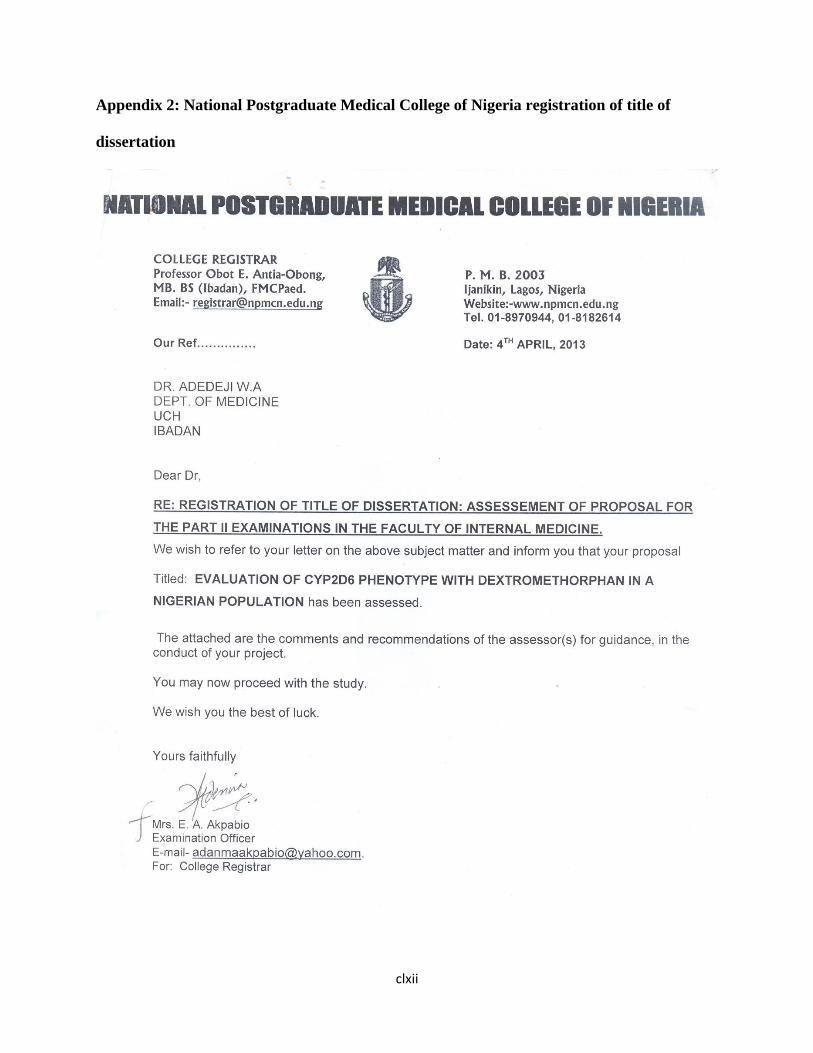
clxii
Appendix 2: National Postgraduate Medical College of Nigeria registration of title of
dissertation

clxiii
Appendix 3: INFORMED CONSENT
Title of the research: Evaluation of CYP2D6 Phenotypes in a Nigerian Population.
Name(s) and affiliation(s) of researcher(s): This study is being conducted by Dr. W.A. Adedeji
of Clinical Pharmacology Department, University College Hospital, Ibadan.
Purpose of Research: This study is being carried out to determine how a particular enzyme; the
CYP2D6 enzymes in your body break down dextromethorphan. This will allow us to know its
effectiveness in breaking down drugs that it normally acts on in your body. It is going to involve
only healthy participants. All our participants will be unrelated Yoruba from Nigerian. It is
hoped that findings from this study will help in knowing CYP2D6 phenotype and its
effectiveness in breaking down drugs. This will help us in reducing the drugs of those whose
enzyme function is low and to increase the dose of the drugs in those whose enzyme are working
too fast. This will reduce the occurrence of adverse drug reactions and improve good response
following treatment. .
Procedure of Research: If you agree to take part in this study, you will be asked to fast
overnight (that is stop eating from 10 pm the night before the test) and come to the UCH in the
morning by 7:30 am. You will be examined, and your weight will be measured, thereafter you
will be asked to pass all the urine in your bladder as much as you can and about 10 mls of blood
will be collected from your arm for CYP2D6 genotyping and laboratory tests .You will then be
given 30 mg of dextromethorphan orally. We will be collecting your urine inside a container for
8 hours. And about 5 mls of blood will be collected from your arm 3 hours after taking the drug
and you will be allowed to eat after 2 hours. You will not be allowed to go out for about 8 hours.
clxiv
Expected Duration of Research and of Participant(s)’ involvement: The study is expected to
be conducted over a period of 3 months; however you will only be requested to partake once and
it will take you about 8 hours during which time you will not be allowed to go out.
Risk(s): About 10 to 15 mls of blood will be collected from forearm with needle and syringe by
expert under a clean environment and conditions. It will cause little pain from needle pricking.
To ensure bleeding and infection from the site, we will ensure that the sample are collected by
expert and avoidance of multiple pricking as much as possible, and make sure that bleeding stop
before pressure is removed from pricking site. Also cleaning of the site with methylated spirit
before pricking will also prevent infection transmission. Besides, we will avoid reusing of needle
and syringe and no two participants will use the same needle and syringe.
Urine collection will not cause any pain apart from the discomfort of passing the urine inside a
container for 8 hours.
To ensure that you are comfortable, we will not use our general wards and the venue will be
conducive and your privacy is guaranty.
The drug (dextromethorphan hydrobromide syrup) that you will be given has been validated to
be a good and safe drug for the study. Also the dose is small and is not likely to lead to adverse
drug reaction.
However, dizziness, lightheadedness, drowsiness, nervousness, restlessness, nausea, vomiting
and stomach pain can occur. To prevent this, if you have reacted to the drug before, you will not
be allowed to participate in the study. And for any reaction that occur during the study, the
participants will be treated properly by experts.
Benefit(s): This will assist doctors in selecting appropriate dose of drugs that will be effective in
treating patients while avoiding adverse drug reactions and failure of the medication. This will

clxv
lead to individualization of drug therapy and reduction in morbidity and mortality associated
with hypertension and other non-communicable diseases.
This will provide a valuable pharmacogenetics data for Nigerian, and a good data base for
Africa and the world as a whole.
Confidentiality: All the information collected from this study will be coded. This cannot be
linked to you in any way and your name or identifier will not be in any publication or reports
from this study. As part of our responsibility to conduct this research properly, officials from
UI/UCH IRC on ethics may have access to these records. However, data obtained from this study
may be used for publication in local or international journals as well as presentations at
conferences.
Consequences of participants’ decision to withdraw from research and procedure for
orderly termination of participation: You can also choose to withdraw from the research at
any time. Please note that some of the information that has been obtained about you before you
chose to withdraw may have been modified or used in reports and publications. These cannot be
removed anymore. However, the researcher promises to make good faith and effort to comply
with your wishes as much as practicable.
Statement of person obtaining informed consent:
I have fully explained this research to-----------------------------------------------------------------------
--------------and have given sufficient information, including about risks and benefits, to make an
informed decision.
DATE: _________________________ SIGNATURE_____________________
NAME: __________________________________________________________

clxvi
Statement of person giving consent:
I have read the description of the research or have had it translated into language I understand. I
have also talked it over with the doctor to my satisfaction. I understand that my participation is
voluntary. I know enough about the purpose, methods, risks and benefits of the research study to
judge that I want to take part in it. I understand that I may freely stop being part of this study at
any time. I have received a copy of this consent form and additional information sheet to keep
for myself.
DATE: _________________________ SIGNATURE: _______________________________
NAME: __________________________________________________________
WITNESS’ SIGNATURE (if applicable): ______________________________________
WITNESS’ NAME (if applicable): _______________________________________________

clxvii
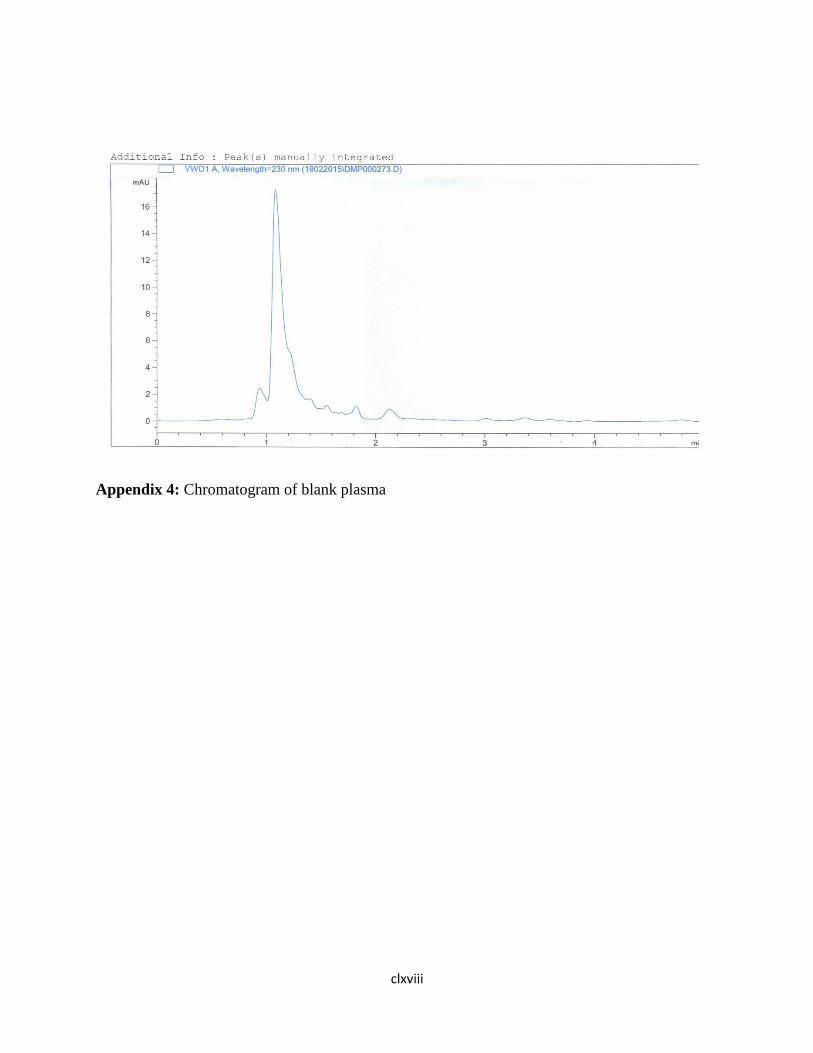
clxviii
Appendix 4: Chromatogram of blank plasma
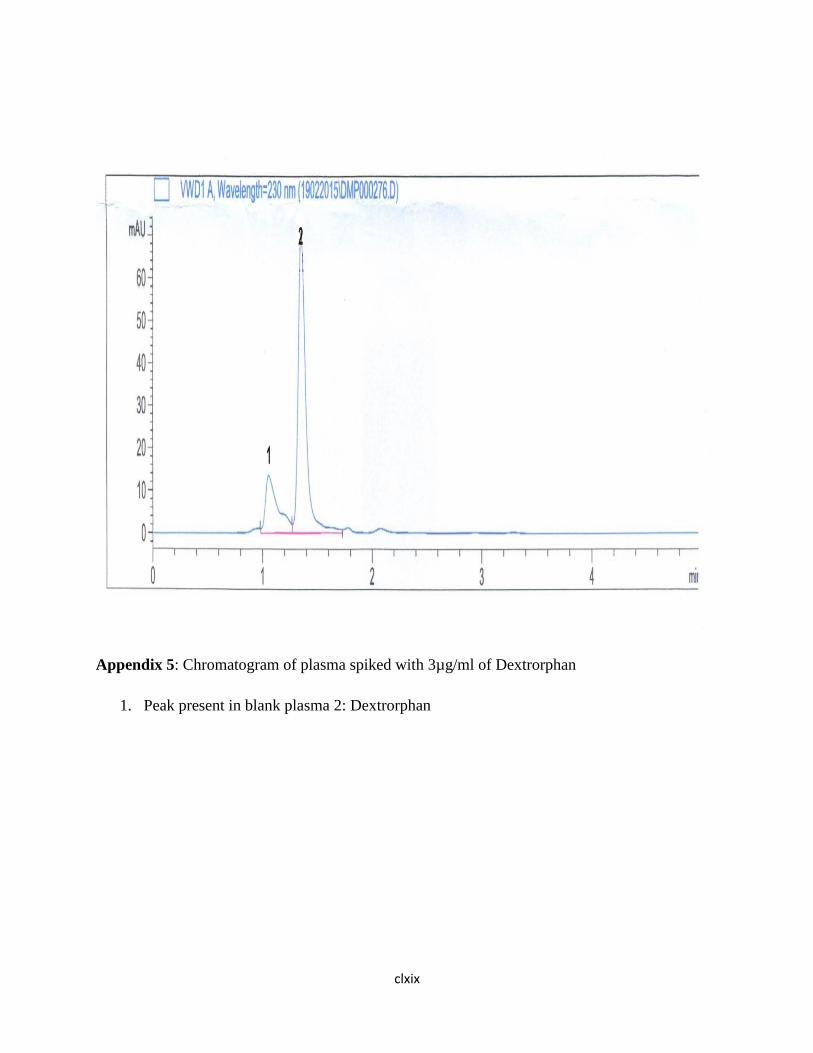
clxix
Appendix 5: Chromatogram of plasma spiked with 3µg/ml of Dextrorphan
1. Peak present in blank plasma 2: Dextrorphan
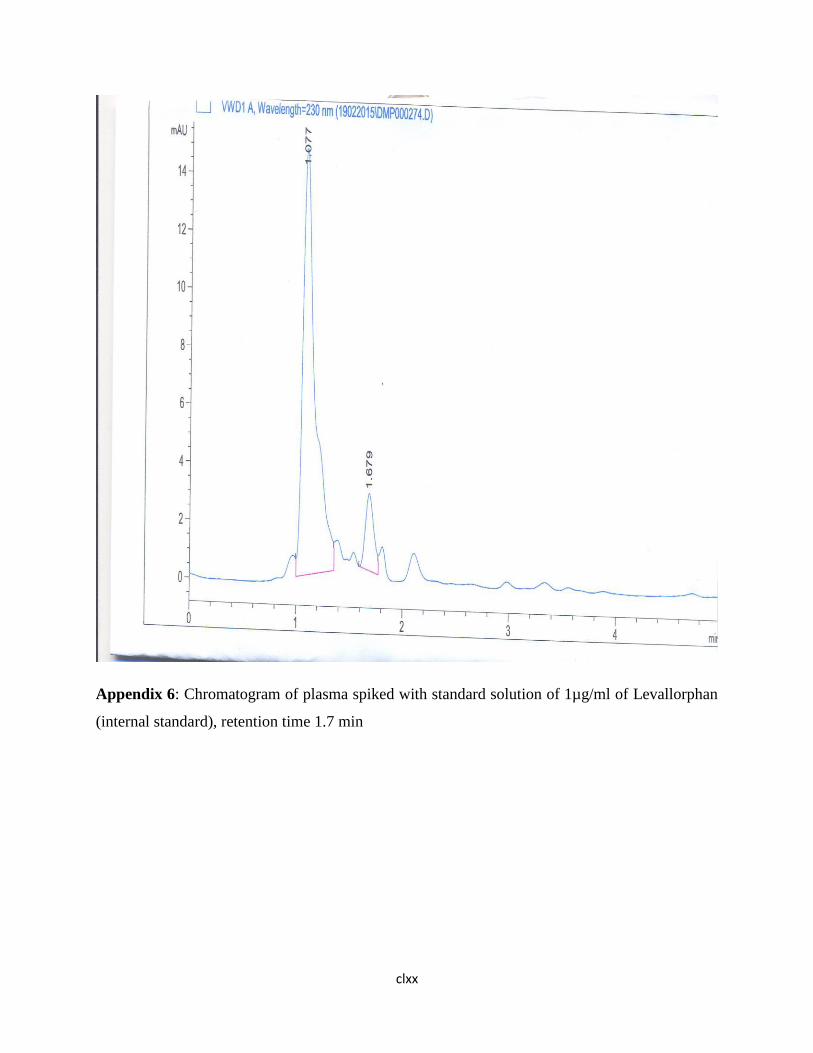
clxx
Appendix 6: Chromatogram of plasma spiked with standard solution of 1µg/ml of Levallorphan
(internal standard), retention time 1.7 min

clxxi
Appendix 7: Chromatogram of plasma spiked with standard solution of 3µg/ml of
dextromethorphan (1)

clxxii
Appendix 8: Chromatogram of plasma spiked with standard solution of 3µg/ml of Dextrorphan,
and dextromethorphan, and 1 µg/ml of levallorphan

clxxiii
Appendix 9: QUESTIONNAIRE
EVALUATION OF CYP2D6 PHENOTYPE WITH DEXTROMETHORPHAN IN
A YORUBA NIGERIAN POPULATION
Serial Number.............. Initials................ Phone No....................................
Date of Recruitment……………………………. IRB number: ……………..
SECTION A
(1) Age ..................(last birthday) Date of Birth ---------------------------------
(2) Gender (1) Male (2) Female
(3) Place of Birth ......................................................................
(4) Local Government Area..............................................................
(5) State of Origin........................................................................
(6) Nationality...............................................................................
(7) Ethnicity (1) Hausa (2) Igbo (3) Yoruba (4) Others (Specify)...................
(8) What is the home town of your father? ...................................................
(9) What is the name of your mother home town? ----------------------------------------------
(10) Marital Status (1) Single( 2) married(3)Divorced (4) Widow (5) Separated
(11) Level of educational (1) Nil (2) Some primary (3)Primary(4) Some secondary
(5) Completed secondary (5) Tertiary or Post-secondary
(12) Occupation (specify) ---------------------------------------------
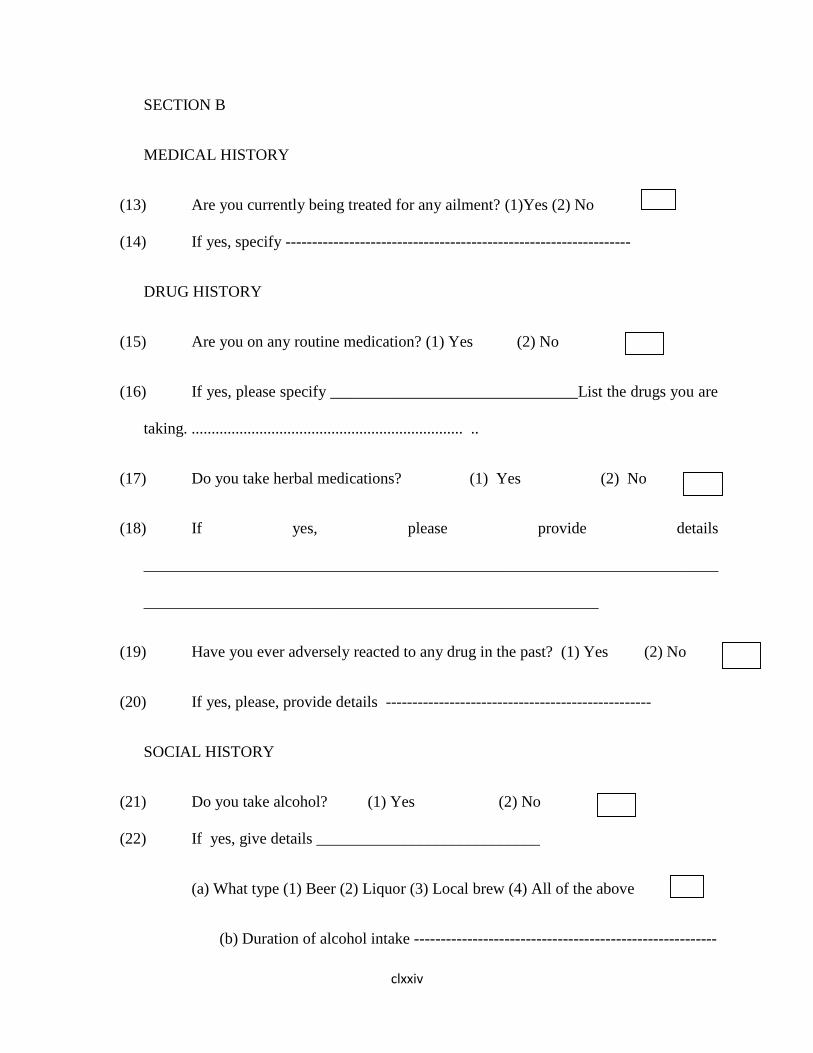
clxxiv
SECTION B
MEDICAL HISTORY
(13) Are you currently being treated for any ailment? (1)Yes (2) No
(14) If yes, specify -----------------------------------------------------------------
DRUG HISTORY
(15) Are you on any routine medication? (1) Yes (2) No
(16) If yes, please specify _______________________________List the drugs you are
taking. .................................................................... ..
(17) Do you take herbal medications? (1) Yes (2) No
(18) If yes, please provide details
________________________________________________________________________
_________________________________________________________
(19) Have you ever adversely reacted to any drug in the past? (1) Yes (2) No
(20) If yes, please, provide details --------------------------------------------------
SOCIAL HISTORY
(21) Do you take alcohol? (1) Yes (2) No
(22) If yes, give details ____________________________
(a) What type (1) Beer (2) Liquor (3) Local brew (4) All of the above
(b) Duration of alcohol intake ---------------------------------------------------------

clxxv
(23) Ever smoked cigarette? (1)Yes (2) No
If yes, quantify and provide duration ---------------------------------------------------------------
(a) Duration of Smoking -------------------------------------------------
(b) Number of sticks per day --------------------------------------------
(24) History of substance abuse (1) Heroine (2) Cocaine (3) Marijuana (4)
others (specify) --------------------------------------------------------------------------------
SECTION 1 C
CLINICAL PARAMETERS
PHYSICAL FINDINGS
1) Weight (Kg) --------------------------------
2) Height (m) ----------------------------------
a. BMI (Kg/m2) -------------------------
3) Temperature (O C) --------------------------
4) Purse Rate -----------------------------------
5) Blood Pressure: -----------------------------
INVESTIGATIONS
(1)Urine Dipsticks:
(a) Proteinuria:
(1) Positive (2) Negative
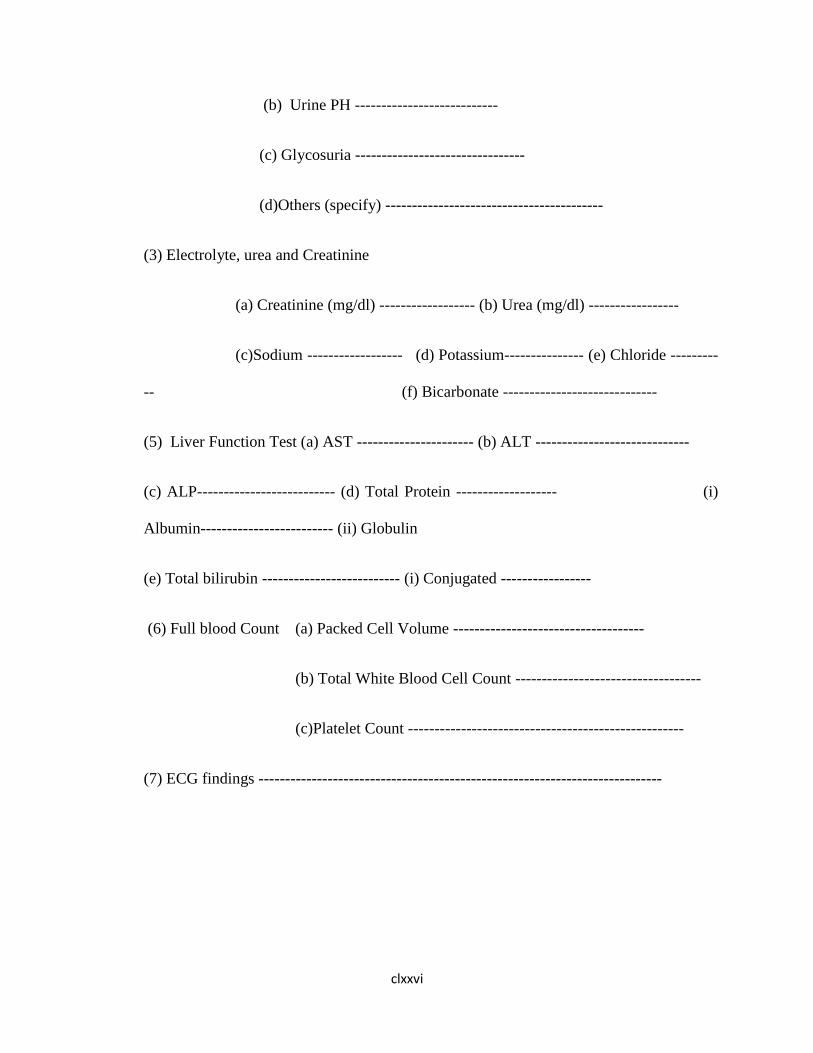
clxxvi
(b) Urine PH ---------------------------
(c) Glycosuria --------------------------------
(d)Others (specify) -----------------------------------------
(3) Electrolyte, urea and Creatinine
(a) Creatinine (mg/dl) ------------------ (b) Urea (mg/dl) -----------------
(c)Sodium ------------------ (d) Potassium--------------- (e) Chloride ---------
-- (f) Bicarbonate -----------------------------
(5) Liver Function Test (a) AST ---------------------- (b) ALT -----------------------------
(c) ALP-------------------------- (d) Total Protein ------------------- (i)
Albumin------------------------- (ii) Globulin
(e) Total bilirubin -------------------------- (i) Conjugated -----------------
(6) Full blood Count (a) Packed Cell Volume ------------------------------------
(b) Total White Blood Cell Count -----------------------------------
(c)Platelet Count ----------------------------------------------------
(7) ECG findings ----------------------------------------------------------------------------
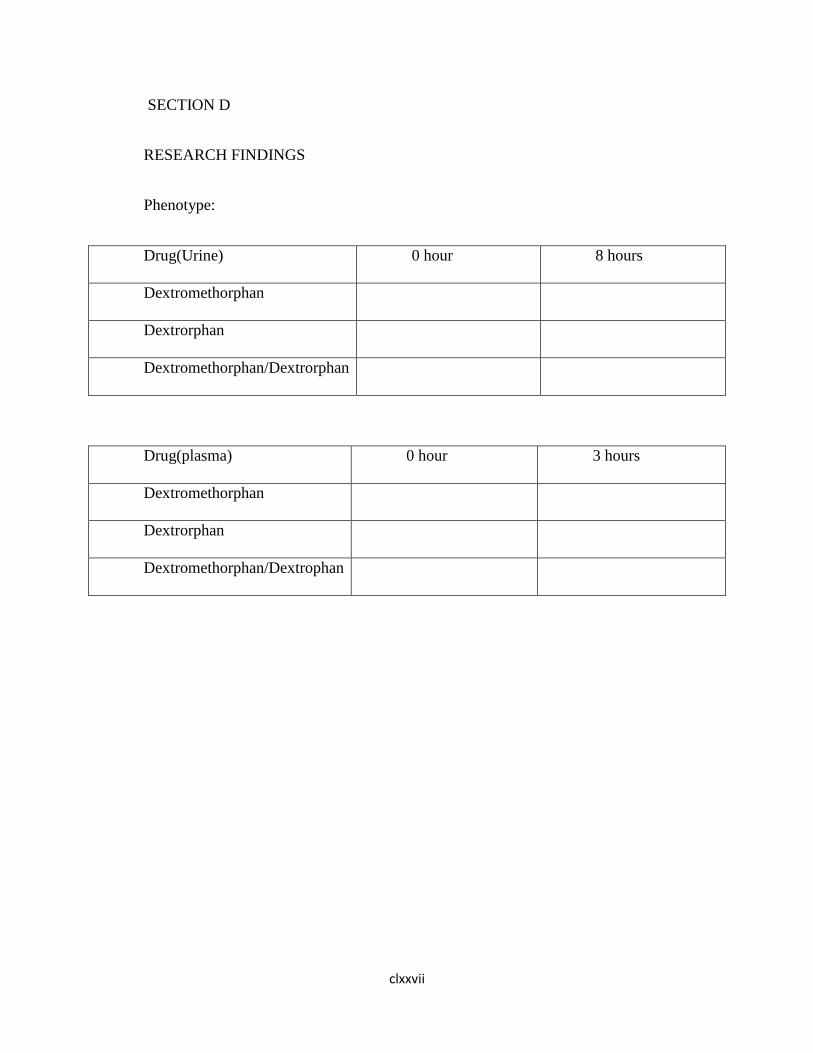
clxxvii
SECTION D
RESEARCH FINDINGS
Phenotype:
Drug(Urine) 0 hour 8 hours
Dextromethorphan
Dextrorphan
Dextromethorphan/Dextrorphan
Drug(plasma) 0 hour 3 hours
Dextromethorphan
Dextrorphan
Dextromethorphan/Dextrophan