Evaluation of Chlorine Dioxide (ClO2) Generation System...
36
Desalination Technologies Research Institute Saline Water Conversion Corporation Desalination Technologies Research Institute Saline Water Conversion Corporation Kingdom of Saudi Arabia Evaluation of Chlorine Dioxide (ClO 2 ) Generation System for Disinfection in RO Product Water at SWCC Jubail Plant
Transcript of Evaluation of Chlorine Dioxide (ClO2) Generation System...

Desalination Technologies Research InstituteSaline Water Conversion Corporation
Desalination Technologies Research Institute
Saline Water Conversion CorporationKingdom of Saudi Arabia
Evaluation of Chlorine Dioxide (ClO2) Generation System for Disinfection in RO Product Water
at SWCC Jubail Plant
Desalination Technologies Research InstituteSaline Water Conversion Corporation
Investigators
Principal Investigator: Dr. Ali Al-Hamzah Co-Investigators: Dr. Mohammed Mahmoodur Rahman
Mr. Prasanna KurupMr. Anwar Barnawi
Al-Jubail RO PlantsMr. Bader GhannamMr. Ibrahim Musharraf
Sendab CompanyEng. Fouad Al NajjarEng. Ahmed ObeidallahMr. Willie DevezaMr. Thomas Livesey (Scotmas-UK)
2

Desalination Technologies Research InstituteSaline Water Conversion Corporation 3
CONTENTS
Background1
Experimental3
Results and Discussion4
Conclusions5
2 Objectives

Desalination Technologies Research InstituteSaline Water Conversion Corporation
BACKGROUND
Recent studies have shown the formation of bromatein desalination-derived drinking water, especiallywhen the desalinated water is treated with sodiumhypochlorite solution produced by electrolyzingseawater.
Environmental Health Criteria 216, WHO (2000), Disinfectants and Disinfection By- products, ISBN 9241572167, 30-31. http://www.who.int/ipcs/publications/ehc/ ehc_216/en/
4
Desalination Technologies Research InstituteSaline Water Conversion Corporation 5
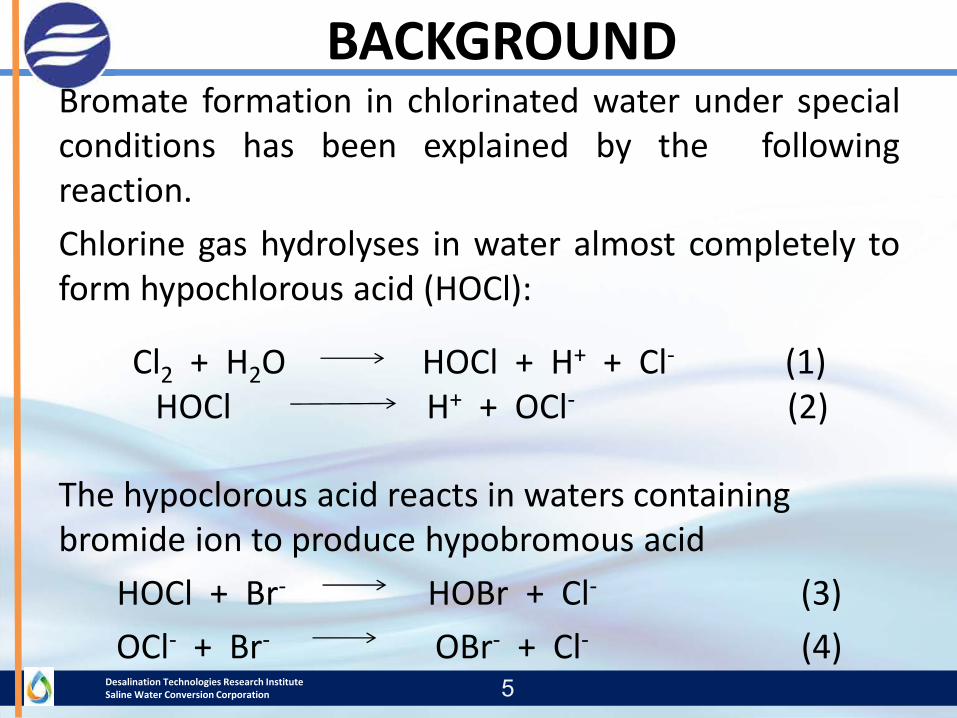
Bromate formation in chlorinated water under specialconditions has been explained by the followingreaction.Chlorine gas hydrolyses in water almost completely toform hypochlorous acid (HOCl):
Cl2 + H2O HOCl + H+ + Cl- (1)HOCl H+ + OCl- (2)
The hypoclorous acid reacts in waters containing bromide ion to produce hypobromous acid
HOCl + Br- HOBr + Cl- (3)OCl- + Br- OBr- + Cl- (4)
BACKGROUND
Desalination Technologies Research InstituteSaline Water Conversion Corporation 6
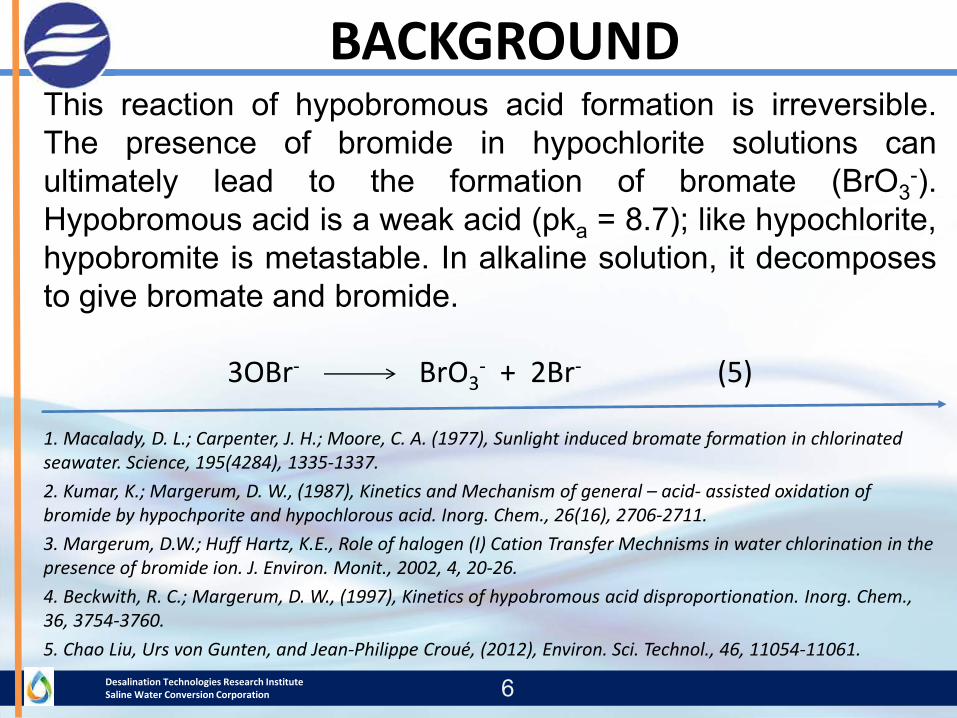
This reaction of hypobromous acid formation is irreversible.The presence of bromide in hypochlorite solutions canultimately lead to the formation of bromate (BrO3
-).Hypobromous acid is a weak acid (pka = 8.7); like hypochlorite,hypobromite is metastable. In alkaline solution, it decomposesto give bromate and bromide.
3OBr- BrO3- + 2Br- (5)
1. Macalady, D. L.; Carpenter, J. H.; Moore, C. A. (1977), Sunlight induced bromate formation in chlorinated seawater. Science, 195(4284), 1335-1337.2. Kumar, K.; Margerum, D. W., (1987), Kinetics and Mechanism of general – acid- assisted oxidation of bromide by hypochporite and hypochlorous acid. Inorg. Chem., 26(16), 2706-2711.3. Margerum, D.W.; Huff Hartz, K.E., Role of halogen (I) Cation Transfer Mechnisms in water chlorination in the presence of bromide ion. J. Environ. Monit., 2002, 4, 20-26.4. Beckwith, R. C.; Margerum, D. W., (1997), Kinetics of hypobromous acid disproportionation. Inorg. Chem., 36, 3754-3760.5. Chao Liu, Urs von Gunten, and Jean-Philippe Croué, (2012), Environ. Sci. Technol., 46, 11054-11061.
BACKGROUND

Desalination Technologies Research InstituteSaline Water Conversion Corporation
BACKGROUND
In view of the above observations of enhancedbromate formation in water distribution systemscontaining bromide disinfected by chlorinationunder alkaline conditions, there appeared a needto choose an alternative to chlorine in curtailingthe bromate formation.
7
Desalination Technologies Research InstituteSaline Water Conversion Corporation
If any disinfectant is to replace free chlorine asthe most commonly used disinfectant, severalcriteria must be met, as follows:1. It must be easily generated and be in wide use2. It must be a good biocide.3. It must provide an easily measured residual.4. It must not produce or reduce undesirable
byproducts than does free chlorine, and5. It must be cost effective.
8
BACKGROUND

Desalination Technologies Research InstituteSaline Water Conversion Corporation
Chlorine dioxideBased on a review of the literature chlorine dioxide was found to be the best alternative for the following:1. It does not react with bromide to form hypobromites which could contribute
to the formation of organo bromine compounds and bromate.2. It is not a chlorinating agent and does not form halogenated organic
compounds (i.e., THMs).3. It is efficient over a wide pH range (5.0 to 9.5).4. Very active against bacteria, viruses, algae, fungi and microorganisms.5. Environmentally friendly.
Eva Agus, Nikolay V., David L. Sedlak, (2009), Disinfection byproducts and their potentialimpacts on the quality of water produced by desalination systems: A Literature Review,Desalination 237, p. 214-237.
Chao Liu, Urs von Gunten, and Jean-Philippe Croué, (2012), Environ. Sci. Technol., 46,11054-11061.
9
BACKGROUND
Desalination Technologies Research InstituteSaline Water Conversion Corporation
Chlorine dioxide exists almost entirely asmonomeric free radicals. Concentratedchlorine dioxide vapour is potentiallyexplosive, and attempts to compress and storethis gas, either alone or in combination withother gases, have been commerciallyunsuccessful. Because of this, chlorinedioxide, like ozone, must be manufactured atthe point of use.
10
BACKGROUND

Desalination Technologies Research InstituteSaline Water Conversion Corporation 11

Desalination Technologies Research InstituteSaline Water Conversion Corporation
OBJECTIVES
12
To evaluate the performance of ClO2 generatingsystem (Scotmas-UK represented by SENDAB, KSA) inRO product water of SWCC plant.
To Study the purity and efficiency of ClO2 productand the percentage yield.
Optimization of the required Chlorine Dioxide dosageto disinfect the RO product water.
To study the DBPs formation with the use of ClO2generating system..
Desalination Technologies Research InstituteSaline Water Conversion Corporation13
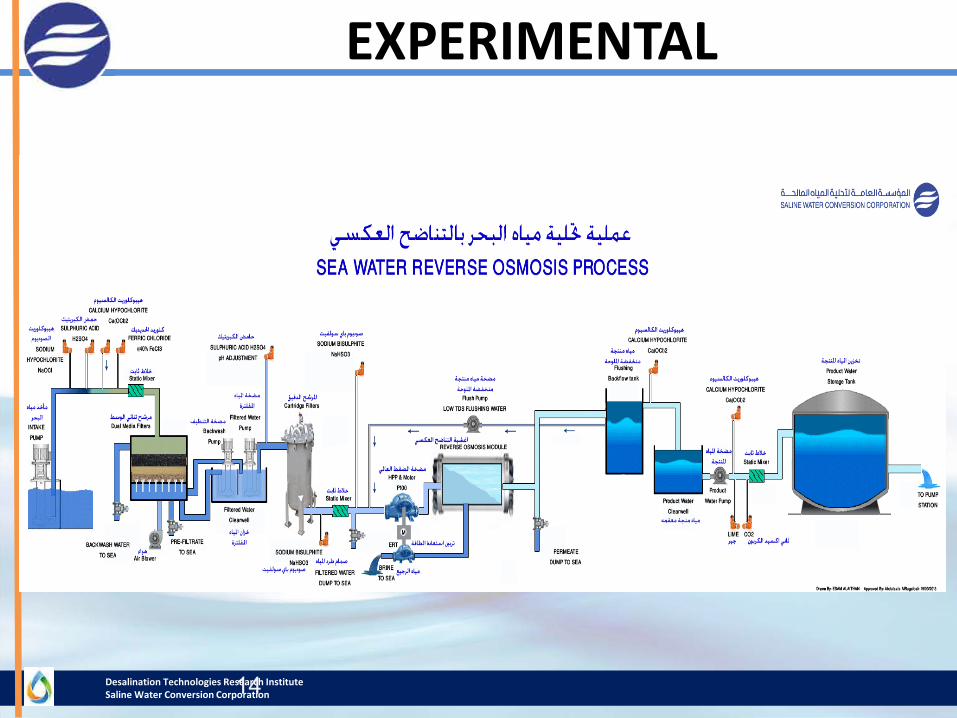
EXPERIMENTALPretreatment of RO plant
The existing pretreatment comprised rapid mix/coagulation usingferric chloride (40%), flocculation, sedimentation and dual granularmedia (sand and anthracite) filtration.
Coagulant was dosed at 2.0 to 3.5 ppm (mg/L) and pH was adjustedto 6.8 by adding sulphuric acid (98%).
Chlorine was dosed from the electro chlorinators of intake and theresidual chlorine was kept in the range of 0.3 – 1.5 ppm. However, tocompensate for deficiencies & shutdowns at intake chlorination,separate chlorination lines from calcium hypochlorite dosing systemof RO plant have been provided. These dosing lines are located inthe dosing pit upstream of dual media filters
Desalination Technologies Research InstituteSaline Water Conversion Corporation14
EXPERIMENTAL
Desalination Technologies Research InstituteSaline Water Conversion Corporation
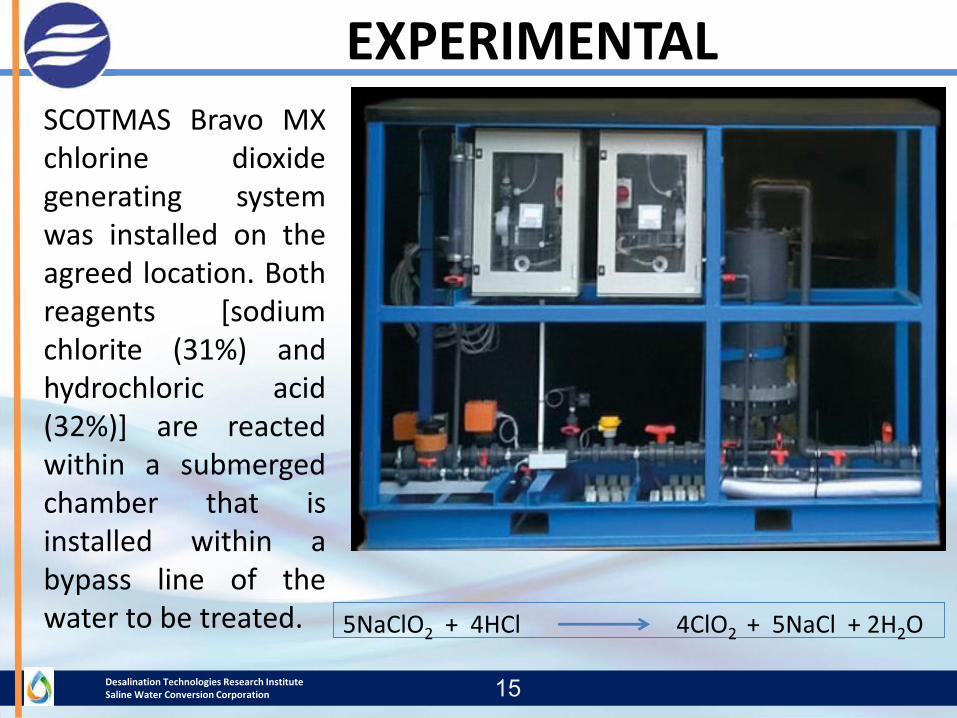
EXPERIMENTALSCOTMAS Bravo MXchlorine dioxidegenerating systemwas installed on theagreed location. Bothreagents [sodiumchlorite (31%) andhydrochloric acid(32%)] are reactedwithin a submergedchamber that isinstalled within abypass line of thewater to be treated.
15
5NaClO2 + 4HCl 4ClO2 + 5NaCl + 2H2O

Desalination Technologies Research InstituteSaline Water Conversion Corporation 16
EXPERIMENTAL
Dosing of ClO2 with the flow of water was controlled byonline analyzer and directly recorded on the screen by theoperator. The sensors used are ion-specific amperometric2-electrode systems, protected by a membrane, foraccurate measurement of both chlorine dioxide andchlorite, and minimum detection limit is 0.05ppm.
Desalination Technologies Research InstituteSaline Water Conversion Corporation
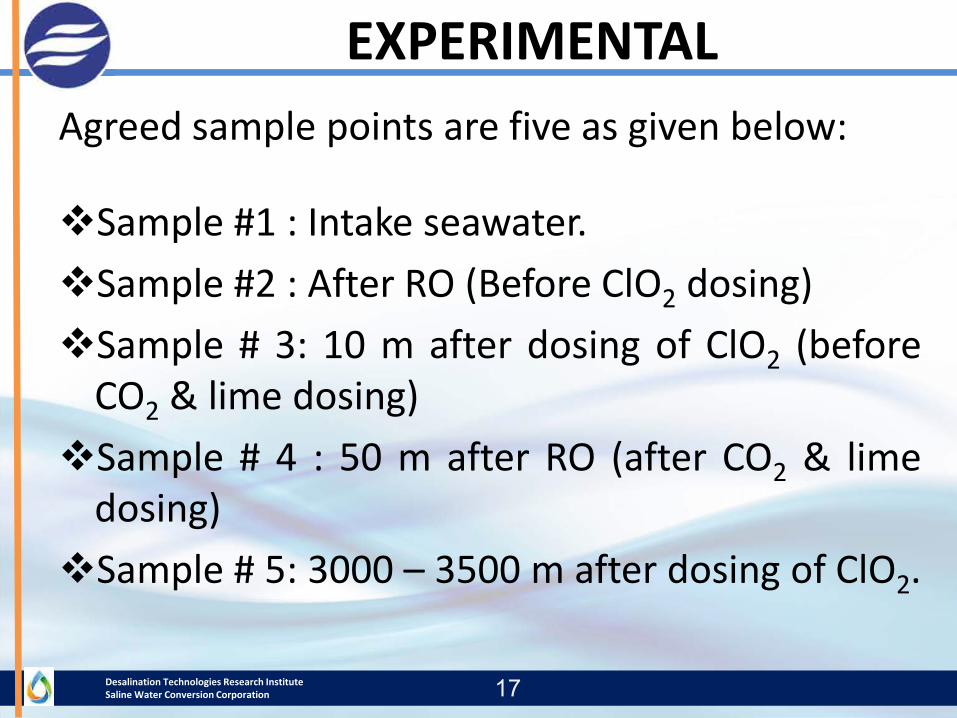
Agreed sample points are five as given below:
Sample #1 : Intake seawater.Sample #2 : After RO (Before ClO2 dosing)Sample # 3: 10 m after dosing of ClO2 (before
CO2 & lime dosing)Sample # 4 : 50 m after RO (after CO2 & lime
dosing)Sample # 5: 3000 – 3500 m after dosing of ClO2.
17
EXPERIMENTAL
Desalination Technologies Research InstituteSaline Water Conversion Corporation 18
EXPERIMENTAL
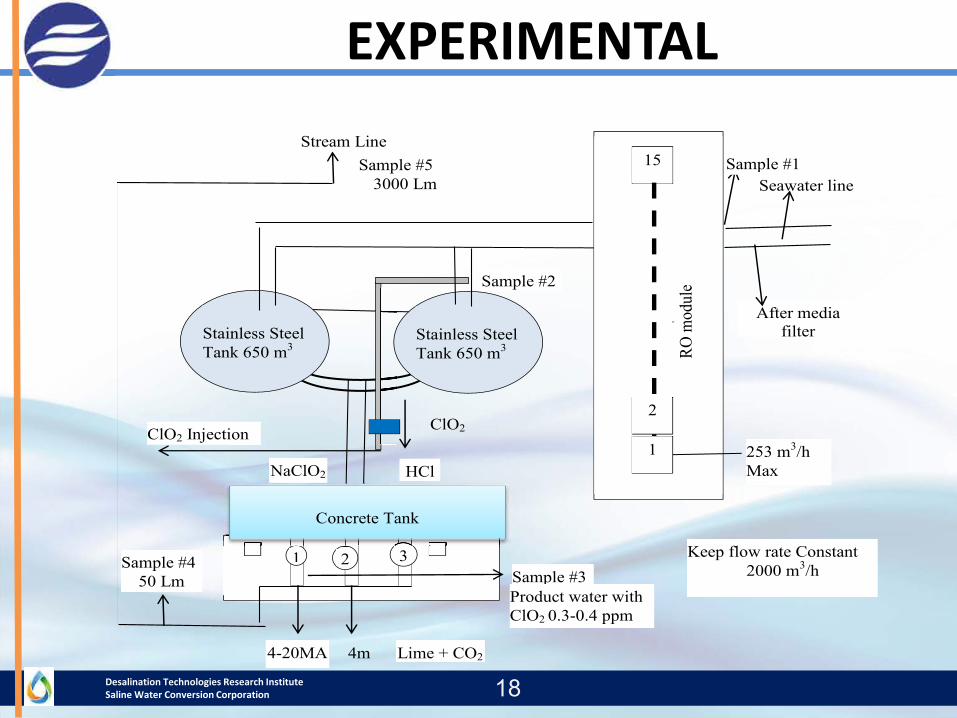
NaClO2-
HCl
ClO2 System
ClO2 Injection point
1 2 3
Concrete Tank
Sample #4 50 Lm
Lime + CO2
4m
4-20MA
Sample #1
Sample #2
Sample #3
Product water with ClO2 0.3-0.4 ppm
Sample #5 3000 Lm
Stainless Steel Tank 650 m3
Stainless Steel Tank 650 m3
Stream Line
15
Seawater line
After media filter
253 m3/h Max
Keep flow rate Constant 2000 m3/h
2
1
R
RO m
odul
e

Desalination Technologies Research InstituteSaline Water Conversion Corporation
Samples were collected for analysis to check theagreed parameters as follows:
Residual ClO2, chlorate, chlorite, residualchlorine, bromate, organics, THMs, andbiological analysis.
Additional parameters; residual sodium bisulfite(SBS), residual free chlorine and pH at agreedlocations.
19
EXPERIMENTAL
Desalination Technologies Research InstituteSaline Water Conversion Corporation
ANALYTICAL TECHNIQUES
20
Trihalomethanes (THMs) Analysis by GC/MSAll samples were analyzed According to the StandardMethods based on the described procedures in APHAStandard Methods (APHA, 2003).
Bromate and Chlorate Analysis by Ion ChromatographyBromate and chlorate in water was measured by ionchromatography using suppress conductivity detectionaccording to U.S. EPA Method 300.1 B.
Chlorine dioxide and Chlorite AnalysisResidual Chlorine dioxide and Chlorite levels were measuredby means of an online amperometric probe.
Desalination Technologies Research InstituteSaline Water Conversion Corporation 21
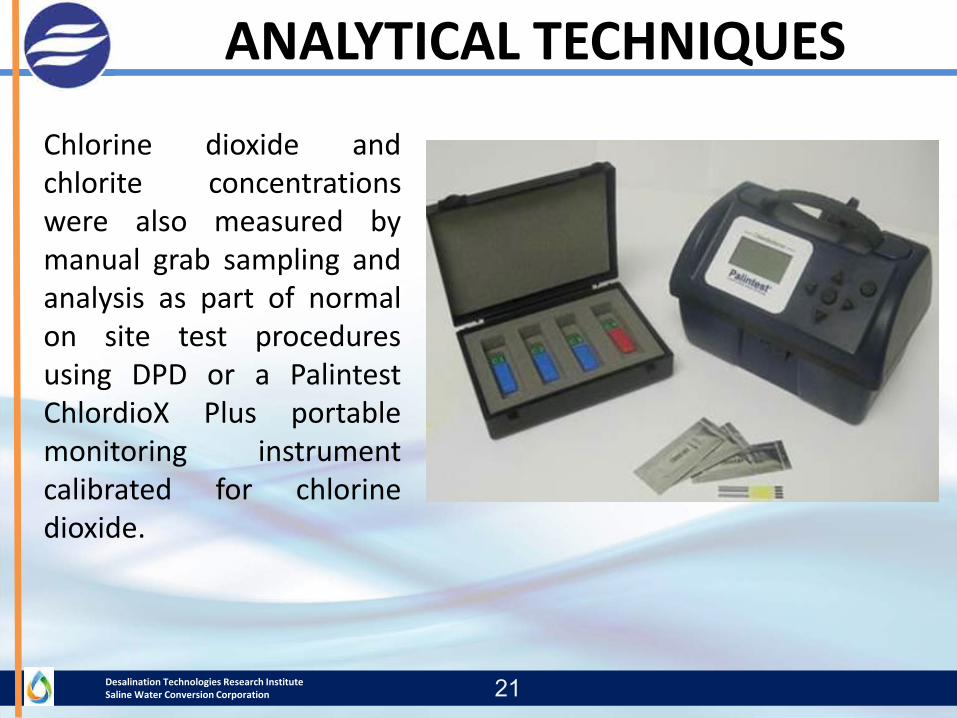
Chlorine dioxide andchlorite concentrationswere also measured bymanual grab sampling andanalysis as part of normalon site test proceduresusing DPD or a PalintestChlordioX Plus portablemonitoring instrumentcalibrated for chlorinedioxide.
ANALYTICAL TECHNIQUES

Desalination Technologies Research InstituteSaline Water Conversion Corporation
Biological AnalysisWater samples were withdrawn from thesampling points employing aseptic techniquesand analyzed using “APHA Method 9215:Standard Methods for the Examination of WaterWastewater”
22
ANALYTICAL TECHNIQUES

Desalination Technologies Research InstituteSaline Water Conversion Corporation
RESULTS AND DISCUSSIONS
23
Table shows Results fromsampling point # 2representative ofpermeate. Bromate,chlorite and chloratewere found to benegligible or nil for thewhole evaluation period.Though some amount ofTHMs, predominantlybromoform (~40 ppb)was detected, the totalTHMs values (<1) werewell below the regulatedvalues (WHO=1).
Desalination Technologies Research InstituteSaline Water Conversion Corporation
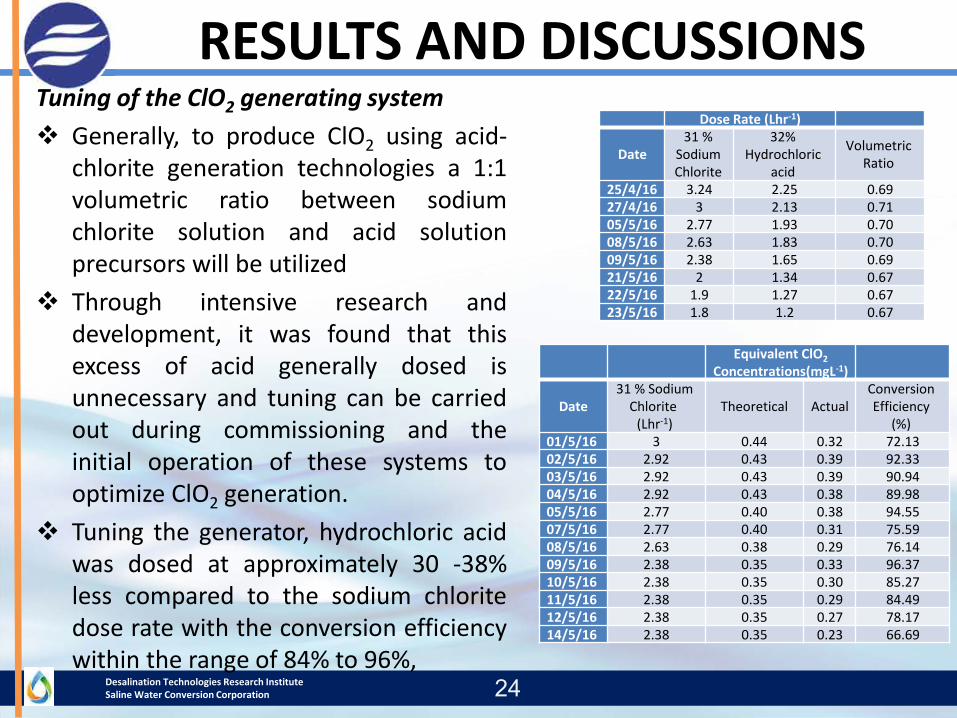
RESULTS AND DISCUSSIONSTuning of the ClO2 generating system Generally, to produce ClO2 using acid-
chlorite generation technologies a 1:1volumetric ratio between sodiumchlorite solution and acid solutionprecursors will be utilized
Through intensive research anddevelopment, it was found that thisexcess of acid generally dosed isunnecessary and tuning can be carriedout during commissioning and theinitial operation of these systems tooptimize ClO2 generation.
Tuning the generator, hydrochloric acidwas dosed at approximately 30 -38%less compared to the sodium chloritedose rate with the conversion efficiencywithin the range of 84% to 96%,
24
Dose Rate (Lhr-1)
Date31 %
Sodium Chlorite
32% Hydrochloric
acid
Volumetric Ratio
25/4/16 3.24 2.25 0.6927/4/16 3 2.13 0.7105/5/16 2.77 1.93 0.7008/5/16 2.63 1.83 0.7009/5/16 2.38 1.65 0.6921/5/16 2 1.34 0.6722/5/16 1.9 1.27 0.6723/5/16 1.8 1.2 0.67
Equivalent ClO2Concentrations(mgL-1)
Date31 % Sodium
Chlorite (Lhr-1)
Theoretical ActualConversion Efficiency
(%)01/5/16 3 0.44 0.32 72.1302/5/16 2.92 0.43 0.39 92.3303/5/16 2.92 0.43 0.39 90.9404/5/16 2.92 0.43 0.38 89.9805/5/16 2.77 0.40 0.38 94.5507/5/16 2.77 0.40 0.31 75.5908/5/16 2.63 0.38 0.29 76.1409/5/16 2.38 0.35 0.33 96.3710/5/16 2.38 0.35 0.30 85.2711/5/16 2.38 0.35 0.29 84.4912/5/16 2.38 0.35 0.27 78.1714/5/16 2.38 0.35 0.23 66.69

Desalination Technologies Research InstituteSaline Water Conversion Corporation
RESULTS AND DISCUSSIONS
25
Optimization of ClO2 DoseRateThe dosing control for chlorinedioxide was monitored at samplepoint # 3. A dosage of ClO2 witha residual in the range of 0.3 to0.4ppm was controlled as perthe requirement for initialdisinfection.
A dose rate in the range of 0.18 –0.20 ppm of residual ClO2 wasfound to be optimum dose rateand the test was continued withthis rate and monitoring themicrobiological analysis theperformance was evaluated.
Sample Date
Sample Point
Chlorine Dioxide Residual Palintest
Chlorine Dioxide Residual Online
Chlorite (ClO2
-) Palintest
Chlorite (ClO2
-) Online
Chlorate (ClO3
-)Bromate (BrO3
-) Organics Bromoform
THMs (total)
Biological Analysis pH
1 2 3 4 5 6 7 8 9 10 11UoM mg/l mg/l mg/l mg/l mg/l µg/l µg/l µg/l
21/4/16 3 0.36 NA 0.03 0.03 NA <2 ND NA NA Negative NA23/4/16 3 0.32 0.34 0.03 0.03 NA <2 ND NA NA Negative NA24/4/16 3 0.38 0.33 0.04 0.03 NA <2 ND NA NA Negative NA25/4/16 3 0.41 0.34 0.02 0.02 NA <2 ND 38 0.38 Negative NA26/4/16 3 0.45 0.33 0.04 0.03 NA <2 ND 35 0.35 Negative NA27/4/16 3 0.44 0.39 0.03 0.03 NA <2 ND 37 0.37 Negative NA28/4/16 3 0.31 0.29 0.03 0.03 NA <2 ND 35 0.35 Negative 8.5530/4/16 3 0.31 0.32 0.03 0.03 NA <2 ND NA NA Negative NA
1/5/16 3 0.31 0.3 0.04 0.03 NA <2 ND 40 0.4 Negative 7.482/5/16 3 0.34 0.32 0.01 0.03 NA <2 ND 38 0.38 Negative 83/5/16 3 0.33 0.31 0.03 0.03 0.07 <2 ND 38 0.38 Negative 84/5/16 3 0.34 0.33 0.03 0.03 0.05 <2 ND 35 0.35 Negative 7.95/5/16 3 0.25 0.3 0.03 0.04 0.07 <2 ND 33 0.33 Negative NA7/5/16 3 0.31 0.32 0.05 0.04 NA <2 ND NA NA Negative NA8/5/16 3 0.27 0.31 0.03 0.07 0.05 <2 ND 39 0.39 Negative 7.89/5/16 3 0.25 0.3 0.01 0.07 0.08 <2 ND 40 0.4 Negative NA10/5/16 3 0.28 0.29 0.02 0.04 0.05 <2 ND 32 0.32 Negative 8.511/5/16 3 0.25 0.26 0.03 0.05 0.06 <2 ND 27 0.27 Negative 7.5512/5/16 3 0.2 0.23 0.01 0.05 0.03 <2 ND 32 0.32 Negative 7.2214/5/16 3 0.21 0.22 0.03 0.04 0.02 <2 ND NA NA Negative NA15/5/16 3 0.24 0.22 0.03 0.04 NA <2 ND 32 0.32 Negative 7.216/5/16 3 NA NA NA NA NA NA ND NA NA Negative NA17/5/16 3 0.24 0.22 0.03 0.04 0.01 <2 ND 33 0.33 Negative NA19/5/16 3 0.24 0.2 0.02 0.05 NA <2 ND NA NA Negative NA21/5/16 3 0.24 0.2 0.03 0.05 NA <2 ND NA NA Negative NA22/5/16 3 0.21 0.18 0.02 0.05 0.01 <2 ND 35 0.35 Negative 7.8225/5/16 3 0.21 0.21 0.03 0.05 0.01 <2 ND 34 0.34 Negative NA
1/6/16 3 0.19 0.2 0.04 0.05 0.01 <2 ND 34 0.34 Negative NA7/6/16 3 0.18 0.16 0.03 0.07 0.01 <2 ND 33 0.33 Negative 7.58/6/16 3 0.17 0.17 0.02 0.07 0.05 <2 ND 27 0.27 Negative NA16/6/16 3 0.2 0.21 0.02 0.06 0.02 <2 ND 30 0.30 Negative 8.5320/6/16 3 0.18 0.19 NA 0.07 0.01 <2 ND 34 0.34 Negative 5.5322/6/16 3 0.2 0.19 NA 0.07 0.01 <2 ND 33 0.33 Negative 5.3627/6/16 3 0.19 0.2 NA 0.08 0.01 <2 ND 31 0.31 Negative 5.2529/6/16 3 0.19 0.21 NA 0.08 0.01 <2 ND 27 0.27 Negative 5.27
4/7/16 3 0.2 0.15 NA 0.08 0.01 <2 ND 25 0.25 Negative 5.3111/7/16 3 0.19 0.2 NA 0.08 0.01 <2 ND 28 0.28 Negative 5.313/7/16 3 0.2 0.15 NA 0.08 NA <2 ND NA NA Negative 5.3418/7/16 3 0.17 0.19 NA 0.07 NA <2 ND NA NA Negative 5.3120/7/16 3 0.19 0.2 NA 0.09 NA <2 ND NA NA Negative 5.20
Desalination Technologies Research InstituteSaline Water Conversion Corporation
RESULTS AND DISCUSSIONS
26
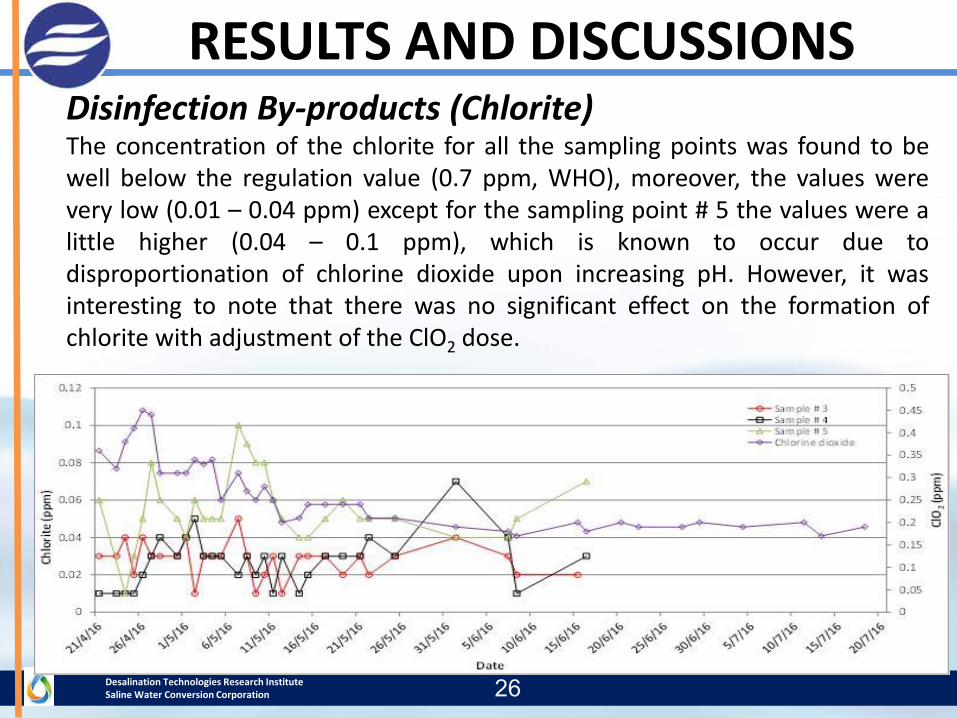
Disinfection By-products (Chlorite)The concentration of the chlorite for all the sampling points was found to bewell below the regulation value (0.7 ppm, WHO), moreover, the values werevery low (0.01 – 0.04 ppm) except for the sampling point # 5 the values were alittle higher (0.04 – 0.1 ppm), which is known to occur due todisproportionation of chlorine dioxide upon increasing pH. However, it wasinteresting to note that there was no significant effect on the formation ofchlorite with adjustment of the ClO2 dose.

Desalination Technologies Research InstituteSaline Water Conversion Corporation
RESULTS AND DISCUSSIONS
27
ChlorateThe concentration of the chlorate for all the sampling points # 3, 4 and 5 duringthe optimization and for the duration of test with the optimized dose rate wasfound to be well below the regulation value (0.7 ppm, WHO). Initially at a higherdose rate of ClO2, Chlorate concentrations were found to be a little higher (0.05 –0.14 ppm). But as the dose rate of ClO2 were reduced and at the optimum doserate of 0.19 ppm ClO2, the chlorate values for sampling point # 4 and # 5 werereduced and found to be in the range of 0.02 – 0.06 ppm whereas for samplingpoint # 3 the values were almost consistent at 0.01ppm.
0
0.05
0.1
0.15
0.2
0.25
0.3
0.35
0.4
0.45
0.5
0
0.02
0.04
0.06
0.08
0.1
0.12
0.14
0.16
ClO2 (p
pm)
Chlor
ate (p
pm)
Date
Sample # 3Sample # 4Sample # 5Chlorine dioxide

Desalination Technologies Research InstituteSaline Water Conversion Corporation
RESULTS AND DISCUSSIONS
28
BromateBromate concentrationsdetermined were foundto be <2 ppb for all thesampling pointsindicating negligible orno bromate formationwith ClO2 treatmentduring the whole trialperiod. Bromateconcentrations for eachsample pointthroughout the trial
Sample Date
Sample Point
Chlorine Dioxide Residual Palintest
Chlorine Dioxide Residual Online
Chlorite (ClO2
-) Palintest
Chlorite (ClO2
-) Online
Chlorate (ClO3
-)Bromate (BrO3
-) Organics Bromoform
THMs (total)
Biological Analysis pH
1 2 3 4 5 6 7 8 9 10 11UoM mg/l mg/l mg/l mg/l mg/l µg/l µg/l µg/l
21/4/16 3 0.36 NA 0.03 0.03 NA <2 ND NA NA Negative NA23/4/16 3 0.32 0.34 0.03 0.03 NA <2 ND NA NA Negative NA24/4/16 3 0.38 0.33 0.04 0.03 NA <2 ND NA NA Negative NA25/4/16 3 0.41 0.34 0.02 0.02 NA <2 ND 38 0.38 Negative NA26/4/16 3 0.45 0.33 0.04 0.03 NA <2 ND 35 0.35 Negative NA27/4/16 3 0.44 0.39 0.03 0.03 NA <2 ND 37 0.37 Negative NA28/4/16 3 0.31 0.29 0.03 0.03 NA <2 ND 35 0.35 Negative 8.5530/4/16 3 0.31 0.32 0.03 0.03 NA <2 ND NA NA Negative NA
1/5/16 3 0.31 0.3 0.04 0.03 NA <2 ND 40 0.4 Negative 7.482/5/16 3 0.34 0.32 0.01 0.03 NA <2 ND 38 0.38 Negative 83/5/16 3 0.33 0.31 0.03 0.03 0.07 <2 ND 38 0.38 Negative 84/5/16 3 0.34 0.33 0.03 0.03 0.05 <2 ND 35 0.35 Negative 7.95/5/16 3 0.25 0.3 0.03 0.04 0.07 <2 ND 33 0.33 Negative NA7/5/16 3 0.31 0.32 0.05 0.04 NA <2 ND NA NA Negative NA8/5/16 3 0.27 0.31 0.03 0.07 0.05 <2 ND 39 0.39 Negative 7.89/5/16 3 0.25 0.3 0.01 0.07 0.08 <2 ND 40 0.4 Negative NA10/5/16 3 0.28 0.29 0.02 0.04 0.05 <2 ND 32 0.32 Negative 8.511/5/16 3 0.25 0.26 0.03 0.05 0.06 <2 ND 27 0.27 Negative 7.5512/5/16 3 0.2 0.23 0.01 0.05 0.03 <2 ND 32 0.32 Negative 7.2214/5/16 3 0.21 0.22 0.03 0.04 0.02 <2 ND NA NA Negative NA15/5/16 3 0.24 0.22 0.03 0.04 NA <2 ND 32 0.32 Negative 7.216/5/16 3 NA NA NA NA NA NA ND NA NA Negative NA17/5/16 3 0.24 0.22 0.03 0.04 0.01 <2 ND 33 0.33 Negative NA19/5/16 3 0.24 0.2 0.02 0.05 NA <2 ND NA NA Negative NA21/5/16 3 0.24 0.2 0.03 0.05 NA <2 ND NA NA Negative NA22/5/16 3 0.21 0.18 0.02 0.05 0.01 <2 ND 35 0.35 Negative 7.8225/5/16 3 0.21 0.21 0.03 0.05 0.01 <2 ND 34 0.34 Negative NA
1/6/16 3 0.19 0.2 0.04 0.05 0.01 <2 ND 34 0.34 Negative NA7/6/16 3 0.18 0.16 0.03 0.07 0.01 <2 ND 33 0.33 Negative 7.58/6/16 3 0.17 0.17 0.02 0.07 0.05 <2 ND 27 0.27 Negative NA16/6/16 3 0.2 0.21 0.02 0.06 0.02 <2 ND 30 0.30 Negative 8.5320/6/16 3 0.18 0.19 NA 0.07 0.01 <2 ND 34 0.34 Negative 5.5322/6/16 3 0.2 0.19 NA 0.07 0.01 <2 ND 33 0.33 Negative 5.3627/6/16 3 0.19 0.2 NA 0.08 0.01 <2 ND 31 0.31 Negative 5.2529/6/16 3 0.19 0.21 NA 0.08 0.01 <2 ND 27 0.27 Negative 5.27
4/7/16 3 0.2 0.15 NA 0.08 0.01 <2 ND 25 0.25 Negative 5.3111/7/16 3 0.19 0.2 NA 0.08 0.01 <2 ND 28 0.28 Negative 5.313/7/16 3 0.2 0.15 NA 0.08 NA <2 ND NA NA Negative 5.3418/7/16 3 0.17 0.19 NA 0.07 NA <2 ND NA NA Negative 5.3120/7/16 3 0.19 0.2 NA 0.09 NA <2 ND NA NA Negative 5.20
Desalination Technologies Research InstituteSaline Water Conversion Corporation
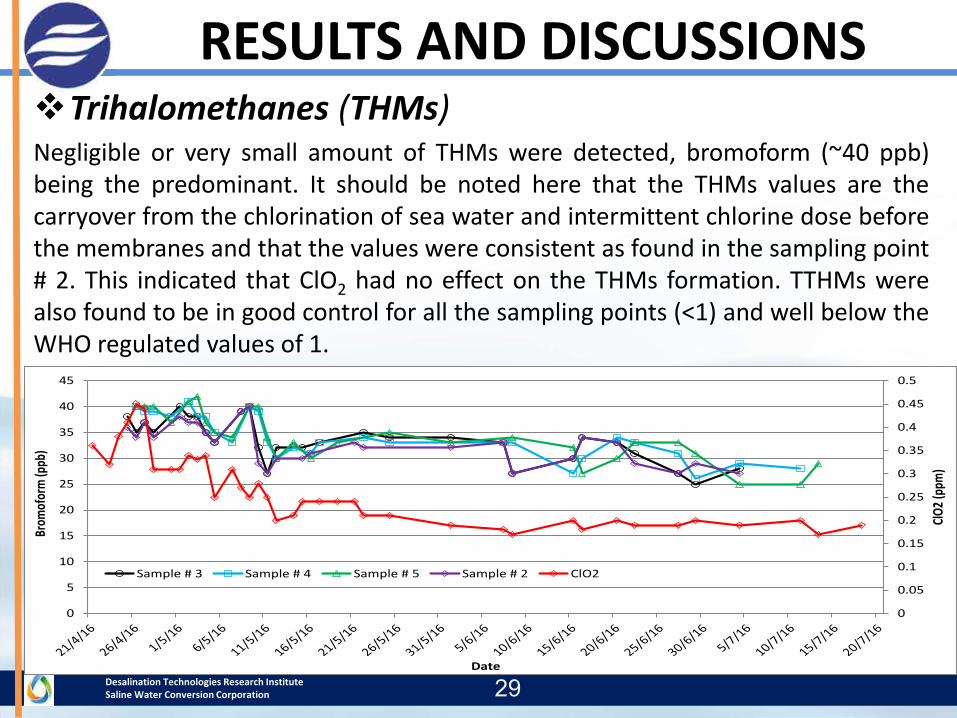
Trihalomethanes (THMs)Negligible or very small amount of THMs were detected, bromoform (~40 ppb)being the predominant. It should be noted here that the THMs values are thecarryover from the chlorination of sea water and intermittent chlorine dose beforethe membranes and that the values were consistent as found in the sampling point# 2. This indicated that ClO2 had no effect on the THMs formation. TTHMs werealso found to be in good control for all the sampling points (<1) and well below theWHO regulated values of 1.
29
RESULTS AND DISCUSSIONS
0
0.05
0.1
0.15
0.2
0.25
0.3
0.35
0.4
0.45
0.5
0
5
10
15
20
25
30
35
40
45
ClO2 (
ppm
)
Brom
ofor
m (p
pb)
Date
Sample # 3 Sample # 4 Sample # 5 Sample # 2 ClO2

Desalination Technologies Research InstituteSaline Water Conversion Corporation
CONCLUSIONSA dose rate in the range of 0.18 – 0.20 ppm as residual
ClO2 was found to be optimum dose rate on theperformance of disinfection observed from themicrobiological analysis.
Biological analyses showed total Coliforms & E.Coli in allthe sampling points was negative indicating ClO2 to bevery efficient in killing the bacteria and therefore asuitable alternative to chlorination.
Residual ClO2 at the sampling point # 4 and # 5 werefound to be in the range of 0.1– 0.16 ppm.
30

Desalination Technologies Research InstituteSaline Water Conversion Corporation
Disinfection byproducts chlorite and chlorate formedat the ClO2 control point (sampling point # 3) werefound to be in the range of 0.01 – 0.04 ppm whichare well below the WHO regulation values of 0.7ppm.
The combined ClO2, chlorite and chlorateconcentrations did not exceed the maximum limit of1mgL-1 currently recommended by USEPA.
31
CONCLUSIONS

Desalination Technologies Research InstituteSaline Water Conversion Corporation
Bromate concentrations determined were found to be<2 ppb for all the sampling points indicating negligibleor no bromate formation with ClO2 treatment.
Negligible or very small amounts of THMs weredetected throughout the trial even through adjustingClO2 dose. Bromoform (~40 ppb) being the predominantTHM detected, was found to be carryover from thechlorination of sea-water and intermittent chlorinedose due to its presence before the RO membraneswith no significant change after ClO2 injection. TTHMswere found to be well below the WHO regulated valuesof ≤1 throughout the whole of the trial.
32
CONCLUSIONS

Desalination Technologies Research InstituteSaline Water Conversion Corporation
The consistent values of disinfection by-products(TTHMS) recorded, resulting from thechlorination of sea-water before and aftertreatment with ClO2 has proven that theseresults could be avoided by use of the SENDAB(SCOTMAS-UK) ClO2 generating system.
33
CONCLUSIONS

Desalination Technologies Research InstituteSaline Water Conversion Corporation
ACKNOWLEDGEMENTS
The authors would like to thank Mr. Ghazzay AuwayidhAlhajji Almutairi, Lab. Supdt., Hosam MustafaAbdulmuhsin Alsanea, RO Operation Division Chief andMr. Abdulaziz R A AlRugaibah, Technical SupportDepartment Manager, Jubail plant, for their cooperationand support.
34

Desalination Technologies Research InstituteSaline Water Conversion Corporation
Thank you
35

Desalination Technologies Research InstituteSaline Water Conversion Corporation36
ClO2 Generator Standards
EN 12671:2009