Evaluation of Biotechnologies for Flexible Pavement ...
133
CAIT-UTC-032 Evaluation of Biotechnologies for Flexible Pavement Applications Final Report December 2016 Christopher Ericson Senior Laboratory Engineer Thomas Bennert, Ph.D* Research Professor Vivek Tandon Associate Professor Nii Attoh-Okine Professor *Rutgers University 100 Brett Road Piscataway, NJ 08854 External Project Manager Eileen Sheehy In cooperation with Rutgers, The State University of New Jersey And State of New Jersey Department of Transportation And U.S. Department of Transportation Federal Highway Administration
Transcript of Evaluation of Biotechnologies for Flexible Pavement ...

CAIT-UTC-032
Evaluation of Biotechnologies for Flexible PavementApplications
Final ReportDecember 2016
Christopher EricsonSenior Laboratory Engineer
Thomas Bennert, Ph.D*Research Professor
Vivek TandonAssociate Professor
Nii Attoh-OkineProfessor
*Rutgers University100 Brett Road
Piscataway, NJ 08854
External Project ManagerEileen Sheehy
In cooperation withRutgers, The State University of New Jersey
AndState of New Jersey
Department of TransportationAnd
U.S. Department of TransportationFederal Highway Administration

Disclaimer StatementThe contents of this report relfect the views of the authors, who are responsible for the facts and the
accuracy of the information presented herein. This document is disseminated under the sponsorship of theDepartment of Transportation, University Transportation Centers Program, in the interest of information
exchange. The U.S. Government assumes no liability for the contents or use thereof.

TECHNICAL REPORT STANDARD TITLE PAGE
1. Report No. 2. Government Accession No. 3. Recipient’s Catalog No.
CAIT-UTC-0324. Title and Subtitle 5. Report Date
December 2016Evaluation of Biotechnologies for Flexible PavementApplications
6. Performing Organization Code
CAIT/Rutgers
7. Author(s) 8. Performing Organization Report No.
Christopher Ericson, Thomas Bennert, Ph.D., VivekTandon, Nii Attoh-Okine, Eileen Sheehy
CAIT-UTC-032
9. Performing Organization, Name and Address 10. Work Unit No.
University of Delaware, Newark, DE 19716Center for Transportation Infrastructure System,The University of Texas at El Paso, 500 W. Uni-versity Avenue, El Paso, TX 79968-0516
11. Contract or Grant No.
DTRT12-G-UTC1612. Sponsoring Agency Name and Address 13. Type of Report and Period Covered
Center for Advanced Infrastructure and Transportation Final ReportRutgers, The State University of New Jersey 6/01/13 - 12/1/2016100 Brett Road 14. Sponsoring Agency Code
Piscataway, NJ 0885415. Supplementary Notes
U.S Department of Transportation/Research and Innovative Technology Administration1200 New Jersey Avenue, SEWashington, DC 20590-000116. Abstract
With solid data from environmental scientists supporting climate change there has been a strong push in theindustry to look for alternative “green” or environmentally friendly methods to keep building and maintainingour infrastructure. This collaborative report looks into microbial processes to stabilize soil subgrade for roadwaysand asphalt like liquids extracted from algae. Not only are new bio technologies looked into for building but alsomicrobial deterioration is looked into and needs to be addressed when evaluating the life cycle of a capital project.
17. Key Words 18 Distributional Statement
Acidulated Soy Soapstock, Lipids, Microalgae, AsphaltMixtures, Binder, Bio Additives, Cement, Calcium Car-bonate19. Security Classification 20. Security Classification (of this page) 21. No. of Pages 22. Price
Unclassified Unclassified 133
Form DOT F 1700.7 (8-09)

1
Acknowledgments
The research report herein was performed under CAIT-UTC 032 by the Center for Advanced
Infrastructure and Transportation (CAIT) at Rutgers University, University of Texas at El Paso,
and University of Delaware.
Dr. Thomas Bennert, Program Director, Pavement Resource Program (PRP) at CAIT, was the
principal investigator with the work being done under his general supervision.
CAIT would like to extend their gratitude to all the individuals who worked on the project
including Wen Zhang, Ph.D. from NJIT for supplying the microalgae. Special thanks are
extended to Dorothy Libring, undergraduate researcher and Christopher Ericson, senior
laboratory engineer, for their work throughout the project.

2
TABLE OF CONTENTS
CHAPTER 1
Introduction………………………………………………………………………………3
Research Needs Statement……………………………………………………………….3
CHAPTER 2
Soil Stabilization Using Microbial Activity: A Feasibility Study………………………10
CHAPTER 3
Biodeterioration of Construction Materials – A General Overview……………………69
CHAPTER 4
Extracting Lipids from Algae Biomass to use as an Additive in Asphalt………………94

3
CHAPTER 1
1.1 INTRODUCTION
As of recent there has been a strong push for our society as a whole to be more sustainable.
However, our society today has become so dependent on reliable roads and infrastructure that a
failure causes economical stress in the surrounding communities. As a result of making sure to
reduce failures, the designers and builders of our infrastructure have more or less left the
environmental impacts associated with the projects to the way side. This paper looks into some
viable organic/renewable technologies to help our infrastructure while helping reduce the impact
on our environment.
This collaborate research includes research from Rutgers University: Center for Advanced
Infrastructure and Transportation, Center for Transportation Infrastructure System
The University of Texas at El Paso, and the University of Delaware. This paper is divided into
chapters which are the papers submitted from all the universities involved with the research.
1.2 RESEARCH NEED STATEMENT
The use of biotechnology has many benefits in construction applications, in this case, the
construction and performance of flexible pavements. From a materials standpoint. the potential
use of biomaterials can reduce the dependency on petroleum products required for asphalt
materials, as well as helping to reduce greenhouse emissions during production and construction.
If adaptable, biomaterials may also be able to help increase the general life of the pavement
while reducing the cost of construction. Biotechnologies may also be able to help in the

4
stabilization of subgrade soils prior to constructing roadways over top of them. Researchers have
found that the use of microbial activity allows for a level of stabilization in liquefiable soils.
Including the use of biomaterials to help stabilize these problematic soils is a cost effective and
environmentally sensitive solution. Although biomaterials has shown to help improve pavement
and soil performance, there is also evidence to show that some pavement biodeterioration does
occur and may affect the general roughness of the pavement. To conclude the research study, an
assessment of paved road deterioration due to biodeterioration and how it influences
roughness progression will also be conducted.

1
CHAPTER 2

Report # provided by Rutgers
1
Soil Stabilization Using Microbial Activity: A Feasibility
Study
FINAL REPORT
November 2014
Submitted by:
Name
Sundeep Inti, Graduate Research Assistant
Name
Megha Sharma, Graduate Research
Assistant
Name
Vivek Tandon, Associate Professor
Center for Transportation Research Infrastructure
The University of Texas at El Paso
500 W. Univ. Ave.
El Paso, Texas 79968-0516

Report # provided by Rutgers
2
External Project Manager
Thomas Bennert
In cooperation with
Rutgers, The State University of New Jersey
And
Department of Transportation
And
U.S. Department of Transportation
Federal Highway Administration

1
Disclaimer Statement
The contents of this report reflect the views of the authors,
who are responsible for the facts and the accuracy of the
information presented herein. This document is disseminated
under the sponsorship of the Department of Transportation,
University Transportation Centers Program, in the interest of
information exchange. The U.S. Government assumes no
liability for the contents or use thereof.
2
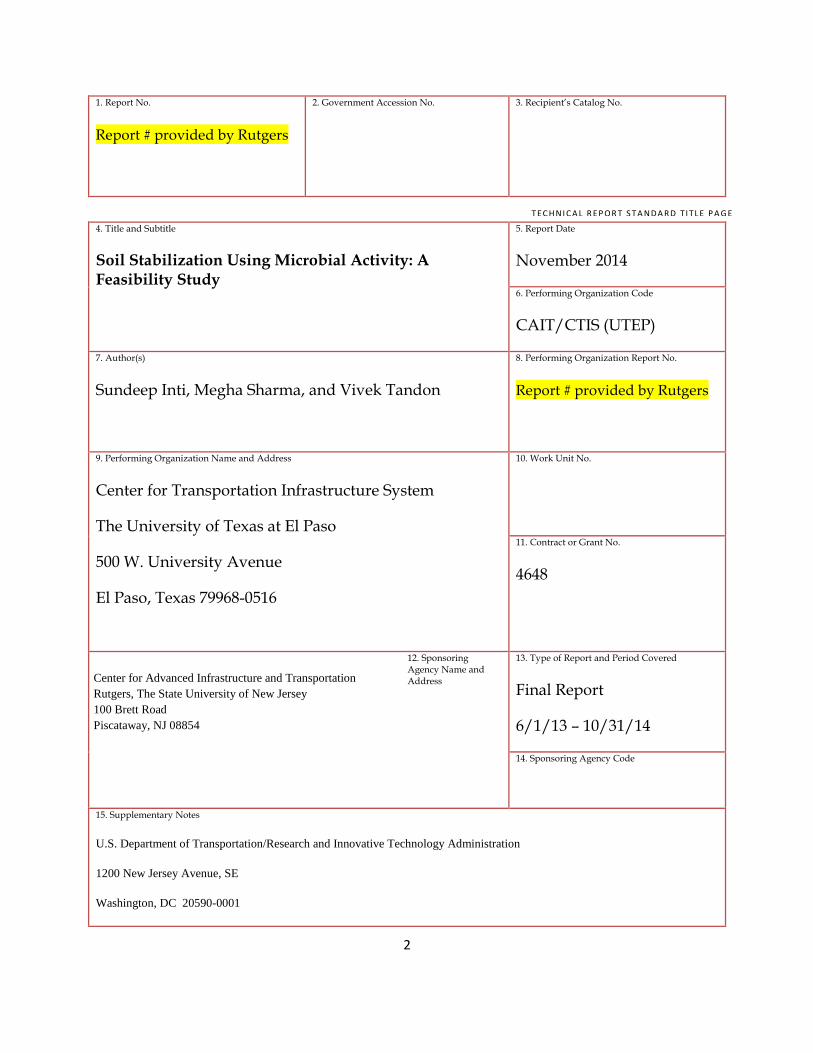
1. Report No.
Report # provided by Rutgers
2. Government Accession No. 3. Recipient’s Catalog No.
4. Title and Subtitle
Soil Stabilization Using Microbial Activity: A Feasibility Study
5. Report Date
November 2014
6. Performing Organization Code
CAIT/CTIS (UTEP)
7. Author(s)
Sundeep Inti, Megha Sharma, and Vivek Tandon
8. Performing Organization Report No.
Report # provided by Rutgers
9. Performing Organization Name and Address
Center for Transportation Infrastructure System
The University of Texas at El Paso
500 W. University Avenue
El Paso, Texas 79968-0516
10. Work Unit No.
11. Contract or Grant No.
4648
12. Sponsoring Agency Name and Address
13. Type of Report and Period Covered
Final Report
6/1/13 – 10/31/14
14. Sponsoring Agency Code
15. Supplementary Notes
U.S. Department of Transportation/Research and Innovative Technology Administration
1200 New Jersey Avenue, SE
Washington, DC 20590-0001
Center for Advanced Infrastructure and Transportation
Rutgers, The State University of New Jersey
100 Brett Road
Piscataway, NJ 08854
T E C H NI C A L R E P OR T S T A NDA RD TI TLE P A G E

3
16. Abstract
It is quite common that bearing capacity of the soil is enhanced through treatment to provide a
stable supporting layer (subgrade) for construction. These treatments can be classified as soil
modification or soil stabilization. The purpose of subgrade modification is to create a working
platform for construction equipment while the purpose of subgrade stabilization is to enhance the
strength of the subgrade. The additional benefit of stabilization is that the increased strength can
be used in the design methodology for adjusting the thickness of base layer. Traditional methods
of subgrade stabilization include chemical processes such as mixing with cement, fly ash, lime,
lime byproducts, and blends of any one of these materials. In recent years, a new method of
stabilization has been proposed and is commonly known as microbial geo-technology, which
uses bacteria to stabilize soils and is the focus of this study. The preliminary evaluation suggests
that bacteria-treatment is a viable alternative as microbial precipitation enhanced strength and
reduced permanent deformation due to traffic loading. The influence of bacteria-treatment was
most pronounced for sandy soils and least for clayey soil. In addition, the micro level evaluation
verified deposition of calcite on soils. However, further research is needed before it can be
implemented in the field.
17. Key Words
Bio-cementation, Mutated Bacteria, Calcite, Precipitation, and Strength
18. Distribution Statement
19. Security Classification (of this report)
Unclassified
20. Security Classification (of this page)
Unclassified
21. No. of Pages
53
22. Price
Form DOT F 1700.7 (8-69)

4
Acknowledgments
The authors like to gratefully acknowledge financial support for this project received from the Center for Advanced Infrastructure and Transportation of Rutgers, The State University of New Jersey. In addition, authors gratefully acknowledge both financial and laboratory support for this project from the College of Engineering, Office of Sponsored Research, the Civil Engineering Department, Biomolecule Analysis Core Facility, the Center for Transportation Infrastructure Systems, and the Nano Material Integration Laboratory at The University of Texas at El Paso.

5
Table of Contents
1. INTRODUCTION ..................................................................................................................................... 8
1.1 Problem Statement ....................................................................................................................... 8
1.2 Research Objective, Approach and Scope .................................................................................... 8
2. REVIEW OF INFORMATION ................................................................................................................... 9
2.1 Microbial Geo-Technology ............................................................................................................ 9
2.1.1 Bio-Cementation ................................................................................................................... 9
3. DESIGN OF EXPERIMENT AND BACTERIA CULTURE ............................................................................ 24
3.1 Experiment Design ...................................................................................................................... 24
3.1.1 Soils ..................................................................................................................................... 24
3.2 Bacteria Culture and Mutation ................................................................................................... 26
3.2.1 Introduction ........................................................................................................................ 26
3.2.2 Constituents required for Bacterial Growth ....................................................................... 26
3.3 Sample Preparation with Bacteria .............................................................................................. 29
3.3.1 Sodium Phosphate Buffer ................................................................................................... 29
3.3.2 Urea Calcium Chloride Medium .......................................................................................... 29
3.3.3 Sample Preparation............................................................................................................. 29
3.4 Macro Level Laboratory Tests ..................................................................................................... 30
3.5 Micro Level Laboratory Tests ...................................................................................................... 31
3.5.1 XRD Analysis ........................................................................................................................ 31
3.5.2 Scanning Electron Microscopy ............................................................................................ 33
4. RESULTS AND DISCUSSION .................................................................................................................... 2
4.1 Macro Level: Laboratory Tests ...................................................................................................... 2
4.2 Micro Level: XRD Analysis ........................................................................................................... 11
4.3 Micro Level: SEM Analysis ........................................................................................................... 12
5. SUMMARY, CONCLUSIONS AND RECOMENDATION........................................................................... 16
6. REFERENCES ........................................................................................................................................ 17
7. APPENDIX A ......................................................................................................................................... 20

6
List of Figures
FIGURE 2.1 THE BACTERIAL GROWTH (FRIEDRICH, 2010) .................................................................. 11
FIGURE 3.1 GRADATION OF SILTY SOIL .......................................................................................... 25
FIGURE 3.2 GRADATION OF SANDY SOIL ........................................................................................ 25
FIGURE 3.3 GRADATION OF CLAYEY SOIL ........................................................................................ 25
FIGURE 3.4 CELLCULTURE HOOD (LABGARD, CLASS-II, TYPE A2) .......................................................... 27
FIGURE 3.5 SHAKE INCUBATOR .................................................................................................... 27
FIGURE 3.6 SPECTROPHOTOMETER ............................................................................................... 28
FIGURE 3.7 BACTRIA-TREATMENT OF SOIL ...................................................................................... 31
FIGURE 3.8 CALCITE DEPOSITION (OVEN DRIED SOIL) ........................................................................ 31
FIGURE 3.9 SCHEMATIC OF X-RAY DIFFRACTION ............................................................................... 32
FIGURE 3.10 BRUKER D8 X-RAY DIFFRACTOMETER........................................................................... 32
FIGURE 3.11 SCHEMATIC OF SCANNING ELECTRON MICROSCOPE.......................................................... 34
FIGURE 3.12 HITACHI TM-1000 SCANNING ELECTRON MICROSCOPE ..................................................... 1
FIGURE 4.1 INFLUENCE OF BACTERIA-TREATMENT ON GRADATION ......................................................... 4
FIGURE 4.2 MOISTUE DENSITY CURVE OF SILTY SOIL ........................................................................... 5
FIGURE 4.3 MOISTUE DENSITY CURVE OF SANDY SOIL ......................................................................... 6
FIGURE 4.4 MOISTUE DENSITY CURVE OF CLAYEY SOIL ........................................................................ 6
FIGURE 4.5 INFLUENCE OF BACTERIA-TREATMENT ON UNCONFINED COMPRESSIVE STRENGTH ....................... 7
FIGURE 4.6 INFLUENCE OF BACTERIA-TREATMENT ON STRESS-STRAIN RELATIONSHIP FOR SILTY SOIL ............... 7
FIGURE 4.7 INFLUENCE OF BACTERIA-TREATMENT ON STRESS-STRAIN RELATIONSHIP FOR SANDY SOIL ............. 8
FIGURE 4.8 INFLUENCE OF BACTERIA-TREATMENT ON STRESS-STRAIN RELATIONSHIP FOR CLAYEY SOIL ............ 9
FIGURE 4.9 INFLUENCE OF BACTERIA-TREATMENT ON RESILIENT MODULUS .............................................. 9
FIGURE 4.10 INFLUENCE OF BACTERIA-TREATMENT ON SEISMIC MODULUS ............................................. 10
FIGURE 4.11 X-RAY DIFFRACTION PATTERN OF SANDY SOIL TREATED WITH BACTERIA (TRIAL 1) .................. 11
FIGURE 4.12 X-RAY DIFFRACTION PATTERN OF SANDY SOIL TREATED WITH BACTERIA (TRIAL 2) .................. 12
FIGURE 4-13 SEM IMAGES OF UNTREATED SANDY SOIL ..................................................................... 13
FIGURE 4-14 SEM IMAGES OF TREATED SANDY SOIL ........................................................................ 13
FIGURE 4-15 SEM IMAGES OF UNTREATED SILTY SOIL ....................................................................... 14
FIGURE 4-16 SEM IMAGES OF TREATED SILTY SOIL .......................................................................... 14
FIGURE 4-17 SEM IMAGES OF UNTREATED CLAYEY SOIL .................................................................... 15
FIGURE 4-18 SEM IMAGES OF TREATED CLAYEY SOIL ........................................................................ 15

7
List of Tables
TABLE 2.1 SUMMARY OF BIO-CEMENTATION BY VARIOUS RESEARCHERS ................................................ 17
TABLE 3.1 VARIOUS TEST FOR EVALUATING SOIL PROPERTIES .............................................................. 24
TABLE 3.2 INGREDIENTS OF TRIS –YE BACTERIA CULTURE MEDIUM ....................................................... 27
TABLE 3.3 COMPOSITION OF UREA CALCIUM CHLORIDE MEDIUM ......................................................... 29
TABLE 4.1 SOIL CLASSIFICATION AND MECHANICAL PROPERTY TEST RESULTS ............................................ 2

8
1. INTRODUCTION
1.1 Problem Statement
State highway agencies often construct highways on lower quality subgrade (in-situ soil) materials. To meet the bearing capacity requirements, the lower quality material is typically modified either through mechanical modification or through chemical stabilization. In recent years, researchers have proposed a sustainable approach of using bacteria to stabilize soils. Dejong et al. (2010) proposed to take advantage of a natural soil bacterium (Bacillus pasteurii). This microbe causes calcite (calcium carbonate) to be deposited around sand, cementing them together. By injecting bacterial cultures, additional nutrients and oxygen, DeJong et al. found that they could turn loose, liquefiable sand into a solid cylinder. Similarly, Hamden et al. (2011) used Microbially induced calcium carbonate precipitation (MICP) to mitigate earthquake potential of liquefiable soils, enhancement of the bearing capacity of shallow foundations, control of groundwater flow, facilitation of excavation and tunneling in running and flowing sands, and reduction of erosion and scour potential, etc. Thus, MICP offers the promise of a sustainable, non-disruptive and energy efficient engineering solution to stabilize soils and is the focus of this study.
1.2 Research Objective, Approach and Scope
The main objective of this study is to evaluate feasibility of enhancing quality of soils through MICP. To achieve objectives of this study, the following approach is proposed:
Develop a methodology for bacterial growth for soil stabilization.
Develop a methodology for mixing of bacteria in the soil.
Identify presence of MICP using micro-level tests and evaluate influence of MICP on soil strength.
To achieve objectives of this study within time constrained, the study was performed with one bacteria type and three soil types.

9
2. REVIEW OF INFORMATION
State Highway Agencies (SHA) often construct on roadbeds that do not possess sufficient strength to support traffic loads imposed upon them during construction or the service life of the highway. It is quite common that bearing capacity of the soil is enhanced through treatment to provide a stable subgrade or a working platform for the construction of the pavement. These treatments can be classified as soil modification or soil stabilization. The purpose of subgrade modification is to create a working platform for construction equipment while the purpose of subgrade stabilization is to enhance the strength of the subgrade. The additional benefit of stabilization is that the increased strength can be used in the design methodology for adjusting base layer thickness. The methods of subgrade modification include physical processes such as soil densification, blends with granular material, use of reinforcements (Geogrids), undercutting and replacement, and stabilization includes chemical processes such as mixing with cement, fly ash, lime, lime byproducts, and blends of any one of these materials. Soil properties such as strength, compressibility, hydraulic conductivity, workability, swelling potential, and volume change tendencies may be altered by various soil modification or stabilization methods. In recent years, a new method of stabilization has been proposed and is commonly known as microbial geo-technology, which uses bacteria to stabilize soils.
2.1 Microbial Geo-Technology
The microbial geo-technology deals with enhancing the mechanical properties of geological materials through microbial activities. According to Volodymyr and Cheu (2008), the most suitable microorganisms are facultative anaerobic and micro aerophilic bacteria. Two notable applications of microbial geo-technology are bio-clogging and bio-cementation. Bio-clogging is the production of pore filling materials, through microbial means, such that the porosity and hydraulic conductivity of soil can be reduced. Bio-cementation is the generation of particle binding materials through microbial processes such that the shear strength of soil can be increased. Additionally, the bio-cementation can also lead to bio-clogging due to deposition of binding material.
2.1.1 Bio-Cementation
2.1.1.1 Introduction
Bio-cementation or bio-mineralization is a widespread complex phenomenon that binds materials through microbial activities to increase the strength and durability. In this process, micro-organisms or bacteria form minerals like calcium carbonate (CaCO3) in various geothermal systems. The process creates heterogeneous materials composed of biologic (or organic) and inorganic compounds like carbonate, phosphate, oxalate, silica, iron, or sulfur-containing minerals, with heterogeneous distributions that reflect the environment in which they form (Skinner et al. 2003). Biologically induced mineralization is also an important geological process that helps in the formation of microfossil, hot spring deposition and transfer of chemical elements (Merz 1992, Jones et al. 1997, Konhauser et al. 1996). Although bacterial

10
cells are very minuscule, they have the largest surface to volume ratio of any life form. Therefore, they provide a large contact area that can interact with the surrounding environments and are responsible for the transformation of at least one third of the elements in the periodic table (Belkova 2005). The unique properties and functions of bio-mineralization have inspired innovative high-performance composites for construction applications, as well as other new materials (Bright 1994, Newnham 1997, and Travis 1997). Moreover, bio-mineralization have advantage of low investment and maintenance cost. It also offers benefits to environments and aesthetics (Karol 2003). For example: a potential use of this technology is carbon sequestration, which involves carbon dioxide (CO2) capturing and converts it to calcium carbonate (CaCO3).
2.1.1.2 Bacteria
Bacteria are single-celled (unicellular) micro-organisms, spherical, rod-shaped, spiral and appearing singly or in a chain that undergo metabolism, reproduction and growth, differentiation, communication, movement and evaluation. Activity and growth of bacteria depends on several growth limiting factors. These are a source of carbon for cell mass, a source of energy to sustain life activity, water, other nutrients and a favorable environment (including temperature, pH, salinity, and sufficient space).
The bacterial growth curve depends on inoculation of viable cells into a sterile broth (bacterial growth medium) and incubation of the culture under adequate temperature, pH and gaseous conditions. Under growth promoting conditions, the cells will reproduce rapidly and the dynamics of microbial growth can be plotted in population growth curve. A typical growth curve under these conditions is shown in Figure 2.1 and various growth phases are as follows:
Lag Phase: During this stage the cells are adjusting to the new environment. A cellular metabolism is accelerated, resulting in rapid biosynthesis of cellular macromolecules, primarily enzymes. Although the cells are moderately increasing in size, there is limited cell division and therefore only a moderate increase in cell numbers.
Starting Phase: In this phase, bacteria just start to grow after getting nourishment in a favorable environment.
Logarithmic (log or exponential) phase: In the logarithmic phase, the physiologically robust cells reproduce at a uniform and rapid rate by binary fission. Thus, there is a rapid exponential increase in population, which doubles regularly until a maximum number of cells are reached. The length of the log phase depends on the organisms and the composition of the medium and varies significantly depending on bacteria type.
Stationary Phase: During this phase, the number of cells undergoing division is equal to the number of cells that are dying. Therefore, there is no further increase in cell number and the population is maintained at is maximum level for a period of time. The primary factors responsible for this phase are the depletion of some

11
essential nutrients and the accumulation of toxic acidic or alkaline waste products in the medium.
Decline or Death Phase: Because of the continuing depletion of nutrients and buildup of metabolic wastes, the microorganisms die rapidly at a uniform rate during this phase. The decrease in bacteria population closely parallels to its increase during the log phase. Theoretically, the entire population should die during a time interval equal to that of the log phase. Since a small number of highly resistant organisms persist for an indeterminate length of time, this does not happen.
Slow-down Phase: In this phase, bacteria just start dying due to lack of nutrients.
Figure 2.1 The Bacterial Growth (Friedrich, 2010)
2.1.1.3 Microbiologically Induced Carbonate Precipitation (MICP)
Carbonate precipitation is a common natural phenomenon found in the environment. According to Boquet et al. (1973), calcium carbonate is a general phenomenon in the bacterial world, and under suitable conditions, most bacteria are able to precipitate calcite crystals. Precipitation of CaCO3 can occur in two ways: abiotic and biotic pathways. Abiotic precipitation occurs in supersaturated solutions through evaporation while pressure decreases and temperature increases (Castanier et al. 1999). Biotic precipitation can be either biotically controlled or biotically induced. When an organism exerts some sort of control over the location, size, and composition of the minerals formed, like skeletons and shells, the process is

12
said to be biotically controlled (Frankel et al. 2003). If the precipitation arises as a result of the metabolic activity of an organism, and the organism has little or no control over the mineralization, the process is biotically induced (Frankel et al. 2003). Carbonate precipitation has great importance in many environmental and civil engineering (material) applications. Abiotic precipitation has been used for purposes as wide ranging as permeability reduction in unconsolidated soils (Bird et al. 2008) to methods for carbon dioxide disposal (Lackner et al. 1995). Biologically induced carbonate precipitation by bacteria has been proposed for several biotechnological applications. Carbonate mineralization by bacteria can occur in two ways: active or passive pathways. Active precipitation occurs as a by-product of common microbial processes such as photosynthesis, urea hydrolysis, sulfate reduction, and iron reduction (Knorre et al. 2000). Actually these processes increase the pH in the environment surrounding the bacteria that alters the saturation state of carbonate and other ions, such as calcium and iron. These new saturation states allows carbonate to precipitate out of solution as calcium carbonate (calcite, aragonite, or vaterite), magnesite, siderite, dolomite, or any number of carbonate minerals. One engineering application for active carbonate precipitation is the use of iron (III) reducing bacteria to stabilize fly ash, a residue generated by the combustion of coal (Roh et al. 2001). In passive carbonate precipitation, heterogeneous nucleation on negatively charged points of bacteria attracts positively charged ions, allowing for the precipitation of carbonate (Bazylinski et al. 2003). Calcium carbonate is one of the most common products of carbonate precipitation, as both calcium and carbonate ions are abundant in natural environments. Sporosarcina pasteurii formerly known as “Bacillus pasteurii”, is a bacterium with the ability to precipitate calcite and solidify sand given a calcium source and urea, through the process of biological cementation. S. pasteurii has been proposed to be used as an ecologically sound biological construction material. Carbonate mineralization of these bacteria follows active pathways. The process is fairly straightforward. In the first step, bacteria get nutrition from culture medium and secrete urease enzyme (Urea-amino-hydrolease), this enzyme hydrolyzed urea (CO(NH2)2) to ammonia (NH3) and carbonic acid (H2CO3) in the series of reactions outlined bin equations 2-4 through 2-6 (Burne et al. 2000). Then this ammonia and carbonic acid equilibrate in water to form bicarbonate (HCO3
-), ammonium (NH4+), and hydroxide ion (OH-)
(Equations 2-7 & 8). After this, the pH increase due to formation of NH4+ which is essential for
creation of calcite. This rise in pH shifts the bicarbonate equilibrium to form carbonate ions (Equation 2-9) which, in the presence of soluble calcium (Ca2+), precipitates out of solution as calcium carbonate (Burne et al. 2000; Castanier et al. 1999). The overall reaction from the hydrolysis of urea in the presence of calcium is listed in the following equations.

13
CO(NH2)2 + H2O → NH2COOH + NH3
2-1
NH2COOH + H2O → NH3 + H2CO3
2-2
CO(NH2)2 + 2H2O → 2NH3 + H2CO3
(Overall, step 1)
2-3
H2CO3 ↔ HCO3− + H+
2-4
2NH3 + 2H2O ↔ 2NH4+ + 2OH−
2-1
HCO3− + H+ + 2OH− ↔ CO3
2− + 2H2O
2-2
CO32− + Ca2+ ↔ CaCO3
2-3
CO(NH2)2 + 2H2O + Ca2+ ↔ 2NH4+ + CaCO3
(Overall process)
2-4
These reactions occur under the influence of natural environmental factors. These factors are the type of bacteria; bacteria cell concentration, temperature, urea concentration, calcium concentration, ionic strength, and the pH of the media. Since the activity of the urease enzyme is controlled by these factors, it may have a significant impact on MICP. The bacteria should possess high ureolytic efficiency, alkalophilic (optimum growth rate occurs at pH around 9, and no growth at all around pH 6.5), non-pathogenic, and possess the ability to deposit calcite homogeneously on the substratum (George et al. 2010). The bacteria should also have a high negative zeta-potential (Dick et al. 2006) to promote adhesion and surface colonization, and produce enormous amounts of urease enzyme in the presence of high concentrations of ammonium (Kaltwasser et al. 1972) to enhance both the rate of ureolysis and microbial carbonate precipitation (Nemati et al. 2003).
Urease-catalyzed ureolysis is also influenced by temperature like any other enzymatic reaction. The optimum temperature ranges from 20 to 37 °C depending on environmental conditions and concentrations of other reactants in the system (George, et al. 2010). It has been reported that the rate of ureolysis increases with temperature, when temperature rises from 15 to 20 °C, the
Urease enzyme (catalyst)

14
rate of ureolysis kurea is 5 to 10 times greater from 10°C (Mitchell, et al. 2005). Thus, the rate of ureolysis can be enhanced by increasing the temperature within the optimum range.
Nemati and Voordouw (2003) verified that increasing urea and Ca2+ beyond 36 and 90g/L, respectively, does not have any significant effect on bacterial calcium carbonate precipitation. Since Ca2+ is not utilized by microbial metabolic processes, it would accumulate outside the cell where it would be readily available for MICP (Silver et al. 1975).
Ionic strength is also an important factor which influences enzymatic reactions like temperature and concentration. In bacteria transport of porous media, the total interaction energy needed by microbial particles to adhere and attach themselves to solid surfaces as explained by the classical Derjaguin– Landau–Verwey–Overbeek theory which is composed of the repulsive electrostatic forces and the attractive Van Der Waals forces (George et al. 2010). High ionic strength increases electrical double layer (EDL) compression by decreasing EDL repulsive forces leaving attractive Van Der Waals forces to dominate, and in the process promotes bacterial adhesion and attachment to the substratum (Faibish et al. 1998). Martell and Smith (1974) showed that the equilibrium constant for ammonia speciation increase from 9.3 to 9.4 by raising ionic strength from 0.1 to 1.0.
A pH increase is an indication of urea hydrolysis, and is an important property of alkalophiles (optimum growth at pH 9 and no growth below pH 6.5). At any pH levels, NH3 gas and dissolved NH4
+ exist at different concentrations. A higher concentration of NH3 creates favorable conditions for MICP (George, et al. 2010).
The phenomenon of MICP is not very well understood (Douglas et al. 1998). Knorre and Krumbien (2000) elucidated that MICP occurs as a result of common microbial metabolic processes such as photosynthesis, urea hydrolysis, and sulfate reduction. According to Ramachandran (2001), use of bacteria in PCC construction industry is considered unorthodox. But MICP is pollution free and natural activity and improves the performance of PCC or mortar (Ghosh et al. 2005). This recent research on bio-mineralization is leading use of microorganism as potential new material in construction industry. Some calcite forming bacteria strains, as example Arthrobacter crystallopoietes (ATCC 15481), Sporosarcina pasteurii (ATCC 11859), Bacillus sphaericus (ATCC 14577), and Lysinibacillus fusiformis (ATCC 7055) etc., have enough potentiality to precipitate calcium carbonate in optimum condition to improve the strength of PCC (Park, et al, 2009).
2.1.1.4 Bio-Cementation of Soils
The roles of microorganisms as explained by Van Paassen (2009) are
1. Producing carbonate (hydrolysis) 2. Producing alkalinity (increasing the pH locally, which causes the dissolved inorganic
carbon which is mainly present as bicarbonate to dissociate causing an increase in carbonate concentration).
3. Acting as nucleation sites in an already oversaturated solution.

15
Bachmeier (2002) studied the urease activity MICP. Bacillus pasteurii and Escherichia coli, microorganisms were used for the experiments. These two microorganisms have ability to precipitate calcite. They used Bacillus pasteurii which was immobilized in polyurethane (PU) foam to compare the efficiency of calcite precipitation between the free and immobilized enzymes. After the process of MICP, Scanning Electron Microscope (SEM) was used. SEM images identified calcite precipitation throughout the matrices of PU. In comparison, SEM images of calcite precipitation induced by the PU-immobilized urease showed smaller and less organized crystals on the surface, and PU foam has well organized crystals within the matrices.
DeJong et al. (2006) used microorganism Bacillus pasteurii for achieving MICP, an aerobic bacterium pervasive in natural soil deposits. The microbes were introduced to the sand specimens in a liquid growth medium amended with urea and a dissolved calcium source. To increase the cementation level of the sand particle matrix, cementation treatments were done on the specimen. The results of both MICP and gypsum-cemented specimens were assessed non-destructively by measuring the shear wave velocity. SEM microscopy verified formation of a cemented sand matrix with a concentration of precipitated calcite forming bonds at particle-particle contacts. X-ray compositional mapping confirmed that the observed cement bonds were comprised of calcite.
DeJong et al. (2006) recommended the use of Bacillus Pasteurii as the stabilization microorganism applied in soil improvement. These bacteria used urea as the nutrient and grow at 30±2°C with sufficient oxygen. To ensure the growing of bacteria and effective chemical reaction, nutrients and chemicals supplements are necessary.
Whiffin et al. (2007) used MICP as a soil improvement technique. For evaluating MICP as a strengthening process, a five meter sand column was treated with bacteria and reagents under conditions that were realistic for field applications. The injection and reaction parameters were monitored during the process and both bacteria and process reagents could be injected over the full column length at low pressures (hydraulic gradient < 1; a flow rate of approximately 7 m/day) without resulting in clogging of the material. After treatment, the column was subjected to mechanical testing, which indicated a significant improvement of strength and stiffness over several meters. Calcium carbonate was precipitated over the entire five meter treatment length.
Table 2.1 shows the summary of various researches done on different types of soils. The review of information indicated that bio-cementation has been successfully used in strengthening of sand columns. In addition, the review also indicated that MICP can be used for healing as well as strengthening of the concrete. The other applications include slope stability, bioremediation of piping erosion in sands. However, the use bio-cementation has been limited to sands and its application for stabilization of clay or silt has not been well documented. In addition, there is no documented application of mutated bacteria for soil remediation. In a study, Achal et.al (2009) investigated that ultra violet (UV) irradiation of BP not only increased the efficiency of this

16
bacterium to grow at high pH but also increased urease activity for more calcite formation. The influence of mutation on calcite precipitation needs to be evaluated as well.
Therefore, the main focus of the study is to develop a methodology for mixing mutated bacteria (MB) in the soil and evaluate its influence on strength of clayey, as well as sandy soil.
17
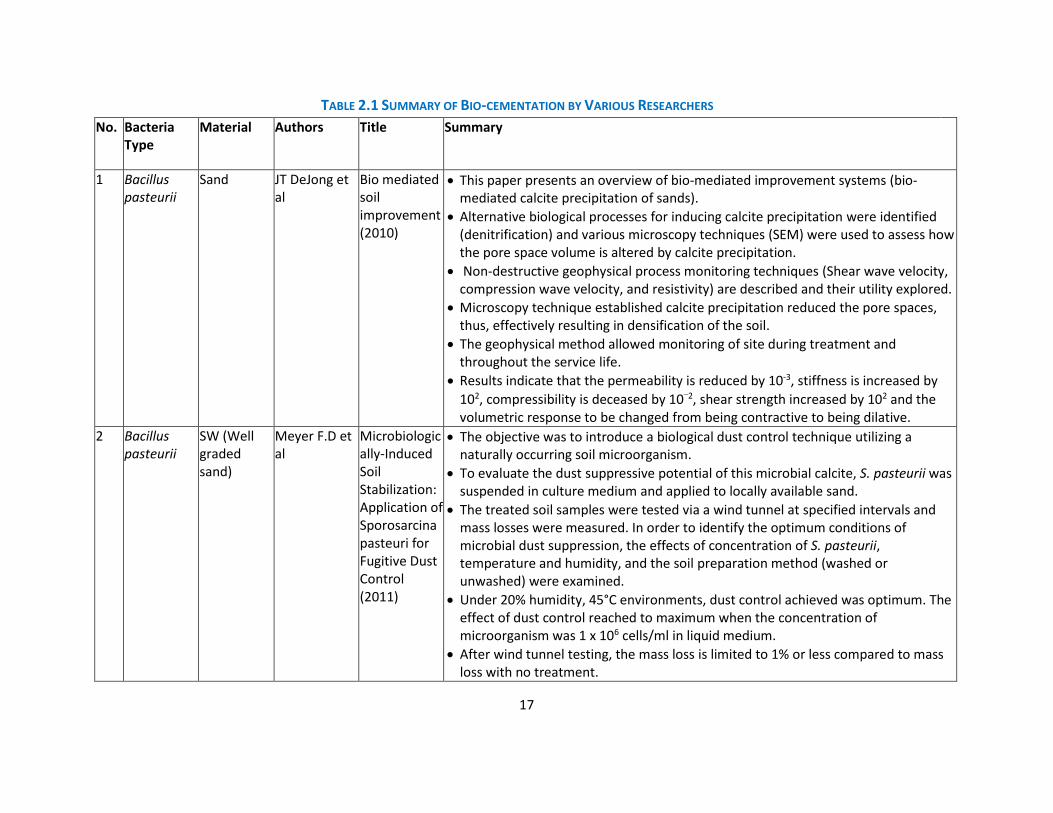
TABLE 2.1 SUMMARY OF BIO-CEMENTATION BY VARIOUS RESEARCHERS
No. Bacteria Type
Material Authors Title Summary
1 Bacillus pasteurii
Sand JT DeJong et al
Bio mediated soil improvement (2010)
This paper presents an overview of bio-mediated improvement systems (bio-mediated calcite precipitation of sands).
Alternative biological processes for inducing calcite precipitation were identified (denitrification) and various microscopy techniques (SEM) were used to assess how the pore space volume is altered by calcite precipitation.
Non-destructive geophysical process monitoring techniques (Shear wave velocity, compression wave velocity, and resistivity) are described and their utility explored.
Microscopy technique established calcite precipitation reduced the pore spaces, thus, effectively resulting in densification of the soil.
The geophysical method allowed monitoring of site during treatment and throughout the service life.
Results indicate that the permeability is reduced by 10-3, stiffness is increased by
102, compressibility is deceased by 10−2, shear strength increased by 102 and the volumetric response to be changed from being contractive to being dilative.
2 Bacillus pasteurii
SW (Well graded sand)
Meyer F.D et al
Microbiologically-Induced Soil Stabilization: Application of Sporosarcina pasteuri for Fugitive Dust Control (2011)
The objective was to introduce a biological dust control technique utilizing a naturally occurring soil microorganism.
To evaluate the dust suppressive potential of this microbial calcite, S. pasteurii was suspended in culture medium and applied to locally available sand.
The treated soil samples were tested via a wind tunnel at specified intervals and mass losses were measured. In order to identify the optimum conditions of microbial dust suppression, the effects of concentration of S. pasteurii, temperature and humidity, and the soil preparation method (washed or unwashed) were examined.
Under 20% humidity, 45°C environments, dust control achieved was optimum. The effect of dust control reached to maximum when the concentration of microorganism was 1 x 10⁶ cells/ml in liquid medium.
After wind tunnel testing, the mass loss is limited to 1% or less compared to mass loss with no treatment.

18
No. Bacteria Type
Material Authors Title Summary
3 Bacillus pasteurii
Silica Sand, Surface material from unpaved road and concrete coarse aggregate
Li, S. A laboratory study of the effects of biostabilization on geomaterials (2013)
The objective was to introduce biological additives into geomaterial specimens to test the strength and other geotechnical properties of soil and analyse the micro structure of untreated and bio-treated specimens.
Eight tests were conducted on the bio-treated specimens, which are, compression test, micro analysis (SEM and EDS), mercury porosimetry, Iowa pore index, freezing and thawing, soil index test, abrasion and impact.
Bio-treatment increased the average UCS of silica sand samples by 3–6 times.
Bio-stabilization effect is slightly better when NH4Cl liquid medium is used. It reduces the porosity of concrete pavement coarse aggregate by microbially induced precipitation. After 6 cycles of bio-treatments, mercury intrusion volume was decreased from 0.0697mL/g to 0.0199mL/g. The pores were seemingly plugged by bio-precipitants.
The soundness of aggregate test showed that the bio-treated aggregate has 20% less mass loss compared to the untreated aggregate.
4 Bacillus pasteurii
Sand Whiffing et al
Microbial Carbonate Precipitation as a soil improvement technique (2007)
In order to evaluate MICP as a soil strengthening process, a five meter sand column was treated with bacteria.
The injection and reaction parameters were monitored during the process and both bacteria and process reagents could be injected over the full column length at low pressures (hydraulic gradient < 1; a flow rate of approximately 7 m/day).
After treatment, the column was subjected to mechanical testing, which indicated a significant improvement of strength and stiffness over several meters. Calcium carbonate was precipitated over the entire five meter treatment length.
The average permeability over the column after treatment was 9×10⁻⁶ m/s compared to the original material permeability of 2×10⁻⁵ m/s.

19
No. Bacteria Type
Material Authors Title Summary
5 Castellaniella denitrificans
Garden soil or sludge from a waste water treatment
Van Paassen et al.
Potential soil reinforcement by biological denitrification (2010)
In this paper, an alternative for MICP method is used, i.e., microbial denitrification of calcium nitrate, using calcium salts of fatty acids as electron donor and carbon source.
In this process, organic compounds like acetate can be oxidized to produce carbonate ions and alkalinity, which are required for the precipitation of calcite, while nitrate is reduced to nitrogen gas.
Using calcium salts of both the electron donor and acceptor results in a high CaCO3 yield.
The occurrence of inhibitive intermediates (nitrite and nitrous oxide) at high concentrations and the heterogeneous distribution of calcium carbonate in the sand column still negatively affect the potential of denitrification as soil reinforcement method.
The rate of calcium carbonate formation by denitrification is far lower than for the urease process.
6 Pseudomonas denitrificans
Granular soils
Hamdan Nasser et al
Carbonate Mineral Precipitation for Soil Improvement through Microbial Denitrification (2011)
This paper discuss about the use of microbial denitrification as a preferred method for MICP.
Bench scale bioreactor and column tests using Pseudomonas denitrificans have shown that calcite can be precipitated from calcium rich pore water using denitrification.
As denitrifying bacteria are ubiquitous in the subsurface, denitrification offers the potential for bio-stimulation of indigenous microorganisms.
Denitrification does not produce toxic end products, may be cost effective since nearly 100% utilization of electron donor is possible, and does not require the addition of potentially harmful exogenous organic materials such as urea.
In denitrification, the total dissolved solids in the reactors and columns are reduced by addressing the loss of free calcium in the form of calcium phosphate

20
precipitate from the pore fluid.

21
No. Bacteria Type
Material Authors Title Summary
7 Bacillus pasteurii
Sand Van der Ruyt et al.
Biological in situ reinforcement of sand in near-shore areas (2009)
In this study, BioGrout (MICP) process is adopted for increasing the strength of the sand and its potential applications are mentioned
BioGrout can be applied in existing dunes that are not wide enough to withstand design conditions, or in situations where, for example, buildings need some extra protection
To ensure a stable slope with sufficient resistance against liquefaction, BioGrout solutions can be applied to create a cemented zone that is no longer be able to liquefy
The main advantage of BioGrout is that soil (or sand) can be strengthened without interfering with the hydraulics of the treated soil. Therefore natural aquifers are not interrupted by the construction, and maintain their function, even at a local level. Also, the soil can be strengthened without excavation or replacement.
8 Organic soil (compost-green waste and biosolids)mixed with sand
Sand Adams, and Xiao
Bioremediation of Piping Erosion in Sand (2011)
This study aims to explore a remediation method in which organic soil is mixed with sand to increase the sand’s resistance to piping erosion.
In this study, a mixture of green and manure compost, referred to as co-compost, is used as the source of organic soil. Hole-erosion tests are performed to quantify the erosion of a silty sand, the co-compost, and various ratios of sand–cocompost mixtures.
The potential increase in consolidation settlement and reduction in shear strength and permeability due to the addition of organic matter were also investigated.
Greater proportions of organic soil mixed with typical construction sand result in increased resistances to piping erosion.
With the addition of organic matter to sand, consolidation settlement increases, undrained compression strength decreases, and permeability was reduced by two orders of magnitude.

22
No. Bacteria Type
Material Authors Title Summary
9 Bacillus Concrete Jonkers et al.
Application of bacteria as self-healing agent for the development of sustainable (2010)
This study investigated the potential of bacteria to act as self-healing agent in concrete, i.e. their ability to repair occurring cracks.
Ordinary Portland cement was mixed with tap water in a water-to-cement weight ratio of 0.4 or 0.5. Bacteria containing specimens were prepared by addition of washed spore suspensions replacing part of the makeup water.
Liquid paste was poured in moulds (with dimensions of 4 cm×4cm×4 cm), gastight sealed and cured at room temperature. Bacterial specimens contained
1–10×108 spores cm−3 cement stone.
ESEM analysis indicates that copious and robust minerals are produced
Bacteria plus calcium lactate, representing a two-component healing agent, produce 20–80 micrometres sized mineral-like precipitates on crack surfaces of young, 7 days cured, cement stone specimens
Bacterial cement stone specimens appeared to produce substantially more crack-plugging minerals than control specimens
10 Bacillus Pasteruii
Concrete Ramakrishnan et al.
Improvement of concrete durability by bacterial mineral precipitation (2005)
In this paper, a technique in remediating cracks and fissures in concrete by utilizing microbiologically induced calcite (CaCo3) precipitation is discussed.
They conducted a durability study of concrete beams that were treated with bacteria grown in three mediums: water, urea, and phosphate buffer.
The beams were exposed to sulphate, alkaline, and freeze thaw environments. Scanning electron microscope (SEM) and X-ray diffraction (XRD) were used to analyse the quantity and shape of MICP. They found the durability of concrete beams treated with bacteria was much higher than the control group.
The authors concluded phosphate-buffer was the most effective bacteria medium and at the end of 28 curing days beams with bacterial concentration of 1 x 10⁶ cells/ml, 1 x 10⁷ cells/ml, and 1 x 10⁸ cells/ml had 13%, 20%, 34% less shrinkage deformations respectively than that of the control beams.

23
No.
Bacteria Type
Material Authors Title Summary
11 Bacillus sphaericus
Limestone Muynck et al.
Influence of urea and calcium dosage on the effectiveness of bacterially induced Carbonate precipitation on limestone (2010)
In this study, the influence of the chemical parameters, i.e. concentration of calcium salts and urea, on the effectiveness of the bio-deposition treatment has been examined.
The amount of calcium carbonate that can be precipitated in the stone is conditioned both by the amount of cells retained in the stone and the concentration of urea and calcium used.
From sonication experiments, a good consolidation was observed for limestone
prisms treated with a calcium dosage of 17 g Ca2+m−2 with no improvement at higher concentrations.
For limestone prisms of 4 cm×2cm×1 cm, the bio-deposition treatment resulted in a 63% lower weight loss upon sonication compared to untreated specimens.
The waterproofing effect was observed to increase with increasing calcium
dosages. While for a calcium dosage of 17 g Ca2+m−2 the water absorption was
similar to that of untreated specimens, concentrations of 67 g Ca2+m−2 resulted in a 50% decrease of the rate of water absorption.
The optimum calcium dosage can be tentatively estimated to about 13.4 mg Ca2+ cm−2.Bio deposition treated specimens showed a similarly decreased water absorption and resistance towards sonication as specimens treated with ethyl-silicates

24
3. DESIGN OF EXPERIMENT AND BACTERIA CULTURE
To study the influence of bacteria-treatment, an experiment design was developed and soil properties were evaluated using standard test methods and verified using micro level tests. In this chapter, the proposed experiment design, test methods for performance evaluation, and developed bacteria-treatment techniques are discussed. A brief discussion on bacteria mutation and growth is also presented.
3.1 Experiment Design
Three different types of soils (sand, silt and clay) were considered for this study. Table 3.1 shows the test conducted on the soil specimens (before and after bacteria-treatment. The purpose of selected test methods was to identify influence of bio-cementation on strength increase as well as to identify influence of calcite deposition on properties that can influence soil classification. The laboratory tests were conducted on specimens treated with mutated bacteria (Bacillus Pasteurii). In addition to the above tests micro analysis of the soils was also done using X-ray diffraction (XRD) and SEM (Scanning Electron Microscope).
Table 3.1 Various Test for Evaluating Soil Properties
Tests Reference
Moisture Dry Density & Optimum Moisture Content
ASTM D698
Unconfined Compressive Strength ASTM D2166
Resilient Modulus AASHTO T 307
Free- Free Resonant Column ASTM C215
Atterberg Limits ASTM D4318-10
Sieve Analysis ASTM D6913-04
3.1.1 Soils
Silty soil (AASHTO Classification A-2-4) was obtained from Strahan Road (close to Rio Grande
River), El Paso, Texas and its gradation is shown in Figure 3.1. Sandy soil was prepared in the
laboratory by mixing the silty soil and sand in a ratio of 1:1, the gradation is shown in Figure 3.2
(AASHTO Classification A-1-b). The sand was manufactured sand obtained from Jobe Materials
(El Paso, Texas). Clayey soil (AASHTO Classification A-2-6) used in this study was obtained from
Horizon cotton fields, El Paso, Texas and its gradation is shown in Figure 3.3.

25
Figure 3.1 Gradation of Silty Soil
Figure 3.2 Gradation of Sandy Soil
Figure 3.3 Gradation of Clayey Soil
0.0
10.0
20.0
30.0
40.0
50.0
60.0
70.0
80.0
90.0
100.0
0.010.1110
Pe
rce
nt
Pas
sin
g
Sieve Size mm
0.0
10.0
20.0
30.0
40.0
50.0
60.0
70.0
80.0
90.0
100.0
0.010.1110
Pe
rce
nt
Pas
sin
g
Sieve Size mm
0.0
10.0
20.0
30.0
40.0
50.0
60.0
70.0
80.0
90.0
100.0
0.010.1110
Pe
rce
nt
Pas
sin
g
Sieve Size mm

26
3.2 Bacteria Culture and Mutation
Bacterial growth requires specific nutrients as well as procedure to minimize bacterial death during growth and stabilization. Therefore, optimal growth medium and a procedure was developed. Since bacteria mutation depends on the type of bacteria as well as a specific procedure, a procedure was also developed for mutation and to make sure that reverse mutation does not occur. The following sections describe bacterial growth and mutation process.
3.2.1 Introduction
For this research, a vial of Sporosarcina pasteurii or Bacillus pasteurii (BP) was procured from American Type Culture Collection (ATCC-11859). This vial of BP was then cultured to multiply the organisms by letting them reproduce in a conducive medium under controlled laboratory conditions. However, it is very difficult for micro-organisms to survive in a high pH environment (around 12), which causes bacterial death or formation of endospores. Thus, the micro-organisms were mutated such that they can survive in a high pH environment.
3.2.2 Constituents required for Bacterial Growth
Various chemicals were used to culture Bacillus pasteurii bacteria and to provide nutrients for bacterial growth during soil stabilization. The constituents and their compositions were maintained constant throughout the study to minimize the influence of changes in chemicals on the growth of bacteria. For mutated bacteria (MB), a higher pH was maintained to improve the survivability and minimize mutation reversal. In the following sections chemicals required for bacterial growth and bacteria mutation process are discussed.
3.2.2.1 Chemicals for Growth of Bacteria and Curing of Soils
Various chemicals were used to the prepare medium for growth and isolation of bacteria. The culture medium for growth was prepared by mixing Yeast extract (Sigma Aldrich; product no.Y1001), Tris Buffer (Sigma Aldrich; product no. T6066), and Ammonium Sulfate ((NH4)2SO4
¬, Sigma Aldrich; product no.A2939). The amounts of ingredients required for optimal growth are shown in Table 3.2. After growth of the bacteria, the culture medium was washed (using 50 mM sodium phosphate buffer) to remove the chemicals used for bacterial growth. It was then adjusted for the required optical density of bacteria. The buffer was prepared by mixing 8.2 grams of Sodium Phosphate (Na3PO4, Sigma Aldrich; product no. 342483) in 1 liter of water. The
washed growth of bacteria was used throughout the specimen preparation.
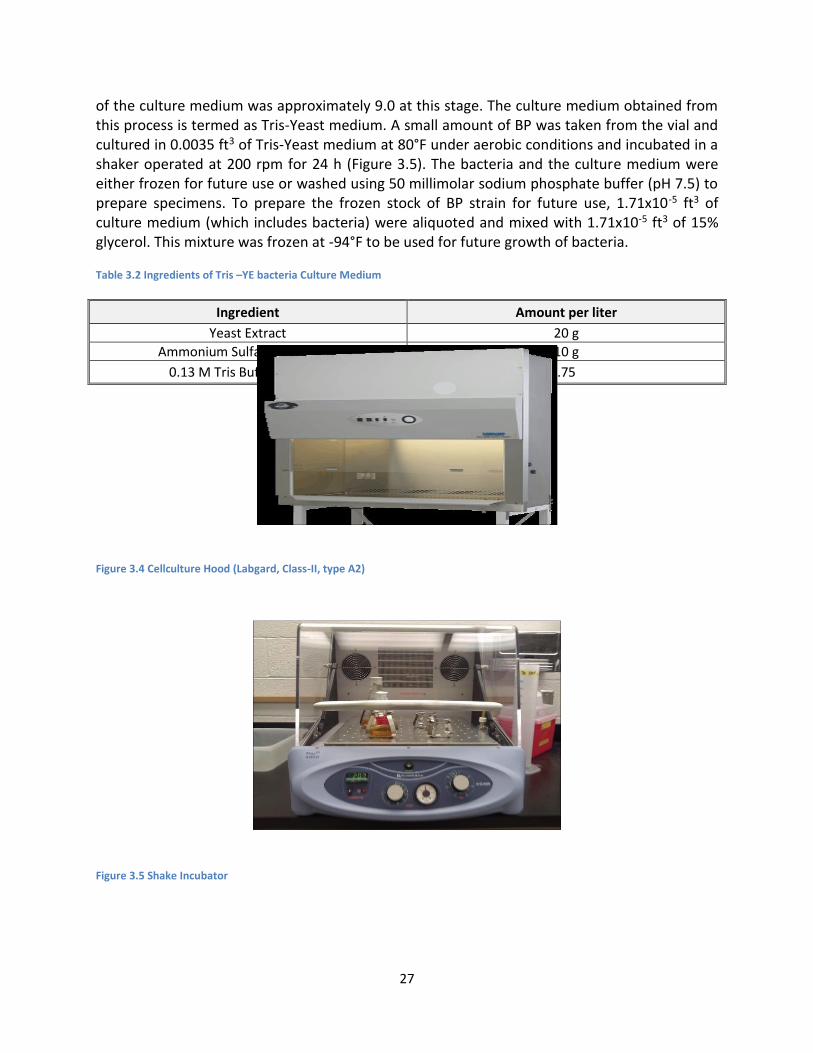
A growth medium (Tris-YE) was used for stock and pilot cultures of B. pasteurii. This medium was prepared following ATCC Medium 1376 protocol. Individual ingredients were autoclaved aseptically (free of micro-organisms) in a cell culture hood (Figure 3.4) and combined afterwards to avoid precipitation of ingredients. Each ingredient was mixed in 0.01059 ft3 of deionized water and autoclaved. In the autoclave, a high pressure stream of 2.9 psi/min was applied at 249.8°F for roughly 90 minutes, depending on the size of the loads and the contents. Then, the autoclaved ingredients were cooled at 122-131°F and aseptically combined. The pH
27
of the culture medium was approximately 9.0 at this stage. The culture medium obtained from this process is termed as Tris-Yeast medium. A small amount of BP was taken from the vial and cultured in 0.0035 ft3 of Tris-Yeast medium at 80°F under aerobic conditions and incubated in a shaker operated at 200 rpm for 24 h (Figure 3.5). The bacteria and the culture medium were either frozen for future use or washed using 50 millimolar sodium phosphate buffer (pH 7.5) to prepare specimens. To prepare the frozen stock of BP strain for future use, 1.71x10⁻⁵ ft3 of culture medium (which includes bacteria) were aliquoted and mixed with 1.71x10⁻⁵ ft3 of 15% glycerol. This mixture was frozen at -94°F to be used for future growth of bacteria.
Table 3.2 Ingredients of Tris –YE bacteria Culture Medium
Figure 3.4 Cellculture Hood (Labgard, Class-II, type A2)
Figure 3.5 Shake Incubator
Ingredient Amount per liter
Yeast Extract 20 g
Ammonium Sulfate, (NH4)2SO4 10 g
0.13 M Tris Buffer (pH 9.0) 15.75

28
The culture medium obtained after 24 hours of shaking was poured into a container and centrifuged at 4,000 rpm for 15 minutes to harvest bacterial cell pellets. These cell pellets were then washed twice with a 50 millimolar sodium phosphate buffer solution of pH 7.5 containing 8.2 g (0.289 oz.) of sodium phosphate per 0.001 m3 (0.035 ft3) of water in order to eradicate the effect of culture media ingredients on soil samples. The final cell pellets were then suspended in phosphate buffer and adjusted to obtain the desired optical density using a spectrophotometer (Figure 3.6). This bacterial suspension was used for preparing specimens. Optical density 0.6 is considered in the present study.
Figure 3.6 Spectrophotometer
1.1.1.1 Mutation of Bacteria
B. Pasteurii grows well at an optimum pH of 9.0 and also has the capability to produce endospore. An endospore is a dormant form of the cell that endures extreme environmental conditions. However, a high pH increases osmotic pressure of, which reduces the survivability of bacteria and minimizes urease activity. Achal et. al. (2009) investigated and found that ultra violet (UV) irradiation of BP not only increased the efficiency of this bacterium to grow at high pH, but also increased urease activity for more calcite formation.
It has been found that UV light is lethal and mutagenic in a variety of organisms including bacteria (Auerbach 1976, Witkin 1976). It is generally accepted that exposing bacteria to UV irradiation results in DNA mutation by changing its DNA structure, which allows bacteria to survive under adverse conditions (Miguel & Tyrrell 1983).
To obtain mutated bacteria, the BP was cultured in the regular growth medium as described previously. After 24 h of incubation, this bacterial culture was exposed to UV irradiation using a Philips 20W germicidal lamp for 20 min. According to Achal et al. (2009), a typical survival rate is less than 10%. A small portion (1 mL) of irradiated bacteria culture was randomly selected and transferred to a 100 mL of Tris-YE media to grow the MB for 48 h in a shaker operated at 200 rpm and 86 °F under aerobic conditions. To minimize reverse mutation, higher pH is required. Therefore, 4 molar sodium hydroxide (NaOH) was added to Tris-YE medium to

29
increase pH from 9.0 to 10.5. This process was repeated three times and each time samples were randomly selected from immediate previous culture of MB. The purpose of culturing MB several times was to make sure that MB is incapable of mutation reversal. Similar to BP, MB were frozen for future use or washed with phosphate buffer for immediate sample preparation.
3.3 Sample Preparation with Bacteria
Traditionally, the water content is varied to develop dry density and moisture content relationship for determining optimum moisture content. The strength and resilient modulus tests are performed by preparing specimens at the determined optimum moisture content. Since specimen preparation process at optimum moisture content has been standardized, the sample preparation process for soils without bacteria will not be discussed herein. The process of introducing bacteria, bacteria curing medium, and drying of soil is further discussed in the following sections.
3.3.1 Sodium Phosphate Buffer
Since bacteria cannot survive in water, due to difference in osmotic pressure, a sodium phosphate buffer is proposed to be used for introducing bacteria in the soil. Sodium phosphate buffer (SPB) of pH 7.5 was used in the specimens. This buffer contains 8.2 g of Sodium Phosphate (Na3PO4) per liter of distilled water. The sodium phosphate buffer is similar to the one used for washing of bacteria after growth or mutation.
3.3.2 Urea Calcium Chloride Medium
Since bacteria needs nutrients for survival that in turn leads to calcite precipitation, nutrients for bacterial survival are provided through urea calcium chloride medium (Halder, 2012). Table 3.3 contains ingredients for Urea-CaCl2 medium per liter of distilled water. Chemicals used for Urea-CaCl2 medium are Urea (NH2CONH2, Sigma Aldrich; product no.U5378), Calcium Chloride (CaCl2.2H2O, Sigma Aldrich; product no.C5080), Nutrient broth (Sigma Aldrich; product no.S4681), Ammonium Chloride (NH4Cl, Sigma Aldrich; product no.A0171), and Sodium bi-carbonate (NaHCO3, Sigma Aldrich; product no.S5761).
3.3.3 Sample Preparation
The laboratory evaluation of soil samples prepared with and without bacteria required a standard sample size; therefore, 4x8 in. cylindrical size was selected for evaluating the influence of bacteria-treatment on strength and modulus. The specimen preparation process for bacteria-treated samples required use of sodium phosphate buffer as well as urea calcium chloride medium, therefore, a procedure was developed and is discussed in the following paragraphs.
Table 3.3 Composition of Urea Calcium Chloride Medium
Chemicals Amount per liter
Nutrient Broth 3 g
Urea 20 g
Sodium Bicarbonate 2.12 g

30
Ammonium Chloride 10 g
Calcium Chloride 3.7 g
To minimize lysing of bacteria during mixing, the bacteria is mixed with sodium phosphate buffer solution. The mutated bacteria (MB) sample, obtained in section 3.2.2.2, is placed in an autoclaved container. The sodium phosphate buffer is then added to the sample and optical density (OD) of the solution is determined with the help of spectrophotometer. The buffer quantity is increased until OD of 0.6 is reached (Halder, 2012). This sodium phosphate buffer bacterium solution (SPBS) is then mixed with the soil (Figure 3.7a) using standard laboratory trowel. The amount SPBS selected was 1 to 2% less than the optimum moisture content as suggested by Li (2013). The purpose of using less than optimum moisture content was to make sure soil is not fully saturated as it will reduce oxygen availability for the bacterial survival while ensuring enough bacterial solution is present to cover the soil sample.
The soil mixed with SPBS was then placed inside a 6x12 in. cylindrical mold with holes at the bottom. A 2 in. aggregate layer was placed at the bottom as well as at the top of bacteria mixed soil. The purpose of the holes as well as the aggregate layer was to make sure that the urea calcium chloride medium can be easily provided to the soil as well as can be drained out of the soil. After placement of soil and aggregate layer, the urea calcium chloride medium was allowed to flow at a fixed rate using pipette. The rate of flow of 120 mL/hour was maintained as proposed by Montoya (2012). A rate of flow less than the mentioned amount will not be enough for bacterial survival while a higher rate will increase moisture content of the soil and reduce oxygen needed for bacterial survival. Additionally, bacteria lyse within two days (Lee et al. 2013) after mixing, therefore, there was not an additional benefit of providing nutrient to the soil for more than two days. Thus, urea calcium chloride medium was provided for two days at the rate of 120 mL/hour. After two days of bacteria-treatment, the soil is taken out of the cylindrical mold and is shown in Figure 3.7b. A comparison between Figures 3.7a and 3.7b suggests that the moisture content of bacteria-treated sample is higher. After bacteria-treatment, the samples were taken out of the mold and placed inside an oven maintained at 212 °F for a day (Li 2013). The drying process allowed identification of calcite deposition and also to make sure bacteria has lysed (Figure 3.8). The dried samples were crushed and again tested, as specified in Table 3.1.
3.4 Macro Level Laboratory Tests
Since most of the tests listed in Table 3.1 are standard, they are not discussed herein. Even though standardized, the free-free resonant column (FFRC) test is not frequently used, therefore, a brief description is included in Appendix A. In FFRC testing, the specimen is impacted with a hammer, and the resonant frequency associated with the standing waves within the specimen is measured. The resonant frequency along with the length of the specimen can be used to determine the seismic modulus (ASTM C215). For this test to be effective, a specimen with a length-to-diameter ratio of at about 1.5 to 2 is required.

31
3.5 Micro Level Laboratory Tests
To verify results of macro test results and to identify presence of calcite micro level tests were
performed. Investigation of different micro-structure characteristics such as elemental analysis
of materials were performed using X-ray diffractometer (XRD) and scanning electron
microscopy (SEM).
Figure 3.7 Bactria-Treatment of Soil
Figure 3.8 Calcite Deposition (Oven Dried Soil)
3.5.1 XRD Analysis
X-rays are electromagnetic radiation of wavelength varying from 0.1 Å to 100 Å. For diffraction
application, short wavelength X-rays, also called hard X-rays (0.1 Å to few Å), are used
(Introduction to X-ray diffraction 2011). X-ray diffraction is a non-destructive technique for
characterizing the crystalline material. An X-ray beam, produced by the X-ray tube is directed
towards the sample. When the beam strikes the sample, diffraction occurs (Figure 3.9)
according to Bragg law (ASM Handbook) which is as follows:
λ=2d Sinθ (3. 1)
Where d is the inter-planar spacing, θ is the scattering angle, λ is the wavelength of X-ray and n
is an integer. Bragg condition is also the condition for constructive interference. Bragg law is
a) Mixed with SPBS b) Two Day Bacteria Treatment

32
satisfied by varying the angle θ. The diffraction pattern is usually recorded as intensity versus
diffraction angle 2θ. The peak positions in the diffraction pattern are directly related to d and
the peak intensity depends on the atom in the diffracting plane.
Figure 3.9 Schematic of X-ray Diffraction
Micro-structural characterization of the bacteria treated soil samples were investigated using
Bruker D8 Discover advance XRD (Figure 3.10). Cu Kα radiation of wavelength λ=1.5406 Å was
used to analyze soil using 0.2 mm slit in a scanning range of 10-90° in 2θ scale at a rate of
5°/min.
Figure 3.10 Bruker D8 X-ray Diffractometer

33
3.5.2 Scanning Electron Microscopy
SEM uses electrons instead of light to produce an image. The schematic of SEM is shown in
Figure 3.11. An electron beam is produced by the electron gun. The beam travels through the
microscope which is kept in a vacuum. Electromagnetic lenses (condenser and objective) are
used to focus the beam onto the sample surface. The interaction of the electron beam and the
sample surface causes emission of electrons (secondary, back-scatter and auger) and X-rays.

34
Figure 3.11 Schematic of Scanning Electron Microscope

1
Secondary electrons are detected by the detector and converted to a signal which produces the
final image. The resolution of SEM image is very high (1-20 nm) compared to optical microscope
because the wavelength of electron beam is extremely small (Dmitri 2011). Backscattered
electron can be detected to produce backscattering image which is useful for contrasting
sample area having different chemical compositions.
Microstructure of fragment of the different soil samples was investigated using Hitachi Table
Top SEM TM-1000 (Figure 3.12). Images were taken at 3kV or 7 kV to reduce the effect of
charging and Energy Dispersive X-ray Spectroscopy (EDS) analysis was performed using Genesis
Spectrum Version-6.04 software at 20 kV.
Figure 3.12 Hitachi TM-1000 Scanning Electron Microscope

2
4. RESULTS AND DISCUSSION
The bacteria-treatment procedure developed in the previous chapter was used for preparing
soil samples for evaluating influence of bacteria-treatment on mechanical properties. In
addition, a portion of samples were collected to perform micro level testing using XRD and
SEM.
4.1 Macro Level: Laboratory Tests
The three soil types selected for evaluation were first classified as per AASHTO soil classification
system. Additionally, their mechanical properties like unconfined compressive strength,
resilient modulus, and seismic modulus (FFRC testing) were evaluated. Since maximum grain
size of selected soils was less than 4 mm, it was decided to use 4by8 in. cylindrical specimens
for evaluation of mechanical property in order to minimize amount of bacteria needed for the
treatment. Similar tests were performed on soil specimens after bacteria-treatment. To
quantify the influence of bacteria-treatment on desired parameter, three specimens were
tested to evaluate mechanical properties and obtained average as well as standard deviation
are shown in Table 4.1 while standard deviations are shown in bracket. The bacteria-treated
samples were oven dried and crushed before performing classification or mechanical property
evaluation.
Table 4.1 Soil Classification and Mechanical Property Test Results
Tests Soil 1 (Silt) Soil 2 (Sand) Soil 3 (Clay)
Before
Treatment After
Treatment Before
Treatment After
Treatment Before
Treatment After
Treatment
Liquid Limit, % 23.4 NP 14.5 NP 40.0 32.7
Plastic Limit, % 13.6 NP NP NP 18.8 21.0
Plasticity Index, % 9.8 NP NP NP 15.2 11.7
Maximum Dry Density, lb/ft3
125.0 124.5 137.5 138.0 121.4 87.0
Soil Classification (AASHTO)
A-2-4 A-2-4 A-1-b A-1-b A-2-6 A-2-6
Optimum Moisture Content, %
16.4 15.2 9.8 9.2 20.0 18.5
Unconfined Compressive Strength,
psi
14.8 15.4 24.8 26.3 22.0 21.6
4.110 3.431 3.296 4.759 4.069 3.637
Resilient Modulus, psi 11.6 12.8 14.6 25.0 7.5 11.5
3.724 4.211 5.854 8.475 1.403 2.691
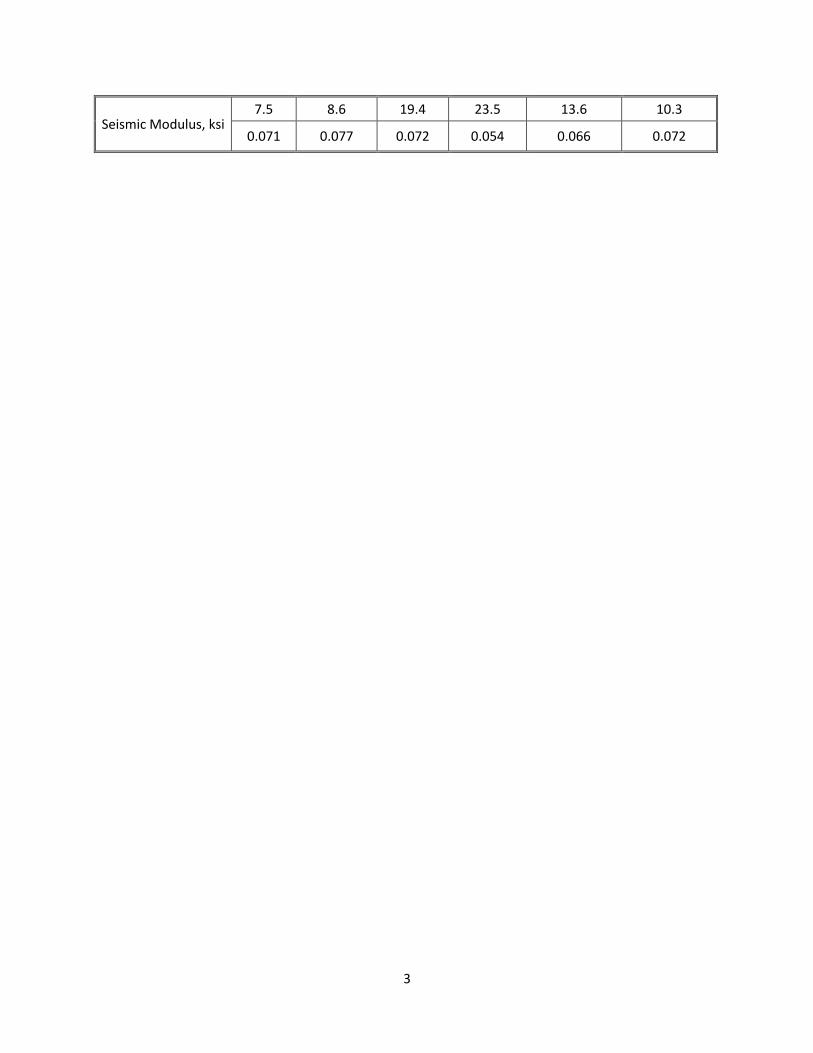
3
Seismic Modulus, ksi 7.5 8.6 19.4 23.5 13.6 10.3
0.071 0.077 0.072 0.054 0.066 0.072

4
The sieve analysis and measured Atterberg limits suggested that evaluated soil types are sandy,
clayey, and silty. As per AASHTO soil classification system, the soils can be classified as A-1-b, A-
2-6, and A-2-4, respectively. Although gradation (Figure 4.1) and plasticity of soils slightly
changed after treatment, the change was not significant enough to influence soil classification.
Although the plasticity index of silty soil was 9.8 before treatment, the soil became non plastic
after treatment. Although plasticity index of clay reduced slightly (from 15.2 to 11.7), it was not
enough to make soil non-plastic.
Figure 4.1 Influence of Bacteria-Treatment on Gradation
The influence of bacteria-treatment on moisture density curve (Figures 4.2 through 4.4) was
minimal for sandy and silty soils while it was significant for clayey soil. The maximum dry
density of sandy and silty soils were similar before and after treatment, however, maximum dry
density of clayey soil changed from 121.4 to 87 lb/ft3 after treatment. In terms of optimum
moisture content, all three soils required less moisture to attain maximum dry density. An
explanation could not be found for significant drop in dry density of clayey soil and needs to be
further explored in future research.
The unconfined compressive strength (UCS) results are shown in Figures 4.5 through 4.8. The
test results suggest a slight increase in UCS of sandy soils but no influence on silty or clayey soils
strength (Figure 4.5). The standard deviation of measured UCS was within 3.25 to 4.75 psi. The
stress strain curve of UCS test for each soil is shown in Figures 4.6 through 4.8. The figures also
show a slight increase in strength of sandy soil. Additionally, the brittleness of clayey soil
increased after bacteria-treatment (Figure 4.8) while sandy as well as silty soils brittleness
reduced or remained the same after bacteria-treatment. Although dry density of clayey soil
reduced significantly, the drop in UCS of soil was not that apparent.
The resilient modulus test results are shown in Figure 4.9. The results indicate that resilient
modulus of all three soils increased after bacteria-treatment. The increase was significant (more
0
20
40
60
80
100
0.010.1110
% P
assi
ng
Sieve size mm
Gradation before & after bacteria treatment (Silt)
before treatment
After treatment
0
20
40
60
80
100
0.010.1110
% P
assi
ng
Sieve Size mm
Gradation before & after bacteria treatment(Sand)
before treatment
after treatment

5
than 50%) for sandy and clayey soil while it was less significant for silty soil (less than 5%). The
standard deviation of measured resilient modulus was within in the range of 1.4 to 4.2 psi for
silty and clayey soil while it was higher for sandy soil (5.8 to 8.5 psi). The increase in resilient
modulus suggest that the soil will exhibit less of permanent deformation during service life of
pavement under repeated traffic loading. Also, the influence of lower dry density of clay on
resilient modulus was insignificant.
Figure 4.2 Moistue Density Curve of Silty Soil
60
70
80
90
100
110
120
130
140
0.00% 5.00% 10.00% 15.00% 20.00% 25.00%
Dry
De
nsi
ty,
lb/f
t 3
Moisture Content, %
Untreated
Treated
60
70
80
90
100
110
120
130
140
0.00% 5.00% 10.00% 15.00% 20.00% 25.00%
Dry
De
nsi
ty,
lb/f
t3
Moisture Content, %
untreated
Treated

6
Figure 4.3 Moistue Density Curve of Sandy Soil
Figure 4.4 Moistue Density Curve of Clayey Soil
60.00
70.00
80.00
90.00
100.00
110.00
120.00
130.00
140.00
0.00% 5.00% 10.00% 15.00% 20.00% 25.00%
Dry
De
nsi
ty,
lb/f
t3
Moisture Content, %
Untreated
Treated
0
5
10
15
20
25
30
UC
S (
ksi)
Untreated Treated
Sand ClaySilt

7
Figure 4.5 Influence of Bacteria-Treatment on Unconfined Compressive Strength
Figure 4.6 Influence of Bacteria-Treatment on Stress-Strain Relationship for Silty Soil
0
2
4
6
8
10
12
14
16
18
0 0.01 0.02 0.03 0.04 0.05 0.06 0.07 0.08
Stre
ss, p
si
Strain, in/in
Untreated
Treated
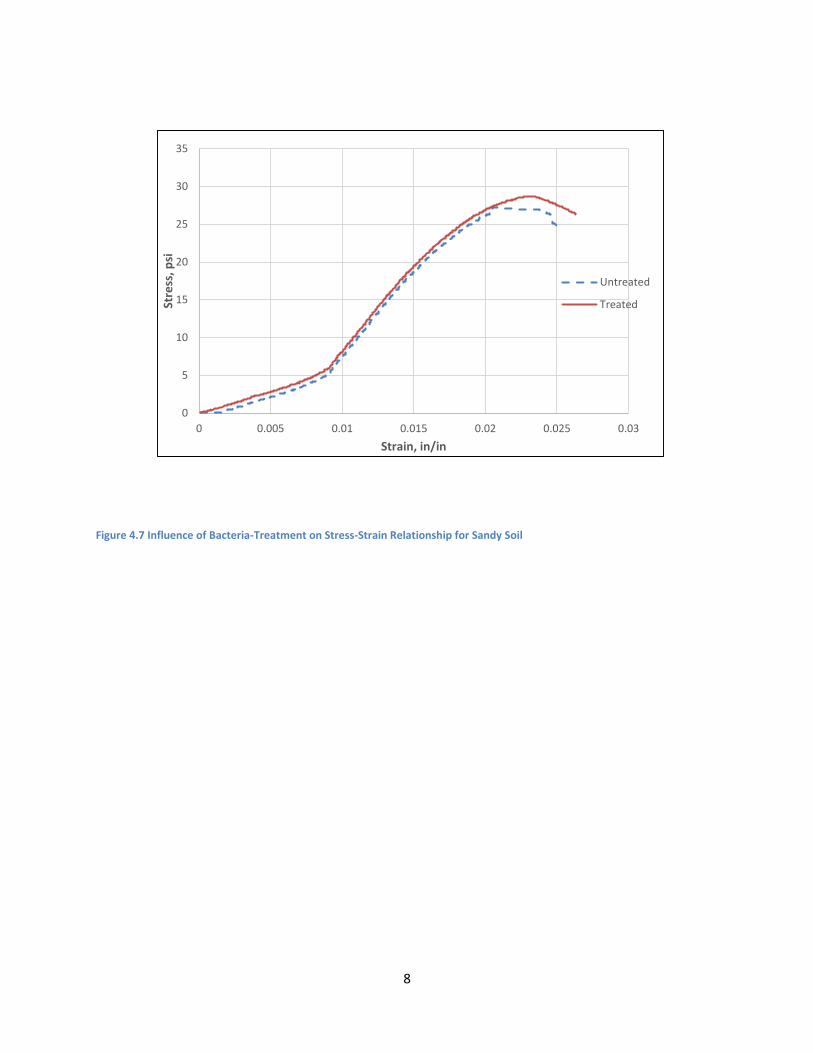
8
Figure 4.7 Influence of Bacteria-Treatment on Stress-Strain Relationship for Sandy Soil
0
5
10
15
20
25
30
35
0 0.005 0.01 0.015 0.02 0.025 0.03
Stre
ss, p
si
Strain, in/in
Untreated
Treated

9
Figure 4.8 Influence of Bacteria-Treatment on Stress-Strain Relationship for Clayey Soil
Figure 4.9 Influence of Bacteria-Treatment on Resilient Modulus
0
5
10
15
20
25
0 0.01 0.02 0.03 0.04 0.05
Stre
ss, p
si
Strain, in/in
Untreated
Treated
0
5
10
15
20
25
30
Re
silie
nt
Mo
du
lus
(p
si)
Untreated Treated

10
The FFRC test results are shown in Figure 4.10. The seismic modulus of sandy soil increased
significantly from 19.4 to 23.5 ksi after bacteria-treatment. Additionally, the seismic modulus of
silty soil slightly increased from 7.5 to 8.6 ksi after bacteria treatment. However, seismic
modulus of clayey soil decreased from 13.6 to 10.3 ksi due to bacteria-treatment. The standard
deviation of measured resilient modulus was less than 1 ksi for all the soil types.
Overall, the test results suggest that the bacteria-treatment improved sandy soil mechanical
properties significantly while its influence on silty and clayey soil was mixed. One of the factor
leading to mixed behavior can be attributed to the process of preparing soil samples. The
bacteria-treated soils were crushed and oven-dried before molding specimens for testing. The
main benefit of bacteria-treatment is that it fills up pores within the treated sample. The
crushing and drying of soil minimizes the benefit of pore clogging. Therefore, test setup needs
to be developed that treats soil on large scale which allows in-situ testing like California Bearing
Ratio (CBR) testing. The other alternative could be that cores can be extracted from large scale
sample and tested in the laboratory to identify influence of bacteria-treatment.
Figure 4.10 Influence of Bacteria-Treatment on Seismic Modulus
0
5
10
15
20
25
30
FFR
C (
ksi)
Untreated Treated

11
4.2 Micro Level: XRD Analysis
Small amount of crushed soil sample after bacteria-treatment was collected and dried at 100°C
and then analyzed using XRD. Cu Kα radiation of wavelength λ=1.5406 Å was used to examine
the fragment of soil in a scanning range 10-75° in 2θ scale at a scanning speed 5°/min in
continuous scan mode. XRD patterns obtained from two trials are presented in Figures 4.11 and
4.12. Calcite present in the sample is shown as a calcite peaks. Further evaluation and
comparison could not be performed due to equipment breakage.
Figure 4.11 X-Ray Diffraction Pattern of Sandy Soil Treated with Bacteria (Trial 1)
Calcite peaks

12
4.3 Micro Level: SEM Analysis
Micro-structure analysis of untreated and treated bacteria soils was performed using Hitachi
TM-1000 SEM. SEM images were obtained using 3kV of energy and at different magnification
level. The advantage of using high-resolution low voltage imaging is that it allows observation
of compositional differences as well as precise location of nanoparticles within the individual
pores.
Figure 4.12 X-Ray Diffraction Pattern of Sandy Soil Treated with Bacteria (Trial 2)
The SEM images (Figure 4.13 – 4.18) indicate precipitation of calcite crystals over the soil
surface and from these images shape and distribution of the particles can be understood. Low
voltage analysis helps in reducing the charging effect of the scanned area and also reduces local
radiation damage of the sample induced by energetic electrons. The images were obtained at
Calcite peaks

13
specific magnification and at different locations. From the SEM images, the uniform distribution
of the calcite crystals over the soil surface is confirmed.
SEM images for untreated sandy soil are shown in Figure 4-13 while for bacteria treated sandy
soil is shown in Figure 4-14. Both the images were obtained at similar magnification levels.
Comparing the images of treated and untreated soils, it is observed that, there is no formation
of any crystal like structure in untreated soil even when the magnification level was increased
from 3,000 to 5,000. While for treated soil, at 3,000 magnification level a layer of calcite
crystals was observed over the soil surface while an increase in magnification level to 5,000
suggested a a rhombohedral calcite structure. An increase in magnification level revealed the
distribution of calcite over the soil surface.
Figure 4-13 SEM Images of Untreated Sandy soil
Figure 4-14 SEM Images of Treated Sandy Soil
Soil
Surface
Calcite
Calcite smooth
structure
a) 3000x b) 5000x
a) 3000x b) 5000x

14
The SEM images for untreated silty soil (Figure 4-15) and treated silty soil (Figure 4-16) also
exhibited presence of calcite precipitation similar to the sandy soil.
Figure 4-15 SEM Images of Untreated Silty soil
Figure 4-16 SEM Images of Treated Silty Soil
SEM images of untreated clay (Figure 4-17) and treated clay (Figure 4-18), did not show much
difference. This may have occurred due to less formation of calcite in clayey soil. From SEM
images, we can see the formation of calcite but the distribution is not uniform and also at
higher magnification the crystal structure is not clear.
Calcite smooth
structure Soil
Surface
Calcite
a) 3000x b) 6000x
a) 3000x b) 6000x

15
Figure 4-17 SEM Images of Untreated Clayey Soil
Figure 4-18 SEM Images of Treated Clayey Soil
The micro level analysis confirmed the results obtained from macro level analysis indicating that the
calcite precipitation is more dominant in sandy and clayey soils while minimal precipitation could be
observed in clayey soils. One of the explanation could be that porosity of soil is important for providing
nutrient to the bacteria for better precipitation of calcite.
a) 3000x b) 5000x
Calcite smooth
structure
Soil
Surface
Calcite
a) 3000x b) 5000x

16
5. SUMMARY, CONCLUSIONS AND RECOMENDATION
The main purpose of this project was to evaluate the feasibility of soil stabilization through
bacteria-treatment of the soils. The aerobic bacteria was used to increase the compressive
strength and stabilize the soil through calcite precipitation. Since, the whole process of urease
activity increases pH of the environment, the survivability of bacteria becomes an issue. To
survive in a high pH (around 12), the bacteria were mutated by exposing bacteria to ultraviolet
rays. The advantage of mutation is that the bacteria can withstand higher pH as well as forms
more calcite than normal bacteria. The soil with and without bacteria-treatment was tested to
evaluate the influence of treatment.
Based on the analysis of test results, the following conclusions can be drawn:
1. The bacteria induced calcite precipitation was observed and verified using micro level
analysis.
2. Bacteria treatment of sandy and clayey soil resulted in enhancing compressive strength
as well as modulus. However, clayey soils did not exhibit significant improvement in
mechanical properties and could be attributed to the lower porosity of clay which
hinders in providing nutrient, thus, lower calcite precipitation.
3. XRD analysis of bacteria-treated samples displayed a larger calcite peak suggesting
calcite precipitation.
4. SEM investigation indicated full growth of calcite crystal in bacteria-treated samples and
presence of more calcium in those samples.
Although the research was able to identify increase in strength due to MICP, the following
needs to be studied further before field implementation:
In addition to strength, the soil properties such as compressibility, hydraulic
conductivity, workability, swelling potential, durability, and volume change tendencies
may be altered due to bio-cementation and needs to further evaluated.
Even though sandy and silty soils exhibited enhancement in strength and modulus, the
clayey soil exhibited wither loss or minimal enhancement in measured mechanical
properties and needs to be investigated.
The soil stabilization at large scale needs to be evaluated to identify practicality of bio-
cementation.
Cost benefit analysis needs to be performed to document benefits of bio-cementation.

17
6. REFERENCES
1. Achal, V., Mukherjee, A., Basu, P. C., and Reddy, M. S. (2009). “Strain improvement of
Sporosarcina pasteurii for enhanced urease and calcite production.” J. India Microbiol.
Biotechnol., 36, 981-988.
2. Adams, B. T., and Xiao, M. (2011). "Bioremediation of piping erosion in sand." ASCE Geo
Frontiers 2011: Adv. Geotech. Eng., 211, 4060-4069.
3. Auerbach C. (1976). “Mutation Research: Problems Results and Perspectives” Chapman
& Hall, London.
4. Bachmeier, K.L. (2002), “Urease activity in microbiologically induced calcite
precipitation,” Journal of Biotechnology, pp. 171-181.
5. Bazylinski D.A. and Frankel R.B. “Biologically Induced Mineralization by Bacteria.”
Reviews in Mineralogy and Geochemistry, 54, 2003, p. 95-114.
6. Belkova LN. “Biomineralization in natural environments: the effect of microorganisms
inhabiting hot spring water and biomats on mineral formation.” Geophys Res Abs, 2005,
p. 7.
7. Halder, B.K. “Sustainable Disposal of Brine.” M.S. Thesis, Department of Civil
Engineering, The University of Texas at El Paso, El Paso, Texas, August 2012.
8. Bright H. “Biosensors for the future.” Nav Res Rev., 1994, p 46-49.
9. Burne R. A. and Chen Y. M. “Bacterial ureases in infectious diseases.” Microbes and
Infection, 2, 2000, p. 533-542.
10. Castanier S., Le Métayer Levrel G. and Perthuisot J. “Ca-carbonates precipitation and
limestone genesis.” The microbiogeologist point of view, Sedimentary Geology, 126,
1999, p 9-23.
11. DeJong, J. T., Mortensen, B. M., Martinez, B.C., and Nelson, D. C. (2010). "Bio-mediated
soil improvement." Ecological Engineering, 36(2), 197-210.
12. Dick, J.; De Windt, W.; De Graef, B.; Saveyn, H.; Van der Meeren, P.; De Belie, N.;
Verstraete, W. “Bio-deposition of a calcium carbonate layer on degraded limestone by
Bacillus species.” Biodegradation 17, 2006, p. 357–367.
13. Douglas S. and Beveridge T. J. “Mineral formation by bacteria in natural microbial
communities.” FEMS Microbiol, Ecol. 26, 1998, p 79-88.
14. Faibish R.S., Elimelech M. and Cohen Y. “Effect of interparticle electrostatic double layer
interactions on permeable flux decline in crossflow membrane filtration of colloidal
suspensions: an experimental investigation.” J. Colloid Interf. Sci. 204, 1998, p.77–86.
15. Friedrich Widdel Theory and Measurement of Bacterial Growth. 2010.
16. George D.O., Okwadha and Jin Li. ‘Optimum conditions for microbial carbonate
precipitation.” Chemosphere 81, 2010, p. 1143-1148.

18
17. Ghosh, P.; Mandal, S.; Chattopadhyay, B. D.; Pal, S. “Use of microorganism to improve
the strength of cement mortar.” Cem. Concr. Res. 35, 2005, p. 1980-1983.
18. Hamdan, N., Kavazanjian, E. Jr, Rittmann, B. E., and Karatas, I. (2011). "Carbonate
mineral precipitation for soil improvement through microbial denitrification." ASCE Geo
Frontiers 2011: Adv. Geotech. Eng., 211, 3925-3934.
19. Jones, B.; Renaut, R.W.; and Rosen, M.R. “Biogenecity of silica precipitation
aroundgeysers and hot springs vents.” 1997, p. 88–104.
20. Jonkers, H. M., Thijssen, A., Muyzer, G., Copuroglu, O., and Schlangen, E., (2010).
"Application of bacteria as self-healing agent for the development of sustainable
concrete." Ecological engineering, 36(2), 230-235.
21. Kaltwasser H., Kramer J. and Conger W.R. “Control of urease formation in certain
aerobic bacteria.” Arch. Microbiol. 81. 1972, p. 178-196.
22. Lackner, K. S.; Wendt, C. H.; Butt, D. P.; Joyce, E. L. Jr.; Sharp, D.H. “Carbon dioxide
disposal in carbonate minerals.” Energy, 20(11), 1995, p.1153-1170.
23. Li, S. (2013). "A laboratory study of the effects of bio-stabilization on geomaterials." M.S.
thesis, Iowa State University, Ames, Iowa.
24. Lee, M.L., Ng, W.S., Tanaka, Y. (2013), "Stress-deformation and compressibility
responses of bio-mediated residual soils ". Ecological Engineering, 60, 142-149.
25. Martell, A.E.; Smith, R.M. “Critical Stability Constants.” Vol.4: Inorganic Complexes.
Plenum Press, New York, 1976.
26. Merz MUE. “The biology of carbonate precipitation by cyanobacteria.” 1992, p. 81-102.
27. Meyer, F. D., Bang, S., Min, S., Stetler, L.D., and Bang, S.S. (2011). "Microbiologically-
Induced Soil Stabilization: Application of Sporosarcina pasteurii for Fugitive Dust
Control." Proceedings of the Geo Fronteirs Conference, ASCE, Reston, VA, 4002-4011.
28. Miguel A.G. and Tyrrell R.M. “Induction of oxygen-dependent lethal damage by
monochromatic UVB (313) radiation: strand breakage, repair and cell death.” Carciogenesis,
4. . 1983, p.375-380.
29. Montoya, B.M.(2012), "Bio-Mediated Soil Improvement and the effect of cementation
on the behavior, improvement and performance of Sand". PhD Dissertation, University
of California, Davis, California.
30. Muynck W.D., Verbeken K., Belie N.D. and Verstraete W. (2010b). “Influence of urea and
calcium dosage on the effectiveness of bacterially induced carbonate precipitation on
limestone”. Ecological Engineering 36, pp.99-111.
31. Nemati M. and Voordouw G. “Modification of porous media permeability using calcium
carbonate produced enzymatically in situ.” Enzyme Microb. Technol. 33. 2003, p. 635–
642.
32. Newnham RE. “Molecular mechanisms in smart materials.” Mater Res Soc Bull. 1997, p
20–33.

19
33. Park, Sung-Jin; Yu-Mi, Park; Young Chun, Woo; Jung Kim, Wha; Youl Ghim, Sa. “Calcite-
Forming Bacteria for Compressive Strength Improvement in Mortar.” J. Microbiol.
Biotechnol. (2010), 20(4). 2009, p.782–788.
34. Park, S. J., Park, Y. M., Chun, W. Y., Kim, W. J., Ghim, S. Y. (2010). “Calcite-Forming
Bacteria for Compressive Strength Improvement in Mortar.” J. Microbiol. Biotechnol.,
20(4), 782–788.
35. Ramakrishnan, V., Panchalan, R. K., and Bang, S. S. (2005). "Improvement of concrete
durability by bacterial mineral precipitation." In Proc. ICF, 11, Torino, Italy, 357-67.
36. Ramachandran SK, Ramakrishnan V and Bang SS. “Remediation of concrete using
microorganism.” ACI Material Journal; 98(1). 2001, p.3-9.
37. Roh, Y.; Phelps, T. J.; McMillan, A. D.; Lauf, R. J. “Utilization of biomineralization
processes with fly ash for carbon sequestration.” Washington D.C: DOE-AC05-
00OR22725, U.S. Department of Energy, 2001.
38. Silver S., Toth K. and Scribner H. “Facilitated transport of calcium by cells and subcellular
membranes of Bacillus subtilis and Escherichia coli.” J. Bacteriol. 122. 1975, p. 880-885.
39. Skinner WCH and Jahren HA. “Biomineralization.” Treatise on Geochemistry,vol. 8.
Elsevier; 2003, p. 117–84.
40. Travis J. “Microchips covered with DNA emerge as powerful research tools.” Sci News.
1997, p 144-146.
41. Van der Ruyt, M., and Van der Zon, W. (2009). "Biological in situ reinforcement of sand
in near-shore areas." Proceedings of the ICE-Geotechnical Engineering, 162(1), 81-83.
42. Van Paassen, L. A., Daza, C. M., Staal, M., Sorokin, D. Y., Van der Zon, W., and
Loosdrecht, M. C. (2010). "Potential soil reinforcement by biological denitrification."
Ecological Eng., 36(2), 168-175.
43. Volodymyr, I. and Cheu, J. (2008), “Applications of microorganisms to geotechnical
engineering for bioclogging and biocementation of soil in- situ,” Environmental Science
Biotechnology, 139-153.
44. Whiffin, V. S., Van Paassen, L. A., and Harkes, M. P. (2007). "Microbial carbonate
precipitation as a soil improvement technique." Geomicrobiology Journal, 24(5), 417-
423.
45. Witkin E.M. “Ultraviolet mutagenesis and inducible DNA repair in Escherichia coli.”
Bacteriol. Rev. 40. 1976, p. 869-907.
20
7. APPENDIX A
The Free-free Resonant Column (FFRC) tests had been developed for measuring the seismic
modulus of Portland cement concrete but have been found suitable for asphalt concrete
specimens as well. The FFRC test is performed by generating and measuring the velocity of
wave propagation in a medium. When a cylindrical specimen is subjected to an impulse load at
one end, seismic energy over a large range frequency will propagate within the specimen.
Depending on the dimensions and the density of the specimen, energy associated with one or
more frequencies are trapped and resonate as they propagate within the specimen. The goal
with this test is to determine these resonant frequencies. Since the dimensions of the
specimen are known, if one can determine the resonant frequencies, one can readily determine
the modulus of the specimen using principles of wave propagation in a solid rod.
In general, the impulse load generates two types of wave energy: longitudinal and shear. Once
the longitudinal resonant frequency, fL, and the length of the specimen, L, are known, the
laboratory Young's modulus, Elab, can be found from the following relation:
Elab =ρ (2 fL L)2 (A.1)
where ρ is mass density. The mass density is calculated from:
ρ = M /(L As) (A.2)
where As is the cross-sectional area of the specimen. Poisson’s ratio, ν, is determined from
1
15.0
(A.3)

21
where
D
L
S
L Cf
f2
(A.4)
with CL/D being a correction factor when the length-to-diameter ratio differs from 2 and
fs=shear (or torsional) resonant frequency.
One of the advantages of the two methods is that they provide properties that can also be
directly measured in the field with a nondestructive testing device called the Portable Seismic
Property Analyzer (PSPA).
The free-free resonant column setup was also used in the laboratory for determining the
seismic modulus of asphalt concrete and synthetic specimens. A simplified setup has been
developed at UTEP, as shown in Figure A.1 so that a test can be performed in less than 1
minute. The FFRC consists of a data acquisition system, an accelerometer, and an instrumented
hammer. The accelerometer is securely placed on one end of the specimen, and the other end
is impacted with the instrumented hammer. The signals from the load cell and accelerometer
are used to determine the resonant frequencies. The frequencies of the primary (compression)
wave and secondary (shear) wave are found with the help of the developed software that could
interpret the data from the sensors and presents it graphically (Figure A.2). The modulus of the
specimen is determined using principles of wave propagation by measuring the dimensions and
weight of the specimen.
To perform the FFRC test, the diameter, length and mass of the specimen are measured before
the specimen is placed on test stand. An accelerometer is attached to one end of the
specimen. A convenient way of attaching the accelerometer to the specimen is to use a
magnet. The specimen is struck mildly and rapidly with the instrument hammer at the opposite
end of the specimen. The test is repeated three times to obtain an average resonant
frequency.

22
Figure A.1 – Free-free Resonant Column Test Setup
Figure A.2 – P-wave and S-wave Generated by Using FFRC

1
CHAPTER 3

2
Biodeterioration of Construction Materials –
A General Overview
FINAL REPORT
February 2016
Submitted by: Farzana Atique
Graduate Student
Nii Attoh-Okine Professor
University of Delaware
Newark, DE 19716
External Project Manager
Alexander K Appea
In cooperation with
Rutgers, The State University of New Jersey And
State of Virginia Department of Transportation

3
And U.S. Department of Transportation Federal Highway Administration

4
Disclaimer Statement
The contents of this report reflect the views of the authors,
who are responsible for the facts and the accuracy of the
information presented herein. This document is disseminated
under the sponsorship of the Department of Transportation,
University Transportation Centers Program, in the interest of
information exchange. The U.S. Government assumes no liability for the contents or use thereof.

5
1. Report No.
Report # provided by Rutgers
2. Government Accession No. 3. Recipient’s Catalog No.
4. Title and Subtitle
Biodeterioration of Construction Materials – A General
Overview
5. Report Date
February 2016 6. Performing Organization Code
CAIT/University of Delaware 7. Author(s)
Farzana Atique Nii Attoh-Okine
8. Performing Organization Report No.
Report # provided by Rutgers
9. Performing Organization Name and Address
University of Delaware Newark, DE 19716
10. Work Unit No.
11. Contract or Grant No.
DCTR432139 12. Sponsoring Agency Name and Address 13. Type of Report and Period Covered
Final Report January 2014 - December 2015
14. Sponsoring Agency Code
15. Supplementary Notes
U.S. Department of Transportation/Research and Innovative Technology Administration
1200 New Jersey Avenue, SE
Washington, DC 20590-0001
16. Abstract
Developing a well balanced budget and expenditure program for any infrastructure
network requires predicting the rate of deterioration of the infrastructure and nature of
the changes in its physical, chemical and biological characteristics. The correct timing,
type and cost of maintenance and rehabilitation needs can therefore be estimated. For
the model to be useful for evaluating the primary options available in maintenance and
rehabilitation, it must show explicitly the primary effects of loads, age, distress and
biological effects on the structure. This will enable better trade-offs between the
intervention options of minimal maintenance at different periods and condition levels
to be made. During the service life of the infrastructure, natural aging, loads, and
damage of structure are caused by different physical, chemical and biological processes.
This report attempts to introduce the missing component of infrastructure
biodeterioration. The report presents a general overview and definitions only.
17. Key Words
Construction Materials; Bio deterioration; Infrastructure performance
18. Distribution Statement
19. Security Classification (of this report)
Unclassified 20. Security Classification (of this page)
Unclassified 21. No. of Pages
14 22. Price
Center for Advanced Infrastructure and Transportation
Rutgers, The State University of New Jersey
100 Brett Road
Piscataway, NJ 08854
T E C H NI C A L R E P OR T S T A NDA RD TI TLE P A G E
Form DOT F 1700.7 (8-69)

6
Acknowledgments
Alexander K Appea, Ph.D., P.E
Fredericksburg District Materials
87 Deacon Road
Fredericksburg, VA 22405

7
Table of Contents
1. DESCRIPTION OF THE PROBLEM ........................................................................................................... 1
1.1 DEFINITION OF BIODETERIORATION ............................................................................................. 1
1.2 CLASSIFICATION OF BIODETERIORATION ..................................................................................... 1
1.3 ENVIRONMENTAL CONDITIONS FOR ORGANISM GROWTH ......................................................... 2
1.4 EFFECTS OF BIODETERIORATION ON CONSTRUCTION MATERIALS .............................................. 3
1.4.1 WOOD ................................................................................................................................... 4
1.4.2 METAL ................................................................................................................................... 5
1.4.3 STONE .................................................................................................................................... 6
1.4.4 REINFORCED CONCRETE (RC) ................................................................................................ 6
1.4.5 CONCRETE ............................................................................................................................. 7
2. APPROACH ............................................................................................................................................ 8
3. METHODOLOGY .................................................................................................................................... 9
3.1 COUPLED DETERIORATION MODEL .............................................................................................. 9
3.2 TIME-DEPENDENT BIODETERIORATION RATE FUNCTION .......................................................... 10
4. FINDINGS ............................................................................................................................................. 14
5. CONCLUSION ....................................................................................................................................... 14
6. RECOMMENDATIONS.......................................................................................................................... 15
REFERENCES ................................................................................................................................................ 15

8
List of Figures
FIGURE 1. DAMAGE EFFECTS OF SOFT, WHITE, AND BROWN ROT ON WOOD STRUCTURE (SANCHEZ-SILVA AND
ROSOWSKY, 2008) .............................................................................................................. 4
FIGURE 2. PHENOMENOLOGICAL DECAY OF WOOD RESISTANCE AS A RESULT OF FUNGI (SANCHEZ-SILVA AND
ROSOWSKY, 2008) .............................................................................................................. 5
FIGURE 3. CORROSION CAUSED BY CONCENTRATION CELL FORMATION (SANCHEZ-SILVA AND ROSOWSKY, 2008) 6
FIGURE 4. CONCEPTUAL DESCRIPTION OF THE COUPLED MODEL FOR BIODETERIORATION, CHLORIDE INGRESS, AND
CRACKING OF CONCRETE STRUCTURES (BASTIDAS-ARTEAGA ET. AL., 2008) ....................................... 10
FIGURE 5. CONCEPTUAL MODEL OF BIODETERIORATION (BASTIDAS-ARTEAGA ET. AL, 2008) ........................ 11
FIGURE 6. (A) AGE MEMBERSHIP FUNCTIONS, (B) BIODETERIORATION RATE MEMBERSHIP FUNCTIONS (BASTIDAS-
ARTEAGA ET. AL, 2008) ...................................................................................................... 13
FIGURE 7. (A) SURFACE GENERATED IN FIS TYPE, (B) TIME-DEPENDENT BIODETERIORATION RATE FUNCTION
(BASTIDAS-ARTEAGA ET. AL., 2008). ..................................................................................... 14

9
List of Tables
TABLE 1. ORGANISMS INVOLVED IN DAMAGES AND DEFECTS OF BUILDING COMPONENTS (VIITANEN AND
SALONVAARA, 2001) ........................................................................................................... 3
TABLE 2. EFFECTS OF BACTERIA ON RC STRUCTURES (BASTIDAS-ARTEAGA ET AL., 2008) .............................. 7
TABLE 3. MECHANISMS OF BIODETERIORATION (SILVA AND NAIK 2013) .................................................. 8

1
DESCRIPTION OF THE PROBLEM
Civil infrastructure systems are critical assets for a country’s socioeconomic development. Designing and
maintaining infrastructure systems have become important issues due to the fact that many
infrastructures are aging and nearing the end of their useful life time frame. A comprehensive life-cycle
cost analysis should consider factors that can cause a structural system to perform unacceptably at any
point in its lifetime. This includes extreme events, such as earthquakes and hurricanes, or the
progressive and sustained loss of capacity caused by operational or environmental factors.
Biodeterioration of structural materials is an important component in causing continued loss of capacity
in structures. Even though the effects of biodeterioration on wood in an aggressive environment are
widely known, not much is known about the effects of biodeterioration on reinforced concrete and steel
components of infrastructure systems.
As with other civil infrastructure systems, developing a well-balanced budget and expenditure program
for a highway network requires predicting the rate of deterioration of the pavement and the nature of
the changes in its physical, chemical, and biological characteristics. For the model to be useful, it must
evaluate the primary effects of traffic, pavement strength, age, distress, and biological elements on the
structure.
For the model to be useful for evaluating the primary options available in maintenance and
rehabilitation, it must show explicitly the primary effects of traffic, pavement strength, age, distress, and
biological effects on the structure. This will provide better trade-offs between the intervention options
of minimal maintenance, patching, recycling, resurfacing, and other maintenance tasks.
1.1 DEFINITION OF BIODETERIORATION
A widely accepted definition of biodeterioration was proposed by Hueck (1968) as: “any undesirable
change in the properties of a material caused by the vital activities of organisms.” Similarly, Rose (1981)
defines biodeterioration as the process by which “biological agents (i.e., live organisms) are the cause of
the [structural] lowering in quality or value.”
1.2 CLASSIFICATION OF BIODETERIORATION
According to Gaylarde et al. (2003) biodeterioration can be classified into (Sanchez-Silva and Rosowsky,
2008):

2
1. Physical or mechanical: This encompasses all physical actions of organisms that contribute to a physical deterioration of the material. It is often referred to as the process by which live organisms disrupt the material structure by growth or by movement but do not use the material as food source.
2. Fouling or soiling (aesthetic): This is caused by the presence of organisms, their dead bodies, excreta, or metabolic products forming a microbial layer known as biofilm on a surface material. It is primarily associated with the microorganism causing unacceptable appearance but not affecting the material performance.
3. Chemical: (1) assimilatory and (2) dissimilatory. Assimilatory occurs when the organisms use the structural component as a source of food (i.e., carbon and/or energy source), thus modifying the properties of the material (e.g., degradation of fuels, metals). Dissimilatory occurs when the live organisms’ excreted waste products or other substances (e.g., H2S, FeS) adversely affect the material.
The common live organisms associated with biodeterioration of construction materials are as follows:
1. Marine borers (e.g., gribble and shipworms); 2. Insects (e.g., termites and wood-boring beetles); 3. Fungi (soft rots, white and brown rots), primary and secondary molds, stainers algae, and
lichens; and 4. Microorganisms (e.g., bacteria).
1.3 ENVIRONMENTAL CONDITIONS FOR ORGANISM GROWTH
The existence and growth of microorganisms require environmental conditions such as the availability of
water, light, oxygen, and nitrogen within an environment with appropriate temperature and pH.
The water requirement for microorganisms is expressed by the so-called water activity of the
environment (aw). The water activity is defined as: ln(aw)=−(ν⋅m⋅θ)/55.5; where ν =number of ions
formed by each solute molecule; m =molar concentration of solute; and θ =molar osmotic coefficient
(Rose 1981). Pure water has a value of aw =1.0, and this value decreases when solutes are dissolved in it.
Microorganisms can grow in media with 0.63<aw <0.99. It is known that bacteria require values of
0.93<aw <0.99, while yeast or molds grow in lower values of 0.88<aw <0.91.
Table 1 by Viitanen and Salonvaara (2001) shows how the humidity and moisture range and the
temperature range affect building components.

3
Table 2. Organisms involved in damages and defects of building components (Viitanen and Salonvaara, 2001)
Organism Damage/problem
type Humidity or moisture range (RH or MC %)
Temperature range ( ̊C)
Bacteria Biocorrosion of many different materials, smell, health problems
Wet materials RH>97%
ca -5 to +60
Mold fungi Surface growth on different materials and health problems
Ambient RH>75%, depends on duration, temperature, and species
ca -5 to +45
Blue stain fungi Blue stain of wood, permeability change of wood
Wood moisture content > 25-120%, RH >95%
ca -5 to +45
Decay fungi
Different types of decay in wood (soft rot, brown rot, or white rot), deterioration of other materials, strength loss of materials
Ambient RH>95%, MC >25-120%, depends upon duration, temperature, fungus and materials
ca 0 to +45
Algae and lichen
Surface growth of different materials outside or weathered material
Wet material, also nitrogen and low pH are needed
ca 0 to +45
Insects
Different type of damages in organic materials, surface failures or strength loss
Ambient RH >65% depends on duration, temperature, species, and environment
ca 5 to +50
1.4 EFFECTS OF BIODETERIORATION ON CONSTRUCTION MATERIALS

4
1.4.1 WOOD
Wood is the primary material used in residential construction in the US. The low durability of wood
construction is mainly caused by the lack of attention given to construction details, which can cause the
growth of microorganisms. Wood deterioration depends significantly on the presence of water.
Laboratory testing has shown that the optimal wood moisture levels for most decay fungi are between
40 and 80% (Scheffer, 1973). A oxygen concentration also increases the possibility of biodeterioration. In
addition to water and oxygen, nutrients are required for biological activity; this is closely related to the
ratio of carbon to nitrogen in the wood. When this ratio is very high, the low availability of nitrogen
reduces the chance of fungi attack. Other favorable conditions for increased chance of microorganism
growth are pH values between 3 and 6 and temperature in the range of 0-45 0C. Wood deterioration
results from the destruction of 1) cellulose, 2) hemicellulose, or 3) lignin. Figure 1 shows how different
types of organisms damage the wood structure.
Figure 19. Damage effects of soft, white, and brown rot on wood structure (Sanchez-Silva and Rosowsky, 2008)
The structural degradation of wood depends on the relationship between the structure, the
characteristics of the organism, and the environment. Microorganisms use the wood as a food source,
thereby reducing the weight of the wood. Figure 2 shows the phenomenological decay of wood
resistance as a result of fungi. The weight loss (biomass loss) is a measure of decay and is expressed as:
𝑊𝐿 =𝑊0−𝑊𝑑𝑒𝑐𝑎𝑦𝑒𝑑
𝑊𝑜𝑑 (1)

5
Where Wo= original weight, Wdecayed=decayed weight, and 𝑊𝑜𝑑= origin oven dry weight.
Figure 20. Phenomenological decay of wood resistance as a result of fungi (Sanchez-Silva and Rosowsky, 2008)
1.4.2 METAL
Biodeterioration of metals occurs from the associated processes that accelerate corrosion rather than
from the direct action of microorganisms on the material. Microorganism activity related to metal
corrosion is classified in terms of:
1. Oxygen users. 2. Acid producers. 3. Slime formers.
The corrosion process is electrochemical in nature and can occur under these three circumstances:
1. Attack by concentration cells. 2. Action of sulfides (S-2). 3. Effect of organic and inorganic acids.
The process of corrosion caused by biofilm is shown in Figure 3.

6
Figure 21. Corrosion caused by concentration cell formation (Sanchez-Silva and Rosowsky, 2008)
1.4.3 STONE
Evaluation of the biological contribution of stone decay begins with the description of the type of stone
material and exposure with the conditions for the object/building and the presence of water and
nutrients. Microbial colonization of stones depends on environmental factors, such as water availability,
pH, climatic exposure, and nutrient sources, and on petrologic parameters. The parameters are mineral
composition, the type of stone, and the porosity and permeability of the rock material (Warscheid and
Braams, 2000).
1.4.4 REINFORCED CONCRETE (RC)
Reinforced concrete structures are highly durable; however, deterioration of RC is often found in
structures subjected to an aggressive environment such as sulfate attack and chloride ion penetration.
The main organisms involved in RC biodeterioration are: 1) bacteria, 2) fungi, and 3) algae and lichens.
All of those organisms erode and perforate the concrete (Gaylarde et al., 2003). The favorable
environmental conditions for organism growth on concrete surfaces are (Sanchez-Silva and Rosowsky,
2008):
1. Elevated relative humidity (i.e. between 60 and 98%. 2. Long cycles of humidification and drying or freezing and defrosting.

7
3. High carbon dioxide concentrations. 4. High concentration of chloride ions or other salts (e.g. marine environments). 5. High concentration of sulfates and small amount of acids. (e.g. sewer pipes or residual water
treatment plants).
Table 2 shows the characteristics of the main bacteria that cause biodeterioration in concrete materials.
Table 3. Effects of bacteria on RC structures (Bastidas-Arteaga et al., 2008)
Bacteria type Lifestyle Temperature and pH range
Consequences on concrete
1. Cyanobacteria Autotrophic, aerobic or anaerobic
−60 to 85 °C (wide pH range)
Generate tensile stresses leading to an increment in the size of cracks.
2. Nitrobacteria Heterotrophic and anaerobic
18–25 °C, pH < 7.5
Nitrifying bacteria (Nitrosonoma and Nitrobacter) produce calcium nitrate by solubilizing some of cement components.
3. Sulfur-reducing bacteria
Heterotrophic and anaerobic
25–44 °C, 5.5 < pH < 9
Produce H2S that is used for the sulfur-oxidizing bacteria to produce sulfuric acid. This process is commonly called concrete corrosion.
4. Sulfur-oxidizing bacteria
Heterotrophic and aerobic
25–44 °C, 2 < pH < 9
Produce sulfuric acid, acetic acid, sulfates, sulfur, sulfites, and polythionates that affect the concrete chemically.
4.1 Neutrophilic sulfur oxidizing (NSOM)
pH ≈ 7
4.2 Acidophilic sulfur oxidizing (ASOM)
pH < 3.0
1.4.5 CONCRETE
Mechanisms of biodeterioration can be summarized as shown in Table 3 (Silva and Naik, 2013).
Organisms can grow on concrete surfaces under these conditions: elevated relative humidity, long cycles
of humidification and drying or freezing and thawing, high carbon dioxide concentrations, high
concentration of chlorides or other salts, and high concentration of sulphates and small amounts of
acids. Attacks of organisms on concrete can be 1) physical or mechanical, 2) fouling or soiling, or 3)
chemical attack by using a structural component as a food source or by excreting waste products that

8
affect the material. Biodeterioration of concrete structures can also be caused by the settlement of
macroscopic organisms, such as zebra mussels.
Table 4. Mechanisms of biodeterioration (Silva and Naik 2013)
Mechanisms Examples
Physical or mechanical attack Can be from fungi, cyanobacteria, algae, mussels
Fouling or soiling Discoloration, biofilm enables growth of other organisms, traps moisture
Chemical attack Microbes utilize ions present in cement, metabolites solubilize minerals, enzymes break down mortar
2. APPROACH
There have been a large number of performance models developed in the past decades; however, a
coupled performance model of roughness and biological components is not yet available. To develop
the model, discrete values of pavement distress data such as cracking (traverse, edge cracking, and
other types), raveling, rut depth, and pavement roughness will be collected. Also, three primary
variables, pavement strength, traffic loading, and regional location in terms of m-factor, will also be
collected.
Microbes have shown to consume and/or degrade asphaltene and polyaromatic compounds from both
natural (Raggi et al., 2013, Mahmoudi et al., 2013) and human-made sources. Ultimately, the goal of this
research is to quantify the contributions of these microbes to asphalt binder stability and degradation.
Microbial colonization within the binder and production of extracellular polysaccharides (EPS) can
strengthen the binder. However, consumption of these polysaccharides or of the polymers mixed with
the binder to improve its performance can reduce the strength and flexibility of the asphalt. To be able
to predict the conditions under which these processes will occur, we must first isolate microbial species
capable of growth in the dry, organic-rich environment of asphalt, identify their requirements for
growth, and quantify the rate of EPS production and asphaltene degradation under both ideal
(laboratory) and non-ideal (field) conditions. The mathematical models built on these data will allow
more accurate prediction of performance under field conditions of a variety of structures.
A summarized algorithm for predicting pavement roughness coupled with biodeterioration can be
universally applicable and serve as a primary performance model for pavement management
forecasting and pavement design. Given the uncertainties in both the parameters and the model, the
probabilistic approach appears to be more appropriate than the deterministic approach. In modeling the

9
performance over the pavement life cycle, the important features to capture are the two phases of the
deterioration rate, before and after cracking, and the different mechanisms causing roughness.
3. METHODOLOGY
Bastidas-Arteaga et. al (2008) proposed a model for the variation of concrete products with time as:
𝑊𝑚(𝑡) = [
0 𝜏𝑖𝑛𝑖 ≥ 𝑡𝑓(𝑡, 𝐷𝑂2, 𝐴, 𝑔) 𝜏𝑤 ≥ 𝑡 ≥ 𝜏𝑖𝑛𝑖
ℎ(𝑡, 𝐷𝑂2, 𝐴, 𝑔) 𝑡 ≥ 𝜏𝑤
] (2)
Where 𝜏𝑖𝑛𝑖, 𝜏𝑤= time to corrosion initiation and time to corrosion of the total bar surface, respectively.
𝐷𝑂2= diffusion coefficient of O2, and g describes the geometry of the problem.
3.1 COUPLED DETERIORATION MODEL
The coupled deterioration model suggested by Bastidas-Arteaga et al. (2008) took into account three
effects: 1) corrosion induced by chloride ingress, 2) cracking as a result of corrosion products, and 3)
reduction of concrete cover caused by biodeterioration. Figure 5 represents the conceptual description
of the coupled model.

10
Figure 22. Conceptual description of the coupled model for biodeterioration, chloride ingress, and cracking of concrete structures (Bastidas-Arteaga et. al., 2008)
Where 𝐷𝐶𝑂2(𝜏) is the diffusion coefficient of oxygen in the concrete, 𝑊(𝜏) is the amount of corrosion
product, and the amount of critical rust products Wcrit (g) is defined as the amount at which all free
spaces between the steel bar and the concrete are filled and the cracking begins.
Due to live organism action, the thickness of the concrete cover is a time-dependent function. The
thickness at time 𝜏, cover (𝜏), is calculated as:
𝑐𝑜𝑣𝑒𝑟(𝜏) = 𝑐 − ∫ 𝛾(𝜏)𝑑𝜏𝜏
0 (3)
Where c in the cover at 𝜏 =0 and 𝛾(𝜏) is the biodeterioration rate function as discussed below.
3.2 TIME-DEPENDENT BIODETERIORATION RATE FUNCTION
Biodeterioration is a complex process in which many classes of organisms, environmental variables, and
other processes interact. Computing the RC time-dependent biodeterioration rate is an important
aspect for the accuracy of the numerical model. Bastidas-Arteaga et al. (2008) remarked that there is a
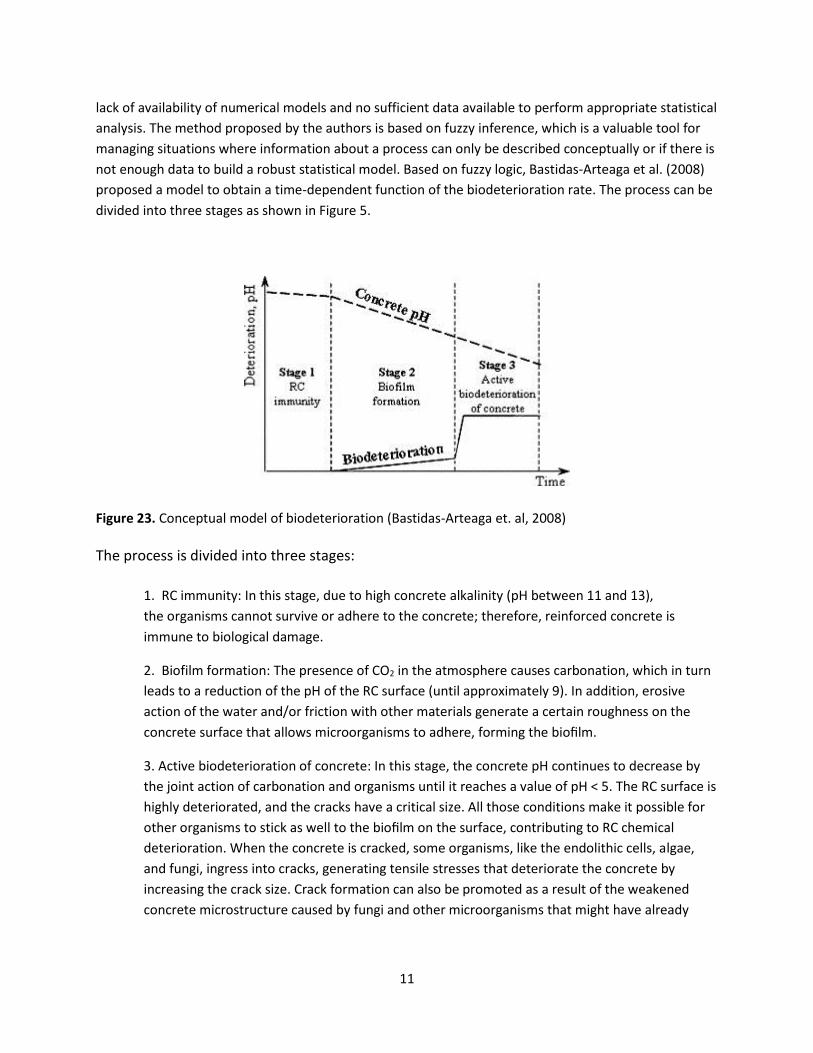
11
lack of availability of numerical models and no sufficient data available to perform appropriate statistical
analysis. The method proposed by the authors is based on fuzzy inference, which is a valuable tool for
managing situations where information about a process can only be described conceptually or if there is
not enough data to build a robust statistical model. Based on fuzzy logic, Bastidas-Arteaga et al. (2008)
proposed a model to obtain a time-dependent function of the biodeterioration rate. The process can be
divided into three stages as shown in Figure 5.
Figure 23. Conceptual model of biodeterioration (Bastidas-Arteaga et. al, 2008)
The process is divided into three stages:
1. RC immunity: In this stage, due to high concrete alkalinity (pH between 11 and 13),
the organisms cannot survive or adhere to the concrete; therefore, reinforced concrete is
immune to biological damage.
2. Biofilm formation: The presence of CO2 in the atmosphere causes carbonation, which in turn
leads to a reduction of the pH of the RC surface (until approximately 9). In addition, erosive
action of the water and/or friction with other materials generate a certain roughness on the
concrete surface that allows microorganisms to adhere, forming the biofilm.
3. Active biodeterioration of concrete: In this stage, the concrete pH continues to decrease by
the joint action of carbonation and organisms until it reaches a value of pH < 5. The RC surface is
highly deteriorated, and the cracks have a critical size. All those conditions make it possible for
other organisms to stick as well to the biofilm on the surface, contributing to RC chemical
deterioration. When the concrete is cracked, some organisms, like the endolithic cells, algae,
and fungi, ingress into cracks, generating tensile stresses that deteriorate the concrete by
increasing the crack size. Crack formation can also be promoted as a result of the weakened
concrete microstructure caused by fungi and other microorganisms that might have already

12
diffused into the concrete matrix.
Based on the conceptual model, the membership functions for the age of the structure (i.e., in time
units (years) and the biodeterioration rate c (mm/year) can be defined. Then, the structure life can be
divided into two stages:
1. Initial age: At this age, microorganisms can hardly live on the surface of the concrete because
it is even and the pH of the concrete is high.
2. Active biodeterioration age: At this stage, the biodeterioration is active because the surface
offers optimal conditions for colonization by microorganisms.
These stages are represented by membership functions of sigmoidal form (see Figure 6a):
𝜇𝑎𝑔𝑒(𝜏, 𝑎, 𝑏) =1
1+exp(−𝑎(𝜏−𝑏)) (4)
Where τ is the time in years, and a, b are constants that define the shape of the function. In addition, it
is necessary to define two membership functions for the corresponding biodeterioration rate, γ. The
first corresponds to the initiation of the biodeterioration process for which the maximum membership
value assigned is γini = 0 mm/year. Then, in this case, the modified Gaussian function that describes the
initial biodeterioration rate membership is given by (as shown in Figure 6b):
𝜇𝛾1(𝛾, 𝜎) = [exp (−1
2[
𝛾
𝜎]
2
) 𝑖𝑓 𝛾 ≫ 0
0 𝑜𝑡ℎ𝑒𝑟𝑤𝑖𝑠𝑒] (5)
Where σ is a shape parameter. The second function corresponds to the time within which
biodeterioration is active; thus, based on the values of the biodeterioration rate caused by the
acidophilic sulfur oxidizing microorganisms (ASOM) and the average active biodeterioration rate, γav, is
assigned to the maximum membership value. In this case, the membership function that describes the
corrosion rate is:
𝜇𝛾2 (𝛾, 𝛾𝑎𝑣 , 𝜎) = exp (−1
2[
𝛾−𝛾𝑎𝑣
𝜎]
2
) (6)

13
Figure 24. (a) Age membership functions, (b) biodeterioration rate membership functions (Bastidas-Arteaga et. al, 2008)
Figure 6 illustrates these functions for the following parameters: 𝑎𝜏𝑖𝑛𝑖
= −0.8 and 𝑏𝜏𝑖𝑛𝑖= 6.5 for
the initial age; 𝑎𝜏𝑎𝑐𝑡= 0.7 and 𝑏𝜏𝑎𝑐𝑡
= 12 for the active biodeterioration age; 𝜎𝛾𝑖𝑛𝑖= 0.1for the initial
biodeterioration rate; and 𝛾𝑎𝑣 = 2.5 𝑚𝑚/𝑦 and 𝜎𝛾𝑎𝑐𝑡= 0.4 for the active biodeterioration rate.
The rules used for the fuzzy inference system are:
1. If the structure is in the initial age, then the biodeterioration rate is the initial.
2. If the structure is in the active biodeterioration age, then the biodeterioration rate is active.
Based on these rules, a response surface can be determined as follows:
𝑆(𝜏, 𝛾) = max ((𝜇𝑎𝑔𝑒1(𝜏, 𝑎𝜏𝑖𝑛𝑖,𝑏𝜏𝑖𝑛𝑖
)𝜇𝛾1(𝛾, 𝜎𝛾𝑖𝑛𝑖
)
(𝜇𝑎𝑔𝑒2(𝜏, 𝑎𝜏𝑎𝑐𝑡,𝑏𝜏𝑎𝑐𝑡)𝜇𝛾2
(𝛾, 𝛾𝑎𝑣 , 𝜎𝛾𝑎𝑐𝑡)
) (7)
Where, 𝑆(𝜏, 𝛾) is the surface generated by the maximum of products composition, (𝜇𝑎𝑔𝑒1(𝜏, 𝑎𝜏𝑖𝑛𝑖,𝑏𝜏𝑖𝑛𝑖))
is the membership function corresponding to the concrete initial age, (𝜇𝑎𝑔𝑒2(𝜏, 𝑎𝜏𝑖𝑛𝑖𝑎𝑐𝑡,𝑏𝜏𝑎𝑐𝑡)
corresponds to the active biodeterioration age, 𝜇𝛾1(𝛾, 𝜎𝛾𝑖𝑛𝑖
) corresponds to the initial biodeterioration
rate, and 𝜇𝛾2(𝛾, 𝛾𝑎𝑣 , 𝜎𝛾𝑎𝑐𝑡
) corresponds to the active biodeterioration rate. The surface generated by
Eq. (7) is shown in Figure 7a. By using the strategy of the center of gravity for the surface defuzzification,
it is possible to obtain a time-dependent biodeterioration rate function, γ(τ), as shown in Figure 7b:

14
Figure 25. (a) Surface generated in FIS type, (b) time-dependent biodeterioration rate function (Bastidas-Arteaga et. al., 2008).
Advantages: Bastidas-Arteaga et al. (2008) stated that the advantage of this solution is that it provides
an estimation of the time-dependent change of the biodeterioration rate depending on the expert’s
knowledge. The expert determines the form of the membership functions and has to assign values to
the variables a, b, γav, and σ based on his/her expertise. An example is given where an expert can define
the membership functions of the biodeterioration rate considering the environmental factors and
nutrient availability of the determinate place and the age membership functions, taking into account the
type of cement or the condition of the structure at a given time. It is also stated that the
biodeterioration rate function can be updated permanently by modifying the membership functions
based on field measurements and experimental data.
4. FINDINGS
There has been substantial experimental work on biodeterioration of various construction materials.
Unfortunately, the effect of microbes on asphalt binder stability and degradation is missing. Therefore,
there is a need to investigate how various microbes can affect asphalt binders, which is a major
component of asphaltic concrete.
5. CONCLUSION
Generally, there is the need to develop approaches to prevent biodeterioration of construction
materials. Although there have been major advances in protecting synthetic materials, the area of
construction materials has been lagging.
Furthermore, it is very clear that physical and chemical methods may not be adequate in determining
15
the resistance of construction materials, including asphalt, to biological attacks. Protection of materials
from bio-deterioration can begin at the surface.
6. RECOMMENDATIONS
There is a need to develop coupled models of infrastructure deterioration based on biodeterioration and other deterioration parameters. For example, a coupled model between pavement roughness and biodeterioration.
A summary algorithm for predicting pavement roughness coupled with biodeterioration can be universally applicable and serve as a primary performance model for pavement management and design.
REFERENCES
Bastidas-Arteaga, E., Sanchez-Silva, M., Chateauneuf, A., and Silva, R.M. (2008). “Coupled reliability
model of biodeterioration, chloride ingress and cracking for reinforced concrete structures.” Structural
Safety, 30, 110-129.
Gaylarde, C., Ribas Silva, M., and Warscheid, T. (2003). “Microbial impact on building materials: An
overview.” Mater. Struct. , 36, 342–352.
Hueck, H. J. (1968). “The biodeterioration of materials—An appraisal.” Biodeterioration of materials,
Elsevier, London, 6.
Raggi, L. et al. (2012). “Bacterial symbionts and bathymodiolus mussels and escarpia tubeworms from
Chapopote, an asphalt seep in the southern Gulf of Mexico,” Environmental microbiology, 19p.
Mahmoudi, N. et al. (2013). “Assessing microbial carbon sources and potential PAH degradation using
natural abundance 14C analysis,” Environmental Pollution, Vol 175, pp 125-130.
Rose, A. H. (1981). “Microbial biodeterioration.” Economic microbiology, Vol. 6, Academic, London.
Sanchez-Silva, M., and Rosowsky, D.V. (2008). “Biodeterioration of construction Materials: State of the
art and future challenges.” Journal of Materials in Civil Engineering, 20, 352-362.
Scheffer, T. C. (1973). “Microbiological degradation and the causal microorganisms.” Wood deterioration
and its prevention by preservative treatment, Degradation and protection of wood, D. D. Nicholas, ed.,
Vol. 1, Syracuse University Press, Syracuse, N.Y.
Silva M.R. and Naik, N.R. (2013). “Biodeterioration of Concrete Structures in Coastal Zone,” Third
International Conference on Sustainable Construction Materials and Technologies.
Viitanen, H. and Salonvaara, M. (2001). Failure criteria. In Trechsel, H. ed. Moisture analysis and
condensation control in building envelopes, MNL40. ASTM USA. pp. 66-80.

16
Warscheid, T. and Braams, J. (2000). “Biodeterioration of stone: A review.” International
Biodeterioration and Biodegradation, 46, 343-368.

CAIT-UTC 032
1
CHAPTER 4

CAIT-UTC 032
2
Evaluation of Biotechnologies for Flexible Pavement
Applications
FINAL REPORT May 2016
Submitted by: Christopher Ericson*
Senior Laboratory Engineer
Thomas Bennert, Ph.D.* Research Professor
*Rutgers University 100 Brett Rd. Piscataway, NJ 08854
External Project Manager Eileen Sheehy
In cooperation with
Rutgers, The State University of New Jersey And
New Jersey Department of Transportation
And U.S. Department of Transportation Federal Highway Administration
1
Disclaimer Statement
The contents of this report reflect the views of the authors,
who are responsible for the facts and the accuracy of the
information presented herein. This document is disseminated
under the sponsorship of the Department of Transportation,
University Transportation Centers Program, in the interest of
information exchange. The U.S. Government assumes no liability for the contents or use thereof.
The Center for Advanced Infrastructure and Transportation (CAIT) is a Tier I UTC Consortium
led by Rutgers, The State University. Members of the consortium are the University of Delaware,
Utah State University, Columbia University, New Jersey Institute of Technology, Princeton
University, University of Texas at El Paso, University of Virginia and Virginia Polytechnic
Institute. The Center is funded by the U.S. Department of Transportation.

2
1. Report No.
CAIT-UTC 032
2. Government Accession No. 3. Recipient’s Catalog No.
4. Title and Subtitle
Evaluation of Biotechnologies for Flexible Pavement Applications
5. Report Date
April 2016 6. Performing Organization Code
CAIT/Rutgers University 7. Author(s)
Christopher Ericson, Thomas Bennert, Ph.D.
8. Performing Organization Report No.
CAIT-UTC 032
9. Performing Organization Name and Address
Center for Advanced Infrastructure and Transportation Rutgers, The State University of New Jersey 100 Brett Road Piscataway, NJ 08854
10. Work Unit No.
11. Contract or Grant No.
4-35811
12. Sponsoring Agency Name and Address 13. Type of Report and Period Covered
Final Report 6/1/2013 – 5/1/2016
14. Sponsoring Agency Code
15. Supplementary Notes
U.S. Department of Transportation/Research and Innovative Technology Administration
1200 New Jersey Avenue, SE
Washington, DC 20590-0001
16. Abstract
Acidulated soy soapstock and lipids extracted from microalgae were looked at in this study as
viable options for additives in asphalt binder to provide anti-oxidant and rejuvenating properties.
Unfortunately it was to difficult to acquire in any means enough processed high lipid microalgae
for this study but we were able to thoroughly examine acidulated soy soapstock to see if it had
any rheological redeeming qualities as an additive. This study looked at asphalt binder mixed
with 1% and 5% by weight acidulated soy soapstock and were tested using the AASHTO-
specified Performance Grade test, along with Direct Tension Testing, Separation Testing, and
MasterCurve analysis. These results were compared to the control sample which had no additives
in it. The binders which contained bio-additives were softer and easier to work with than the
control binder, which is promising for the asphalt industry as it may make recycled asphalts
easier and more cost-effective to work with.
17. Key Words
Acidulated Soy Soapstock, Lipids, Microalgae, Asphalt Mixtures, Binder, Bio Additives
18. Distribution Statement
19. Security Classification (of this report)
Unclassified 20. Security Classification (of this page)
Unclassified 21. No. of Pages
36 22. Price
Center for Advanced Infrastructure and Transportation
Rutgers, The State University of New Jersey
100 Brett Road
Piscataway, NJ 08854
T E C H NI C A L R E P OR T S T A NDA RD TI TLE P A G E

3
Form DOT F 1700.7 (8-69)

1
Acknowledgments
The research report herein was performed under CAIT-UTC 032 by the Center for Advanced
Infrastructure and Transportation (CAIT) at Rutgers University, University of Texas at El Paso,
and University of Delaware.
Dr. Thomas Bennert, Program Director, Pavement Resource Program (PRP) at CAIT, was the
principal investigator with the work being done under his general supervision.
CAIT would like to extend their gratitude to all the individuals who worked on the project
including Wen Zhang, Ph.D. from NJIT for supplying the microalgae. Special thanks are
extended to Dorothy Libring, undergraduate researcher and Christopher Ericson, senior
laboratory engineer, for their work throughout the project.

2
TABLE OF CONTENTS
List of Tables .................................................................................................................................... 3
List of Figures ................................................................................................................................... 4
CHAPTER 1 ..................................................................................................................................... 5
1.1 Introduction ...................................................................................................................... 5
1.2 Research Need Statement ................................................................................................ 5
CHAPTER 2 – Literature Review ..................................................................................................... 7
2.1 Introduction ...................................................................................................................... 7
2.2 Past Research ................................................................................................................... 7
CHAPTER 3 – Work plan ................................................................................................................. 10
3.1 Overview .......................................................................................................................... 10
3.2 Acidulated Soy Soapstock ............................................................................................... 10
3.3 Algae ................................................................................................................................ 11
CHAPTER 4 - Findings ..................................................................................................................... 16
4.1 Performance Grades ........................................................................................................ 16
4.2 Critical Cracking Temperatures ...................................................................................... 18
4.3 Mastercurve Analysis ...................................................................................................... 20
4.4 Separation Test Results ....................................................................................................23
CHAPTER 5 - Conclusions ............................................................................................................... 24
5.1 Recommendations ............................................................................................................ 24
5.2 Future Research ............................................................................................................... 24
REFERENCES… ..............................................................................................................................26
APPENDIX .......................................................................................................................................27

3
LIST OF TABLES
Table 1: PG Grades of Asphalt Binders…………………………………………………………17
Table 2: 64-22 Bio-Binders Control Critical Cracking Temperature…………………...………19
Table 3: 64-22 + 1% Acidulated Soy Soapstock………………………………………………..19
Table 4: 64-22 + 5% Acidulated Soy Soapstock………………………………………………..19
Table 5: Glover-Rowe Black Space Parameters………………………………………………...22

4
LIST OF FIGURES
Figure 1: Sohlet Extractor Setup. Algal Biomass sits on top of Cotton……………………….12
Figure 2: Sohxlet Filling up With Hexane. Algal Biomass is Reacting……………………….13
Figure 3: Algal Biomass Ground up using Mortar & Pestle and Put Back into Soxhlet………13
Figure 4: Soxhlet Extractor Running With Ground up Algal Biomass………………………..14
Figure 5: Buchi Rotovap Setup Distilling Hexane From Solution…………………………….15
Figure 6: Algal Biomass Lipids………………………………………………………………..15
Figure 7: Performance Grade Temperature vs. Percentage Acidulated Soy Soapstock…….....18
Figure 8: Complex Modulus vs. Reduced Frequency………………………………………….21

5
CHAPTER 1
1.1 INTRODUCTION
Asphalt is a necessary product for our expected standard of living today. In the interest of
environmental responsibility, companies are adding more recycled content to their binders than
ever before. This makes it more sustainable and decreases the cost of materials to the contractor.
Problems arise when using recycled asphalt, however, which detract from these benefits.
Recycled content makes binder stiffer and more difficult to work with. Machines must heat the
material to much higher temperatures to yield a workable product. Maintaining this high heat is
more expensive and consumes more fuel than used for traditional binders. Therefore, finding a
substance that can be added to binders to lower their workable temperature range is a current
goal in the civil engineering industry. Rutgers University aims to prove through this paper that
adding bio-additives to asphalt will soften the binder and make it more workable, without
negatively impacting its performance. A successful first analysis will spawn more specific
research into the feasibility of using these materials on an industrial scale.
1.2 RESEARCH NEED STATEMENT
The use of biotechnology has many benefits in construction applications, in this case, the
construction and performance of flexible pavements. From a materials standpoint. the potential
use of biomaterials can reduce the dependency on petroleum products required for asphalt
materials, as well as helping to reduce greenhouse emissions during production and construction.
If adaptable, biomaterials may also be able to help increase the general life of the pavement
while reducing the cost of construction. Biotechnologies may also be able to help in the
stabilization of subgrade soils prior to constructing roadways over top of them. Researchers have

6
found that the use of microbial activity allows for a level of stabilization in liquefiable soils.
Including the use of biomaterials to help stabilize these problematic soils is a cost effective and
environmentally sensitive solution. Although biomaterials has shown to help improve pavement
and soil performance, there is also evidence to show that some pavement biodeterioration does
occur and may affect the general roughness of the pavement. To conclude the research study, an
assessment of paved road deterioration due to biodeterioration and how it influences
roughness progression will also be conducted.

7
CHAPTER 2
2.1 INTRODUCTION
A tremendous amount of literature was identified related to bio additives being added to asphalt
and its influence on HMA mechanical properties. There have also been studies on 100%
replacement of petroleum based asphalt binder in HMA however this study only looked at bio-
additives.
2.2 LITERATURE REVIEW
1. Seidel, J. C., & Haddock, J. E. (2014). Rheological characterization of asphalt
binders modified with soybean fatty acids. Construction and Building Materials,53,
324-332.
Seidel and Haddock (2004) conducted a study on the rheological properties of asphalts blended
with soybean acidulated soapstock (SAS). SAS is a relatively low-cost and highly concentrated
source of soybean fatty acids. The study found that as SAS is added to binders, they become
softer and their high temperature viscosities are reduced. However the study showed that the
addition of 1% SAS reduces thermal stress accumulation. These findings suggest that SAS could
be used as a fluxing agent (i.e., consistency reducer) for stiff, hard and viscous asphalt binders,
increasing their workability. SAS may also improve low temperature performance of an asphalt
binder by reducing thermal stress development.
2. Tang, S. (2010). Asphalt modification by utilizing bio-oil ESP and tall oil additive.

8
Tang, S. (2010) studied the effects of adding corn stover, oak wood, and switch grass derived
bio-oil to asphalt binder. Also as part of the study tall oil was also added to asphalt binder to see
its effects. The study concluded that there is some indication that these additives can increase the
high temperature performance of asphalt binders. However, the increase in high temperature
performance greatly affects the low temperature binder properties. This would not be good for
regions that have severe freeze thaw cycles. However, the tall oil does provide significant
rehabilitation effects to the bio-oil modified binders at low temperatures. In the study the
dynamic modulus test results did not really correlate with the asphalt binder test results. This
would suggest a potential for greater mix performance improvement than that which can be seen
by just using asphalt binder testing.
3. Fini, E. H., Kalberer, E. W., Shahbazi, A., Basti, M., You, Z., Ozer, H., &
Aurangzeb, Q. (2011). Chemical characterization of biobinder from swine manure:
Sustainable modifier for asphalt binder. Journal of Materials in Civil Engineering,
23(11), 1506-1513.
Fini et al. (2011) studied the production, modification, and characterization of biobinder from
swine manure. They used a hydrothermal process to convert the swine manure to a bio-oil. The
bio-oil was then fractionated to extract water, solid residue, and some of the organic compounds.
The sticky residue after fractionation was then used as a replacement for asphalt binder. They
found biobinder from swine manure to be a promising candidate for partial replacement for
petroleum-asphalt binder instead of being a complete replacement. The use of biobinder was
shown to improve petroleum-asphalt binder’s low temperature properties while reducing asphalt
pavement construction costs.

9
4. Raouf, M. A., & Williams, R. C. (2010). Temperature and shear susceptibility of a
nonpetroleum binder as a pavement material. Transportation Research Record:
Journal of the Transportation Research Board, 2180(1), 9-18.
Raouf and Williams (2010) found that temperature is the main contributor to the viscosity of the
bio-oils rather than shear rate. Therefore the effect of temperature in changing the viscosity of
the bio-oils was more significant than the effect of shear rate. This means that the bio-oils act
similarly to conventional petroleum based asphalt binders. The findings from this study are in
compliance with conclusions reported previously by other researchers. Raouf and Williams also
found that the addition of polymer modifiers to oakwood-derived bio-oil led to a shift in the
temperature range and made it very close to that of bitumen binders modified with bio-binders.
5. Chailleux, E., Mariane, A. U. D. O., Bujoli, B., Queffelec, C., Legrand, J., & Lepine,
O. (2012, January). Alternative Binder from microalgae: Algoroute project. In
Workshop Alternative Binders for Sustainable Asphalt Pavements (pp. pp-7).
Chailleux et al. (2012) looked at using the lipids extracted from microalgae as a 100% asphalt
binder replacement due to its rheological similarity to asphalt binder. This is a very neat concept
however it is not economically feasibility or environmentally friendly yet for a total replacement.
The energy consumed to process the algae is to high to call it environmentally friendly.

10
CHAPTER 3
3.1 OVERVIEW
We mainly looked at the viability of 2 bio-additives in asphalt binder. The goal was to look at the
performance properties of asphalt binder with the additive in it at different percentages. In the
following sections the work plan of both additives are discussed.
3.2 ACIDULATED SOY SOAPSTOCK
Acidulated soy soapstock is a by-product of the refining process of producing soybean oil. It is a
highly concentrated solution of plant-based fatty acids and exhibits a low viscosity liquid at room
temperature. The acidulated soy soapstock was added into virgin asphalt binder with a
Performance Grade (PG grade) of 64-22. Two mixes were produced containing 1% and 5% of
ASS by weight. The asphalt binders were mixed using a low shear Glas-Col Precision Stirrer,
which ran for a half hour at 145 °C to achieve a homogenous mixture.
Binder tests were performed according to AASHTO specifications on three bio-binder mixtures
to ascertain their physical properties; the two bio-additive mixtures and the virgin 64-22 were
tested. The testing consisted of a full PG grade according to AASHTO R-29, Multiple Stress
Creep Recovery analysis, Direct Tension Test, Separation Test, and a Mastercurve analysis. The
instruments needed to perform these tests are listed below. All tests were performed to AASHTO
specifications with the exception of the Mastercurve testing and analysis.

11
3.3 ALGAE
Today, there are many companies that grow algae for the food and drug industry. However, the
algae they grow are rich in proteins and vitamins but they are very low in lipids. The algae used
in this study was Scenedesmus Dimorphus that is high in lipids and a perfect candidate for this
study. The algae was grown by Wen Zhang at his laboratory at NJIT, sonicated, dried, semi
crushed, and mailed to us in small quantities. The production of the algae was a slow process and
we were only able to get roughly 8-10 grams of dried algae roughly every 2 weeks. The algae
was expected to yield around 10% by weight of the dried algae of lipids when extracted.
Therefore we needed around 3000g of dried algae in order to obtain 300g lipids in order to use as
an additive at different percentages in asphalt binder to conduct testing as a viable additive.
Below is a brief description of how the algae was processed before it was sent to us.
3.3.1 ALGAE PROCESSING BEFORE SENDING TO RUTGERS
Process of Algae done by Dr. Wen Zhang at NJIT:
Step 1: Centrifuge algae at 5000 x gravity for 10 minutes of more to ensure separation of algal
cells from the medium. Then discard the supernatant
Step 2: Ultrasound the cells at 2kW for 15 minutes cycling on for 30 seconds and then pausing
for 30 seconds for a total of 30 cycles. This is cooled by ice and then maintained at room
temperature.
Step 3: Dry the concentrated biomass in the oven at 60C until weight of the biomass is constant
over time.

12
3.3.2 ALGAE PROCESSING AT RUTGERS TO EXTRACT LIPIDS
Figure 1 shows the soxhlet extractor setup. The condenser is on top of where the sample is held.
As the hexane is heated up in the mantle it will boil at approximately 68°C. The hexane vapor
will then travel up through the whole apparatus and up to the condenser. The hexane will
condense in the condenser and then drip down onto the algal biomass. The cotton which is below
the biomass is to prevent large algal particles from clogging the apparatus and from getting into
the reservoir.
Figure 39: Sohlet Extractor Setup. Algal Biomass sits on top of Cotton

13
Figure 2 is showing the soxhlet extractor is filling up with condensed hexane and the photos on
the left is showing the algal biomass is reacting with the hexane and releasing some sort of gas.
After running this setup for approximately 8 hours we were left with only a slightly green hexane
and algal solution in the collection flask. We then decided to take out the algal biomass and
physically crush it up with a mortar and pestle and put back into the soxhlet extractor with new
cotton as shown in figure 3.
Figure 40: Sohxlet Filling up With Hexane. Algal Biomass is Reacting
Figure 3: Algal Biomass Ground up using Mortar & Pestle and Put Back into Soxhlet
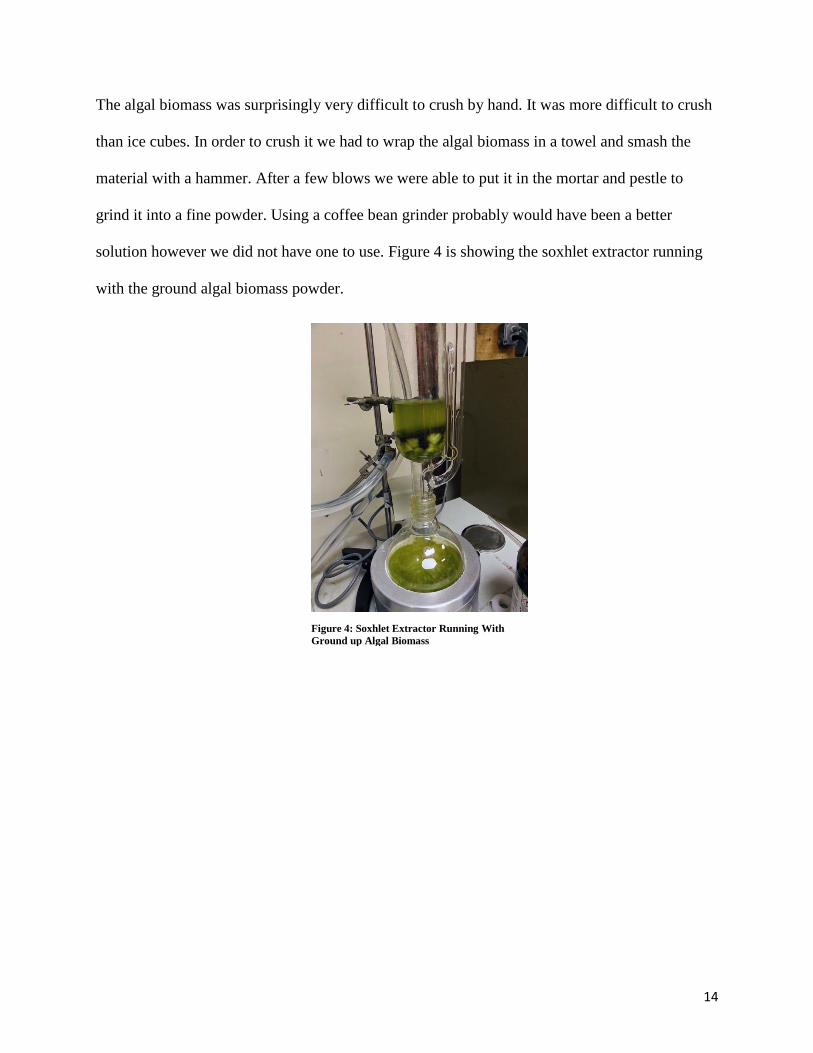
14
The algal biomass was surprisingly very difficult to crush by hand. It was more difficult to crush
than ice cubes. In order to crush it we had to wrap the algal biomass in a towel and smash the
material with a hammer. After a few blows we were able to put it in the mortar and pestle to
grind it into a fine powder. Using a coffee bean grinder probably would have been a better
solution however we did not have one to use. Figure 4 is showing the soxhlet extractor running
with the ground algal biomass powder.
Figure 4: Soxhlet Extractor Running With
Ground up Algal Biomass

15
3.3.3 Recovery of Algal Biomass Lipids from Hexane Solution
Once the soxhlet extractor has run for 8 hours we are left with a solution of lipids in the hexane
and the solution has a very dark green color to it. We then take the solution and distill the hexane
from the lipids using our Buchi Rotovap. We use CO2 as the sweep gas to aid in the distillation
process along with applying a vacuum to the system. Figure 5 shows the setup of the Rotovap in
the process of distillation.
Figure 5: Buchi Rotovap Setup Distilling Hexane From Solution
Figure 6: Algal Biomass Lipids.

16
Figure 6 is showing the end product of the algal biomass extraction & recovery process. The
yield was just under 10% by weight of the dried weight of the algal biomass. Specifically we
started with 30.55g of dried algal biomass and we extracted 2.8g of lipids from the biomass.
CHAPTER 4
Performing the tests listed above gives an understanding of the physical characteristics of asphalt
binder. These values represent how a binder will perform under certain conditions, including
temperature and loading, over the life of the material. Important values to understand are the
Performance Grade of the binder and the Critical Cracking temperatures. A broad understanding
of the material can be gained from a MasterCurve analysis. Finally, in binders with additives, a
Separation Test is used to understand how the homogeny of the mixture is maintained when
being stored for long periods of time in heated silos.
4.1 PERFORMANCE GRADE RESULTS
A PG grade is a specification which denotes the performance of a binder under different loading
applications. It is denoted as two numbers, representing the maximum and minimum
temperatures which produce acceptable performance during these tests. For example, the virgin
binder used in this study has an industry standard PG grade of 64-22. This conveys that it will
perform well at temperatures between 64 and -22 degrees Celsius. As stated, this rating is an
industry standard, which means that the binder falls between 64-22 and the next standard grade,
70-22. These standards are typically listed in 6 degree intervals. The results of the laboratory PG
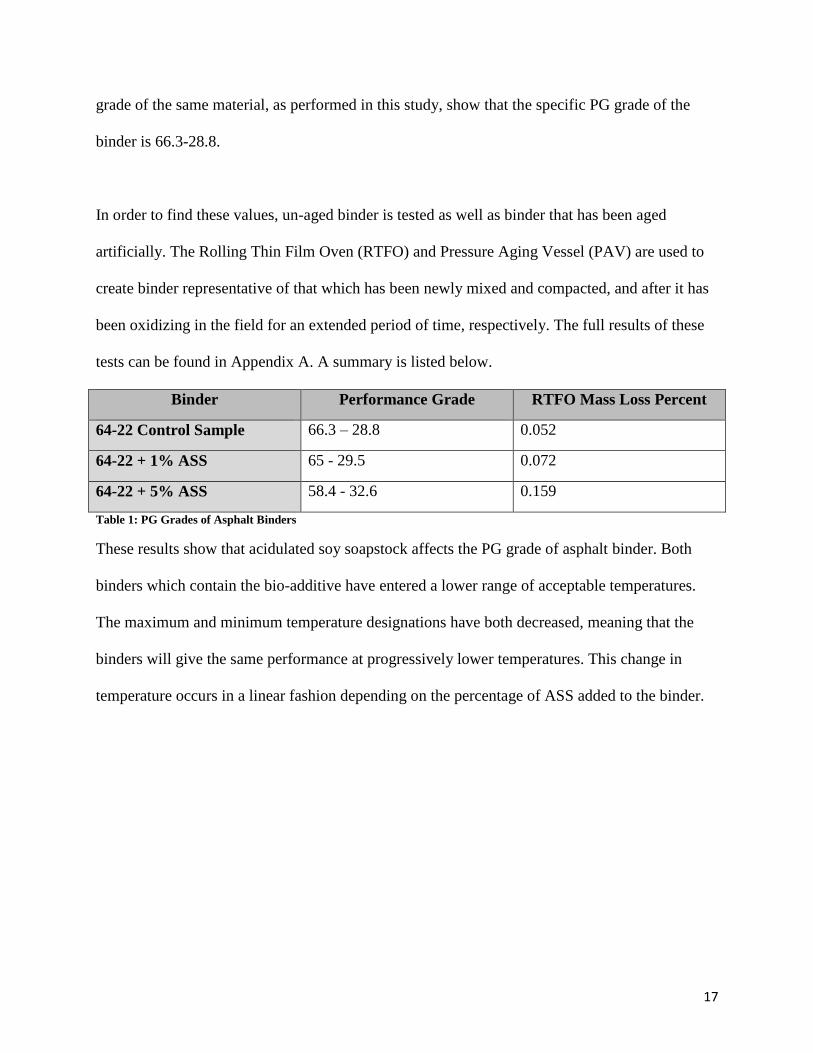
17
grade of the same material, as performed in this study, show that the specific PG grade of the
binder is 66.3-28.8.
In order to find these values, un-aged binder is tested as well as binder that has been aged
artificially. The Rolling Thin Film Oven (RTFO) and Pressure Aging Vessel (PAV) are used to
create binder representative of that which has been newly mixed and compacted, and after it has
been oxidizing in the field for an extended period of time, respectively. The full results of these
tests can be found in Appendix A. A summary is listed below.
Binder Performance Grade RTFO Mass Loss Percent
64-22 Control Sample 66.3 – 28.8 0.052
64-22 + 1% ASS 65 - 29.5 0.072
64-22 + 5% ASS 58.4 - 32.6 0.159
Table 1: PG Grades of Asphalt Binders
These results show that acidulated soy soapstock affects the PG grade of asphalt binder. Both
binders which contain the bio-additive have entered a lower range of acceptable temperatures.
The maximum and minimum temperature designations have both decreased, meaning that the
binders will give the same performance at progressively lower temperatures. This change in
temperature occurs in a linear fashion depending on the percentage of ASS added to the binder.

18
Figure 7: Performance Grade Temperature vs. Percentage Acidulated Soy Soapstock
Another important factor to consider is the loss of mass which occurs due to heating and
oxidation when the binder is in the RTFO. Due to the organic nature of the bio-additive, the
binders which contained ASS lost more mass than the control. All 3 binders are well below the
maximum accepted mass loss percentage of 1% loss.
4.2 CRITICAL CRACKING RESULTS
The Critical Cracking value represents the temperature at which a binder will fail to relax while
cooling and fail. The temperature varies depending on the cooling rate of the binder. This means
that, if asphalt is being worked in temperatures near its critical cracking point, it can be protected
by allowing it to cool more slowly. The critical cracking values are found by inputting the results
R² = 0.9987
R² = 0.9818
-40
-20
0
20
40
60
80
0 1 2 3 4 5 6
PG
Gra
de
Te
me
ratu
re, C
Percentage Acidulated Soy Soapstock, %
Performance Grade Temperature vs Percentage Acidulated Soy Soapstock
Series1
Series2
Linear (Series1)
Linear (Series2)

19
of the BBR and DTT tests into a program called TsarPlus. The results can be found below in the
tables.
TCMODEL Critical Cracking Temperature (°C)
Starting
Temperature
of cooling
event
Cooling
Rate
Cooling
Rate
Cooling
Rate
Cooling
Rate
C/hr C/hr C/hr C/hr
1 2 5.6 10
10C -27.6 -26.2 -23.8 -22.5
5C -27.6 -26.2 -23.8 -22.5
0C -27.7 -26.2 -23.9 -22.5
-5C -27.7 -26.2 -23.9 -22.6 Table 2: 64-22 Bio-Binders Control Critical Cracking Temperature
TCMODEL Critical Cracking Temperature (°C)
Starting
Temperature
of cooling
event
Cooling
Rate
Cooling
Rate
Cooling
Rate
Cooling
Rate
C/hr C/hr C/hr C/hr
1 2 5.6 10
10C -28.3 -27.0 -24.7 -23.4
5C -28.3 -27.0 -24.7 -23.4
0C -28.3 -27.0 -24.7 -23.4
-5C -28.3 -27.0 -24.8 -23.5 Table 3: 64-22 + 1% Acidulated Soy Soapstock
TCMODEL Critical Cracking Temperature (°C)
Starting
Temperature
of cooling
event
Cooling
Rate
Cooling
Rate
Cooling
Rate
Cooling
Rate
C/hr C/hr C/hr C/hr
1 2 5.6 10
10C -32.1 -30.3 -27.5 -26.1
5C -32.1 -30.3 -27.5 -26.1
0C -32.1 -30.3 -27.5 -26.2
-5C -32.2 -30.3 -27.5 -26.2 Table 4: 64-22 + 5% Acidulated Soy Soapstock
The binders which contain acidulated soy soapstock have lower critical cracking temperatures at
all cooling rates compared to the control.

20
4.3 MASTERCURVE ANALYSIS RESULTS
As explained in the methodology section, a MasterCurve analysis represents the stiffness of a
binder at a broad range of temperatures and loading frequencies. Asphalt binder is stiffer at
cooler temperatures. It also acts stiffer when being loaded at a high frequency. A MasterCurve
test applies loads on a sample of asphalt at varying temperatures and frequencies, and from this
data can extrapolate a smooth curve which represents a wide range of situations. The Rutgers
University sequence tests the binder at 0 – 60 degrees Celsius, in 15 degree intervals. The data
collected by the DSR is then entered into RHEA software, which converts the raw data into
points which compare the complex modulus of the binder at different frequencies. When these
points are plotted on a graph on a logarithmic scale, they create a MasterCurve. When multiple
binders are compared, the superpositioning of these curves on one graph shows the relative
stiffness of each binder. Figure 8 shows the results of the MasterCurve analysis for the three
binders in this experiment.

21
Figure 8: Complex Modulus vs. Reduced Frequency
The virgin 64-22 binder is stiffer than the binders which contain the bio-additive. The more
acidulated soy soapstock the sample contains, the less viscous it becomes. This difference
becomes less pronounced at high frequencies, as the binders approach the glassy region and
begin to exhibit the characteristics of a solid rather than a liquid.
The MasterCurve analysis also produces values which are known in the industry as Black Space
Values. These values are found by taking the complex dynamic shear modulus (G*) and phase
angle of the binder at two sets of temperature and frequency conditions. These conditions are
considered to be equivalent in terms of the change in physical properties that occur in the binder.
1.0E-02
1.0E-01
1.0E+00
1.0E+01
1.0E+02
1.0E+03
1.0E+04
1.0E+05
1.0E+06
1.0E-04 1.0E-03 1.0E-02 1.0E-01 1.0E+00 1.0E+01 1.0E+02 1.0E+03 1.0E+04 1.0E+05 1.0E+06
Co
mp
les
Mo
du
lus
(kP
a)
Frequency (rad/sec)
Complex Modulus vs. Reduced Frequency
64-22CONTROL
64-22 + 1%A.S.S.
64-22 + 5%A.S.S.

22
Theoretically, the G* and phase angle should be the same at both of these loading conditions.
Two more important values are the crossover frequency and the rheological index, or R-value.
The crossover frequency represents the frequency at a given temperature where the tangent of the
phase angle, tan() = 1. In general, the crossover frequency represents the stiffness of the binder.
A higher frequency represents a softer binder, as binder stiffens at increased loading speeds. The
rheological index is the difference between the glassy modulus and the dynamic complex
modulus (G*) at the crossover frequency. The R-value is a parameter which represents the ability
of the binder to relax. Typical values for the R-value are between 1.2 and 2. Table 6 shows the
Black Space results for this experiment.
44.7C & 10 rad/s 15C & .005 rad/s
G*, Pa Phase
Angle, ° G*, Pa
Phase
Angle,
°
Crossover
Freq. rad/s
R-
Value
64-22 Control 6.64E+01 71.5 2.83E+01 73.3 805.01 1.888
64-22 +1%
Acidulated Soy
Soapstock 5.54E+01 70.9 2.17E+01 73.1 943.75 1.959
64-22 +5%
Acidulated Soy
Soapstock 2.64E+01 73.2 6.68E+00 76.1 5125.29 2.019 Table 5: Glover-Rowe Black Space Parameters
The comparison of the two loading conditions do not yield similar G* values, but the phase
angles are close enough to be statistically significant. The crossover frequency results confirm
that binders containing more bio-additive are softer than their virgin counterparts. The R-values
of all three binders are in the expected range.

23
4.4 SEPARATION TEST RESULTS
When an additive is combined with virgin binder, it is thoroughly stirred to ensure a homogenous
mixture. Differences in the densities of the two materials, however, can sometimes produce
separation of the binder from the additive during storage. A separation test is performed to
ensure that the modified binder does not separate enough to cause quality control issues. The
separation test was performed to SHRP Plus specifications. The full results can be seen in the
Appendix.
Due to unknown human errors during the performance of the Separation Test, the results are
inconclusive. It appears that the binder containing 1% acidulated soy soapstock aged
dramatically, and became stiffer than the virgin binder. Discarding the results of the 1% bio-
binder due to this discrepancy, however, the separation test results were actually improved by the
addition of the acidulated soy soapstock. The percent difference between the test results of the
top and bottom of the separation tube for the virgin 64-22 binder was around 11%. The average
separation of the 5% acidulated soy soapstock mix was around 7%. This result is unexpected,
and further testing should be done to investigate further.

24
CHAPTER 5
5.1 RECOMMENDATIONS
In conclusion, it can be seen that adding acidulated soy soapstock to virgin binder softens the
mixture. This result supports the goals of the research project. Adding soy soapstock to recycled
asphalt would lower the workable temperature, making it a more environmentally friendly
alternative. The soy soapstock does not negatively affect the performance of the binder in terms
of critical cracking or load performance, as demonstrated by the BBR, DTT and MasterCurve
analyses.
5.2 FURTHER RESEARCH
Due to the successful nature of this first experiment with bio-additives, Rutgers University plans
to pursue more in-depth research on the topic. A comparison of the performance of soapstock
with other additives is the next step. Rutgers has already collected a sample of algae from the
labs at NJIT, with the intention of producing a microalgae lipid extraction. Preliminary
extractions, performed with a Soxhlet Extractor, yield the following results:
Algae – scenedesmus dimorphus – 21.37 g
chlorella zofingiensis – 9.18 g
Total – 30.55 g
Lipid Extraction – 9% yield, 2.8 grams
An immediate observation for the algae bio-additive is that pure algae samples are far more
difficult to obtain than soy soapstock. This could limit the usefulness of such an additive, as the
main goal of this research is to decrease the total cost of producing and working with recycled
asphalt binder. This research still holds merit in the civil engineering community. If the algae

25
lipids produce favorable results over other bio-additives, cheaper sources of bulk algae may
come into existence due to the rise in demand.

26
REFERENCES
Chailleux, E., Mariane, A. U. D. O., Bujoli, B., Queffelec, C., Legrand, J., & Lepine, O. (2012,
January). Alternative Binder from microalgae: Algoroute project. In Workshop Alternative
Binders for Sustainable Asphalt Pavements (pp. pp-7).
Fini, E. H., Kalberer, E. W., Shahbazi, A., Basti, M., You, Z., Ozer, H., & Aurangzeb, Q. (2011).
Chemical characterization of biobinder from swine manure: Sustainable modifier for asphalt
binder. Journal of Materials in Civil Engineering, 23(11), 1506-1513.
Raouf, M. A., & Williams, R. C. (2010). Temperature and shear susceptibility of a nonpetroleum
binder as a pavement material. Transportation Research Record: Journal of the Transportation
Research Board, 2180(1), 9-18.
Seidel, J. C., & Haddock, J. E. (2014). Rheological characterization of asphalt binders modified
with soybean fatty acids. Construction and Building Materials,53, 324-332.
Tang, Sheng, "Asphalt modification by utilizing bio-oil ESP and tall oil additive" (2010).
Graduate Theses and Dissertations. Paper 11569. Iowa State University.

27
APPENDIX

28
Project ID: Sample ID: Control Sample
Technician: Mix Type:
Date:
0.052
135°C 0.49
165°C 0.13
Temp(°C) Temp(°C)
Sample1 Sample2 Average Sample1 Sample2 AverageG*/sinδ(kPa) 1.298 1.345 1.322 0.6317 0.6551 0.643
δ(°) 85.71 85.72 85.72 87.23 87.26 87.25
G*(kPa) 1.294 1.341 1.318 0.631 0.654 0.643
Temp(°C) Temp(°C)
Sample1 Sample2 Average Sample1 Sample2 AverageG*/sinδ(kPa) 3.569 3.461 3.515 1.708 1.651 1.680
δ(°) 80.02 80.28 80.15 82.06 82.37 82.22G*(kPa) 3.515 3.412 3.464 1.692 1.636 1.664
Temp(°C) Temp(°C)
DSR Sample1 Sample2 Average Sample1 Sample2 Average
G*sinδ(Pa) 6532 6067 6300 4766 4377 4572
δ(°) 44.88 44.84 44.86 46.72 46.77 46.75G*(Pa) 9257 8605 8931 6547 6007 6277
Temp(°C) -18 Temp(°C) -24
BBR S(Mpa) m-value S(Mpa) m-value
Sample1 276 0.334 569 0.262
Sample2 269 0.334 582 0.265
Average 272.5 0.334 575.5 0.264
RotationalViscosity(Pa·s)
66.3-28.8(18.2)
CriticalCrackingTemp(°C)
AsphaltContent(%)
ContinuousGrade(°C)
#DIV/0!
2/10/14
Dorothy Libring
64-22 Bio Binders
19
64 70
64 70
16
FlashPointTemperature(°C)
SofteningPoint(°C)
RTFOMassLoss%
SpecificGravity
SummaryofResults
OriginalDSR
RTFODSR
PressureAgingVessel

29
Project ID: Sample ID: Control Sample
Technician: Mix Type:
Date:
MSCR Temp 58°C 64°C 70°C
PASS/FAIL FAIL FAIL FAIL
1.267 3.044 6.94
1.441 3.545 8.057
89.21 94.01 97.45
95.72 98.89 100.0810.79 5.99 2.55
4.28 1.11 -0.08
0.7
0.8
0.9
1
1.1
1.2
1.31.41.5
1.752
2.25
2.5
2.75
[email protected](%)[email protected](%)
AverageJnr(Pa)@3.2kPa
AverageJnr(Pa)@0.1kPa
64-22 Bio Binders
Dorothy Libring
2/10/14
0
10
20
30
40
50
60
70
80
90
100
0 0.5 1 1.5 2 2.5 3
%Recovery(%)
Non-RecoverableCreepCompliance,Jnr(1/kPa)
58°C
64°C
70°C

30
Project ID: Sample ID: w/ 1% Acidulated Soy Soapstock
Technician: Mix Type:
Date:
0.072
135°C 0.58
165°C 0.15
Temp(°C) Temp(°C)
Sample1 Sample2 Average Sample1 Sample2 AverageG*/sinδ(kPa) 1.126 1.127 1.127 0.562 0.568 0.565
δ(°) 84.7 85.38 85.04 85.96 86.95 86.46
G*(kPa) 1.122 1.123 1.123 0.5606 0.567 0.564
Temp(°C) Temp(°C)
Sample1 Sample2 Average Sample1 Sample2 AverageG*/sinδ(kPa) 2.723 2.851 2.787 1.297 1.344 1.321
δ(°) 81.69 81.45 81.57 83.73 83.62 83.68G*(kPa) 2.694 2.82 2.757 1.29 1.336 1.313
Temp(°C) Temp(°C)
DSR Sample1 Sample2 Average Sample1 Sample2 Average
G*sinδ(Pa) 6625 6672 6649 4525 4825 4675
δ(°) 45.31 46.02 45.67 47.78 47.94 47.86G*(Pa) 9318 9273 9296 6110 6499 6305
Temp(°C) -18 Temp(°C) -24BBR S(Mpa) m-value S(Mpa) m-valueSample1 243 0.347 539 0.271Sample2 247 0.344 540 0.270
Average 245 0.346 539.5 0.271
RotationalViscosity(Pa·s)
65-29.5(18.4)
CriticalCrackingTemp(°C)
AsphaltContent(%)
ContinuousGrade(°C)
#DIV/0!
2/10/14
Dorothy Libring
64-22 Bio Binders
19
64 70
64 70
16
FlashPointTemperature(°C)
SofteningPoint(°C)
RTFOMassLoss%
SpecificGravity
SummaryofResults
OriginalDSR
RTFODSR
PressureAgingVessel

31
Project ID: Sample ID: w/ 1% Acidulated Soy Soapstock
Technician: Mix Type:
Date:
MSCR Temp 58°C 64°C 70°C
PASS/FAIL FAIL FAIL FAIL
0.8437 2.067 4.821
0.9734 2.477 5.738
84.41 91.03 95.33
92.22 97.63 99.615.59 8.97 4.67
7.78 2.37 0.4
0.7
0.8
0.9
1
1.1
1.2
1.31.41.5
1.752
2.25
2.5
2.75
[email protected](%)[email protected](%)
AverageJnr(Pa)@3.2kPa
AverageJnr(Pa)@0.1kPa
64-22 Bio Binders
Dorothy Libring
2/10/14
0
10
20
30
40
50
60
70
80
90
100
0 0.5 1 1.5 2 2.5 3
%Recovery(%)
Non-RecoverableCreepCompliance,Jnr(1/kPa)
58°C
64°C
70°C

32
Project ID: Sample ID: w/ 5% Acidulated Soy Soapstock
Technician: Mix Type:
Date:
0.159
135°C 0.35
165°C 0.11
Temp(°C) Temp(°C)
Sample1 Sample2 Average Sample1 Sample2 AverageG*/sinδ(kPa) 1.006 1.092 1.049 0.5172 0.5366 0.527
δ(°) 85.75 85.73 85.74 87.33 87.27 87.30
G*(kPa) 1.003 1.089 1.046 0.5167 0.536 0.526
Temp(°C) Temp(°C)
Sample1 Sample2 Average Sample1 Sample2 AverageG*/sinδ(kPa) 3.203 3.209 3.206 1.508 1.508 1.508
δ(°) 80.53 80.53 80.53 82.77 82.82 82.80G*(kPa) 3.16 3.165 3.163 1.497 1.497 1.497
Temp(°C) Temp(°C)
DSR Sample1 Sample2 Average Sample1 Sample2 Average
G*sinδ(Pa) 6737 6213 6475 4403 4472 4438
δ(°) 45.37 46.09 45.73 48.15 47.83 47.99G*(Pa) 9466 8624 9045 5910 6034 5972
Temp(°C) -18 Temp(°C) -24
BBR S(Mpa) m-value S(Mpa) m-value
Sample1 159 0.373 354 0.308
Sample2 161 0.363 374 0.304
Average 160 0.368 364 0.306
RotationalViscosity(Pa·s)
58.4-32.6(15.1)
CriticalCrackingTemp(°C)
AsphaltContent(%)
ContinuousGrade(°C)
#DIV/0!
2/10/14
Dorothy Libring
64-22 Bio Binders
16
58 64
58 64
13
FlashPointTemperature(°C)
SofteningPoint(°C)
RTFOMassLoss%
SpecificGravity
SummaryofResults
OriginalDSR
RTFODSR
PressureAgingVessel

33
Project ID: Sample ID: w/ 5% Acidulated Soy Soapstock
Technician: Mix Type:
Date:
MSCR Temp 58°C 64°C 70°C
PASS/FAIL FAIL FAIL FAIL
2.466 5.611 12.06
2.921 6.726 14.25
91.99 95.9 98.44
98.16 100.48 100.618.01 4.1 1.56
1.84 -0.48 -0.61
0.7
0.8
0.9
1
1.1
1.2
1.31.41.5
1.752
2.25
2.5
2.75
[email protected](%)[email protected](%)
AverageJnr(Pa)@3.2kPa
AverageJnr(Pa)@0.1kPa
64-22 Bio Binders
Dorothy Libring
2/10/14
0
10
20
30
40
50
60
70
80
90
100
0 0.5 1 1.5 2 2.5 3
%Recovery(%)
Non-RecoverableCreepCompliance,Jnr(1/kPa)
58°C
64°C
70°C
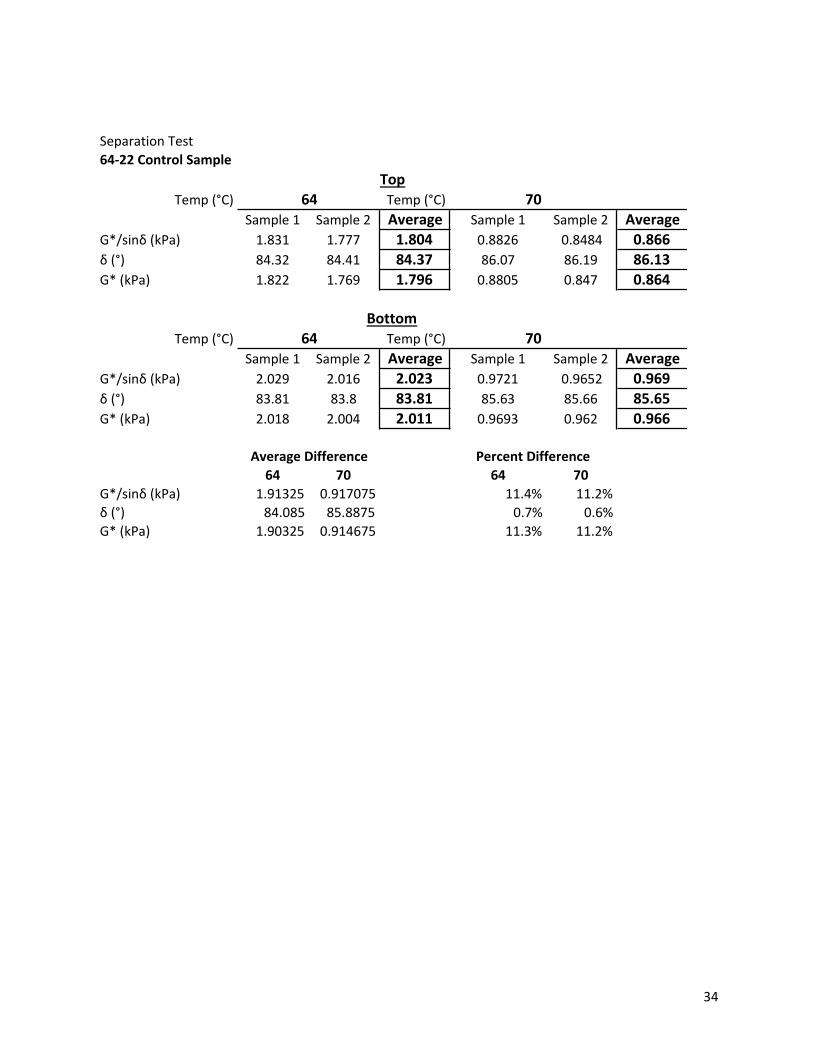
34
SeparationTest
64-22ControlSample
Temp(°C) Temp(°C)
Sample1 Sample2 Average Sample1 Sample2 AverageG*/sinδ(kPa) 1.831 1.777 1.804 0.8826 0.8484 0.866δ(°) 84.32 84.41 84.37 86.07 86.19 86.13G*(kPa) 1.822 1.769 1.796 0.8805 0.847 0.864
Temp(°C) Temp(°C)
Sample1 Sample2 Average Sample1 Sample2 AverageG*/sinδ(kPa) 2.029 2.016 2.023 0.9721 0.9652 0.969δ(°) 83.81 83.8 83.81 85.63 85.66 85.65G*(kPa) 2.018 2.004 2.011 0.9693 0.962 0.966
64 70 64 70
G*/sinδ(kPa) 1.91325 0.917075 11.4% 11.2%
δ(°) 84.085 85.8875 0.7% 0.6%
G*(kPa) 1.90325 0.914675 11.3% 11.2%
64Top
70
AverageDifference PercentDifference
Bottom64 70

35
SeparationTest
64-22+1%AcidulatedSoySoapstock
Temp(°C) Temp(°C)
Sample1 Sample2 Average Sample1 Sample2 AverageG*/sinδ(kPa) 1.343 1.377 1.360 0.6842 0.6986 0.691δ(°) 83.48 83.37 83.43 85.45 85.32 85.39G*(kPa) 1.335 1.368 1.352 0.6821 0.696 0.689
Temp(°C) Temp(°C)
Sample1 Sample2 Average Sample1 Sample2 AverageG*/sinδ(kPa) 1.63 1.657 1.644 0.8151 0.8237 0.819δ(°) 82.32 82.41 82.37 84.41 84.47 84.44G*(kPa) 1.616 1.642 1.629 0.8113 0.820 0.816
70 76 70 76
G*/sinδ(kPa) 1.50175 0.7554 18.9% 16.9%
δ(°) 82.895 84.9125 1.3% 1.1%
G*(kPa) 1.49025 0.7524 18.6% 16.8%
AverageDifference PercentDifference
Top70 76
Bottom70 76

36
SeparationTest
64-22+5%AcidulatedSoySoapstock
Temp(°C) Temp(°C)
Sample1 Sample2 Average Sample1 Sample2 AverageG*/sinδ(kPa) 1.112 1.236 1.174 0.5695 0.6185 0.594δ(°) 84.31 84.09 84.20 86.17 85.94 86.06G*(kPa) 1.107 1.229 1.168 0.5682 0.617 0.593
Temp(°C) Temp(°C)
Sample1 Sample2 Average Sample1 Sample2 AverageG*/sinδ(kPa) 1.085 1.112 1.099 0.547 0.559 0.553δ(°) 84.65 84.53 84.59 86.38 86.38 86.38G*(kPa) 1.081 1.107 1.094 0.546 0.558 0.552
64 70 64 70
G*/sinδ(kPa) 1.13625 0.5735 6.6% 7.1%
δ(°) 84.395 86.2175 0.5% 0.4%
G*(kPa) 1.131 0.572275 6.5% 7.1%
AverageDifference PercentDifference
Top64 70
Bottom64 70

1