Evaluation of Atmospheric Water Generation Technology ...
25
EPA/600/R-18/379 | September 2018 | www.epa.gov/research Evaluation of Atmospheric Water Generation Technology: Microbial Water Quality Office of Research and Development National Exposure Research Laboratory | Systems Exposure Division
Transcript of Evaluation of Atmospheric Water Generation Technology ...
1
photo
EPA/600/R-18/379 | September 2018 | www.epa.gov/research
Evaluation of Atmospheric Water Generation Technology: Microbial Water Quality
Office of Research and Development National Exposure Research Laboratory | Systems Exposure Division

EPA/600/R-18/379 September 2018
Evaluation of Atmospheric Water Generation Technology: Microbial Water Quality
by
Michael Jahne Stacy Pfal ler
Dawn King Jay Garland
Chris Impel l i t ter i 2
Systems Exposure Division Nat ional Exposure Research Laboratory
Cincinnat i , OH 45268
2Safe and Sustainable Water Resources Program Cincinnat i , OH 45268

ii
Notice/Disclaimer Statement
The work described herein was performed under a Cooperative Research and Development Agreement
(CRADA) with Watergen USA. A portion of the work was completed by APTIM Federal Services, LLC
under the Operations Support Services for EPA-Cincinnati Test and Evaluation (T&E) Facility and Other
Contract (EP-C-14-012), Work Assignment 3-06. The views expressed in this report are those of the
authors and do not necessarily represent the views or policies of the U.S. Environmental Protection
Agency. Mention of trade names, products, or services does not convey, and should not be interpreted as
conveying, official EPA approval, endorsement, or recommendation.

iii
Summary
Atmospheric water generators (AWGs) have the potential to expand the availability of water during
shortages, contamination events and interruptions of service. Given the nature of atmospheric water
generation (i.e., condensation of atmospheric water vapor), high quality produced water is generally
anticipated; however, it may not be safe for human consumption. Concentrating large volumes of air can
simultaneously concentrate contaminants, and microbial growth in plumbing and stored water is
possible. An initial review of water quality data provided by Watergen USA (hereafter referred to as
Watergen), a manufacturer of AWG technology, confirmed both the generally high quality of produced
water (e.g., no elemental analyses above current EPA primary or secondary drinking water standards),
but an elevated level of overall microbial numbers (i.e., heterotrophic bacteria). Indicators of fecal
contamination (e.g., fecal coliforms, E. coli) were not detected. The primary microorganisms of human
health concern are therefore opportunistic pathogens, such as Legionella spp. and Mycobacterium spp.,
that are commonly associated with drinking water infrastructure. Detection of these organisms,
particularly L. pneumophila serogroup 1 and M. avium, would constitute a potential health concern. The
objective of this study was to evaluate the microbial quality of untreated condensate and produced
(treated) water from a commercial AWG unit (Watergen GEN-350) during a three-month period.
Opportunistic pathogens were not detected in weekly samples collected; however, high levels of
heterotrophic bacteria, detected using heterotrophic plate counts (HPC) of treated water, indicate
inadequate disinfection and/or microbial regrowth following treatment. The presence of heterotrophic
bacteria does not represent a human health risk, but suggests microbial instability and conditions
favorable for microbial growth. It is therefore recommended that chlorination or ozonation be included
as an additional unit process in the GEN-350 treatment train. While not directly transferrable to other
AWG systems, results of this work emphasize that atmospheric condensate is not sterile and should be
treated adequately prior to potable use. This report covers a period from February 28, 2018 to September
6, 2018 and work was completed as of September 28, 2018.

iv
Foreword
The U.S. Environmental Protection Agency (EPA) is charged by Congress with protecting the Nation's
land, air, and water resources. Under a mandate of national environmental laws, the Agency strives to
formulate and implement actions leading to a compatible balance between human activities and the ability
of natural systems to support and nurture life. To meet this mandate, EPA's research program is providing
data and technical support for solving environmental problems today and building a science knowledge
base necessary to manage our ecological resources wisely, understand how pollutants affect our health,
and prevent or reduce environmental risks in the future.

v
Table of Contents
Notice/Disclaimer Statement ...................................................................................................... ii
Summary ................................................................................................................................... iii
Foreword ................................................................................................................................... iv
Acronyms and Abbreviations .................................................................................................... vii
Acknowledgments ................................................................................................................... viii
1.0 Introduction .......................................................................................................................... 1
2.0 Assessment of Third Party Water Quality Data ................................................................... 2
3.0 AWG Testing - Methods ...................................................................................................... 6
4.0 AWG Testing - Results and Discussion ............................................................................... 8
5.0 AWG Testing - Conclusions and Recommendations ......................................................... 11
6.0 References ........................................................................................................................ 12
Appendix A - Quality Assurance and Quality Control .............................................................. A1
Tables
Table 1. Elements analyzed for product water samples from the Watergen GEN-350 unit .…...2
Table 2. List of measurements for additional analysis of product water samples from the Watergen GEN-350 unit ..……………………………………………………………………….……..3
Table 3. List of measurements for microbial analysis for product water samples from the Watergen GEN-350 unit …………………………………………………………….……………...….4
Table 4. qPCR results for opportunistic pathogens ………………………………………………….8
Table 5. pH and conductivity of treated water ………………………………………………….…....10
Table A1. Method blank and field blank results for microbial analyses ………..…….…..……….A1
Table A2. qPCR controls ………………………………………………………….………………….A2
Table A3. qPCR results for exogenous internal positive controls …………………………...…..A2
Table A4. Daily check standards for pH and conductivity measurements ……….……………..A3

vi
Figures
Figure 1. HPC results ………………………………………………………………………………..9
vii
Acronyms and Abbreviations
AWG Atmospheric water generator
BLQ Below limit of quantification
CBI Confidential business information
CFU Colony forming unit
CRADA Cooperative Research and Development Agreement
Ct Cycle threshold
EPA Environmental Protection Agency
FB Field blank
HDPE High density polyethylene
HPC Heterotrophic plate counts
ICP Inductively coupled plasma
IPC Internal positive control
LOQ Limit of quantification
MB Method blank
MCL Maximum contaminant level
MRDL Maximum residual disinfectant level
MOH Ministry of Health
NERL National Exposure Research Laboratory
NTC No template control
NTU Nephelometric turbidity units
ORD Office of Research and Development
QA Quality assurance
QAPP Quality Assurance Project Plan
qPCR Quantitative polymerase chain reaction
SED Systems Exposure Division
SM Standard Methods for the Examination of Water and Wastewater
SWTR Surface Water Treatment Rule
T&E EPA Test and Evaluation Facility
TDS Total dissolved solids
TT Treatment technique
UV Ultraviolet

viii
Acknowledgments
Brittany Stuart (NERL/SED Quality Assurance Manager) for her exceptional quality assurance support.
John Hall (EPA National Homeland Security Research Center) for facilitating use of the APTIM Federal
Services, LLC contract. Greg Meiners (APTIM), Timothy Kling (APTIM), Josh Weber (EPA National
Risk Management Research Laboratory), and other staff at the Cincinnati Test and Evaluation (T&E)
facility for installation, maintenance, and daily operation of the AWG unit. Avi Peretz (Watergen), Ed
Russo (Watergen), and Watergen's leadership and technical staff for provision of the AWG unit and their
comprehensive support throughout the study. Kenneth Rotert (EPA Office of Water), Lesley D'Anglada
(EPA Office of Water), and Mike Blumenstein (NSF International) for reviewing the draft report.

1
1.0 Introduction
Atmospheric water generators (AWGs) produce potable water from ambient air. These units range from
home-based units that can produce 1 to 20 liters of water per day to commercial-scale units capable of
1,000 to over 10,000 liters per day. Water production rates are highly dependent upon the amount of water
vapor in the atmosphere (i.e., humidity) and temperature of the air. The most commonly used AWG
systems employ condenser and cooling coil technology to pull moisture from the air in the same way a
household dehumidifier does. Significant quantities of energy can be required to operate these condenser
and fan systems, but recent technological advancements have substantially improved the energy-water
ratio, which increases the feasibility of using these systems to provide clean water in a cost-effective way.
EPA has explored the feasibility of AWG systems for different scenarios in recent years. For instance,
EPA’s Office of Land and Emergency Management examined the application of AWGs to supplement or
provide drinking water during Superfund response actions. Although they found the energy cost of AWG
water production to be higher than the cost of obtaining water from a public water supply, they also noted
that AWG water production has a lower cost than providing bottled water in an emergency or alternative
scenario where a public water supply is not available. Recent high-profile natural disasters, such as
Hurricane Harvey, and public water infrastructure failures, such as those that occurred in Flint, Michigan,
have increased the interest in AWG technology as both emergency and longer-term supply solutions.
In August of 2017, EPA’s Office of Research and Development (ORD) announced a Cooperative
Research and Development Agreement (CRADA) developed to further advance the science of AWG and
assess its potential as a water production and supply solution for different scenarios. In January 2018, EPA
signed a CRADA with Watergen, a corporation developing cutting-edge AWG technology, to evaluate
their GEN-350 system (http://water-gen.com/). The GEN-350 is capable of generating nearly 600 liters of
water per day in optimal temperature and humidity conditions. Collected water is periodically recirculated
through a treatment system consisting of a sediment filter, carbon filter, and ultraviolet (UV) disinfection.
It is then delivered on-demand via an integrated tap following mineralization and polish filtration. A test
unit was shipped to EPA lab facilities for collaborative research purposes.
This report covers the results of an overall assessment of the quality of water produced by the AWG. As a
first step, EPA-ORD agreed to review water quality data from the Watergen system provided by a 3rd party
laboratory. The purpose of this effort was to review the data with respect to EPA drinking water standards,
and focus subsequent sampling of the Watergen system by ORD. This evaluation confirmed that the
microbiological quality of atmospherically generated water was of greatest concern, and a long term (3
month) study was conducted to determine the potential for growth of opportunistic microbial pathogens
(Legionella spp. and Mycobacterium spp.) commonly associated with water distribution systems.
2
2.0 Assessment of Third Party Water Quality Data
On October 13, 2017, Watergen provided EPA-ORD commercial laboratory test results on water quality
produced from a GEN-350 unit identical to the unit used for testing under the CRADA with EPA. The
test results were performed on product water samples from the GEN-350 and consisted of two elemental
analyses (conducted on July 12, 2017 and July 16, 2017), a microbiological analysis (conducted July 17,
2017), and an inorganic and microbiological analysis (conducted July 23, 2017). All testing was
performed by AMINOLAB (AMINOLAB LTD. Analytical Laboratory Services, Weizmann Science
Park, 1 Pinhas Sapir St., P.O.B. 4074 Ness Ziona 70400, Israel). The laboratory report indicates that the
samples were collected by “The Customer” (presumed to be Watergen representatives). The summaries
provided below on the results have not undergone a rigorous quality assurance/quality control review by
EPA nor were they performed under an EPA Quality Assurance Project Plan. The following sections
simply describe the results provided to EPA-ORD by Watergen. The specific data are not reported as
they are considered confidential business information (CBI); the following is the ORD review of the
data with respect to EPA drinking water standards.
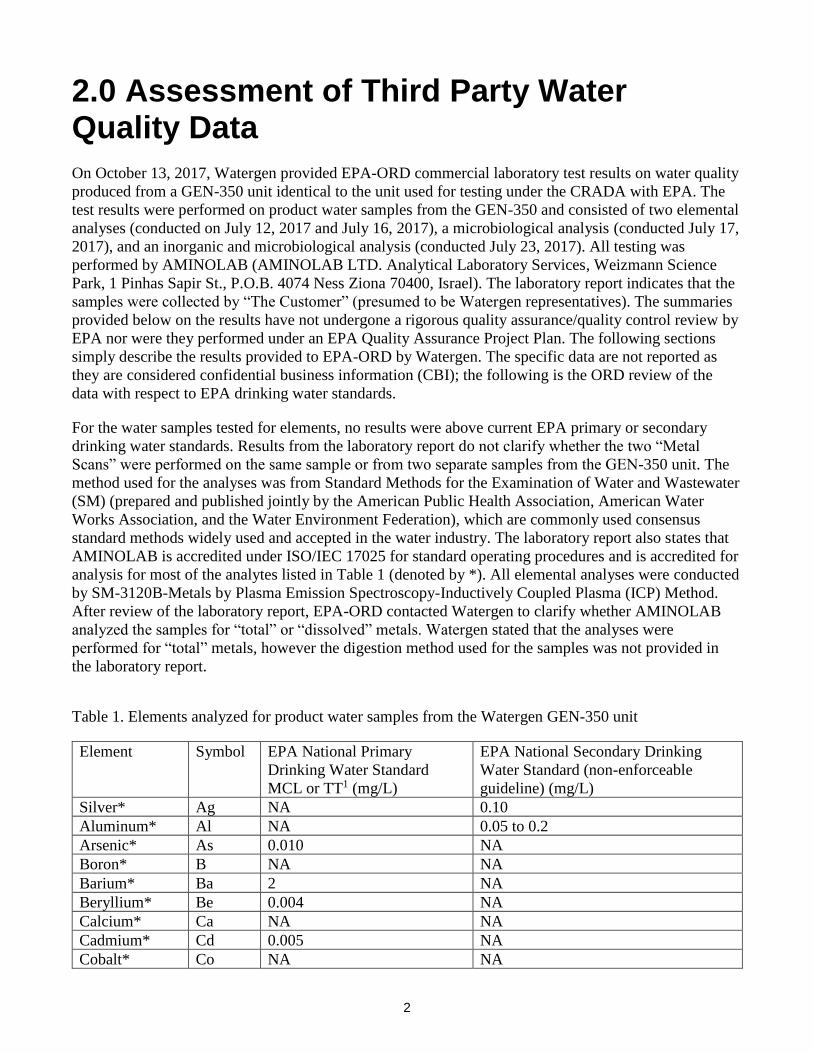
For the water samples tested for elements, no results were above current EPA primary or secondary
drinking water standards. Results from the laboratory report do not clarify whether the two “Metal
Scans” were performed on the same sample or from two separate samples from the GEN-350 unit. The
method used for the analyses was from Standard Methods for the Examination of Water and Wastewater
(SM) (prepared and published jointly by the American Public Health Association, American Water
Works Association, and the Water Environment Federation), which are commonly used consensus
standard methods widely used and accepted in the water industry. The laboratory report also states that
AMINOLAB is accredited under ISO/IEC 17025 for standard operating procedures and is accredited for
analysis for most of the analytes listed in Table 1 (denoted by *). All elemental analyses were conducted
by SM-3120B-Metals by Plasma Emission Spectroscopy-Inductively Coupled Plasma (ICP) Method.
After review of the laboratory report, EPA-ORD contacted Watergen to clarify whether AMINOLAB
analyzed the samples for “total” or “dissolved” metals. Watergen stated that the analyses were
performed for “total” metals, however the digestion method used for the samples was not provided in
the laboratory report.
Table 1. Elements analyzed for product water samples from the Watergen GEN-350 unit
Element Symbol EPA National Primary
Drinking Water Standard
MCL or TT1 (mg/L)
EPA National Secondary Drinking
Water Standard (non-enforceable
guideline) (mg/L)
Silver* Ag NA 0.10
Aluminum* Al NA 0.05 to 0.2
Arsenic* As 0.010 NA
Boron* B NA NA
Barium* Ba 2 NA
Beryllium* Be 0.004 NA
Calcium* Ca NA NA
Cadmium* Cd 0.005 NA
Cobalt* Co NA NA

3
Chromium* Cr 0.1 (total Cr) NA
Copper* Cu 1.3 (TT action level) 1.0
Iron* Fe NA 0.3
Potassium* K NA NA
Lithium* Li NA NA
Magnesium* Mg NA NA
Manganese* Mn NA 0.05
Molybdenum* Mo NA NA
Sodium* Na NA NA
Nickel* Ni NA NA
Phosphorus P NA NA
Lead* Pb 0.015 (TT action level) NA
Sulfur* S NA NA2
Selenium* Se 0.05 NA
Tin Sn NA NA
Strontium Sr NA NA
Titanium Ti NA NA
Vanadium V NA NA
Zinc Zn NA 5 1 MCL = Maximum Contaminant Level. TT = Treatment Technique (a required process intended to
reduce the contaminant level in drinking water). 2 A secondary DW standard exists for sulfate (250 mg/L).
*Analytes for which AMINOLAB is accredited for under ISO/IEC 17025.
Additional analyses performed by AMINOLAB consisted of pH, conductivity, turbidity, free chlorine,
and total chlorine measurements. These measurements are listed in the lab report as “field
measurements”. The field measurements were taken according to the Israeli Ministry of Health’s
sampling guidelines and AMINOLAB was accredited to perform these analyses under ISO/IEC 17025 at
the time of testing. Table 2 provides information on applicable EPA standards for the measurements on
the Watergen GEN-350 product water.
Table 2. List of measurements for additional analysis of product water samples from the Watergen
GEN-350 unit
Analysis EPA National Primary Drinking Water
Standard MCL or TT or Surface Water
Treatment Rule requirement
EPA National Secondary Drinking
Water Standard (non-enforceable
guideline)
pH NA 6.5-8.5 (pH units)
Conductivity NA NA
Turbidity 5 NTU1 NA
Free Chlorine MRDL = 4.02 NA
Total Chlorine MRDL = 4.02 NA 1 NTU = Nephelometric turbidity units. Under the surface water treatment rules, at no time can turbidity
go above this limit (5 NTU). There are additional turbidity requirements for systems that use filtration in
their treatment process (see https://www.epa.gov/dwreginfo/surface-water-treatment-rules). 2 MRDL = Maximum residual disinfectant level. Measured as Cl2. The USEPA MRDL of 4.0 mg/L is
the highest level of a disinfectant allowed in drinking water. Under EPA’s Surface Water Treatment and

4
Groundwater Rules, a minimum chlorine disinfectant residual of 0.2 mg/L is required for most systems
at the entry point to the drinking water distribution system and to be detectable throughout.
It should be noted that, within the lab report provided by Watergen, the Israeli Ministry of Health
(MOH) Requirements for free chlorine in drinking water range from 0.1 mg/L to 0.5 mg/L. Free and
total chlorine results from the GEN-350 product water were less than 0.1 mg/L indicating that the
product water tested did not have a chlorine residual that met Israeli MOH requirements.
EPA surface water treatment rules contain treatment technique requirements for systems that exceed
specified turbidity levels (as noted in Table 2). The Watergen GEN-350 unit contains filtration
components that could be classified as “alternative filtration” within the context of U.S. drinking water
standards which apply to surface water sources (though this report recognizes that the source water for
the Watergen unit would generally not be considered surface water). Under the Long Term 1 Enhanced
Surface Water Treatment Rule, alternative filtration (e.g., membranes, cartridges, or other) turbidity
requirements are set by the state, but must not exceed 1 NTU in 95% percent of samples (taken at least
every 4 hours). If a water system serves populations <500, turbidity monitoring frequency can be
decreased to one sample per day, if approved by EPA. According to the laboratory report, the Israeli
MOH requires that the NTU value be below 1 for drinking water. The turbidity results in the provided
lab report are below 1 NTU.
Results provided in the lab report for one of two samples included total count (heterotrophic plate count-
HPC), coliforms, fecal coliforms, and Streptococcus faecalis/Enterococcus group analyses. All
microbial analyses were performed using widely accepted methods from SM: SM-9215B-Heterotrophic
Plate Count-Pour Plate Method, SM-9222B-Membrane Filter Technique for Members of the Coliform
Group-Standard Total Coliform Membrane Filter Procedure, SM-9222D-Membrane Filter Technique for
Members of the Coliform Group-Fecal Coliform Membrane Filter Procedure, and SM-9230C-Fecal
Streptococcus and Enterococcus Groups-Membrane Filter Techniques were used for total count,
coliforms, fecal coliforms, and Streptococcus faecalis/Enterococcus group, respectively. At the time of
testing, the laboratory report states that AMINOLAB was accredited to perform these analyses under
ISO/IEC 17025 with standard operating procedures and recognized to perform these analyses by the
Israeli Ministry of Health.
The second sample included results for the same microbial contaminants as the first sample, but also
included analysis for Escherichia coli by SM-9222G-Membrane Filter Technique for Members of the
Coliform Group-MF Partition Procedures.
Table 3. List of measurements for microbial analysis for product water samples from the Watergen
GEN-350 unit
Analysis EPA National Primary Drinking Water
Standard MCL or TT or Surface Water
Treatment Rule requirement
EPA National Secondary
Drinking Water Standard (non-
enforceable guideline)
Total Heterotrophic
Bacteria (using HPC
method)
500 CFU/mL1 NA
Coliforms 5.0%2 NA
Fecal Coliforms NA NA

5
Streptococcus
faecalis/Enterococcus
Group
NA NA
E. coli See2 NA 1 CFU = Colony forming units. Under EPA’s surface water treatment rules, systems may use HPC
measurements as an alternative indicator of the presence of a disinfectant residual. Systems in
exceedance of the 500 CFU/mL limit in more than 5% of samples each month for two consecutive
months are in violation of the regulatory requirements. 2 No more than 5.0% of samples can be total coliform-positive in a month. If a system exceeds this level,
they must conduct an assessment of the system. For water systems that collect fewer than 40 routine
samples per month, no more than one sample can be total coliform-positive in a month. Samples that are
positive for total coliforms must be tested for Escherichia coli. The system must also collect repeat
samples (see https://www.epa.gov/dwreginfo/revised-total-coliform-rule-and-total-coliform-rule for
details).
The lab report results from AMINOLAB reported no detections (<1 CFU/100 mL) for coliforms, fecal
coliforms and Streptococcus faecalis/Enterococcus group for samples one and two. Sample two was also
reported as a non-detect (<1 CFU/100 mL) for E. coli. Heterotrophic plate count results (listed as total
counts in the lab report) exceeded the EPA National Primary Drinking Water Standard value in both
samples (>500 CFU/mL).
The two main issues identified from the laboratory report from Watergen on product water from the
GEN-350 unit are: 1) absence of a disinfectant residual and 2) elevated HPC values for the product
water. In addition to adding a disinfectant to Watergen GEN-350 product water, it is also recommended
that product water turbidity be monitored every 4 hours or once daily (with state approval) during water
production. The elevated HPC levels suggest that the extent and nature of microbial growth within the
product water should be quantified during longer term operation; results of this study are presented
below.

6
3.0 AWG Testing - Methods
Following a 1-month period of acclimation, the GEN-350 was sampled on an approximately weekly basis
for 3 months to assess the microbial water quality of both raw (untreated) and treated product water. These
analyses included HPC and quantitative polymerase chain reaction (qPCR) for opportunistic pathogens L.
pneumophila serogroup 1, M. avium, and M. intracellulare. In addition, pH and conductivity of the treated
water were monitored to ensure that they remained within manufacturer operating range. To maintain
production and sampling of fresh water, the GEN-350 was routinely drained on Mondays and Thursdays
or when the unit was entirely full; microbial samples were typically collected on Wednesdays and pH and
conductivity measurements were typically performed on Mondays prior to draining. The GEN-350 was
operated indoors in a heated but not air-conditioned facility.
During each microbial sampling event (n=10), the unit's ambient temperature water tap was disinfected
using 70% isopropyl alcohol wipes prior to collection of 15L treated water into a 20L HDPE carboy.
Additionally, up to 2L untreated condensate (depending on quantity available) was manually collected into
1L HDPE bottles by removing the plastic quick-release plug from the bottom of the stainless-steel canister
that collects water directly from the evaporators. All sample containers were cleaned using a 10% bleach
solution, neutralized, and autoclaved (15 min at 15 psi and 121°C) prior to use. During 3 sampling events
(beginning, middle, and end of study), field blanks were collected by pouring 1L molecular grade water
into the 20L HDPE carboy and back into a 1L HDPE collection bottle.
Upon receipt at the laboratory, samples were mixed by shaking and subsampled for various analyses. For
the treated water, 1L subsamples were poured into clean, autoclaved 1L HDPE containers for each of the 4
analyses (HPC and 3 qPCR targets); 10L of the remainder was reserved for future metagenomic microbial
community analysis (not included in this report). For the raw (untreated) water, the sample was either
divided in half (7 samples) into clean, autoclaved 1L HDPE containers or, if the volume was ≤0.5L, the
entire volume was used for either HPC and qPCR or metagenomics, alternating between the analyses sets
(3 samples).
DNA was extracted for qPCR as described by Beumer et al. (2015). Briefly, subsamples were vacuum
filtered; bead-beaten to disrupt bacterial cells; treated to remove proteins, RNA, and other cellular debris;
and precipitated by alcohol prior to DNA resuspension in 50µL molecular grade water. Method blanks
were prepared during each batch of sample processing by substituting 1L molecular grade water for
experimental samples. qPCR was performed in triplicate on the Applied Biosystems StepOnePlus
instrument using 5µL (for L. pneumophila) or 10µL (for M. avian and M. intracellulare) extracted DNA
and primer/probe sets reported by Merault et al. (2011) and Chern et al. (2015), respectively. No template
controls (NTCs) were maintained on each qPCR plate, and PCR inhibition was monitored using an
exogenous internal positive control (IPC) added to each reaction. If applicable, sample concentrations
were determined by interpolation of cycle threshold (Ct) values against a master standard curve prepared
from 10-fold serial dilutions of quantified genomic DNA included on each plate. Limits of quantification
(LOQs) were based on the lowest-concentration quantifiable standard (10 gene copies/PCR reaction for
each target) and were 100 gene copies/L sample for L. pneumophila and 50 gene copies/L sample for M.
avian and M. intracellulare. Severe sample PCR inhibition was identified by IPC Ct>40 (i.e., IPC not
measurable during the 40-cycle reaction).
HPC methods followed Standard Method 9215C (APHA 2017), using R2A agar and 7-day incubation at
25°C. Multiple dilutions of each sample, typically ranging from undiluted to 1:100 in sterile molecular
biology-grade water, were analyzed in duplicate. Sample concentrations were determined by averaging
each replicate containing ≥30 and ≤500 colony forming units (CFU) per plate. Negative controls, which

7
included filtered, sterile molecular biology-grade water, were included with each processing batch.
pH and conductivity were measured using a YSI 556 Multi-Probe System following manufacturer
instructions. Monthly calibrations were performed and check standards analyzed with each weekly sample.

8
4.0 AWG Testing - Results and Discussion
Opportunistic pathogens L. pneumophila serogroup 1, M. avium, and M. intracellulare were not detected
in any raw or treated water samples (Table 1). However, the last four treated water samples were PCR-
inhibited and pathogen detection was therefore undetermined. The source of this inhibition remains
unknown; however, fine gray debris were noted when filtering the treated water. All qPCR method
blanks and NTCs were negative; one field blank was positive for M. avium, but this finding did not
impact study results (corresponding experimental samples were negative). All standards within the range
of quantification (101–106 copies/PCR reaction) were positive; infrequent cases of nonlinearity among
serial dilutions did not impact negative sample determinations. While failure to detect opportunistic
pathogens in raw and treated waters suggests low health risk from these organisms during the study
period, high heterotrophic bacteria counts (see below) indicate microbial instability and therefore the
potential for their colonization. L. pneumophila has been previously detected in untreated condensate
from home air conditioning units, which are functionally similarly to AWG (Alipour et al. 2015).
Table 4. qPCR results for opportunistic pathogens
1 BLQ = Below limit of quantification: <50 gene copies/L for M. avium and M. intracellulare; <100
gene copies/L for L. pneumophila serogroup 1. 2 Undetermined due to sample inhibition of PCR reaction.
HPC results are shown in Figure 1. Treated water exceeded the EPA alternative disinfectant residual
limit (≤500 CFU/mL) for drinking water systems using surface water in 9/10 samples. This standard
does not apply to AWG source waters, which lack the fecal influences associated with surface water
(EPA 2018). However, while high levels of heterotrophic bacteria are not directly associated with
human health risk, it does indicate microbial instability of the water and is evidence of inadequate
Collection Date M. avium M. intracellulare L. pneumophila serogroup 1
Raw 3/14/2018 BLQ1 BLQ BLQ
Water 3/21/2018 BLQ BLQ BLQ
3/29/2018 BLQ BLQ BLQ
4/18/2018 BLQ BLQ BLQ
4/26/2018 BLQ BLQ BLQ
5/17/2018 BLQ BLQ BLQ
5/24/2018 BLQ BLQ BLQ
5/30/2018 BLQ BLQ BLQ
Treated 3/14/2018 BLQ BLQ BLQ
Water 3/21/2018 BLQ BLQ BLQ
3/29/2018 BLQ BLQ BLQ
4/5/2018 BLQ BLQ BLQ
4/18/2018 BLQ BLQ BLQ
4/26/2018 BLQ BLQ BLQ
5/2/2018 Undetermined2 Undetermined Undetermined
5/17/2018 Undetermined Undetermined Undetermined
5/24/2018 Undetermined Undetermined Undetermined
5/30/2018 Undetermined Undetermined Undetermined

9
disinfection and/or regrowth of bacteria following treatment (Bartram et al. 2003). Previous studies of
commercial air handing units have demonstrated both low (100–101 most probable number/mL; Glawe
et al. 2016) and high (105–107 CFU/mL; Hugenholtz and Fuerst 1992) HPC in untreated atmospheric
condensate collections, suggesting large variability in the quality of these waters. No growth was
observed for field blanks, and two method blanks with a single colony each did not impact sample
interpretation (concentrations negligible compared to corresponding samples). Routine service,
including filter replacement and chlorine disinfection of the unit, did not reliably improve treated water
HPC.
Figure 1. HPC results
pH of the treated water ranged 6.01–7.78 (Table 2), within or near the operating range reported by
Watergen (6.5–8.5). Three samples were below the non-enforceable EPA secondary standard for pH
(6.5–8.5); low pH may result in bitter metallic taste and corrosion, but does not present a health concern

10
(EPA 2018). Conductivity of treated samples was very low (18–114 μS/cm), frequently below Watergen
estimates (approximately 78-313 μS/cm based on reported 50-200 mg/L total dissolved solids (TDS)).
The EPA secondary standard for TDS is <500 mg/L (approximately 782 μS/cm); low conductivity does
not present a health concern.
Table 5. pH and conductivity of treated water
Collection Date pH Conductivity (µS/cm)
3/15/2018 6.69 25
3/19/2018 6.01 33
3/26/2018 6.22 37
4/2/2018 7.19 97
4/9/2018 7.50 82
4/17/2018 7.78 45
4/24/2018 6.79 61
4/30/2018 7.61 74
5/7/2018 7.52 71
5/14/2018 7.11 94
5/21/2018 7.31 77
5/29/2018 7.01 83
6/4/2018 7.02 68

11
5.0 AWG Testing - Conclusions and Recommendations
An initial review of water quality data provided by Watergen confirmed the generally high quality of
atmospherically generated water (e.g., no elemental analyses above current EPA primary or secondary
drinking water standards), but an elevated level of overall microbial numbers (i.e., heterotrophic plate
counts). Subsequent testing by EPA-ORD focused on potential microbiological risks and found no
detections of opportunistic pathogens in the generated water during 3 months of continuous operation. The
high heterotrophic bacteria levels of both raw and treated AWG waters indicate that they are suitable
environments for microbial growth. This also suggests that either the treatment system is inadequate for
bacterial removal and/or that significant regrowth occurs post-treatment in distribution lines. These
concerns could be addressed by incorporating chlorination or ozonation as an additional disinfection
process in the treatment system and ensuring that a residual concentration of the disinfectant is maintained
throughout the distribution line. The observed visible debris and PCR inhibition at the end of the study
should be examined further to diagnose causes and assess their potential impact on drinking water quality.

12
6.0 References
Alipour, V., Mahvi, A.H. and Rezaei, L., 2015. Quantitative and qualitative characteristics of condensate
water of home air-conditioning system in Iran. Desalin. Water Treat. 53(7):1834–1839.
APHA, 2017. Standard Methods for the Examination of Water and Wastewater. American Public Health
Association, Washington, DC.
Bartram, J., Cotruvo, J.A., Exner, M., Fricker, C. and Glasmacher, A. eds., 2003. Heterotrophic plate
counts and drinking-water safety. IWA publishing, London, UK.
Beumer, A., King, D., Donohue, M., Mistry, J., Covert, T. and Pfaller, S., 2010. Detection of
Mycobacterium avium subsp. paratuberculosis in drinking water and biofilms by quantitative PCR.
Appl. Environ. Microbiol. 76(21):7367–7370.
Chern, E.C., King, D., Haugland, R. and Pfaller, S., 2015. Evaluation of quantitative polymerase chain
reaction assays targeting Mycobacterium avium, M. intracellulare, and M. avium subspecies
paratuberculosis in drinking water biofilms. J. Water Health 13(1):131–139.
EPA, 2018. 2018 Edition of the Drinking Water Standards and Health Advisories Tables. U.S.
Environmental Protection Agency, Office of Water, Washington, DC. EPA 822-F-18-001.
Glawe, D., Wooten, M. and Lye, D., 2016. Quality of condensate from air-handling units. ASHRAE J.
58(12):14–23.
Hugenholtz, H. and Fuerst, J.A., 1992. Heterotrophic bacteria in an air-handling system. Appl. Environ.
Microbiol. 58(12):3914–3920.
Merault, N., Rusniok, C., Jarraud, S., Gomez-Valero, L., Cazalet, C., Marin, M., Brachet, E., Aegerter,
P., Gaillard, J.L., Etienne, J. and Herrmann, J.L., 2011. Specific real-time PCR for simultaneous
detection and identification of Legionella pneumophila serogroup 1 in water and clinical samples. Appl.
Environ. Microbiol. 77(5):1708–1717.

A1
Appendix A - Quality Assurance and Quality Control
AWG testing was performed under the NERL Quality Assurance Project Plan (QAPP) "Evaluating the
Microbial Quality of Atmospheric Water Generator Condensate" (D-SED-0031412-QP-1-0, effective date
2/28/18); third party data provided by Watergen was not subject to EPA quality assurance (QA)
procedures and was not collected under an approved QAPP. Audits of data quality (ADQ) for EPA AWG
testing were conducted on 8/2/2018–8/3/2018 for microbial analyses and on 8/24/2018 for pH and
conductivity measurements. All findings were addressed following corrective actions approved by the
NERL/SED QA Manager and did not impact interpretation of results.
Tables A1–A4 summarize the results of QA controls during AWG testing by EPA. Observed HPC growth
on two method blanks (3/14/2018 and 5/2/2018; Table A1) consisted of a single colony each and had a
negligible impact on corresponding sample measurements (may be overestimated by 10 CFU/mL,
representing <2% difference in sample concentrations). Detection of M. intracellulare in the 4/18/2018
field blank (Table A1) was at an average Ct of 39.06, close to the Ct <40 cutoff for positive determination
and representing approximately one gene copy; study results were unimpacted since the target was not
detected in any experimental samples. qPCR standard curves (106–100 copies in Table A2) demonstrated
successful PCR amplification of control DNA and quantification limits of 101 copies (lowest concentration
standards with reliable detection), but were not used for quantification of samples due to non-detection of
the targets; all qPCR NTCs were successfully negative. Results of the exogenous IPC (Table A3) indicate
that all raw water samples and the first six treated water samples (3/14/2018–4/26/2018) did not
significantly inhibit the PCR (IPC within acceptable range), yet the final four treated water samples
(5/2/2018–5/30/2018) completely inhibited the reaction (no detection of the IPC), rendering associated
pathogen determinations inconclusive. All check standards for pH and conductivity measurements (Table
A4) were within acceptable ranges.
Table A1. Method blank and field blank results for microbial analyses; target concentration is zero
CFU/mL or below limit of quantification (BLQ)
Collection
Date
Blank
Type1
HPC
(CFU/mL)
M. avium
(gene copies/L)
M. intracellulare
(gene copies/L)
L. pneumophila
serogroup 1
(gene copies/L)
3/14/2018 MB 10 BLQ2 BLQ BLQ
3/14/2018 FB 0 BLQ BLQ BLQ
3/21/2018 MB 0 BLQ BLQ BLQ
3/27/2018 MB 0 BLQ BLQ BLQ
3/29/2018 MB 0 BLQ BLQ BLQ
4/5/2018 MB 0 BLQ BLQ BLQ
4/18/2018 MB 0 BLQ BLQ3 BLQ
4/18/2018 FB Not performed BLQ 0.96 BLQ
4/26/2018 MB 0 BLQ BLQ BLQ
5/2/2018 MB 10 BLQ BLQ BLQ
5/17/2018 MB 0 BLQ BLQ BLQ
5/24/2018 MB 0 BLQ BLQ BLQ

A2
5/30/2018 MB 0 BLQ BLQ BLQ
5/30/2018 FB 0 BLQ BLQ BLQ 1 MB = Method blank. FB = Field blank. 2 BLQ = Below limit of quantification: <50 gene copies/L for M. avium and M. intracellulare; <100 gene
copies/L for L. pneumophila serogroup 1. 3 1 of 3 replicates positive at a concentration of 0.86 gene copies/L; 2 of 3 replicates positive is considered
a positive result.
Table A2. qPCR controls; Ct <40 is considered a positive result and are otherwise reported as
Undetermined
Control Plate # M. avium
(Ct)
M. intracellulare
(Ct)
L. pneumophila serogroup 1
(Ct)
106 copies 1 22.72 18.65 17.71
105 copies 1 26.33 22.23 21.65
104 copies 1 30.01 25.81 24.93
103 copies 1 33.18 29.16 28.37
102 copies 1 35.98 32.69 31.99
101 copies 1 38.25 35.79 35.26
100 copies 1 Undetermined Undetermined Undetermined
NTC1 1 Undetermined Undetermined Undetermined
NTC 1 Undetermined Undetermined Undetermined
106 copies 2 22.71 18.70 17.79
105 copies 2 26.16 22.29 21.70
104 copies 2 29.99 25.71 25.10
103 copies 2 33.18 29.25 28.53
102 copies 2 36.32 32.66 32.27
101 copies 2 38.95 35.49 33.84
100 copies 2 Undetermined Undetermined 38.83
NTC 2 Undetermined Undetermined Undetermined
NTC 2 Undetermined Undetermined Undetermined 1 NTC = No template control.
Table A3. qPCR results for exogenous internal positive controls (average of 3 replicates); acceptable Ct
range is 25.40–28.40 and Undetermined indicates a completely inhibited reaction
Collection Date M. avium
(Ct)
M. intracellulare
(Ct)
L. pneumophila serogroup 1
(Ct)
Raw 3/14/2018 26.78 26.78 26.65
Water 3/21/2018 26.80 26.80 26.59
3/29/2018 26.62 26.62 26.56
4/18/2018 26.77 26.77 26.50
4/26/2018 26.75 26.75 26.51
5/17/2018 26.86 26.86 26.64
5/24/2018 26.92 26.92 26.65

A3
Table A4. Daily check standards for pH and conductivity measurements; acceptable ranges are 5.8–6.2
and 95–105 µS/cm, respectively
Collection Date pH Conductivity (µS/cm)
3/15/2018 6.01 97
3/19/2018 6.00 Not performed
3/26/2018 6.02 Not performed
4/2/2018 6.01 10001
4/9/2018 5.99 104
4/17/2018 5.99 104
4/24/2018 6.04 105
4/30/2018 6.05 103
5/7/2018 8.012 104
5/14/2018 7.952 96
5/21/2018 6.02 105
5/29/2018 8.012 104
6/4/2018 7.972 104 1 Substituted 1000 µS/cm standard due to exhausted reagent; acceptable range 995–1005 µS/cm. 2 Substituted pH 8 standard due to sample pH noted >7; acceptable range 7.8–8.2.
5/30/2018 26.63 26.63 26.54
Treated 3/14/2018 26.82 26.82 26.49
Water 3/21/2018 27.96 27.96 27.62
3/29/2018 26.72 26.72 26.44
4/5/2018 26.80 26.80 26.59
4/18/2018 26.95 26.95 26.78
4/26/2018 28.26 28.26 27.99
5/2/2018 Undetermined Undetermined Undetermined
5/17/2018 Undetermined Undetermined Undetermined
5/24/2018 Undetermined Undetermined Undetermined
5/30/2018 Undetermined Undetermined Undetermined

Office of Research and
Development (8101R)
Washington, DC 20460
Offal Business Penalty for Private Use $300
PRESORTED STANDARD POSTAGE
& FEES PAID EPA PERMIT NO. G-35