EVALUATION OF ARIVU EDUCATIONAL LOAN SCHEME …
180
GOVERNMENT OF KARNATAKA EVALUATION OF ARIVU EDUCATIONAL LOAN SCHEME IMPLEMENTED BY D DEVARAJ URS BACKWARD CLASSES DEVELOPMENT CORPORATION IN KARNATAKA (2011-12 to 2017-18) KARNATAKA EVALUATION AUTHORITY DEPARTMENT OF PLANNING, PROGRAMME MONITORING AND STATISTICS GOVERNMENT OF KARNATAKA SEPTEMBER 2020
Transcript of EVALUATION OF ARIVU EDUCATIONAL LOAN SCHEME …

GOVERNMENT OF KARNATAKA
EVALUATION OF ARIVU EDUCATIONAL LOAN
SCHEME IMPLEMENTED BY D DEVARAJ URS
BACKWARD CLASSES DEVELOPMENT
CORPORATION IN KARNATAKA (2011-12 to 2017-18)
KARNATAKA EVALUATION AUTHORITY
DEPARTMENT OF PLANNING, PROGRAMME MONITORING AND STATISTICS
GOVERNMENT OF KARNATAKA
SEPTEMBER 2020


EVALUATION OF ARIVU EDUCATIONAL LOAN
SCHEME IMPLEMENTED BY D DEVARAJ URS
BACKWARD CLASSES DEVELOPMENT
CORPORTAION IN KARNATAKA (2011-12 to 2017-18)
NAME OF PRINCIPAL INVESTIGATOR – Dr. M D USHA DEVI
NAME OF ECO:
GRASSROOTS RESEARCH AND ADVOCACY MOVEMENT
DEPARTMENT NAME:
D DEVARAJ URS BACKWARD CLASSES DEVELOPMENT
CORPORATION
KARNATAKA EVALUATION AUTHORITY
DEPARTMENT OF PLANNING, PROGRAMME MONITORING AND STATISTICS
GOVERNMENT OF KARNATAKA
SEPTEMBER 2020

©Karnataka Evaluation Authority, 2020
Published
For:
Karnataka Evaluation Authority,
#542, 5th Floor, 2nd Stage,
M.S. Building, Dr. Ambedkar Veedhi,
Bengaluru – 560 001.
By:
Grassroots Research and Advocacy Movement
CA-II, KIADB Industrial Housing Area
Hebbal Ring Road
Mysore, Karnataka, India – 570 016
Land line: 0821 – 2415412
Mail Id: [email protected]
Printer and Typeset Details:
SPC Enterprises,
# 36, NS Ayyangar road,
Seshadripuram, Bangalore 20
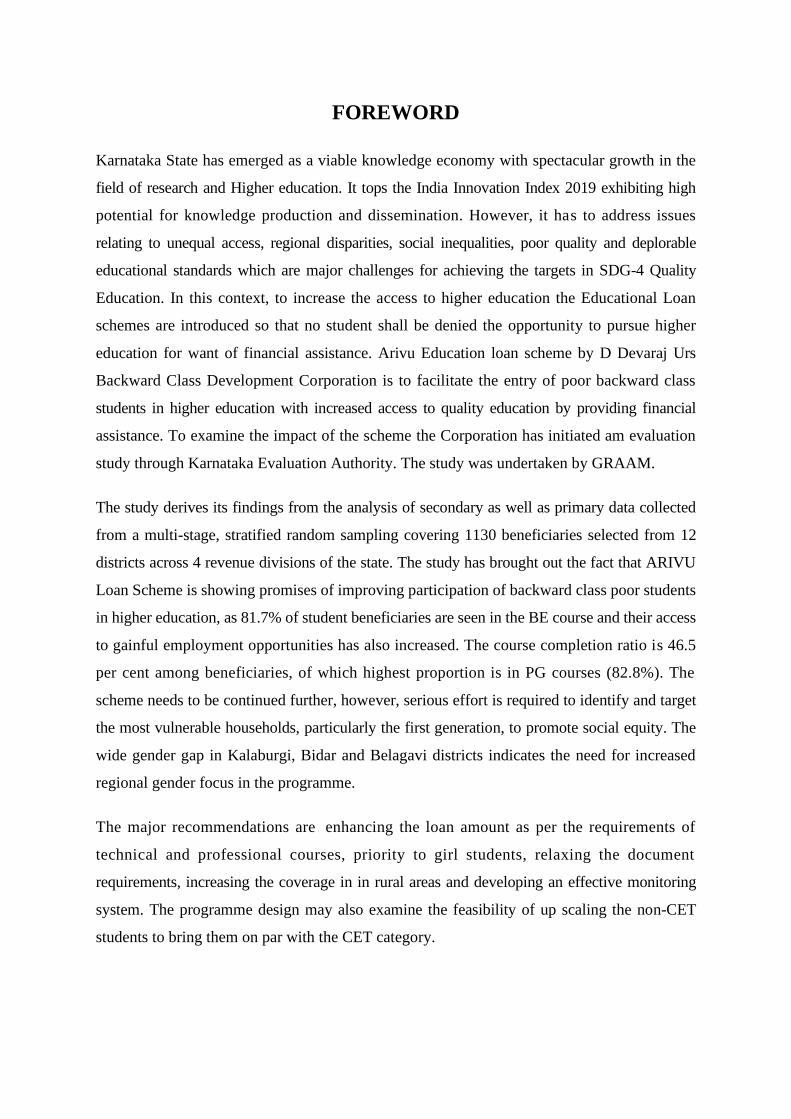
FOREWORD
Karnataka State has emerged as a viable knowledge economy with spectacular growth in the
field of research and Higher education. It tops the India Innovation Index 2019 exhibiting high
potential for knowledge production and dissemination. However, it has to address issues
relating to unequal access, regional disparities, social inequalities, poor quality and deplorable
educational standards which are major challenges for achieving the targets in SDG-4 Quality
Education. In this context, to increase the access to higher education the Educational Loan
schemes are introduced so that no student shall be denied the opportunity to pursue higher
education for want of financial assistance. Arivu Education loan scheme by D Devaraj Urs
Backward Class Development Corporation is to facilitate the entry of poor backward class
students in higher education with increased access to quality education by providing financial
assistance. To examine the impact of the scheme the Corporation has initiated am evaluation
study through Karnataka Evaluation Authority. The study was undertaken by GRAAM.
The study derives its findings from the analysis of secondary as well as primary data collected
from a multi-stage, stratified random sampling covering 1130 beneficiaries selected from 12
districts across 4 revenue divisions of the state. The study has brought out the fact that ARIVU
Loan Scheme is showing promises of improving participation of backward class poor students
in higher education, as 81.7% of student beneficiaries are seen in the BE course and their access
to gainful employment opportunities has also increased. The course completion ratio is 46.5
per cent among beneficiaries, of which highest proportion is in PG courses (82.8%). The
scheme needs to be continued further, however, serious effort is required to identify and target
the most vulnerable households, particularly the first generation, to promote social equity. The
wide gender gap in Kalaburgi, Bidar and Belagavi districts indicates the need for increased
regional gender focus in the programme.
The major recommendations are - enhancing the loan amount as per the requirements of
technical and professional courses, priority to girl students, relaxing the document
requirements, increasing the coverage in in rural areas and developing an effective monitoring
system. The programme design may also examine the feasibility of up scaling the non-CET
students to bring them on par with the CET category.

I expect that the findings and recommendations of the study will be useful to the Government
and D Devaraj Urs Backward Class Development Corporation for taking up the necessary
modifications in scheme design and implementation.
The study received support and guidance of the Additional Chief Secretary Planning,
Programme Monitoring and Statistics Department, Government of Karnataka. The report was
approved in 47th Technical Committee meeting. The review of the draft report by KEA,
members of the Technical Committee and an Independent Assessor, has provided useful
insights and suggestions to enhance the quality of the report. I duly acknowledge the assistance
rendered by all in successful completion of the study.
Chief Evaluation officer
Karnataka Evaluation Authority

ACKNOWLEDGEMENTS
Foremost, we would like to express our gratitude to Dr. Shalini Rajneesh, IAS., Additional
Chief Secretary to the Government, Planning, Programme Monitoring & Statistics Department,
Government of Karnataka. We also thank Karnataka Evaluation Authority (KEA), Department
of Planning for the opportunity to conduct this study. We thank Mr. Sudarshan G.A., Chief
Evaluation Officer KEA for his leadership and guidance throughout the study. We would also
like to thank Dr.Chaya K Degaonkar, Additional Chief Evaluation Officer of KEA for the
technical support and guidance throughout the study. We Thank Ms. Jyothi S. Jenni, Associate
Director for all the administrative support during the study.
Our sincere thanks to D Devaraj Urs Backward Classes Development Corporation for their
kind cooperation in providing secondary data and other inputs that have been very valuable for
this study.
Our sincere appreciation and thanks to the contribution of Dr M D Usha Devi who has not only
led this study but has also been centrally involved in drafting and modifying the report in its
multiple iterations. Our sincere thanks to Dr Syed Ajmal Pasha, former Senior Research
Fellow, GRAAM, who has played a critical role at all stages of the study.
We would like to thank the community consultation team and project management team at
GRAAM for effective management of data collection and constant communication with KEA
respectively. Our special thanks to enumerators and NGOs who helped us complete the data
collection despite difficulties due to floods and other field imperatives.
We are thankful to all the study participants i.e. the beneficiaries of the scholarships who shed
light on their experience of the scholarship, the non-beneficiaries and the officials who
provided insights on the process side. Without them it would not have been possible to do this
piece of work.
Sd/-
(Dr. Basavaraju R)
Executive Director, GRAAM

Study Team:
• Dr M D Usha Devi, Principal Investigator
• Dr Basavaraju R Shreshta, Executive Director, GRAAM – Project Director
• Dr Syed Ajmal Pasha, Senior Research Fellow, GRAAM – Project Holder
• Dr Rajendra Prasad, Senior Research Fellow, GRAAM – Study Core Team Member
• Ramya S, Research Associate (Statistics), GRAAM - Statistician
• Dr. Shivaprasad BM, Senior Research Associate, GRAAM – Data Collection and
Analysis Support
TABLE OF CONTENTS
Executive Summary ................................................................................................................. 1
CHAPTER - 1 ............................................................................................................................ 7
INTRODUCTION .................................................................................................................. 7
1.1 Background about ARIVU Educational Loan Scheme: .............................................. 7
1.2 Problem Statement ...................................................................................................... 9
1.3 The Purpose of Evaluation .......................................................................................... 9
1.4 Objectives of the Study: ............................................................................................ 10
CHAPTER - 2 .......................................................................................................................... 11
METHODOLOGY ............................................................................................................... 11
2.1 Theory of Change ...................................................................................................... 11
2.2 Data Collection Methods and Analysis ..................................................................... 13
2.3 Sampling Design and Research Tools ....................................................................... 17
2.3.1 Selection of sample student beneficiaries of Arivu Scheme .............................. 18
2.3.2 Research Tools: Description .............................................................................. 19
2.3.3 Data Analysis ..................................................................................................... 19
CHAPTER - 3 .......................................................................................................................... 21
LITERATURE REVIEW ..................................................................................................... 21
3.1 Student loan for higher education: Studies in India .................................................. 21
3.2 Student loan for higher education: International contexts ........................................ 25
CHAPTER - 4 .......................................................................................................................... 31
EMPIRICAL ANALYSIS ................................................................................................... 31
4.1 Progress, Spread and Coverage at the State Level .................................................... 31
4.1.1 Coverage across Caste Groups........................................................................... 33
4.1.2 Arivu Beneficiaries under CET Category .......................................................... 37
4.1.3 Beneficiary Coverage across Higher Education Courses: Time Series Analysis
37
4.1.4 Beneficiary Coverage across Categories: Time Series Analysis ....................... 39
4.1.5 Beneficiary Coverage: Gender-Wise and Regional Analysis ............................ 41
4.1.6 Beneficiary Coverage: Category & Regional Analysis ..................................... 43
4.1.7 Beneficiary Coverage: Higher Education Courses & Regional Analysis .......... 44
4.2 Arivu Education Loan Beneficiaries: Background ................................................... 46
4.2.1 Landholding Status ............................................................................................ 46
4.2.2 Household Assets Owned by Beneficiaries ....................................................... 48
4.2.3 Student Beneficiaries by Type of College, Parents Occupation and Income .... 50

4.3 Beneficiary and Stakeholders’ Perceptions about Arivu Loan Scheme .................... 53
4.3.1 Continuation of Arivu Loan Scheme and Adequacy of Loan Amount ............. 53
4.3.2 Benefit and Utility of the Scheme ...................................................................... 54
4.3.3 Non-Economic Benefits of Arivu Loan ............................................................. 54
4.3.4 Utilisation of Arivu Education Loan .................................................................. 55
4.3.5 Release of Loan: Mode of Payment, Timeliness ............................................... 56
4.3.6 Timeliness of Loan Release ............................................................................... 57
4.4 Effectiveness of Arivu Scheme Implementation ....................................................... 58
4.4.1 Beneficiary Selection Procedure: Problems and Issues ..................................... 60
4.4.2 Beneficiary Perceptions about Scheme Implementation: Easy Accessibility .... 60
4.4.3 Beneficiary Perceptions about Procedural Requirements .................................. 61
4.5 Arivu Education Loan Impact on Educational Outcomes ......................................... 64
4.5.1 Arivu Impact on Course Completion Ratio ....................................................... 64
4.5.2 Arivu Education Loan Impact on Employment ................................................. 68
4.6 Expenditure Incurred by Beneficiaries during their study period ............................. 76
4.7 Loan Repayment Status of Arivu Beneficiaries ........................................................ 81
4.7.1 Loan repayment status among employed and unemployed beneficiaries .......... 82
4.7.2 Loan repayment status among male-female Beneficiaries ................................ 83
4.7.3 Loan repayment status across four BC categories ............................................. 84
4.7.4 Loan repayment across different courses ........................................................... 86
4.7.5 Loan repayment status across different management types ............................... 87
4.7.6 Loan repayment status across districts/divisions ............................................... 87
4.8 Logistic Regression ................................................................................................... 89
4.9 Beneficiary Awareness about Arivu Education Loan ............................................... 90
4.9.1 Eligibility Criteria .............................................................................................. 91
4.9.2 Selection & Application Procedure ................................................................... 92
4.9.3 Beneficiary Awareness about Documents required ........................................... 95
4.10 Reasons and Constraints for Low Access & Poor Participation ............................... 96
4.11 A Comparative Analysis of Non-Beneficiaries ......................................................... 97
4.12 Case Study of a Female Student Beneficiary ............................................................ 98
4.13 Comparative Analysis of Arivu Scheme with Similar Schemes from Other States 101
CHAPTER - 5 ........................................................................................................................ 103
FINDINGS, SUGGESTIONS, AND RECOMMENDATIONS........................................ 103
5.1 Major Findings ........................................................................................................ 103
5.2 Suggestions and Recommendations ........................................................................ 108

ANNEXURE ......................................................................................................................... 111
IDIs (In-depth Interviews) and ........................................................................................... 111
FGDs (Focused Group Discussions) Analysis ................................................................... 111
BIBLIOGRAPHY .............................................................................................................. 115
APPENDIX ........................................................................................................................... 119
Questionnaire / Schedule .................................................................................................... 119
Terms of Reference for the Study ...................................................................................... 145
Study Photographs.............................................................................................................. 162

LIST OF TABLES
Table 2.1 Evaluation Matrix .................................................................................................... 13
Table 2.2 Sampling Design ...................................................................................................... 17
Table 4.1 Progress of ARIVU Education Loan Scheme at the State Level ............................ 32
Table 4.2 Physical & Financial Allocation & Achievement of Arivu Loan for Nomadic &
Semi-Nomadic BC students at the State Level ........................................................................ 34
Table 4.3 Physical & Financial allocation & Achievement of Arivu Loan for Madivala BC
students at the State Level........................................................................................................ 34
Table 4.4 Physical & Financial allocation & Achievement of Arivu Loan for Savitha BC
students at the State Level........................................................................................................ 35
Table 4.5 Physical & Financial allocation & Achievement of Arivu Loan for Kumbara BC
students at the State Level........................................................................................................ 35
Table 4.6 Physical & Financial allocation & Achievement of Arivu Loan for Tigala BC
students at the State Level........................................................................................................ 36
Table 4.7 Physical & Financial allocation & Achievement of Arivu Loan for Uppara BC
students at the State Level........................................................................................................ 36
Table 4.8 Physical & Financial allocations under CET (Overall State) .................................. 37
Table 4.9 Arivu Education Beneficiaries in CET and Non-CET courses ................................ 38
Table 4.10 Arivu beneficiary coverage under different courses for category I students ......... 39
Table 4.11 Arivu beneficiary coverage under different courses for category IIA students ..... 40
Table 4.12 Arivu beneficiary coverage under different courses for category IIIA students ... 40
Table 4.13 Arivu beneficiary coverage under different courses for category IIIB students .... 41
Table 4.14 Gender- wise Coverage across Sample Districts (Universe-All Beneficiaries) .... 42
Table 4.15 BC category- wise Coverage across Sample districts (Universe-All Beneficiaries)
.................................................................................................................................................. 43
Table 4.16 Course-wise distribution & coverage of beneficiaries in the sample districts
(Universe-All Beneficiaries) .................................................................................................... 45
Table 4.17 Land owning status of the Arivu Beneficiaries ..................................................... 47
Table 4.18 Landowning Status across Beneficiary Categories ................................................ 47
Table 4.19 Type of Land Owned Across Beneficiary Categories ........................................... 48
Table 4.20 Household Assets owned by Beneficiaries across districts ................................... 49
Table 4.21 Beneficiaries by Type of College .......................................................................... 50
Table 4.22 Beneficiary College Type and the Annual Income of their Parents ...................... 51
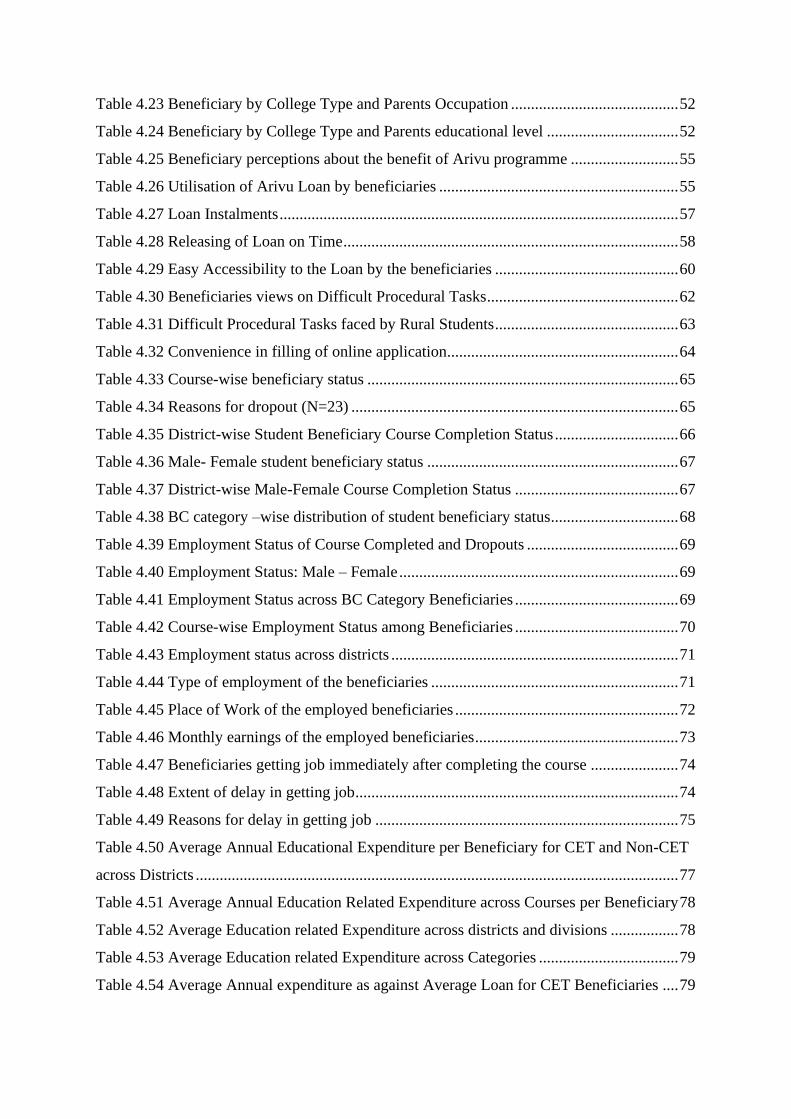
Table 4.23 Beneficiary by College Type and Parents Occupation .......................................... 52
Table 4.24 Beneficiary by College Type and Parents educational level ................................. 52
Table 4.25 Beneficiary perceptions about the benefit of Arivu programme ........................... 55
Table 4.26 Utilisation of Arivu Loan by beneficiaries ............................................................ 55
Table 4.27 Loan Instalments .................................................................................................... 57
Table 4.28 Releasing of Loan on Time .................................................................................... 58
Table 4.29 Easy Accessibility to the Loan by the beneficiaries .............................................. 60
Table 4.30 Beneficiaries views on Difficult Procedural Tasks ................................................ 62
Table 4.31 Difficult Procedural Tasks faced by Rural Students .............................................. 63
Table 4.32 Convenience in filling of online application.......................................................... 64
Table 4.33 Course-wise beneficiary status .............................................................................. 65
Table 4.34 Reasons for dropout (N=23) .................................................................................. 65
Table 4.35 District-wise Student Beneficiary Course Completion Status ............................... 66
Table 4.36 Male- Female student beneficiary status ............................................................... 67
Table 4.37 District-wise Male-Female Course Completion Status ......................................... 67
Table 4.38 BC category –wise distribution of student beneficiary status................................ 68
Table 4.39 Employment Status of Course Completed and Dropouts ...................................... 69
Table 4.40 Employment Status: Male – Female ...................................................................... 69
Table 4.41 Employment Status across BC Category Beneficiaries ......................................... 69
Table 4.42 Course-wise Employment Status among Beneficiaries ......................................... 70
Table 4.43 Employment status across districts ........................................................................ 71
Table 4.44 Type of employment of the beneficiaries .............................................................. 71
Table 4.45 Place of Work of the employed beneficiaries ........................................................ 72
Table 4.46 Monthly earnings of the employed beneficiaries ................................................... 73
Table 4.47 Beneficiaries getting job immediately after completing the course ...................... 74
Table 4.48 Extent of delay in getting job ................................................................................. 74
Table 4.49 Reasons for delay in getting job ............................................................................ 75
Table 4.50 Average Annual Educational Expenditure per Beneficiary for CET and Non-CET
across Districts ......................................................................................................................... 77
Table 4.51 Average Annual Education Related Expenditure across Courses per Beneficiary 78
Table 4.52 Average Education related Expenditure across districts and divisions ................. 78
Table 4.53 Average Education related Expenditure across Categories ................................... 79
Table 4.54 Average Annual expenditure as against Average Loan for CET Beneficiaries .... 79

Table 4.55 Average Annual expenditure as against Average Loan for Non-CET Beneficiaries
.................................................................................................................................................. 80
Table 4.56 Loan Repayment Status among Beneficiaries ....................................................... 82
Table 4.57 Employment Status of Beneficiaries and Loan Repayment Status........................ 82
Table 4.58 Loan Repayment Status of Employed-Unemployed Male-Female Beneficiaries . 83
Table 4.59 Repayment of loan across different categories of Beneficiaries ............................ 84
Table 4.60 Repayment of loan among employed-unemployed across different categories of
Beneficiaries ............................................................................................................................ 85
Table 4.61 Beneficiaries loan repayment status across different courses ................................ 86
Table 4.62 Beneficiaries loan repayment status across different type of higher education
institutions ................................................................................................................................ 87
Table 4.63 Status of Repayment of the loan ............................................................................ 87
Table 4.64 Status of Repayment of the loan – Matrix Regression Results of Employment
status with independent variables ............................................................................................ 90
Table 4.65 Source of awareness about the Arivu Scheme ....................................................... 91
Table 4.66 Beneficiaries knowledge about programme eligibility criteria .............................. 92
Table 4.67 Beneficiaries knowledge about selection process / procedure ............................... 93
Table 4.68 Awareness about Loan Amount Releasing Procedure among the Beneficiaries ... 94
Table 4.69 Beneficiaries knowledge about application procedures ......................................... 95
Table 4.70 Beneficiaries knowledge about documents required for the scheme ..................... 96
Table 4.71 Non-Arivu BC beneficiary views on higher Education [N=12] ............................ 98

LIST OF FIGURES
Figure 2.1 Theory of Change ................................................................................................... 12
Figure 2.2 Map Showing the Selected Districts across Revenue Divisions of Karnataka ...... 18
Figure 4.1 Progress of Arivu Education Loan Scheme at State Level ..................................... 32
Figure 4.2 Progress of ARIVU Education Loan Scheme at the State Level (in %) ................ 33
Figure 4.3 Gender- wise Coverage across Sample districts ..................................................... 42
Figure 4.4 BC category- wise Coverage across Sample districts (Universe-All Beneficiaries)
.................................................................................................................................................. 44
Figure 4.5 Distribution of beneficiaries across colleges (%) ................................................... 51
Figure 4.6 Beneficiary by College Type & Parent's educational level .................................... 53
Figure 4.7 Loan repayment status among employed-unemployed beneficiaries ..................... 83
Figure 4.8 Loan repayment status of employed-unemployed male-female beneficiaries ....... 84
Figure 4.9 Repayment of loan among Male and Female Employed Beneficiaries ................. 85
Figure 4.10 Beneficiaries loan repayment status across different courses .............................. 86
Figure 4.11 Status of Repayment of the loan ........................................................................... 89
LIST OF PICTURES
Picture 1: Interview with Arivu Education Loan Beneficiary Parent .................................... 162
Picture 2 Interview with DD Urs Corporation district Manager Bangalore .......................... 162
Picture 3 Interview with Engg. College Principal in Belagaum on Arivu Education loan .... 163
Picture 4 : Arivu Educational Loan Study Tools Orientation to enumerators ....................... 163

LIST OF ABBREVIATIONS
BC Backward Class
BE Bachelor of Engineering
CEO Chief Executive Officer
CET Common Entrance Test
DDUBCDC D Devaraj Urs Backward Class Development Corporation
EQUIP Education Quality Up-gradation and Inclusion Programme
FGDs Focus Group Discussion
GDP Gross Domestic Product
GER Gross Enrolment Ratio
GOK Government of Karnataka
HEI Higher Educational Institutions
IDIs In-depth Interviews
KEA Karnataka Examination Authority
MHRD Ministry of Human Resource Development
PG Post-Graduation
ZP Zilla Panchayat

Karnataka Evaluation Authority | 1
Executive Summary
The present study is an Evaluation of the Arivu Education Loan Programme launched by the
Karnataka state government. The scheme aims at increasing access, reducing dropout and
enhancing employability of the backward class students of category I, II-A, III-A & III-B. The
scheme provides education loan to pursue higher education for both CET and non-CET
backward class students. It covers all the 30 districts. The scheme is implemented by the D
Devaraj Urs Backward Class Development Corporation [DDUBCDC]. The scheme offers a
maximum loan of Rs.1.0 lakh per student per year at 2% interest per annum whose family’s
annual income does not exceed Rs. 3.5 lakh per annum.
The purpose of evaluation as given in the Terms of Reference issued by KEA is to examine the
design, structure & process of implementation of the scheme. The objectives of the study are:
(i) to assess the programme impact in terms of intended outcomes; (ii) to examine its spread,
coverage, timely availability, utilization; (iii) to understand beneficiary and stakeholders’
perceptions with respect to programme implementation and impact. The study employs a field
survey method of evaluation combined with case study. Data collection methods include
questionnaires, documentary analysis, FGDs and IDIs. The sampling design involves multi-
stage, stratified covering a sample size of 1130 beneficiaries selected from 12 districts across
4 revenue divisions of the state. The data analysis includes both quantitative and qualitative
techniques.
Major Findings:
1. Overall, the state has covered a total of 16,430 BC students under the Arivu Educational
loan programme from the year 2011-12 to 2018-19. Considering the total amount spent for
the programme target of 15,095 beneficiaries and financial allocation of Rs.10,297.71
lakhs, the efficiency in terms of achievement works out to 108.8 per cent for the former
and 83.1 per cent for the latter. Relatively better performance is seen with respect to annual
coverage for the years 2013-14 & 2015-16. In terms of achievement of targets under the
CET category, the scheme reveals consistently positive performance.
2. Consistent shortfall in the coverage of most vulnerable caste groups like Nomadic & Semi-
Nomadic, Kumbara, Thigala, Madivala, Savitha, not only suggests the need for re-
examining the program design but also revising the state policy norm itself.

Evaluation of the Arivu Educational Loan Scheme Implemented by D Devaraj Urs Backward Classes
Development Corporation in Karnataka State (2011-12 To 2017-18)
2| Karnataka Evaluation Authority
3. Across courses in the 12 sample districts from 2011 to 2015, the BE/B.Tech course reveals
highest coverage, taking a big leap from the year 2016 onwards to boost the participation
of BC students in the most happening professional programme (Engineering) of higher
education sector. This is a commendable achievement. Despite limited coverage of PG,
Medical and non-CET courses, the consistent growth over the years is a reflection of the
increased demand. Considering the fact that BC students constitute large chunk of the
general degree enrolment in rural areas, there is a need to examine the relevance and up
scaling of Arivu loan benefit even to this category of students.
4. Across BC categories, over the time, the coverage proportion is found to be in alignment
with the overall state distribution norms. By default, category IIA emerges as the largest
beneficiary of the programme. Across regions, anomalies in coverage of categories in
Bengaluru, Mysore districts and Hyderabad Karnataka region, although is explained in the
context of demographic composition and spread of the population, yet the fact remains that
some of the predominant castes under these categories may not necessarily qualify for the
benefit. Therefore, the most crucial factor in the final selection of the beneficiaries needs
to be based on the vulnerability and risk factors among such caste groups rather than
merely going by nominal categories.
5. The programme is found to cover 4 girls for every six boys. However, the wide gender gap
in Kalaburgi, Bidar and Belagavi districts indicate the need for increased regional gender
focus under the programme.
6. Overall, a whopping majority (81.7%) of student beneficiaries are seen in the BE course.
Across regions, all divisions present the same trend. It is gratifying to note that even
backward districts such as Bagalkote and Uttara Kannada reveal more than 90.0 per cent
of beneficiaries in the BE programme. Higher visibility of BC students in the most
happening and glamorous programme such as the BE even in the backward regions is
an indication of positive impact of the Arivu programme.
7. Higher proportion (58.0 %) of the beneficiary households do not own land, suggesting
presence of vulnerability and deprivation factors. Landless status is higher in case of
Bengaluru (73.0%) and Belagavi (60.0%) divisions. Category IIIB reveals higher
proportion of landless beneficiaries. Even in case of those revealing higher proportion (75.0
to 80.0 per cent) of dry land, such as those in Kalaburgi and Mysore regions, may not

Executive Summary
Karnataka Evaluation Authority | 3
necessarily provide immunity from vulnerability due to the fact that dry land in most cases
does not ensure productive income.
8. Largest chunk (63.2%) of beneficiaries is found to be studying in private unaided colleges.
This may be an obvious trend considering the fact that higher education is predominantly
offered by the private sector in the state. Further, the selection and choice of the college
type is also determined by the CET rank position of the student. This phenomenon,
however, is noteworthy and further the Arivu programme facilitating this trend is even
more promising.
9. Barring districts of Kolar and Bellary, in general, beneficiaries are satisfied with respect to
mode of loan disbursement, easy accessibility (82.0%), convenience in accessing and
submitting on-line application (94%), and timely release of loan (87.3%). However,
procedural difficulties (44.3%), providing surety, providing affidavit (32.5%) and
submitting different documents (28.4%) appear to be major deterrents across most
districts.
10. Arivu loan is being utilized for education purpose alone as reported by an overwhelming
majority (94.51%). Apart from the loan mitigating their financial hardships and household
burden, it has also helped them to complete their higher education in colleges of their choice
without any interruptions and paved way for economic and social mobility. Additionally,
more than 96.0 per cent of the beneficiaries are in strong agreement about the benefit of
Arivu programme in increasing their confidence and comfort levels. While the loan
amount is found to be sufficient by and large, a need has been felt for enhancement for
medical students considering the heavy expenses incurred by them.
11. An encouraging feature, suggestive of positive impact of the Arivu programme is the course
completion ratio with 46.5 per cent of the beneficiaries, of which highest proportion is in
PG courses (82.8%) followed by BE course (46.3%). While the programme is found to
reveal absolute positive impact in terms of course completion for category IIA
beneficiaries, for category IIIB, it is the other way round. The latter also reveals highest
incidence of dropout with 14 out of the total 23 dropouts hailing from this category. Mysore
division reveals relatively higher rate of positive impact with respect to course completion
ratio.

Evaluation of the Arivu Educational Loan Scheme Implemented by D Devaraj Urs Backward Classes
Development Corporation in Karnataka State (2011-12 To 2017-18)
4| Karnataka Evaluation Authority
12. Overall, the programme seems to impact boys and girls almost equally in terms of course
completion ratio. However, when regional dimension is added, different patterns seems to
emerge. Kolar and Kodagu districts reveal far higher positive impact on female students
than male students.
13. With respect to programme’s impact on employment, a higher proportion of beneficiaries
is found to be unemployed (58.1%) as compared to employed (41.5%). Category IIA
reveals highest level of unemployment (60.0 per cent). The trend appears obvious as this
category receives highest coverage (54%) under the programme. Across courses, barring
the general degree and the medical programme, which have very small samples,
unemployment rate is higher among PG beneficiaries (66%) followed by BE graduates
(57%). Further, as revealed by the regression analysis, the programme is found to
significantly influence employment of beneficiaries in Bengaluru division, male
beneficiaries, and of those in government colleges. Quite significantly, loan repayment
behaviour is found to increase with employment status.
14. Highest proportion of beneficiaries are holding engineering jobs as engineering graduates
happen to constitute a major chunk in the study sample, and most of them (56.84%) are
working in Bengaluru and within Karnataka (35.9%).
15. The monthly earnings of the highest proportion (48%) of the employed beneficiaries fall
between 15k to 25k. The wage structure seems to vary across districts.
16. The annual expenditure reported by the student beneficiaries is found to vary in the range
of Rs1.0 lakh to over Rs.4.0 lakh across districts. So also there is variation between CET
and non-CET students. Overall a CET beneficiary will be required to meet a gap of
Rs.38,929.85 per annum during the study period. This gap is found to vary from a low of
Rs.25K a high of Rs.97k plus. Quite interestingly, Shivamogga district reveals lesser
expenditure incurred as against the loan availed in the year.
17. Only 101 out of 549 eligible beneficiaries have repaid the loan, which works out to 18.4
per cent. Across districts, Hassan and Bellary reveal relatively better performance. It is very
poor in Bengaluru Urban district (1.49 %). Across categories, loan repayment is much
better in the case of category III B beneficiaries, 30 percent of them are repaying the loan.
Low level of repayment is seen both in case of category I and category IIA, the latter being

Executive Summary
Karnataka Evaluation Authority | 5
largest beneficiaries of Arivu programme. Those taking loan from other sources is quite
negligible.
Recommendations
1. Considering the greater utility value and higher benefit accrued to backward class students,
it is recommended that the ARIVU programme may be continued further. It is also
recommended that the programme may further be extended to backward class students
in general degree programmes of higher education.
2. As the coverage and targeting under specific BC communities such as Nomadic & Semi-
Nomadic, Savitha, Kumbara, Thigala, Uppara reveal huge shortfalls, the State needs to
seriously examine the way programme has been designed to reach out to these most
vulnerable households, particularly the first generation families.
3. Considering low visibility of girls in the Arivu programme, it is strongly recommended
that the programme may consider giving priority to girls to the extent of 30.0 per cent,
particularly in backward regions.
4. As the programme is seen to favour beneficiaries largely from urban and semi-urban
regional backgrounds, it is recommended to enhance target coverage for rural
beneficiaries so as to bring them on par with their urban counterparts.
5. While it is necessary to re-examine the rationale and mechanism for fixing targets and
allocations to improve overall reach and coverage, district specific strategies may be
employed for fair and unbiased selection of beneficiaries.
6. There is need for benchmarking data systems and to develop proper baseline datasets to
track the progress and impact of any given programme over the time. Such a system would
enable the governments to justify public resource investments as well as achieving various
developmental goals. In the light of this, it is recommended that the DDUDBC may
consider establishing a statistical unit in collaboration with the education department for
not only generating statistical database, but also for proper monitoring and assessment
of various education programmes.
7. In the light of beneficiaries reporting about difficulties experienced in providing surety,
affidavits and several documents, it is necessary for the department to streamline and

Evaluation of the Arivu Educational Loan Scheme Implemented by D Devaraj Urs Backward Classes
Development Corporation in Karnataka State (2011-12 To 2017-18)
6| Karnataka Evaluation Authority
simplify some of these procedures so as to make it convenient and friendlier. Therefore, it
is recommended that the present system of providing surety/witnesses may be replaced
with alternative authentic proof system provided by beneficiary’ own family.
8. In view of the higher expenditure incurred by the beneficiaries in certain courses, it is
recommended that the present loan amount may be enhanced to 2.0 lakh per annum for
medical education courses.
9. The incidence of large scale non-payment of loan among beneficiaries is a serious issue.
While unemployment appears to be the key factor for default, there are also instances of
non-repayment even among the employed beneficiaries. Considering the fact that some
students face financial constraints and have genuine reasons for loan repayment, it is
recommended that the waiting period for loan recovery may be extended for one year
from the date of completion to enable those seeking employment. Alternatively, the
department may consider decreasing interest rate to enable loan recovery from those who
experience serious constraints. On the other hand, for those already employed, some
serious disciplinary actions may be invoked for loan recovery.
10. It is noticed that the department has a weak monitoring system to review and take stock of
the programme. It is therefore strongly recommended that the department has to step up
its district level monitoring of the programme in terms of tracking the loan beneficiary
and upkeep of the record through the use of digital software systems.
11. Loan in the first semester / year can be given to the college. But from the second year
onwards, it can be given at the time of paying college fees. Students can pay the loan
amount to college as fees. This will reduce the burden on students’ parents of mobilizing
the fees amount.
12. The DDUBCD Corporation is required to step up its information dissemination strategy in
backward districts like Bagalkot, Belgaum, Bellary, Mysore and Uttara Kannada. Similarly
awareness strategies about the Arivu scheme and the administrative support system may be
strengthened for better reach and coverage of beneficiaries in such backward districts.
13. Further research, preferably case studies may be initiated to understand and identify region
specific variables impacting education among backward class students.

Karnataka Evaluation Authority | 7
1 CHAPTER - 1
INTRODUCTION
The Indian economy currently is poised for reaping the advantages of the competitive edge it
enjoys in terms of the expected demographic dividend in the next few decades. Therefore,
improving the quality of human capabilities for increased productivity and efficiency have
emerged as the top priority developmental agenda in the national context. Clearly higher
education has received a significant boost in this direction with the vision to realize India's
human resource potential to its fullest in the Higher Education sector and the mission to provide
greater opportunities of access to Higher Education with equity to all the eligible persons and
in particular to the vulnerable sections. The Higher Education sector, with is major focus on
expansion and qualitative improvement aims at increasing the Gross Enrolment Ratio (GER)
in Higher Education to 30% by the year 2020 (MHRD, GOI, 2019). As per the Indian
government’s latest release of the 5-year vision plan of Education Quality Up-gradation and
Inclusion Programme (EQUIP), the major focus area is doubling the GER and resolving
geographically & socially skewed access to Higher Education Institutions in India as well as
doubling employability of students passing out of these institutions.
Karnataka State presents a promising scenario of spectacular growth in the field of higher
education. Being a front runner in higher education, the state has pegged an average (above the
national average) of 35% GER by 2020 from the current GER of 25% (Karnataka Knowledge
Commission, GoK, 2012). However, it encounters formidable challenges of addressing issues
relating to unequal access, regional disparities, social inequalities, poor quality and deplorable
educational standards. Low transition, high dropout, poor completion ratio in higher education
paint a gloomy picture in the otherwise promising higher education sector. Besides, rising cost,
credit constraints and opportunity cost pose challenges for vulnerable population segments, not
only for accessing higher education, but also for successful completion and economic gains.
1.1 Background about ARIVU Educational Loan Scheme:
Karnataka state has launched Arivu, an Education loan scheme as an alternative source of
financing higher education for credit constrained students from underprivileged sections. The
scheme is aimed at increasing access, participation in higher education and economic mobility
among backward class students belonging to marginalized sections. The scheme provides
financial support to pursue higher education for backward community students, who are unable
Evaluation of the Arivu Educational Loan Scheme Implemented by D Devaraj Urs Backward Classes
Development Corporation in Karnataka State (2011-12 To 2017-18)
8| Karnataka Evaluation Authority
to mobilize loans from public sector banks owing to poverty and economic restraints. The
scheme aims at increasing access, reducing dropout and enhancing employability of the
students belonging to backward communities and is implemented through the D Devaraj Urs
Backward Class Development Corporation [DDUBCDC]. The scheme covers all the 30
districts and targets higher education students of backward classes - category I, II-A, III-A &
III-B in the ratio of 14%, 54%, 14% and 18% respectively. Earlier both CET and Non-CET
educational loans were sanctioned and disbursed through Zilla Panchayats at the district level.
Since 2017-18 CET educational loans are sanctioned, managed and disbursed on-line directly
by D.D. Urs Corporation headquartered at Bengaluru. Non-CET loans are being given at the
district level through Zilla Panchayats. ARIVU loan scheme covers engineering, medical and
other 28 courses.
The Scheme, implemented in the year 2010-11, initially offered a maximum of Rs.10,000/-per
year with an interest rate of 2% per annum, starting from the beginning of the course. The
beneficiaries have to start repaying the educational loan with interest after four months of their
completion of the course, even without getting any job. They have to clear the loan with interest
in equal monthly instalment over a period of three years after completing the course over the
period of completion of education. It was limited to only two categories of backward classes
and only for students pursuing professional courses in engineering and medical education. The
annual income limit for eligibility was Rs.22,000/-. Over the years, the scheme has seen
expansion with respect to beneficiary coverage to include other backward class categories as
well as other professional and general degree courses in higher education. The loan amount has
been revised upwards and the eligibility norms have also been revised. Currently, the scheme
offers a maximum loan of Rs.1.0 lakh per student per year at 2% interest per annum whose
family’s annual income does not exceed Rs. 3.5 lakh per annum. Up until the year 2018-19,
16,430 student beneficiaries have been covered with a budgetary expenditure of Rs.8558.75
lakh. It is nearly a decade that the Arivu scheme has been in place and there is need to
understand how this scheme / programme has been performing over the years, how many
student beneficiaries have been covered and what changes it has brought to the students in
terms of economic and social gains. Hence the present study. It is expected that this evaluation
study would provide appropriate feedback on the policy and the programme implementation as
well as reveal critical insights with regard to the major challenges and issues confronting the
higher education sector in the state.
Introduction
Karnataka Evaluation Authority | 9
1.2 Problem Statement
As already mentioned, the Arivu scheme has been implemented with the intention of enhancing
enrolment and participation in higher education as well as improving job prospects among
backward class students from the marginalized sections through the support of education loan.
The scheme envisages bringing about economic and social change among these population
segments thereby addressing issues relating to equitable growth and improving overall
development.
While the programme targets the backward class students from the most vulnerable households,
it is to be noted that apart from great diversity among the backward class population located in
different geographical regions, the economic and social vulnerability factors also vary between
households. This phenomenon is further compounded by the asymmetrical growth and
development of higher education across different regions in the state, which will have
differential impact on the intended outcomes of the programme. Further, the programme being
implemented through a Quasi-Governmental Agency, namely D Devaraj Urs Backward Class
Development Corporation in coordination with various line departments creates complexity in
smooth and efficient implementation. It is in this context, it is worthwhile to understand not
only the performance of the programme in terms of its intended benefits, but also to identify
critical impediments, issues and challenges which come in the way of effective
implementation. Thus, it is necessary to understand the interplay of various linkages in the
programme with respect to design, planning, implementation, inputs, activities/tasks, outputs
and outcomes.
1.3 The Purpose of Evaluation
The purpose, scope, and methodology of evaluation as given in the Terms of Reference is to
examine the design, structure & process of implementation of the scheme; study & assess
impact in terms of increasing access to higher education, completion ratio, reducing dropout,
increasing job opportunities and economic mobility.

Evaluation of the Arivu Educational Loan Scheme Implemented by D Devaraj Urs Backward Classes
Development Corporation in Karnataka State (2011-12 To 2017-18)
10| Karnataka Evaluation Authority
1.4 Objectives of the Study:
1. To assess the performance of Arivu scheme in terms of spread and coverage, timely
availability and disbursement, extent of utilization
2. To assess beneficiary and stakeholders’ perception and satisfaction with regard to Arivu
loan scheme
3. To study the impact of the Arivu scheme in increasing access, enrolment, participation
and employment potential of backward class students in higher education
4. To study the effectiveness of Arivu scheme implementation [tracking supply-
distribution chain from the origin till the end beneficiary]
5. To assess the level of awareness of Arivu scheme among the backward class students
6. To find out reasons and constraints for low access and poor participation in higher
education among backward class youth
7. To make a comparative analysis of the scheme with similar schemes from other states
8. To identify constraints and glitches experienced by Arivu loan student beneficiaries for
managing other expenses during their study period
9. To examine the repayment status of Arivu loan by the beneficiaries as well as about
other alternative loans if they have availed for higher education purpose
10. To critically analyse the context and historical background of the DDUBCDC and its
interface with planning and growth of higher education sector
11. To explore various dimensions of budgetary components of loan and subsidy in regard
to financing of Arivu loan scheme
12. To critically analyse the criteria and mechanism adopted for selection of student
beneficiaries across different strata [caste categories, households, courses, boys and
girls] within the overall demographic composition in the region.

Karnataka Evaluation Authority | 11
2 CHAPTER - 2
METHODOLOGY
The study being an evaluation of a public policy intervention essentially employs standard
social research method unique to the evaluation of a social program. The purpose, scope and
methodology of evaluation as given in the Terms of Reference is to examine the design,
structure & process of implementation of the scheme; study & assess impact in terms of
increasing access to higher education, completion ratio, reducing dropout, increasing job
opportunities and economic mobility. The study essentially employs an analytical research
design involving macro survey of secondary data as well as micro survey of field data. The
survey is also being supplemented by qualitative methods. At macro level, numerical data
relating to financial parameters as well as beneficiary coverage from the secondary sources are
being subjected to trend analysis across time and space. The field survey is aimed at mapping
the socio-economic profiles of the beneficiaries using household level data.
Keeping this in view, the research method follows the general principles, types and techniques
that are generally followed in any evaluation research method. These are input measurement,
output/performance measurement, impact/outcomes assessment, service quality assessment,
process evaluation, and quantitative and qualitative methods. The evaluation research, being a
rigorous systematic process involves collecting data about organizations, processes, programs,
services, and resources from student beneficiaries and other stakeholders.
2.1 Theory of Change
The present study is set within the Theory of Change framework in order to evaluate how a
public policy intervention like the Arivu education loan scheme has been planned and
implemented to bring about change among the backward class community students in terms of
increasing access to higher education, enhancing their enrolment, participation and
achievement in HEIs and thereby enhancing their employment prospects. The theoretical frame
identifies the logical connection between and among the given inputs, activities, outputs and
the expected outcomes. The inputs are defined with respect to budgetary resources (financial
allocations), physical and material infrastructure (office, establishment structures and

Evaluation of the Arivu Educational Loan Scheme Implemented by D Devaraj Urs Backward Classes Development Corporation in Karnataka State (2011-12 To 2017-18)
12| Karnataka Evaluation Authority
technology support systems) and human resource (officials, ministerial staff, technical support staff, training and capacity building, student
beneficiaries). The scheme implementation identifies a number of activities right from defining the agenda and objectives of the scheme,
preparation of physical and financial plan targets, setting up organizational structures, coordination and management of the scheme across different
offices and departments. The outputs are identified in terms of reaching the target coverage with respect to amount of money spent or utilized,
beneficiary coverage and spread of the scheme across region, over the time and among different target groups. The final outcomes are defined in
terms of the overall gain in human capital and human resources at large. This logical frame is diagrammatically represented in the following flow
figure-2.1 below.
Figure 2.1 Theory of Change
Inputs Activity Output Outcome
1. Human Resource Development
2. Human Capital Formation
3. Improved Socio-Economic
Conditions of Backward Classes
4. Economic Growth
5. Egalitarian Society
Implementation – Supply Side Results – Demand Side
1. Financial and physical target
achievements
2. Number of Beneficiaries Covered-
Category-wise and Region-Wise
3. Number of Beneficiaries Completed
Higher Education-- Category-wise
and Region-wise
4. Extent of Enrolment in Higher
Education
5. Number of Students got Jobs
6. Other Outputs
1. Budget Allocation
and Expenditure
2. Selection of
Beneficiaries by
District Level
Selection Committee
3. Processes of Loan
Disbursement
4. Other Activities
1. Budget for
Education Loan
2. District Level
Selection
Committee
3. Implementing
Human Power
4. Other Items
Assumptions: Timely allocation and expenditure of budget. Required human power be there. Efficiency in loan disbursement by the officials.
Risks: Resources crunch at the government level. Inefficiency in programme implementation. Beneficiaries not utilising the benefits effectively

Methodology
Karnataka Evaluation Authority | 13
2.2 Data Collection Methods and Analysis
The entire evaluation procedure describing the evaluation questions, data indicators, data sources, data collection tools and analysis procedure is
represented in Table-2.1 below.
Table 2.1 Evaluation Matrix
Evaluation Question
Indicators Data Source Collection Method / Tool Analysis Procedure
1. To assess the performance
of Arivu scheme in terms of
spread and coverage, timely
availability and disbursement,
extent of utilization
- Financial -budgetary allocations
(Rs)
Expenditure as against allocations
& No. of beneficiaries actually
covered as against physical target
fixed [category wise; CET/Non-
CET]
- Physical- No. of beneficiaries
covered
• Extent of awareness created
• Level of awareness about
ARIVU among backward
classes students.
• Spread and coverage of the
scheme
• Timely availability and
disbursement of loan
- Extent of utilization
• Secondary data from
official records
• Review of official
documents, records
Discussions with the
concerned officials
• Document verification
• Interviews (IDIs)
FGDs
Data and information shall be
analysed in terms of
allocation of budget, its
release and actual
expenditure. Timely release
and availability of Arivu loan
to the line departments and to
the beneficiaries.
Awareness, right
identification of
beneficiaries and timely
distribution of ARIVU loan.
2. To assess beneficiary and
stakeholders’ perception and
satisfaction with regard to the
loan scheme
• Extent of beneficiary
satisfaction about ARIVU
• Perceptions of beneficiaries and
other stakeholders about
ARIVU
• Awareness about ARIVU
scheme
• Interviews with
beneficiaries and other
stakeholders
• IDIs and FGDs
• Structured questionnaires
/ schedules
• Questionnaire
• Interview schedules
• FGDs
• IDIs
How far the beneficiaries
are happy and satisfied with
ARIVU loan scheme, and
their level of awareness.
Reasons for low
participation of backward

Evaluation of the Arivu Educational Loan Scheme Implemented by D Devaraj Urs Backward Classes Development Corporation in Karnataka State (2011-12 To 2017-18)
14| Karnataka Evaluation Authority
• Constraints, if any, for low
participation of backward class
students in the higher education
class students in higher
education, if any
3. To study the impact of the
scheme in increasing access,
enrolment, participation and
employment potential of
backward class students in
higher education
- Increase in No. of BC students
enrolled in Higher Educational
Institutions [HEI]
- Availability of HEIs in the
region as against the supply pool
of BC students in the region;
- Spatial access that is distance to
be traversed to reach an HEI;
- Type of HEI, that is Govt,
private aided and private unaided;
- Type of Education- General
degree, Professional, Technical,
- Number of BC students passing
out PUC in the given academic
year, eligible to be enrolled into a
HEI. [CET/Non-CET]
- Number of students passing out
in the given academic year and
no. of students actually getting
enrolled in HEIs [CET/Non-
CET]
- No. of BC student beneficiaries
successfully completing the
course in a given time period
[CET/Non-CET]
- No. of BC student beneficiaries
getting employment after
completing the degree
[CET/Non-CET]
Secondary data from
official records and
documents-of
departments, colleges,
officials,
Schedule / questionnaire,
FGDs IDIs, and Key
Informants
Collected data shall be
analyzed across different
variables and indicators
using appropriate
techniques.
4.To study the effectiveness
of scheme implementation
[tracking supply- distribution
- Adhering to time schedule by
various departments from the
time of budgetary sanctions to
• Documents on fund
release from
• Document verification
• Interview schedules
• FGDs
Data and information shall
be analyzed in terms of

Methodology
Karnataka Evaluation Authority | 15
chain from the origin till the
end beneficiary]
release of loan amount to
different line departments until it
reaches the beneficiary;
- Selection of beneficiaries as per
norms by the ZP committee;
- Timely release of notification to
colleges for inviting and
submission of applications to the
concerned authority;
- Processing scrutiny of
applications by the concerned
authority; (v) release of
sanctioned loan amount to CET
& non-CET beneficiaries;
• Timely release of funds
• Access, level of enrolment and
participation and employability
of the beneficiaries.
• Effectiveness of the scheme-
process, implementation and
monitoring.
• Repayment of loan amount
implementing agency
(Secondary)
• Documents on release of
loan to the beneficiaries
• Interviews with
beneficiaries and their
families, and officials
IDIs
process, implementation
and distribution.
5.To assess the level of
awareness of Arivu scheme
among the backward class
students
- Awareness, knowledge and
understanding about the Arivu
scheme with respect to different
dimensions [CET/Non-CET]
Beneficiaries and other
stakeholders.
Structured questionnaire /
schedule, FGDs and IDIs
Data, particularly qualitative
data shall be analyzed using
appropriate techniques.
6. To find out reasons and
constraints for low access and
poor participation in higher
education among backward
class youth
- Views of beneficiary/non-
beneficiary households,
department functionaries, HEI
authorities, ZP committee,
student beneficiaries & non-
beneficiaries with regard to poor
participation of BC students in
• Official records,
officials, college
principals, beneficiaries
and other stakeholders.
• Questionnaire /
Schedule, FGDs, IDIs.
Both quantitative and
qualitative shall be analyzed
keeping in view the related
indicators.

Evaluation of the Arivu Educational Loan Scheme Implemented by D Devaraj Urs Backward Classes Development Corporation in Karnataka State (2011-12 To 2017-18)
16| Karnataka Evaluation Authority
higher education [CET/Non-
CET]
7. To examine the repayment
status of loan by the
beneficiaries
• Opinions/views from student
beneficiaries, department
functionaries, ZP committee
members with regard to
payment/default of loan
recovery [CET/Non-CET]
• Official records and
documents and the
beneficiaries
• Questionnaire /
Schedule, FGDs and
IDIs.
Data shall be analysed in
terms of loan received by
the student beneficiaries,
percent / extent of loan
repaid, loan outstanding and
the reasons for not repaying
the loan amount, if any.
8. To make a comparative
analysis of the scheme with
similar schemes from other
states
- Review of student Loan data
from various sources [Inter-state
compilation of statistical data
from NSSO, Banking/higher
education sector & other
agencies]
• Research findings and insights
from review of research studies
across States- Issues &
Challenges
• Review of literature,
review of reports from
the other States,
secondary sources,
official documents
• Literature and
documents
Analysis will be made based
on the reviews to gain a
comparative perspective.
Source: Author

Karnataka Evaluation Authority | 17
2.3 Sampling Design and Research Tools
Within the prescribed sampling frame and sample size already indicated as per the ToR, the
study has employed a multi-stage stratified sampling design. In the first stage, four revenue
divisions are selected. In the second stage, 3 districts from each of the divisions, high, medium
and low beneficiary coverage are selected. Thus, a total of 12 districts are selected. In the third
stage, the student beneficiaries are selected. Overall the 12 districts had a coverage of 2247
student beneficiaries under the Arivu Loan scheme. From these 12 districts, approximately
50% of them, that is 1130 student beneficiaries are selected as final sampling units. In addition,
one percent of non-beneficiary students [12] is selected for each of the sample districts. The
sampling design and size is indicated in the following Table-2.2. The spatial spread and
location of the sample districts are also shown in the Map-1 below.
Table 2.2 Sampling Design
Districts Total
Beneficiaries
Samples
drawn
Sampling Description
BENGALURU DIVISION Sample drawn from
4 Revenue Division X 3 District =
12 Districts
Four Revenue Divisions Bengaluru,
Belagavi, Mysore and Kalaburgi
From each division, three districts:
One Dist. with highest No. of Beneficiaries
One Dist. with lowest No. of Beneficiaries
One Medium District Total Beneficiaries =
2247
Total Sampled Beneficiaries = 1130
One Percent of the sampled beneficiaries
are selected as Control Group covering all
the four divisions i.e. 1130X1/100 = 12
Non- Beneficiary Students
Bengaluru Urban 589 245
Shivamogga 194 81
Kolar 59 25
MYSORE DIVISION
Mysore 270 160
Hassan 113 67
Kodagu 30 18
BELAGAVI DIVISION
Belagavi 389 189
Bagalkot 158 78
Uttara Kannada 84 41
KALBURGI DIVISION
Kalaburgi 177 110
Bidar 103 65
Bellary 81 51
TOTAL 2247 1130
Source: ToR, KEA
Evaluation of the Arivu Educational Loan Scheme Implemented by D Devaraj Urs Backward Classes
Development Corporation in Karnataka State (2011-12 To 2017-18)
18| Karnataka Evaluation Authority
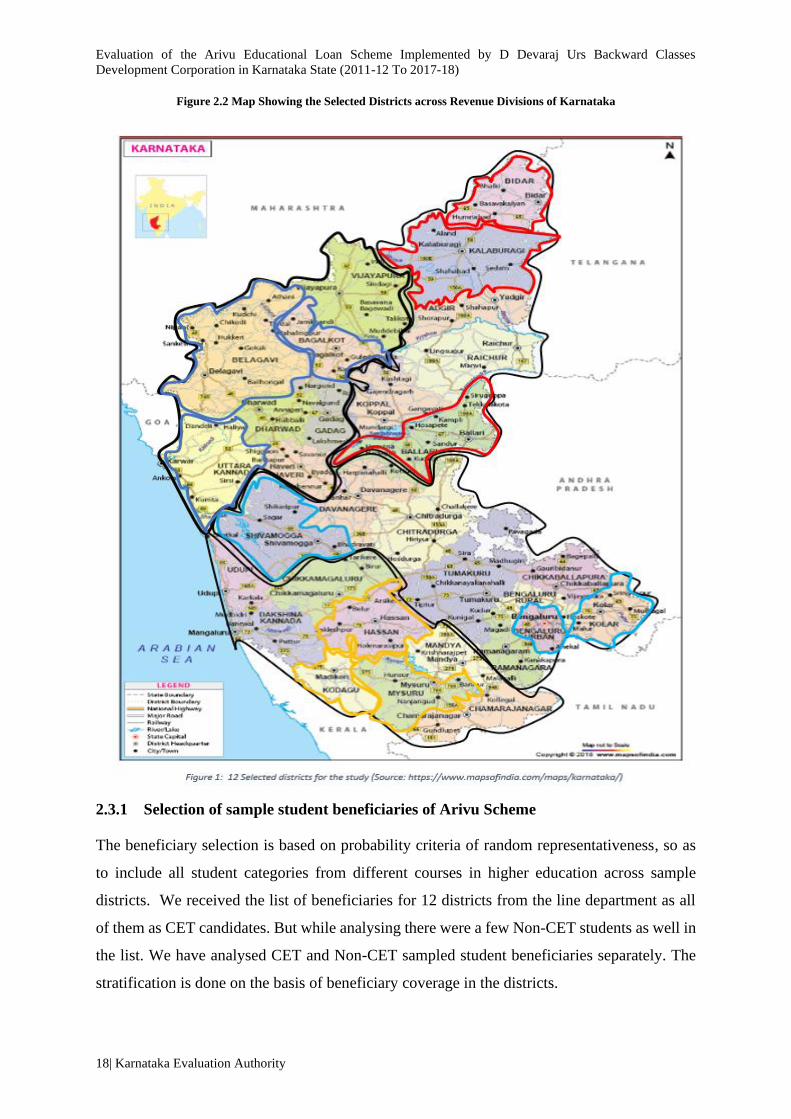
Figure 2.2 Map Showing the Selected Districts across Revenue Divisions of Karnataka
2.3.1 Selection of sample student beneficiaries of Arivu Scheme
The beneficiary selection is based on probability criteria of random representativeness, so as
to include all student categories from different courses in higher education across sample
districts. We received the list of beneficiaries for 12 districts from the line department as all
of them as CET candidates. But while analysing there were a few Non-CET students as well in
the list. We have analysed CET and Non-CET sampled student beneficiaries separately. The
stratification is done on the basis of beneficiary coverage in the districts.

Methodology
Karnataka Evaluation Authority | 19
2.3.2 Research Tools: Description
Primarily, the research tools employed for data collection are questionnaires, in-depth
interviews, Focused Group Discussion and informal interactions. Further qualitative data
relating to process of implementation and issues relating to selection of beneficiaries,
scheduling of tasks and activities, criteria adopted for selection by category-wise, minutes of
the meetings, coordination with the line departments, colleges, CET/KEA are also collected
from concerned departments, ZP offices and various stakeholders. Thus, the research tools used
for data collection in the present study are:
• Student Beneficiary and Non-Beneficiary Survey Questionnaire
• Interview schedule for BC/DDUBCDC Department officials
• Focused Group Discussion at the College Level (Principal and other faculty).
• Interview schedule for CEOs of ZPs
• Focused Group Discussion of the Student Beneficiaries
2.3.3 Data Analysis
The quantitative data are analysed using spreadsheets (SPSS, STATA) statistical packages.
The format of data analysis is done using 2-way/3-way formats, cross-sectional methods.
Typologies are generated wherever necessary and presentation is done using matrix format or
schematic diagram, flow chart etc., the mode of analysis is interpretative and inferential. Case
studies are presented in descriptive and narrative styles.
In South Africa, the national student financial aid scheme (NFSAS), which has an in-built
student loan component not only is unpopular among students as it saddles them with debt but
also the government itself is finding it unviable. Recent reforms have increased the bursary
component of NFSAS and undermined its recovery ratio (George Hull, 2016). In countries
such as Kenya, Nigeria, Mozambique & Zambia, the trend suggests increasingly moving
towards loan schemes. Even rich countries such as New Zealand, Australia and the United
Kingdom have introduced cost recovery through loans once their higher education participation
rose above 15%

Karnataka Evaluation Authority | 21
3 CHAPTER - 3
LITERATURE REVIEW
Escalating cost in higher education is a global phenomenon. Along with this, the issue of
increasing access to education loans to students in order to increase educational attainment is
an important subject in higher education financing for both academics and policy makers.
Currently student loan is a fiercely debated issue across most of the countries as higher
education around the world is being drastically impacted by the global economic and political
dynamics. There are different views on financing higher education and the way student loan
has to be organized, supported and managed within this framework. The questions such as
which category of students need to be supported with loan, what is the source of student loan,
what is the role of government in the provision of student loan, and how should student loan
be paid and recovered have occupied central concerns in this discourse. These questions
eventually touch upon larger issues of access, equity, outcome, investments and returns to
higher education. There is sufficient literature and empirical evidence, which provide rich
insights about student loan for higher education, its policy perspective, operational strategy,
impact and the outcome. Some major observations stemming from such literature review is
presented hereunder.
3.1 Student loan for higher education: Studies in India
In Indian context, economists and public finance experts such as JBG Tilak (1991,2003);
Varghese (1991,2014), Sudhanshu Bhushan (2008), JL Azad (2008), P. Geetharani (2009),
Ravi Srivastava (2008), Ravindra Dholakia (2009) have contributed extensively to the
understanding of various contours and perspectives underlying higher education financing. In
their discourse, they point out salient issues and the emerging challenges for the Indian higher
education, such as planning, resource allocation, expenditure, effect of public spending on
education including student loan financing for higher education, its effect on poverty reduction,
economic mobility and better employment and wages.
Tilak JBG & Varghese NV (1991) argue that given the resource constraints and equity
considerations, financing higher education from the general tax revenue may not be a viable
option in the long run. In the light of this, they suggest several alternative policy choices for
higher education financing from the public resources, which include student loan also. They
also caution that the government is not only required to bear large responsibility for higher
Evaluation of the Arivu Educational Loan Scheme Implemented by D Devaraj Urs Backward Classes
Development Corporation in Karnataka State (2011-12 To 2017-18)
22| Karnataka Evaluation Authority
education financing, but also needs to exercise greater fiscal restraints to make the allocations
effective and sustainable in the long run as Indian economy is being subjected to the changing
dynamics of socio-economic and political realities.
In a study of National Loan Scholarship scheme in India, Tilak (1992) finds out several
problems and issues relating to implementation of the scheme. Although he does not subscribe
to the view that student loans are more effective than other methods of financing higher
education, however, argues that in the light of declining budgetary resources for higher
education, discriminatory pricing would be more effective both in terms of efficiency and
equity points of view [Tilak & Varghese, 1991].
Srinivasan R & Das D (2011) examined practices followed in selecting beneficiary student for
grant of education loan for pursuing higher studies in India; problems faced by applicants;
background of the problematic borrowers and steps taken to overcome problems in getting
loans. Using a probit model for statistical analysis of the data, the authors conclude that students
pursuing post graduate professional courses is more likely to get education loan than the one
pursuing undergraduate education; banks prefer giving loans to students seeking admission in
government and government recognized colleges. Further, there appeared to be no
discrimination in granting loans to students with or without prior work experience. The study
also found out the reluctance of private sector banks in extending education loan to students.
Jacob John (2013) has made a comprehensive analysis of the operational features, issues of
implementation and impact of student loans in India. The author argues for expanding the
student loan scheme and even recommends for establishing a national body for coordinating
all such efforts across the country. He further cautions about the undesirable effects of such a
scheme and the need for careful calibration and implementation procedure with sensitivity to
the needs of students from socially and economically marginalised sections of the society.
Rajeev Darolia (2013) observes that student loan debt and defaults have been steadily rising,
igniting public worry about the associated public and private risks. Policymakers face the
challenge of promoting efficient use of public funds (education loan) and protecting students
while also encouraging access to higher education.
Varghese K. X. and Manoj P. K (2013) note that with the advent of the Educational Loan
Scheme of the Public Sector Banks in India in 2001, there has been a fillip in the enrolment in
higher education institutions. The educational loans paved the way for pursuing professional

Literature Review
Karnataka Evaluation Authority | 23
and job-oriented courses offered at the self-financing colleges and Universities to deserving
students.
Rajesh Tiwari and Bimal Anjum (2013) observe that for a country with the largest population
of young people combined with a poor GER, availability of loan is a necessity to ensure supply
of skilled manpower for the economic progress and wealth distribution in the country. They
argue that the move towards privatization of higher education and poor budgetary support
further increases the importance of educational loans for the country. For every 1% rise in
GDP, demand for education loan rises by 3%. They note that in spite of consistent rise in
outstanding amount of education loans, the issue of poor access to banking services, complaints
regarding loan rejection by banks merit serious attention.
Manoj P.K. (2013) analyses the growth of education loan vis-à-vis other forms of personal
loans at the national level. He observes a steady increase in the disbursement higher education
loan with an increase in private colleges and deemed universities and also increase in enrolment
for higher education during the period 2001-2011.
Aarti Dewan et al (2013) conducted a study on student perception on education loan in Haryana
state. The study examined students’ perceptions towards education loan with respect to various
features such as value addition, mortgage, effectiveness, eligibility criteria, disbursement
procedure, convenience and rate of interest. The study found out differential perceptions
between male and female students with respect to various parameters.
According to a study conducted by ASSOCHAM (2015) nearly 680,000 students, many of
them from middle classes, go abroad to study, with an annual outflow of $6 billion to $7 billion,
suggesting that not only the rich but even the middle class that can contribute to cross-
subsidization. Under the circumstance, bank finance for professional courses will be critical in
the future. While loans increased at a phenomenal annual rate of 26% in real terms (not
accounting for inflation) between 2006 and 2010, the annual growth rate dropped to only 3%
in the next four years. This was partly due to loan recovery issues. Alumni funds can be used
to guarantee such loans with limits imposed. Currently 15% of the total enrolment in higher
education in the county is funded by bank loans. This should increase to at least 30% by 2020-
21, implying annual growth rate of 20%. The government can also encourage insurance
companies to design products to be brought by educational institutions to protect themselves
against the possibility of potentially jobless graduates not being able to repay their loans.

Evaluation of the Arivu Educational Loan Scheme Implemented by D Devaraj Urs Backward Classes
Development Corporation in Karnataka State (2011-12 To 2017-18)
24| Karnataka Evaluation Authority
Geetharani P (2016) has examined trends and troubles in financing higher education from the
perspective of student loan as a dominant source of financing higher education in India in an
attempt to explore various factors that influence the growth of higher education in India. Some
of the factors considered are enrolment growth, growing private sector, bulging youth
population with middle class with a wider acceptability of loan culture and increasing earning
premium of higher education and the willingness to pay. Using various secondary data sources
including available unique datasets on interest subsidy scheme on student loans, the author
notes the trend of increasing fees, grants/scholarships and increasing cost and role of markets
in higher education along with affordability within the domain of family characteristics.
Sangeeta Arora and Jagadish Kaur (2016) discuss the status of higher education and
educational loan with special reference to Punjab state in India. The authors observe that there
is a linear increase in the number of HEIs, student enrolment and education loans. In Punjab,
there has been a steady expansion in the number of HEIs and the student loan and the
government has made improvement in the education loan scheme over the years to fulfil the
student needs.
Bandyopadhyay A (2016) made an empirical investigation on the borrower level risk
characteristics of education loan in India. Using a cross section of data from 5000 borrowers
obtained from 4 major public sector banks in India, he found out that education loan defaults
are mainly influenced by security, borrower margin, and repayment periods. The presence of
guarantor or default loss rates. Further, the socio-economic characteristics of borrowers, and
their regional locations also act as important factors associated with education loan defaults.
Senjuti Patra et.al (2017) evaluated the performance of model education loan introduced by the
Indian Central Bank in 2001, which had substantially increased availability of education loans
to students in India. The study focused on assessing the impact of the education loan on
students. The authors found out that not only the loan availability has improved years of
schooling but also decision to enrol for higher education. At disaggregate level, the study
reveals mixed effects of education loans on enrolment and years of schooling with the effects
being more pronounced for the relatively disadvantaged groups across caste, gender and
location (rural/urban).
An empirical study in Punjab by Manisha (2018) has broken the myth that girl students and
rural students do not avail education loans for their higher studies of professional courses.

Literature Review
Karnataka Evaluation Authority | 25
Students belonging to different categories are provided education loans by banks. The study
reveals that most of the meritorious but poor students are refused education loans by the banks
because they do not possess any property; increase in outstanding amount is due to less
employability and less salaries; In the ranking of first five courses in which male students have
availed education loans are B. Tech, MCA, MBA, BDS and Law respectively. In case of female
students first five courses are B. Tech, BDS, Nursing, MBA and MDS; Girls are taking more
loans for BDS, MDS and Nursing because they want to go abroad as these courses have value
in foreign countries. The maximum students’ loans are from public sector banks with lesser
rate of interest; Students whose parents are government employees have taken maximum
education loans followed by farmers and businessmen. The study further points out that Loans’
disbursement should not be linked with income of the family as poor students face difficulties
in getting education loans; Repayment of education loan is a major area of concern for
beneficiaries. Majority of students said that due to less salary they could not repay the loan, it
is difficult for them to repay as instalment in some cases is 40-45 percent of their salary, 30
percent could not find jobs, 14.44 percent could not get suitable job according to their
qualification.; Even bank employees feel less employability and less income are the main
reasons for non-repayment of loans.
3.2 Student loan for higher education: International contexts
Shen et.al, (2009) in an international comparison of government sponsored student loans in
over 70 countries, observe that there is considerable diversity in the design, practice, and
overall efficacy of schemes. They point out that apart from the schemes revealing different
rates of success across countries, five central issues emerge which need to be addressed in
evaluating a current scheme or setting up a new one. These are the objective of the loans
scheme, its initial funding source, the financial viability, justification for government subsidy
of loans schemes, and method of repayment collection.
Student loans in advanced countries is seen as an effective policy intervention for expanding
access to higher education for students. In this regard, Colclough’s study (1990) on student
education loan argues that payroll taxes would satisfy both equity and efficiency criteria more
effectively than students’ loans.
Daniel Rivero’s (2017) analysis of student loans in United States reveals how the student loan
industry betrays young Americans. He observes among the 44 million Americans who have
amassed the nation’s whopping $1.4trillion in student debt, the student loan industry flourished
Evaluation of the Arivu Educational Loan Scheme Implemented by D Devaraj Urs Backward Classes
Development Corporation in Karnataka State (2011-12 To 2017-18)
26| Karnataka Evaluation Authority
under the Obama administration, and its stock rose sharply after the election of Donald Trump.
These findings are further corroborated by Fusion TV investigation (2016), which observe that
most of the wrath stems from structural issues surrounding college finance, like the terms of
the loans, which the federal government and private banks are responsible for, but not the
customer service issues relating to the loan industry. It further notes that the present system of
student loan scheme, instead of breaking down inequities is actually reinforcing.
In the US, over the past decade, the reliance on loans for funding higher education has increased
and this has led to many problems and complexities. For instance, between 2004 and 2014, the
total student debt in the US tripled from $364 billion in 2004 to $1.16 trillion in 2014. The
student debt increased by an average of 13 percent per year. With respect to the rise in the
number of borrowers, it is noticed that a steadily increasing share of young people are taking
out student loans: in 2004, only about 27 percent of 25-year-old had student debt while 9 years
later, in 2013, the proportion of 25 years old with student debt had increased to about 45 percent
(McAndrews, 2015).
A survey by Brookings Institute (2016) in US reveals that the year 2019 is the worst year for
student loans with the borrowers owing over 1.5 trillion dollars student loans. The study
concludes that making college education free would mainly benefit higher income families, not
lower income families.
Chingos (2016), in his study observed that the high school graduation rates and college
enrolment rates in the US among low income and disadvantaged students virtually improved
when certain affirmative actions are provided. However, stark differences remained in college
progression and completion rates between disadvantaged and non-disadvantaged and white and
black students due to factors such as college debt and overpriced college tuition.
Jason Delisle’s study (2016) examined whether the law that prevents borrowers from
discharging their federal loans in bankruptcy, and a separate wage garnishment policy prevent
“strategic defaults”. The study relied on a links of National Student Loan Data System, which
houses records for all federal student loans, with each borrower’s federal income tax
information. Using this data, the author examined the changes in the borrower repayment
patterns before and after key policy changes related to bankruptcy and wage garnishment. The
study revealed that repayment incentives changed for different groups of borrowers who were
affected by changes to bankruptcy law and wage garnishment.

Literature Review
Karnataka Evaluation Authority | 27
Webber (2016) examined the financial value over the course of a lifetime of pursuing a college
degree under a variety of different settings. One of the factors considered was student loan
debt. Having student loans totalling $30,000 and a college degree at age 22 is on average, a
much better situation than peers who decided to skip college and go directly into the labour
market at age 18. The results emphasise the role that risk plays in the cost benefit analysis of
obtaining a college degree.
Nicholas Barr (2015), argues that tuition fees should be fully covered by income-contingent
loans. He argues that in a good system, university is free for students while they are studying
but they then pay part of the cost of their higher education once they have graduated. Thus, a
good system would have tuition fees initially paid for the students by the student loan
administration, but later students would pay part of the cost once they start earning. Thus, a
good system of student loans, where “good” means a loan designed so as not to deter people
from poor backgrounds from going to university.
Countries such as Australia, New Zealand, and the UK have tuition fees, but fully covered by
a well-designed student loan. Another highly desirable feature of the UK system is that any
loan that has not been repaid after 30 years is forgiven. Thus income-contingent repayments
protect graduates with low monthly earnings and forgiveness after 30 years those with low
lifetime earnings (Nicholas Barr, 2015).
Johnstone (2012) presents an excellent review of student loan programmes in Central America,
Europe, Africa, USA, Sweden, Germany, Netherlands, UK, South Africa and Kenya. The
review also covers recent experiences of student loan scheme in some Asian countries
presented by Shen and Li (2003) for China, Kim and Li (2003) for Korea, Ziderman (2003) for
Thailand, Chung (2003) for Hong Kong and Kitaevetal (2003) for Philippines. Across the
countries, the most important and common objectives of student loan programme are equity
and access for the poor. The review reveals cost sharing has an implicit budgetary objective in
regard to public funding replacement in higher education.
Chung (2003) observes, in Hong Kong, the allocation of student loan is based on considerations
of equity, efficiency, and adequacy. The students from less well-off families receive greater
financial assistance and the loan entitlement varies according to a formula based on applicant’s
family financial situation. The scheme mainly has two goals, first, no deserving and qualified
student is deprived of higher education because of lack of funds and second, the maximum loan

Evaluation of the Arivu Educational Loan Scheme Implemented by D Devaraj Urs Backward Classes
Development Corporation in Karnataka State (2011-12 To 2017-18)
28| Karnataka Evaluation Authority
is adjusted so as to correspond to the general living needs of a student through regular surveys
of student expenses and the compilation of the student price index.
Ziderman (2003) notes that the Thailand loan scheme operating from 1996 is aimed at
disadvantaged students enrolled in upper secondary general and vocational schools as well as
tertiary education, in both public and private sector. It receives a considerably higher level of
government subsidy than the loans schemes in the other countries. However, the scheme
although is aimed at needy students, targeting is not found to be effective. The family income
ceiling set for loan eligibility is three times more than the officially designated poverty level.
Besides the loan budget allocation to educational institutions is very loosely tied to the social
profile of the student population at a given institution.
Veronica R Nyahende’s study (2013) examined the factors indicating the success of students’
loan in financing higher education in Tanzania. Using data collected from a larger cross-
sectional survey, the study reveals that the programme is successful in increasing enrolment in
HEIs and further the Higher Education Students’ Loans Boards is making enough efforts to
recover loans apart from putting in place adequate guidelines and satisfactory criteria.
Erik Cantona & Andreas Blom (2004) examined whether financial aids to students in tertiary
education contributed to human capital accumulation through two channels: increased
enrolment and improved student performance. For this study quantitative data from private
universities in Mexico, where the scheme was implemented were analysed. The authors
observe that with regard to the first channel, enrolment, Mexican household survey data
analysis indicates a strong positive effect on university enrolment. Regarding the second
channel, that is student performance, administrative data provided were analysed using a
regression-discontinuity design. Empirical results indicate show better academic performance
than students without a credit.
In South Africa, the national student financial aid scheme (NFSAS), which has an in-built
student loan component not only is unpopular among students as it saddles them with debt but
also the government itself is finding it unviable. Recent reforms have increased the bursary
component of NFSAS and undermined its recovery ratio (George Hull, 2016). In countries
such as Kenya, Nigeria, Mozambique & Zambia, the trend suggests increasingly moving
towards loan schemes. Even rich countries such as New Zealand, Australia and the United

Literature Review
Karnataka Evaluation Authority | 29
Kingdom have introduced cost recovery through loans once their higher education participation
rose above 15%.


Karnataka Evaluation Authority | 31
4 CHAPTER - 4
EMPIRICAL ANALYSIS
In this chapter, empirical analysis of the data gathered from secondary source as well as primary
source has been done. Wherever necessary, disaggregated analysis has been done to capture
variations in trends and patterns across courses, gender, category, district/division of Arivu
beneficiaries. The data analysis is done keeping in view the objectives outlined in the study.
4.1 Progress, Spread and Coverage at the State Level
The spread and coverage of the programme reflects the extent to which the Arivu programme
has been utilized by student beneficiaries. In this section, an attempt has been made to assess
the performance of the Arivu programme in terms of physical and financial target achievements
at the state level. To obtain a macro scenario, time series statistical data obtained from the
official records of the DDUBCDC, KEA/CET and Economic Survey have been used.
Analysing the data, it is seen from Table-4.1 (Graph-4.1 and 4.2), overall, the state has covered
a total of 16,430 students under the Arivu Educational loan programme from the year 2011-12
to 2018-19. The total amount spent for the programme during the period is Rs 8,558.75 lakh.
Considering the achievement in terms of physical target coverage of 15,095 student
beneficiaries and the total financial allocation of Rs. 10,297.71 lakhs for the scheme, the
scheme is efficient to the extent of 108.8 per cent and 83.1 per cent respectively over the same
period.
Further, the annual coverage of the student beneficiaries does not indicate positive growth
during the period. Rather there is fluctuation in the physical targets. The shortfall in fund
utilisation is consistently seen for all the years, except for the years 2013-14 & 2015-16, where
both physical and financial achievements have exceeded 100 per cent. It transpired during the
interaction with the officials that the Department was able to cover more beneficiaries in these
two years because the State government had provided special grants for the Arivu scheme. In
the subsequent years, however, the department had made allocations to the scheme out of the
available funds given to the department. Hence fluctuation in the beneficiary coverage.

Evaluation of the Arivu Educational Loan Scheme Implemented by D Devaraj Urs Backward Classes
Development Corporation in Karnataka State (2011-12 To 2017-18)
32| Karnataka Evaluation Authority
Table 4.1 Progress of ARIVU Education Loan Scheme at the State Level
Year
Target Allocations
(Rs. in Lakhs)
Achievement
(Rs. in Lakhs) Percentage
Physical Financial Physical Financial Physical Financial
2011-12 NA NA 176 17.60 - -
2012-13 NA NA 134 20.60 - -
2013-14 200 100.00 249 108.63 124.50 108.63
2014-15 1615 807.71 997 513.03 61.73 63.52
2015-16 500 250.00 1251 583.01 250.0 233.00
2016-17 3780 2450.00 3523 1951.01 93.0 80.0
2017-18 4000 3150.00 5819 2800.66 145 89
2018-19* 5000 3540.00 4281 2564.21 86 72
Total 15,095 10297.71 16,430 8,558.75 108.8 83.1
Note: * Up to November, 2018. Data for the years 2011-12 and 2012-13 has been taken from TOR of
KEA (DDUBCDC). For the years 2013-14 to 2014-15, data as per the official records provided by
DDUBCDC, Bengaluru. For the years 2015-16 to 2018-19, data has been taken from Economic Survey
of Karnataka, 2018-19.
Figure 4.1 Progress of Arivu Education Loan Scheme at State Level
Source: EOS 2018-19

Empirical Analysis
Karnataka Evaluation Authority | 33
Figure 4.2 Progress of ARIVU Education Loan Scheme at the State Level (in %)
Source: EOS 2018-19
4.1.1 Coverage across Caste Groups
It is noted that some numerical data is available for exclusive caste groups of BC students, such
as Nomadic, Semi-Nomadic, Madivala, Savitha, Kumbara, Thigala and Uppara. This data is
available for only certain years. An attempt is made to assess the coverage of these caste groups.
In case of Nomadic and Semi-Nomadic BC students, analysing the coverage from the year
2014-15 up to 2018-19 (Table 4.2), it is noted that both physical and financial allocations
indicate an increasing trend during this period except for the last year, 2018-19. However,
strangely in terms of achievement, both these parameters indicate severe shortfall.
0.00%
50.00%
100.00%
150.00%
200.00%
250.00%
300.00%
2013-14 2014-15 2015-16 2016-17 2017-18 2018-19* Total
Progress of ARIVU Education Loan Scheme at the State Level (in %)
Percentage Physical - - Percentage Financial - -
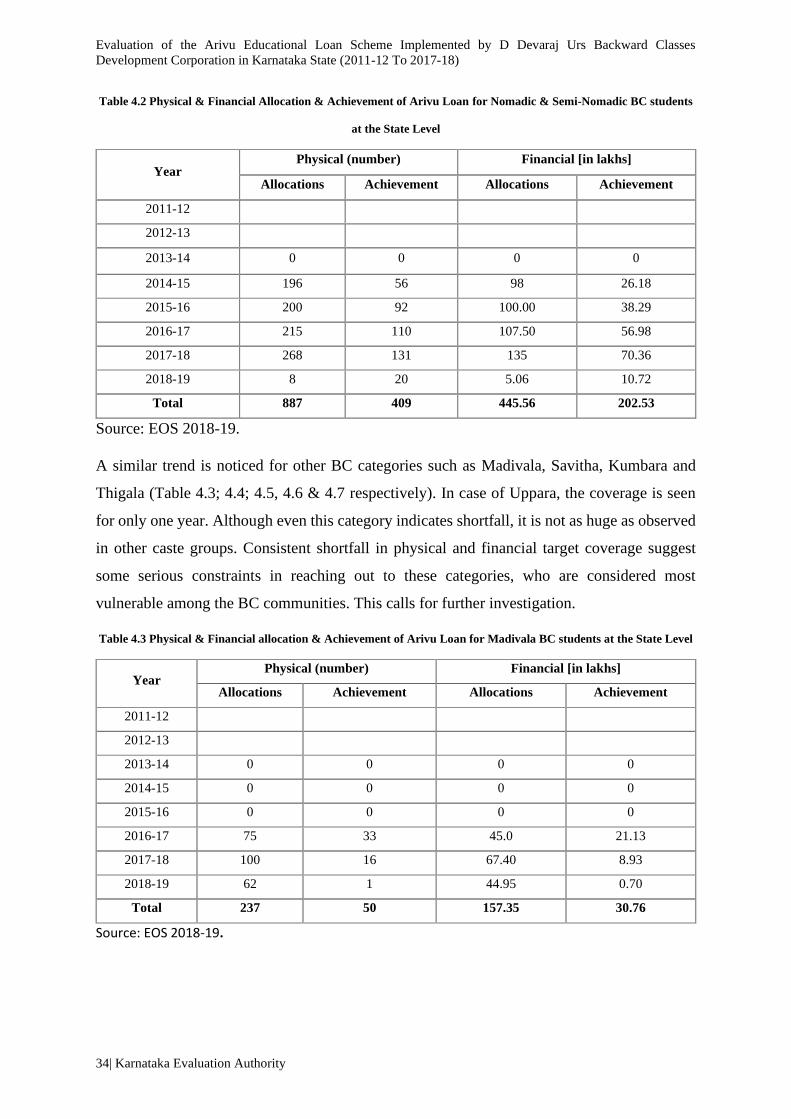
Evaluation of the Arivu Educational Loan Scheme Implemented by D Devaraj Urs Backward Classes
Development Corporation in Karnataka State (2011-12 To 2017-18)
34| Karnataka Evaluation Authority
Table 4.2 Physical & Financial Allocation & Achievement of Arivu Loan for Nomadic & Semi-Nomadic BC students
at the State Level
Year Physical (number) Financial [in lakhs]
Allocations Achievement Allocations Achievement
2011-12
2012-13
2013-14 0 0 0 0
2014-15 196 56 98 26.18
2015-16 200 92 100.00 38.29
2016-17 215 110 107.50 56.98
2017-18 268 131 135 70.36
2018-19 8 20 5.06 10.72
Total 887 409 445.56 202.53
Source: EOS 2018-19.
A similar trend is noticed for other BC categories such as Madivala, Savitha, Kumbara and
Thigala (Table 4.3; 4.4; 4.5, 4.6 & 4.7 respectively). In case of Uppara, the coverage is seen
for only one year. Although even this category indicates shortfall, it is not as huge as observed
in other caste groups. Consistent shortfall in physical and financial target coverage suggest
some serious constraints in reaching out to these categories, who are considered most
vulnerable among the BC communities. This calls for further investigation.
Table 4.3 Physical & Financial allocation & Achievement of Arivu Loan for Madivala BC students at the State Level
Year Physical (number) Financial [in lakhs]
Allocations Achievement Allocations Achievement
2011-12
2012-13
2013-14 0 0 0 0
2014-15 0 0 0 0
2015-16 0 0 0 0
2016-17 75 33 45.0 21.13
2017-18 100 16 67.40 8.93
2018-19 62 1 44.95 0.70
Total 237 50 157.35 30.76
Source: EOS 2018-19.

Empirical Analysis
Karnataka Evaluation Authority | 35
Table 4.4 Physical & Financial allocation & Achievement of Arivu Loan for Savitha BC students at the State Level
Year Physical (number) Financial [in lakhs]
Allocations Achievement Allocations Achievement
2011-12
2012-13
2013-14 0 0 0 0
2014-15 0 0 0 0
2015-16 0 0 0 0
2016-17 75 10 45.0 5.66
2017-18 100 15 67.40 9.90
2018-19 62 3 44.95 2.01
Total 237 28 157.35 17.57
Source: EOS 2018-19.
Table 4.5 Physical & Financial allocation & Achievement of Arivu Loan for Kumbara BC students at the State Level
Year Physical (number) Financial [in lakhs]
Allocations Achievement Allocations Achievement
2011-12
2012-13
2013-14 0 0 0 0
2014-15 0 0 0 0
2015-16 0 0 0 0
2016-17 75 30 45.0 18.98
2017-18 100 17 67.40 10.26
2018-19 62 2 44.95 0.77
Total 237 49 157.35 30.01
Source: EOS 2018-19.

Evaluation of the Arivu Educational Loan Scheme Implemented by D Devaraj Urs Backward Classes
Development Corporation in Karnataka State (2011-12 To 2017-18)
36| Karnataka Evaluation Authority
Table 4.6 Physical & Financial allocation & Achievement of Arivu Loan for Tigala BC students at the State Level
Year Physical (number) Financial [in lakhs]
Allocations Achievement Allocations Achievement
2011-12
2012-13
2013-14 0 0 0 0
2014-15 0 0 0 0
2015-16 0 0 0 0
2016-17 75 11 45.0 7.90
2017-18 138 10 89.70 8.06
2018-19 69 1 44.85 0.42
Total 282 22 179.55 16.38
Source: EOS 2018-19.
Table 4.7 Physical & Financial allocation & Achievement of Arivu Loan for Uppara BC students at the State Level
Year Physical (number) Financial [in lakhs]
Allocations Achievement Allocations Achievement
2011-12
2012-13
2013-14 0 0 0 0
2014-15 0 0 0 0
2015-16 0 0 0 0
2016-17 75 37 45 21.59
2017-18 0 0 0 0
2018-19 0 0 0 0
Total 75 37 45 21.59
Source: EOS 2018-19.

Empirical Analysis
Karnataka Evaluation Authority | 37
4.1.2 Arivu Beneficiaries under CET Category
The State’s data for BC students under the CET category is available for 3 years from 2016-17
to 2018-19 (Table 4.8). The figures however suggest an increasing pattern in terms of physical
and financial target achievements over the years indicating good performance of the scheme.
Table 4.8 Physical & Financial allocations under CET (Overall State)
Year Physical Financial (in lakhs)
2016-17 525 268.43
2017-18 1059 543.2
2018-19 1551 518.39
Total 3135 1330.02
Source: EOS 2018-19
4.1.3 Beneficiary Coverage across Higher Education Courses: Time Series Analysis
Spread and coverage of student beneficiaries under Arivu programme is an ostensible
reflection of the programme’s effectiveness. It indicates how programme has targeted student
beneficiaries across different courses, across regions, male and female students, and across
different categories over the years. Arivu programme is not universal in coverage of BC
students in higher education. It is limited to certain professional and other undergraduate and
post graduate degree courses. It targets both BC students selected through CET by the
Karnataka Examination Authority (KEA) and students in certain non-CET courses offered in
HEIs. Over the years, there are some revisions in the inclusion and exclusion of non-CET
students. In this context, an attempt is made to capture trends by assessing the coverage of
beneficiaries across different higher education courses over the period. For this analysis,
universe data available for the 12 sample districts in the four divisions of the state from 2011-
12 to 2017-18 is used. It is seen from the Table 4.9 that there has been an increase in the overall
number of beneficiaries for different higher education courses both for CET and Non-CET
categories over the years. However, the increase is huge in terms of absolute numbers for CET
courses. From a mere 31 in the year 2011, it increased to 1111 in 2017.

Evaluation of the Arivu Educational Loan Scheme Implemented by D Devaraj Urs Backward Classes
Development Corporation in Karnataka State (2011-12 To 2017-18)
38| Karnataka Evaluation Authority
Table 4.9 Arivu Education Beneficiaries in CET and Non-CET courses
Course
Year
CET
CET
Total
Non-CET
Non-
CET
Total
Grand
Total BE/
BTech PG
Other
Profes MBBS Others
Gen.
Degree Others PG
2011 31 31 31
2012 27 27 27
2013 115 16 6 137 137
2014 418 67 12 17 1 515 2 5 7 522
2015 437 34 9 21 1 502 3 1 4 506
2016 591 45 20 40 2 698 9 2 3 14 712
2017 951 58 55 44 3 1111 27 2 8 37 1148
G T 2570 220 96 128 7 3021 41 4 17 62 3083
Source: DDUBDC, Bengaluru
However, the incremental growth is not consistent from 2011 to 2015. Across different
courses, it is quite pleasing to note it is the BE/BTech course, which reveals not only highest
coverage of beneficiaries but also consistent increase in absolute numbers over the years. It
appears that from the year 2016, the coverage has taken a big leap in case of BE course. The
trend is clearly an indication of the Arivu higher educational loan programme boosting
participation of BC students in the most trending professional programme (Engineering) in the
sunrise sector of the economy.
Similarly, consistent increase is also noticed in case of PG, Medical and professional courses
under the CET category from 2015 onwards, although the number is limited to two digits and
less than 60. In case of non-CET courses, it is only in the year 2014, the Arivu education loan
beneficiaries are beginning to make themselves visible in different courses, albeit in small
numbers. This is due to the programme itself being extended to them in the later years and also
limiting the coverage itself to a small proportion. Considering the fact that large majority of
higher education enrolment is in general degree courses, that too in rural areas, and comprises
large chunk of OBC students, it becomes necessary to examine the relevance and prospects of
extending education loan benefit even to this section of students.
The increasing numbers of beneficiary coverage over the years is in a way broad reflection of
higher utility value of the programme. However, mere numerical figures do not adequately

Empirical Analysis
Karnataka Evaluation Authority | 39
reflect the utility aspect of the programme. Therefore, one has to assess the utility value by
considering other factors such as various benefits students have received after availing the loan.
This aspect is further analysed and discussed by using field survey primary data [section 4.3;
4.4; 4.5; 4.6].
4.1.4 Beneficiary Coverage across Categories: Time Series Analysis
Analysis of time series beneficiary data is attempted to examine the coverage trends for four
different categories of students over the time for different courses under CET and non-CET.
Table 4.10, 4.11, 4.12 and 4.13 present the coverage trends for Category I, category IIA,
category IIIA and category IIIB respectively. The increase in coverage over the time across
four categories reveals that it is the BE/B.Tech students who are availing the Arivu loan benefit
to the maximum extent from all the four categories. It is noted that from the year 2016-17, for
BC students selected through CET, an advance grant is being made available to the CET Cell
at the time of student counselling, to enable students to make fee payment as per requirement
of the respective college. Further on, it is the category IIA students who are the largest
beneficiaries, followed by IIIB, I and IIIA. In case of MBBS degree, the increase in coverage
is noticed highest for Category IIA from initial 3 to 22 in 2017, the other three categories do
not reveal increased coverage. In fact, strangely, category IIIB reveals inconsistent growth with
initial 3 beneficiaries in 2015 increasing to 16 in 2016 and declining to 9 during 2017.
Table 4.10 Arivu beneficiary coverage under different courses for category I students
Year
CET Non-CET Total
BE/B Tech PG Degree MBBS Others General
Degree PG Others
2011 11 100.00) (0.00) (0.00) (0.00) (0.00) (0.00) (0.00) (0.00) 11(100.00)
2012 4 (100.00) (0.00) (0.00) (0.00) (0.00) (0.00) (0.00) (0.00) 4 (100.00)
2013 22 (91.67) 1(4.17) (0.00) 1(4.17) (0.00) (0.00) (0.00) (0.00) 24 (100.00)
2014 57 (86.36) 4(6.06) 3(4.55) 2(3.03) (0.00) 2 (66.67) 1(33.33) (0.00) 69 (100.00)
2015 73 (87.95) 5(6.02) 1(1.20) 4(4.82) (0.00) 2(100.00) (0.00) (0.00) 85 (100.00)
2016 78 (83.87) 6(6.45) 3(3.23) 4(4.30) 2(2.15) 2(100.00) (0.00) (0.00) 95 (100.00)
2017 145(81.46) 9(5.06) 12(6.74) 9(5.06) 3(1.69) 3 (60.00) 1(20.00) 1(20.00) 183(100.00)
Grand
Total 390(84.97) 25(5.45) 19(4.14) 20(4.36) 5(1.09) 9 (75.00) 2(16.67) 1 (8.33) 471(100.00)
Source: DDUBDC, Bengaluru Note : Numbers in parenthesis are in percentage

Evaluation of the Arivu Educational Loan Scheme Implemented by D Devaraj Urs Backward Classes Development Corporation in Karnataka State (2011-12 To 2017-18)
Karnataka Evaluation Authority | 40
Table 4.11 Arivu beneficiary coverage under different courses for category IIA students
Course
Year
CET Non-CET
Total BE/B Tech PG Degree MBBS Others
General
Degree PG Others
2011-12 20 (100.00) (0.00) (0.00) (0.00) (0.00) (0.00) (0.00) (0.00) 20 (100.00)
2012-13 23 (100.00) (0.00) (0.00) (0.00) (0.00) (0.00) (0.00) (0.00) 23 (100.00)
2013-14 66 (83.54) 10 (12.66) (0.00) 3 (3.80) (0.00) (0.00) (0.00) (0.00) 79 (100.00)
2014-15 219 (80.81) 34 (12.55) 6 (2.21) 11 (4.06) 1 (0.37) (0.00) 4 (100.00) (0.00) 275 (100.00)
2015-16 243 (87.73) 18 (6.50) 5 (1.81) 10 (3.61) 1 (0.36) (0.00) 1 (100.00) (0.00) 278 (100.00)
2016-17 341 (86.11) 25 (6.31) 13 (3.28) 17 (4.29) (0.00) 5 (55.56) 3 (33.33) 1 (11.11) 405 (100.00)
2017-18 498 (86.31) 30 (5.20) 27 (4.68) 22 (3.81) (0.00) 11 (68.75) 4 (25.00) 1 (6.25) 593 (100.00)
Grand Total 1410 (85.82) 117 (7.12) 51 (3.10) 63 (3.83) 2 (0.12) 16 (53.33) 12 (40.00) 2 (6.67) 1673 (100.00)
Source: DDUBDC, Bengaluru Note : Numbers in parenthesis are in percentage
Table 4.12 Arivu beneficiary coverage under different courses for category IIIA students
Course
Year
CET Non-CET
Total BE/B Tech PG Degree MBBS
General
Degree PG Others
2013 11 (73.33) 2 (13.33) (0.00) 2 (13.33) 15 (100.00)
2014 59 (76.62) 12 (15.58) 2 (2.60) 4 (5.19) 77 (100.00)
2015 67 (88.16) 4 (5.26) 1 (1.32) 4 (5.26) 1 (100.00) (0.00) (0.00) 77 (100.00)
2016 98 (89.91) 7 (6.42) 1 (0.92) 3 (2.75) (0.00) (0.00) 1 (100.00) 110 (100.00)
2017 131 (89.73) 5 (3.42) 6 (4.11) 4 (2.74) 5 (83.33) 1 (16.67) (0.00) 152 (100.00)
Grand
Total 366 (86.52) 30 (7.09) 10 (2.36) 17 (4.02) 6 (75.00) 1 (12.50) 1 (12.50) 431 (100.00)
Source: DDUBDC, Bengaluru

Empirical Analysis
Karnataka Evaluation Authority | 41
Table 4.13 Arivu beneficiary coverage under different courses for category IIIB students
Course
Year
CET Non-CET Total
BE/B Tech PG Degree MBBS General
Degree PG
2013 16(84.21) 3 (15.79) (0.00) (0.00) (0.00) (0.00) 19(100.00)
2014 83(82.18) 17(16.83) 1 (0.99) (0.00) (0.00) (0.00) 101(100.00)
2015 54(81.82) 7 (10.61) 2 (3.03) 3 (4.55) (0.00) (0.00) 66 (100.00)
2016 74(74.00) 7 (7.00) 3 (3.00) 16(16.00) 2 (100.00) (0.00) 102(100.00)
2017 177(84.29) 14 (6.67) 10 (4.76) 9 (4.29) 8 (80.00) 2(20.00) 220(100.00)
Grand
Total 404(81.45) 48 (9.68) 16 (3.23) 28 (5.65) 10 (83.33) 2(16.67) 508(100.00)
Source: DDUBDC, Bengaluru Note : Numbers in parenthesis are in percentage
Thus, the proportion of coverage across four categories over the time is found to be in
alignment with the State norms for distribution of education loan benefit. The number under
Non-CET is small and the increase over the years for different categories is also insignificant.
Justification for not up scaling coverage for the students under non-CET perhaps calls for
proper explanation.
4.1.5 Beneficiary Coverage: Gender-Wise and Regional Analysis
In this section, the coverage of male and female beneficiaries across 12 sample districts in the
four divisions of the state is examined to capture variations if any. The data from the official
records of the DDUBCDC have been used for this analysis. The cumulative statistics for the
entire universe of student beneficiary from 2011-12 to 2018-19 are used for this analysis.
At the outset, the coverage of male and female students has been examined across regions. A
peek into Table 4.14 and Graph-4.3 reveals that overall, the programme has covered 38.3 per
cent of female students and 61.7 per cent of male students during the period. That is for every
6 boys, 4 girls are covered under the programme. It is to be noted that the Programme does not
have any gender focus. Moreover, Karnataka has achieved gender parity in higher education
with girls constituting 50.04 per cent of the overall higher education enrolment (AISHE, 2018-
19). Across regions, the same overall trend of less coverage of girls as compared to boys is
noticed. However, the yawning gender gap in Kalaburagi and Belgaum divisions is a matter of
concern. Whether Kalaburagi, Bidar and Belagavi districts deserve better targeting of girls
under the programme has to be seriously looked into.

Evaluation of the Arivu Educational Loan Scheme Implemented by D Devaraj Urs Backward Classes
Development Corporation in Karnataka State (2011-12 To 2017-18)
42| Karnataka Evaluation Authority
Table 4.14 Gender- wise Coverage across Sample Districts (Universe-All Beneficiaries)
Districts Female Male Total
B.Urban 370 (47) 415 (53) 785 (100)
Kolar 80 (37) 136 (63) 216 (100)
Shivamogga 56 (44) 71 (56) 127 (100)
Bengaluru division 506 (45) 622 (55) 1128 (100)
Bagalkote 90 (32.1) 190 (67.9) 280 (100)
Belagavi 148 (31.6) 320 (68.4) 468 (100)
Uttara Kannada 31 (41.9) 43 (58.1) 74 (100)
Belagavi Division 269 (32.7) 553 (67.3) 822 (100)
Bellary 71 (36) 124 (64) 195 (100)
Bidar 38 (32) 80 (68) 118 (100)
Kalaburgi 55 (26) 153 (74) 208 (100)
Kalaburgi division 164 (31) 357 (69) 521 (100)
Hassan 54 (41) 78 (59) 132 (100)
Kodagu 125 (38) 203 (62) 328 (100)
Mysore 16 (48) 17 (52) 33 (100)
Mysore Division 195 (40) 298 (60) 493 (100)
Overall Total 1134 (38.3) 1830 (61.7) 2964 (100)
Source: DDUBDC, Bengaluru Note: Numbers in parenthesis are in percentage
Figure 4.3 Gender- wise Coverage across Sample districts
Source: DDUBDC, Bengaluru
47%37% 44%
32% 32%42% 36% 32% 26%
41% 38%48%
38%
53%63% 56%
68% 68%58% 64% 68% 74%
59% 62%52%
62%
0%
20%
40%
60%
80%
100%
120%
Gender- wise Coverage across Sample districts (in %)
Female Male

Empirical Analysis
Karnataka Evaluation Authority | 43
4.1.6 Beneficiary Coverage: Category & Regional Analysis
Analysing the coverage of beneficiaries across four different categories of the BC, it is seen
from the numerical database (Table-4.15 and Graph-4.4) that the coverage appears to be more
or less in alignment with the original proportional norm of 14%, 54%, 14%, and 18% for
categories I, IIA. IIIA & IIIB respectively. However, since 2016-17, the norm was revised with
70% coverage for category I and IIA and 30% coverage for category IIIA and IIIB. Thus
considering this norm, overall at the state level, as well as at the divisional level, the coverage
distribution is quite in alignment. However among districts, Kolar, Bagalkote, and Uttara
Kannada reveal higher coverage for category I and IIA. In contrast, Bengaluru, Kolar and
Uttara Kannada reveal under coverage for category IIA, IIIA and IIIB respectively. Thus, all
through, by default, category IIA is found to be the largest beneficiary of the programme. It
may be noted that this category predominantly covers castes like Kuruba, Ganiga, Banajiga,
which do not necessarily represent the first generation beneficiaries of higher education
programmes. On discussion with the officials of the department in this direction, it was justified
that the demand for loan is higher among IIIA & IIIB in Bengaluru and Mysore districts and
for IIIB students in Hyderabad Karnataka region. Besides, it is also seen that that the
demographic composition and spread of the population in these regions is in alignment with
this argument. However, the most crucial question in this regard is to what extent the final
selection of the beneficiaries seriously considers the vulnerability and risk factors rather than
merely going by aggregate categorisation.
Table 4.15 BC category- wise Coverage across Sample districts (Universe-All Beneficiaries)
Districts Cat-I Cat-IIA Cat-IIIA Cat-IIIB Total
B.Urban 92 (12) 418 (53) 217 (28) 58 (7) 785 (100)
Kolar 54 (25) 112 (52) 17 (8) 33 (15) 216 (100)
Shivamogga 16 (13) 70 (55) 37 (29) 4 (3) 127 (100)
Bengaluru
Division 162 (14) 600 (53) 271 (24) 95 (8) 1128 100)
Bagalkote 32 (11.4) 179 (63.9) 11 (3.9) 58 (20.7) 280 (100)
Belagavi 63 (13.5) 259 (55.3) 11 (2.4) 135(28.8) 468 (100)
UttaraKannada 27 (36.9) 46 (62.2) 0 (0) 1 (1.4) 74 (100)
Belagavi
Division 122 (15) 484 (59) 22 (3) 194 (24) 822 (100)
Bellary 26 (13) 114 (58) 15 (8) 40 (21) 195 (100)
Bidar 28 (24) 55 (47) 7 (6) 28 (24) 118 (100)

Evaluation of the Arivu Educational Loan Scheme Implemented by D Devaraj Urs Backward Classes
Development Corporation in Karnataka State (2011-12 To 2017-18)
44| Karnataka Evaluation Authority
Kalaburgi 35 (17) 101 (49) 15 (7) 57 (27) 208 (100)
Kalaburgi
Division 89 (17) 270 (52) 37 (7) 125 (24) 521 (100)
Hassan 21 (16) 66 (50) 35 (26) 10 (8) 132 (100)
Kodagu 54 (16) 181 (55) 52 (16) 41 (13) 328 (100)
Mysore 3 (9) 18 (55) 8 (24) 4 (12) 33 (100)
Mysore
Division 78 (16) 265 (54) 95 (19) 55 (11) 493 (100)
Overall Total 451(15.2) 1619 (54.6) 425(14.3) 469(15.8) 2964(100)
Source: DDUBDC, Bengaluru Note : Numbers in parenthesis are in percentage
Figure 4.4 BC category- wise Coverage across Sample districts (Universe-All Beneficiaries)
Source: DDUBDC, Bengaluru
4.1.7 Beneficiary Coverage: Higher Education Courses & Regional Analysis
The coverage of Arivu beneficiaries is further analysed to capture the regional spread and
across different courses. Table 4.16 presents data relating to the same. It is clearly evident that
a whopping majority (81.7%) of student beneficiaries are seen in the BE course. It is quite
pleasing to note this encouraging trend considering the fact that BE is one of the most sought-
after programmes targeting lucrative and highly remunerative jobs in the sunrise sector of the
knowledge economy. Presence of increasing number of students and that too from this
marginalised population segment in a trendy course such as Engineering can be considered as
0%
10%
20%
30%
40%
50%
60%
70%
BC category- wise Coverage across Sample districts
(Universe-All Beneficiaries) (in %)
Cat - I Cat - II Cat - IIIA Cat - IIIB

Empirical Analysis
Karnataka Evaluation Authority | 45
a positive impact of the programme in enhancing access for these students. Across regions, all divisions present the same trend. It is interesting
and gratifying to note that backward districts such as Bagalkote and Uttara Kannada reveal more than 90.0 per cent of beneficiaries in the BE
programme. Considering the fact that admission to engineering is based on CET ranking, questions such as whether BC students in these districts
reveal higher success rates in the qualifying examinations at the higher secondary stage, as well as are improving their performance in the CET
examinations also to ensure eligibility for accessing BE programme merit deeper analysis.
Table 4.16 Course-wise distribution & coverage of beneficiaries in the sample districts (Universe-All Beneficiaries)
Districts BAMS BE MBA Graduate PG MBBS MD/MS PhD Total
Bagalkote 1 (0.4) 254 (90.7) 2 (0.7) 10 (3.6) 9 (3.2) 4 (1.4) 0
0
280 (100)
Belagavi 10 (2.1) 343 (73.3) 15 (3.2) 38 (8.1) 27 (5.8) 30 (6.4) 2 (0.4) 3 (0.6) 468 (100)
Uttara Kannada 2 (2.7) 71 (95.9) 1 (1.4) 0 (0) 0 (0) 0 (0) 0 (0) 0 (0) 74 (100)
Belagavi Division 13 (1.6) 668 (81.3) 18 (2.2) 48 (5.8) 36 (4.4) 34 (4.1) 2 (0.2) 3 (0.4) 822 (100)
Bellary 1 (0.5) 151 (77) 13 (7) 5 (3) 13 (7) 12 (6) 0 (0) 0 (0) 195 (100)
Bidar 1 (0.8) 89 (75) 3 (3) 9 (8) 7 (6) 9 (8) 0 (0) 0 (0) 118 (100)
Kalaburgi 1 (0.4) 163 (79) 8 (4) 9 (4) 13 (6) 13 (6) 0 (0) 1 (0.4) 208 (100)
Kalaburgi Division 3 (0.5) 403 (77) 24 (7) 23 (4) 33 (6) 34 (7) 0 (0) 1 (0.1) 521 (100)
Hassan 1 (1) 112 (85) 5 (4) 5 (4) 6 (4) 3 (2) 0 (0) 0 (0) 132 (100)
Mysuru 1 (0.30) 271 (82) 25 (8) 8 (2) 14 (4) 9 (3) 0 (0) 0 (0) 328 (100)
Kodagu 0 (0) 28 (85) 2 (6) 2 (6) 0 (0) 1 (3) 0 (0) 0 (0) 33 (100)
Mysuru Division 2 (1) 411 (83) 32 (6) 15 (3) 20 (4) 13 (3) 0 (0) 0 (0) 493 (100)
Bengaluru Urban 5 (1) 663 (84) 18 (2) 49 (6) 22 (3) 24 (3) 4 (1) 0 (0) 785 (100)
Shivmogga 0 (0) 181 (84) 6 (3) 16 (7) 6 (3) 5 (2) 0 (0) 2 (1) 216 (100)
Kolar 2 (2) 96 (76) 5 (4) 10 (8) 5 (4) 9 (7) 0 (0) 0 (0) 127 (100)
Bengaluru division 7 (1) 940 (83) 29 (3) 75 (7) 33 (3) 38 (3) 4 (0.5) 2 (0.1) 1128 (100)
Overall Total 25 (0.8) 2422 (81.7) 103 (3.5) 161 (5.4) 122 (4.1) 119 (4.0) 6 (0.2) 6 (0.2) 2964 (100)
Source: DDUBDC, Bengaluru Note : Numbers in parenthesis are in percentage

Evaluation of the Arivu Educational Loan Scheme Implemented by D Devaraj Urs Backward Classes
Development Corporation in Karnataka State (2011-12 To 2017-18)
46| Karnataka Evaluation Authority
For backward class students experiencing different forms of vulnerability, getting into colleges
and universities itself is a great honour and achievement. For first generation students, securing
admission in prestigious higher education institutions and pursuing professional programmes
such as BE and MBBS are matters of prestige and privilege. Under the circumstance when
large number of BC students are enrolled into the BE programme, definitely this is an
indication of positive impact of the programme. However, whether the state has ensured proper
targeting of the BC students from the most vulnerable categories and there is no slip-up in the
coverage of different categories is something which needs further probing.
4.2 Arivu Education Loan Beneficiaries: Background
In this section, an attempt is made to understand the background information about Arivu
beneficiaries with respect to certain household information. The analysis is done using primary
data collected from the field survey of 1130 sample beneficiaries selected for the study.
4.2.1 Landholding Status
The programme targets higher education students of backward class below annual family
income of Rs.3.5 lakh. In this context, it would be worthwhile to examine the household
background information of the beneficiaries with respect to landholding and other assets owned
in order to ascertain deprivation and vulnerability aspects of the beneficiaries. For this analysis,
the data provided by the beneficiaries who participated in the primary survey have been used.
Looking at the landowning status, it is seen from table 4.17 that overall 58.0 % of the
beneficiary households do not own land. However, across region, both Bengaluru division and
Belagavi division reveals higher proportion of landless households as compared to landed. In
fact, the former reveals landless household to the extent of 73.0% and the latter to the extent of
almost 60.0%. Whereas in case of Kalaburgi division, landless beneficiary households are only
40.0 % and in case of Mysore division, the distribution of landed and landless is almost equal.
Across districts, quite interestingly, Kalaburgi (74.54%) and Kolar (72.0%) districts reveal
highest proportion of beneficiaries owning landholdings. Similarly, districts like Shivamogga
(56.79%), Bidar (53.85%) and Hassan (64.18%) reveal more than half of the beneficiaries
holding lands. Thus, the vulnerability factor seems to be higher in districts revealing higher
proportion of landless beneficiaries rather than those revealing an opposite trend.

Empirical Analysis
Karnataka Evaluation Authority | 47
Table 4.17 Land owning status of the Arivu Beneficiaries
Division/District Owns land Landless NR Grand Total
Bengaluru Division 69 (19.65 ) 256 (72.93 ) 26 (7.41 ) 351
Bengaluru Urban 5 (2.04 ) 214 (87.34 ) 26 (10.61 ) 245
Kolar 18 (72.00 ) 7 (28.00 ) (0.00 ) 25
Shivamogga 46 (56.79 ) 35 (43.21 ) (0.00 ) 81
Belagavi Division 124 (40.25 ) 184 (59.74 ) (0.00 ) 308
Bagalkot 30 (38.46 ) 48 (61.53 ) (0.00 ) 78
Belagavi 80 (42.32 ) 109 (57.67 ) (0.00 ) 189
Uttar Kannada 14 (34.15 ) 27 (65.85 ) (0.00 ) 41
Kalaburgi Division 136 (60.17 ) 90 (39.82 ) (0.00 ) 226
Bellary 19 (37.25 ) 32 (62.75 ) (0.00 ) 51
Bidar 35 (53.85 ) 30 (46.15 ) (0.00 ) 65
Kalaburgi 82 (74.54 ) 28 (25.45 ) (0.00 ) 110
Mysore Division 123 (50.20 ) 122 (49.79 ) (0.00 ) 245
Hassan 43 (64.18 ) 24 (35.82 ) (0.00 ) 67
Kodagu 3 (16.67 ) 15 (83.33 ) (0.00 ) 18
Mysore 77 (48.13 ) 83 (51.87 ) (0.00 ) 160
Grand Total 452 (40 ) 652 (57.69) 26 (2.30 ) 1130
Source: DDUBDC, Bengaluru Note : Numbers in parenthesis are in percentage
A further attempt to understand the landholding status of the beneficiaries across four BC
categories, it is seen (table 4.18) except category IIIB, in all the remaining three categories,
more than half of the beneficiary households are landless. Thus, the vulnerability factor
appears to be higher in case of category I, IIA and IIIA, with category IIIA revealing highest
proportion of landless beneficiaries.
Table 4.18 Landowning Status across Beneficiary Categories
Category Owns a land Landless NR Total
I 72 (45.0 ) 85 (53.12 ) 3 (1.88 ) 160
IIA 243 (37.44 ) 391 (60.25) 15 (2.31 ) 649
IIIA 46 (30.67 ) 98 (65.3 ) 6 (4.00 ) 150
IIIB 91 (53.2 ) 78 (45.6 ) 2 (1.17 ) 171
Grand Total 452 (40.0 ) 652 (57.69 ) 26 (2.30 ) 1130
Source: DDUBDC, Bengaluru & Filed Survey Note : Numbers in parenthesis are in percentage
A further attempt is made to understand the productivity aspect of the land owned. Thus,
probing the nature of land owned by 452 beneficiaries, it is noticed (table 4.19) that overall

Evaluation of the Arivu Educational Loan Scheme Implemented by D Devaraj Urs Backward Classes
Development Corporation in Karnataka State (2011-12 To 2017-18)
48| Karnataka Evaluation Authority
70.0% of these beneficiaries own dry land. Only 23.45% own irrigated and another 3.32% own
farm land indicating some productivity status. To this extent, landholdings do not necessarily
productive income. If one looks at the land owned status across categories, it may be noticed
that 70 to 80% of the beneficiaries owning just dry land across all categories do not seem to
generate any produce. It is about 20 to 25.0% of the beneficiaries from category I, IIA, and
IIIB seem to be in a position to generate some income by owning irrigated and farm land.
Therefore, even for 70.0% of the beneficiaries, owning land does not guarantee any economic
advantage.
Table 4.19 Type of Land Owned Across Beneficiary Categories
Category Farm Irrigated Dry Total
I 2 (2.78 ) 19 (26.39 ) 51 (70.1 ) 72
IIA 7 (2.88 ) 63 (25.92 ) 173 (71.19) 243
IIIA 4 (8.70 ) 5 (10.87 ) 37 (80.43 ) 46
IIIB 3 (3.30 ) 21 (23.07 ) 67 (73.62 ) 91
Grand Total 16 (3.32 ) 108 (23.45 ) 328 (70.58 ) 452
Source: Field Survey Note : Numbers in parenthesis are in percentage
4.2.2 Household Assets Owned by Beneficiaries
Owning assets and gadgets reflect certain level of economic standard of each family. Some
such assets could be Electricity, Fan, Refrigerator, Mobile phone, internet facility, vehicles like
bicycle, two-wheelers such as bikes, scooters and automobiles like, passenger cars, commercial
vehicles etc, A peek into the table 4.20 clearly reveals that in most households, the presence of
singular asset is seen to the extent of around 20.0 per cent only. However, there is slight
variation in the extent to which each family owns the same. It is only items such as Refrigerator,
Internet and Car seem to be rare possession for many households.

Empirical Analysis
Karnataka Evaluation Authority | 49
Table 4.20 Household Assets owned by Beneficiaries across districts
Division /
District Electricity Fan Refrigerator TV Mobile Internet Bicycle Scooter Car Total
Bengaluru Division 320 (17.68 ) 288 (15.91 ) 234 (12.93 ) 308 (17.02 ) 306 (16.91 ) 74 (4.09 ) 54 (2.98 ) 217(11.99 ) 9 (0.50 ) 1810
Bengaluru Urban 215 (17.41 ) 203 (16.44 ) 197 (15.95 ) 213 (17.25 ) 207 (16.76 ) 40(3.24 ) 14 (1.13 ) 145(11.74 ) 1 (0.08 ) 1235
Kolar 25 (19.08 ) 24 (18.32 ) 9 (6.87 ) 22 (16.79 ) 23 (17.56 ) 3 (2.29 ) 7 (5.34 ) 18 (13.74 ) (0.00 ) 131
Shivamogga 80 (18.02 ) 61 (13.74 ) 28 (6.31 ) 73 (16.44 ) 76 (17.12 ) 31 (6.98 ) 33 (7.43 ) 54 (12.16 ) 8 (1.80 ) 444
Belagavi Division 296 (20.76 ) 238 (16.69 ) 78 (5.47 ) 249 (17.46 ) 265 (18.58 ) 40 (2.81 ) 126 (8.84 ) 127 (8.91 ) 7 (0.49 ) 1426
Bagalkot 75 (20.66 ) 72 (19.83 ) 38 (10.47 ) 65 (17.91 ) 56 (15.43 ) 4 (1.10 ) 47 (12.95 ) 6 (1.65 ) (0.00 ) 363
Belagavi 180 (20.69 ) 133 (15.29 ) 23 (2.64 ) 147 (16.90 ) 169 (19.43 ) 36 (4.14 ) 77 (8.85 ) 99 (11.38 ) 6 (0.69 ) 870
Uttar Kannada 41 (21.24 ) 33 (17.10 ) 17 (8.81 ) 37 (19.17 ) 40 (20.73 ) (0.00 ) 2 (1.04 ) 22 (11.40 ) 1 (0.52 ) 193
Kalaburgi Division 219 (19.16 ) 217 (18.99 ) 56 (4.90 ) 180 (15.75 ) 202 (17.67 ) 108 (9.45 ) 53 (4.64 ) 105 (9.19 ) 3 (0.26 ) 1143
Bellary 50 (17.24 ) 49 (16.90 ) 15 (5.17 ) 45(15.52 ) 48(16.55 ) 44 (15.17 ) 4 (1.38 ) 35 (12.07 ) (0.00 ) 290
Bidar 62 (15.94 ) 61 (15.68 ) 17 (4.37 ) 60 (15.42 ) 60 (15.42 ) 43 (11.05 ) 43 (11.05 ) 43 (11.05 ) (0.00 ) 389
Kalaburgi 107 (23.06 ) 107 (23.06 ) 24 (5.17 ) 75 (16.16 ) 94 (20.26 ) 21 (4.53 ) 6 (1.29 ) 27 (5.82 ) 3 (0.65 ) 464
Mysore Division 242 (19.10 ) 186 (14.68 ) 116 (9.16 ) 233 (18.39 ) 221 (17.44 ) 29 (2.29 ) 50 (3.95 ) 183 (14.44) 7 (0.55 ) 1267
Hassan 67 (21.47 ) 48 (15.38 ) 20 (6.41 ) 60 (19.23 ) 63 (20.19 ) 1 (0.32 ) 9 (2.88 ) 43 (13.78 ) 1 (0.32 ) 312
Kodagu 18 (25.71 ) 15 (21.43 ) 7 (10.00 ) 18 (25.71 ) 5 (7.14 ) (0.00 ) 3 (4.29 ) 4 (5.71 ) (0.00 ) 70
Mysore 157 (17.74 ) 123 (13.90 ) 89 (10.06 ) 155 (17.51 ) 153(17.29 ) 28 (3.16 ) 38 (4.29 ) 136(15.37 ) 6 (0.68 ) 885
Grand Total 1077 (19.08 ) 929(16.45 ) 484(8.57 ) 970(17.18 ) 994(17.61 ) 251(4.45 ) 283(5.01 ) 632(11.19 ) 26(0.46 ) 5646
Source: Field Survey Note : Numbers in parenthesis are in percentage

Empirical Analysis
50| Karnataka Evaluation Authority
4.2.3 Student Beneficiaries by Type of College, Parents Occupation and Income
Analysing the beneficiary data by type of colleges they are studying, it is noted from Table
4.21 and Graph-4.5 that largest chunk (63.2%) of the beneficiaries are studying in private
unaided colleges. If autonomous and deemed universities are added to this, then over 65% of
beneficiaries hail from private colleges. Those studying in government colleges constitute only
a meagre 15.2%. This may be an obvious trend considering the fact that higher education is
predominantly offered by the private sector in the state. Further, the selection and choice of the
college type is also determined by the CET rank position of the student.
On a quick perusal of the list of beneficiaries from Belagavi division, it is interesting to note
that some of the beneficiaries have secured higher rank positions in the CET merit list, through
which they have been able to secure seats in prestigious private engineering colleges like
RVCE, PES, Ramaiah, BMS etc., in Bengaluru. Although, the Arivu scheme takes care of
their tuition fees in such colleges, the question about their living and maintenance expenses in
a big city like Bengaluru is a question worth considering.
Table 4.21 Beneficiaries by Type of College
Type of college/university No. of beneficiaries Percent
Autonomous 22 1.95
Deemed Universities 6 0.53
Government 172 15.22
Private Aided 191 16.90
Private unaided 714 63.19
Others 24 2.12
NR 1 0.09
Total 1130 100
Source: Field Survey
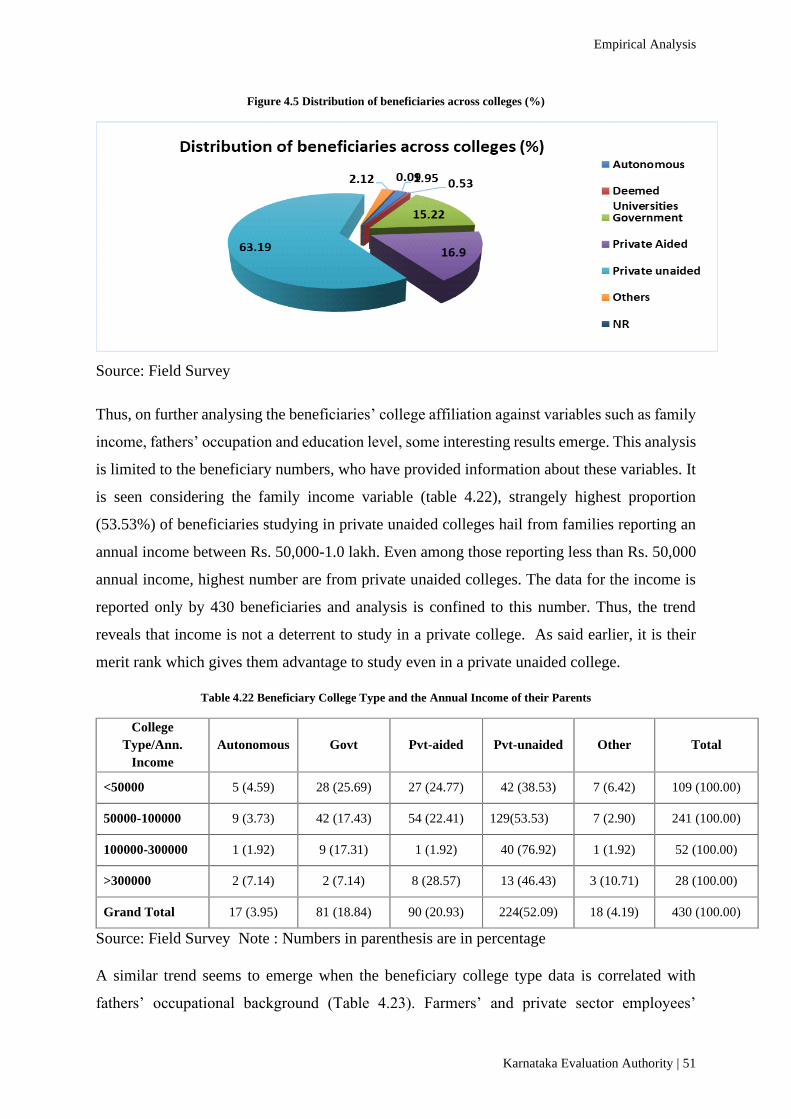
Empirical Analysis
Karnataka Evaluation Authority | 51
Figure 4.5 Distribution of beneficiaries across colleges (%)
Source: Field Survey
Thus, on further analysing the beneficiaries’ college affiliation against variables such as family
income, fathers’ occupation and education level, some interesting results emerge. This analysis
is limited to the beneficiary numbers, who have provided information about these variables. It
is seen considering the family income variable (table 4.22), strangely highest proportion
(53.53%) of beneficiaries studying in private unaided colleges hail from families reporting an
annual income between Rs. 50,000-1.0 lakh. Even among those reporting less than Rs. 50,000
annual income, highest number are from private unaided colleges. The data for the income is
reported only by 430 beneficiaries and analysis is confined to this number. Thus, the trend
reveals that income is not a deterrent to study in a private college. As said earlier, it is their
merit rank which gives them advantage to study even in a private unaided college.
Table 4.22 Beneficiary College Type and the Annual Income of their Parents
College
Type/Ann.
Income
Autonomous Govt Pvt-aided Pvt-unaided Other Total
<50000 5 (4.59) 28 (25.69) 27 (24.77) 42 (38.53) 7 (6.42) 109 (100.00)
50000-100000 9 (3.73) 42 (17.43) 54 (22.41) 129(53.53) 7 (2.90) 241 (100.00)
100000-300000 1 (1.92) 9 (17.31) 1 (1.92) 40 (76.92) 1 (1.92) 52 (100.00)
>300000 2 (7.14) 2 (7.14) 8 (28.57) 13 (46.43) 3 (10.71) 28 (100.00)
Grand Total 17 (3.95) 81 (18.84) 90 (20.93) 224(52.09) 18 (4.19) 430 (100.00)
Source: Field Survey Note : Numbers in parenthesis are in percentage
A similar trend seems to emerge when the beneficiary college type data is correlated with
fathers’ occupational background (Table 4.23). Farmers’ and private sector employees’

Evaluation of the Arivu Educational Loan Scheme Implemented by D Devaraj Urs Backward Classes
Development Corporation in Karnataka State (2011-12 To 2017-18)
52| Karnataka Evaluation Authority
children are likely to study more in private unaided colleges rather than in government or
government aided colleges.
Table 4.23 Beneficiary by College Type and Parents Occupation
College Type/ Occupational
background Autonomous Govt Pvt-aided
Pvt-
unaided Other Total
Farmer/ agriculturist 7 (5.47) 24(18.75) 25(19.53) 64 (50.00) 8 (6.25) 128 (100.00)
Artisan [non-farming] (0.00) (0.00) 1 (25.00) 3 (75.00) (0.00) 4 (100.00)
Business 3 (8.57) 9 (25.71) 2 (5.71) 17 (48.57) 4 (11.43) 35 (100.00)
Govt. service/employee 2 (10.00) 1 (5.00) 6 (30.00) 11 (55.00) (0.00) 20 (100.00)
Private 3 (2.13) 28(19.86) 28(19.86) 81 (57.45) 1 (0.71) 141 (100.00)
Trade/petty shop (0.00) (0.00) 2 (50.00) 1 (25.00) 1 (25.00) 4 (100.00)
Not working (0.00) 7 (17.07) 10(24.39) 23 (56.10) 1 (2.44) 41 (100.00)
other 2 (3.51) 12(21.05) 16(28.07) 24 (42.11) 3 (5.26) 57 (100.00)
Grand Total 17 (3.95) 81(18.84) 90(20.93) 224(52.09) 18 (4.19) 430 (100.00)
Source: Field Survey Note : Numbers in parenthesis are in percentage
However, quite interestingly, it is the Fathers’ educational level which seems to determine the
type of college their wards choose for pursuing higher education (Table 4.24 and Graph-4.6).
The higher the level of fathers’ education, greater likelihood of studying in private unaided
colleges.
Table 4.24 Beneficiary by College Type and Parents educational level
College Type
Education
background
Deemed /
Autonomous Government Pvt -aided Pvt-unaided Other Total
Illiterate (0.00) 3 (30.00) 2 (20.00) 5 (50.00) (0.00) 10 (100.00)
Primary 4 (5.00) 18 (22.50) 8 (10.00) 44 (55.00) 6 (7.50) 80 (100.00)
SSLC 5 (5.75) 14 (16.09) 14 (16.09) 49 (56.32) 5 (5.75) 87 (100.00)
Above SSLC/
below degree 5 (7.69) 7 (10.77) 16 (24.62) 35 (53.85) 2 (3.08) 65 (100.00)
degree & above 3 (1.23) 37 (15.16) 51 (20.90) 147 (60.25) 6 (2.46) 244 100.00)
Grand Total 17
(3.50)
79
(16.26)
91
(18.72)
280
(57.61)
19
(3.91) 486 (100.00)
Source: Field Survey Note : Numbers in parenthesis are in percentage
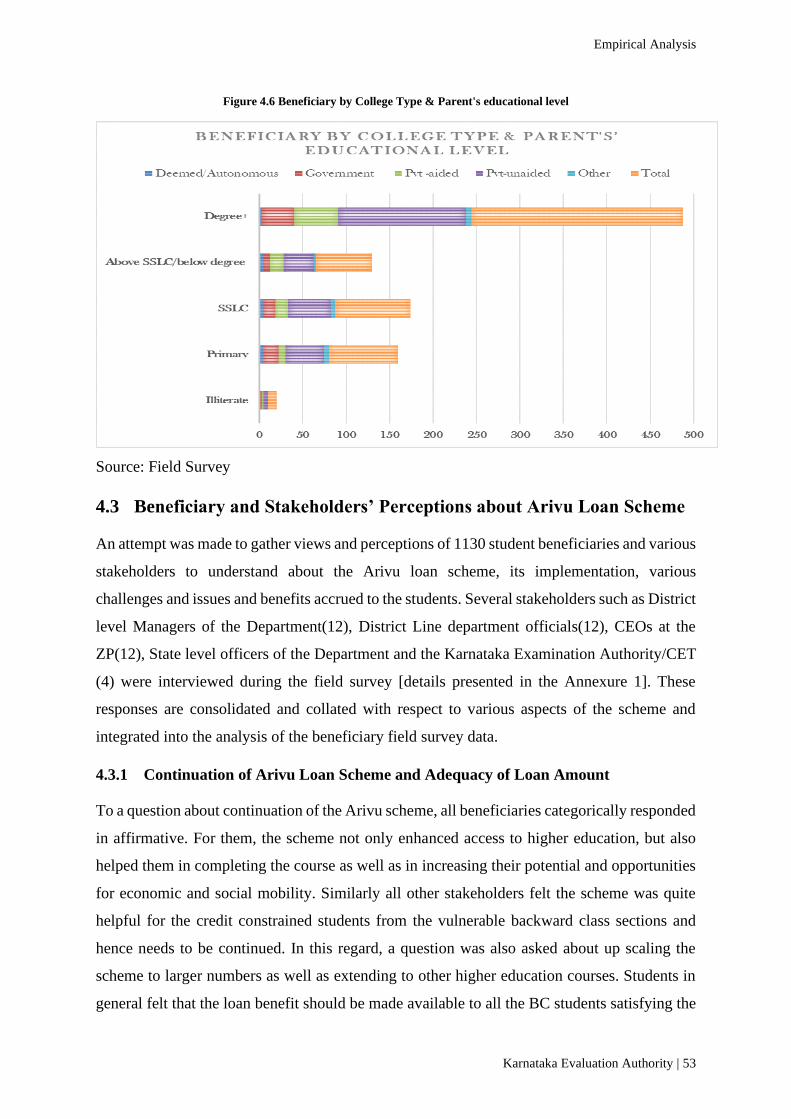
Empirical Analysis
Karnataka Evaluation Authority | 53
Figure 4.6 Beneficiary by College Type & Parent's educational level
Source: Field Survey
4.3 Beneficiary and Stakeholders’ Perceptions about Arivu Loan Scheme
An attempt was made to gather views and perceptions of 1130 student beneficiaries and various
stakeholders to understand about the Arivu loan scheme, its implementation, various
challenges and issues and benefits accrued to the students. Several stakeholders such as District
level Managers of the Department(12), District Line department officials(12), CEOs at the
ZP(12), State level officers of the Department and the Karnataka Examination Authority/CET
(4) were interviewed during the field survey [details presented in the Annexure 1]. These
responses are consolidated and collated with respect to various aspects of the scheme and
integrated into the analysis of the beneficiary field survey data.
4.3.1 Continuation of Arivu Loan Scheme and Adequacy of Loan Amount
To a question about continuation of the Arivu scheme, all beneficiaries categorically responded
in affirmative. For them, the scheme not only enhanced access to higher education, but also
helped them in completing the course as well as in increasing their potential and opportunities
for economic and social mobility. Similarly all other stakeholders felt the scheme was quite
helpful for the credit constrained students from the vulnerable backward class sections and
hence needs to be continued. In this regard, a question was also asked about up scaling the
scheme to larger numbers as well as extending to other higher education courses. Students in
general felt that the loan benefit should be made available to all the BC students satisfying the
Evaluation of the Arivu Educational Loan Scheme Implemented by D Devaraj Urs Backward Classes
Development Corporation in Karnataka State (2011-12 To 2017-18)
54| Karnataka Evaluation Authority
eligibility criteria. The college authorities opined that extending the scheme to other courses
currently not covered will boost up enrolment of backward class students in higher education.
The officials at the state level also felt the scheme may be extended to students from other
courses.
To another question regarding adequacy of the loan amount provided currently under the
scheme, many students were of the view that loan amount was not sufficient as they incurred
many other study related expenses during the course of study. The department officials, on the
other hand felt the loan amount could be increased for only medical students considering the
heavy expenses incurred by them. The officials both at the district and the state level were of
the view that the sanctioned budget was insufficient and they experienced budgetary constraints
while making allocations to the districts.
4.3.2 Benefit and Utility of the Scheme
As already mentioned, while all student beneficiaries wanted the scheme to be continued, they
further reiterated that the scheme is very essential and useful to them as many of them were not
in a position to raise loans from Banks owing to financial hardships. In view of this the scheme
was most useful in reducing financial burden of the family in terms of paying th e required
college fee. This view was further corroborated by college principals, district level and state
level officials. Beneficiaries also reported that it helps them to complete their courses without
any interruptions. Some of them also felt that it boosted their morale and self-confidence and
paved way for smooth absorption into the job market through on-campus selection.
4.3.3 Non-Economic Benefits of Arivu Loan
Although, the major dimension of the programme is economic support and assistance to poor
students, there are other non-economic benefits that may accrue to students in the process. The
very fact that there is temporary relief for the financial hardship because of a loan intervention
itself may generate positive feelings among the beneficiaries. Some of the implicit benefits are:
increase in their confidence and comfort levels because of timely financial assistance, enhanced
motivation to participate in academic activities and continue studies uninterruptedly, reduced
economic burden. In this context, the beneficiaries were asked to respond to certain key
questions on a five-point scale of agreement. Analysing the responses to the questions in this
direction, it is interesting to note that indeed some benefits have accrued to the beneficiaries in
terms of certain positive influences (Table 4.25). More than anything, the loan has provided
them a ‘temporary reprieve from the financial hardships’ and ‘increased their levels of

Empirical Analysis
Karnataka Evaluation Authority | 55
‘confidence and self- esteem’ as more than 96.0 per cent of the beneficiaries have responded
both in agreement and strong agreement. Similarly, ‘enhanced motivation to complete the
course’ (over 88.0 per cent) ‘campus placement’ (over 70.0 per cent) have also emerged as
other accrued benefits as per responses to agree and strongly agree statements. However, it
may be noted that the ‘undecided’ beneficiaries constitute more than 18.0 per cent and 10.0
percent respectively for the latter and former aspect.
Table 4.25 Beneficiary perceptions about the benefit of Arivu programme
Perceptions Strongly
Agree Agree Neutral Disagree
Strongly
Disagree
Grand
Total
Temporary
reprieve from
financial hardship
409 (36.2) 678 (60.0) 31 (2.7) 8 (0.7) 2 (0.2) 1130 (100)
Increased
confidence and
self-esteem levels
381 (33.7) 714 63.20) 27 (2.4) 6 (0.5) 1 (0.1) 1130 (100)
Enhanced
motivation to
complete the
course
293 (25.9) 696 (61.6) 115(10.2) 24 (2.1) 2 (0.2) 1130 (100)
Campus
placement 157 (13.9) 638 (56.5) 210 18.6) 124 (11.0) 1 (0.1) 1130 (100)
Source: Field Survey Note : Numbers in parenthesis are in percentage
4.3.4 Utilisation of Arivu Education Loan
It is interesting to know how Arivu loan is utilised, for what purpose and to what extent
beneficiaries are satisfied with the loan received. Analysis of data in this regard yielded the
following results (table 4.26).
Table 4.26 Utilisation of Arivu Loan by beneficiaries
Districts Exclusively
for education
Education
of other
family
members
Personal No
information Others All
Bagalkot 68 (87.2) 6 (7.7) 4 (5.1) 78 (100)
Bengaluru
Urban 223 (91.0) 21 (8.6) 1 (0.4) 245 (100)
Belagavi 182 (96.3) 6 (3.2) 1 (0.5) 189 (100)
Bellary 49 (96.0) - 1 (2.0) 1 (2.0) 51 (100)
Bidar 65 (100.0) 65 (100)
Kalaburgi 109 (99.1) 1 (0.9) 110 (100)
Hassan 67 (100.0) 67 (100)
Kodagu 6 (33.3) 12 (66.7) 18 (100)

Evaluation of the Arivu Educational Loan Scheme Implemented by D Devaraj Urs Backward Classes
Development Corporation in Karnataka State (2011-12 To 2017-18)
56| Karnataka Evaluation Authority
Kolar 24 (96.0) 1 (4.0) 25 (100)
Mysore 158 (98.8) 2 (1.3) 160 (100)
Shivamogga 79 (97.5) 1 (1.2) 1 (1.2) 81 (100)
Uttar
Kannada 38 (92.7) 1 (2.4) 2 (4.9) 41 (100)
Grand Total 1068 (94.5) 37 (3.3) 2 (0.2) 6 (0.5) 17 (1.5) 1130 (100)
Source: Field Survey Note : Numbers in parenthesis are in percentage
Overall, an overwhelming majority (94.51%) of the beneficiaries have utilised the loan amount
for educational purpose. There are however, another 5.0 per cent of the beneficiaries who have
reported that it is used for other course related expenses. There are two beneficiaries who seem
to have used the loan amount for meeting their personal expenses, perhaps towards transport
charges. It may be noted that the first year loan amount is released directly to the college to
meet tuition and college fees. However, subsequently, the amount is released to student’s bank
account. Even the data analysed from the FGDs reveals that highest proportion of beneficiaries
report about the Arivu loan benefit in completing the course as well as in providing financial
stability. Considerable number also report about helpfulness of the scheme in getting admission
in good college as well as enabling them to pursue higher education. This seems an added
advantage for BC students.
4.3.5 Release of Loan: Mode of Payment, Timeliness
An attempt is made to find out the mode of payment of loan to the beneficiaries and timeliness
with which it reaches them. For this analysis, perceptions and views expressed by sample
respondents during field survey have been used. As reported by the beneficiaries as well as
stakeholders, the loan is released in instalment and payment mode is done both by check and
on-line. Further, more number of beneficiaries across districts reported about receiving the
loan in one instalment. The second and third instalments are released as beneficiaries’ progress
towards course completion. To a question relating to mode of loan payment, most beneficiaries
have reported that it is either through cheque or on-line. While the former mode is being used
in case on Non-CET beneficiaries, the latter is being employed in making loan payment to CET
student beneficiaries.

Empirical Analysis
Karnataka Evaluation Authority | 57
Table 4.27 Loan Instalments
District No. of Instalments
Total One Two Three
Bengaluru Urban 4 2 2 8
Kolar 2 4 2 8
Shivamogga 2 3 3 8
Belagavi 4 3 7
Bagalkote 4 2 6
Uttara Kannada 3 3 2 8
Bellary 5 2 7
Bidar 5 2 7
Kalaburgi 3 3 2 8
Hassan 3 2 2 8
Kodagu 4 5 9
Mysore 5 2 3 10
TOTAL 44 33 16 93
Source: Field Survey
4.3.6 Timeliness of Loan Release
It is important that the education loan has to reach on time so that students are not put to any
kind of difficulties, especially when they belong to the most vulnerable groups. The analysis
relating to timely release of loan has been done using the primary survey data gathered from
1130 Arivu beneficiaries. To a question relating in this regard, as seen from Table 4.28 overall,
large majority have reported in affirmative (87.3%). However, interestingly an unacceptably
high proportion (48%) of beneficiaries from Kolar district report in negative. This is a matter
of serious concern. On further analysing the data gathered from FGD/IDI, it transpired that
some of the CET and non-CET college authorities and student beneficiaries expressed the view
that loan was not given on time. The college authorities in particular were of the view that as
the colleges usually start during July- August period, if the loan is sanctioned by September
that will be more appropriate and beneficial.

Evaluation of the Arivu Educational Loan Scheme Implemented by D Devaraj Urs Backward Classes
Development Corporation in Karnataka State (2011-12 To 2017-18)
58| Karnataka Evaluation Authority
Table 4.28 Releasing of Loan on Time
Districts Released on time Did not release on
time No info Grand Total
Bagalkot 68 (87.2) 9 (11.5) 1 (1.3) 78 (100.0)
Bengaluru
Urban 241 (98.4) 4 (1.6) 245 (100)
Belagavi 163 (86.2) 26 (13.8) 189 (100)
Bellary 45 (88.2) 6 (11.8) 51 (100)
Bidar 52 (80.0) 13 (20.0) 65 (100)
Kalaburgi 93 (84.6) 16 (14.6) 1 (0.9) 110 (100)
Hassan 62 (92.5) 5 (7.5) 67 (100)
Kodagu 15 (83.3) 3 (16.7) 18 (100)
Kolar 13 (52.0) 12 (48.0) 25 (100)
Mysore 126 (78.8) 34 (21.3) 160 (100)
Shivamogga 72 (88.9) 8 (9.9) 1 (1.2) 81 (100)
Uttar
Kannada 36 (87.8) 4 (9.8) 1 (2.4) 41 (100)
Grand Total 986 (87.3) 140 (12.4) 4 (0.4) 1130 (100)
Source: Field Survey Note : Numbers in parenthesis are in percentage
4.4 Effectiveness of Arivu Scheme Implementation
Effectiveness of Arivu scheme implementation is assessed through beneficiary perceptions.
However, before that a brief report about the way programme is implemented is presented
herein as reported by the department authorities. Every year action plan is prepared by
DUBCDC during April-May. Based on the OBC population, Central office will fix the physical
and financial targets to the districts in the ratio of 70 and 30 percent criteria. This will be placed
before the advisory committee, which will decide the loan sanction. As per the roaster and the
scheme guidelines, based on CET ranking candidate is identified. According to the Manager
of the District office, first Annual action plan will be prepared, then notification will be issued
for receiving application. These applications will be verified for eligibility criteria and other
conditions of fulfilment by the district office and sanctions of Arivu loan will be released.
For CET central server based online applications will be notified during July, August, and
September (since 2016-17). For ARIVU education loan, the Corporation invites applications
every year from eligible candidates. Corporation sorts out the applications based on criteria
Empirical Analysis
Karnataka Evaluation Authority | 59
(eligibility) under different categories; and a list is prepared and the same is sent to KEA / CET.
KEA verifies the list and if the listed candidates have cleared the KEA entrance exams, and
based on the individual ranking of the student and allotment to different colleges, ARIVU loan
will be sanctioned as per the required amount. KEA also invites applications from students
who are in 2nd Year PUC (Science) every year, and also from other candidates for different
courses. After PUC / CET exams, if the candidates are eligible and ranked, seats will be allotted
accordingly for professional courses. List of selected candidates for other courses shall also be
prepared based on the rankings. The list of selected candidates sent by D Urs Corporation will
be verified, and whoever comes under ranking, ARIVU loan will be sanctioned.
After CET ranking, the candidates’ sanction letter will go to the respective allotted colleges as
well as to the students. This letter enables the students and the colleges to complete the
admission processes. The students need not have to pay the admission fees to the college at the
time of admission. After admission, the joining letter with fees structure and other required
documents will come to KEA. This makes clear that the student has accepted the course and
the college and college has admitted him/her. Then KEA start the process of remitting the
admission fees (government fees) for first semester / year directly to the college online, and
this may take a maximum of three months. For the subsequent semesters / years, D Urs
Corporation releases the loan amount directly to the students. For CET courses, applications
are invited on-line every year. The on-line received applications are scrutinized and stratified
based on categories and courses for each district. Keeping the budgeted cap for each district, a
list of eligible candidates is prepared for each district, and the same is sent to each district for
further verifications. The verified lists from all the districts will come back to corporation, and
the same is forwarded to CET/ KEA for sanction and releasing of first semester / year loan
amount to the respective colleges.
For non-CET, applications are invited off-line by the corporation (also by the district office)
and the applications will come to district manager’s office at the district level. DM office
scrutinize and verify the applications for necessary documents and stratify the applications—
category-wise and course-wise; the selected applications (based on the cap by the
corporation—budget for each district) will be submitted to the selection committee headed by
CEO. Generally, CEO with the committee members approves the list. The DM office submit
the CEO approved list with all the documents of all the selected candidates to the corporation.

Evaluation of the Arivu Educational Loan Scheme Implemented by D Devaraj Urs Backward Classes
Development Corporation in Karnataka State (2011-12 To 2017-18)
60| Karnataka Evaluation Authority
The corporation approves the list and loan is directly sanctioned to the selected candidates, and
the loan amount is credited to the candidate’s account through RTGS.
4.4.1 Beneficiary Selection Procedure: Problems and Issues
It appears that there are certain bottlenecks in the procedure followed for scheme
implementation. It transpired during interviews that beneficiary selection process is quite a
complicated process as it entails verification of the documents submitted by the beneficiaries
to check for authenticity of the same. This is a time-consuming process. It is noticed that in the
context of spiralling demand for higher education, the department receives excess application
and distributing the same category-wise is quite a ticklish issue because of less budgetary
provisions. Besides the physical target has to be decided as per the concerned district
requirement. Many a times beneficiaries fail to produce required security deposit papers, which
poses problem for obtaining approval from the selection committee.
4.4.2 Beneficiary Perceptions about Scheme Implementation: Easy Accessibility
What kinds of views and perceptions stakeholders have about the Arivu programme in terms
of the way it is being implemented, serving the purpose, timeliness in its reach, accessibility
are all important aspects while assessing the effectiveness of the programme. Besides, their
views on problems and difficulty experienced are also important from the point of
understanding how the programme has performed and served the clientele. Beneficiaries were
asked about various aspects of Scheme Implementation. To a question relating to easy
accessibility to programme information, it is gratifying to note from Table-4.29 that overall a
large majority (82.0) have reported that the programme was easily accessible. Across districts,
more or less the same picture emerges. However, Bellary and Kolar districts reveal higher
proportion of beneficiaries reporting in negative that is not easily accessible. In fact, Bellary
district reveals far higher proportion (82.0%) of beneficiaries reporting that the programme was
not easily accessible.
Table 4.29 Easy Accessibility to the Loan by the beneficiaries
Districts Yes No Total
Bagalkot 76 (97.4) 2 (2.6) 78 (100)
Bengaluru Urban 239 (97.6) 6 (2.4) 245 (100)
Belagavi 117 (61.9) 72 (38.1) 189 (100)
Bellary 9 (17.7) 42 (82.4) 51 (100)
Bidar 59 (90.8) 6 (9.2) 65 (100)

Empirical Analysis
Karnataka Evaluation Authority | 61
Kalaburgi 104 (94.6) 6 (5.5) 110 (100)
Hassan 67 (100) 0 67 (100)
Kodagu 17 (94.4) 1 (5.6) 18 (100)
Kolar 12 (48.0) 13 (52.0) 25 (100)
Mysore 139 (86.9) 21 (13.1) 160 (100)
Shivamogga 50 (61.7) 31 (38.3) 81 (100)
Uttar Kannada 37 (90.2) 4 (9.8) 41 (100)
Grand Total 926 (82.0) 204 (18.1) 1130 (100)
Source: Field Survey Note: Numbers in parenthesis are in percentage
4.4.3 Beneficiary Perceptions about Procedural Requirements
The department has laid down procedural guidelines to be followed by students for obtaining
Arivu loan. Accordingly, application forms are filled by the candidates, attaching all the
required documents, and submitted to the corporation. Students have to submit the quotation
from the college after getting admission to the course. Quotation includes college fee structure
and other education related expenditure like books, stationary etc. Based on the quotation, loan
is sanctioned. College admission receipt with fees paid receipt will have to be enclosed. While
it is necessary to ensure that all norms and conditions are adhered to while releasing the loan
to the students, at the same time the procedures in place should not intimidate or create hurdles
for the students. Many a times government programme norms are unduly stringent only to
ensure no conditions are compromised or the authority and power abused. Lax implementation
mechanisms may create unnecessary burden for the student in terms of investment of time,
money and effort in fulfilling the requirements. In this context beneficiaries were asked about
their views on the most difficult procedural requirement to be adhered to while submitting
application (Table 4.30). Most importantly, five elements have emerged from their responses.
They are, procuring application, filling application, submitting documents, providing affidavit,
providing surety. Overall, highest proportion (44.3%) report about ‘providing surety’ as the
most difficult aspect. In order of difficulty level, ‘providing affidavit’ (32.5%), ‘submitting
different documents’ (28.4%), ‘procuring application’ (21.7) and ‘filling application’ (10.7%)
are reported.

Evaluation of the Arivu Educational Loan Scheme Implemented by D Devaraj Urs Backward Classes
Development Corporation in Karnataka State (2011-12 To 2017-18)
62| Karnataka Evaluation Authority
Table 4.30 Beneficiaries views on Difficult Procedural Tasks
District Procuring
application
Filling
application
Submitting
documents
Giving
affidavit
Giving_
surety others
Bagalkot 44 (18.) 8 7 20 65 2
Bengaluru
Urban 29 39 (32.2) 166 (51.7) 25 29 1
Belagavi 96 (39.2) 55 (45.5) 55 (17.1) 89 (24.3) 116 (23.2) 10
Bellary 1 2 24 29 19
Bidar 40 (16.3) 2 5 15 40 (8.0)
Kalaburgi 10 6 26 95 (25.9) 79 (15.8)
Hassan 3 3 9 15 29 23
Kodagu 1 8 9
Kolar 10 1 2 3 10
Mysore 3 1 5 9 42 (8.4) 46
Shivamogga 2 3 10 60 (16.3) 62 (12.4) 10
Uttara
Kannada 7 1 13 8 9 17
Grand Total 245 (21.7) 121 (10.7) 321 (28.4) 367 (32.5) 501 (44.3) 128
Source: Field Survey Note: Numbers in parenthesis are in percentage
Across districts in the region, ‘providing surety’ emerges as the most difficult task as highest
number of beneficiaries have viewed. In fact, for many students, getting witnesses from people
of the surrounding area is quite a challenging task. Even department officials concurred that
obtaining affidavits and surety from the beneficiaries indeed was a challenging exercise as it
not only demanded proper verification to ensure authenticity but also many times consumed
more time during the process. A couple of beneficiaries also reported about paying money to
the proposed witness in order to procure surety. In this regard, during the interaction with the
stakeholders, a suggestion was made to obtain witness from one’s own family. For Bengaluru
Urban district ‘submitting documents’ emerged as the most difficult task. Similarly providing
affidavit has emerged as the most difficult task for Belagavi, Bellary, Kalaburgi, and
Shivamogga districts. For Belagavi, Bidar and Kolar, procuring application itself is a
challenging task in addition to other procedural tasks as reported by beneficiaries. An attempt
was also made to find out difficulties faced by rural students in regard to some of the procedural
requirements (Table-4.31).

Empirical Analysis
Karnataka Evaluation Authority | 63
Table 4.31 Difficult Procedural Tasks faced by Rural Students
District Procuring
Application
Filling
application
Submitting
documents
Giving
affidavit
Giving
surety others Total
Bagalkot 23 (31.9) 3 (4.2) 4 (5.6) 10 (13.9) 32 (44.4) 72 (100)
Bengaluru Urban 1 (12.5) 4 (50.0) 2 (25.0) 1 (12.5) 8 (100)
Belagavi 44 (22.8) 21 (10.9) 23 (11.9) 43 (22.3) 58 (30.1) 4 (2.1) 193(100)
Bellary 1 (1.6) 2 (3.3) 19 (31.2) 23 (37.7) 16 (26.2) 61 (100)
Bidar 22 (38.6) 3 (5.3) 8 (14.0) 24 (42.1) 57 (100)
Kalaburgi 9 (7.6) 2 (1.7) 15 (12.6) 50 (42.0) 43 (36.1) 119(100)
Hassan 3 (6.0) 1 (2.0) 8 (16.0) 10 (20.0) 15 (30.0) 13(26.0) 50 (100)
Kodagu 5 (50.0) 5 (50.0) 10 (100)
Kolar 9 (45.0) 2 (10.0) 1 (5.0) 8 (40.0) 20 (100)
Mysore 1 (2.3) 1 (2.3) 1 (2.3) 2 (4.7) 21 (48.8) 17(39.5) 43 (100)
Shivamogga 1 (1.3) 1 (1.3) 7 (8.8) 29 (36.3) 33 (41.3) 9 (11.3) 80 (100)
Uttara Kannada 3 (8.3) 6 (16.7) 5 (13.9) 7 (19.4) 15(41.7) 36 (100)
Grand Total 117 (15.6) 31 (4.1) 90 (12.0) 184(24.6) 256 (34.2) 71 (9.5) 749(100)
Source: Field Survey Note: Numbers in parenthesis are in percentage
Even here, giving surety and giving affidavits emerged as the most difficult tasks. Even
procuring application is also seen as the difficult task considering the highest number of
beneficiaries reporting about this. For most districts, besides these, even procuring application
and filling application are most difficult.
The introductions of digital software systems in most of the departments under the state
government have enabled hassle-free service to the clienteles seeking help and support from
the government. In line with this, the backward class department corporation has also
introduced on-line application procedure for accessing the education loan. In this context,
beneficiaries were asked about the convenience and friendliness of the procedure under the
Arivu programme (Table 4.32). In specific, to a question on convenience in filling up the online
application, overall highest majority have reported in affirmative.

Evaluation of the Arivu Educational Loan Scheme Implemented by D Devaraj Urs Backward Classes
Development Corporation in Karnataka State (2011-12 To 2017-18)
64| Karnataka Evaluation Authority
Table 4.32 Convenience in filling of online application
Districts Convenient Not convenient Total
Bagalkot 75 (96.2) 3 (3.9) 78 (100)
Bengaluru Urban 239 (97.6) 6 (2.5) 245 (100)
Belagavi 183 (96.8) 6 (3.2) 189 (100)
Bellary 37 (72.6) 14 (27.5) 51 (100)
Bidar 63 (96.9) 2 (3.1) 65 (100)
Kalaburgi 108 (98.2) 2 (1.8) 110 (100)
Hassan 66 (98.5) 1 (1.5) 67 (100)
Kodagu 16 (88.9) 2 (11.1) 18 (100)
Kolar 24 (96.0) 1 (4.0) 25 (100)
Mysore 151 (94.4) 9 (5.6) 160 (100)
Shivamogga 60 (74.1) 21 (25.9) 81 (100)
Uttara Kannada 40 (97.6) 1 (2.4) 41 (100)
Grand Total 1062 (94.0) 68 (6.0) 1130 (100)
Source: Field Survey Note : Numbers in parenthesis are in percentage
4.5 Arivu Education Loan Impact on Educational Outcomes
Being a non- experimental study, measuring actual impact of the Arivu programme on
educational outcomes exclusively for the BC students is a daunting task as it demands baseline
and terminal datasets at disaggregate levels with respect to access, enrolment, attendance,
course completion, reduction in dropout and finally employment and economic mobility. In the
absence of these datasets in the required format at disaggregated levels, alternative
symptomatic numerical data have to be considered for this analysis. Thus, outcome indicators
such as course completion, dropout, employment-unemployment status, wages etc., have been
examined to assess the impact on outcomes.
4.5.1 Arivu Impact on Course Completion Ratio
It is noted from Table-4.33 that out of the 1130 students who participated in the survey, an
overall 51.4 per cent of them are still studying and 46.5 per cent have completed the course.
The proportion of latter, although is not equal to the former, yet the fact it is as high as 46.5 per
cent can be seen as an encouraging feature, suggestive of positive impact of the Arivu
programme on course completion.
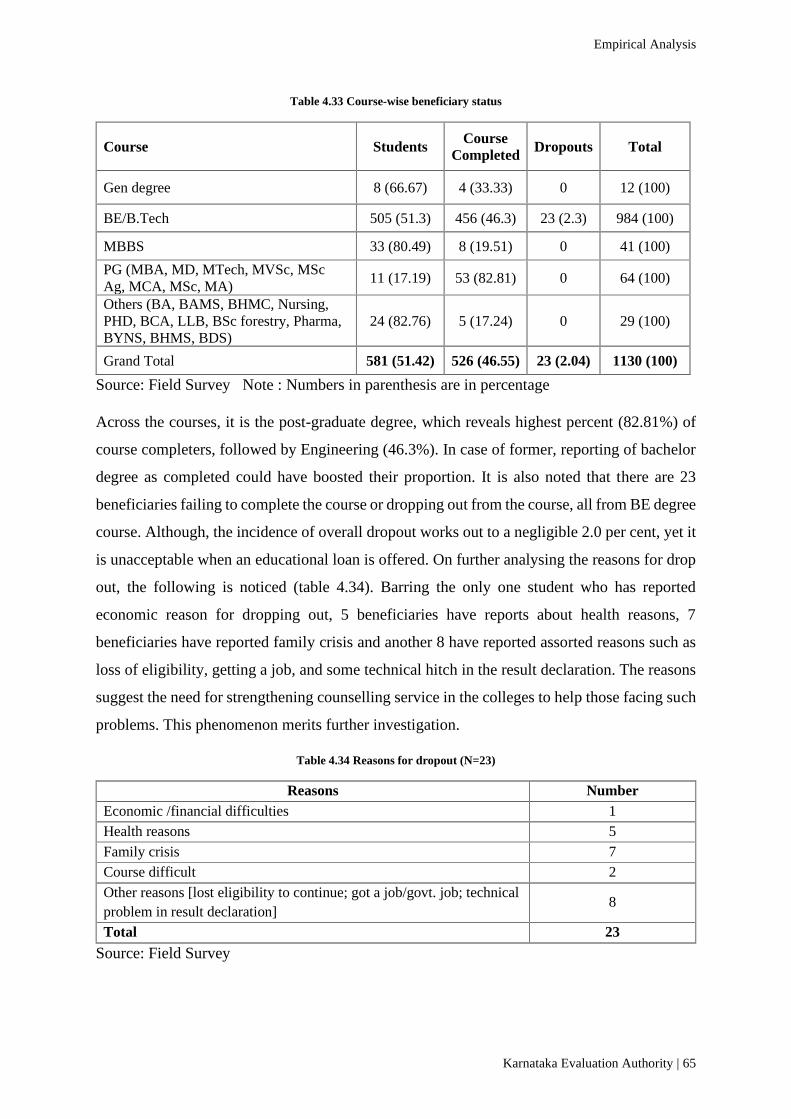
Empirical Analysis
Karnataka Evaluation Authority | 65
Table 4.33 Course-wise beneficiary status
Course Students Course
Completed Dropouts Total
Gen degree 8 (66.67) 4 (33.33) 0 12 (100)
BE/B.Tech 505 (51.3) 456 (46.3) 23 (2.3) 984 (100)
MBBS 33 (80.49) 8 (19.51) 0 41 (100)
PG (MBA, MD, MTech, MVSc, MSc
Ag, MCA, MSc, MA) 11 (17.19) 53 (82.81) 0 64 (100)
Others (BA, BAMS, BHMC, Nursing,
PHD, BCA, LLB, BSc forestry, Pharma,
BYNS, BHMS, BDS)
24 (82.76) 5 (17.24) 0 29 (100)
Grand Total 581 (51.42) 526 (46.55) 23 (2.04) 1130 (100)
Source: Field Survey Note : Numbers in parenthesis are in percentage
Across the courses, it is the post-graduate degree, which reveals highest percent (82.81%) of
course completers, followed by Engineering (46.3%). In case of former, reporting of bachelor
degree as completed could have boosted their proportion. It is also noted that there are 23
beneficiaries failing to complete the course or dropping out from the course, all from BE degree
course. Although, the incidence of overall dropout works out to a negligible 2.0 per cent, yet it
is unacceptable when an educational loan is offered. On further analysing the reasons for drop
out, the following is noticed (table 4.34). Barring the only one student who has reported
economic reason for dropping out, 5 beneficiaries have reports about health reasons, 7
beneficiaries have reported family crisis and another 8 have reported assorted reasons such as
loss of eligibility, getting a job, and some technical hitch in the result declaration. The reasons
suggest the need for strengthening counselling service in the colleges to help those facing such
problems. This phenomenon merits further investigation.
Table 4.34 Reasons for dropout (N=23)
Reasons Number
Economic /financial difficulties 1
Health reasons 5
Family crisis 7
Course difficult 2
Other reasons [lost eligibility to continue; got a job/govt. job; technical
problem in result declaration] 8
Total 23
Source: Field Survey
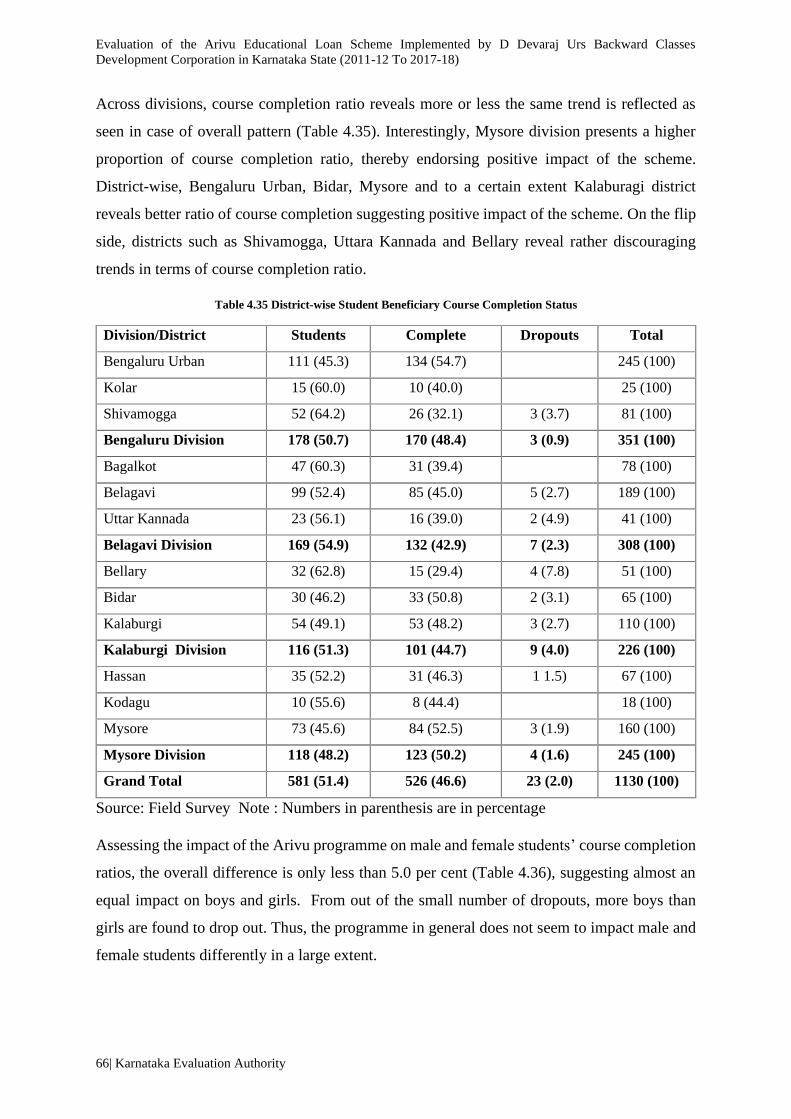
Evaluation of the Arivu Educational Loan Scheme Implemented by D Devaraj Urs Backward Classes
Development Corporation in Karnataka State (2011-12 To 2017-18)
66| Karnataka Evaluation Authority
Across divisions, course completion ratio reveals more or less the same trend is reflected as
seen in case of overall pattern (Table 4.35). Interestingly, Mysore division presents a higher
proportion of course completion ratio, thereby endorsing positive impact of the scheme.
District-wise, Bengaluru Urban, Bidar, Mysore and to a certain extent Kalaburagi district
reveals better ratio of course completion suggesting positive impact of the scheme. On the flip
side, districts such as Shivamogga, Uttara Kannada and Bellary reveal rather discouraging
trends in terms of course completion ratio.
Table 4.35 District-wise Student Beneficiary Course Completion Status
Division/District Students Complete Dropouts Total
Bengaluru Urban 111 (45.3) 134 (54.7) 245 (100)
Kolar 15 (60.0) 10 (40.0) 25 (100)
Shivamogga 52 (64.2) 26 (32.1) 3 (3.7) 81 (100)
Bengaluru Division 178 (50.7) 170 (48.4) 3 (0.9) 351 (100)
Bagalkot 47 (60.3) 31 (39.4) 78 (100)
Belagavi 99 (52.4) 85 (45.0) 5 (2.7) 189 (100)
Uttar Kannada 23 (56.1) 16 (39.0) 2 (4.9) 41 (100)
Belagavi Division 169 (54.9) 132 (42.9) 7 (2.3) 308 (100)
Bellary 32 (62.8) 15 (29.4) 4 (7.8) 51 (100)
Bidar 30 (46.2) 33 (50.8) 2 (3.1) 65 (100)
Kalaburgi 54 (49.1) 53 (48.2) 3 (2.7) 110 (100)
Kalaburgi Division 116 (51.3) 101 (44.7) 9 (4.0) 226 (100)
Hassan 35 (52.2) 31 (46.3) 1 1.5) 67 (100)
Kodagu 10 (55.6) 8 (44.4) 18 (100)
Mysore 73 (45.6) 84 (52.5) 3 (1.9) 160 (100)
Mysore Division 118 (48.2) 123 (50.2) 4 (1.6) 245 (100)
Grand Total 581 (51.4) 526 (46.6) 23 (2.0) 1130 (100)
Source: Field Survey Note : Numbers in parenthesis are in percentage
Assessing the impact of the Arivu programme on male and female students’ course completion
ratios, the overall difference is only less than 5.0 per cent (Table 4.36), suggesting almost an
equal impact on boys and girls. From out of the small number of dropouts, more boys than
girls are found to drop out. Thus, the programme in general does not seem to impact male and
female students differently in a large extent.

Empirical Analysis
Karnataka Evaluation Authority | 67
Table 4.36 Male- Female student beneficiary status
Gender Students Course Completed Drop outs Total
Female 236 (54.5) 189 (43.7) 8 (1.9) 433 (100)
Male 345 (49.5) 337 (48.4) 15 (2.2) 697 (100)
Total 581 (51.4) 526 (46.6) 23 (2.04) 1130 (100)
Source: Field Survey Note : Numbers in parenthesis are in percentage
However, when regional dimension is added, different patterns seems to emerge (Table 4.37).
Kolar and Kodagu districts reveal far higher positive impact on female students than male
students. While Kodagu’s performance may be attributed to the higher female ratio of the
district, the same cannot hold good for Kolar as well, considering its laggard status both in
terms of infrastructure and female educational attainment. Bengaluru urban district reveals a
better picture for girls as compared to their counterparts in other districts. While the gender
gap is observed to the extent of over 30.0 per cent in the remaining districts, districts such as
Bagalkot, Uttara Kannada, and Kalaburgi reveal striking gender disparities. Thus, the trend
suggests disparate impact of the Programme on girls, when regional dimension is added.
Table 4.37 District-wise Male-Female Course Completion Status
Districts Course completed Drop outs
Female Male Female Male
Bengaluru Division 79 (46.5) 91 (53.5) 2 (66.7) 1 (33.3)
Bengaluru Urban 63 (47.0) 71 (53.0)
Kolar 7 (70.0) 3 (30.0) 7 (70.0) 3 (30.0)
Shivamogga 9 (34.6) 17 (65.4) 2 (66.7) 1 (33.3)
Belagavi Division 35 (26.5) 97 (73.5) 2 (28.6) 5 (71.4)
Bagalkot 6 (19.4) 25 (80.7)
Belagavi 27 (31.8) 58 (68.2) 1 (20.0) 4 (80.0)
Uttara Kannada 2 (12.5) 14 (87.5) 1 (50.0) 1 (50.0)
Kalaburgi Division 28 (27.7) 73 (72.3) 4 (44.4) 5 (55.6)
Bellary 5 (33.3) 10 (66.7) 3 (75.0) 1 (25.0)
Bidar 10 (30.3) 23 (69.7) 2 (100)
Kalaburgi 13 (24.5) 40 (75.5) 1 (33.3) 2 (66.7)
Mysore Division 47 (38.2) 76 (61.8) 4 (100)
Hassan 10 (32.3) 21 (67.7) 1 (100)
Kodagu 5 (62.5) 3 (37.5)
Mysore 32 (38.10) 52 (61.90) 3 (100)
All 189 (35.93) 337 (64.07) 8 (34.78) 15 (65.22)
Source: Field Survey Note: Numbers in parenthesis are in percentage

Evaluation of the Arivu Educational Loan Scheme Implemented by D Devaraj Urs Backward Classes
Development Corporation in Karnataka State (2011-12 To 2017-18)
68| Karnataka Evaluation Authority
It would be interesting to study whether the Arivu programme impacts differently the course
completion and dropout incidence across four different BC categories (Table 4.38). Looking
at the course completion ratio as against the students for each of the category, in case of
category IIA, there is absolute positive impact with students and course completion ratio
revealing 1:1. Regretfully, this category also reveals highest proportion of dropout incidence,
with 14 out of the total 23 dropouts hailing from this category. Category IIIB reveals far lower
proportion of students completing the course as compared to students, thereby indicating
negative impact of the programme on this category.
Table 4.38 BC category –wise distribution of student beneficiary status
Beneficiary Students Course Completed Drop outs Total
Category
I 84 (52.5) 71 (44.4) 5 (3.1) 160 (100)
IIA 318 (49.0) 317 (48.8) 14 (2.2) 649 (100)
IIIA 81 (54.0) 68 (45.3) 1 (0.7) 150 (100)
IIIB 98 (57.3) 70 (40.9) 3 (1.8) 171 (100)
Total 581 (51.4) 526 (46.6) 23 (2.0) 1130 (100)
Source: Field Survey Note : Numbers in parenthesis are in percentage
4.5.2 Arivu Education Loan Impact on Employment
An attempt is made to examine the employment status of Arivu beneficiaries as an indicator of
assessing the programme’s impact. This variable is examined for male and female
beneficiaries, across regions and different courses and across four categories. This analysis is
confined to only those who have completed the course. It is observed that even some of the
dropouts have reported about their employment status. They have also been included for this
analysis. Thus, 549 beneficiaries out of the total sample of 1130 have been considered for this
analysis.
It is seen from Table 4.39 that out of the total 549 beneficiaries, 228 are employed and 319 are
unemployed. The former includes 4 dropouts as well. Thus, the overall employment –
unemployment ratio indicates that a higher proportion of beneficiaries are unemployed (58.1%)
as compared to employed (41.5%).

Empirical Analysis
Karnataka Evaluation Authority | 69
Table 4.39 Employment Status of Course Completed and Dropouts
Status of employment Course Completed Drop outs Total
Employed 224 (42.6) 4 (17.4) 228 (41.5)
Unemployed 300 (57.0) 19 (82.6) 319 (58.1)
No info 2 (0.4) 0 2 (0.4)
Total 526 (100) 23 (100) 549 (100)
Source: Field Survey Note : Numbers in parenthesis are in percentage
However, it is to be noted that the figure for unemployed could be higher as many may not be
successful in campus recruitment or have just completed the course and are waiting to be
employed. Between male and female beneficiaries, the unemployment level is 66.5 per cent
among female (Table 4.40), which is 13.0 per cent higher than that of male respondents.
Table 4.40 Employment Status: Male – Female
Gender Employed Unemployed NR Total
Female 66 (33.5) 131 (66.5) 197 (100)
Male 162 (46.0) 188 (53.4) 2 (0.6) 352 (100)
Total 228 (41.5) 319 (58.1) 2 (0.4) 549 (100)
Source: Field Survey Note : Numbers in parenthesis are in percentage
Similarly, across BC categories, Category-I reveals highest level of unemployment to the
extent of almost 62 per cent followed by Category IIIB (61.6 %) (Table 4.41).
Table 4.41 Employment Status across BC Category Beneficiaries
Category Employed Unemployed NR Total
I 28 (36.8) 47 (61.8) 1 (1.3) 76 (100)
IIA 139 (42.0) 191 (57.7) 1 (0.3) 331 (100)
IIIA 33 (47.8) 36 (52.2) 69 (100)
IIIB 28 (38.4) 45 (61.6) 73 (100)
Total 228 (41.5) 319 (58.1) 2 (0.4) 549 (100)
Source: Field Survey Note: Numbers in parenthesis are in percentage
Whether the pattern of employment-unemployment status varies for different courses is yet
another question which needs to be looked into. Barring the small number of general degree
holders (4), medical graduates (8) and others (5), it is seen from Table 4.42 that the extent of
employment is relatively higher (42.6%) among the engineering graduates as compared to the
post graduates (34.0%). However, conversely the unemployment level is higher among the

Evaluation of the Arivu Educational Loan Scheme Implemented by D Devaraj Urs Backward Classes
Development Corporation in Karnataka State (2011-12 To 2017-18)
70| Karnataka Evaluation Authority
latter as compared to the former (66.0 % as against 57%) due to the highest proportional
representation of engineering graduates in the sample coverage.
Table 4.42 Course-wise Employment Status among Beneficiaries
Course Employed Unemployed NR Total
Gen degree 1 (25.0) 3 (75.0) 4 (100)
BE/B.Tech 204 (42.6) 273 (57.0) 2 (0.4) 479 (100)
MBBS 2 (25.0) 6 (75.0) 8 (100)
PG (MBA, MD, MTech, MVSc,
MSc Ag, MCA, MSc, MA) 18 (34.0) 35 (66.0) 53 (100)
Others (BA, BAMS, BHMC,
Nursing, PHD, BCA, LLB, BSc
forestry, BPharma, BYNS, BHMS,
BDS)
3 (60.0) 2 (40.0) 5 (100)
Grand Total 228 (41.5) 319 (58.1) 2 (0.4) 549 (100)
Source: Field Survey Note: Numbers in parenthesis are in percentage
Barring the students, who have yet to earn their degrees to become eligible for employment
across regions, the employment-unemployment status among the graduates across regions, it
is noticed that the extent of unemployment is highest in the Kalaburgi Division recording 39.4
per cent (table 4.43). Conversely looking at the employment status, it is the Bengaluru division,
which reveals highest percentage of 28.5 per cent. This is followed by Mysore division with
24.5 per cent. Across districts, it is Bengaluru Urban reveals highest percentage of employment
(35.5%) followed by Mysore district (29.4%). Regretfully, Kalaburgi records highest
percentage of unemployment with 46.4 per cent followed by Belagavi, Bidar, Bellary and
Hassan all of them revealing unemployment level to more than 30.0 per cent.

Empirical Analysis
71| Karnataka Evaluation Authority
Table 4.43 Employment status across districts
Division/district Employed Unemployed NR Students
Grand
Total
Bengaluru Division 100 (28.5) 73 (20.8) 0 178 (50.7) 351 (100)
Bengaluru Urban 87 (35.5) 47 (19.2) 0 111 (45.3) 245 (100)
Kolar 5 (20.0) 5 (20.0) 0 15 (60.0) 25 (100)
Shivamogga 8 (9.9) 21 0 52 81
Belagavi Division 47 (15.3) 90 (29.2) 2 (0.7) 169 (54.9) 308 (100)
Bagalkot 12 (15.4) 19 (24.4) 0 47 (60.3) 78 (100)
Belagavi 29 (15.3) 60 (31.8) 1 (0.5) 99 (52.4) 189 (100)
Uttara Kannada 6 (14.6) 11 (26.8) 1 (2.4) 23 (56.1) 41 (100)
Kalaburgi Division 21 (9.3) 89 (39.4) 0 116 (51.3) 226 (100)
Bellary 4 (7.8) 15 (29.4) 0 32 (62.8) 51 (100)
Bidar 12 (18.5) 23 (35.4) 0 30 (46.2) 65 (100)
Kalaburgi 5 (4.6) 51 (46.4) 0 54 (49.1) 110 (100)
Mysore Division 60 (24.5) 67 (27.4) 0 118 (48.2) 245 (100)
Hassan 10 (14.9) 22 (32.8) 0 35 (52.2) 67 (100)
Kodagu 3 (16.7) 5 (27.8) 0 10 (55.6) 18 (100)
Mysore 47 (29.4) 40 (25.0) 0 73 (45.6) 160 (100)
Grand Total 228 (20.2) 319 (28.2) 2 (0.2) 581 (51.4) 1130 (100)
Source: Field Survey Note: Numbers in parenthesis are in percentage
An attempt is made to further examine the type of jobs the employed beneficiaries are currently
holding, it is seen from Table-4.44 that highest proportion of them are holding engineering jobs
as engineering graduates happen to constitute a major chunk in the study sample. The
remaining are working as tech support in BPO, clerical and associates in business enterprises
also as computer assistants and in teaching profession. This group is an amalgamation of all
kinds of graduates.
Table 4.44 Type of employment of the beneficiaries
Districts
BPO, Business, Clerical,
computer Asst.,
Teacher, Trainer
Doctor Engineer Total
Bagalkot 2 (16.7) 10 (83.3) 12 (100)
Bengaluru Urban 3 (3.5) 84 (96.6) 87 (100)
Belagavi 11 (34.4) 21 (65.6) 32 (100)
Bellary 1 (20.0) 4 (80.0) 5 (100)

Evaluation of the Arivu Educational Loan Scheme Implemented by D Devaraj Urs Backward Classes
Development Corporation in Karnataka State (2011-12 To 2017-18)
72| Karnataka Evaluation Authority
Bidar 3 (25.0) 1 (8.3) 8 (66.7) 12 (100)
Kalaburgi 4 (80.0) 1 (20.0) 5 (100)
Hassan 8 (80.0) 2 (20.0) 10 (100)
Kodagu 3 (100) 0 3 (100)
Kolar 4 (80.0) 1 (20.0) 5 (100)
Mysore 27 (57.5) 20 (42.6) 47 (100)
Shivamogga 4 (40.0) 1 (10.0) 5 (50.0) 10 (100)
Uttara Kannada 3 (50.0) 3 (50.0) 6 (100)
Grand Total 73 (31.2) 2 (0.9) 159 (68.0) 234 (100)
Source: Field Survey Note: Numbers in parenthesis are in percentage
Further looking at their job locations, it is seen from Table-4.45 that highest proportion
(56.84%) are working in Bengaluru and within Karnataka (35.9%). This trend is seen even
across region. Those working outside Karnataka is far and few (6.8%).
Table 4.45 Place of Work of the employed beneficiaries
Districts Outside
Bengaluru Outside KA
Within
Bengaluru Within KA
Grand
Total
Bagalkot 1 (8.3) 3 (25.0) 8 (66.7) 12 (100)
Bengaluru Urban 1 (1.2) 1 (1.2) 84 (96.6) 1 (1.2) 87 (100)
Belagavi 7 (21.9) 12 (37.5) 13 (40.6) 32 (100)
Bellary 5 (100) 5 (100)
Bidar 2 (16.7) 1 (8.3) 9 (75.0) 12 (100)
Kalaburgi 1 (20.0) 4 (80.0) 5 (100)
Hassan 2 (20.0) 5 (50.0) 3 (30.0) 10 (100)
Kodagu 1 (33.3) 2 (66.7) 3 (100)
Kolar 4 (80.0) 1 (20.0) 5 (100)
Mysore 1 (2.1) 15 (31.9) 31 (66.0) 47 (100)
Shivamogga 1 (10.0) 3 (30.0) 6 (60.0) 10 (100)
Uttara Kannada 5 (83.3) 1 (16.7) 6 (100)
Grand Total 1 (0.4) 16 (6.8) 133 (56.8) 84 (35.9) 234 (100)
Source: Field Survey Note: Numbers in parenthesis are in percentage
Looking at the monthly earnings of the employed beneficiaries, it is seen (Table 4.46) the
median salary falls between 15k to 25k. Close to 48.0 per cent of the beneficiaries fall in this
range. Another 20.0 per cent are in the range of 10k to 15k. Bengaluru urban and Mysore
districts reveal contradictory trends in terms of spread of high and low wage earners in the
opposite quartiles. Interestingly, districts in North Karnataka region reveals presence of

Empirical Analysis
Karnataka Evaluation Authority | 73
beneficiaries earning highest salary of 30k+ per month, although the number is very small.
Bengaluru urban job market does not seem to support high salary as not a single beneficiary is
represented in the category of 30k+ salary range.
Table 4.46 Monthly earnings of the employed beneficiaries
Districts <5k 5-10k 10-15k 15-
20k
20-
25k
25-
30k 30k + NR
Grand
Total
Bagalkot 1 1 1 3 3 3 12
Bengaluru Urban 1 4 31 32 19 87
Belagavi 3 10 5 3 8 3 32
Bellary 1 2 1 1 5
Bidar 3 1 1 4 2 1 12
Kalaburgi 1 1 1 1 1 5
Hassan 1 6 2 1 10
Kodagu 1 1 1 3
Kolar 1 1 1 1 1 5
Mysore 1 10 15 10 8 3 47
Shivamogga 1 3 3 2 1 10
Uttara Kannada 1 1 1 1 1 1 6
Grand Total 2 26 46 57 55 37 9 2 234
Source: Field Survey
There are many factors which influence one’s employment-unemployment status, such as
quality of education, merit status, job related skills, demand for jobs, nature and quality of job
training etc., Examining the incidence of securing job immediately after course completion, it
is seen (Table-4.47) that overall, those who have reported in affirmative to the question of
getting a job immediately after course completion is 68.0 per cent. Alternatively, 32.0 per cent
have answered in negative suggesting the incidence of delay. Across the districts, beneficiaries
from Bengaluru district report that there is no delay, while all the 3 beneficiaries from Kodagu
district report about experiencing delay. Relatively higher proportion of beneficiaries from
Bagalkote (75.0%), Kalaburgi (80.0%), Kolar (80.0%) and Hassan (60.0%) report about
experiencing delay.
To a follow up question, what is the extent of delay that beneficiaries experienced, it is seen
(Table-4.48) overall 6-12 months is reported by highest proportion (35.14 %). Across districts,
large majority of the districts reveal this trend. The incidence of experiencing delay to the extent

Evaluation of the Arivu Educational Loan Scheme Implemented by D Devaraj Urs Backward Classes
Development Corporation in Karnataka State (2011-12 To 2017-18)
74| Karnataka Evaluation Authority
of more than one year and two years is seen to be prevalent among beneficiaries from Belagavi,
Bidar, Kalaburgi, Hassan and Mysore districts.
Table 4.47 Beneficiaries getting job immediately after completing the course
Districts Yes No N R Grand Total
Bagalkot 3 (25.0) 9 (75.0) 12 (100)
Bengaluru Urban 87 (100) 87 (100)
Belagavi 14 (43.6) 18 (56.2) 32 (100)
Bellary 4 (80.0) 1 (20.0) 5 (100)
Bidar 7 (58.3) 5 (41.7) 12 (100)
Kalaburgi 1 (20.0) 4 (80.0) 5 (100)
Hassan 4 (40.0) 6 (60.0) 10 (100)
Kodagu 3 (100) 3 (100)
Kolar 1 (20.0) 4 (80.0) 5 (100)
Mysore 29 (61.7) 18 (38.3) 47 (100)
Shivamogga 5 (50.0) 5 (50.0) 10 (100)
Uttara Kannada 4 (66.7) 1 (16.7) 1 (16.7) 6 (100)
Grand Total 159 (68.0) 74 (31.6) 1 (0.4) 234 (100)
Source: Field Survey Note : Numbers in parenthesis are in percentage
Table 4.48 Extent of delay in getting job
Districts <6
months
6-12
months
12 - 18
months
18-24
months
24
Months+
No
info Total
Bagalkot 4 (44.4) 5 (55.6) 9 (100)
Bengaluru Urban 0 0 0 0 0 0 0
Belagavi 2 (11.1) 7 (38.9) 4 (22.2) 3 (16.7) 2 (11.1) 18 (100)
Bellary 1 (100) 1 (100)
Bidar 1 (20.0) 1 (20.0) 1 (20.0) 2 (40.0) 5 (100)
Kalaburgi - 2 (50.0) 1 (25.0) 1 (25.0) 4 (100)
Hassan 2 (33.3) - 3 (50.0) 1 (16.7) 6 (100)
Kodagu 1 (33.3) 2 (66.7) - - 3 (100)
Kolar 3 (75.0) 1 (25.0) 4 (100)
Mysore 1 (5.7) 5 (27.8) 9 (50.0) 3 (16.7) 18 (100)
Shivamogga 1 (20.0) 2 (40.0) 1 (20.0) 1 (20.0) - 5 (100)
Uttara Kannada 1(100.0) 1 (100)
Grand Total 15(20.3) 26(35.1) 19 (25.7) 4 (5.4) 9 (12.2) 1 (1.4) 74 (100)
Source: Field Survey Numbers in parenthesis are in percentage

Empirical Analysis
Karnataka Evaluation Authority | 75
Further probing the reasons for delay in getting the job, it is seen (Table 4.49) that a variety of
factors seem to compound the problem. However, the most common reason as reported by
more than half of the sample beneficiaries is found to be ‘lack of job opportunities.
Additionally, 33.8 per cent beneficiaries report that they could not succeed in the interviews.
While the first reason indicates some kind of lopsided planning, the second reason clearly
suggests the inefficiency of the higher education programme in equipping the graduates with
appropriate competencies and skills.
Table 4.49 Reasons for delay in getting job
Districts Couldn't
succeed
Didn't
try
No
money
bribe
No
opportunity
monetary
reasons
(bribe)
others Total
Bagalkot 1 (11.1) 1
(11.1) 7 (77.8) 9 (100)
Bengaluru Urban
Belagavi 3 (16.7) 12 (66.7) 1 (5.7) 2(11.1) 18
(100)
Bellary 1 (100) 1 (100)
Bidar 1(20.0) 4 (80.0) 5 (100)
Kalaburgi 1 (25.0) 3 (75.0) 4 (100)
Hassan 1 (16.7) 5 (83.3) 6 (100)
Kodagu 1
(33.3) 2 (66.7) 3 (100)
Kolar 1(25.0) 1 (25.0) 2(50.0) 4 (100)
Mysore 17 (94.4) 1 (5.6) 18
(100)
Shivamogga 1 (20.0) 3 (60.0) 1(20.0) 5 (100)
Uttara Kannada 1 (100) 1 (100)
Grand Total 25 (33.8) 2 (2.7) 2 (2.7) 38 (51.4) 1 (1.4) 6 (8.1) 74
(100)
Source: Field Survey Note : Numbers in parenthesis are in percentage

Evaluation of the Arivu Educational Loan Scheme Implemented by D Devaraj Urs Backward Classes
Development Corporation in Karnataka State (2011-12 To 2017-18)
76| Karnataka Evaluation Authority
4.6 Expenditure Incurred by Beneficiaries during their study period
Many of the Arivu Education beneficiaries may be required to relocate for purpose of pursuing
higher education. Or even if they stay in their own hometown, they may be required to commute
to college located at long distances. Besides, they will also be required to spend money for
purchase of study materials and other college expenses. It is noticed that most beneficiaries
view Arivu education loan as a great financial support to pursue higher education. Most of
them also report that without this support, it would not have been possible to pursue higher
education. Besides, they not only feel this scheme should be extended to all BC students in
higher education, but also feel the loan amount has to be increased.
During the Focus Group Discussion, many of the beneficiaries have reported that the
expenditure incurred by them during their study period is towards accommodation, food,
transport, books, stationery, study materials and other miscellaneous items. Under the
circumstance, how much annual expenditure is incurred by the Arivu beneficiaries is examined
for different courses as well as for different category of students across divisions/districts.
For purpose of calculating annual average expenditure per beneficiary, the total expenditure
incurred by each beneficiary for various items during the previous year is collected. The
amount varies as students will be studying in different semesters/years of course/programme.
Besides, the amount also varies for CET and non-CET beneficiaries. From the reported total
expenditure for the year, the tuition fee for the corresponding course/year is deducted. The
average is calculated for each district by dividing the total expenditure by the number of
students for each of the districts. The average expenditure is calculated separately for CET and
non-CET beneficiaries. It is to be noted that the figures thus obtained are reported by the
beneficiaries for various items of expenditure and the authenticity of the same needs validation.
It is noted that the beneficiaries from the North East Karnataka region have reported higher
expenditure than their counterparts in Bengaluru and Mysore. Similarly, in some cases, Non-
CET students are reported to have incurred more expenditure than CET beneficiaries.

Empirical Analysis
Karnataka Evaluation Authority | 77
Table 4.50 Average Annual Educational Expenditure per Beneficiary for CET and Non-CET across Districts
Division/District CET (in Rs.) Non-CET (in Rs.) Grand Total
Bengaluru Division 166875.13 159062.50 166786.10
Bengaluru Urban 189156.09 209416.67 189404.17
Kolar 166035.96 166035.96
Shivamogga 99737.50 8000.00 98604.94
Belagavi Division 228485.05 171009.09 226432.34
Bagalkot 202274.67 142300.00 199967.95
Belagavi 237477.91 181775.00 235120.11
Uttara Kannada 236730.73 236730.73
Kalaburgi Division 183589.26 132285.71 182000.21
Bellary 305564.60 181000.00 303122.16
Bidar 149398.55 101166.67 147172.46
Kalaburgi 146402.88 147166.67 146423.71
Mysore Division 263476.15 371333.33 264796.85
Hassan 143462.66 143462.66
Kodagu 419672.22 419672.22
Mysore 296784.27 371333.33 298182.06
Grand Total 207903.18 182294.00 207336.60
Source: Field Survey
It is seen (table 4.50) overall annual expenditure incurred for CET beneficiaries is over Rs. 2.0
lakh per student. The same for non-CET beneficiary is over 1.80 lakh per student. Quite
interestingly, Bengaluru division reveals lowest expenditure (1.67 lakh) as compared to
Mysore (Rs. 2.6 lakh), Belagavi (Rs.2.28 lakh) and Kalaburgi (1.83 lakh). Across districts,
Kodagu reveals highest (Rs 4.1 lakh). Strangely, all three districts in Belagavi and Mysore
district reveal far higher expenditure than Bengaluru district. In case of non-CET beneficiaries,
Mysore district reveals an expenditure of Rs.3.7 lakh, higher than even for CET beneficiary.
Strangely, Bengaluru urban and Kalaburgi districts reveal far higher expenditure as compared
to CET beneficiaries.

Evaluation of the Arivu Educational Loan Scheme Implemented by D Devaraj Urs Backward Classes
Development Corporation in Karnataka State (2011-12 To 2017-18)
78| Karnataka Evaluation Authority
Table 4.51 Average Annual Education Related Expenditure across Courses per Beneficiary
Course Annual Education Related Expenditure (Rs.)
Gen degree 71000
BE/B.Tech 67596
MBBS 117819
PG (MBA, MD, MTech, MVSc, MSc Ag,
MCA, MSc, MA) 89707
Others (BA, BAMS, BHMC, Nursing, PHD,
BCA, LLB, BSc forestry, B. Pharma, BYNS,
BHMS, BDS)
56596
Grand Total 70424
Source: Field Survey
From Table 4.51, it can be seen that on an average per year per beneficiary for all the courses
put together is Rs. 70,424 is being spent on education related expenses. These expenses include
food, lodging, travel, project work and other miscellaneous expenses. Across courses these
expenses are higher (Rs.1,17,819) in the case of MBBS course followed by PG courses (Rs.
89,707). Further, across districts these average expenses are higher in Bellary District
(Rs.1,53,097) followed by Belagavi (Rs.1,03,669) (Table-4.52). It can also be seen from Table-
4.53 that across categories, these expenses are higher in the case of Category III B students
(Rs. 75,112) followed by Category III A students (Rs. 72,605).
Table 4.52 Average Education related Expenditure across districts and divisions
Division/ district Average Education related Expenditure (Rs.)
Bengaluru Division 45796
Bengaluru Urban 57300
Kolar 81440
Shivamogga 0
Belagavi Division 86043
Bagalkot 38756
Belagavi 1,03,669
Uttara Kannada 94748
Kalaburgi Division 93911

Empirical Analysis
Karnataka Evaluation Authority | 79
Bellary 1,53,097
Bidar 60096
Kalaburgi 86451
Mysore Division 64407
Hassan 27888
Kodagu 120383
Mysore 73403
Grand Total 70424
Source: Field Survey
Table 4.53 Average Education related Expenditure across Categories
Category Average Education related Expenditure (Rs.)
I 70,060
IIA 68,774
IIIA 72,605
IIIB 75,112
Grand Total 70424
Source: Field Survey
Worked out in averages for CET (table 4.54) and Non-CET (table 4.55) category students as
well as across the districts/Division (table 4.54 and 4.55).
Table 4.54 Average Annual expenditure as against Average Loan for CET Beneficiaries
Division/District Average loan
availed
Average
expenditure Gap
Bengaluru Division 104667.52 166875.13 -62207.61
Bengaluru Urban 108641.45 189156.09 -80514.64
Kolar 68820.00 166035.96 -97215.96
Shivamogga 103848.75 99737.50 4111.25
Belagavi Division 98555.57 228485.05 -129929.48
Bagalkot 97884.25 202274.67 -104390.42
Belagavi 101971.19 237477.91 -135506.72
Uttara Kannada 84704.88 236730.73 -152025.85
Kalaburgi Division 57567.64 183589.26 -126021.62

Evaluation of the Arivu Educational Loan Scheme Implemented by D Devaraj Urs Backward Classes
Development Corporation in Karnataka State (2011-12 To 2017-18)
80| Karnataka Evaluation Authority
Bellary 52980.56 305564.60 -252584.04
Bidar 60929.03 149398.55 -88469.52
Kalaburgi 57763.41 146402.88 -88639.47
Mysore Division 110434.79 263476.15 -153041.36
Hassan 90668.66 143462.66 -52794
Kodagu 79705.56 419672.22 -339966.66
Mysore 122393.12 296784.27 -174391.15
Grand Total 94953.09 207903.18 -112950.09
Source: Field Survey
It is seen from Table-4.54 that the overall average annual expenditure incurred by the CET
beneficiary is Rs.2,07,903 and considering the average loan of Rs. 94,953 availed by the
beneficiary, he or she will be required to meet a gap of Rs.1,12,950 per annum during the study
period. Across divisions, strangely, it is the Mysore division, which reveals highest gap of
Rs.1,53,041, which is way higher than even Bangalore division (Rs. 62,207). Across districts,
it is Kodagu which reveals highest gap of Rs.3,39,966, which is rather unacceptably higher. In
Kalaburgi division, Bellary district reveal a gap of Rs.2,52,584. These figures appear
unacceptably higher. Since these are reported figures, there is possibility of exaggeration. Quite
interestingly Shivamogga district reveals positive difference in the gap suggesting lesser
expenditure incurred as against the loan availed in the year. Mysore, Bagalkot and Uttar
Kannada, all of these districts reveal lower gap of difference.
Table 4.55 Average Annual expenditure as against Average Loan for Non-CET Beneficiaries
Division/District Average loan
availed
Average
expenditure Gap
Bengaluru Division 64750.00 159062.50 -94312.5
Bengaluru Urban 66333.33 209416.67 -143083.34
Shivamogga 60000.00 8000.00 52000
Belagavi Division 53829.36 171009.09 -117179.73
Bagalkot 67833.33 142300.00 -74466.67
Belagavi 48577.88 181775.00 -133197.12
Kalaburgi Division 50142.86 132285.71 -82142.85
Bellary 40000.00 181000.00 -141000

Empirical Analysis
Karnataka Evaluation Authority | 81
Bidar 36666.67 101166.67 -64500
Kalaburgi 67000.00 147166.67 -80166.67
Mysore Division 103333.33 371333.33 -268000
Mysore 103333.33 371333.33 -268000
Grand Total 68013.89 182294.00 -114280.11
Source: Field Survey
A similar analysis of the expenditure incurred by the Arivu beneficiaries for non-CET category
reveals an overall gap of Rs.1,14,280 between loan availed and expenditure incurred. It may
be noticed from table 4.55 that the average loan availed itself is Rs. 68,000/-, however the
expenditure far exceeds (Rs.1,82,294). Here highest gap of Rs.2,68,000 is noticed for Mysore
division followed by Belagavi division (Rs.1,17,179). From among the districts, again Mysore
register highest difference between loan availed and expenditure incurred. Once again, it
appears to be a matter of over reporting.
4.7 Loan Repayment Status of Arivu Beneficiaries
In this section, beneficiary details relating to Arivu loan repayment status, loans taken from
other sources, financial liabilities etc., are analysed. For analysis of Arivu loan repayment
status, only those beneficiaries who had completed the course and those dropped out have been
taken into consideration. Students, currently attending colleges are excluded. Thus there were
altogether 549 beneficiaries, which included 526 beneficiaries successfully completing the
course and 23 beneficiaries who had dropped out midway through the course. There are 14
non-CET beneficiaries out of the total of 549, out of whom 3, all from Gulbarga division had
repaid the loan amount. Similarly, even from among the dropouts, some had repaid the loan
amount. The programme requires that beneficiaries start repaying the loan (loan amount plus
interest in monthly instalments up to three years) after four months of completing their courses.
For defaulters, 4 percent interest will be charged on cumulative basis. For the dropout
candidates, who had availed the loan, it is required that they should repay the loan with four
percent interest rates in four equal monthly instalments.
Thus analysing the beneficiaries by loan repayment status, it is noticed overall, at aggregate
level, only 101 beneficiaries out of the 549 eligible had repaid the loan. This accounts for a
mere 18.40 per cent (Table 4.56). From among the successful completers, a mere 18.63% had
repaid the loan, suggesting high proportion (81.36%) of defaulters. Similarly, 3 each of the

Evaluation of the Arivu Educational Loan Scheme Implemented by D Devaraj Urs Backward Classes
Development Corporation in Karnataka State (2011-12 To 2017-18)
82| Karnataka Evaluation Authority
dropouts (13.04%) and non-CET beneficiaries (17.64%) had repaid the loan amount. On further
asking about reasons for loan non-payment, many of them mentioned about their
unemployment and non-earning status. Alternatively, those employed reported about their low
income and poor financial conditions. However, they expressed the positive view that they
will be making repayment of their loan amount.
Table 4.56 Loan Repayment Status among Beneficiaries
Beneficiary Status No. %
Repaid 101 18.40
Not paid 448 81.60
Total * 549 100.00
*includes 23 dropouts and 17 non-CET (Source: Field Survey)
4.7.1 Loan repayment status among employed and unemployed beneficiaries
Considering the fact that the ability to pay back loan increases with the beneficiary getting a
job and starts earning wages, an attempt is made to correlate the loan repayment status with
employment status (table 4.57). It is noticed from the Graph 4.7 that in absolute numbers,
slightly higher number of unemployed beneficiaries have repaid loan as against employed. This
is quite contrary to the assumption. However, in terms of proportion, a slightly higher
proportion (19.7 per cent) of the employed beneficiaries have repaid loan as against 17.24 per
cent of the unemployed beneficiaries. But it is to be noted that over 80.0 per cent of the
employed beneficiaries have yet to repay the loan suggesting that employment does not
determine the loan repayment ability.
Table 4.57 Employment Status of Beneficiaries and Loan Repayment Status
Employment Status Loan Repayment Status
Total Paid Not paid
Employed 45 (19.7) 183 (80.3) 228
Unemployed 55 (17.24) 264 (82.76) 319
NR 1 (50.0) 1 (50.0) 002
Total 101 448 549
Source: Field Survey Note: Numbers in parenthesis are in percentage

Empirical Analysis
Karnataka Evaluation Authority | 83
Figure 4.7 Loan repayment status among employed-unemployed beneficiaries
Source: Field Survey
4.7.2 Loan repayment status among male-female Beneficiaries
Further analysing the loan repayment status among employed-unemployed male-female
beneficiaries, it is noted that as it is the employment level among female beneficiaries is quite
low as compared to their male counterparts. Yet, when it comes to fulfilling the loan
commitments, they seem to outperform their male counterparts. The proportion of employed
male and female beneficiaries for loan repayment status does not indicate any difference,
although it is quite low as just 19.0 per cent (Table 4.58 and Graph-4.8).
Table 4.58 Loan Repayment Status of Employed-Unemployed Male-Female Beneficiaries
Employment Status
Gender Loan Repayment Status
Total
Paid Not paid
Male Employed 32 (19.8) 130 (80.2) 162
Female Employed 13 (19.7) 53 (80.3) 66
Male Unemployed 30 (16.0) 158 (84.0) 188
Female Unemployed 25 (19.1) 106 (80.9) 131
NR 1 (50.0) 1 (50.0) 2
Total 101 448 549
Source: Field Survey Note: Numbers in parenthesis are in percentage
19.70% 17.24%
80.30% 82.76%
0.00%
20.00%
40.00%
60.00%
80.00%
100.00%
120.00%
Employed Unemployed
Loan repayment status among employed-unemployed
beneficiaries (in %)
Paid Not Paid
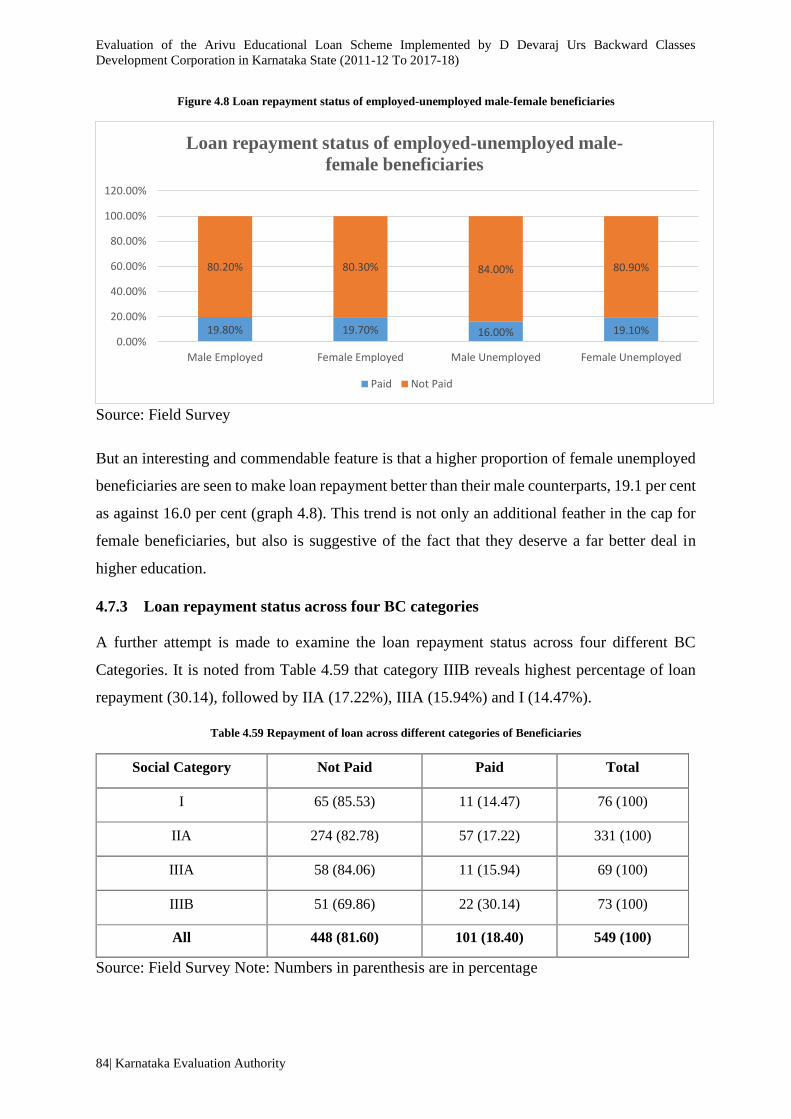
Evaluation of the Arivu Educational Loan Scheme Implemented by D Devaraj Urs Backward Classes
Development Corporation in Karnataka State (2011-12 To 2017-18)
84| Karnataka Evaluation Authority
Figure 4.8 Loan repayment status of employed-unemployed male-female beneficiaries
Source: Field Survey
But an interesting and commendable feature is that a higher proportion of female unemployed
beneficiaries are seen to make loan repayment better than their male counterparts, 19.1 per cent
as against 16.0 per cent (graph 4.8). This trend is not only an additional feather in the cap for
female beneficiaries, but also is suggestive of the fact that they deserve a far better deal in
higher education.
4.7.3 Loan repayment status across four BC categories
A further attempt is made to examine the loan repayment status across four different BC
Categories. It is noted from Table 4.59 that category IIIB reveals highest percentage of loan
repayment (30.14), followed by IIA (17.22%), IIIA (15.94%) and I (14.47%).
Table 4.59 Repayment of loan across different categories of Beneficiaries
Social Category Not Paid Paid Total
I 65 (85.53) 11 (14.47) 76 (100)
IIA 274 (82.78) 57 (17.22) 331 (100)
IIIA 58 (84.06) 11 (15.94) 69 (100)
IIIB 51 (69.86) 22 (30.14) 73 (100)
All 448 (81.60) 101 (18.40) 549 (100)
Source: Field Survey Note: Numbers in parenthesis are in percentage
19.80% 19.70% 16.00% 19.10%
80.20% 80.30% 84.00% 80.90%
0.00%
20.00%
40.00%
60.00%
80.00%
100.00%
120.00%
Male Employed Female Employed Male Unemployed Female Unemployed
Loan repayment status of employed-unemployed male-
female beneficiaries
Paid Not Paid

Empirical Analysis
Karnataka Evaluation Authority | 85
Analysing the loan repayment status among employed-unemployed and four categories of
beneficiaries, it is seen (Table 4.60 and Graph-4.9) that among both employed and unemployed,
beneficiaries under category IIIB reveal highest percentage of repayment, 28.6% and 31.1%
respectively. An interesting trend that is noticed is both category IIIA and IIIB reveal a higher
percentage of beneficiaries among unemployed category repaying loan as compared to
employed. This deserves further probing as to what factor has prompted even the unemployed
to make loan repayment.
Table 4.60 Repayment of loan among employed-unemployed across different categories of Beneficiaries
Category
Employed Unemployed Gran
d
Total
Loan
paid
Not
paid NR
Tot
al
Loan
paid
Not
paid NR Total
I 5(17.9) 23(82.1) - 28 6(12.5) 41 (85.4) 1 (2.1) 48 76
IIA 29(20.7) 110(78.6) 1(0.7) 140 27 (14.3) 164
(85.9) - 191 331
IIIA 3 (9.1) 30 (90.9) - 33 8 (22.2) 28 (77.8) - 36 69
IIIB 8 (28.6) 20 (71.4) - 28 14 (31.1) 31 (68.9) - 45 73
Total 45 183 1 229 55 264 1 320 549
Source: Field Survey Note: Numbers in parenthesis are in percentage
Figure 4.9 Repayment of loan among Male and Female Employed Beneficiaries
Source: Field Survey
18%
82%
13%
85%
21%
79%
14%
86%
9%
91%
22%
78%
29%
71%
31%
69%
0%
10%
20%
30%
40%
50%
60%
70%
80%
90%
100%
Paid Not Paid Paid Not Paid
Employed Unemployed
Repayment of loan among employed-unemployed across different
categories of Beneficiaries (in %)
I II IIIA IIIB
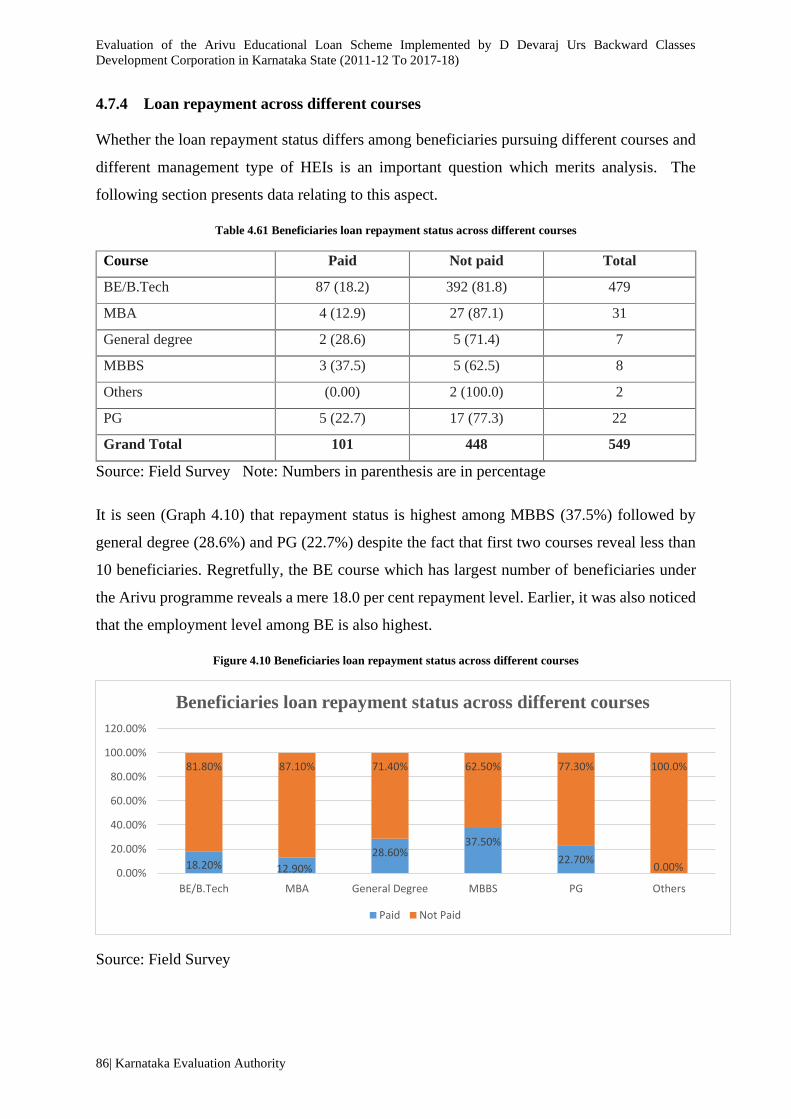
Evaluation of the Arivu Educational Loan Scheme Implemented by D Devaraj Urs Backward Classes
Development Corporation in Karnataka State (2011-12 To 2017-18)
86| Karnataka Evaluation Authority
4.7.4 Loan repayment across different courses
Whether the loan repayment status differs among beneficiaries pursuing different courses and
different management type of HEIs is an important question which merits analysis. The
following section presents data relating to this aspect.
Table 4.61 Beneficiaries loan repayment status across different courses
Course Paid Not paid Total
BE/B.Tech 87 (18.2) 392 (81.8) 479
MBA 4 (12.9) 27 (87.1) 31
General degree 2 (28.6) 5 (71.4) 7
MBBS 3 (37.5) 5 (62.5) 8
Others (0.00) 2 (100.0) 2
PG 5 (22.7) 17 (77.3) 22
Grand Total 101 448 549
Source: Field Survey Note: Numbers in parenthesis are in percentage
It is seen (Graph 4.10) that repayment status is highest among MBBS (37.5%) followed by
general degree (28.6%) and PG (22.7%) despite the fact that first two courses reveal less than
10 beneficiaries. Regretfully, the BE course which has largest number of beneficiaries under
the Arivu programme reveals a mere 18.0 per cent repayment level. Earlier, it was also noticed
that the employment level among BE is also highest.
Figure 4.10 Beneficiaries loan repayment status across different courses
Source: Field Survey
18.20% 12.90%
28.60%37.50%
22.70%0.00%
81.80% 87.10% 71.40% 62.50% 77.30% 100.0%
0.00%
20.00%
40.00%
60.00%
80.00%
100.00%
120.00%
BE/B.Tech MBA General Degree MBBS PG Others
Beneficiaries loan repayment status across different courses
Paid Not Paid

Empirical Analysis
Karnataka Evaluation Authority | 87
4.7.5 Loan repayment status across different management types
Yet another question of interest is whether students studying under different management type
of colleges reveal different patterns of loan repayment. It is assumed that those studying under
private management status will be in a better position to repay their loan as they may belong to
economically well-off households. It is noted from Table 4.62 that beneficiaries from
autonomous colleges reveal highest percentage of loan repayment (28.6%). However, they are
very small in number. Considering those under private unaided and private aided, it adds up to
36.6 per cent. Thus, the assumption seems to corroborate that beneficiaries studying under
these types of colleges may hail from relatively higher economic background.
Table 4.62 Beneficiaries loan repayment status across different type of higher education institutions
Type of Higher Education Institution Paid Not paid Total
Autonomous/deemed 4 (28.6) 10 (71.4) 14
Government 17 (22.1) 60 (77.9) 77
Pvt-aided 20 (20.2) 79 (79.8) 99
Pvt-unaided 58 (16.4) 295 (83.6) 353
Other 1 (20.0) 4 (80.0) 5
NR 1 (100.0) (0.00) 1
Grand Total 101 448 549
Source: Field Survey Note: Numbers in parenthesis are in percentage
4.7.6 Loan repayment status across districts/divisions
Further analysing data across regions, it is seen that Kalaburgi division records highest
percentage (28.18 %) of loan repayment (Table 4.63 and Graph-4.11).
Table 4.63 Status of Repayment of the loan
Districts Not Paid Paid Total
Bengaluru Division 166 (95.95) 7 (4.05) 173 (100)
Bengaluru Urban 132 (98.51) 2 (1.49) 134 (100)
Kolar 8 (80.00) 2 (20.00) 10 (100)
Shivamogga 26 (89.66) 3 (10.34) 29 (100)
Belagavi Division 107 (76.98) 32 (23.02) 139 (100)
Bagalkot 18 (58.06) 13 (41.94) 31 (100)
Belagavi 74 (82.22) 16 (17.78) 90 (100)

Evaluation of the Arivu Educational Loan Scheme Implemented by D Devaraj Urs Backward Classes
Development Corporation in Karnataka State (2011-12 To 2017-18)
88| Karnataka Evaluation Authority
Uttara Kannada 15 (83.33) 3 (16.67) 18 (100)
Kalaburgi Division 79 (71.82) 31 (28.18) 110 (100)
Bellary 10 (52.63) 9 (47.37) 19 (100)
Bidar 22 (62.86) 13 (37.14) 35 (100)
Kalaburgi 47 (83.93) 9 (16.07) 56 (100)
Mysore Division 96 (75.59) 31 (24.41) 127 (100)
Hassan 15 (46.88) 17 (53.13) 32 (100)
Kodagu 5 (62.50) 3 (37.50) 8 (100)
Mysore 76 (87.36) 11 (12.64) 87 (100)
Grand Total 448 (81.60) 101 (18.40) 549 (100)
Source: Field Survey Note: Numbers in parenthesis are in percentage
This is followed by Mysore division (24.41%) and Belagavi division (23.02%). Bengaluru
division records lowest percentage (4.05%). Across districts, Hassan reveals highest
percentage (53.13) followed by Bellary (47.37%), Bagalkote (41.94%), Kodagu (37.50%) and
Bidar (37.14%) districts. While, it is regrettable that all districts in Bengaluru Urban division
record very poor loan repayment status, it is noteworthy that districts from backward districts
reveal better performance.
Overall, it has been noticed and analysed that low level of loan repayment in many cases is due
to: 1) unemployment even after completing the course, 2) low salary even if they are employed,
3) not so serious about repaying the loan taken from the government, 4) low level of monitoring
and loan recovery mechanisms.

Empirical Analysis
Karnataka Evaluation Authority | 89
Figure 4.11 Status of Repayment of the loan
Source: Field Survey
4.8 Logistic Regression
Having analysed the loan repayment status across several independent variables in 2-way & 3-
way tables, an attempt has been made to statistically test the significance of correlation of
dependent variable with different independent variables in the sample. Whether the
employment status of beneficiaries’ influences loan repayment status and also to what extent
the employment status itself is linked to background variables. This is examined by subjecting
dependent and independent variables to regression analysis. The regression model was fit with
dependent variable as employment status and division, gender, location, OBC category, college
type, repayment of loan, total land holding size, house type, and type of degree as independent
variables. Some of the significant variables are shown in the Matrix 4.64. The results are rather
mixed up and merit further investigation with some variables revealing significant correlation
and some others negative. Across divisions, Bengaluru division beneficiaries’ employment
status increases as compared to others; male beneficiaries are more likely to be employed;
beneficiaries in government colleges are more likely to be employed; quite significantly, loan
repayment behaviour increases with employment status; similarly, landless and owning Pucca
house tend to increase the likelihood of employment for Arivu beneficiaries. Thus the results
however suggest that there are other measures which need to be put in place to improve better
employment prospects for Arivu beneficiaries, more so for females and in the backward

Evaluation of the Arivu Educational Loan Scheme Implemented by D Devaraj Urs Backward Classes
Development Corporation in Karnataka State (2011-12 To 2017-18)
90| Karnataka Evaluation Authority
regions. Similarly, the results also raise the question, whether the norms need to be revised and
reappropriated in so far as extending the loan benefit to private colleges as well as for the
landless and the non-pucca households.
Table 4.64 Status of Repayment of the loan – Matrix Regression Results of Employment status with independent
variables
Variable Factors Coefficient Standard
error p-value Significant
Division
Belagavi
Division -1.045429 .3047334 0.001
Bangalore Division is Significant
at 1% level of significance
Gulbarga
Division -2.056385 .3677206 0.000
Bangalore Division is Significant
at 1% level of significance
Mysore
Division -.5370871 .2807404 0.056
Bangalore Division is Significant
at 5% level of significance
Gender Male .9550243 .2141239 0.000 Significant at 1% level of
significance level.
College
Type
Pvt. aided -.6533159 .3579 0.068
Government college is
Significant at 7% level of
significance level.
Pvt.
unaided -.5065369 .3017185 0.093
Government college is
Significant at 10% level of
significance
Repayment
of the loan Repaid .6755807 .2599179 0.009
Significant 1 % level of
significance level.
Land
holding
NO land
or landless .8467308 .3749558 0.024
Significant at 3% level of
significance
House type Pucca 1.010964 .4775967 0.034 Significant at 4% level of
significance.
Source: Field Survey
4.9 Beneficiary Awareness about Arivu Education Loan
In this section, knowledge and awareness of beneficiaries about the Arivu programme, its
source of information, purpose, selection and implementation procedure, and other related
dimensions are analysed. To begin with, an attempt has been made to analyse the data gathered
from the FGD of the beneficiaries about the source through which they came to know about
the Arivu programme. The following table reveals the same.

Empirical Analysis
Karnataka Evaluation Authority | 91
Table 4.65 Source of awareness about the Arivu Scheme
District
College
Notice
Board
News Paper Website Friends
Family
members/ot
hers
Bengaluru
Urban 4 2 2
Kolar 3 4 5 5 4
Shivamogga 4 3 1
Belgaum 5 2
Bellary 2 2 1 1
Uttara Kannada 4 2 1 2 1
Bidar 3 1 1 1 1
Bagalkote - 4 2 1 1
Kalaburgi 4 2 2 2
Hassan 3 2 1
Kodagu 4 3 1 1
Mysore 4 2 2 1 1
Total 40 29 15 15 11
Source: Field Survey
It may be noticed (table 4.65) that the most common source of information about Arivu
programme comes to the beneficiaries through College Notice Board, followed by News Paper.
Department Website and friends also are found to disseminate information about Arivu
programme.
4.9.1 Eligibility Criteria
Further analysing the data gathered from 1130 sample beneficiaries about their knowledge and
awareness about the programme eligibility criteria, the process of selection, loan release
procedure, application procedure, and documents required are examined. It is seen that overall,
almost an equal proportion of beneficiaries are either ‘fully aware’ or ‘partially aware’ about
the eligibility of the scheme (Table 4.66). However, across the districts the trend appears to be
different. Bagalkot, Bellary, Bidar, Belagavi, Mysore, Shivamogga, Uttara Kannada districts
reveal higher proportion of ‘partial awareness’ about the programme eligibility criteria among
the beneficiaries.

Evaluation of the Arivu Educational Loan Scheme Implemented by D Devaraj Urs Backward Classes
Development Corporation in Karnataka State (2011-12 To 2017-18)
92| Karnataka Evaluation Authority
Table 4.66 Beneficiaries knowledge about programme eligibility criteria
Districts Fully aware Neutral Not aware Partially aware Total
Bagalkot 16 (20.5) 2 (2.6) 60 (76.9) 78 (100)
Bengaluru Urban 174 (71.0) 2 (0.8) 69 (28.2) 245 (100)
Belagavi 84 (44.4) 1 (0.5) 7 (3.7) 97 (51.3) 189 (100)
Bellary 4 (7.8) 47 (92.2) 51 (100)
Bidar 16 (24.6) 1 (1.5) 12 (18.5) 36 (55.4) 65 (100)
Kalaburgi 83 (75.5) 1 (0.9) 26 (23.6) 110 (100)
Hassan 32 (47.8) 3 (4.5) 32 (47.8) 67 (100)
Kodagu 14 (77.8) 1 (5.6) 3 (16.7) 18 (100)
Kolar 22 (88.0) 1 (4.0) 2 (8.0) 25 (100)
Mysore 54 (33.8) 2 (1.3) 3 (1.9) 101 (63.1) 160 (100)
Shivamogga 29 (35.8) 1 (1.2) 51 (63.0) 81 (100)
Uttara Kannada 14 (34.2) 1 (2.4) 26 (63.4) 41 (100)
Total 542 (48.0) 4 (0.4) 34 (3.0) 550 (48.7) 1130 (100)
Source: Field Survey Note : Numbers in parenthesis are in percentage
In fact, Bellary district reveals more than 90.0 per cent of the beneficiaries having only ‘partial
knowledge’ about the scheme. This is a sad reflection. On the contrary, the remaining districts
reveal a higher proportion of beneficiaries reporting ‘full awareness’ about the programme.
Kolar district reveals highest proportion (88.0%) reporting about ‘full knowledge’ about the
scheme.
4.9.2 Selection & Application Procedure
A similar analysis of beneficiary perceptions about the selection process/procedure of
beneficiaries into the programme reveals overall more than half (53.8%) of the respondents are
‘fully aware’ (Table 4.67). About 43.6 % are ‘partially aware’. Across districts, in Kolar,
Belagavi, Bellary, Mysore and Uttara Kannada, the proportion of beneficiaries reporting about
partial awareness is higher as compared to that of full awareness.

Empirical Analysis
Karnataka Evaluation Authority | 93
Table 4.67 Beneficiaries knowledge about selection process / procedure
Districts Fully
aware Neutral
Not
aware
Partially
aware NR Total
Bagalkot 18 (23.1) 1 (1.3) 58 (74.4) 1 (1.3) 78 (100)
Bengaluru
Urban 181 (73.9) 1 (0.4) 63 (25.7) 245 (100)
Belagavi 76 (40.2) 3 (1.6) 110 (58.2) 189 (100)
Bellary 2 (3.9) 1 (2.0) 3 (5.9) 45 (88.2) 51 (100)
Bidar 30 (46.2) 2 (3.1) 33 (50.8) 65 (100)
Kalaburgi 90 (81.8) 20 (18.2) 110 (100)
Hassan 53 (79.1) 2 (3.0) 11 (16.4) 1 (1.5) 67 (100)
Kodagu 18 (100) 18 (100)
Kolar 23 (92.0) 2 (8.0) 25 (100)
Mysore 67 (41.9) 3 (1.9) 90 (56.3) 160 (100)
Shivamogga 32 (39.5) 1 (1.2) 7 (8.6) 41 (50.6) 81 (100)
Uttara Kannada 18 (43.9) 22 (53.7) 1 (2.4) 41 (100)
Grand Total 608 (53.8) 3 (0.3) 23 (2.0) 493 (43.6) 3 (0.3) 1130 (100)
Source: Field Survey Note: Numbers in parenthesis are in percentage
While in Kodagu all the 18 beneficiaries are fully aware, in Kolar district, more than 90.0 per
cent fall into this category. In the remaining districts of Bengaluru urban, Kalaburgi, Hassan,
beneficiaries reporting ‘full awareness ‘about the programme selection procedure far exceeds.
A disturbing feature observed although in small proportion is the beneficiaries’ total lack of
awareness about the programme’s eligibility and selection process. A total of 34 and 23
beneficiaries respectively do not seem to have an idea about the programme eligibility criteria
and selection procedure as they report about being ‘not at all aware’. This reflects either
casual/superficial attitude towards government programmes in general or could be that the
entire activity was mediated by some well-wishers or representatives. A question was also
asked to the beneficiaries about the method and procedure through which the loan amount was
released to the selected students (Table 4.68).

Evaluation of the Arivu Educational Loan Scheme Implemented by D Devaraj Urs Backward Classes
Development Corporation in Karnataka State (2011-12 To 2017-18)
94| Karnataka Evaluation Authority
Table 4.68 Awareness about Loan Amount Releasing Procedure among the Beneficiaries
District Fully aware Neutral Not
aware
Partially
aware No info Total
Bagalkot 16 (20.5) 4 (5.1) 57 (73.1) 1 (1.3) 78 (100)
Bengaluru Urban 173 (70.6) 72 (29.4) 245 (100)
Belagavi 81 (42.9) 5 (2.7) 103 (54.5) 189 (100)
Bellary 3 (5.9) 1 (2.0) 47 (92.2) 51 (100)
Bidar 13 (20.0) 1 (1.5) 13 (20.0) 38 (58.5) 65 (100)
Kalaburgi 64 (58.2) 46 (41.8) 110 (100)
Hassan 36 (53.7) 1 (1.5) 4 (6.0) 26 (38.8) 67 (100)
Kodagu 13 (72.2) 2 (11.1) 3 (16.7) 18 (100)
Kolar 21 (84.0) 1 (4.0) 1 (4.0) 2 (8.0) 25 (100)
Mysore 38 (23.8) 3 (1.9) 9 (5.6) 110 (68.8) 160 (100)
Shivamogga 40 (49.4) 1 (1.2) 3 (3.70) 37 (45.7) 81 (100)
Uttara Kannada 21 (51.2) 19 (46.3) 1 (2.4) 41 (100)
Grand Total 519 (45.9) 7 (0.6) 42 (3.7) 560 (49.6) 2 (0.2) 1130 (100)
Source: Field Survey Note : Numbers in parenthesis are in percentage
Overall, almost equal proportion of students seem to be divided between ‘fully aware’ and
‘partially aware’. There are also 42 beneficiaries who report about ‘not at all being aware’
about this, which indeed is a sad reflection on the programme implementation. Across districts,
Bengaluru Urban, Kalaburgi, Hassan, Kodagu, Kolar, Uttara Kannada reveal a higher
proportion of beneficiaries expressing ‘full awareness’ about the programme. From among
these, Kolar district occupies the top position with 84.0 %. The remaining districts of Bagalkot,
Belagavi, Bellary, Bidar, Mysore reveal higher proportion of beneficiaries being ‘partially
aware’ than ‘fully aware’. It is again Bellary district which reveals far higher (92.0%)
beneficiaries under the ‘partially aware’ category than under ‘fully aware’. Beneficiaries’
knowledge and awareness about the application procedure involved in obtaining Arivu
education loan was also examined. In this regard, it is noticed (Table 4.69).
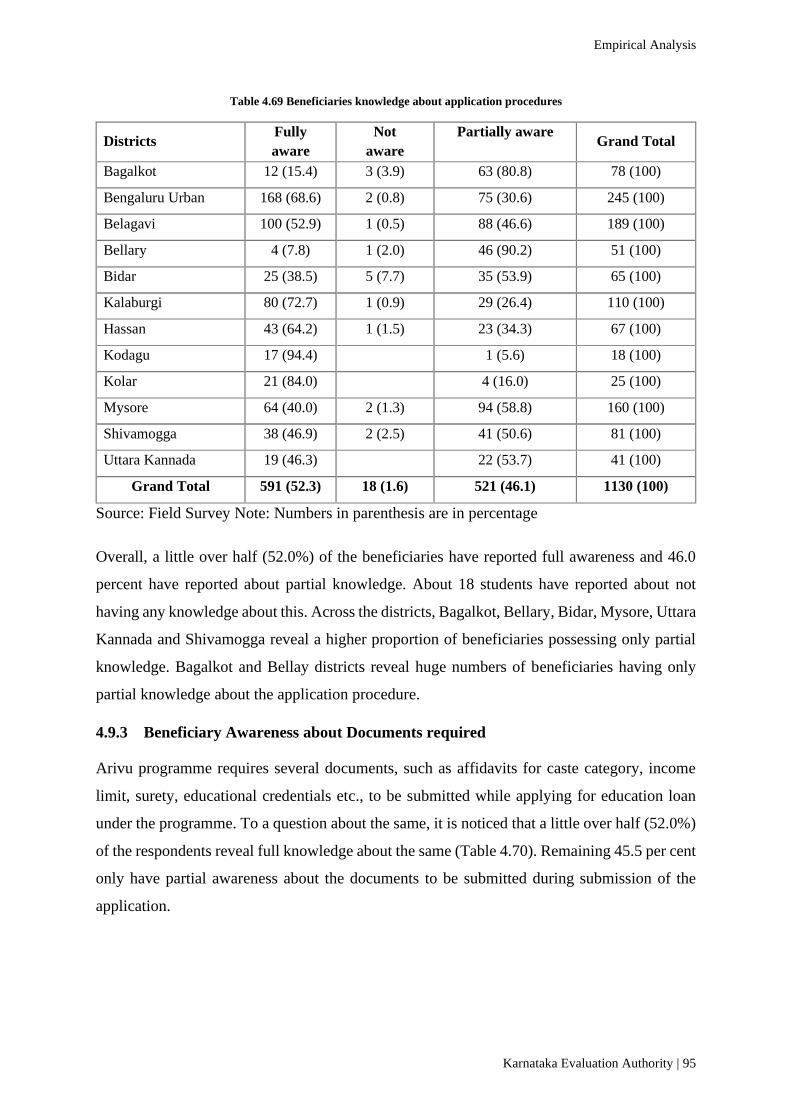
Empirical Analysis
Karnataka Evaluation Authority | 95
Table 4.69 Beneficiaries knowledge about application procedures
Districts Fully
aware
Not
aware
Partially aware
Grand Total
Bagalkot 12 (15.4) 3 (3.9) 63 (80.8) 78 (100)
Bengaluru Urban 168 (68.6) 2 (0.8) 75 (30.6) 245 (100)
Belagavi 100 (52.9) 1 (0.5) 88 (46.6) 189 (100)
Bellary 4 (7.8) 1 (2.0) 46 (90.2) 51 (100)
Bidar 25 (38.5) 5 (7.7) 35 (53.9) 65 (100)
Kalaburgi 80 (72.7) 1 (0.9) 29 (26.4) 110 (100)
Hassan 43 (64.2) 1 (1.5) 23 (34.3) 67 (100)
Kodagu 17 (94.4) 1 (5.6) 18 (100)
Kolar 21 (84.0) 4 (16.0) 25 (100)
Mysore 64 (40.0) 2 (1.3) 94 (58.8) 160 (100)
Shivamogga 38 (46.9) 2 (2.5) 41 (50.6) 81 (100)
Uttara Kannada 19 (46.3) 22 (53.7) 41 (100)
Grand Total 591 (52.3) 18 (1.6) 521 (46.1) 1130 (100)
Source: Field Survey Note: Numbers in parenthesis are in percentage
Overall, a little over half (52.0%) of the beneficiaries have reported full awareness and 46.0
percent have reported about partial knowledge. About 18 students have reported about not
having any knowledge about this. Across the districts, Bagalkot, Bellary, Bidar, Mysore, Uttara
Kannada and Shivamogga reveal a higher proportion of beneficiaries possessing only partial
knowledge. Bagalkot and Bellay districts reveal huge numbers of beneficiaries having only
partial knowledge about the application procedure.
4.9.3 Beneficiary Awareness about Documents required
Arivu programme requires several documents, such as affidavits for caste category, income
limit, surety, educational credentials etc., to be submitted while applying for education loan
under the programme. To a question about the same, it is noticed that a little over half (52.0%)
of the respondents reveal full knowledge about the same (Table 4.70). Remaining 45.5 per cent
only have partial awareness about the documents to be submitted during submission of the
application.

Evaluation of the Arivu Educational Loan Scheme Implemented by D Devaraj Urs Backward Classes
Development Corporation in Karnataka State (2011-12 To 2017-18)
96| Karnataka Evaluation Authority
Table 4.70 Beneficiaries knowledge about documents required for the scheme
Districts Fully aware Neutral Not
aware
Partially
aware Total
Bagalkot 14 (18.0) 6 (7.7) 58 (74.4) 78 (100)
Bengaluru Urban 173 (70.6) 1 (0.4) 71 (29.0) 245 (100)
Belagavi 82 (43.4) 1 (0.5) 4 (2.1) 102 (54.0) 189 (100)
Bellary 4 (7.8) 1 (2.0) 46 (90.2) 51 (100)
Bidar 27 (41.5) 6 (9.2) 32 (49.2) 65 (100)
Kalaburgi 81 (73.6) 29 (26.4) 110 (100)
Hassan 47 (70.2) 20 (29.9) 67 (100)
Kodagu 15 (83.3) 3 (16.7) 18 (100)
Kolar 22 (88.0) 1 (4.0) 2 (8.0) 25 (100)
Mysore 67 (41.9) 1 (0.6) 92 (57.5) 160 (100)
Shivamogga 42 (51.9) 1 (1.2) 38 (46.9) 81 (100)
Uttara Kannada 19 (46.3) 1 (2.4) 21 (51.2) 41 (100)
Grand Total 593 (52.5) 2 (0.2) 21 (1.9) 514 (45.5) 1130 (100)
Source: Field Survey Note : Numbers in parenthesis are in percentage
Across regions, Bagalkot, Belagavi, Bellary, Mysore and Uttara Kannada districts are having
much higher proportion of beneficiaries possessing only partial knowledge about the scheme.
Further on Bellary and Kolar reveal contrasting picture in accommodating beneficiaries who
either have disproportionately full knowledge or partial knowledge about different documents
to be submitted.
4.10 Reasons and Constraints for Low Access & Poor Participation
In order to find out low access and poor participation among backward class students in higher
education, it is necessary to have supply pool data relating to student demographics such as
enrolment, transition, progression and completion ratios both at aggregate and disaggregate
levels. This data will be useful to assess the flow into higher education among the BC students
in terms of access, enrolment, transition, retention, dropout and completion ratios.
Furthermore, baseline and time-series enrolment data, dropout, transition, progression and
completion data need to be compiled at the district level in order to capture the spread and
progress made by different population segments as well as across different higher education
courses. However, an attempt to tap this database proved futile as neither the Department of
Collegiate Education, nor the Backward Class Department had compiled any such statistical

Empirical Analysis
Karnataka Evaluation Authority | 97
datasets to enable us to undertake this exercise. Nonetheless, in order to obtain a bird’s eye
view of the issues relating to low access and poor participation in higher education among the
BC students an attempt was made to contact a few non-beneficiaries across different divisions.
Section 4.11 below reflects on the issues related to low access and poor participation of BC
students in higher education.
4.11 A Comparative Analysis of Non-Beneficiaries
As it has been mentioned earlier in the methodology, 12 non-beneficiaries, one each from the
selected 12 districts have been interviewed. These respondents are those who have not taken
ARIVU loan for their higher education purpose. The respondents were selected purposively to
be compared with the beneficiaries. In other words, while selecting care has been taken that
these respondents should be from BC communities and backward in terms income. Among the
non-beneficiaries, 5 are female and 7 Male. Three are studying in Government College, 4 in
private, 4 in private aided and 1 respondent in an autonomous college. All are in Degree level
courses (BA/BSc/B. Com/BBM).
Eight respondents are from rural, 3 from urban and 1 from semi-urban areas. Seven respondents
belong to II A category, 4 to IIIB and one is from category I. Seven of them have no land of
their families.
Nine respondents have completed the course, but only one is employed, the other eight are still
unemployed. Only 2 respondents have taken loan from banks, which ranges from 35,000 to
1,20,000. Out of 12 respondents, 10 have no other financial support, only two got support from
the state government. The annual educational expenditure of these respondents ranges from
Rs.35,000 to Rs.1,20,000.
About ARIVU education loan, four of the respondents are aware about it, and they got this
information through friends and newspapers. They did not apply for ARIVU loan as they
opined that applying to ARIVU loan is cumbersome, procedure takes lot of time, providing
documents is difficult, it is not released on time, and we may not get even after applying to it.
It may be noticed from table 4.71 that over 58.0 % of the students have reported that the HEIs
in the region are located in faraway places. As such it is inconvenient and difficult to reach the
colleges, thereby making higher education inaccessible to them. Further, 83.3% of the students
report that they are in need of financial support. Regretfully, large majority are not aware about
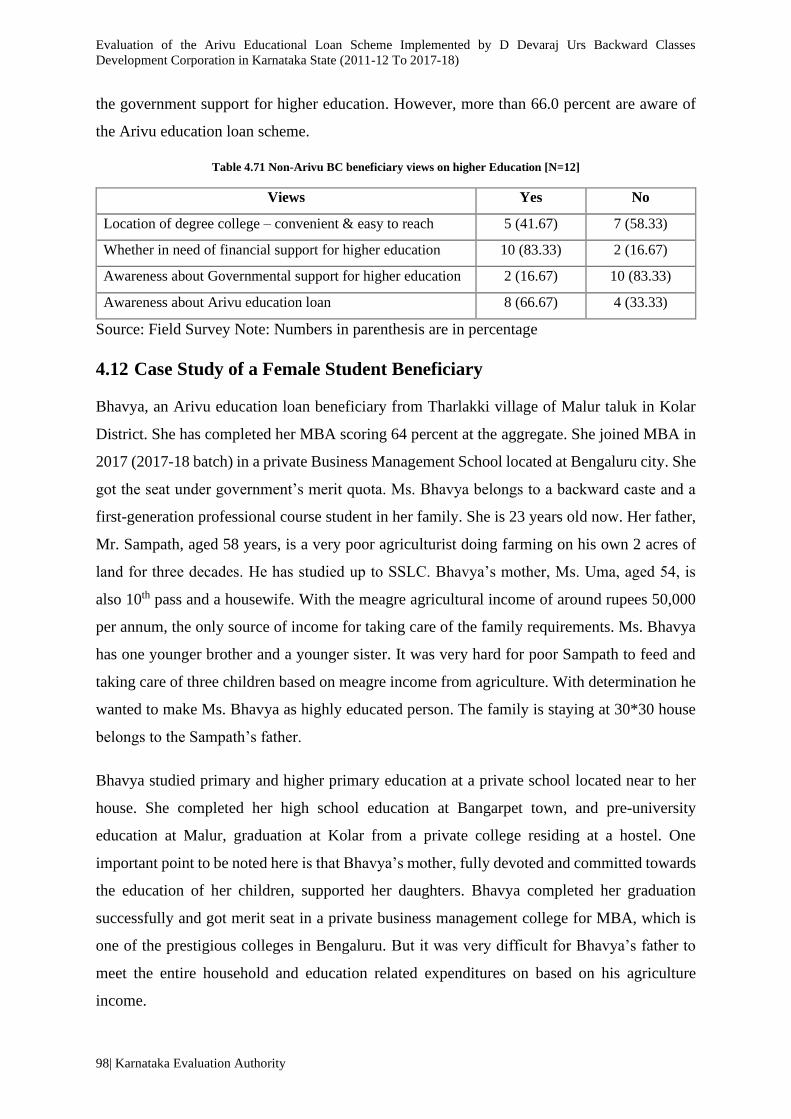
Evaluation of the Arivu Educational Loan Scheme Implemented by D Devaraj Urs Backward Classes
Development Corporation in Karnataka State (2011-12 To 2017-18)
98| Karnataka Evaluation Authority
the government support for higher education. However, more than 66.0 percent are aware of
the Arivu education loan scheme.
Table 4.71 Non-Arivu BC beneficiary views on higher Education [N=12]
Views Yes No
Location of degree college – convenient & easy to reach 5 (41.67) 7 (58.33)
Whether in need of financial support for higher education 10 (83.33) 2 (16.67)
Awareness about Governmental support for higher education 2 (16.67) 10 (83.33)
Awareness about Arivu education loan 8 (66.67) 4 (33.33)
Source: Field Survey Note: Numbers in parenthesis are in percentage
4.12 Case Study of a Female Student Beneficiary
Bhavya, an Arivu education loan beneficiary from Tharlakki village of Malur taluk in Kolar
District. She has completed her MBA scoring 64 percent at the aggregate. She joined MBA in
2017 (2017-18 batch) in a private Business Management School located at Bengaluru city. She
got the seat under government’s merit quota. Ms. Bhavya belongs to a backward caste and a
first-generation professional course student in her family. She is 23 years old now. Her father,
Mr. Sampath, aged 58 years, is a very poor agriculturist doing farming on his own 2 acres of
land for three decades. He has studied up to SSLC. Bhavya’s mother, Ms. Uma, aged 54, is
also 10th pass and a housewife. With the meagre agricultural income of around rupees 50,000
per annum, the only source of income for taking care of the family requirements. Ms. Bhavya
has one younger brother and a younger sister. It was very hard for poor Sampath to feed and
taking care of three children based on meagre income from agriculture. With determination he
wanted to make Ms. Bhavya as highly educated person. The family is staying at 30*30 house
belongs to the Sampath’s father.
Bhavya studied primary and higher primary education at a private school located near to her
house. She completed her high school education at Bangarpet town, and pre-university
education at Malur, graduation at Kolar from a private college residing at a hostel. One
important point to be noted here is that Bhavya’s mother, fully devoted and committed towards
the education of her children, supported her daughters. Bhavya completed her graduation
successfully and got merit seat in a private business management college for MBA, which is
one of the prestigious colleges in Bengaluru. But it was very difficult for Bhavya’s father to
meet the entire household and education related expenditures on based on his agriculture
income.
Empirical Analysis
Karnataka Evaluation Authority | 99
Difficulties increased as she joined the college at Bengaluru for taking care of the educational
expenditures—travelling from her PG, college fees, books, food etc. She was desperately
looking for some financial support. One day her relative saw an advertisement in a local
newspaper about Arivu education loan. Immediately he informed Bhavya about it, and Bhavya
without losing time visited Kolar District DDUBDC office, enquired about ARIVU loan and
procedures, collected the application form and applied. This was in September, 2017. She
furnished the telephone number of her father and gave her email id.
After applying for Arivu loan she was hopeful that she will get it, as she was confident to get
the loan because of her merit and economic backwardness. After 15 days she received a call
from DDUBDC office on her father’s phone in September, 2017 that she has to appear for a
document verification with all the required documents at District office of DDUBDC. She
successfully got selected for the loan. Finally, in November, 2017 she got her first year’s loan
amount of Rs. 89,000/ through Cheque. Bhavya says “This Helped her and her father a lot
and both were so happy on that day”. Her father was encouraged and got confidence that she
will complete her MBA course. She got the loan amount when she was in the process of
applying education loan at a bank. A benefit of Rupees Eighty-nine thousand was very big help
to her family at that time of need! If she was not getting this, she would have taken education
loan from bank with many hassles and high rate of interest. In the second year, she got 65,000
rupees.
Now she has completed the course and got job after one month of course completion at BPO
with the package of 3.6 lakhs per annum, almost she is getting 27,000 rupees per month. It is
not just the financial support of ARIVU education loan, it has also created a self-confidence
and positive attitude in Bhavya.
Bhavya says: ‘The total annual MBA course related expenditure was Rs. 2,50,000. Arivu
loan was Rs.1,54,000, and the balance of Rs.96,000 was managed through her father’s
earnings and through her part time job’.
She paid first year’s college fees out of his father’s income and by taking loan from relatives.
She repaid the loan taken from relatives after getting ARIVU loan amount. This adjustment
was necessary as the academic year starts from June/July every year, and Arivu cheque was
received in November / December of the year i.e. usually after few months of collage
commencement.

Evaluation of the Arivu Educational Loan Scheme Implemented by D Devaraj Urs Backward Classes
Development Corporation in Karnataka State (2011-12 To 2017-18)
100| Karnataka Evaluation Authority
Bhavya at Present:
She is working in well-established private company, a BPO at Bengaluru. She is earning 27,000
rupees as monthly salary, her food and accommodation, travel and personal expenses amounts
to Rs. 12,000 rupees per month, she is also sending Rs.10,000 to her parents and also supporting
her younger brother and sister for their education. She has a desire to get the good position in
her profession, wants to become a supportive member of her family. She has very much
interested to contribute her sister education in future.
Lessons from the Case:
Output:
1. One educated and good young girl is promoted
2. Promoted young girl for professional work.
3. Contributes to the society as a productive Social & Economic capital
Outcome:
1. From non-earning to earning member of the family (Non-productive member to Productive
Member)
2. Development of career aspiration
Impact:
1. Safe guarded from financial crisis
2. Positive change in the family
3. Contribution to family and society
4. Change in attitude and behaviour of the poor girl.

Empirical Analysis
Karnataka Evaluation Authority | 101
4.13 Comparative Analysis of Arivu Scheme with Similar Schemes from
Other States
Education loan for higher education to Indian Students both within the country as well as for
foreign countries is provided for backward class students under the Union Ministry of Social
Justice, GoI. In one of the recently held meetings of the National Backward caste Financial
and Development Corporation, the Union Minister for Social Justice announced that the
Ministry has hiked the limit of education loan for backward class students and also has waived
interest on loan to girls by 0.5 %. Under this scheme students will get loan of Rs.10 lakh instead
of Rs 5 lakh for higher education within the country. Those going abroad for studies will get
Rs.20 lakh instead of the current Rs.10 lakh. Similarly, girl students will get concession of
0.5% in interest rate on the education loan. The loan interest rate for boys is 4.0 per cent and
that of girls is 3.5%. He mentioned that over 13 lakh students are taking benefit of several
schemes of the corporation [ToI, March 06, 2020, Mumbai].
There is very little evidence about the State sponsored higher education loan schemes in other
states of the country. However, from the available evidences, some insights and inferences
could be drawn.
According to a recent report, the education loan in the banking sector in Kerala State has run
into a major problem. The outstanding education loan has been increasing year by year since
2015 and the NPA of educational loan is skyrocketing to the extent of Rs.2000 crore, which is
in neck to neck with the agriculture loan. It is seen that about 70% of the NPA of educational
loans was with the public sector banks followed by private commercial banks (DH, 2019).
Considering the situation, the Kerala State has launched an education loan support scheme to
bail out those students who are not in a position to repay loan borrowed from the Banks. Due
to liberal policy and procedural guidelines, many students availed bank loans for purpose of
higher studies. However, owing to unemployment and under employment, many students
found it difficult to repay their loans as per time schedule. This resulted in accumulation of
debts by the students and increasing NPA in the Scheduled banks. In order to bail out debt-
ridden students, the State government has launched Education Loan Repayment Support
Scheme for providing repayment support to borrower students. This was announced in the
budget of 2016-17 and 2017-18. The scheme envisages government support to those who
availed of education loan for a period of four years after the repayment holiday. Under this
scheme, education loans sanctioned to students are classified under two categories: - (i)

Evaluation of the Arivu Educational Loan Scheme Implemented by D Devaraj Urs Backward Classes
Development Corporation in Karnataka State (2011-12 To 2017-18)
102| Karnataka Evaluation Authority
education loan non-NPA/Standard Account, and (ii) education loan turned to NPA account on
or before March 2016. Annual repayment loan amount (principal + interest) shared between
the government and the borrower in the specified ratio during the four-year relief period for
the first category. For the second category government will assist the borrower to settle and
close the loan account by paying specified amount as per eligibility.
In Madhya Pradesh, a Higher Education Loan Scheme has been launched to promising students
studying in IITs, IIMs and other such prominent institutions. With this, the MP is set to become
India’s first state to finance students for higher education. Under this scheme, interestingly,
students won’t be asked to furnish any documents to avail the loan or even a bank guarantee.
Only their parents will be required to provide a self-attested certificate stating they don’t pay
any tax and live permanently in the state. The borrower will have to repay the loan amount
within 5 years after completing his/her education.
The Tribal Welfare Department of Andhra Pradesh, under the Ambedkar overseas Vidhyanidhi
offers education loan to the tune of Rs.5.0 lakh from any nationalized bank at prevailing interest
rate to ST students for pursuing PG courses in foreign universities of UK, USA, Canada,
Australia, & Singapore. The AP Scheduled Tribes Cooperatives Finance Corporation, Ltd.,
(TRICOR) coordinates with the nationalized banks in securing the education loan to the
selected candidates.
The Andhra Pradesh State also provides interest subsidy to all education loan borrowers. In
this context, in one of the recently held SBI regional conferences in Guntur, AP, the Bank
managers noted that providing interest subsidy to all education loan borrowers would largely
benefit the students and education sector. They were also of the view that risk weightage on
education loans should be made ‘zero’. In this regard, it was mentioned that the SBI has even
initiated consultations with the field level managers to finalise the policy decisions.
Additionally, the field level managers observed that the students should be mandatorily
provided the information about the education loan scheme while choosing the colleges through
web-based options. It was also felt that massive awareness programmes should be conducted
particularly in rural areas to bring the rural populace to the digital fold (ToI, Aug 19, 2019).

Karnataka Evaluation Authority | 103
5 CHAPTER - 5
FINDINGS, SUGGESTIONS, AND RECOMMENDATIONS
5.1 Major Findings
1. Overall, the state has covered a total of 16,430 BC students under the Arivu Educational
loan programme from the year 2011-12 to 2018-19. Considering the total amount spent for the
programme target of 15,095 and financial allocation of Rs.10,297.71 lakhs, the efficiency in
terms of achievement works out to 108.8 per cent for the former and 83.1 per cent for the latter.
In terms of annual coverage, relatively better performance is noticed for the years 2013-14 &
2015-16. In terms of achievement of targets under the CET category, the scheme reveals
consistently positive performance.
2. Consistent shortfall in the coverage of the most vulnerable caste groups like Nomadic
& Semi-Nomadic, Kumbara, Thigala, Madivala, Savitha, not only suggests the need for re-
examining the program design but also revising the state policy norm itself.
3. Across courses in the 12 sample districts from 2011 to 2015, the BE/B.Tech course
reveals highest coverage, taking a big leap from the year 2016 onwards to boost the
participation of BC students in the most happening professional programme (Engineering) of
higher education sector. This is a commendable achievement. Despite limited coverage of PG,
Medical and non-CET courses, the consistent growth over the years is a reflection of the
increased demand. Considering the fact that BC students constitute large chunk of the general
degree enrolment in rural areas, there is a need to examine the relevance and up scaling of
Arivu loan benefit even to this category of students.
4. Across four BC categories, over the time, the coverage proportion is found to be in
alignment with the overall state distribution norms at the divisional level. However, among
districts, Kolar, Bagalkot, and Uttara Kannada reveal higher coverage for category I and IIA.
In contrast, Bengaluru, Kolar and Uttara Kannada reveal under coverage for category IIA, IIIA
and IIIB respectively. Thus, all through, by default, category IIA emerges as the largest
beneficiary of the programme. This phenomenon is justified in the context of increasing
demand for higher education loan among certain categories in Bengaluru, Mysore districts and
Hyderabad Karnataka region. Although, the demographic composition and spread of the
population in these regions tend to be in alignment with this argument, the fact that some of

Evaluation of the Arivu Educational Loan Scheme Implemented by D Devaraj Urs Backward Classes
Development Corporation in Karnataka State (2011-12 To 2017-18)
104| Karnataka Evaluation Authority
the predominant castes under these categories do not necessarily represent the first-generation
beneficiaries of higher education programmes cannot be trivialised. Therefore, the most crucial
factor in the final selection of the beneficiaries need to be based on the vulnerability and risk
factors among such caste groups rather than merely going by nominal categories. Further, the
number under Non-CET coverage is quite insignificant for different categories. Justification
for not up scaling coverage for these students deserve proper attention.
5. The programme is found to cover 4 girls for every six boys. However, the wide gender
gap in Kalaburgi, Bidar and Belagavi districts indicate the need for increased regional gender
focus under the programme.
6. Overall, a whopping majority (81.7%) of student beneficiaries are seen in the BE
course. Across regions, all divisions present the same trend. It is gratifying to note that even
backward districts such as Bagalkot and Uttara Kannada reveal more than 90.0 per cent of
beneficiaries in the BE programme. Higher visibility of BC students in the most happening and
glamorous programme such as the BE is an indication of positive impact of the Arivu
programme, yet the fact whether the state has ensured proper targeting of the BC students from
the most vulnerable castes and there is no slip-up in the coverage of the neediest and deserving
students is worth probing.
7. Overall, 58.0 % of the beneficiary households do not own land, suggesting presence of
vulnerability and deprivation factors. Landless status is higher in case of Bengaluru (73.0%)
and Belagavi (60.0%) divisions. Districts like Bengaluru Urban, Bagalkot, Belagavi, Uttara
Kannada, Kodagu and Mysore reveal higher proportion of landless beneficiaries. Similarly,
Category IIIB reveals higher proportion of landless beneficiaries. However, even regions such
as Kalaburgi and Mysore divisions, though reveal higher proportion (75.0 to 80.0 per cent) of
beneficiaries having landholdings, it is to be noted that largely it is dry land, which may not
guarantee productive income. Thus, the vulnerability factor may get reinforced even for dry
land-owning beneficiaries.
8. The presence of vulnerability factor for the BC students is also reflected in terms of
absence of various facilities, gadgets and assets in the household. Except for mobile phone,
only around 20.0 per cent of the beneficiaries are found to possess various facilities and
gadgets. Refrigerator, Internet and Car seem to be a rare possession for many households.

Findings, Suggestions, And Recommendations
Karnataka Evaluation Authority | 105
9. Largest chunk (63.2%) of beneficiaries is found to be studying in private unaided
colleges. This may be an obvious trend considering the fact that higher education is
predominantly offered by the private sector in the state. Further, the selection and choice of the
college type is also determined by the CET rank position of the student. This phenomenon,
however is noteworthy and further the Arivu programme facilitating this trend is even more
promising. On further probing the choice of private unaided colleges among the beneficiaries,
it is seen that father’s educational attainment is found to determine the choice of college rather
than their income or occupation.
10. Beneficiaries are found to be satisfied in so far as mode of loan payment is considered.
The programme is seen efficient in terms of easy accessibility (82.0%). An overwhelming
majority (94%) feel convenient in accessing and submitting on-line application. In terms of
timely release of loan, large majority (87.3%) report in affirmative. However, in districts like
Bellary and Kolar, the trend appears to be discouraging with considerable proportion reporting
in negative. Of the procedural difficulties involved in obtaining Arivu education loan, overall,
highest proportion (44.3%) report about ‘providing surety’ as the most difficult aspect,
followed by ‘providing affidavit’ (32.5%) and ‘submitting different documents’ (28.4%).
These have emerged as the most difficult tasks across most districts.
11. An overwhelming majority (94.51%) have utilized the loan amount for education
purpose. The programme is found to have greater benefit and utility value as it is useful in
mitigating students’ financial hardships and burden to the family. More than 96.0 per cent of
the beneficiaries are in strong agreement about benefit of Arivu loan in terms of providing them
a ‘temporary reprieve from the financial hardships’ and in ‘increasing their levels of
‘confidence and self- esteem’. Similarly, ‘enhanced motivation to complete the course’ (over
88.0 per cent) ‘campus placement’ (over 70.0 per cent) have also emerged as other accrued
benefits. While the loan amount is found to be sufficient by and large, a need has been felt for
enhancement for medical students considering the heavy expenses incurred by them.
12. An encouraging feature, suggestive of positive impact of the Arivu programme is the
course completion ratio with 46.5 per cent of the beneficiaries, of which highest proportion is
in PG courses (82.8%) followed by BE course (46.3%). While the programme is found to reveal
absolute positive impact in terms of course completion for category IIA beneficiaries, for
category IIIB, it is the other way round. This category also reveals highest incidence of dropout

Evaluation of the Arivu Educational Loan Scheme Implemented by D Devaraj Urs Backward Classes
Development Corporation in Karnataka State (2011-12 To 2017-18)
106| Karnataka Evaluation Authority
with 14 out of the total 23 dropouts hailing from this category. Mysore division reveals
relatively higher rate of positive impact with respect to course completion ratio.
13. Overall, the programme seems to impact boys and girls almost equally in terms of
course completion ratio. However, when regional dimension is added, different patterns seems
to emerge. Kolar and Kodagu districts reveal far higher positive impact on female students than
male students. While Kodagu’s performance may be attributed to the favourable female ratio
in the district, the same will not hold good in case of Kolar district, considering its laggard
status in terms of educational development. Bengaluru urban district reveals better picture for
girls as compared to their counterparts in districts like Bagalkot, Uttara Kannada, Kalaburgi,
suggesting disparate impact of the programme on girls, when regional dimension is added.
14. With respect to programme’s impact on employment, a higher proportion of
beneficiaries is found to be unemployed (58.1%) as compared to employed (41.5%). Category
IIA reveals highest level of unemployment (60.0 per cent). The trend appears obvious as this
category receives highest coverage (54%) under the programme. Across courses, barring the
general degree and the medical programme, which have very small samples, unemployment
rate is higher among PG beneficiaries (66%) followed by BE graduates (57%). Further, as
revealed by the regression analysis, the programme is found to significantly influence
employment of beneficiaries in Bengaluru division, male beneficiaries, and of those in
government colleges. Quite significantly, loan repayment behaviour is found to increase with
employment status.
15. A variety of factors seem to contribute to delay in getting job. The most common reason
as reported by more than half of the sample beneficiaries is found to be ‘lack of job
opportunities. Additionally, 23.0 per cent beneficiaries report that they could not succeed in
the interviews. The trend suggests not only the need for better planning strategies but also for
putting in place effective curricular strategies at the college level.
16. Highest proportion of beneficiaries are holding engineering jobs as engineering
graduates happen to constitute a major chunk in the study sample, and most of them (56.84%)
are working in Bengaluru and within Karnataka (35.9%).
17. The monthly earnings of the highest proportion (48%) of the employed beneficiaries
fall between 15k to 25k. Bengaluru urban and Mysore districts reveal contradictory trends in
terms of spread of high and low wage earners in the opposite quartiles. Interestingly, districts

Findings, Suggestions, And Recommendations
Karnataka Evaluation Authority | 107
in North Karnataka region reveals presence of beneficiaries earning highest salary of 30k+ per
month, although the number is very small. Bengaluru urban job market does not seem to
support high salary as not a single beneficiary is represented in the category of 30k+ salary
range.
18. By and large most beneficiaries are found to be aware of eligibility criteria, selection
criteria, application procedure and documents to be submitted. However, across districts in
Kolar, Belagavi, Bellary, Mysore and Uttara Kannada, unacceptable proportion of partial
awareness is seen.
19. It is seen that CET beneficiaries incur an annual expenditure of over Rs. 2.0 lakh per
student. The same for non-CET beneficiary is over 1.80 lakh per student. Quite interestingly,
Bengaluru division reveals lowest expenditure (1.67 lakh). Across districts, Kodagu reveals
highest expenditure (Rs 4.1 lakh+). Strangely, all three districts in Belagavi and Mysore
divisions reveal far higher expenditure than Bengaluru urban district. In case of non-CET
beneficiaries, Mysore district reveals an expenditure of Rs.3.7 lakh+, higher than even for CET
beneficiary. Strangely, Bengaluru Urban and Kalaburgi districts reveal far higher expenditure
as compared to CET beneficiaries.
20. Overall, a CET beneficiary will be required to meet a gap of Rs.38,929.85 per annum
during the study period, when the difference between the Arivu loan amount received and the
expenditure incurred is computed. Across divisions, strangely, it is the Kalaburgi division,
which reveals highest gap of Rs.74,984, which is way higher than even Bengaluru division
(Rs.62,207). The lowest gap of Rs.12,922 is seen for Mysore division and a slightly higher gap
of Rs.14,191 is noticed for Belagavi division. Across districts, it is Kolar which reveals rather
unacceptably higher gap of Rs.97,215. In Kalaburgi division, barring Bellary district, both
Kalaburgi and Bidar reveal more than Rs.88,000 gap. Since these are reported figures, the
likelihood of over reporting may not be ruled out. Quite interestingly Shivamogga district
reveals positive difference in the gap suggesting lesser expenditure incurred as against the loan
availed in the year. Mysore, Kodagu, Bagalkot and Uttara Kannada, all of these districts reveal
lower gap of difference between Rs.25000 to 32000.
21. With respect to repayment status of Arivu loan, only 101 out of 549 eligible
beneficiaries have repaid, which works out to 18.4 per cent. Across districts, Hassan and
Bellary reveal 53.13 per cent of the beneficiaries and 47.37 per cent of beneficiaries repaying

Evaluation of the Arivu Educational Loan Scheme Implemented by D Devaraj Urs Backward Classes
Development Corporation in Karnataka State (2011-12 To 2017-18)
108| Karnataka Evaluation Authority
indicating relatively better performance. Loan repayment is good from Bidar and Kodagu
districts being 37.4 percent and 37.5 percent respectively. It is very poor in Bengaluru Urban
district (1.49 %). Across categories, loan repayment is much better in the case of category III
B beneficiaries, 30 percent of them are repaying the loan. Low level of repayment is seen both
in case of category I and category IIA, the latter being largest beneficiaries of Arivu
programme.
22. It is seen 97 beneficiaries have taken loan from other sources. This works out to a small
percentage of 8.6. Across region, Belagavi, Kolar, Mysore and Uttara Kannada districts reveal
more than 10.0 percent of the beneficiaries taking loan from other sources suggesting relatively
higher financial constraints. Largely banks and money lenders have emerged as the main
source of loan financing as reported by 34.0 percent and 25.0 percent of the Arivu beneficiaries
respectively. While bank loans are raised in Bengaluru Urban district, private money lenders
are characteristic of Mysore district.
5.2 Suggestions and Recommendations
1. Considering the greater utility value and higher benefit accrued to backward class
students, it is recommended that the ARIVU programme may be continued further. It is
also recommended that the programme may further be extended to backward class
students in general degree programmes of higher education.
2. As the coverage and targeting under specific BC communities such as Nomadic &
Semi-Nomadic, Savitha, Kumbara, Thigala, Uppara reveal huge shortfalls, the State needs to
seriously examine the way programme has been designed to reach out to these most vulnerable
households, particularly the first-generation families.
3. Considering low visibility of girls in the Arivu programme, it is strongly
recommended that the programme may consider giving priority to girls to the extent of
30.0 per cent, particularly in backward regions.
4. As the programme is seen to favour beneficiaries largely from urban and semi-urban
regional backgrounds, it is recommended to enhance target for rural beneficiaries so as to
bring them on par with their urban counterparts.

Findings, Suggestions, And Recommendations
Karnataka Evaluation Authority | 109
5. While it is necessary to re-examine the rationale and mechanism for fixing targets and
allocations to improve overall reach and coverage, district specific strategies may be employed
for fair and unbiased selection of beneficiaries.
6. Failure or constraints in adhering to the prescribed representation norm take us to the
much larger question of availability of supply pool data at disaggregate levels, which can give
us a fair estimate of the number of students available under the most vulnerable categories.
Needless to mention that such a database will have to be generated at the district level taking
into account the demographic composition of the region and the education development index,
which will not only reveal category (caste) wise student data base at various educational levels
but also spatial distribution of educational infrastructure. There is need for benchmarking data
systems and to develop proper baseline datasets to track the progress and impact of any given
programme over the time. Such a system would enable the governments to justify public
resource investments as well as achieving various developmental goals. In the light of this, it
is recommended that the DDUDBC may consider establishing a statistical unit in
collaboration with the education department for not only generating statistical database,
but also for proper monitoring and assessment of various education programmes.
7. Presence of large number of student beneficiaries from the BC in the most glamorous
course like Engineering can be justified from the point of enhancing access and promoting
economic mobility among this population segment, yet there are more important questions
which come to the fore. For instance, questions such as what is the nature of backwardness and
the nature of vulnerability among these students and most importantly how many of them are
really first-generation engineers assume crucial significance. Therefore, the department may
consider this criterion as well while selecting beneficiaries under various categories.
8. In the light of beneficiaries reporting about difficulties experienced in terms of providing
surety, affidavits and several documents, it is necessary for the department to streamline
and simplify some of these procedures so as to make it convenient and friendlier. Therefore,
it is recommended that the present system of giving ‘witnesses’ may be replaced with
alternative authentic proof system provided by beneficiaries own families.
9. In view of the higher expenditure incurred by the beneficiaries in certain courses, it is
recommended that the present loan amount may be enhanced to 2.0 lakh per annum
for medical education courses.

Evaluation of the Arivu Educational Loan Scheme Implemented by D Devaraj Urs Backward Classes
Development Corporation in Karnataka State (2011-12 To 2017-18)
110| Karnataka Evaluation Authority
10. The incidence of large-scale non-payment of loan among beneficiaries is a serious issue.
While unemployment appears to be the key factor for default, there are also instances of
non-repayment even among the employed beneficiaries. Considering the fact that some
students do face financial constraints and have genuine reasons for loan repayment
immediately after three months of course completion, it is recommended that the waiting
period for loan recovery may be extended for one year from the date of completion to
enable those seeking employment. Alternatively, the department may consider
decreasing interest rate to enable loan recovery from those who experience serious
constraints. On the other hand, for those already employed, some serious disciplinary
actions may be invoked for loan recovery.
11. The DDUBCD Corporation is required to step up its information dissemination strategy in
backward districts like Bagalkot, Belgaum, Bellary, Mysore and Uttara Kannada.
Similarly, awareness strategies about the Arivu scheme and the administrative support
system may be strengthened for better reach and coverage of beneficiaries in such backward
districts.
12. It is noticed that the department has a weak monitoring system to review and take stock of
the programme. It is therefore strongly recommended that the department has to step
up its district level monitoring of the programme in terms of tracking the loan
beneficiary and upkeep of the record through the use of digital software systems.
13. Loan in the first semester / year can be given to the college. But from the second year
onwards, it can be given at the time of paying college fees. Students can pay the loan
amount to college as fees. This will reduce the burden on students’ parents of mobilizing
the fees amount.
14. Further research, preferably case studies may be initiated to understand and identify region
specific variables impacting education among backward class students.

Karnataka Evaluation Authority | 111
ANNEXURE
IDIs (In-depth Interviews) and
FGDs (Focused Group Discussions) Analysis
We have used the qualitative information / data collected through IDS and FGDs in the report
wherever it was appropriate to use. In this section, we are presenting the views / opinions of
different stakeholders gathered / collected through IDIs and FGDs.
In total, 40 IDIs were conducted (As per TOR). The details are:
• District Managers / Member secretaries = 12 (one each in 12 districts)
• District level line department officials = 12 (one each in 12 districts)
• CEOs of Zilla Panchayat = 12 (one each in 12 districts)
• State level Officials = 4 (DDUBCDC and KEA).
From Annexure Table 1 below, responses from different stakeholders can be seen.

Evaluation of the Arivu Educational Loan Scheme Implemented by D Devaraj Urs Backward Classes Development Corporation in Karnataka State (2011-12 To 2017-18)
112| Karnataka Evaluation Authority
Annexure Table 1 – IDI responses to Key questions
Key
Questions
District Managers and
B.C. Corporation
District level
line
department
officials
CEOs, ZPs
State level
Officials and
KEA officers
Remarks
Continuation of ARIVU Loan Yes Yes Yes Yes
It is very useful for
course completion by
BC students.
Upscaling & extending Arivu
coverage - - - Yes -
Beneficiary selection procedure –
problems & issues
Document verification and
submission of original documents by
the applicants on time.
Excess of application, Distribution
of application into category wise will
be difficult-less amount of budget,
high demand, physical target should
be based on district requirement
Failing to producing required
security deposit papers on time
Lack of applications to get the
approval from selection committee
Loan amount releases after
admission.
-
Central office will be fixed the
physical target, as per that
requirements, committee will
decide the loan sanction
Based on the other back ward
population, central office will
give the physical and financial
targets to the districts
Physical and Financial targets
will be assigned by Central
office, as per 70 and 30
percent criteria
As per scheme criteria, Cat- I
and Cat-II 70%, Cat-IIIA, Cat-
IIIB, 30% candidates are
selected.
AS per roster and scheme
guideline and based on CET
ranking candidate identified
No -
Adequacy of loan amount - - - Adequate for all
except for -

ANNEXURE
Karnataka Evaluation Authority | 113
medical
education, which
can be increased.
Benefit & usefulness of loan to BC
Students - -
Based on the current demand
the sanctioned budget is not
sufficient.
Yes -
Present loan granting Procedure
Action plan by head office during
April to May, central server based
online application usually notified
during July to August, September.
publicizing the notification and
receiving the application and put the
same infront of the committee
Online application, that will handle
by central office
- - - -
Knowledge & publicity strategy
currently in use
Creating awareness about the
scheme and giving wide publicity in
the local and regional newspaper
Issuing the newspaper notification,
posting at college notice board,
conducting committee meeting
- - To be improved -
Loan recovery procedure/measures
for improving efficiency - - -
Not fully
satisfied -
Further, the details about FGDs can be seen from Annexure Table 2 below.
Total Number of FGDs conducted are 16 (as per TOR):
FGDs for student beneficiaries = 12 (one FGD each in 12 districts)
FGDs at the college level = 4 (one college each in 4 divisions)

Evaluation of the Arivu Educational Loan Scheme Implemented by D Devaraj Urs Backward Classes Development Corporation in Karnataka State (2011-12 To 2017-18)
114| Karnataka Evaluation Authority
Annexure Table – FGD Analysis
Key
Questions/issues FGDs at the college level FGDs for student beneficiaries
Beneficiary selection procedure –
problems & issues -
Loan was not given on time.
Loan amount was not sufficient to
Feasibility of Continuation of ARIVU
Loan - It should be continued and given to all BC students.
Up scaling & extending loan befit to
non-CET
Not on time, usually colleges will start in the month of July to
august, if they sanctioned the loan by September that will be
good.
Loan amount has to be increased.
Loan amount should be given all BC students who satisfy the
criteria.
Loan amount was not sufficient to pay fee.
Adequacy of loan amount - Loan amount was not sufficient to pay fee.
Benefit & usefulness of loan to BC
Students
Very essential and beneficial scheme.
Yes, it is one of the most useful schemes, in order to get higher
education among backward class students and it will relax in the
financial issues.
Yes, it is useful, those who unable to adjust the fee they can get
the loan.
It is very useful. It has increased my confidence level and
moral strength. It has reduced family financial burden. It
has helped to complete education without any barrier. It
has helped in getting campus selection and recruitment. It
has increased my financial condition and societal
condition
Present loan sanctioning Procedure
As per merit and economic condition and based on documents
Based on CET and scheme criteria
-
Knowledge & publicity mechanisms
-
Collage noticeboard, Website, Newspaper, Radio, TV,
Friends, and Family Members.
Loan recovery procedure/enhancing
efficiency
-
-

Karnataka Evaluation Authority | 115
BIBLIOGRAPHY
Barr & Crawford, 2005 –Barr N,. & I Crawford 2005. Financing Higher Education: Answers
from the UK. First Edition, Routledge, NY
Chapman B, 2006. Government Managing Risk: Income Contingent Loans for Social &
Economic Progress,. First Edition, Routledge, ISBN-10:1134444338, pp 240
Chattopadhyaya S, 2007, Exploring alternative sources of financing higher education, EPW
Oct 20, pp 4251-59
Chingos, Matthew M. 2016 “who would benefit most from free college?”
Brookings Report, USA based on excerpts from Kalamazoo Promise, Michigan;
http://blog.ominox.org/should college-be-free/).
Christie, H & M Munro 2003: The Logic of Loans: Students’ perceptions of the costs and
benefits of the student loans British journal Of Sociology, Education 24:621-636.
DOI:10.1080/0142569032000127170
Daniel Rivero,2017 [“The debt trap: how the student loan industry betrays young Americans
“The Guardian” ; https://amp.the guardian.com/money/2017/sep/06/]
Debi S 2010. Loan financing to higher education: Experiences of Bank financing in a less
developed region, CMDR Monograph Series No.56, CMDR, Dharwad
Douglas A.Webber, 2016- Are college costs worth it? How ability, major, and debt affect the
returns to schooling, Economics of Education Review53 (2016)
Douglas Webber, Temple University. May 23, 2017: Inequality, Colleges & Universities,
Scholars Strategy Network; http://doi.org/10.1016/j.econedurev.2016.04.007)
Hongwei Yu, Univ of Texas, Austin: At Issue: the Relationship between Student Loans and
Low Income Students’ Baccaulaureate Attainment: A Literature Review. The Community
College Enterprise, Spring 2014 [https://www.researchgate.net/publication/281686878]. Even
in the US the degree completion rates among low income

Evaluation of the Arivu Educational Loan Scheme Implemented by D Devaraj Urs Backward Classes
Development Corporation in Karnataka State (2011-12 To 2017-18)
116| Karnataka Evaluation Authority
Jason Delisle “Two Student loan studies everyone missed” Brookings Report, Dec 7, 2017; in
a novel research study released by Constantine Yannelis of New York University (2016),
Johnstone, D.B., and P.N. Marcucci. 2010. Financing higher education worldwide: Who
pays? Who should pay? Baltimore: Johns Hopkins University Press. Particularly Chapters 6
and 7.Google Scholar
John F Brugel. Gary P.Johnson, Larry L.”the demand for student loans in higher education: A
study of preferences and attitudes” Research in Higher Education, March 1977, vol.6 (i)pp 65-
83-
Monica Bhole (2006), Federal Grad PLUS loan program affected private lending for graduates
and professional schools. [https://www.brrokings.edu/reseach/two student –loan studies –
everyone-missed/]
National Bureau of Economic Research Paper, 2018 “The end of free college in England:
implications for quality, enrolments & equity” nber.org/papers/w23888.
NFSAS and undermined its recovery ratio (“George Hull, University of Cape Town, 2016”;
the conversation.com/amp/-66145).
Nicholas Barr (London school of economics and political science) - “University fees: how to
structure a system that benefits poor students” {the conversation.com. https://the
conversation.com/university-fees-how- to- structure-a-system-that-benefits-poor-students-
49675)
Nico Cloete [ http://the conversation.com / Sep 28, 2016/the wrong questions are being asked
in the free higher education debate -66085].
Ravindra Dholakia, Vijaya Sherry Chand, Rajeev Sharma (oct 26, 2016), https://www.
livemint.com/Opinion --Financing Higher education-Livemint
Senjuti Patra, Tridip Ray, Arka Roy Chaudhury, 2017: Impact of Educational Loans on Higher
Education: The Indian experience, ISI, ND,
Shen, Hua, and A. Ziderman. 2009. Student loans repayment and recovery: International
comparisons. Higher Education 53 (3): 315–333

ANNEXURE
Karnataka Evaluation Authority | 117
Srinivasan, R & D Das 2011, Analysis of education loan: A case study of national capital
territory of Delhi. International Journal of management strategy
Tilak, JBG, 2004. Public subsidies education in India, EPW, 39: 343-359
Usher A 2004, Are the needy poor? Distribution of student loans and grants by family income
quantile in CanadaEducation policy Institute, Canada
Usher, A 2005Global Debt partterns: an international comparison of student loan burdens and
repayment conditions, First edition, Educatioanl policy institute, Canada
Woodhall M 2007, Funding higher education: the contribution of economic thinking to debate
and Policy development, Education working paper Series No.8, WB Washington DC
Ziderman, A 2002, Financing Student Loans in Thailand: Revolving full or open ended
commitment? Economic Education Review 21; 367-380 DOI:10.1016/50272-7757(01)00024-
3
Ziderman, A. 2002. Alternative objectives of national student loan schemes: Implications for
design, evaluation and policy. The Welsh Journal of Education 11 (1): 37–47.Google Scholar
Ziderman, A. 2013. Student loans schemes in practice: Global perspectives. In Student
financing of higher education: A comparative perspective, International studies in higher
education series, ed. D.E. Heller and C. Calendar. New York: Routledge. Google Scholar
Ziderman, A, and M. Bevc (Eds.). 2009, Financial support to students through student
loans, European centre for higher education (CEPES) [Special issue]. Higher Education in
Europe, 34(2).Google Scholar
Ziderman, A., and International Institute for Educational Planning. 2004. Policy options for
student loan schemes: Lessons from five Asian case studies. Paris: UNESCO.Google Scholar
Ziderman A. (2017) Experience with Student Loans, Higher Education. In: Shin J., Teixeira P.
(eds) Encyclopedia of International Higher Education Systems and Institutions. Springer,
Dordrecht].


Karnataka Evaluation Authority | 119
APPENDIX
Questionnaire / Schedule
PART-A (Beneficiary)
Particulars Response
1. Name of the
Beneficiary
2. Mobile/email Mobile E-mail
3. Gender 1. Male 2. Female 3. Transgender
4. Age (in
completed years)
21 2
2
23 24 25 2
6
27 28 28+
5. Marital Status 1.
Single
2. Married (ask question
numbers 65 and 66)
3. Others (Specify)
6. Father’s Name
7. Residence: 1. Urban 2. Rural 3. Semi-urban
8. Religion 1. Hindu 2.
Musli
m
3.
Christian
4. Jain 5.
Bud
dhis
t
6. Sikh 7. Others
9. Caste
10. BC Category I IIA IIIA IIIB
11. Course
studied /
studying@ (Gen
degree)
1. BA 2. BSc 3.
B.
Co
m
4. BCA 5. BBM 6.
Others
12. Course
studied /
studying@
(Professional)
1.
BE/BTech
2. MBBS 3.
BS
c
Ag
4. BVSc 5. MBA 6. Others
13. Year of
Enrolment for the
course
(actual)
2011-12 2012-13 2013-14 2014-15 2015-16 2016-
17
2017-18
14.Year of
Completion of the
course
2013-14 2014-15 2015-16 2016-17 2017-18 2018-19
15. CET / Non-
CET
1. CET 2. Non-CET
16. College where
studied / studying
1. Govt 2. Pvt
Aided
3. Pvt.
Unaided
4. Deemed 5. Autonomous 6. Others
17. Study
Arrangements:
1. Daily
Commu
ting
2. Staying
at Hostel
3. At PG
rental
4. Relative’s
house
5. Rental
house -
sharing
6. Others
18. Total Arivu loan Availed:
2011-12 Rs.
2012-13 Rs.
2013-14 Rs.

Evaluation of the Arivu Educational Loan Scheme Implemented by D Devaraj Urs Backward Classes
Development Corporation in Karnataka State (2011-12 To 2017-18)
120| Karnataka Evaluation Authority
2014-15 Rs.
2015-16 Rs.
2016-17 Rs.
2017-18 Rs.
19. Mode of Loan Disbursement:
2011-12 1. Cheque 2. Online
2012-13 1. Cheque 2. Online
2013-14 1. Cheque 2. Online
2014-15 1. Cheque 2. Online
2015-16 1. Cheque 2. Online
2016-17 1. Cheque 2. Online
2017-18 1. Cheque 2. Online
20. Number of Instalments:
2011-12 1. One 2. Two 3. Three
2012-13 1. One 2. Two 3. Three
2013-14 1. One 2. Two 3. Three
2014-15 1. One 2. Two 3. Three
2015-16 1. One 2. Two 3. Three
2016-17 1. One 2. Two 3. Three
2017-18 1. One 2. Two 3. Three
21. Loan Amount Repaid:
2011-12 Rs.
2012-13 Rs.
2013-14 Rs.
2014-15 Rs.
2015-16 Rs.
2016-17 Rs.

Appendix
Karnataka Evaluation Authority | 121
2017-18 Rs.
22. Total Arivu Loan Taken for the Whole Study Period (Rs):
23. Total Arivu Loan Amount Outstanding (Rs):
24. Did you utilize the Arivu loan amount only for the course for which it was sanctioned?
1. Yes 2. No 3. If no,
A. I changed the course as it was difficult to pass
B. The course for which loan was sanctioned, was not job oriented
C. It was not interesting to me
D. Others (specify)
25. Year-wise exams passed with percentage of total marks obtained
1. Year 2. Course
3. Semester/Annual exam 4. Percentage/ Marks
obtained
26. How did you utilize the ARIVU loan money?
• For educational purpose
• Other course related expenditure
• Other personal related expenditure
• For family needs
• Others (specify)
27. Did you take any other loan (other than ARIVU) for your studies?
1) Yes 2) No
3) If yes,
a) Source: 1. Banks 2. Money Lenders 3. Friends 4. Others (Specify)
b) Loan Amount (Rs): 1. Banks……… 2. Money Lenders……….
3. Friends…………….. 4. Others
(Specify)…………………

Evaluation of the Arivu Educational Loan Scheme Implemented by D Devaraj Urs Backward Classes
Development Corporation in Karnataka State (2011-12 To 2017-18)
122| Karnataka Evaluation Authority
c) Rate of Interest: 1. Banks…….. 2. Money Lenders…….3. Friends…….4. Others
(Specify)
d) Loan Amount outstanding (Rs):
1. Banks…………….. 2. Money Lenders………… 3. Friends…………..
4. Others (Specify)………………………………………
28. Have you received any other financial support from the Government or others for your
education?
1. Yes 2. No
3. If Yes
a) Source:
1). State Govt. 2) Central Govt. 3) NGO 4) Philanthropist 5) Others (specify)
b) Amount (Rs):
1). State Govt……….. 2) Central Govt………… 3) NGO…………….
4) Philanthropist……………… 5) Others (specify)………………
29. How much money (Rs) on an average per year did you spent for the following related to
your education (Rs):
Break-up:
1. Fees (Rs)……………….. 2. Source:
1. Accommodation (Rs)……………… 2. Source
1. Food (Rs)……………. 2. Source
1. Travel (Rs)………… 2. Source
1. Private Tuition (Rs)………… 2. Source
1. Purchase of Computer (Rs)………… 2. Source
1. Project Work (Rs)…………… 2. Source
1. Others (Rs)…………. 2. Source
30. Awareness of the beneficiary about the Arivu scheme (open-ended):
31. How did you come to know about ARIVU scheme?
• College notification
• dept. notification on the website

Appendix
Karnataka Evaluation Authority | 123
• newspaper
• Radio announcement
• Television advertisement
• friends
• family members/relatives
• others (specify)
32. Authority / departments involved for Sanctioning and release of Arivu Loan (open-ended)
33. Departments involved in selection of the beneficiary (open-ended)
34. Whether on-line application format easily accessible? 1. Yes 2. No
35. Was the format of application convenient to fill in? 1. Yes 2. No
36. Selection list announcement procedure
1) Fully aware 2) to some extent 3) not at all aware 4) neutral
37. Procedure for applying for the loan scheme?
1) Fully aware 2) to some extent 3) not at all aware 4) neutral
38. Documents required to be submitted
1) Fully aware 2) to some extent 3) not at all aware 4) neutral
39. Eligibility criteria for receiving the loan
1) Fully aware 2) to some extent 3) not at all aware 4) neutral
40. Loan amount and releasing procedure
1) Fully aware 2) to some extent 3) not at all aware 4) neutral
41. Interest rate on the loan
1) Fully aware 2) to some extent 3) not at all aware 4) neutral
42. Loan Repayment Schedule & conditions
1) Fully aware 2) to some extent 3) not at all aware 4) neutral
43. Was the loan released on time? 1. Yes 2. No
44. Details about the petty expenditure incurred by you for getting the educational loan
sanctioned

Evaluation of the Arivu Educational Loan Scheme Implemented by D Devaraj Urs Backward Classes
Development Corporation in Karnataka State (2011-12 To 2017-18)
124| Karnataka Evaluation Authority
1. Travel 2. Rs.
2. Procuring required documents 2. Rs.
3. Food 2. Rs.
4. Payments (bribe) to officials, if any 2. Rs.
5. Others (specify) 2. Rs.
6. Total 2. Rs.
45. Which procedural items were most difficult (Rank them):
1. Procuring the application
2. Filling the application
3. Documents to be submitted
4. Giving Affidavit
5. Giving Surety
6. Others (specify)
46. Are you aware about loan waiving for students receiving loan before 2013?
1. Yes 2. No
47. Have you availed this benefit? 1. Yes 2. No
48. Has any of your sibling/s also been a recipient of ARIVU loan schemes?
1. Yes 2. No
3. If yes,
A. Brother-1
a) Amount Received (Rs)…………. b) loan amount outstanding (Rs)………….
B. Brother-2
a) Amount Received (Rs)………….. b) Loan amount outstanding (Rs)……………
C. Sister-1

Appendix
Karnataka Evaluation Authority | 125
a) Amount Received (Rs)………….. b) Loan amount outstanding
(Rs)…………………
D. Sister-2
a) Amount Received (Rs)…………… b) loan amount outstanding
(Rs)…………………
(For Alumni Only)
49. Current
Occupation*
1 2 3 4 5 6 7 8 9 10
50. Date of
joining the job
2013 2014 2015 201
6
2017 2018 2019
51. Place of
work at present
1. Within
Karnataka
• Outside
Karnataka
• Within Bengaluru • Outside
Bengaluru
52. Total
Monthly
Earnings/Salary
/ /Income
(Rs)**
1 2 3 4 5 6 7
53. Average
Monthly living
Exp. (current)
Rs***
1 2 3 4 5 6
54. Did you get the job immediately after completing your education?
1. Yes 2. No
(a) If no, how many months were taken to get the job?
1) < 6 months 2) 6 to 12 months 3) 12 to 18 months 4) 18 to 24 months 5) > 24
months
(b) Reasons
1). No job opportunities 2) could not succeed 3) did not try 4) had no money to pay
(bribe)
55. Did anybody help you in getting the job? 1. Yes 2. No
If yes, who?
1). Friends 2) Relatives 3) Officials 4) Politicians
Evaluation of the Arivu Educational Loan Scheme Implemented by D Devaraj Urs Backward Classes
Development Corporation in Karnataka State (2011-12 To 2017-18)
126| Karnataka Evaluation Authority
56. Were you required to pay any money (fees) for getting the job? 1. Yes 2. No
3. If Yes, how much? 4. To whom?
57. Were you required to pay any money (bribe) for getting the job? 1. Yes 2. No
3. If Yes, how much? 4. To whom?
58. How and in what particular way the Arivu loan scheme has helped you in your college
education?
1) Increased my confidence level and boosted my morale
a) Strongly agree b) agree c) neutral d) disagree e) strongly disagree
2) Has decreased financial burden of my family
a) Strongly agree b) agree c) neutral d) disagree e) strongly disagree
3) Successful completion of my college education without any interruption
a) Strongly agree b) agree c) neutral d) disagree e) strongly disagree
4) On campus recruitment benefit and getting a job
a) Strongly agree b) agree c) neutral d) disagree e) strongly disagree
5. Enhanced my economic mobility and family social status
a) Strongly agree b) agree c) neutral d) disagree e) strongly disagree
6. Any other (specify)
a) Strongly agree b) agree c) neutral d) disagree e) strongly disagree
59. What other Govt. facility /support you think could have helped you in your educational
achievements?
1). Free hostel facility 2) Transportation allowances 3) Food allowances 4) others
(specify)
60. Did you help/ support financially your brothers and sisters in their education and in getting
employment?
• Yes 2. No

Appendix
Karnataka Evaluation Authority | 127
61. How would have you completed your education in the absence of ARIVU loan?
(i) My parents would have borne the expense of my education
(ii) Would have taken other bank loan
(iii) My relatives and friends would have helped me
(iv) Would have depended on local moneylenders
(v) It would not have been possible to complete
62. How much money (Rs) are you giving / sending to your parents / guardians every Month?
1. < 500 2. 500-1000 3. 1000-2000 4. 2000-3000 5. 3000 >
63. How much of your salary are you saving per month, other than giving to your parents /
guardians?
1) 10 % 2) 20 % 3) 20 % >
64. What are the other sources of income to you?
1. Agriculture 2. Rent from buildings 3. Interest on deposits
5. Returns on investments 5. Spouse’s income 6. Others (specify)
65. Is your spouse working? 1. Yes 2. No
• If yes, nature of job
1. Govt. 2. Private 3. Others (specify)
66. Where are your children studying?
Sl.No 1. Name of the child 2. Type of institution
(Govt/private)
4. Mode of travel
67. What are your views on ARIVU education loan? (Your experience, shortcomings,
hassles, was sufficient or not, improvements to be made) (Open-ended)

Evaluation of the Arivu Educational Loan Scheme Implemented by D Devaraj Urs Backward Classes
Development Corporation in Karnataka State (2011-12 To 2017-18)
128| Karnataka Evaluation Authority
PART II – For the Family
1. Members of the Family
a) Number of adults (19 to 59 years): 1. Males………….. 2. Females…………….
b) Number of Children (up to 18 years of age):1. Males………….. 2. Females…………….
c) Number of Physically Challenged: 1. Males………….. 2. Females……………
d) Number of persons with old age (60 + years): 1. Males…………..2. Females……………
e) Total Family Members 1. Males………….. 2. Females……………
2. Education background of the family members
i) Name of the member-1…………………………………………………………….
a) Male b) Female
ii) Education Background:
a) SSLC b) PUC c) Degree e) P.G f) Technical g) BE h) MBBS i) Dental j) Others
iii) Status:
a) Completed b) Drop-out
i) Name of the member-2………………………………………………………………..
a) Male b) Female
ii) Education Background:
a) SSLC b) PUC c) Degree e) P.G f) Technical g) BE h) MBBS i) Dental j) Others
iii) Status:
a) Completed b) Drop-out
i) Name of the member-3………………………………………………………………..

Appendix
Karnataka Evaluation Authority | 129
a) Male b) Female
ii) Education Background:
a) SSLC b) PUC c) Degree e) P.G f) Technical g) BE h) MBBS i) Dental j) Others
iii) Status:
a) Completed b) Drop-out
i) Name of the member-4…………………………………………………………………
a) Male b) Female
ii) Education Background:
a) SSLC b) PUC c) Degree e) P.G f) Technical g) BE h) MBBS i) Dental j) Others
iii) Status:
a) Completed b) Drop-out
i) Name of the member-5………………………………………………………………….
a) Male b) Female
ii) Education Background:
a) SSLC b) PUC c) Degree e) P.G f) Technical g) BE h) MBBS i) Dental j) Others
iii) Status:
a) Completed b) Drop-out
3. Was there any financial or other kind of support from the government for the education of
the family members?
1. Yes 2. No
3.1. If, Yes,
1. Scholarship 2. Free Hostel facilities 3. Free Transportation

Evaluation of the Arivu Educational Loan Scheme Implemented by D Devaraj Urs Backward Classes
Development Corporation in Karnataka State (2011-12 To 2017-18)
130| Karnataka Evaluation Authority
4. Others (specify)
4. Occupation and Annual Income (Rs) of Household Members
a) Name of the family member-
1…………………………………………………………………
b) Occupation:
1) Govt. 2) Private 3) Business 4) Others (specify) 5) Not working
c) Annual Income (Rs):
1) < 50,000 2) 50,000 to 1,00,000 3) 1,00,000 to 3,00,000 4) 3,00,000
>
a) Name of the family member-
2…………………………………………………………………
b) Occupation:
1) Govt. 2) Private 3) Business 4) Others (specify) 5) Not working
c) Annual Income (Rs):
1) < 50,000 2) 50,000 to 1,00,000 3) 1,00,000 to 3,00,000 4) 3,00,000
>
a) Name of the family member-
3…………………………………………………………………
b) Occupation:
1) Govt. 2) Private 3) Business 4) Others (specify) 5) Not working
c) Annual Income (Rs):
1) < 50,000 2) 50,000 to 1,00,000 3) 1,00,000 to 3,00,000 4) 3,00,000
>
a) Name of the family member-
4…………………………………………………………………
b) Occupation:
1) Govt. 2) Private 3) Business 4) Others (specify) 5) Not working
c) Annual Income (Rs):
1) < 50,000 2) 50,000 to 1,00,000 3) 1,00,000 to 3,00,000 4) 3,00,000
>
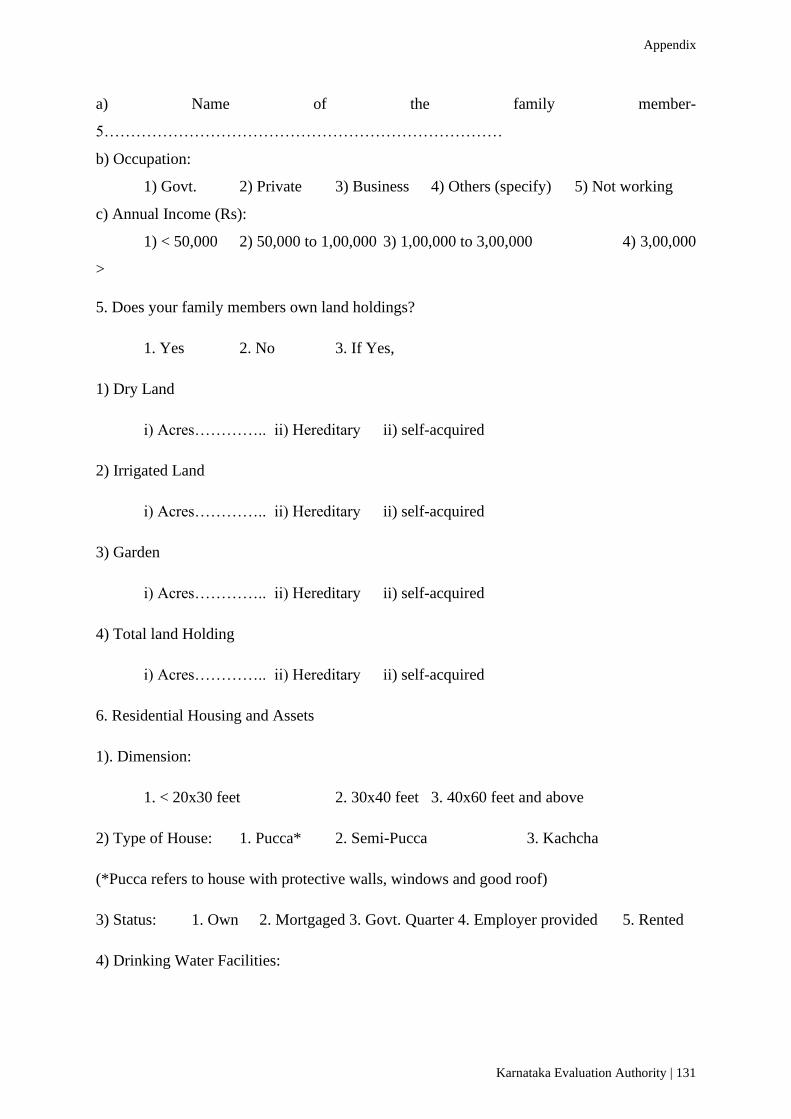
Appendix
Karnataka Evaluation Authority | 131
a) Name of the family member-
5…………………………………………………………………
b) Occupation:
1) Govt. 2) Private 3) Business 4) Others (specify) 5) Not working
c) Annual Income (Rs):
1) < 50,000 2) 50,000 to 1,00,000 3) 1,00,000 to 3,00,000 4) 3,00,000
>
5. Does your family members own land holdings?
1. Yes 2. No 3. If Yes,
1) Dry Land
i) Acres………….. ii) Hereditary ii) self-acquired
2) Irrigated Land
i) Acres………….. ii) Hereditary ii) self-acquired
3) Garden
i) Acres………….. ii) Hereditary ii) self-acquired
4) Total land Holding
i) Acres………….. ii) Hereditary ii) self-acquired
6. Residential Housing and Assets
1). Dimension:
1. < 20x30 feet 2. 30x40 feet 3. 40x60 feet and above
2) Type of House: 1. Pucca* 2. Semi-Pucca 3. Kachcha
(*Pucca refers to house with protective walls, windows and good roof)
3) Status: 1. Own 2. Mortgaged 3. Govt. Quarter 4. Employer provided 5. Rented
4) Drinking Water Facilities:

Evaluation of the Arivu Educational Loan Scheme Implemented by D Devaraj Urs Backward Classes
Development Corporation in Karnataka State (2011-12 To 2017-18)
132| Karnataka Evaluation Authority
1. Tap (within the house) 2. Tap (public / common) 3. Well 4. Tank
4.Kiosk 5. Common Supply (Thombey)
5) Cooking: 1. LPG 2. Fire Wood 3. Kerosene 4. Electricity 5. Dung
6) Electricity: 1. Yes 2. No
7) Fans: 1. Yes 2. No
8) Refrigerator: 1. Yes 2. No
9) Television: 1. Yes 2. No
10) Mobile Phone: 1. Yes 2. No
11) Internet: 1. Yes 2. No
12) Bicycles: 1. Yes 2. No
13) Scooter / Motor Cycle: 1. Yes 2. No
14) Car: 1. Yes 2. No
7. Do family members have any bank account?
1) Yes 2) No
Code Description
*current occupation code
1-graduate engineer 2-software Techie 3-Resident Doctor 4-BPO tech support
5-computer assistant/DEO 6-clerical 7-business assistant/manager 8-teaching
9-skilled technician 10-others (specify)
**Earning /income per month (in Rs) code
• <5000
• 5001-10000
• 10000-15000
• 15001-20000
• 20001-25000
• 25001-30000
• 30001+

Appendix
Karnataka Evaluation Authority | 133
***Expenditure incurred per month (in Rs) code
1<10000
2-10001-15000
3-15001-20000
4-20001-25000
5-25001-30000
6-30001+
@: if currently pursuing PG such as MA/MSC/M. Tech/MD/MBA to be noted down
PART-A (Non- Beneficiary)
Particulars Response
1. Name of
the
Beneficiary
2.
Mobile/email
Mobile E-mail
3. Gender 1. Male 2. Female 3. Transgender
4. Age (in
completed
years)
21 22 23 24 25 26 27 28 28+
5. Marital
Status
1. Single 2. Married 3. Others (Specify)
6. Father’s
Name
7. Residence: 1. Urban 2. Rural 3. Semi-urban
8. Religion 1. Hindu 2. Muslim 3. Christian 4. Jain 5.
Buddhist
6. Sikh 7. Others
9. Caste
10. BC
Category
I IIA IIIA IIIB
11. Course
studied /
studying@
(Gen degree)
1. BA 2. BSc 3. B.
Com
4. BCA 5.
BBM
6. Others
12. Course
studied /
studying@
(Professional
)
1. BE/BTech 2. MBBS 3. BSc
Ag
4. BVSc 5.
MBA
6. Others
13. Year of
Enrolment
for the course
(actual)
2011-12 2012-13 2013-14 2014-15 2015-16 2016-17 2017-18
14.Year of
Completion
of the course
2013-14 2014-15 2015-16 2016-17 2017-18 2018-19
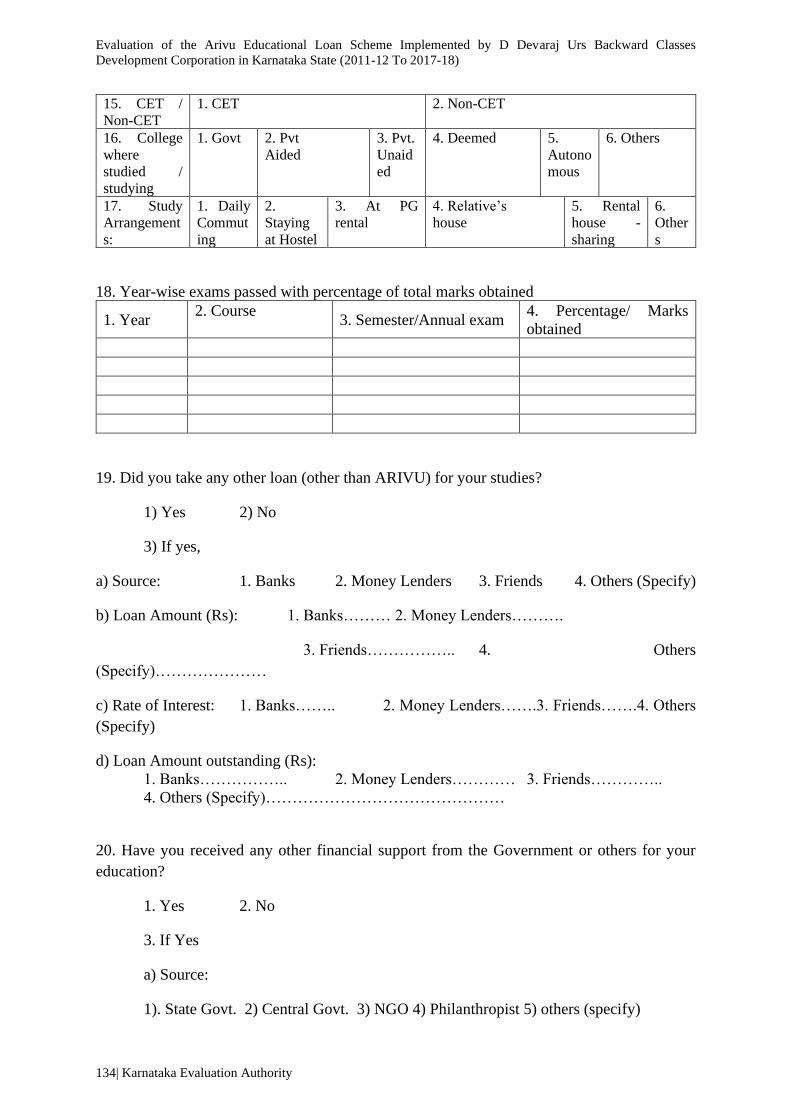
Evaluation of the Arivu Educational Loan Scheme Implemented by D Devaraj Urs Backward Classes
Development Corporation in Karnataka State (2011-12 To 2017-18)
134| Karnataka Evaluation Authority
15. CET /
Non-CET
1. CET 2. Non-CET
16. College
where
studied /
studying
1. Govt 2. Pvt
Aided
3. Pvt.
Unaid
ed
4. Deemed 5.
Autono
mous
6. Others
17. Study
Arrangement
s:
1. Daily
Commut
ing
2.
Staying
at Hostel
3. At PG
rental
4. Relative’s
house
5. Rental
house -
sharing
6.
Other
s
18. Year-wise exams passed with percentage of total marks obtained
1. Year 2. Course
3. Semester/Annual exam 4. Percentage/ Marks
obtained
19. Did you take any other loan (other than ARIVU) for your studies?
1) Yes 2) No
3) If yes,
a) Source: 1. Banks 2. Money Lenders 3. Friends 4. Others (Specify)
b) Loan Amount (Rs): 1. Banks……… 2. Money Lenders……….
3. Friends…………….. 4. Others
(Specify)…………………
c) Rate of Interest: 1. Banks…….. 2. Money Lenders…….3. Friends…….4. Others
(Specify)
d) Loan Amount outstanding (Rs):
1. Banks…………….. 2. Money Lenders………… 3. Friends…………..
4. Others (Specify)………………………………………
20. Have you received any other financial support from the Government or others for your
education?
1. Yes 2. No
3. If Yes
a) Source:
1). State Govt. 2) Central Govt. 3) NGO 4) Philanthropist 5) others (specify)

Appendix
Karnataka Evaluation Authority | 135
b) Amount (Rs):
1). State Govt……….. 2) Central Govt………… 3) NGO…………….
4) Philanthropist……………… 5) others (specify)………………
21. How much money (Rs) on an average per year did you spent for the following related to
your education (Rs):
Break-up:
1. Fees (Rs)……………….. 2. Source:
1. Accommodation (Rs)……………… 2. Source
1. Food (Rs)……………. 2. Source
1. Travel (Rs)………… 2. Source
1. Private Tuition(Rs)………… 2. Source
1. Purchase of Computer (Rs)………… 2. Source
1. Project Work (Rs)…………… 2. Source
1. Others (Rs)…………. 2. Source;
22. Are you aware of the ARIVU Educational Loan Scheme of the Govt. of Karnataka?
1. Yes 1) No
23. If Yes, Why have you not availed this loan?
1) It is difficult to get it
2) It is time consuming
3) We will not get it on time
4) Procedure of applying is cumbersome
5) We have to pay money (bribe)
6) Interest rate is high
7) Others (specify)
24. How did you come to know about ARIVU scheme?
• College notification
• dept. notification on the website

Evaluation of the Arivu Educational Loan Scheme Implemented by D Devaraj Urs Backward Classes
Development Corporation in Karnataka State (2011-12 To 2017-18)
136| Karnataka Evaluation Authority
• newspaper
• Radio announcement
• Television advertisement
• friends
• family members/relatives
• others (specify)
25. Are you aware about loan waiving for students receiving loan before 2013?
1. Yes 2. No
26. Has any of your sibling/s been a recipient of ARIVU loan schemes?
1. Yes 2. No
3. If yes,
1. Brother-1
a) Amount Received (Rs)…………. b) loan amount outstanding (Rs)………….
2. Brother-2
a) Amount Received (Rs)………….. b) Loan amount outstanding (Rs)……………
3. Sister-1
a) Amount Received (Rs)………….. b) Loan amount outstanding
(Rs)…………………
4. Sister-2
a) Amount Received (Rs)…………. b) loan amount outstanding (Rs)…………………
27. Current
Occupation*
1 2 3 4 5 6 7 8 9 10
28. Date of
joining the job
2013 2014 2015 201
6
2017 2018 2019
29. Place of
work at present
1. Within
Karnataka
• Outsid
e
Karnataka
• Within Bengaluru • Outside
Bengaluru
30. Total
Monthly
1 2 3 4 5 6 7
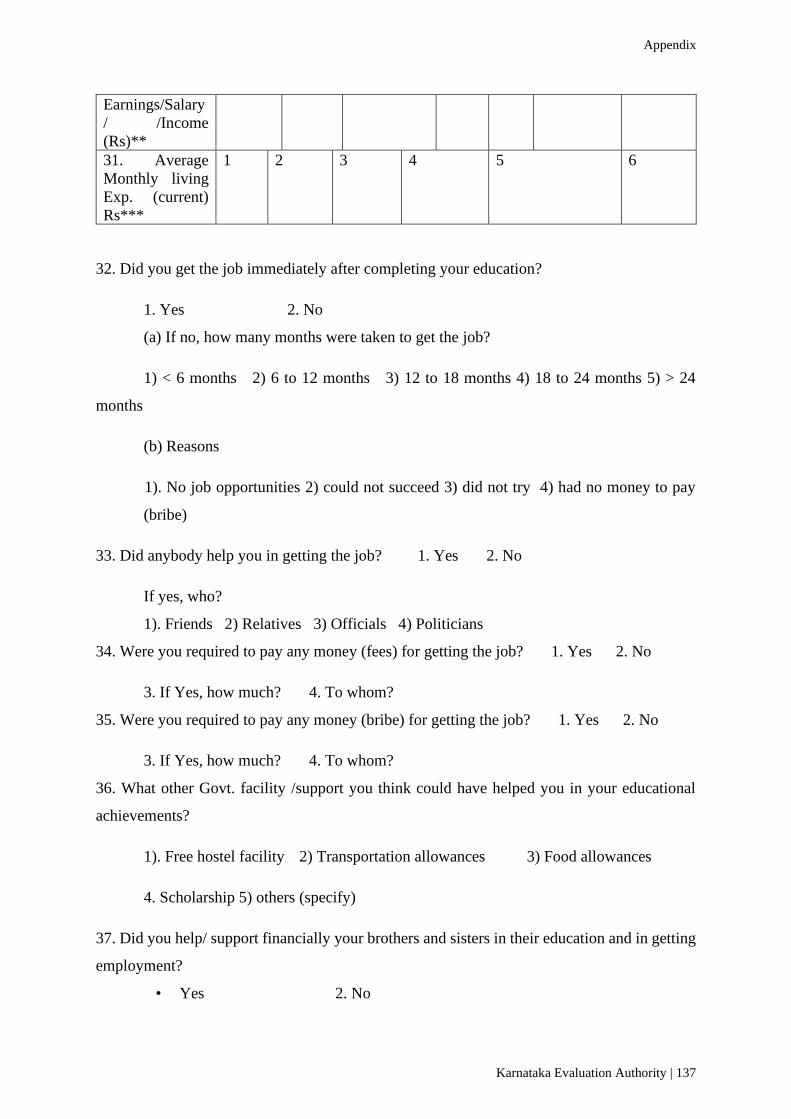
Appendix
Karnataka Evaluation Authority | 137
Earnings/Salary
/ /Income
(Rs)**
31. Average
Monthly living
Exp. (current)
Rs***
1 2 3 4 5 6
32. Did you get the job immediately after completing your education?
1. Yes 2. No
(a) If no, how many months were taken to get the job?
1) < 6 months 2) 6 to 12 months 3) 12 to 18 months 4) 18 to 24 months 5) > 24
months
(b) Reasons
1). No job opportunities 2) could not succeed 3) did not try 4) had no money to pay
(bribe)
33. Did anybody help you in getting the job? 1. Yes 2. No
If yes, who?
1). Friends 2) Relatives 3) Officials 4) Politicians
34. Were you required to pay any money (fees) for getting the job? 1. Yes 2. No
3. If Yes, how much? 4. To whom?
35. Were you required to pay any money (bribe) for getting the job? 1. Yes 2. No
3. If Yes, how much? 4. To whom?
36. What other Govt. facility /support you think could have helped you in your educational
achievements?
1). Free hostel facility 2) Transportation allowances 3) Food allowances
4. Scholarship 5) others (specify)
37. Did you help/ support financially your brothers and sisters in their education and in getting
employment?
• Yes 2. No

Evaluation of the Arivu Educational Loan Scheme Implemented by D Devaraj Urs Backward Classes
Development Corporation in Karnataka State (2011-12 To 2017-18)
138| Karnataka Evaluation Authority
38. How much money (Rs) are you giving / sending to your parents / guardians every Month?
1. < 500 2. 500-1000 3. 1000-2000 4. 2000-3000 5. 3000 >
39. How much of your salary are you saving per month, other than giving to your parents /
guardians?
1) 10 % 2) 20 % 3) 20 % >
40. What are the other sources of income to you?
1. Agriculture 2. Rent from buildings 3. Interest on deposits
5. Returns on investments 5. Spouse’s income 6. Others (specify)
41. Is your spouse working? 1. Yes 2. No
• If yes, nature of job
1. Govt. 2. Private 3. Others (specify)
42. Where are your children studying?
Sl.No 1. Name of the child 2. Type of institution
(Govt/private)
4. Mode of travel
PART II – For the Family
1. Members of the Family
a) Number of adults (19 to 59 years): 1. Males………….. 2. Females…………….
b) Number of Children (up to 18 years of age):1. Males………….. 2. Females…………….
c) Number of Physically Challenged: 1. Males………….. 2. Females……………
d) Number of persons with old age (60 + years): 1. Males…………..2. Females……………
e) Total Family Members 1. Males………….. 2. Females……………
2. Education background of the family members
i) Name of the member-1…………………………………………………………….

Appendix
Karnataka Evaluation Authority | 139
a) Male b) Female
ii) Education Background:
a) SSLC b) PUC c) Degree e) P.G f) Technical g) BE h) MBBS i) Dental j) Others
iii) Status:
a) Completed b) Drop-out
i) Name of the member-2………………………………………………………………..
a) Male b) Female
ii) Education Background:
a) SSLC b) PUC c) Degree e) P.G f) Technical g) BE h) MBBS i) Dental j) Others
iii) Status:
a) Completed b) Drop-out
i) Name of the member-3………………………………………………………………..
a) Male b) Female
ii) Education Background:
a) SSLC b) PUC c) Degree e) P.G f) Technical g) BE h) MBBS i) Dental j) Others
iii) Status:
a) Completed b) Drop-out
i) Name of the member-4…………………………………………………………………
a) Male b) Female
ii) Education Background:
a) SSLC b) PUC c) Degree e) P.G f) Technical g) BE h) MBBS i) Dental j) Others
iii) Status:
a) Completed b) Drop-out

Evaluation of the Arivu Educational Loan Scheme Implemented by D Devaraj Urs Backward Classes
Development Corporation in Karnataka State (2011-12 To 2017-18)
140| Karnataka Evaluation Authority
i) Name of the member-5………………………………………………………………….
a) Male b) Female
ii) Education Background:
a) SSLC b) PUC c) Degree e) P.G f) Technical g) BE h) MBBS i) Dental j) Others
iii) Status:
a) Completed b) Drop-out
3. Was there any financial or other kind of support from the government for the education of
the family members?
1. Yes 2. No 3. If, Yes,
1. Scholarship 2. Free Hostel facilities 3. Free Transportation
4. Others (specify)
4. Occupation and Annual Income (Rs) of Household Members
a) Name of the family member-
1…………………………………………………………………
b) Occupation:
1) Govt. 2) Private 3) Business 4) Others (specify) 5) Not working
c) Annual Income (Rs):
1) < 50,000 2) 50,000 to 1,00,000 3) 1,00,000 to 3,00,000 4) 3,00,000
>
a) Name of the family member-
2…………………………………………………………………
b) Occupation:
1) Govt. 2) Private 3) Business 4) Others (specify) 5) Not working
c) Annual Income (Rs):
1) < 50,000 2) 50,000 to 1,00,000 3) 1,00,000 to 3,00,000 4) 3,00,000
>

Appendix
Karnataka Evaluation Authority | 141
a) Name of the family member-
3…………………………………………………………………
b) Occupation:
1) Govt. 2) Private 3) Business 4) Others (specify) 5) Not working
c) Annual Income (Rs):
1) < 50,000 2) 50,000 to 1,00,000 3) 1,00,000 to 3,00,000 4) 3,00,000
>
a) Name of the family member-
4…………………………………………………………………
b) Occupation:
1) Govt. 2) Private 3) Business 4) Others (specify) 5) Not working
c) Annual Income (Rs):
1) < 50,000 2) 50,000 to 1,00,000 3) 1,00,000 to 3,00,000 4) 3,00,000
>
a) Name of the family member-
5…………………………………………………………………
b) Occupation:
1) Govt. 2) Private 3) Business 4) Others (specify) 5) Not working
c) Annual Income (Rs):
1) < 50,000 2) 50,000 to 1,00,000 3) 1,00,000 to 3,00,000 4) 3,00,000
5. Does your family members own land holdings?
1. Yes 2. No 3. If Yes,
1) Dry Land
i) Acres………….. ii) Hereditary ii) self-acquired
2) Irrigated Land
i) Acres………….. ii) Hereditary ii) self-acquired
3) Garden
i) Acres………….. ii) Hereditary ii) self-acquired

Evaluation of the Arivu Educational Loan Scheme Implemented by D Devaraj Urs Backward Classes
Development Corporation in Karnataka State (2011-12 To 2017-18)
142| Karnataka Evaluation Authority
4) Total land Holding
i) Acres………….. ii) Hereditary ii) self-acquired
6. Residential Housing and Assets
1). Dimension:
1. < 20x30 feet 2. 30x40 feet 3. 40x60 feet and above
2) Type of House: 1. Pucca* 2. Semi-Pucca 3. Kachcha
3) Status: 1. Own 2. Mortgaged 3. Govt. Quarter 4. Employer provided 5. Rented
4) Drinking Water Facilities:
1. Tap (within the house) 2. Tap (public / common) 3. Well 4. Tank
4.Kiosk 5. Common Supply (Thombey)
5) Cooking: 1. LPG 2. Fire Wood 3. Kerosene 4. Electricity 5. Dung
6) Electricity: 1. Yes 2. No
7) Fans: 1. Yes 2. No
8) Refrigerator: 1. Yes 2. No
9) Television: 1. Yes 2. No
10) Mobile Phone: 1. Yes 2. No
11) Internet: 1. Yes 2. No
12) Bicycles: 1. Yes 2. No
13) Scooter / Motor Cycle: 1. Yes 2. No
14) Car: 1. Yes 2. No
(*Pucca refers to house with protective walls, windows and good roof)
7. Do family members have any bank account?
1) Yes 2) No

Appendix
Karnataka Evaluation Authority | 143
Code Description
*current occupation code
1-graduate engineer 2-software Techie 3-Resident Doctor 4-BPO tech support
5-computer assistant/DEO 6-clerical 7-business assistant/manager 8-teaching
9-skilled technician 10-others (specify)
**Earning /income per month (in Rs) code
• <5000
• 5001-10000
• 10000-15000
• 15001-20000
• 20001-25000
• 25001-30000
• 30001+
***Expenditure incurred per month (in Rs) code
1<10000
2-10001-15000
3-15001-20000
4-20001-25000
5-25001-30000
6-30001+
@: if currently pursuing PG such as MA/MSC/M. Tech/MD/MBA to be noted down


Karnataka Evaluation Authority | 145
Terms of Reference for the Study
SI.
No. Content Page no
1 Title of the Study 01
2 Department Implementing the Scheme 01
3 Background and Context 01
4 Evaluation Scope, Purpose and Objective 04
5 Evaluation Questions 05
6 Evaluation Methodology 08
7 Deliverables and Time Schedules 11
8 Qualities Expected from the Report 12
9 Administrative Arrangements Core Team 13
10 Cost and Schedule of Budget Release 14
11 Selection of Consultant Agency for Evaluation 15
12 Contact Person for Further Details 15

Evaluation of the Arivu Educational Loan Scheme Implemented by D Devaraj Urs Backward Classes Development Corporation in Karnataka State (2011-12 To 2017-18)
146| Karnataka Evaluation Authority
Terms of Reference for the study
Evaluation of Arivu-Educational Loan Scheme Implemented by D Devaraj
Urs Backward Classes Development Corporation in Karnataka State
(2011-12 to 2015-16)
1. Title of the study;
Evaluation of Arivu-Educational Loan Scheme Implemented by D Devaraj Urs Backward
Classes Development Corporation in Karnataka State (2011-12 to 2015-16)
2. Department implementing the scheme:
The scheme is implemented by D Devaraj Urs Backward Classes Development Corporation in
Karnataka State
3. Background and Context
One of the major developments in global economic thought over the past 60 years or so may
be rightly coined as knowledge or human capital revolution. Education is the key factor to
build up human capital. Many economists like Solow, Schultz, Arrow Romer and Lukas argued
that there is a positive relationship between education and economic and human development.
The endogenous growth theories recognize knowledge as an essential input for economic
development. Knowledge is now identified as an important source of economic growth
in the present century. The differences in levels of development of different countries
today are mainly attributed to differences in accumulation of human capital. Attainment of
higher levels of education not only ensures higher returns to individuals but also leads to
accumulation of human and social capital. It is also a powerful tool of empowerment and
inclusive growth as higher education increases access to skilled and high paid jobs. But
the transition to higher education is very slow in developing countries including India.
Education promotes knowledge building process which ultimately raises collective levels of
economic and social well-being. If India has to reap the benefits of demographic dividend,
then access, equity and quality emerge as vital issues in shaping the programmes and
policies for expansion of higher education. In a knowledge economy, those who have
education and Knowledge are able to enter the global markets and reap the benefits. The
Principle of Social Justice implies that the benefits of development should trickle down to

Appendix
Karnataka Evaluation Authority | 147
the people living on the margin of the society. A good social arrangement is one where
the socio-economic benefits reach more and more the most deprived sections of the
society. Therefore, the concept of Social Justice
advocates a development process that reaches to the last bottom member in the society.
Education is the strong means to attain it.
There is a need to increase Gross Enrolment Rate in Higher Education and skills among the
youths to take advantage of the demographic dividend. The existing education system in
India has to make a visible shift to integrating analytical and technical skills for research and
innovation. Unless we are able to achieve the goal of effectively cultivating such skills in
our young population, it is impractical to visualize India as a prosperous nation in the future
(Rao and Anitha, 2009). Therefore, way to accumulate knowledge and establish a
knowledge society is to increase the enrolment in higher education and provide access to
all. The GER in higher education was 12.4 percent in India (2006-07) and was 13.1 percent in
Karnataka. After that it is increasing. The GER in higher education at the all India level was
20.4 in 2013-14 and it was 21.6 for male and 18.9 for female students. Karnataka is placed
at the middle with the GER of 24 and it is above national average. However, the GER of
Karnataka is low when compared to some Southern States. It is 38.2 in Tamil Nadu, 27.6 in
AP and 27.4 in Maharashtra.
The GER varies across the caste groups. The GER of SC is 15.4 and for ST it is 12.7. The
SC/ ST /OBC and Minority students have lesser access to higher education as both the direct
as well as the opportunity cost of higher education is very high for these low income
group students. Students are not able to bear the initial cost of admission to many professional
courses. Many students drop out in between due to financial difficulties. Therefore, the
questions of access and equity are prominent in higher education. Hence, deprivation of
access to higher education is one of the greatest deprivations faced by these youths in
Karnataka. The issues need to be addressed mainly through adequate financial assistance
in various forms such as Scholarships and loans.
Evaluation of the Arivu Educational Loan Scheme Implemented by D Devaraj Urs Backward Classes Development Corporation in Karnataka State (2011-12 To 2017-18)
148| Karnataka Evaluation Authority
Arivu —Education Loan Scheme -Background and Context
Karnataka Government has extended financial assistance to the students of backward
classes to seek admission and complete the professional courses. Arivu- the educational loan
scheme was introduced vide the Government order. no. ¸ÀPÀE 207 BCA/ 97 dt. 12
.1.1999 for studies in professional courses like medical engineering etc. it was limited to
the students in Category I and Category IIA. The annual family income limit was Rs.
22000. A maximum amount of Rs. 10,000 per year was sanctioned with interest rate of
2% over the period of completion of education. Further, by Govt. order no. »AªÀPÀ 507
©JAJ¸ï 2013 ¢£ÁAPÀ 31/8/2013 the loan facility is extended to all the categories of
students. The number of courses is also increased to cover professional, engineering,
medical and other 28 courses of higher education. The loan
amount is increased to Rs. 1,00,000 or the total cost of the course @ the rate of interest of
2%. The household income limit is also increased to Rs. 3.5 Lakhs.
As per Govt. order No. BCW 841/BMS 2015Bengaluru Dt. 09/09/2015, the fees fixed by
CET for admission of the students to various courses is to be paid in advance to CET by the
D Devaraj Urs Development Corporation on behalf of the student and a MOU with terms
and conditions is to be signed with Karnataka Examination Authority. The applications are
received online and as per the allocation available per district for different categories of the
students, the Director of the Corporation releases the first installment of the loan directly to
the students. From 2016-17 the loan is directly sanctioned and the advance amount is paid
to CET. The courses in which seats are not allotted through CET, the loan is sanctioned to
the students as per existing terms and conditions.
Objectives of the Scheme
1. To increase the enrolment and access of students of backward class communities
to higher education.
2. To control the dropouts in Higher education due to financial constraints and enable
them to complete the course.
3. To prepare these students to face the competition in the job market and to
mainstream them with other students/ job seekers.
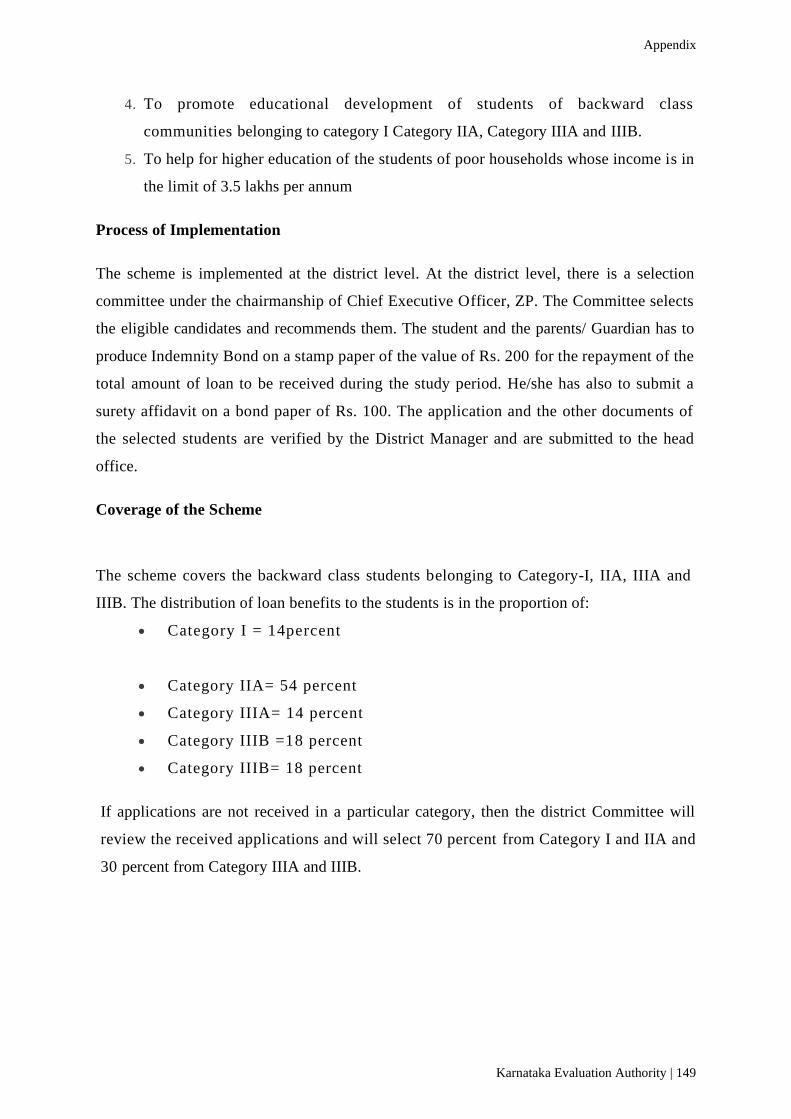
Appendix
Karnataka Evaluation Authority | 149
4. To promote educational development of students of backward class
communities belonging to category I Category IIA, Category IIIA and IIIB.
5. To help for higher education of the students of poor households whose income is in
the limit of 3.5 lakhs per annum
Process of Implementation
The scheme is implemented at the district level. At the district level, there is a selection
committee under the chairmanship of Chief Executive Officer, ZP. The Committee selects
the eligible candidates and recommends them. The student and the parents/ Guardian has to
produce Indemnity Bond on a stamp paper of the value of Rs. 200 for the repayment of the
total amount of loan to be received during the study period. He/she has also to submit a
surety affidavit on a bond paper of Rs. 100. The application and the other documents of
the selected students are verified by the District Manager and are submitted to the head
office.
Coverage of the Scheme
The scheme covers the backward class students belonging to Category-I, IIA, IIIA and
IIIB. The distribution of loan benefits to the students is in the proportion of:
• Category I = 14percent
• Category IIA= 54 percent
• Category IIIA= 14 percent
• Category IIIB =18 percent
• Category IIIB= 18 percent
If applications are not received in a particular category, then the district Committee will
review the received applications and will select 70 percent from Category I and IIA and
30 percent from Category IIIA and IIIB.
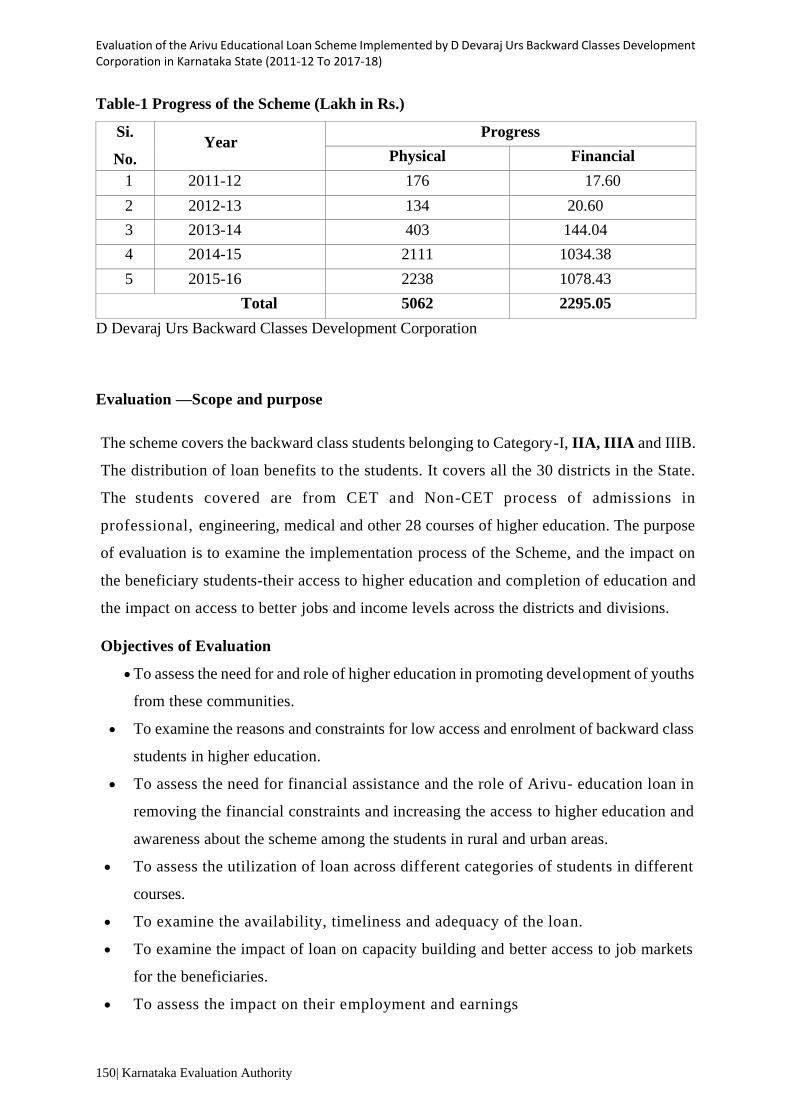
Evaluation of the Arivu Educational Loan Scheme Implemented by D Devaraj Urs Backward Classes Development Corporation in Karnataka State (2011-12 To 2017-18)
150| Karnataka Evaluation Authority
Table-1 Progress of the Scheme (Lakh in Rs.)
Si.
No. Year
Progress
Physical Financial
1 2011-12 176 17.60
2 2012-13 134 20.60
3 2013-14 403 144.04
4 2014-15 2111 1034.38
5 2015-16 2238 1078.43
Total 5062 2295.05
D Devaraj Urs Backward Classes Development Corporation
Evaluation —Scope and purpose
The scheme covers the backward class students belonging to Category-I, IIA, IIIA and IIIB.
The distribution of loan benefits to the students. It covers all the 30 districts in the State.
The students covered are from CET and Non-CET process of admissions in
professional, engineering, medical and other 28 courses of higher education. The purpose
of evaluation is to examine the implementation process of the Scheme, and the impact on
the beneficiary students-their access to higher education and completion of education and
the impact on access to better jobs and income levels across the districts and divisions.
Objectives of Evaluation
• To assess the need for and role of higher education in promoting development of youths
from these communities.
• To examine the reasons and constraints for low access and enrolment of backward class
students in higher education.
• To assess the need for financial assistance and the role of Arivu- education loan in
removing the financial constraints and increasing the access to higher education and
awareness about the scheme among the students in rural and urban areas.
• To assess the utilization of loan across different categories of students in different
courses.
• To examine the availability, timeliness and adequacy of the loan.
• To examine the impact of loan on capacity building and better access to job markets
for the beneficiaries.
• To assess the impact on their employment and earnings

Appendix
Karnataka Evaluation Authority | 151
• To examine the repayment status of loans.
• To compare the impact of the scheme with similar schemes in other states
• To review implementation of the scheme and give suggestions based on field analysis for
effective implementation and enhanced outcomes.
Evaluation questions
1. What is the need for such an educational loan? Examine the outcomes of similar
schemes in other States and at National level? (Review of Literature).
2. Review the information system about the loan? Whether the students in rural areas
are able to know about the scheme? Whether the system of filling up the
application forms on line is convenient to the students? Whether any changes are
required in the existing system?
3. Whether the loans are given to eligible candidates across different categories?
Whether the Selection Committee at the district level has selected candidates
belonging to backward classes only? Whether the ratio is maintained over the years
and across the different courses? Whether any eligible candidates are deprived of the
loan?
4. Whether the loan is utilized for the same course for which it was sanctioned? Are
there any deviations in it? What are the reasons for such diversions?
5. Whether the students have the knowledge about the following;
i. Process of applying for the loan
ii. Sanctioning process and Authority of loan
iii. Process of selection
iv. Different categories of fees covered in the loan
v. Documents to be submitted for the loan.
vi. S e l ec t i o n l i s t
vii. Interest rate and repayment schedule
6. Verify the following information about the loan from the sample
A. The candidate belongs to the eligible category

Evaluation of the Arivu Educational Loan Scheme Implemented by D Devaraj Urs Backward Classes Development Corporation in Karnataka State (2011-12 To 2017-18)
152| Karnataka Evaluation Authority
B. The Annual Income of the family is within the limit of Rs. 3.5 Lakhs.
C. Whether the candidate has received any financial assistance form a Bank/ Finance
for education earlier before the sanction of the loan.
D. Whether the candidate has submitted all the required documents for the loan.
7. Whether students are able to get information about the allotment and release of
loan? What is the system of payment? What system —cheque or Account transfer
is convenient to them? What are the difficulties faced by them in receiving payment
8. Analyse the social background of the students? Which category of students have
larger share in loan? What is the rural urban proportion of the students? What are
the reasons for deviations? Why the number of beneficiaries is less from Kalaburagi
division?
9. Which are the courses in which there is heavy demand for the loan from the
students? Make a separate analysis of admissions to Courses through CET and the
Non-CET courses.
10. Analyse the processes involved in the sanction of loan. What is the time taken at
each stage? What is the total duration of time taken from the period of application
to the delivery of cheque to the student during first year? Whether it varies across the
courses & regions?
11. Whether the students in rural areas are able to get information, face any problems in the
submission of the documents? Whether the process is time consuming for the
students?
12. What are the processes involved in sanction of loan in the subsequent years? Whether
the processes are followed correctly? What is the time gap and difficulties faced
by the students?
13. Whether the students have continued to pursue the course? Are there any drop
outs? What are the reasons for the same?

Appendix
Karnataka Evaluation Authority | 153
14. Whether the loan amount is adequate enough to pursue the course? How the
students are managing the other expenditures? What is the average expenditure
incurred by them?
15. Whether the students who have received the loan before 13/5/ 2013 are aware
about the waiving of the loan? How many have been able to avail the benefit?
16. What is the impact of loan on the educational performance of the students?
Whether it differs across the divisions and districts? Whether it differs across the
CET and Non CET courses?
17. What is the employment status of the Students who have availed loan after
completion of the course? How many of them are able to get employment —Self
or wage/ salary employment in Govt. and private concerns? Analyse in
comparison with control group.
18. Examine the alternative situations in which the candidate would have to take
decisions for seeking admission to the Course in the absence of the loan.
19. One of the basic objectives of the Scheme is to increase the enrolment of
backward class students in higher education. Assess the achievement with the
analysis of trends in enrolment of the students in sample colleges/courses.
20. What is the repayment performance of the students? What are the differences
across the categories and regions?
21. What is the overall opinion of the students about the loan and contribution of the
loan for their educational attainment?
22. Give an account of some successful as well as failure cases?
23. What is the experience of the other students who are not able to get the loan?
Make the analysis of the control group.
24. What is the opinion of the students about continuation of the Scheme? Whether
there are any suggestions for the improvement in the Scheme?

Evaluation of the Arivu Educational Loan Scheme Implemented by D Devaraj Urs Backward Classes Development Corporation in Karnataka State (2011-12 To 2017-18)
154| Karnataka Evaluation Authority
Implementing Officers
1. Whether the notification about call for applications for the loan scheme is published
in the State level and local Newspapers? In how many papers it is published?
Whether letters are sent to the principals of all colleges and the notification is
placed on the website also?
2. What are the difficulties faced in receiving the applications? What is the procedure
followed for receipt and scrutiny of applications?
3. Whether adequate number of applications is received in different categories? What
are the categories where adequate applications are not received? Why?
4. What is the selection procedure adopted by the District level selection Committee?
Are there any delays or lapses in the selection and intimation process? What are
the reasons for it?
5. Whether proper records are maintained about the details of the beneficiaries at the
college level and at the District office level?
6. What is the tracking system to know about the employment status of the students
and the repayment of loan? How is the performance of the students in repayment
of the loan?
7. What is the linkage and coordination between colleges and Districts as well as State
level offices? Are there in gaps or problems in coordination?
8. What is the overall opinion of the implementing officers about the scheme and how
the implementation of the scheme can be improved?

Appendix
Karnataka Evaluation Authority | 155
Evaluation Methodology
The required data for the study to be collected through the following methods
Table 2: Methods of Data collection
Type of data Method of data
collection Source of information Method and Tools
Primary data 1. Quantitative data Beneficiaries, non-
Beneficiaries.
Sample Survey,
2. Qualitative data Beneficiaries, non-
Beneficiaries.
FGD, Case studies
State level, district level,
Officers, Committee
members
IDI-interview
schedules
Secondary
data
Data from the
department, annual
Reports
Department level- State,
district levels.
On selected indicators
r e l e v a n t f o r t h e
evaluation
Sample size and selection of the sample
Table-3 Sample districts and sample size
Sl.
No. Districts 2011-12 2012-13 2013-14 2014-15 2015-16 Total
1 Bengaluru Urban 5 3 23 283 275 589
2 Tumkuru 21 128 121 270
3 Chithradurga 6 3 33 116 106 264
4 Davanagere 9 13 12 85 83 202
5 Shivmogga 16 4 24 75 75 194
6 Chikkaballa pur 2 1 5 64 60 132
7 Ramanagara 14 58 55 127
8 Bengaluru Rural 3 2 6 50 49 110
9 Kolar - - 5 27 27 59
Total 41 26 143 886 851 1947
10 Mysuru 13 15 35 92 115 270
11 Dakshina Karnataka 5 5 18 96 119 243
12 Udupi 31 20 13 72 105 241
13 Mandya - 5 11 39 64 119
14 Hasan 5 1 13 39 55 113
15 Chikkamangaluru 4 1 7 34 61 107
16 Chamarajanagar - 1 9 33 44 87
17 Kodagu 3 - 2 9 16 30
Total 61 48 108 414 579 1210
18 Belagavi 8 4 16 182 179 389

Evaluation of the Arivu Educational Loan Scheme Implemented by D Devaraj Urs Backward Classes Development Corporation in Karnataka State (2011-12 To 2017-18)
156| Karnataka Evaluation Authority
19 Gadag 11 9 11 82 88 201
20 Bijapur - - 14 71 82 167
21 Bagalkote 6 13 18 69 52 158
22 Dharwad 11 6 19 62 58 156
23 Haveri 1 5 11 32 36 85
24 Uttara Kannada 2 1 10 36 35 84
Total 39 38 99 534 530 1240
25 Gulbarga 15 16 15 65 66 177
26 Rai churu 6 36 68 110
27 Koppal 1 - 8 68 32 108
28 Bidar 13 6 12 36 36 103
29 Yadagiri 5 - 8 32 40 85
30 Ballari 1 - 4 40 36 81
Total 35 22 53 277 278 665
Grand Total 176 134 403 2111 2238 5062
Sample selection process
The sample is selected through stratified random multi stage sampling method
I Stage-strata — 4 Divisions in the State
II Stage- 3 districts from each division
➢ Highest number of beneficiaries
➢ To Lowest number of beneficiaries
➢ A median district
Table 4: Distribution of the Sample
Divisions Districts Total
Beneficiaries Sample
Bengaluru Bengaluru Urban 589 245
Shivamogga 194(MD) 81
Kolar 59 25
Mysuru Mysuru 270 160
Hassan 113(MD) 67
Kodagu 30 18
Belagavi Belagavi 389 189
Bagalkote 158(MD) 78
Uttara Kannada 84 41
Kalaburagi Kalaburagi 177 110
Bidar 103(MD) 65
Bellary 81 51
Total 12 2247 1130

Appendix
Karnataka Evaluation Authority | 157
Control Group
Control group consists of the students who are but have not received/ not applied for the
Loan. 1% of the sample to be selected as control group covering all the 4 divisions in the
State. Random sampling to be done at KEA.
Table 5: Qualitative data
Details Number Total
FGDs 12@District level 4 at college level 1 in each
division 16
In Depth
Interviews
12officers @District level+2 members of District
Committee (Chairman/ Member Secretary)
(Total=24)+ 4 members at the State level
40
Deliverables and time schedule
The Department of women and Child Development and KEA will provide the necessary
information pertaining to the study and also co-operate with the consultant organization
in completing the assignment task within the stipulated time period. The concerned
district and taluk officials will be instructed by the Department of Women & Child
Development for providing the required information/data at the taluk and GP levels.
It is expected to complete the present study in 5 months time line, excluding the time taken
for approvals at KEA.
Table 6: Timelines and deliverables:
Inception Report 1 month after signing the agreement
Field Data Collection 3 months date of work plan Approval
Draft report submission 1 month after Field Data Collection
Final report 1 Month after Draft report submission
Total duration 6 Months

Evaluation of the Arivu Educational Loan Scheme Implemented by D Devaraj Urs Backward Classes Development Corporation in Karnataka State (2011-12 To 2017-18)
158| Karnataka Evaluation Authority
Qualities expected from the Report:
The evaluation report should generally confirm to the United Nations Evalua tion
Guidelines (UNEG) "Standards for Evaluation in the UN System" and "Ethical Standards
of Evaluations". The report should
present a comprehensive review of the Scheme/ programme in terms of the content,
implementation process, adequacy, information and access to beneficiaries.
The Report should provide a scientific assessment of implementation of the Arivu -
Educational loan Scheme and the impact on the beneficiary students-their access to
higher education and completion of education and the impact on access to better jobs and
income levels across the districts and divisions.
The qualitative data should be used in unbiased manner to support or for further analysis
of the reflections from the quantitative data. The analysis should provide adequate space
for assessing the variations across the regions and categories. Case studies to be presented
to bring out the realities at the micro level.
The report should come out with specific recommendations based on adequate field
evidence for any modifications in the programme design, content, implementing procedures,
and any other modifications to improve the access and impact of the Scheme/Programme.
Structure of the report
The following are the points- only inclusive and not exhaustive- which need to be
mandatorily followed in the preparation of evaluation report:
By the very look of the evaluation report it should be evident that the study that of D
Devaraj Urs Backward Classes Development Corporation and Karnataka Evaluation
Authority (KEA) which has been completed by the Evaluation Consultant Organization.
The report should be complete and logically organized in a clear but simple language.
Besides confirming to the qualities covered in the Terms of Reference, report should be
arranged in the following order:
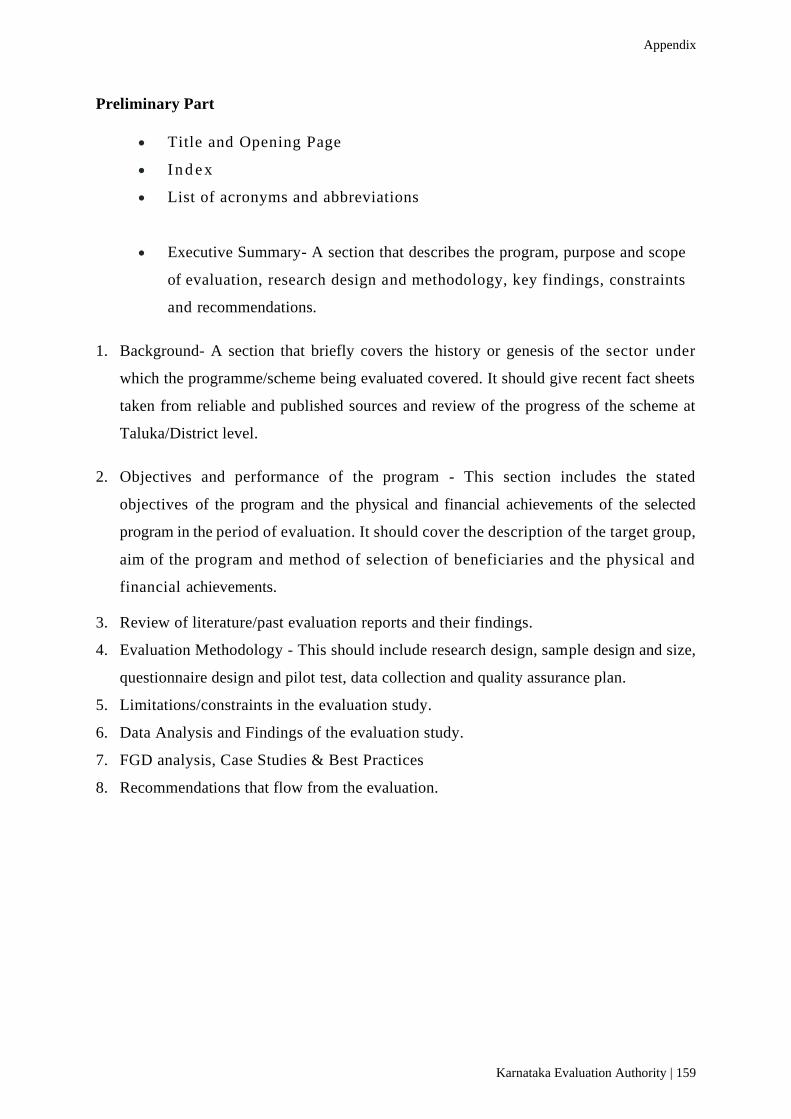
Appendix
Karnataka Evaluation Authority | 159
Preliminary Part
• Title and Opening Page
• I n d ex
• List of acronyms and abbreviations
• Executive Summary- A section that describes the program, purpose and scope
of evaluation, research design and methodology, key findings, constraints
and recommendations.
1. Background- A section that briefly covers the history or genesis of the sector under
which the programme/scheme being evaluated covered. It should give recent fact sheets
taken from reliable and published sources and review of the progress of the scheme at
Taluka/District level.
2. Objectives and performance of the program - This section includes the stated
objectives of the program and the physical and financial achievements of the selected
program in the period of evaluation. It should cover the description of the target group,
aim of the program and method of selection of beneficiaries and the physical and
financial achievements.
3. Review of literature/past evaluation reports and their findings.
4. Evaluation Methodology - This should include research design, sample design and size,
questionnaire design and pilot test, data collection and quality assurance plan.
5. Limitations/constraints in the evaluation study.
6. Data Analysis and Findings of the evaluation study.
7. FGD analysis, Case Studies & Best Practices
8. Recommendations that flow from the evaluation.

Evaluation of the Arivu Educational Loan Scheme Implemented by D Devaraj Urs Backward Classes Development Corporation in Karnataka State (2011-12 To 2017-18)
160| Karnataka Evaluation Authority
Administrative arrangements: - Core Team
The core team should comprise of the following technical members and should possess
requisite qualification and experience as stated below:
Table 7: Team to carry out the study
Sl.
No. Details Subject Experts Requirements Educational Qualification
1
Principal
Investigato
r
Ph.D. in Social sciences/Education
/ I Class Post Graduate in
Economics/Sociology/ Social
work/ Education/Public Policy/
Development Studies
5 years of experience in
Education/ / Social and related
sectors.
2
1st Core
team
member
Post graduate in Education/
Social Sciences/
Should also possess a
minimum of three
t h r e e ( 3 ) y e a r s o f
experience in Education/
Social and allied sector
projects
3 2nd Core team
member
Post Graduate in
Statistics/Economics/Comp
uter Applications with
knowledge of Statistical
analysis/Data analysis
3 years’ experience in data
analysis
And such numbers that the evaluation is completed within the scheduled time
period as prescribed by the ToR.
Cost and Schedule of Budget release:
The Output based budget release will be as follows-
1. The first installment of Consultation fee amounting to 30% of the total fee shall
be payable as advance to the Consultant after the approval of the inception
report, but only on execution of a bank guarantee of a scheduled nationalized
bank, valid for a period of at least 12 months from the date of issuance of
advance.
2. The second installment of Consultation fee amounting to 50% of the total fee
shall be payable to the Consultant after the approval of the Draft report.
3. The third and final installment of Consultation fee amounting to 20% of the
total fee shall be payable to the Consultant after the receipt of the hard and soft

Appendix
Karnataka Evaluation Authority | 161
copies of the final report in such format and number as prescribed in the
agreement, along with all original documents containing primary and secondary
data, processed data outputs, study report and soft copies of all literature used
in the final report. Taxes will be deducted from each payment, as per rates in force.
In addition, the evaluating agency/consultant is expected to pay service tax at their
end.
Selection of Consultant Agency for Evaluation:
The selection of evaluation agency should be finalized as per provisions of KTPP Act
and rules without compromising on the quality.
Contact persons for further details:
1. Nodal officer — Shri T Venugopal, Programme Officer, D Devaraj Urs
Backward Classes Development Corporation. Contact No.9632179589
2. Nodal Officer KEA Shri M Ranganna e mail:
conpkeagkarnataka.gov.in Mobile: 9901174915

Karnataka Evaluation Authority | 162
Study Photographs
Picture 1: Interview with Arivu Education Loan Beneficiary Parent
Picture 2 Interview with DD Urs Corporation district Manager Bangalore
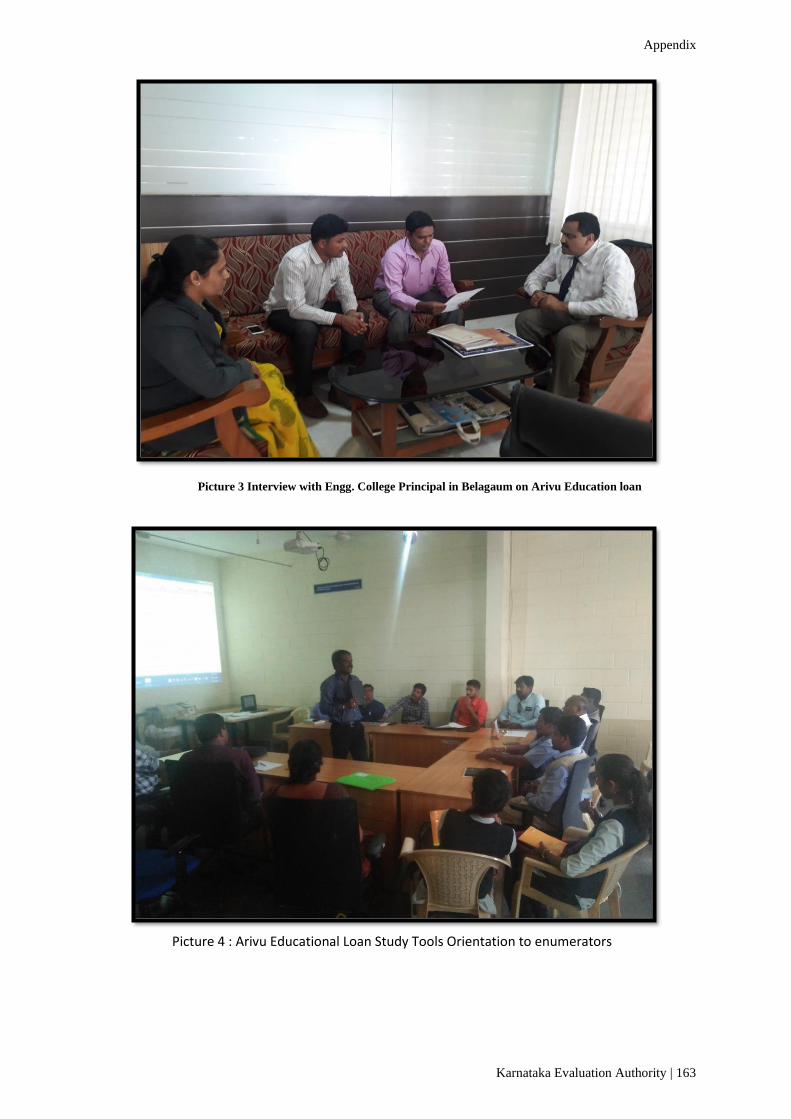
Appendix
Karnataka Evaluation Authority | 163
Picture 3 Interview with Engg. College Principal in Belagaum on Arivu Education loan
Picture 4 : Arivu Educational Loan Study Tools Orientation to enumerators

EVALUATION STUDY OF ARIVU EDUCATIONAL LOAN SCHEME
IMPLEMENTED BY D DEVARAJ URS BACKWARD CLASSES DEVELOPMENT
CORPORTAION IN KARNATAKA (2011-12 to 2017-18)
Karnataka Evaluation Authority Website: kmea.karnataka.gov.in
#542, 5th Floor, 2nd Gate Contact No: 080 2203 2561
Dr. B.R Ambedkar Veedhi Email Id: [email protected]
M.S. Building
Bengaluru – 560 001