Evaluation of an Electrostatic Dust Removal System with ... · PDF fileEvaluation of an...
15
Submitted RSI 19 Jan 2011 Evaluation of an Electrostatic Dust Removal System with Potential Application in Next-Step Fusion Devices F.Q.L. Friesen l , B. John2, C.H. Skinner, A.L. Roquemore 3 , C.I. Calle 4 IGrinnell College, 1115 8th Avenue, Grinnell, fA 50112-1616 2Swarthmore College, 500 College Ave., Swarthmore, Pennsylvania 19081 3Princeton Plasma Physics lAboratory, P.O. Box 451, Princeton, N. J., 08543 4NASA Electrostatics and Surface Physics Laboratory, Kennedy Space Center, FL 32899 Abstract The ability to manage inventories of carbon, tritium, and high-Z elements in fusion plasmas depends on means for effective dust removal. A dust conveyor, based on a moving electrostatic potential well, was tested with particles of tungsten, carbon, glass and sand. A digital microscope imaged a representative portion of the conveyor, and dust particle size and volume distributions were derived before and after operation. About 10 mm 3 volume of carbon and tungsten particles were moved in under 5 seconds. The highest driving amplitude tested of 3 kV was the most effective. The optimal driving frequency was 210 Hz (maximum tested) for tungsten particles, decreasing to below 60 Hz for the larger sand particles. Measurements of particle size and volume distributions after 10 and 100 cycles show the breaking apart of agglomerated carbon, and the change in particle distribution over short timescales «1 s). https://ntrs.nasa.gov/search.jsp?R=20110008731 2018-05-16T23:55:36+00:00Z
Transcript of Evaluation of an Electrostatic Dust Removal System with ... · PDF fileEvaluation of an...
Submitted RSI 19 Jan 2011
Evaluation of an Electrostatic Dust Removal System with Potential Application in Next-Step Fusion Devices
F.Q.L. Friesenl, B. John2, C.H. Skinner, A.L. Roquemore3
, C.I. Calle4
IGrinnell College, 1115 8th Avenue, Grinnell, fA 50112-1616 2Swarthmore College, 500 College Ave., Swarthmore, Pennsylvania 19081 3Princeton Plasma Physics lAboratory, P.O. Box 451, Princeton, N. J., 08543 4NASA Electrostatics and Surface Physics Laboratory, Kennedy Space Center, FL 32899
Abstract
The ability to manage inventories of carbon, tritium, and high-Z elements in fusion plasmas
depends on means for effective dust removal. A dust conveyor, based on a moving electrostatic
potential well, was tested with particles of tungsten, carbon, glass and sand. A digital microscope
imaged a representative portion of the conveyor, and dust particle size and volume distributions
were derived before and after operation. About 10 mm3 volume of carbon and tungsten particles
were moved in under 5 seconds. The highest driving amplitude tested of 3 kV was the most
effective. The optimal driving frequency was 210 Hz (maximum tested) for tungsten particles,
decreasing to below 60 Hz for the larger sand particles. Measurements of particle size and
volume distributions after 10 and 100 cycles show the breaking apart of agglomerated carbon,
and the change in particle distribution over short timescales «1 s).
https://ntrs.nasa.gov/search.jsp?R=20110008731 2018-05-16T23:55:36+00:00Z
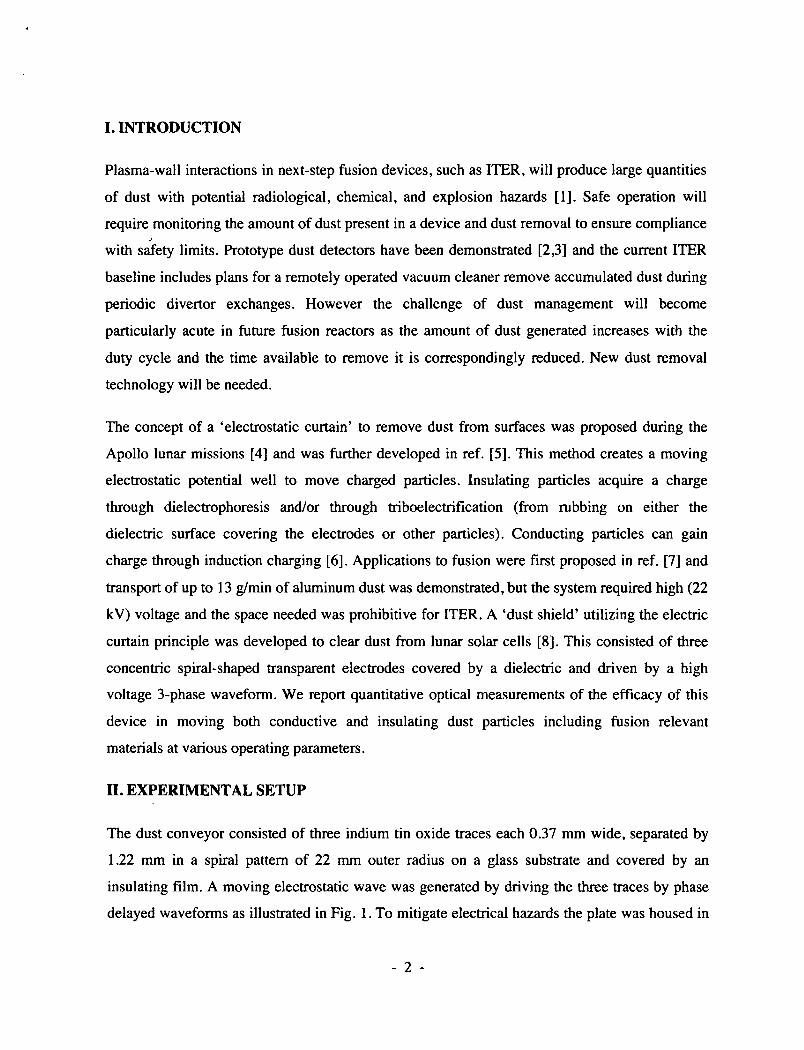
I. INTRODUCTION
Plasma-wall interactions in next-step fusion devices, such as ITER, will produce large quantities
of dust with potential radiological, chemical, and explosion hazards [1]. Safe operation will
require monitoring the amount of dust present in a device and dust removal to ensure compliance J
with safety limits. Prototype dust detectors have been demonstrated [2,3] and the current ITER
baseline includes plans for a remotely operated vacuum cleaner remove accumulated dust during
periodic divertor exchanges. However the challenge of dust management will become
particularly acute in future fusion reactors as the amount of dust generated increases with the
duty cycle and the time available to remove it is correspondingly reduced. New dust removal
technology will be needed.
The concept of a 'electrostatic curtain' to remove dust from surfaces was proposed during the
Apollo lunar missions [4] and was further developed in ref. [5]. This method creates a moving
electrostatic potential well to move charged particles. Insulating particles acquire a charge
through dielectrophoresis and/or through triboelectrification (from rubbing on either the
dielectric surface covering the electrodes or other particles). Conducting particles can gain
charge through induction charging [6]. Applications to fusion were first proposed in ref. [7] and
transport of up to 13 g/min of aluminum dust was demonstrated, but the system required high (22
kV) voltage and the space needed was prohibitive for ITER. A 'dust shield' utilizing the electric
curtain principle was developed to clear dust from lunar solar cells [8]. This consisted of three
concentric spiral-shaped transparent electrodes covered by a dielectric and driven by a high
voltage 3-phase waveform. We report quantitative optical measurements of the efficacy of this
device in moving both conductive and insulating dust particles including fusion relevant
materials at various operating parameters.
ll.EXPE~ENTALSETUP
The dust conveyor consisted of three indium tin oxide traces each 0.37 mm wide, separated by
1.22 mm in a spiral pattern of 22 mm outer radius on a glass substrate and covered by an
insulating film. A moving electrostatic wave was generated by driving the three traces by phase
delayed waveforms as illustrated in Fig. 1. To mitigate electrical hazards the plate was housed in
- 2 -
box with a safety-interlocked lex an lid and a verticallexan tube to allow unobstructed viewing.
A digital microscope [9] with a 0.5x objective and 2048x1536 pixel detector, imaged the
conveyor. Dust was deposited onto the conveyor through the lexan tube and was illuminated by a
halogen lamp.
Both conductive and insulating dust materials were tested. Carbon dust of mean particle diameter
-2 Jlm [10] was obtained by scraping a ATJ graphite tile. Tungsten dust[ll] (mean diameter 5.4
Jlm), glass spheres (mean diameter -60 Jlm), and sand (mean diameter -200 Jlm) were also
tested. All dust samples were baked in vacuum for 4 h at 100 C to remove moisture and stored in
a desiccator.
For carbon and tungsten particles, an area 6.35 mm x 4.75 mm was viewed with a x4 zoom
setting (3.1 JIm per pixel), a white background was placed under the conveyor and the dust was
illuminated from above. For the larger glass and sand particles an area 25.4 mm x 19 mm was
viewed with a xl zoom setting (12.4 Jlm per pixel), a black background was used, and the dust
was illuminated from a shallow angle to improve the contrast. Optical positioning guides were
used with the xl zoom setting to ensure that the same area on the plate was consistently viewed
(the guides were not visible at x4).
The power supply used a Johnson divide-by-six counter to provide timing for several CMOS
analog switches that supplied adjustable low voltage signals to three Matsuda AP-l.5B2 high
voltage operational amplifiers with a 12 V/Jls slew rate. A pre-charge feature provided a DC bias
of up to ±1500 V to all traces for a period of 10 s prior to the oscillating waveforms. This was
intended to help charge the particles. The driving frequency was varied from 5 Hz to 210 Hz
with a peak-to-peak amplitude of up to 3 kV.
To measure the change in particle distribution over short time intervals, the power supply was
triggered from a square wave generator gated by a function generator in one-shot mode, set to
the time interval corresponding to the desired number of steps. Images were taken before
energizing the conveyor, after 10 steps, and after 99 steps. This process was performed 11 times
for each material, and the particle size distributions for each time were averaged together.
- 3 -
ID. DATA ANALYSIS
Initial visual observations of the operation of the dust conveyor showed that large (~1O mm3)
volumes of carbon and tungsten dust could be efficiently cleared within 5 s. To obtain
quantitative measurements of the removal efficiency, the amount of dust was limited so that
individual particles and clumps of particles were visibly separated and differences in removal
efficiency would be clearly revealed. Images of dust on the conveyor were taken before and after
the conveyor was energized. Care was taken to ensure that the dust was consistently illuminated
for all images in a series. After each trial, the plate was cleaned with a gas duster through the
lexan viewing column without any physical contact so as to avoid disturbing the setup. Between
every three trials, a background image was captured with no dust present on the conveyor.
A typical image series consisted of 52 images total: 8 images with no dust present, 22 images of
dust before energizing the conveyor, and 22 images after energizing the conveyor. The
independent variable being tested was typically changed 11 times consecutively, then reset to its
initial value and changed another 11 times, so as to avoid having any two tests with the same
settings take place chronologically near each other.
The image analysis process is designed to calculate the total volume of material present in the
field of view, and to find the particle/clump size distribution for every image. All images were
analyzed by ImageJ [12] software by running a macro which opened the image files, performed
the analysis of the image, saved a monochrome mask of detected particles, and saved a
histogram of the particle distribution by area.
Specifically, each image was first converted from 32-bit ROB to 8-bit grayscale, and a fast
Fourier transform (FFT) spatial filter was applied to remove background irregularities. The
optimal bandpass values were different for each material and are given in table 1. The image was
then converted to monochrome using a threshold value determined manually for each image
series. A four pixel wide border was removed around the image to prevent false dark area
generated by the FFT from being counted as particles. For images taken with Ix zoom (sand and
glass), the script was configured to remove the bottom-left and upper-right corners of the images
- 4 -
that contained the centering guides. Because of its geometry the center of the spiral was less
effective at moving dust. Since a linear pattern is envisioned for fusion applications, this area
was also removed and not included in the analysis.
A watershed algorithm [13] was applied to monochrome images of tungsten, glass and sand to
separate touching yet distinct particles. The watershed could not be applied to images of carbon
particles as these had rough edges that were incorrectly identified by the algorithm as distinct
particles. The algorithm calculates the Euclidean distance map of the image, and then dilates the
local maxima until either the edge of the particle or the edge of another dilating region is
reached. The boundaries between these dilated regions are then used to segment the original
image. An ImageJ particle analysis was then performed on the resulting segmented monochrome
image, and each isolated group of black pixels is considered to be a particle. The area of each
particle was calculated, grouped by size category and binned into a histogram. After this
automated process, the monochrome masks were examined manually as a final check that the
threshold value used was appropriate for all images in the series, and that there were no
variations in lighting.
The histogram files were imported into a spreadsheet by a macro written in Visual Basic for
Applications. The 11 pairs of images in a series were assigned values indicating the order in
which they were taken chronologically. The two chronologically closest background image
particle distributions were averaged together and subtracted from those of the images. This
serves the purpose of removing objects such as scratches on the conveyor plate that could
otherwise be falsely counted as particles. The total volume of material present on the conveyor
was calculated by assuming that all particles and particle clumps were spherical in shape. The
volume was calculated for each particle area range in the histogram, and the number of particles
in each of these area ranges was used to weight the volume contribution from each range. The
total volume of material present in the field of view (VIOl) is the sum of these weighted volumes
where NA is the number of particles with area A.
- 5 -
IV. RESULTS
The particle removal efficiency was measured as a function of pre-charge voltage, driving
amplitude, driving frequency, and duration of conveyor operation. Varying the pre-charge
voltage from - 1500 V to + 1500 V, and varying the pre-charge duration from 5s to 45 s did not
significantly effect the removal efficiency. We therefore conclude that the pre-charge is not of
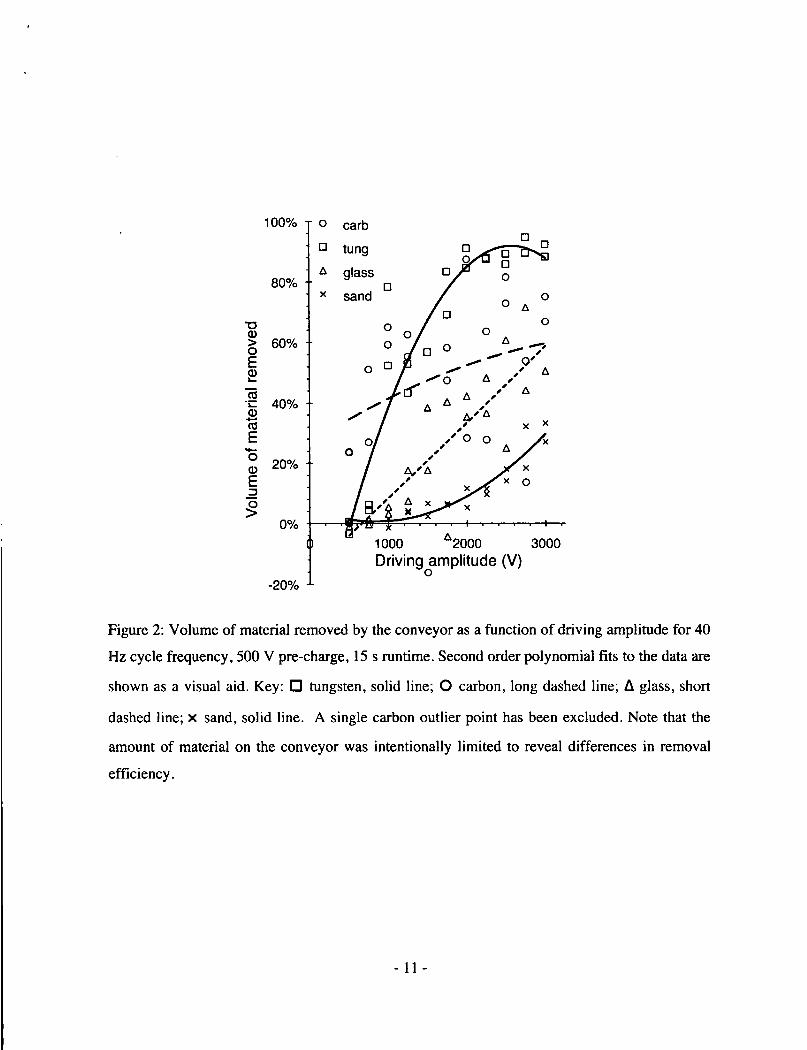
major importance to fusion applications of the conveyor. The removal efficiency did increase
with driving amplitude as shown in Fig. 2. Beyond approximately 2 kV, removal of tungsten
improved slowly with further increase in voltage. However, it was observed qualitatively that
large amounts of tungsten and carbon dust (about l00x what was used for quantitative
measurement) were cleared more quickly by the conveyor at 3 kV than at 2 kV, though roughly
the same small amount of material ultimately remained after one minute of runtime as at 2 kV.
Carbon removal showed a positive correlation with driving amplitude, but data for carbon were
very inconsistent, most likely due to the breaking apart of clumps (see below).
Carbon was most effectively removed at 90 Hz as shown in Fig. 3. Glass was removed
effectively at driving frequencies less than or equal to 60 Hz. Tungsten was removed at most
frequencies, but 5 Hz was least effective, and 210 Hz was most effective. Sand was most
effectively removed at low driving frequencies. This indicates that the optimal driving frequency
is lower for larger particles.
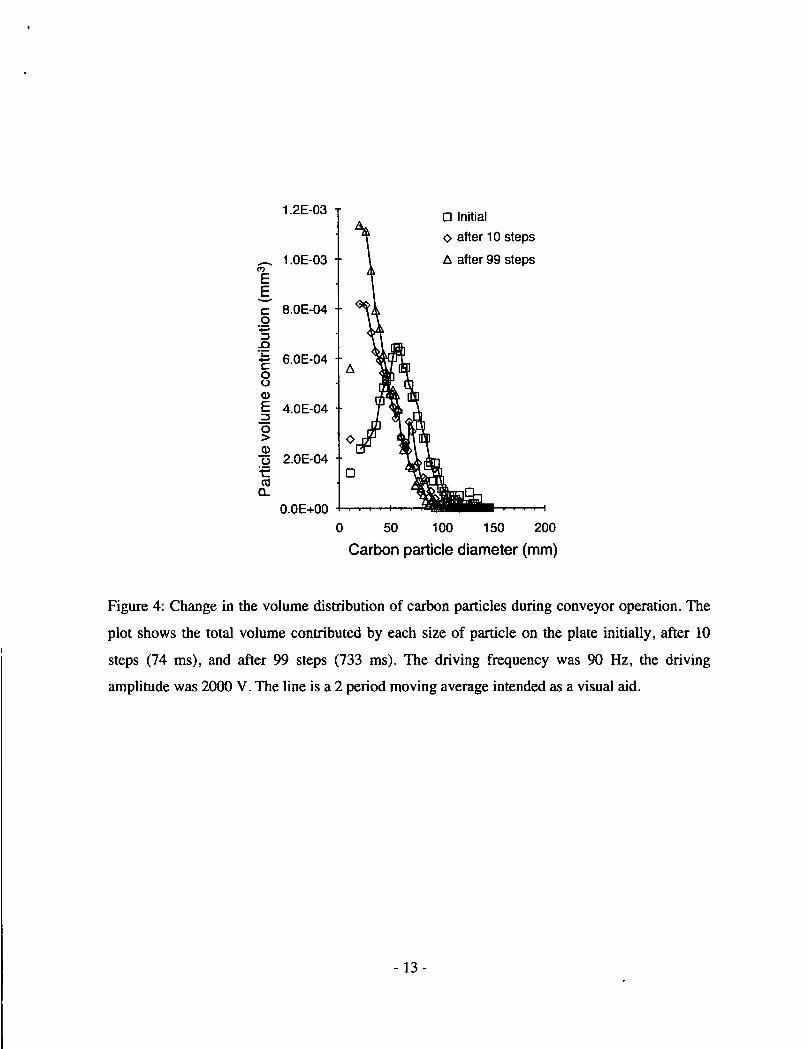
The effect of clumping of carbon particles is shown in Fig. 4. While the individual carbon
particles were quite small, carbon readily agglomerated into clumps of mean diameter -50 !lm
prior to deposition on the plate. The conveyor transported these large clumps, and rapidly broke
them into smaller pieces.
In summary, the dust conveyor was found effective in removing a volume of order 10 mm3 of
carbon and tungsten particles in under 5 seconds. Glass and sand particles were removed at
comparable rates for similar volumes, but some of the larger sand particles were difficult to
move. It is likely that operation in vacuum would mitigate 'sticking' of particles due to moisture.
For fusion applications we envision a mosaic of dust conveyors that would transport dust
- 6 -
accumulating in hidden areas on the lower vacuum vessel into exhaust ports. The conveyors
would utilize linear arrays of closely spaced traces based on contemporary advances in micro
and nano- technology. A limited demonstration of electrostatic dust motion with 25 JIm spaced
traces operated at 50 V was reported in ref. [14].
V. ACKNOWLEDGMENTS
This work was supported by a 2010 National Undergraduate Fellowship, which in turn is
supported by US DOE Grant No DE-AC02-09CHl1466. We would like to thank T. Holoman, G.
Smalley, D. Labrie, R Marsala and T. Provost for technical assistance.
- 7 -
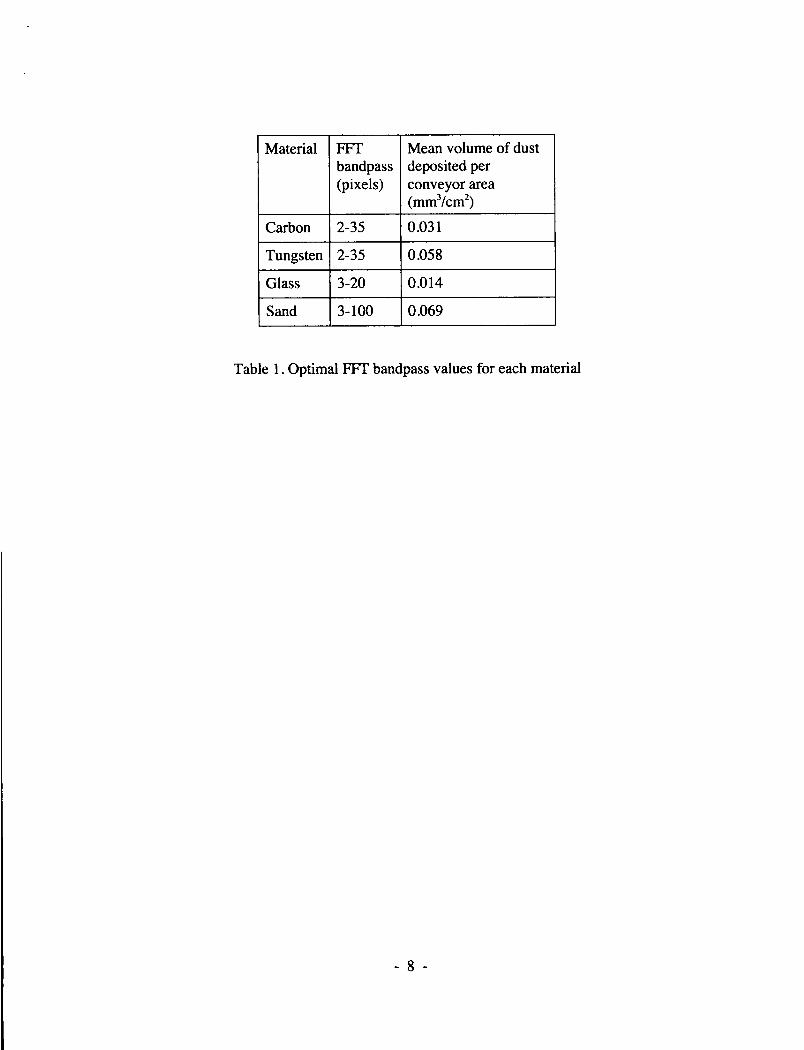
Material FFf Mean volume of dust bandpass deposited per (pixels) conveyor area
(mm3/cm2)
Carbon 2-35 0.031
Tungsten 2-35 0.058
Glass 3-20 0.014
Sand 3-100 0.069
Table 1. Optimal FFf bandpass values for each material
- 8 -
Figure Captions.
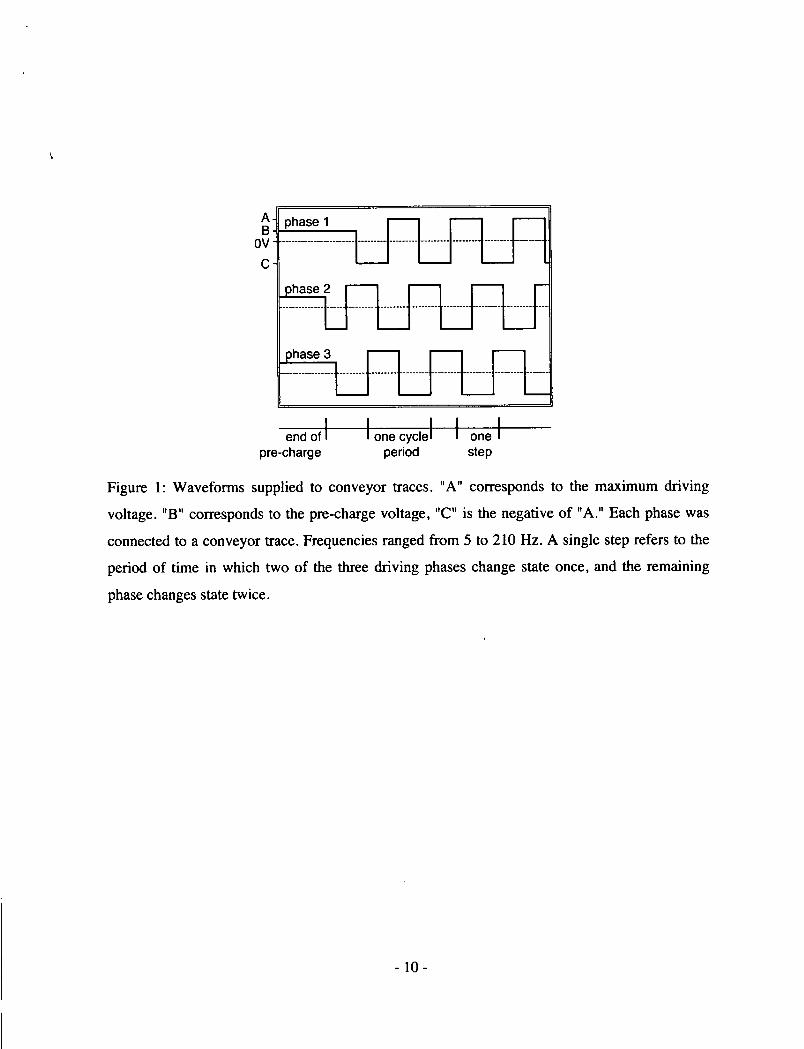
Figure 1: Wavefonns supplied to conveyor traces. "A" corresponds to the maximum driving
voltage. "B" corresponds to the pre-charge voltage, "C" is the negative of "A." Each phase was
connected to a conveyor trace. Frequencies ranged from 5 to 210 Hz. A single step refers to the
period of time in which two of the three driving phases change state once, and the remaining
phase changes state twice.
Figure 2: Volume of material removed by the conveyor as a function of driving amplitude for 40
Hz cycle frequency, 500 V pre-charge, 15 s runtime. Second order polynomial fits to the data are
shown as a visual aid. Key: 0 tungsten, solid line; 0 carbon, long dashed line; l:l glass, short
dashed line; x sand, solid line. A single carbon outlier point has been excluded. Note that the
amount of material on the conveyor was intentionally limited to reveal differences in removal
efficiency.
Figure 3: Volume of removed material as a function of driving frequency for 500 V pre-charge,
15 s runtime. Carbon and tungsten tests were conducted with 1000 V driving amplitude, glass
and sand were driven at 1750 V. Second order polynomial fits to the data are shown as a visual
aid. Key: 0 tungsten, solid line; 0 carbon, long dashed line; l:l glass, short dashed line; x sand,
solid line.
Figure 4: Change in the volume distribution of carbon particles during conveyor operation. The
plot shows the total volume contributed by each size of particle on the plate initially, after 10
steps (74 ms), and after 99 steps (733 ms). The driving frequency was 90 Hz, the driving
amplitude was 2000 V. The line is a 2 period moving average intended as a visual aid.
- 9 -
~ -l~p_ha_s_e_1_...., OV C
end of I pre-charge
lone cyclel one I period step
Figure 1: Wavefonns supplied to conveyor traces. "A" corresponds to the maximum driving
voltage. "B" corresponds to the pre-charge voltage, "C" is the negative of "A." Each phase was
connected to a conveyor trace. Frequencies ranged from 5 to 210 Hz. A single step refers to the
period of time in which two of the three driving phases change state once, and the remaining
phase changes state twice.
- 10-
100% 0 carb
0 tung
6 glass 0 80% 0 x sand 0 0 6
"0 0 0 Q) 0 > 60% 0 6 0 0 -7 E 0
_- 0' Q) - , 6
/0 6 , .... ,
m d"" ,
6 6
, , '':::: 40% 6
6 , , Q) 6,,6 +-' m , , E " 0 0 - 0
, , 0 ,
20% , Q) 6,'6 E , , ~
, , ~ 8,"
0%
1000 6
2000 3000 Driving amplitude (V)
0 -20%
Figure 2: Volume of material removed by the conveyor as a function of driving amplitude for 40
Hz cycle frequency, 500 V pre-charge, 15 s runtime. Second order polynomial fits to the data are
shown as a visual aid. Key: 0 tungsten, solid line; 0 carbon, long dashed line; fl glass, short
dashed line; x sand, solid line. A single carbon outlier point has been excluded. Note that the
amount of material on the conveyor was intentionally limited to reveal differences in removal
efficiency.
- 11 -

"0 Q) > o E ~ (ij .;:: Q) .... co E -o Q)
E ~
~
100%
80%
60%
40%
20%
-20%
o tung
~iJ~-~_':' ......... ,a
o carb /::,. glass x sand o
/::,. 0 ..... /::,. 0 o"' .... ~
d .. 0 8 0', _ e El n ',A 0 o 0 0 '.. 8 0
EE DB _~--~~t 0" 0 C \ ....... .., \
,.". ~\ vo 0\
\ 0 x o
x
x
x
x x ><100
Driving frequency (Hz)
\ \ \ \
200
Figure 3: Volume of removed material as a function of driving frequency for 500 V pre-charge,
15 s runtime. Carbon and tungsten tests were conducted with 1000 V driving amplitude, glass
and sand were driven at 1750 V. Second order polynomial fits to the data are shown as a visual
aid. Key: 0 tungsten, solid line; 0 carbon, long dashed line; f)" glass, short dashed line; x sand,
solid line.
- 12 -
1.2E-03
-. 1.0E-03 M
E E c 8.0E-04 o
:;::; :::J .0
".E 6.0E-04 c o ()
Q)
E 4.0E-04 :::J
g Q)
C3 2.0E-04 :.e ~
a.. o
o Initial
o after 10 steps
ll. after 99 steps
o 50 100 150 200
Carbon particle diameter (mm)
Figure 4: Change in the volume distribution of carbon particles during conveyor operation. The
plot shows the total volume contributed by each size of particle on the plate initially, after 10
steps (74 ms), and after 99 steps (733 ms). The driving frequency was 90 Hz, the driving
amplitude was 2000 V. The line is a 2 period moving average intended as a visual aid.
- 13 -

References
[1] S. Rosanvallon, C. Grisolia, P. Andrew, S. Ciattaglia, P. Delaporte, D. Douai, D. Gamier,
E. Gauthier, W. Gulden S.H. Hong, S. Pitcher, L. Rodriguez, N. Taylor, A. Tesini, S.
Vartanian, A. Vatry, and M. Wykes, J. Nucl. Mater., 390-391 (2009) 57.
[2] C.H. Skinner, B. Rais, A. L. Roquemore, H.W. Kugel, R. Marsala, T. Provost, Rev. Sci.
Instrum. 81, 10E102 (2010).
[3] G.F. Counsell, A.P.C. de Vere, N.St.J. Braithwaite, S. Hillier and P. Bjorkman, Rev. Sci.
Instrum.77 (2006), p. 093501.
[4] F.B.Tatom, , V. Srepel, R.D. Johnson, N.A. Contaxes, J.G. Adams, H. Seaman, and BL.
Cline, "Lunar Dust Degradation Effects and RemovallPrevention Concepts", NASA
Technical Report No. TR-792-7- 207A, p. 3-1 (1967).
[5] S. Masuda, K. Fujibayashi, K. Ishida, H. Inaba, Electrical Engineering in Japan. Vol. 92
(1972) No.1.
[6] M.K. Mazumder, R. Sharma, A.S. Biris, J. Zhang, C. Calle, M. Zahn, Particulate Sci. and
Technology. 25 (2007) 640.
[7] M. Onozuka, Y. Veda, Y. Oda, K. Takahashi, Y. Seik, I. Aoki, W. Veda and R. Kurihara
J. Nucl. Sci and Technol. 34, 1031 (1997).
[8] c.1. Calle, J.L. McFall, CR. Buhler, S1. Snyder, E.E. Arens, A. Chen, M.L. Ritz, J.S.
Clemens, CR. Fortier, and S. Trigwell, Proc. ESA Annual Meeting on Electrostatics
(2008).
[9] National Instruments Model DC5-420
[10] C.V. Parker, C.H. Skinner, and A.L. Roquemore, J. of Nucl. Mater. 363-365 (2007)
1461.
- 14-
[11] Buffalo Tungsten, 2 Main Street, Depew, NY 14043
[12] ImageJ information (Aug 2010), available from http://rsbweb.nih.gov/iil
[13] ImageJ watershed algorithm documentation (aug 2010), available from:
http://rsb.info.nih .gov /ij/docs/menus/process .html#Watershed
[14] A. Campos and C.H. Skinner, Journal of Undergraduate Research vol. IX (2009) 30.
http://www.scied.science.doe.gov/scied/JURv9/default.htm
- 15 -