EVALUATION OF ADVANCED COMPONENT CONCEPTS … · EVALUATION OF ADVANCED COMPONENT CONCEPTS ... Mass...
79
N72-28101 NASA CR-112104 EVALUATION OF ADVANCED COMPONENT CONCEPTS FOR AN INTEGRATED ENVIRONMENTAL CONTROL/LIFE SUPPORT RESISTOJET CONTROL SYSTEM By Carl R. Halbach, Paul D. Arthur, and Russell J. Page JUNE 1972 Prepared under Contract No. NAS1 -10767 by ADVANCED ROCKET TECHNOLOGY (ARTCOR) Irvine, California 92664 for NATIONAL AERONAUTICS AND SPACE ADMINISTRATION Langley Research Center https://ntrs.nasa.gov/search.jsp?R=19720020451 2018-06-06T04:58:55+00:00Z
Transcript of EVALUATION OF ADVANCED COMPONENT CONCEPTS … · EVALUATION OF ADVANCED COMPONENT CONCEPTS ... Mass...

N 7 2 - 2 8 1 0 1NASA CR-112104
EVALUATION OF ADVANCED COMPONENT CONCEPTS
FOR AN
INTEGRATED ENVIRONMENTAL CONTROL/LIFE SUPPORT
RESISTOJET CONTROL SYSTEM
By Carl R. Halbach, Paul D. Arthur,and Russell J. Page
JUNE 1972
Prepared under Contract No. NAS1 -10767 by
ADVANCED ROCKET TECHNOLOGY (ARTCOR)
Irvine, California 92664
for
NATIONAL AERONAUTICS AND SPACE ADMINISTRATION
Langley Research Center
https://ntrs.nasa.gov/search.jsp?R=19720020451 2018-06-06T04:58:55+00:00Z

EVALUATION OF ADVANCED COMPONENT CONCEPTS
FOR AN ^
INTEGRATED ENVIRONMENTAL CONTROL/LIFE SUPPORT - RESISTOJET CONTROL SYSTEM
By Carl R. Halbach, Paul D. Arthur, and Russell J. Page
June 1972
Prepared under Contract No. NAS1-10767 byADVANCED ROCKET TECHNOLOGY (ARTCOR)
Irvine, California
for
NATIONAL AERONAUTICS AND SPACE ADMINISTRATION
Langley Research Center
TABLE OF CONTENTS
SECTION • ' PAGE
LIST OF FIGURES iii
LIST OF TABLES. . . . . . . . . iv
SUMMARY ' 1
INTRODUCTION . . .' ' . . . . . . '.2
LIST OF SYMBOLS 4
MASS FLOW LIMITING DEVICES 6
Thrustor Flow Limiting Requirements ... 6
Mass Flow Limiting Concepts 7
Mass Flow Limiter Performance 10
THERMAL PUMPS . . . . . . . . 46
General Considerations 46
Thermodynamics of the Cooling Cycle 50
Thermodynamics of the Heating Cycle 54
Effect of Non-condensables 66
Overall Cycle Time . , 67
CONCLUSIONS . . . . . 70
, Mass Flow Limiters . 70
Thermal Pumps. .72
REFERENCES 74
11

LIST OF FIGURES
FigureNo.
1
2
3
4
5
6
• 7
8
9
10
11V
12
13
14
15 -
16
17
18
' 19
20
21
22
23
Title
Mass flow and power characteristics of 25-mlb resistojctstarting with water propellant. -
Flow restrictor^thrustor pressure drop model.
Effect of supply pressure changes on thrust forvarious flow restrictor pressure losses.
Flow characteristics of simple flow restrictors.
Estimated cavitating venturi size.
Hybrid flow limiter schematic.
Hybrid flow limiter predicted performance.
Fluid flow bench.
Flow restrictor performance.
Vortex valve performance.
Hybrid flow limiter prototype hardware.
Hybrid flow limiter performance.
Thermal pump model.
Time to chill radiator panel from 300"K to 190°K.
Radiator panel area required to solidify C02 .
Time to chill radiator from 190°K to 162°K and solidifyC02.
Line conductance and pressure drop.
Radiated power.
Phase diagram characteristics of the thermal pump.
Time, to heat radiator panel.
Effect of volume ratio on pumped pressure.
Pumping .effectiveness.
Effect of non-condensables on C02 solid volume ratio.
Page
•12
14
16
19
23
26
• 31 '
32
35
39
42
44
47
51
53
55
56
57
58
60 .
64
65
68

LIST OF TABLES
Table -No. Title Page
I. Concepts Suitable for Flow Limiting 7
II. Fixed Geometry Flow Limiter Configurations Tested 34
III. Flow Sensitivity of Typical Flow Restrictions 37
IV. Hybrid Flow Limiter Performance 45
IV

EVALUATION OF ADVANCED-COMPONENT CONCEPTS ;FOR AN
INTEGRATED ENVIRONMENTAL CONTROL/LIFE SUPPORT - RESISTOJET CONTROL SYSTEM
By Carl R. Halbach, Paul D. Arthur*, and Russell J. Page
Advanced Rocket Technology (ARTCOR)Irvine, California
SUMMARY
Flow restricting devices have been studied for their suitability asliquid water propellant flow limiters for the biowaste resistojet. Flowlimiting during the start-up transient is required to prevent thrustor in-stabilities and icing which could result in heater failure in the electricalresistance heated thrustor (resistojet). The study was directed towardsimple devices which would function passively (i.e., without power exceptfrom the propellant flow itself), and would offer high reliability andsimplicity.
A pre-evaporator (referred to simply as an evaporator) used in con-junction with the biowaste resistojet can serve as a relatively effectiveflow limiter by itself. To perform this function, however, the evaporatormust have sufficient size (thermal capacity), and it must be preheated beforepropellant flow is commanded on. Significant improvement in thrustor flowstability can be provided by employing a flow restrictor such as an orifice,preferably used in conjunction with an evaporator to minimize thermal shockin the thrustor itself. With the use of a flow restrictor, the evaporatorcan be made smaller and lighter and the preheat time can be significantlyshortened. Perfect flow limiting (constant mass flow rate) is not necessarilydesired. Optimum thrustor response would normally occur with a slightlyhigher initial mass flow. The optimum flow limiter - evaporator - .thrustorcombination depends on the thrustor size, power available, and applicationrequirements.
An orifice or nozzle restrictor was found to provide good flow limitingperformance by limiting the initial mass flow rate to about 1.8 times thefinal steady-state value. A hybrid device has been demonstrated with improvedflow limiting capability relative to the orifice or nozzle. For the same ,-typical conditions, an initial-to-final mass flow ratio of about 1.2 ispossible. The device utilizes a stiff diaphragm flexing through a shortdistance to cover one of two orifices. As pressure differential decreases,the covered orifice is opened to hold mass flow rate nearly constant.
*Professor of Aerospace Engineering, University of California at Irvine,Irvine, California.(Consultant at ARTCOR).
In summary, a carefully selected fluidic flow limiter can be a highlyreliable device, located between the propellant valve and the evaporator-thrustor assembly, which can greatly improve the transient response of thethrustor as well as the stability of the thrust output during a start-up withwater as the propellant.
In addition to the flow limiting devices, a thermal pumping system wasstudied to determine, for example, whether CG? desorbed from molecular sievescould be pumped thermally in a space station application. The thermal pumpis considered a possible replacement for mechanical pumps. It involves acyclic, constant volume cryopumping system which employs space radiators toachieve the cryotemperatures. The frozen C0? would be vaporized periodically,using a waste heat loop, to attain sufficient pressure to transfer a largeportion of the trapped CO- to storage tanks.
Several problems became apparent as the study of this particular thermal'pumping system progressed. Small cryopump gas-side volumes and large spaceradiator areas are required. This requires a long and slender gas-side spacewhich would be susceptible to local blockage by solidified CO . Cycle timeswere found to be long - of the order of three hours. The size and weightof the thermal pump tend to be offset by its capacity for dumping waste heatand thereby supplementing or replacing part of the spacecraft radiator system.Electrical power consumption of mechanical pumps is eliminated by the thermalpump. The thermal pump concept may also prove to be useful for other appli-cations; the large savings in electrical power may make this concept attrac- •tive for pumping other gases, as well as CC" .
INTRODUCTION
Electrical resistance heated rockets, called r^esistojets, are presently•under development for the Space Station/Space Base. These thrustors willutilize the biowaste propellants C0?, H?0 and CH.. Considering the integratedEC/LS - resistojet reaction control system operating on these propellants,there are at least two significant problem areas in which thermo-fluidicdevices offer performance improvement potential compared to the present base-line system.
The first of these is the problem of mass flow limiting during start-upof the resistojet when the propellant is water. Without adequate mass flowcontrol, water would surge into the evacuated thrustor at start-up. Insuf-ficient energy would be available in the thrustor to supply the large amount -of heat of vaporization required for the high liquid mass flow rate with theresult that the water propellant would be ejected from the thrustor largely asa liquid. Flow control can be established by using an evaporator stage aheadof the thrustor. One obvious way to prevent the liquid ejection problem would-be—to—preheat—the-evapor.ator_bef ore_commanding_pro.pellant_flow_._ Wi.th_s.uffici.en.t_thermal capacity and preheat, the initial flow surge would be flashed to steam,thereby building up back pressure and effectively controlling the water flowwithin acceptable limits.
There are, however, several significant disadvantages associated withthis obvious solution. Previous experience with evaporator-thrustor assem-
blies has indicated that thrust instabilities occur during the start-uptransient caused by traces of liquid water and ice leaving the thrustor.Also, a relatively large evaporator is required, compared to the thrustorheater size; necessitating a relatively long preheat time before the pro-pellant flow can be commanded on.
A fluidic mass flow-limiting device offers the potential advantage ofmore positive control of the water propellant mass flow rate during thestart-up transient, while minimizing the disadvantages associated with theuse of an evaporator alone as a flow limiter. One major objective of thepresent investigation was, .therefore, to examine both analytically and ex-perimentally the concept of using one of the various fluidic mass flowlimiting devices in conjunction with a biowaste resistojet thrustor operatingon water in order to select the optimal configuration for a flow limiter-evaporator-thrustor combination.
A second problem area is the relatively high electrical power consumptionof the space station baseline mechanical pumping system required to pump thedesorbed C0_ from the molecular sieve to both intermediate (^2 atm) and high( 20 atm) pressure levels for storage, together with the inability of the :mechanical pumping system to eliminate the small percentages of 09 and N9which contaminate the desorbed C02. The presence of the contaminating gases -limits the temperature level and specific impulse potential of metallicbiowaste resistojet thrustors because of excessive chemical reactivity atthe desired operating temperatures.
A thermo-fluidic cryopumping concept offers the potential for eliminatingpart or all of the mechanical pumping system, with its high power consumption,while simultaneously providing the means for eliminating the contaminantgases. This concept envisions the use of a space radiator to provide thethermal sink necessary to cryotrap the C0« being desorbed from the molecularsieves in the EC/LS system. By periodically valving off the cryotrap and ;using waste heat from the baseline system Freon-21 loop, the frozen cryo-trapped C0? could be vaporized, increased in pressure, and pumped to C0~storage tanks. A second major objective of the present investigation was,then, to examine the feasibility of this concept in some detail and to com-rpare it with the baseline mechanical pumping system for the desorbed CO,,.
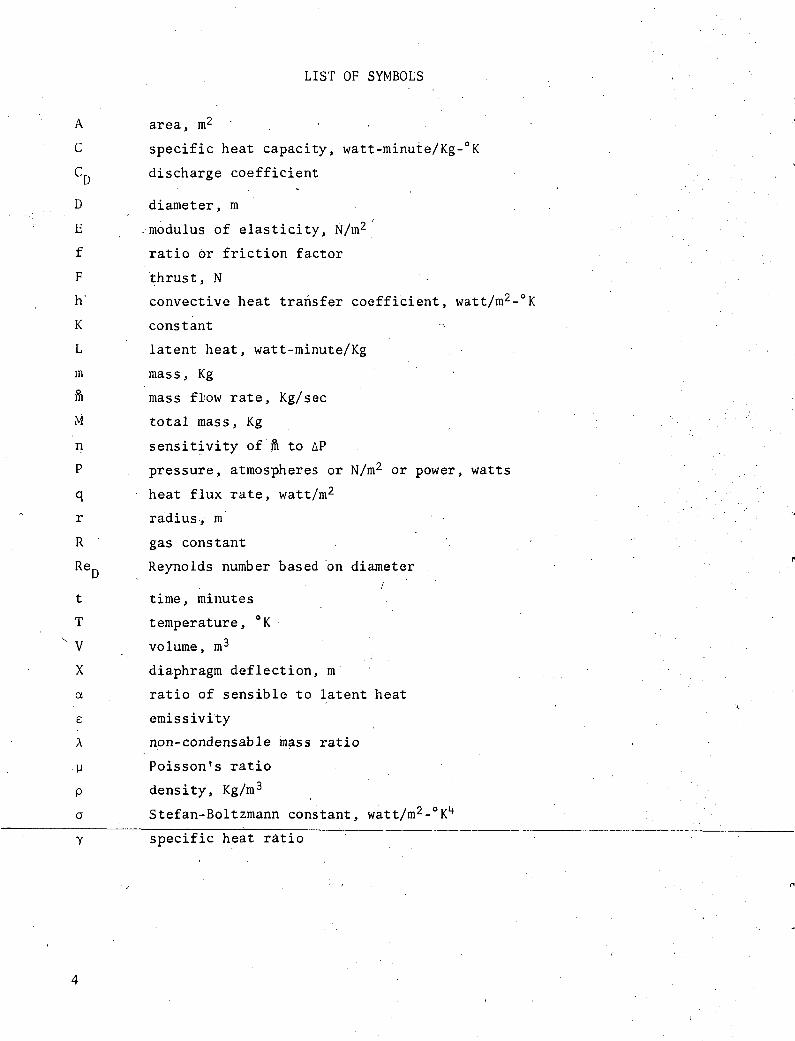
LIST OF SYMBOLS
A area, m2 . •
C specific heat capacity, watt-minute/Kg-°K
C discharge coefficient
D diameter, m
E /modulus of elasticity, N/m2
f ratio or friction factor
F thrust, N
h' convective heat transfer coefficient, watt/m2-°K
K constant -^
L latent heat, watt-minute/Kg
m mass, Kg '
m mass flow rate, Kg/sec
M total mass, Kg
n sensitivity of ft to AP
P . pressure, atmospheres or N/m2 or power, watts
q heat flux rate, watt/m2
r radius, m
R gas constant
Re Reynolds number based on diameter' • /
t time, minutes
T temperature, °K
V volume, m3
X dia.phragm deflection, m
a ratio of sensible to latent heat
e emissivity
X non-condensable mass ratio
y Poisson's ratio
p density, Kg/m3
a Stefan-Boltzmann constant, watt/m2-0^
Y specific heat ratio

Subscripts
C chamber or control
D diaphragm
e effective
fr flow restrictor
F Freon 21
m mass
NC non-condensable
0 orifice
P panel
R relax
S supply or solid phase
t thrustor
T tube or total
v. volume
V vapor phase

MASS FLOW LIMITING DEVICES
Thrustor Flow Limiting Requirements;s:j4S";iq.::..rb • •!.
Mass flow limiters have been considered in order to provi.de; • jl-.i.qiirid pro-pellant flow control for resistojet type thrustors. Difficulties were exper-ienced with resistojets operated on water (ref. 1) and tiyara'zi'rie'-'Cref vl 2)using constant pressure type propellant feed systems. Instabiljrti-esywer.eobserved as the result of the very large starting mass flow rate associatedwith liquid propellant surging into the empty thrustor. In the case^of the.HO propellant test, the effect was to over-cool the thrus;tpjrjytj3;C,the;rppintwnere liquid water passed through the nozzle throat with the subsequent for-mation of ice. Flow limiting devices were incorporated into later' VeVistojetdesigns in order to correct the flow instabilities. Isx^
' ^ ' ' y < - r •• :
In a concentric-tubes resistojet (ref. 1), the use of a pre-evapbratorresulted in good flow limiting, as reported in reference's;. .;,H Itfi) thlsu case, thepre- evaporator must be hot to insure vaporization of the water before it entersthe thrustor. Several minutes are required to preheat the evapor t'o'r , whilea few watts (2 to 3) will hold it in a ready-to-steam condition -rfor,ca.i^lO-mlb.size thrustor. It should be pointed out that the pre- evaporator concept canbe integrated into the thrustor structure and that it has been provenjvto bean effective flow limiter, but that it also imposes a constraint • ojiqt-he reactioncontrol system by requiring either preheating or sustained heating.
Acceptable flow control with the hydrazine thrustor is reported in ref-erence 4, using a porous element in the propellant inlet region to effect aflow dispersion. This thrustor requires preheating to initiate decompositionof the N_H . The flow limiting in this case is analogous to the pre-evaporatorin the water resistojet being necessary to control the decomposition reactionin a stable manner. While a specific liquid flow limiter may be beneficial tothe hydrazine resistojet, it does not eliminate the need for preheating. Aflow limiter may, however, eliminate the preheating requirement for the waterresistojet concept, thereby simplifying the operating mode for this thrustorand greatly improving thrusting response.
Before discussing flow limiter concepts, it is helpful to review brieflythe thermal -transient picture of starting a biowaste resistojet. A start-upproblem arises when a liquid propellant is to be used because of the necessityto ensure that only vapor is present at the nozzle throat for flow controlreasons. This particular problem obviously does not occur with gaseous pro-pellants .
Consider liquid water, for example, being supplied to a cold thrustor byan unrestricted-constant pressure supply. The supply pressure would be thedesign operating pressure of the thrustor with an allowance for pressure drop~fn~~th~e~~feed~sys'tem~:thrustor would fill with liquid water in less than a second and the liquidmass flow rate through the nozzle throat would be of the order of 100 timesthe design mass flow rate based on high temperature steam' flow through thenozzle. In this mode, the thrustor cannot be started. That is, the amount ofpower required to make steam would be an order of magnitude higher than thedesign power. If this power were available and were applied, local heat transfer instabilities could result as the transition to steaming occurred and a

heater burn-out would very likely occur. A flow limiting device is requiredto be able to minimize the starting power requirements and to obtain a stableand safe start-up mode. In addition, a large initial rate of propellarit feedis undesirable from a structural point of view. Large inertia forces (waterhammering) can occur with unrestricted flow into an evacuated thrustor. . .
Preheating the thrustor to full operating temperature is not.consideredpractical from power control and thermal shock points of view. Preheating to anominal ready-to-steam condition of the order of 500°K (900°R) might.be feasible.The power required to hold this temperature would be small (a watt or two) . Amore sophisticated power control system would be required in this case than forfull power operation only. However, unless the thrustor incorporates an evaporatorsection with adequate thermal capacity, an unrestricted propellant feed rate could ,still thermally swamp the thrustor with liquid flow and again prevent start-up.On the other hand, with a device to limit liquid flow to near the design flow rate,start-up from 500°K, or even a cold start-up, would be feasible and safe.
A resistojet thrustor can be preheated to about 500°K, a ready-to-steam con-dition, in the order of 10 seconds. A fraction of full design power would be usedfor preheating to avoid overheating the heater elements. A few watts would thenhold the 500°K condition until propellant flow is initiated. The preheated thrus-tor would make steam instantly when propellant flow is started. Conversely, acold thrustor with full power and limited propellant flow initiated together wouldbe in a steaming condition in about 5 seconds. Of the order of 100 more secondswould be required to reach design operating conditions. During the 5 seconds ofstarting from a cold condition, some liquid water could pass through the nozzlethroat, and some small ice particles could form downstream of the throat. The iceparticles would be expected to break away and not create a problem in the thrustor.However, the passage of liquid and/or ice particles would cause perturbations inthrust which might be undesirable depending on the reaction control system require-ments. An advantage of the cold start with flow limiting is control system simpli-city. The resulting lower specific impulse with momentary over-thrusting for thefirst few seconds may be disadvantageous in which case the ready-to-steam preheatedstart-up with flow limiting would be preferred.
Mass Flow Limiting Concepts
Fixed and variable geometry concepts were considered for flow limiters. TableI lists these concepts, with the fixed geometry devices divided into passive andactive categories.
TABLE ICONCEPTS SUITABLE FOR FLOW LIMITING
1. Fixed Geometry - Passive
a. Fixed Restrictorb. Cavitating Venturic. Non-vented Vortex Amplifierd. Vented Fluidic Devices

2. Fixed Geometry - Active
a. Evaporatorb. Cavitating Venturi with Vaporization or
Ultrasonic Inducerc. Electrolysisd. Electrokinetic Effect
3. Variable Geometry - Passive and Active
a. Flow Controllerb. Positive Displacement Pumpc. Thermal Expansion Element ,d. Joule Magnetostriction Effecte. Wiedeman Effect .
The passive devices extract power directly from the flowing fluid, in the form .of pressure drop, in order to cre_ate the flow limiting effect. The active devicesalso utilize fluid flow power in addition to other power inputs, typically elec- .trical. Within these classifications, the variable geometry flow controller(3.a.) may be passive (i.e'. , spring-diaphragm operated valve controlling pressuredrop across a restrictor), while the remaining four variable geometry devices areof the active type. The passive concepts listed in table I fall into the classreferred to as fluidic devices.* Of the active devices, those with fixed geo-me^tries can be considered hybrid-fluidic devices. The variable geometry devicesare conventional in the fluid control sense. Those having minor moving parts arealso considered hybrid devices. A reasonably constant supply pressure is presumedfor all of the devices. A constant pressure supply is not necessary for the flowcontroller and pump, however.
The purpose of the flow limiter is to minimize flow variations with thrustor.pressure. Since the thrustor is downstream of the flow limiter, thrustor pressureis essentially the back pressure on the flow limiter. It ranges from absolutezero before starting to design pressure at final operating conditions. Brief des-criptions for the table I concepts are as follows:
l.a. Fixed Restrictor. - This is the simplest of the devices,consisting of a fixed geometry flow resistance such asan orifice, nozzle, or capillary tube.
l.b. Cavitating Venturi. - Physically, this is also asimple device, consisting of a nozzle with a diffusersection (venturi). Functionally, this device is morecomplex in that it requires cavitation of the flow inthe diffuser for flow control.
I.e. Non-vented Vortex Amplifier. - The vortex amplifier is . ,;—a-vari-abl-e-fl-ow-restri-cting-devi-ce-uti-H-z-i-ng—a-
constrained vortex. The non-vented vortex amplifier isa mass conservative device in that the usable outputmass flow is equal to the total input mass flow.
*Devices without moving parts using moving fluids to perform sensing, control,information processing, and/or actuation functions.
8

l.d. Vented Fluidic Devices. - These include devices whichresult in modulated output flow rates as the result ofinteracting fluid streams. A portion of the throughputis vented, or dumped, and wasted relative to use with aresistojet thrustor. In view of this disadvantage,these devices (proportional, digital, and vented vortexamplifiers) are not considered practical for resistojetflow limiting.
2.a. Evaporator. - This can include the pre-evaporatordiscussed in the previous section which completelyevaporates water being supplied to the thrustor. It canalso include a variable degree of partially evaporatedwater passing through a fixed restrictor to achieve flowlimiting. A flow signal feedback would be required on thepartial evaporation rate to control flow limiting in thelatter case.
2.b. Induced Cavitating Venturi. - This device is essentiallythe same as item (l.a.) with the addition of some form ofexcitation to induce cavitation. For the low mass flowrates being considered for biowaste resistojets, it may bedifficult to obtain reliable cavitating phenomena in a venturi.Excitation (ultrasonic vibration or local-partial evaporation)may be required to insure repeatable cavitation in a venturiflow nozzle.
2.c. Electrolysis. - Electrolysis of a portion of the waterpropellant flowing through a restrictor could be used to achievethrottling, this requires water with sufficient conductivity anda flow feedback signal, as in the case of the evaporator (2.a.),to control the rate of electrolysis.
2.d. Electrokinetic Effect. - Water is a polar liquid. In contactwith certain solids, some of the liquid molecules becomeattached to the solid in a preferentially oriented manner.This layer of bound molecules is capable of immobilizing some
. . . .of the ions existing in the body of the fluid. The total effect .is the formation of a double layer of charges. The remainingliquid has a net charge resulting from the abstraction of ionsfrom the liquid body. The liquid can, therefore, be caused to-move under the influence of an electric field. Using a capillarybundle or a porous frit, a head of water of the order of onemeter can be generated with an electrical potential of the orderof 100 volts. While high field strengths would be necessary togenerate large pressure differences for adequate resistojetflow limiting, power consumption would be reasonably small.
3.a. Flow Controller. - This device is a conventional fluid dynamic-mechanical device, usually a diaphragm-operated, spring-loadedvalve controlling pressure differential across a fixed restric-tor. This device is considered as a back-up approach to thefluidic devices.

3.b. Positive Displacement Pump. - A positive displacement pumpcan provide accurate flow limiting. This concept is givena back-up status in view of the complexity associated withthis kind of pumping system.
3.c. Thermal Expansion Element. - Using electrical heating,' abimetallic element can be used to effect flow control throughdimensional changes in various flow devices.
3.d. Joule Magnetostriction Effect. - This effect involves a changein physical dimensions of a ferromagnetic material in responseto an applied .magnetic field. The geometry change in turncan be used as a variable size flow restrictor. Pressure signalfeedback would be required to control the applied magnetic, field.
3.e. Wiedeman Effect. - The Wiedeman effect is the twist producedin a conductor placed in a longitudinal magnetic field whena current flows through the conductor. Torsional distortionis due to a helical resultant of an impressed longitudinalfield on the circular field of the conductor. The materialexpands or contracts parallel to the helical lines of forceproducing the twist.
Of these many techniques which might be used to effect flow limiting in aresistojet water propellant feed line, the fluidic mass conservation devicesl.a., l.b., and I.e., the hybrid-fluidic devices 2.a. and 2.b., were, studies.The so-called hybrid-fluidic controller uses a stiff-highly reliable diaphragmand is comparatively simple relative to more conventional mechanical flow con-troller devices. Electrolysis was not a candidate because of the low expectedconductivity of the water propellant (typically 20 micro-mho per centimeter)and the adverse effect which would occur with the probable variable conductivity.The electrokinetic effect, while a possible solution was also not pursued in viewof the high electrical potentials required. The many varieties of variable geo-metry devices could serve as a source of back-up flow limiting, if required.
By operating with a supply pressure above the thrustor design chamberpressure, and a flow restrictor, reasonable flow control can be accomplishedwith thrust pressure varying from an initial hard vacuum condition (thrustor off)to the final design pressure (thrustor at steady state conditions). The fixedrestrictor is the simplest of the devices being considered and will serve asa baseline concept for performance comparisons.
Mass Flow Limiter Performance
A perfect flow limiter in a hydrodynamic sense would be^a device whichwould hold mass flow rate constant as the pressure differential changed across thedevice. For a resistojet thrustor operating with liquid water propellant,- it isnot necessarily desirable to have a perfect flow limiter. The desired flowlimiter characteristics depends on the thrustor configuration and on the dynamicrequirements of the thrustor. Compared to a given thrustor with propellant controlledby a perfect flow limiter (i.e., constant mass flow rate), the same thrustor with a
10

less than perfect flow limiter (which would pass an initially higher massflow rate) could reach steady state operating conditions more rapidly. Theactual thrustor response would depend on the electrical power schedule used,the thermal capacity of the thrustor, the flow limiter characteristics, andwhether or not preheating is employed before propellant flow is initiated.
The following discussion presents an theoretical examination of theperformance to be expected from various candidate flow limiting devices. Thisis followed by an experimental evaluation of some of the candidates.
Theoretical performance. - Evaporation of liquid water propellant mustoccur in the resistojet thrustor system in a controlled manner. Either anevaporator must be included in the thrustor heat exchanger assembly as aspecific evaporation state, or a separate pre-evaporator must be close-coupledto the resistojet(s) , to insure that vaporized water is supplied to the thrustorheat exchanger. An evaporator with sufficient thermal capacity can, in effect,serve as a flow limiter. /The thermal capacity, accumulated during pre-heatingis necessary to flash the initial surge of liquid water occuring at start upto rapidly build up chamber pressure and thereby restrict any further liquidsurges.
A thermal analysis has been conducted to show that a stable start-up can beachieved with a pre-heated evaporator and a constant propellant supply pressure.A typical 25-mlb thrustor condition was considered as follows:
Thrust = 25 mlbDesign Specific Impulse = 250 seconds - . .Design Mass Flow Rate = .0454 grams per secondConstant Chamber Pressure = 1 atmosphereDesign Chamber Temperature = 1800°KDesign Evaporator Outlet Temperature = 420°KInlet Propellant Temperature = 298°K
For these conditions, the steady-state on design power that is put into the pro-pellant by the evaporator is 123 watts and by the final heater stages is 147watts for a total power input to the propellant of 270 watts. Typical thermallosses at the design condition would be about 30 watts for a total electricalpower. input—o.f...3_00 watt_s._ _. ._ i _
Figure 1 presents the results of a set of calculations for chamber tempera-tures varying from a saturated steam temperature (at 1 atmosphere) of 373°K tothe design chamber temperature of 1800°K. The power heating the propellant isshown to be relatively constant dropping at first from 271 watts at the saturatedsteam condition and then increasing to the final design value of 270 watts. Thethermal power loss is proportioned with temperature from 5 watts at saturationto 30 watts at the design condition. The mass flow corresponding to a givenchamber temperature (an instantaneous value) is shown normalized to the designvalue. Mass flow is almost 2.3 times the design value for the case of saturatedsteam leaving the thrustor exhaust nozzle. At the lower temperatures, the specificenthalpy requirement is lower compensating for the higher flow rate and therebyresulting in the relatively constant power heating the propellant. At propellantflow initiation, a flow surge occurs, with a transient mass flow typically 100
11

2.4
2.2
2.0
oh-(£.
o
COCO
1.8
1.6
1.4
1.2
1.0
CHAMBER PRESSURE CONSTANT AT 1.0 ATM.350
300
250
™ 200o3.
ofLU
5Oa. 50
100
50
0
UJ
l<tr
co.
I I ITOTAL ELECTRIC POWER
DESIGNPOWER
POWER HEATINGTHE PROPELLANT
RATIO OF INSTANTANEOUSTO DESIGN MASS FLOWRATE
EXCESS POWERFOR START UP
TRANSIENT
-200 -600 1000 I4CTO 1800
CHAMBER TEMPERATURE, Tfr ,°Kelvin
Figure 1.- Mass flow and power characteristics of 25-mlbresistojet starting with water propellant.
12

times the design mass flow. This very quickly reduces to the 2.3 times valueas the initial surge flow is flashed to steam. For simplicity, this transientis not indicated in the figure 1 representation, and chamber pressure isassumed constant at a typical value of 1.0 atmospheres.
A rigorous transient analysis has not been made; however, a close approxi-mation of the time to reach design conditions can be made from figure 1. Con-sider, for example, a resistojet which includes an integral pre-evaporator. Priorto commanding propellant flow to the thrustor,the evaporator would be preheatedto about 420°K. Some preheating of the final heater stages would also occur.Consider that the thrustor power for the final heater stages is commanded on withpropellant flow initiation. Chamber temperature would typically begin at orslightly above the saturation temperature. Assume that a total electric powerinput of 330 watts (30 watts above design) is used for the heat up transient.The excess power available for heating the thrustor structure and increasingthe chamber temperature would be the difference between the total electric powerinput and the sum of the power heating the propellant and-that which is lost:
Pexcess = Pelectric " I heating propellant + lossj (i)
The excess power is shown in figure 1 and is adequate to effect a rapidstart-up transient to the design condition. A stable start up is assured bythe always positive value of the excess power. On an average, for the caseconsidered, about 60 watts of excess power are available. A typical 25 mlbthrustor would require about 6000 watt-seconds of additional thermal inventoryto power-up from the start to design conditions. The time to effect the start-up would then be 6000/60 to 100 seconds. Upon reaching the design condition,total power would be reset to the design value of 300 watts as indicated infigure 1. A shorter start-up transient would occur with a higher power inputand/or a thrustor with a smaller thermal capacity.
The above discussion is presented to indicate that pre-evaporators can beused effectively to achieve a stable start-up with water propellant supplied atconstant pressure. The evaporator must, of course, be preheated to a ready-to-make-steam condition prior to initiating propellant flow. The preheating wouldnormally require from 100 to 200 seconds depending "on the evap'orator "design.For a typical thrustor, final design conditions are reached after about 100 secondsadditional time. During this start up interval specific impulse would increasefrom about 120 seconds (near-saturated steam conditions) to over 250 seconds atdesign conditions. The effective specific impulse during the start-up transientwould be less than 200 seconds, which may not be significant in terms of longthrusting times contemplated for the space station biowaste resistojets.
A more effective flow limiting device, while not absolutely necessary, canimprove the propellant-thrustor system performance in the following ways:
1. The start-up transient of the biowaste resistojet with waterpropellant can be shortened by limiting the initial high pro-pellant surge flow thus not requiring as high a thermal capacityin the evaporator stage.
13

2. In keeping with item (1), a smaller-lighter mass evaporatorstage can be used.
3. A higher degree of reliability would be offered with the flowlimiter in the event adverse start up conditions occurred(i.e. inadequate evaporator stage warm up).
4. The sensitivity of thrust to changes in supply pressure can bereduced by introducing a flow limiting device.
The first three items are obvious from the discussion above. Item 4is shown to be true in the discussion which follows.
PROPELLANTSUPPLY
VALVE
-THRUSTOR HEATER
rFLOW\RESTRICTOR
LANT— J'E
APfr AP4
THRUSTOR NOZZLE
Figure 2.- Flow restrictor-thrustor pressure drop model.
Figure 2 indicates schematically the relative placement of a flow ••restrictor in relation to the propellant supply and thrustor. The pressurelosses across the'flow restrictor AP~ and the thrustor AP which result from amass flow rate m are indicated. The supply pressure necessary to achieve achamber pressure of P is given by:
P = P + AP,- + AP^s . c fr t (2)
The thrustor pressure drop is essentially a laminar conduit type loss for~whTch~~AP7is proportional to mass flow rate.
APt = (3)
For a contraction-expansion type flow restrictor, for example,2
AP^ = K,m14
fr (4)

Thrust F of the resistojet is proportional to mass flow rate for specificimpulse assumed constant. The assumption of specific impulse constantfollows an assumed constant chamber temperature resulting from controllingelectric power to hold a constant final stage heater temperature. Sincemass flow leaving the thrustor exhaust nozzle for constant geometry andconstant temperature is proportional to chamber pressure, then
F = K 3 m ' . ' • • • (5a)= K4Pc (5b)
Substituting equation (2) into equation (5b), thrust relates to the supplypressure and pressure losses as follows:
F = Ki, (Ps - Pfr - APt) C6)
Differentiating equation (6) and dividing by equation (6) to obtain asensitivity expression for thrust
^-=^dPs -%d(APfr) - %d(APt) (7)
Relating the pressure loss differentials to thrust from equations (3), (4)and (5a), solving for the sensitivity of thrust to a change in supply pressure,and simplifying, the following is found
dPs/Ps Pc + APt * 2APfr
which reduces further to:
dF/F _ 1 (9)APfr/Ps
A plot of equation (9) is presented in figure 3. It shows that thecentage change in thrust due to a percentage change in supply pressure isattenuated by the pressure loss across a flow restrictor. Note that thepressure loss in the thrustor does not affect the sensitivity of thrust tosupply pressure. This is a consequence of the laminar conduit type pressureloss assumed (equation 3) which is realistic for the 25-mlb size thrustor.The figure 3 curve is for a contration-expansion type flow restrictor suchas a nozzle or orifice. Obviously the limiting value of AP~ /P of 1.0 infigure 3 is unrealistic, since it corresponds to zero pressure arop in the
15

1.0
Q. •Q.IDCO
v>O 0.
If)
2°tX
f»— UJ> a:
°-
UJCO
0.9
0.8
0.7
0.6
0.5
CONTRACTION-EXPANSION TYPEFLOW RESTRICTOR
\
0.2 0.4 0,6 0.8
PERCENTAGE OF -SUPPLY PRESSURE LOSTLN__FLOW_RE.STRLC_TOe,_A-Pfr/lPs_
1.0
Figure 3.-- Effect of supply pressure changes on thrustfor various flow restrictor pressure losses.
16

thrustor. Reasonable values of AP,- /P are in the range of 0.4 to 0.5,for which the effect of supply pressure on thrust is attenuated about 30%.This means that for a given allowable thrust error due to chamber pressurevariations, the supply pressure allowable tolerance limits can be broadenedby about 30% with the use of a flow restrictor.
The pressure differential across a fixed restrictor varies with massflow rate. The relationship between pressure differential and mass flowrate depends on both the type of restrictor and the type of flow (i.e.,whether it is laminar or turbulent). Fixed restrictors can be geometricallyclassified as: (1) laminar conduit, (2) turbulent conduit, and (3) contrac-tion-expansion devices.
Laminar conduit includes capillary tubes and porous elements in whichlaminar flow persists and mass flow rate is linearly proportional to pressuredifferential. .
ft AP (laminar conduit) . (10)
Equation (10) follows -from the Darcy Equation for which
' A P-v fft2 ' (11)
and the friction factor f for laminar flow in conduit is
. f = " ,, i :ReD ff
For smooth conduit with turbulent flow at Reynolds numbers below 10 , thefriction factor is typically given by the Blasius relation
. f , R /1/4- ft'1/4 ." (13)ed
'In this case "'" ""r "~ ~ ""
0 4/7 ,m ^ AP (turbulent conduit) (14)
For a contraction-expansion device, such as a nozzle or an orifice, withnegligible viscous loss, >
1/2 'm ^ AP (contraction-expansion) (15)
which follows from the flow equation for such a device
A = C A \/2pAP ' (16)
17
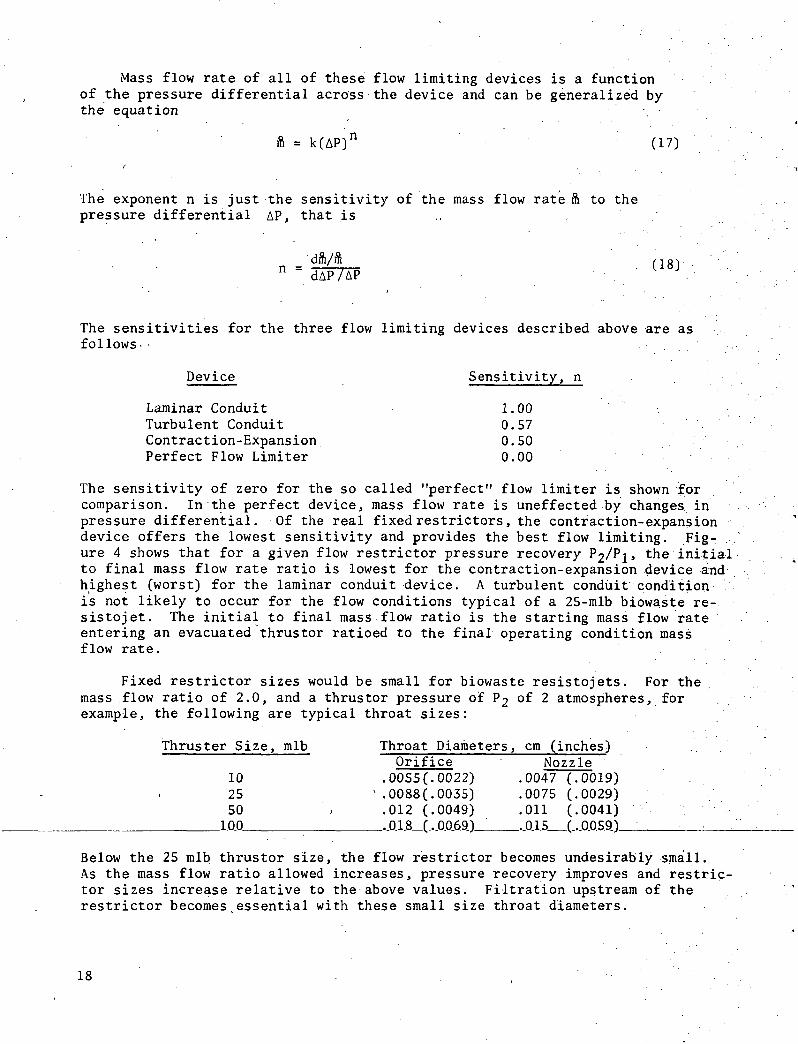
Mass flow rate of all of these flow limiting devices is a functionof the pressure differential across the device and can be generalized bythe equation
ft = k(AP)n (17)f
The exponent n is just the sensitivity of the mass flow rate ft to thepressure differential AP, that is .. .
The sensitivities for the three flow limiting devices described above are asfollows . .
Device Sensitivity, n
Laminar Conduit 1.00Turbulent Conduit 0.57Contraction-Expansion 0.50Perfect Flow Limiter 0.00 .
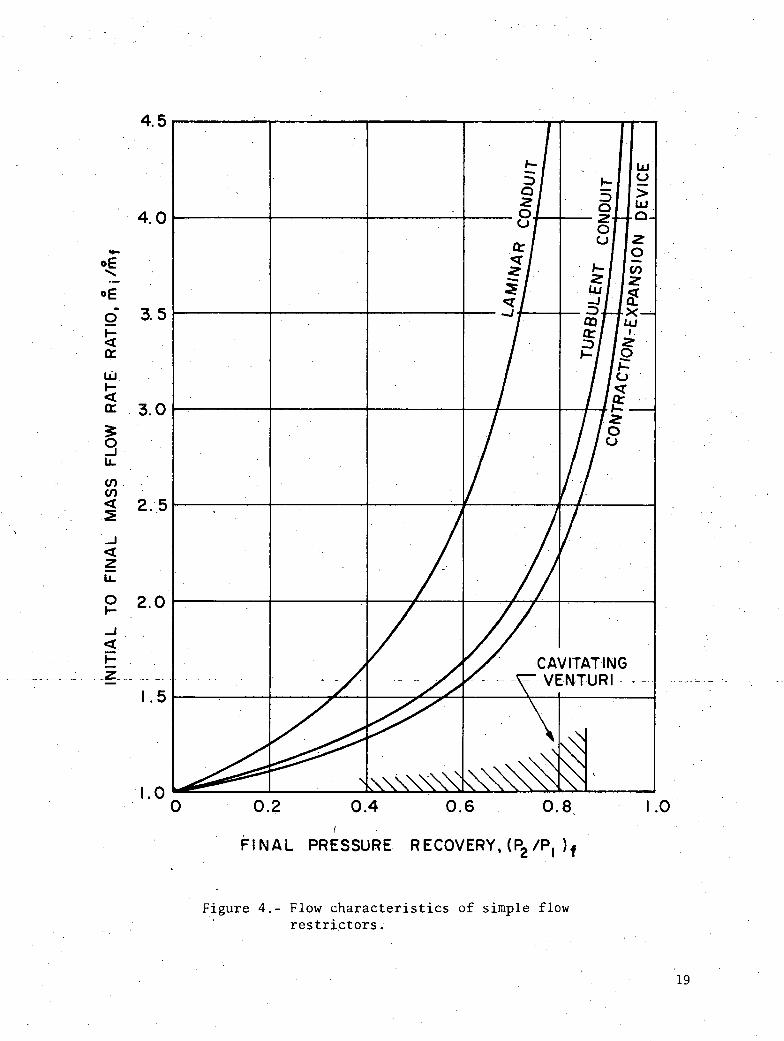
The sensitivity of zero for the so called "perfect" flow limiter is shown forcomparison. In the perfect device, mass flow rate is uneffected by changes inpressure differential. Of the real fixed restrictors, the contraction-expansiondevice offers the lowest sensitivity and provides the best flow limiting. Fig- .ure 4 shows that for a given flow restrictor pressure recovery 2 1' the initialto final mass flow rate ratio is lowest for the contraction-expansion device andhighest (worst) for the laminar conduit device. A turbulent conduit conditionis not likely to occur for the flow conditions typical of a 25-mlb biowaste re-sistojet. The initial to final mass flow ratio is the starting mass flow rateentering an evacuated thrustor ratioed to the final operating condition massflow rate.
Fixed restrictor sizes would be small for biowaste resistojets. For themass flow ratio of 2.0, and a thrustor pressure of ?2 of 2 atmospheres, forexample, the following are typical throat sizes:
Thruster Size, mlb Throat Diameters, cm (inches).Orifice Nozzle
102550
100
.OOS5(.0022)1 .0088(.0035)
.012 (.0049)
.018 f .0069)
.0047 (.0019)
.0075 (.0029)
.011 (.0041)
.015 r.0059)
Below the 25 mlb thrustor size, the flow restrictor becomes undesirably small.As the mass flow ratio allowed increases, pressure recovery improves and restric-tor sizes increase relative to the above values. Filtration upstream of therestrictor becomes essential with these small size throat diameters.
18
4.5
4.0
°EO 3.5
6cc
o
3.0
en</>< 2.5
P 2.0
1.5
CAVITATING-^"••VE-NTURI-
FINAL PRESSURE RECOVERY, (P2/P, )f
Figure 4.- Flow characteristics of simple flowrestrictors.
19

The venturi, a flow nozzle followed by a diffuser, offers excellentflow control at high pressure recovery when used with cavitating liquidflow. Typical of current cavitating venturi technology is a mass flowratio approaching unity with a pressure recovery as high as 0.85 as re-flected in figure 4. The following equation describes the pressure variationoccurring at the nozzle inlet (station 1), the nozzle throat (station 2),and the diffuser exit (station 3) of a venturi:
Pl - P2 * — " P3 * AP2-3
Equation (19) is the Bernoulli equation with the following assumptions:
a. Negligible velocities at stations 1 and 3.b. Negligible viscous loss from station 1 to 2.c. Negligible mass flow of vaporized fluid at stations 1,2, :
and 3. . ,
In. equation (19), P represents the local static pressures (equal to thelocal stagnation pressures at stations 1 and 3), p is the liquid density,and u is the velocity.
AP2-3 represents the pressure loss in the diffuser. It is this termwhich varies with different degress of cavitation to adjust to variationsin ?3. While in a cavitating mode with constant inlet pressure PI} thesum of ?3 and AP-2-3 remains constant over a considerable range of P^.Typically, the pressure recovery ?3/Pi ranges from 0.85 to about 0.10 forconstant mass flow rate at constant inlet pressure as cavitation increases.During cavitation, P2 is equal to the vapor pressure of the liquid andremains constant, as does u2, for constant inlet pressure. During theinitial start-up of a thrustor using a cavitating venturi for flow limiting,hysteresis and cavitation delay may occur which can result in an initiallyhigher mass flow rate. This delay phenomenon is more likely to occur withsmaller size cavitating Venturis.
Cavitating Venturis have been used in throat sizes ranging down to about0.3 centimeter (0.12 inches). For the biowaste resistojet, Venturis smallerby as much as two orders of magnitude may be required. In this situation,scaling effects, including viscous effects and time delay effects, becomecritical, and it is not clear whether a miniature venturi will cavitatereliably; nor is the resulting initial to final mass flow ratio predictable.
Cavitation conditions are best expressed by the cavitation parameter
n .. „ .— f
(20)
where Py is the vapor pressure of the liquid. Equation (20 follows from theleft hand side of equation (19) with P2 equal to Pv. Ideally, cavitation would
20

occur when K drops to or below unity. Usually, cavitation effects presentproblems which investigators try to avoid, and hence, experimental data reflecta trend toward making K as low as .possible. Data on cavitation near submergedobjects reflect a definite trend toward lower K for smaller sizes. In the caseof a deliberate cavitating venturi for flow limiting purposes, as high a K aspossible is preferred to keep the venturi a reasonable size (not too small).
No adequate scaling criteria are available for predicting cavitation per-formance for flow limiter mass flow rates of interest. Some indication of theeffect of size may be obtained from work on submerged bodies. In terms of apredicted value of the cavitation parameter K based on a pressure distributionabout the body, the incipient cavitation parameter K. suggested in reference 5is given by
„ ' ' Constant .Ki = Kp ' , ,,1/2• F (u0d)
where d is the diameter of the body, and u0 is a reference velocity. Reference6 suggests a similar relationship for turbulent flow, and the first power onfor laminar flow. These would suggest that K. decreases as size decreases.
In general, the following factors relative to a flow limiter design affectcavitation:
a. Nuclei are necessary for cavitation. These may include gas inthe liquid and those nuclei fixed on solid surfaces.
b. Viscosity and surface tension are important in the initialgrowth rate of vapor bubbles and decrease their rate of growth.
c. Turbulence (and roughness which induces turbulence) enhancesthe inception of cavitation.
-x
d. Inception of growth of nuclei depends very little on theduration of a favorable (suitably low) pressure. Subsequentgrowth-, necessary-for~effective-flow -control- in-a cavitatingventuri, does depend on the duration of a favorable pressure,however.
e. Hysteresis occurs iri cavitation, is a scale effect becominggreater for decreased geometric size, and depends on thecirculating and surface-bound nuclei.
Data obtained by Kermeen, et al., (ref. 7), and given in reference 8,indicate how cavitation numbers for a particular submerged body decrease fromabout 0.65 for a 2-inch diameter body to about 0.4 for a 0.25-inch diameterbody. For a biowaste resistojet limiter of the cavitating venturi type, anorder of magnitude guesstimate of 0.1 is made for the cavitation parameter toget an idea of the size of the venturi throat. Using the continuity equation
m = pu2CnA2 (22)
21

and the cavitation parameter, equation (20) , the following expression foreffective diameter is derived:
Deff (23)
RA is the effective area; therefore, the geometric diameter is given by:
Deff
geom (24)
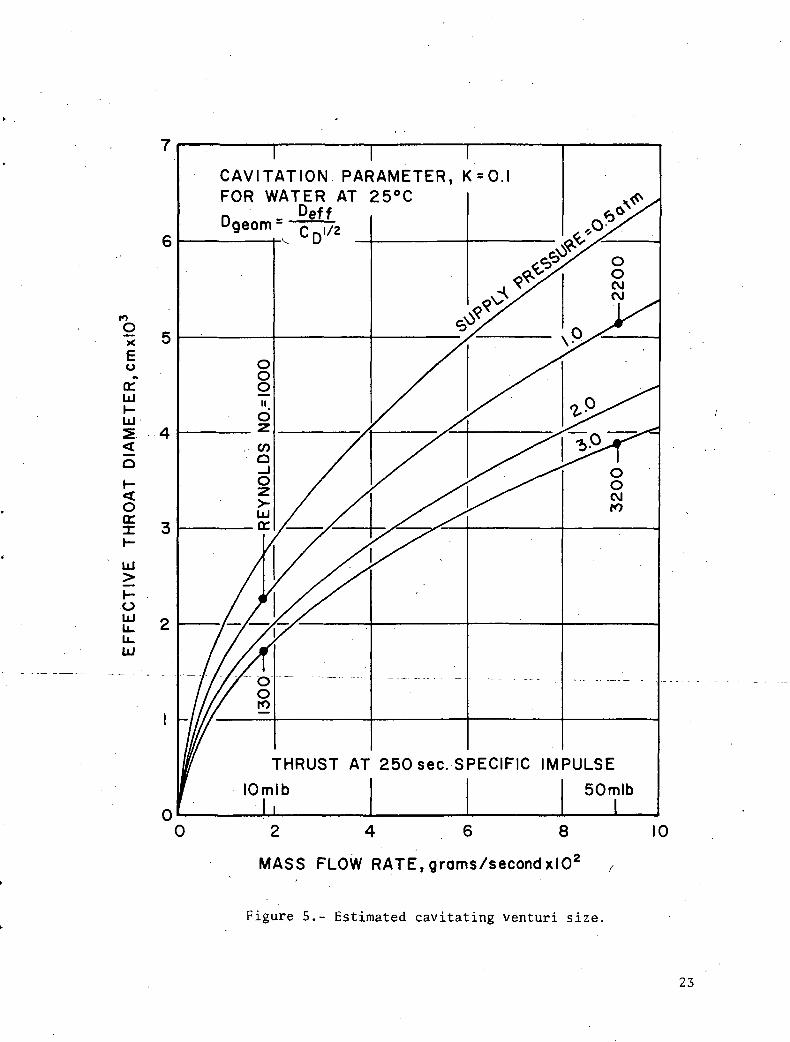
Figure 5 presents the effective throat diameter for a cavitating venturiwith the assemed K value of 0.1 for cold water (25°C). Supply pressure PIis a parameter. Mass flow rates for 10 and 50-mlb size thrustors, based on aspecific impulse of 250 seconds, are indicated as well as some typical Reynoldsnumbers based on throat diameter. For example, a venturi for a 50-mlb thrustorwith a supply pressure PI of 2.0 atmospheres would have a throat diameter ofthe order of 0.0043 cm (0.0017 inches) with a Reynolds number in the transitionregime. Therefore, the cavitating venturi, like the fixed resistor, may havean undesirably small throat size. Compared to the orifice and nozzle fixedrestrictions, Venturis are smaller by virtue of the higher throat velocities,yet they incur smaller pressure losses as a result of good pressure recovery.
Sensitivity of a cavitating venturi to changes in vapor pressure P canbe shown to be small. From the mass flow equation for laminar flow through theventuri nozzle throat, for example, .
(25)
where the density, throat area, discharge coefficient, and cavitation parameterare taken as constants. Actually, second order effects can' occur with p, C_.,and K. Sensitivities of mass flow rate with supply pressure PI and vaporpressure P are as follows:
dm/m
dPl/Pl P l - P v
(26)
dm/ft
dP /Pv v
- P
P l - P v
(27)
22
toOX
eo
ft
CCIDI-UJ2.
OCCX
LU
OLU
UJ
I I ICAVITATION PARAMETER, K = 0.lFOR WATER AT 25°C
^y^wi i i /->
D
THRUST AT 250 sec. SPECIFIC IMPULSE
MASS FLOW RATE, grams/second xlO5
Figure 5.- Estimated cavitating venturi size.
23

For typical conditions (25°C water and 2 to 3 atmosphere supply pressure) ,sensitivity to supply pressure is about 1.0 while sensitivity to vapor pressureis low at about -0.01. For turbulent flow, sensitivities can be shown to beabout one-half those for laminar flow. These sensitivity values show thatsupply pressure must be maintained relatively constant for good flow limitingand control. On the other hand, changes in vapor pressure due to temperaturechanges are not a critical factor. For a + 25°C change in temperature, massflow rate changes less than +2.5 percent for laminar flow. The cavitationparameter will .undoubtedly be a variable in the small venturi size and maypresent a problem which can only be evaluated from experimental data.
Thus far, the discussion on cavitating Venturis has been limited to passivedevices. In the small sizes required for biowaste thrustors, it may be necessaryto use active devices in which some form of excitation is used to induce cavi-tation. This offers the advantage of removing or minimizing hysteresis effectsand time delay effects. Cavitation can be induced by acoustic (including ultra-sonic) energy, and also possibly by partial evaporation of the fluid stream inthe vicinity of the venturi throat. Exploratory type tests using ultrasonicexcitation to induce cavitation in small orifices and nozzles are discussedin the next section. .
Another technique which was considered to enhance cavitation in a smallventuri involves superimposing a swirl or a vortex-like flow on the axialventuri flow. The swirl is used to increase the local velocity for cavitationwhile decreasing the axial velocity associated with throughput. In this way,.the geometric diameter of the venturi could be increased. Swirl could have anadverse effect on the diffuser pressure recovery, however, which is of primaryimportance in proper flow limiting with a cavitating venturi.
Swirl could be obtained by injecting the liquid supply tangentially into avortex chamber forming the entrance plenum to the venturi throat. For thesmall flow of interest, viscous effects will be predominant and free vortexflow would notloccur. Viscous coupling causes the flow to revert toward aforced vortex condition with lower swirl velocities near the region of interest .-the venturi throat. Vector diagram considerations indicate that even. with asubstantial swirl component of velocity, the diameter of the venturi throatcannot be increased by more than a factor of 2. With a diameter increase of afactor of 2, the swirl velocity is theoretically above 95 percent of the cavi-tation velocity. Inadequate margin exists in this case and cavitation couldbegin upstream of the venturi throat-diffuser section, causing adverse flowlimiting performance.
While swirl in a cavitating venturi does not appear to aid significantlythe critical size situation for the 10 to 50-mlb class of thrustors, it maybe useful in a vortex amplifier. Flow throttling and control can be obtainedby varying the amount of swirl imposed on radial flow throughput in a vortexamplifier. This device has been considered as an alternate _f low _Hmi.ti.ng
^ ^ not generally use cavitation for .flow control. In this device,the swirl is not used to affect a higher throat velocity for purposes ofcavitation enhancement; rather, the swirl, through centripetal forces, imposesa back pressure on the fluid supply to affect flow throttling. Cavitationcoupled with a standard vortex amplifier (non-vented type) may have additionaladvantages .
24

The pre-evaporator, close-coupled or integrated into the thrustor, is aunique flow limiter. Initial mass flows would be relatively quite high as thepre-evaporator .fluid inventory is established. Initial vapor passing to thethrustor may partially condense, resulting in increased flow rates relative toa non-condensing situation. However, the vapor carries thermal energy into thethrustor for a more rapid heat-up. Also, at design conditions, pressurerecovery can approach 100 percent (low loss) with a properly designed pre-evaporator. As a result of initial condensation in the thrustor, some waterflow-icing phenomena can occur in the thrustor nozzle. This is not dangerousto the thrustor, but does result in erratic thrust levels at start-up. Erraticthrust levels (momentary bursts to higher than design thrust) would also occurwith a cold thrustor started up with a good mass flow limiter.
A pre-evaporator tested under various flow and power conditions with a 10-mlb biowaste resistojet is discussed in reference 9. This pre-evaporator wasfound to be unstable with gas-liquid mixtures in that a piston effect occurredin which water slugs were pushed forward by the gas causing pressure surges.The evaporator did function properly with either gas or water separately. Theflow instabilities observed (ref. 9) could result in an adverse thermal tran-sient resulting in a thrustor-heater over temperature or burn-out situation.Conceivably, a two-phase condition could occur during propellant change-over,for example, or it may be desirable for some applications to handle two-phaseflows. In effect, these instabilities, if allowed, would require a deratingof the thrustor to provide sufficient tolerance against burn-out.
It appears that an evaporator should not be the sole flow limiting deviceused. Instead, one of the other types of flow limiting devices previouslydescribed should be employed, preferably in.conjunction with an evaporator. Apre-evaporator section integrated with the thrustor heater is advantageous.Thermal leakage into the heater could preheat the entire thrustor to a ready-to-steam condition. However, this requires anticipating the thrusting commandor holding the preheated condition indefinitely. The mass flow limiter pro-vides two advantages. • First, the thrustor can be reliably commanded on from acold condition; and secondly, it improves the reliability of a pre-evaporatortype thrustor by serving as a backup flow control in the event the evaporatoris not sufficiently heated.
A hybrid flow- limiter was designed -in order _to .achieve .improved flow_limiting performance over that of a contraction-expansion device (the best ofthe fixed geometry devices). The hybrid device was considered in order to takeadvantage of the performance characteristics of a moving element while remainingsimple and highly reliable. Compared to an orifice, for example, the hybridwas conceived to significantly improve flow limiting performance without intro-ducing a significant reduction in restrictor size and thereby incurring ablockage due to particle contamination penalty.
A device utilizing a stiff, low-stressed metal diaphragm was conceived andis depicted in the figure 6 schematic. The key elements of the hybrid flowlimiter are the flexing diaphragm containing one off-center orifice, an orificeplate containing two orifices (one centered and one off-center), and a spacerring to space the diaphragm off of the orifice plate. The orifice plate isbacked up by a thicker plate to prevent flexing of the orifice plate underpressure loading.
25

INLET BODY
DIAPHRAGM (one orifice)
SPACER
ORIFICE PLATE ( two orifices)
BACKING PLATEOUTLET BODY
_F i gu r.e_6..^_Hyb ri d_f.1 ow—1-i-mi-ter—s eh ema-t-i-c—
26

The hybrid flow limiter would be located in the flow restrietor positionshown in figure 2. Prior to turning on the thrustor, the limiter would beevacuated to the space vacuum through the thrustor. Upon commanding waterpropellant flow, an initial maximum pressure differential (Pj - P2) . would occuracross the diaphragm causing it to flex in the downstream direction and throttlethe center orifice in the orifice plate. The flow rate would be defined by theresistance of the two off-center orifices flowing in series, with a small orzero contribution from the center orifice which is also in series with the dia-phragm orifice. As thrustor chamber pressure (essentially P3) increased, flowrate would be reduced, as with' a fixed contraction-expansion device. However,the flow reduction would be accompanied by a reduction in (P± - P2) , causingthe diaphragm to relax, uncovering the center orifice and, in effect, causingmass flow rate to increase relative to a fixed restrietor. Over the pressureoperating range of the flow limiter, a flatter, less sensitive flow curve wouldresult.
The hybrid flow limiter performance can be predicted analytically using flowequations for the orifices and the deflection formula for the diaphgragm. Thesimplified derivation which follows will assume that the off-center orificesare not restricted as the result of diaphragm flexing. This would be the caseif the off-center orifices were located at the far edges of the diaphragm andorifice plate, or if these orifices were recessed with appropriate counter bores.
Assuming that the diaphragm deflection and mass flow rate will make a smoothtransition from an initial to a final pressure differential condition, it isonly necessary to evaluate the flow equations at these limiting conditions toestablish the working forces on the diaphragm. Let the orifice plate holes beidentical in size with the flow area A_. Let A- represent the diaphragm holeflow area. Further assume that the diaphragm will close off the center orificeat the initial flow condition. The following equations define the initial andfinal mass flow conditions :
ft. = KAD (Pi - P^ = KAQ (P2 - Ps) (28)
ftf = KAD (Pi - P2)£1/2 = 2KAQ (P2 - P3)£
1/2 .(29)
In the final flow condition reflected by equation (29) , it is assumed that thediaphragm completely uncovers the center orifice. The constant K is taken tobe the same for equations (28) and (29) and includes a square root of densityterm and a flow discharge coefficient term. In effect then, the dischargecoefficient is assumed to be the same for each of the orifices in both limitingmodes. For incompressible flow and similarly sized orifices, this is areasonably good assumption.
Solving equations (28) and (29) for the respective mass flow rates in termsof the overall pressure differential (Pi - P3)
27

ft. =1(PI - PS),
1/2
(30.)
*f •
The initial to final mass ratio becomes
(Pi ; P3),f1/2
A.im-
V.-1
/ AD \1 2 A 0/
f V
^ V
2
}
1/2
1?3f
Pl
1/2
(31)
(32).
where P$. has been taken as zero (thrustor evacuated initially),
The working pressure differentials across the diaphragm are
(Pi - (33)
(Pi - P2)f(Pi - P3)f
(34)
1+KThe supply pressure PI is a constant for the thrustor application.. Relatingequation (31) for the final flow condition to an equivalent effective orificearea A for which the mass flow rate is given as
ft, - P3) (35)
the effective orifice diameter is found to be
28

•1/4 (36)
Typically, the diaphragm orifice diameter D is 33% larger than the orificeplate hole size DO, and D is found to be 87% of D , or 15% larger than D .Therefore, the minimum orifice size D_ is close (within 35%) to the effectiveorifice diameter D of the device, and a flow blockage problem is not incurred.The closing down or the orifice plate center hole occurs only during the start-up transient. During steady-state, both orifice plate holes are open. There-fore, the center orifice is not considered susceptible to blockage relativeto the effective diameter of the device.
The diaphragm deflection due to pressure differential loading is representedby equation (6) of Chapter 10 in Roark (ref. 10) for a circular plate, uniformlyloaded, and with clamped edges. Solving Roark's equation for the diaphragmradius r
r = 16E
- P2)(l - r, [f:* ••«« (f)1j1/4
t (37)
Laminar flow will occur in a hybrid flow limiter sized for the biowaste resisto-jet. The center hole in the orifice plate can be considered to be fully openwhen the diaphragm stands off a distance x for which the gap peripheral areaAp is equal to the hole area AQ.
0
For A = AQ, then
V4 (38)
Considering that the diaphragm has a total deflection of x initially and justcloses the center orifice, then it is required to relax through the x distancefor the final flow condition. For deflections small compared to the diaphragmthickness t, equation (37) indicates a direct .proportionality between deflection
Therefore, the total required diaphragm deflection xx and load (Pl - P2) .can be estimated to be
X-T, = x,.(Pi - P2)'i
(Pi - P2). - (Pi - P2)f(39)
29

For typical hybrid flow limiter conditions corresponding to prototypehardware tests discussed in the next section, solutions to equations (32), (33),(33) minus (34), (36), (37) and (39) are shown graphically in figure 7. Therequired diaphragm radius r follows from equation (37) using the total de- :flection x_ from equation (39) and the initial pressure differential (Pi - P2) .which causes^ the total deflection. As thrustor chamber pressure builds up, thediaphragm relaxes an amount x when the final pressure differential of (Pj-. - ?2)fis reached.
The variables listed in figure 7 include a modulus of elasticity and Poisson's.ratio for corrosion resistant steel, a supply pressure of 3.06 atmospheres(45 psia) and a final thrustor chamber pressure of 2.04 atmospheres (30 psia).An orifice plate hole size D_ of 0.0152 cm (0.006 inches) was chosen as con-venient for fabrication of tne prototype unit. The relaxation distance XRfollows from equation (38). A diaphragm thickness t of 0.0254 cm (0.010inches) was chosen to result in a reasonable prototype size. The prototypeunit was fabricated with a diaphragm orifice size of 0.020 cm (0.0079 inches). :, .According to figure 7, a total deflection of 0.0154 cm is required and the (x/t)term in equation (37) is about 1/3 of the first order term. Thus, equation (39)provides an estimate of x . A more accurate analytical evaluation of the XTrequired can be obtained oy carrying both terms in equation (37) when derivingan expression for x~ in terms of XR and the pressure load terms. The equation(39) simplification is suitable for sizing prototype hardware where the final
^adjustments are made by selecting a spacer of appropriate thickness.
The stress in the deflected diaphragm due to pressure loading can beevaluated using the equations of reference 10. For the prototype hybrid flowlimiter, under worst case conditions, the total stress in the diaphragm wasfound to be about 1.1 x 10⁸ N/m2 (16,000 psi). This is well below the endurancelimit for corrosion resistant steel. Cyclic lifetimes measured in millionsof cycles should be possible, indicating that the hybrid flow limiter should bea highly reliable device.
Note from figure 7 that a mass flow ratio (initial to final) of the orderof 1.2 is possible with the hybrid flow limiter. For the figure 7 conditions(final pressure recovery of 67%), a contraction-expansion device would resultin a mass flow rate ratio of about 1.7, based on figure 4. The hybrid deviceoffers a considerable improvement. Actual test results on a hybrid flow limiterare given in the next section. The device tested was a prototype which wasnot optimized. It produced a mass flow ratio of 1.3, compared to a ratio of1.83 measured with an orifice type contraction-expansion restrictor.
Experimental performance.- Several flow restrictors, including orifices,Venturis, vortex valves, and a hybrid-fluidic controller, have been studiedexperimentally to determine their characteristics as flow limiting devices.Testing was conducted on a flow bench (shown in figure_8)_su.i,tab_lje__for_"evaluating the low flow .rates of liquid water to be expected with biowasteresistojets. Flow meters seen in the center of the flow bench control panelcover the range 0.002 to 9 grams per second. Typical water mass flow ratesfor a 25-mlb biowaste resistojet are from 0.04 to 0.08 grams per second,depending on chamber temperature. Final miniaturization of the flow limiting
30

3.2
2.8
£ 2.4o>0>E
0)u
cu"OX0>
T3CO
IX
H
2.0
0.8
0.4
0L
- oV
QC.UJ
3V)to
C.oCrt
a.(OoE
uia:ui
UJa:
enUJcta.
D0 = O.OI52cm
t =0.0254 cmXR = 0.0038cm
PI =3.06atm.P3. =0atm.
P = 2.04atm.
E=l.93x10^0.3
IO N/m2
0.0)4 0.016 0.018 0.020 0.022 0.024
DIAPHRAGM ORIFICE DIAMETER, DD , cm
Figure 7.- Hybrid flow limiter predicted performance.
31

Neg. 125-3
Figure 8.- Fluid flow bench.
32

devices was not undertaken and these tests include flow rates to as low as0.06 grams per second. The objective of these tests was to evaluate feasibilityof candidate flow limiting concepts in sizes sufficiently small to approximatelycorrespond to the flow regimes, delay times, etc., pertinent to an actualapplication flow condition.
Referring to figure 2 for water flow initiation to a resistojet in space,there would be a hard vacuum condition downstream of the shut-off valve. Aninitial increment of water would flash to vapor and would affect the startingdynamics. The flashing to vapor would be beneficial to the achievement ofsteady-state conditions by increasing the rate of pressure buildup to operating 'chamber pressure. The two-phase flow effects were not included in the experi-ments discussed in this report. Flow characteristics were evaluated in termsof pressure drop, which, for incompressible flow devices, is independent ofthe absolute pressure level. Testing to include the actual hard vacuum startingenvironment should be included when the final selected flow limiting conceptis studied in detail for actual incorporation into a thrustor design.
Table II lists the fixed geometry flow limiter configurations tested.Included were five small diameter orifices and nine vortex valve configurations.Three of the orifices (configurations E, F and G) were molded plastic precisionorifices made by Johnson Service Co., Milwaukee, Wisconsin and used in fluidiccircuits. The smallest orifice tested (configuration N) was made by drillingthrough a 0.025 cm thick plate with a number 97 twist drill. This orifice wasalso tested with radial inflow by spacing a second plate 0.010 cm upstream ofthe orifice plate (configuration P). A larger (0.084 cm diameter configurationL) orifice was made by drilling through a 0.025 cm thick plate with a number66 twist drill. None of the orifices are truly orifices as accepted in fluidmetering practice; that is, with a plate thickness limited to 1/8 of the holediameter (L/D of 0.125). L/D's are listed in table II and range from 0.3 to1.7 for the tested configurations. As a result of using the relatively thickplate orifices, a small viscous loss is introduced which would shift'thetheoretical sensitivity of a contraction-expansion device from 0.5 toward 1.0,corresponding to a laminar conduit device.
The vortex valve tested was a modified General Electric VC-13 non-ventedvortex valve. This valve can be seen in the foreground in figure 8 as a blackblock on top of__the sheet metal mounting stand. The stock VC-13 vortex valveis comprised of a stack of 14-0.010 cm thick-photoetched-corros'ion resistant"steel shims. Each shim has a vortex chamber of 1.22 cm diameter with fourradial supply channels and two tangential control nozzles. The vortex shimstack is bounded on the top and bottom by blank shims having 0.23 cm diameterholes serving as flow sinks. The effective flow nozzle size of the stockvortex valve is 0.24 cm diameter; much too large for the intended flow limitingrequirements. The valve is non-vented in that all input supply and controlflow leaves as the output flow. For these tests, the vortex valve was modifiedby removing some of the shims and substituting smaller sink hole sizes toresult in a flow reduction factor compared to the stock valve of as much as 60.
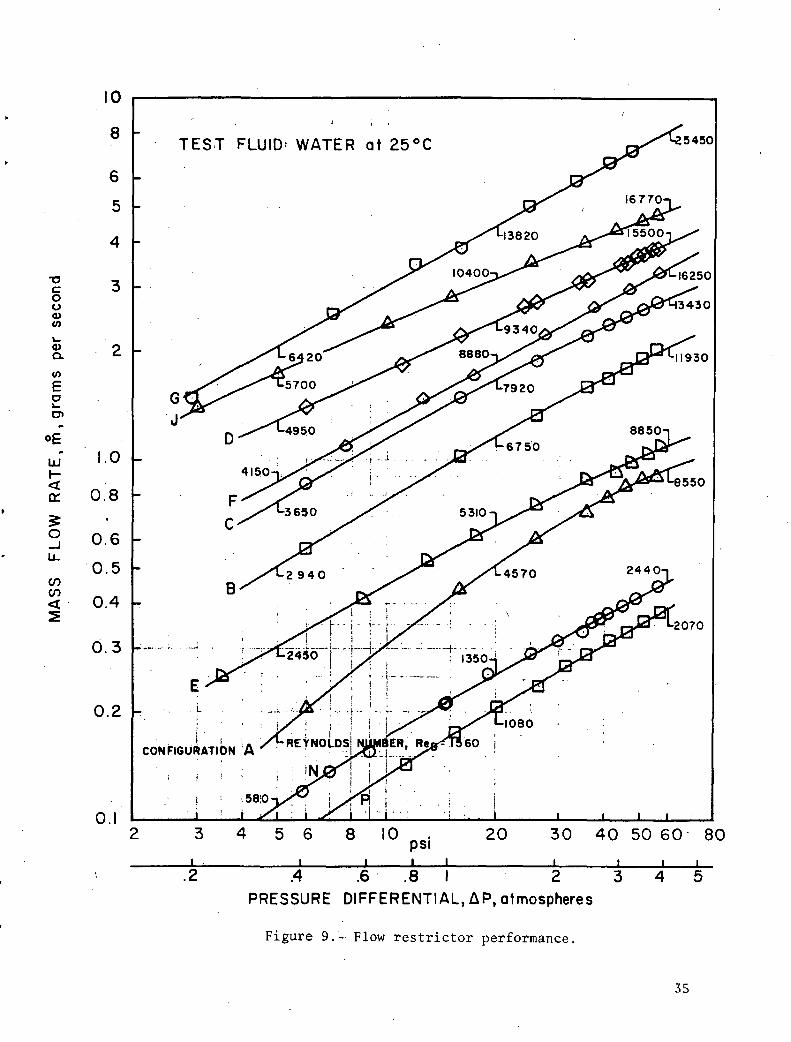
Figure 9 presents flow performance data for several orifice restrictorsand vortex valve configurations tested, plotted on log-log scales. This isconvenient in that the local slopes of the performance curves are equal tothe sensitivity n as defined in equation (18). Thus, devices with the least
33

TABLE II
FIXED GEOMETRY FLOW LIMITER CONFIGURATIONS TESTED
Config.
ABCDEFGHIJ .KLMNP
Type
Vortex
Orifice
Vortex
OrificeVortexOrificeOrifice
Restrictor*Diameter
cm
.023
.036
.043
.053
.025
.043
.066
.025
.035
.061
.053
.084
.026
.015
.015
VortexDepth
cm
-.010.020.030.051
---
.010
.020
.081
.051-
.010--
SinkFlowAreacm2
.55xlO~2
.89xlO"21.21x10 21.43xlO"2_
--
.77xlO"2
,55xlO"2
1.98X10"2
1.98X10"2_
8.2xlO"2
-..
OrificeLength toDiameterRatio
_ .
—_
1.00.60.4_
— ._
_
0.3_ ' •
1.71.7
Entrance toOrificeDiameterRatio
3.03.472.32
. -**
***
*
**Equivalent 'diameter based on CD = 0.65 for vortex valve configuration.
In this test, a small .084 cm diameter sink was used with full vortexvalve depth (0.142 cm) to affect an orifice restriction.
In this test, flow into the orifice was radial between the orificeplate and a parallel plate forming a .010 cm thick spacing.
34
ou
(UQ.
£o
UJ
o
10
8
6
5
4
1.0
0.8
0.6
0,5
0.4
0.3
0.2
TEST FLUID' WATER at 25°C
CONHGU
5450
5 6 8 10 psi 20 30 40 50 60 80
.4 .6 .8 I 2 3PRESSURE DIFFERENTIAL, AP, atmospheres
Figure 9.- Flow restrictor performance.
35

slope offer the best flow limiting. Reynolds numbers are indicated on thefigure 9 curves at,pressure drops of 5, 20 and 60 psi. The Reynolds numbersare based on the orifice diameters in the case of orifice restrictors. In thecase of the vortex valve, flow restriction results from the series arrangementof the control parts and outlet sink holes. An effective restrictor diameterbased on mass flow rate, pressure differential, and a discharge coefficient of0.65 (an arbitrary value) was used to calculate the Reynolds numbers for thevortex valve configurations. >
For the orifices, laminar flow should persist within the orifice, even forReynolds numbers above 2000-2300 (the upper limit for laminar flow in tubeshaving fully developed flow). Insufficient flow length is available for fullydeveloped flow. Approach Reynolds number is negligible for the configuration Land N orifice. For the configuration E, F, and G orifices, the entrance-to-orifice diameter ratios are listed in table II, indicating Reynolds numbersin the entrance to the orifices of about 1/3 those in the orifice proper. Inthe flow range of interest (of the order of 0.1 gram per second), laminar flowconditions exist and viscous effects introduce an influence on the overall flowsensitivity corresponding to laminar conduit flow (n equal to unity). Anevaluation of entrance Reynolds numbers is complicated in the vortex valve bythe vortex spin-up and a clear definition where the actual restriction occurs.Generally speaking, the control ports through which flow was introduced intothe vortex chamber are small high velocity-high L/D nozzles, suggesting theintroduction of turbulent wake into the vortex chamber. This is probably dampedbefore reaching the sink hole. For configuration A at least, with a flow depthof only 0.010 cm, laminar flow probably persists everywhere in the vortex valverestrictions (control nozzle and sink hole).
Table III compares slopes or sensitivity of m to AP, taken from the low APand high AP ends of the curves in figure 9. The highest flow vortex configurationtested - configuration J - had the least sensitivity of all of the configurationstested. That is, it had the lowest value of n at each AP region, as comparedto the other configurations with a slope of 0.40 at the high AP end and 0.45at the low AP end. This indicates that vortex action does offer improved flowlimiting characteristics compared to a simple fixed restrictor (orifice ornozzle). Referring to the sensitivities given in table III for configurationsJ, D, C, B, and A in order of decreasing vortex effective size, the trend istoward increased sensitivity.
An otherwise large flow rate - very high Reynolds number vortex yalve - wasscaled down in thickness while maintaining the spin chamber diameter constant.Most likely, as configuration A and B for instance, the tested vortex valveis non-optimum having a spin chamber very thin relative to its diameter. Ina flow size compatible with the 25-mlb resistojet, it is anticipated thatviscous effects in the vortex chamber will predominate and sensitivity willnot be significantly lower than that of a simple fixed restrictor.
Recalling that theoretical sensitivity shifts from 0.5 for a contraction-expansion device to 1-.0 for a laminar conduit device, we see that the numericaltrend is consistent with the data of table III. Slopes are greatest at the lowflow low AP - lower Reynolds number end in all cases. The large size - highReynolds number orifice configurations F and G exhibited linear characteristics,or constant sensitivities, of about 0.55, close to the theoretical value for
36
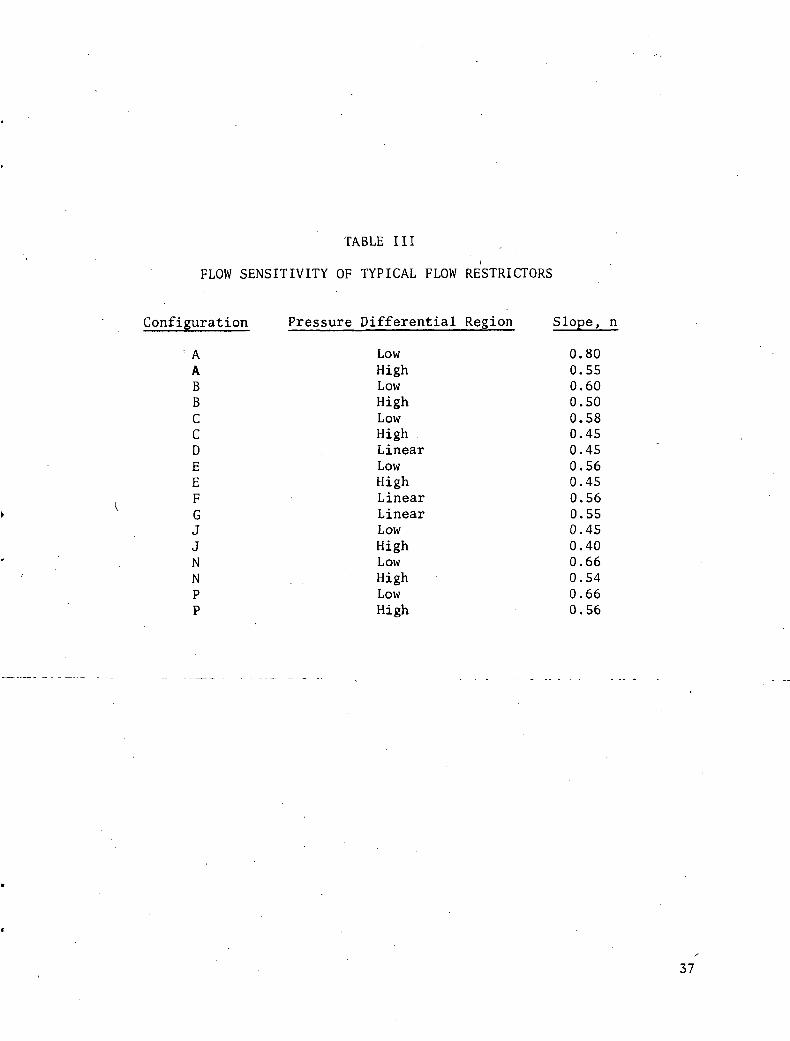
TABLE III
FLOW SENSITIVITY OF TYPICAL FLOW RESTRICTORS
Configuration Pressure Differential Region Slope, n
' A Low 0.80A High 0.55B Low 0.60B High 0.50C Low 0.58C High 0.45D Linear 0.45E Low 0.56E High 0.45F Linear 0.56G Linear 0.55J Low 0.45J High 0.40N Low 0.66N High 0.54P Low 0.66P High 0.56
37
the contraction-expansion device. The 0.55 sensitivity value indicates acontraction-expansion value of 0.50 with some superimposed viscous (laminarconduit) effects. .The 0.45 sensitivity for the high AP value of configurationE is apparently a matter of resolution of the data. The smallest orifices, Nand P, indicate additional viscous effects with a mean sensitivity of about0.6. Scaling down to the flow requirement of a 25-mlb resistojet, viscouseffects would be more predominate and a sensitivity of about 0.7 is likelywith a fixed contraction-expansion device.
The vortex valve configurations were also tested as true fluidic vortexthrottling valves. Flow was introduced into the normal supply ports and theturn-down characteristic was documented as control port flow was introduced.Typical data are shown in figure 10 where the total output mass flow rate atconstant supply and output pressures is seen to decrease for configurations Band C as control flow is increased (represented by an increase in controlpressure). No turn-down resulted with vortex valve configuration A, comprisedof only one 0.010 cm thick shim. While the total output flow increased slightlyfrom 3.39 to 3.49 grams per second for the data of figure 10, the supply flowdecreased from 3.39 to 2.76 grams per second with increasing control pressure(flow). The data of the valve is such that, for constant supply pressure andoutput pressure, the vortex chamber flow may or may not spin-up to effect areduction of supply flow. If the sink presents the major flow resistance, then,with both supply and control streams competing for the sink with AP across thesink held constant at
APSINK=PS - Pout =3° - 4 " 26Psi'
the supply flow necessarily must throttle back as control flow ii inputted.Since a substantial turn-down ratio was observed with twice the number ofshims (configuration B) it is likely that some degree 'of spin-up was evidentin configuration A also.
The data of figure 10 are not specifically related to the flow limiterproblem. These data are presented as a matter of interest to those engaged influidic systems technology. The units of psig for pressure are used for con-veniences in comparing the vortex valve performance against manufacturer's(GE) data sheets. .
When the vortex valve is operated as a flow restrictor (data.of figure 9),supply flow is zero and all flow is inputted via the control nozzles (tan-gential to the vortex chamber). For this case, a significant spin-up in thechamber is to be expected even for the single shim configuration A. Comparingthe high pressure drop region sensitivities in table III for configurations A(smallest vortex) and E (smallest orifice), it appears that the configurationA vortex valve behaves essentially like an orifice at the high flow end. Atthe low flow end, it appears configuration A behaves much like an orifice witha significant viscous loss factor, by virtue of its 0.80 value of sensitivity,which approaches the theoretical laminar restrictor value. In order to verifythat configuration A flow was not predominately controlled by the sink holesize used, configurations H and M were run with the same single vortex shim butwith considerably larger sink areas. Flow performance was essentially unchangedfrom that for configuration A, demonstrating that the flow resistance was
38

8
oo0>tn
o>o.tn
o
o£uTI-<cc
§
Q-h-3O
TEST FLUID-- WATER at 25°G
CONFIGURATION SUPPLY PRESSURE, OUTPUT PRESSURE,psig OUT' psig
TURN DOWNRATIO
A
arfo
A
B
B
C
30.020.0
30.020.0
4.0
6.0
9.0
8.3i
0.97I .7
3.02.3
15 20 25 30 35 40 45
CONTROL PRESSURE, Pc,psig
Figure 10.- Vortex valve performance.
50 55
39

essentially that of the vortex chamber control nozzles. Comparing the higherReynolds number configurations D (vortex) versus F and G (orifices), it appearsthat the vortex valve used as a flow restrictor results in 80% of the sensi-tivity of the simple orifice restrictors. For smaller configurations but alsohigh Reynolds numbers (c.f. the high AP end of the curves for configurationsA and E), the vortex valve shows no advantage over the orifice restrictor.Scaling across curve A to E to compare slopes at about the same Reynolds number,it appears that the orifice restrictor is less sensitive.
It should be emphasized that a large flow rate, - very high Reynolds number :vortex valve - was scaled down in thickness while maintaining the spin chamberdiameter unchanged. Most likely, as configuration A and B for instance, thetested vortex valve is non-optimum. Additional testing would be required atlower Reynolds numbers approaching those of the actual flow limiter/biowasteresistojet application in order to assess the true capability of the vortex valvefor the intended application. For example, thfe vortex valve, and more specifi-cally the spin chamber, should be scaled down to effect a more optimum spiralpath relative to the viscous effects which start to become predominate at theReynolds numbers of interest. Considering a 25-mlb biowaste resistojet with aspecific impulse of 250 seconds as an example, a mass flow rate of 0.045 gramper second is indicated. This required scaling down by a factor of about 4.5from the lowest vortex valve flow data of figure 9. Effective flow restrictorsize will decrease to about 0.0075 cm, a factor of 2 smaller than the smallestconfigurations (orifices) discussed in this report. As with orifices N and P(see table III), viscous effects will become important causing significant in^creases in the sensitivities. In this respect, further development of,the vor-tex' valve- for the 25-mlb resistojet flow rate does not appear to offer animprovement over the simpler orifice restrictor.
While not specifically relevant to the flow limiting problem, it is valuableto other fluidic applications to note that a factor of 7 reduction in the GEVC-13 vortex valve depth was accomplished, resulting in a useful turn-downratio of 3.0 (configuration B at 30 psig supply pressure). The reduction inpower consumption (i.e., mass flow rate) for this case relative to a stock VC-13 vortex valve was a factor of 63.
Three small Venturis were fabricated having throat diameters of 0.015 cmand divergence half angles of 11° and 15°. Ultrasonic excitation was tried onthe Venturis and on one of the orifices tested to' induce cavitation. An ultra-sonic generator operating at 21KHz with a total output power of 80 watts andan output power density of 0.4 watts per square centimeter was used. The flowfittings were pressed against the generator transducer output plate. Whilethe power level within the flow restrictors could not be measured, it isbelieved sufficiently strong to induce cavitation in otherwise marginal flowsituations.
To evaluate qualitatively the effect of the ultrasonic energy on small~fl"ow streams, orifices of various sizes were free-jetted in a water bathexposed to the transducer. Faint clouds of minute bubbles were visible in •the free jets from orifices having throat diameters of 0.025 to 0.050 centi-meters. Typically, the minute bubbles formed a core about 0.4 cm long whichstood off from the exit face of the orifices about 0.1 cm. With the smallestorifice, the clouds were barely visible and were intermittent.
40
Flow data taken on the Venturis and one orifice plate 0.015 cm in diameterby 0.025 cm long revealed no throttling due to cavitation, with or withoutexcitation. On the contrary, under most flow conditions, small (of the orderof 2 percent) flow increases occurred when the excitation was applied. Theultrasonic excitation appeared to have reduced the viscous boundary effects.The faint clouds observed in the free jet tests may have been outgassing. Inany case, these clouds are believed to contain very minute bubbles and did nothave the appearance of a vigorous active cavitation core.
Pressure differentials of up to 4.7 atmospheres were applied to thecavitating Venturis, resulting in values of the cavitation parameter fromequation (20) as low as 0". 1. The tests conducted are considered preliminarysince only a few geometries were evaluated. Since delay time is an importantfactor in cavitation and particularly so in the miniature size venturies tested,perhaps long throat sections would result in cavitation. The 0.015 cm throatsize Venturis are difficult to fabricate without causing what may amount tosignificant discontinuities at the throat-to-diffuser intersection. Therefore,it may be possible under ideal conditions to throttle by cavitation in suchsmall Venturis. It is very likely, however, that performance repeatabilitywould become a problem. In general, it appears that the miniature cavitatingventuri is not a suitable' candidate for a flow limiter for the biowasteresistojet.
Figure 11 shows an assembled and disassembled prototype of the hybrid'flowlimiter. This unit was fabricated using the analytical criteria presented infigure 7 of the previous section as a guide. In the foreground of the dis-assembled view the backing plate, the orifice plate and the diaphragm can beseen (refer to figure 6 for relative placement of the elements in the flowlimiter). Two 0.206 cm (0.081 inches) diameter holes can be seen in the backingplate. Not visible are two 0.0152 cm (0.006 inches) diameter holes in theorifice plate and one 0.020 cm (0.0079 inches) diameter hole in the.diaphragm.The off-center holes (per figure 6) were located 1.04 cm (0.4 inches) off-center.
Next to the two body halves in figure 11 are four typical spacers. . Thesewere fabricated with internal radii (r per equation 37) of 1.52, 1.40, 1.27and 1.14 cm. Each of these internal radius-sized spacers were made in thick-nesses of 0.0053, 0.0078, 0.0109 and 0.0132 cm. The diaphragm was made from0.0254 cm thick corrosion resistant steel shim stock. With this variety ofspacer sizes, the effects of radius and spacer thickness could be evaluated.
The off-center holes in the diaphragm and orifice plate are locatedpart way out along the spacer radius r. The spacer radius r can be seen infigure 6 to set the effective working radius of the diaphragm*. The off-center holes, then, are partially influenced by the diaphragm motion, unlike
* An additional variation relative to the analytical model occurs in theconstraint on the diaphragm. The upstream body half has an internal radiusof 1.52 cm. Therefore, when using the smaller radius spacers, the diaphragmworking radius is effectively slightly larger. This was done for conveniencein making the prototype unit.
41

Figure 11.- Hybrid flow liraiter prototype hardware.
42

the assumption made in deriving the figure 7 analytical performance. Theconsequence of this is not significant. This point is made, however, sincean insufficient off-center distance could result in erratic performance. Tocomply with the analytical model assumptions, the off-center orifices can berecessed in counter bores away from the intermediate space 2 in figure 6.
The prototype was operated with two relative orientations of the off-center holes. In one case, the diaphragm hole was located directly over theoff-center orifice plate hole. Here the interaction of the off-center holeswith diaphragm deflection is eliminated. However, the diaphragm hole exhaustjet is impinging into the off-center orifice plate hole effectively tending tomake the orifice plate hole larger. That is, it passes more flow than it wouldif its input flow was derived from a quiescent condition in the intermediatespace 2 (figure 6) away from the diaphragm hole exhaust jet. In the_ other case,the off-center holes were displaced 180 degrees.
Figure 12 presents typical data taken on the figure 11 hybrid flow limiter.A long hole type fixed orifice restrictor calibration curve (circle symbols)is shown for reference purposes. This fixed orifice had a 0.0152 cm (0.006inches) diameter hole with a length of 0.0254 cm (0.010 inches). Using atotal spacer thickness of 0.0230 cm, the uppermost curve (diamond symbols) wasobtained to show the effective flow size of the hybrid flow limiter withoutdiaphragm deflection action. Ratioing the mass flows at a given pressuredifferential from figure 12, the hybrid flow limiter orifice arrangement iseffectively 50% larger than the fixed orifice. The S-shaped curves in figure12, for which throttling of the center orifice is occurring, indicate that thethrottled hybrid flow limiter is effectively smaller in size than the fixedorifice restrictor.
One curve is shown (open triangular symbols) for the case where the off-center orifices are aligned. The solid symbol data in figure 12 are for thecase of these holes displaced 180 degrees. From the triangular symbol data(open and solid) the effect of diaphragm hole impingement on the off-centerorifice plate hole is seen. In the range of diaphragm interaction (deviationfrom a fixed restrictor trend) the case of displaced holes is seen to resultin less sensitivity of mass flow to pressure drop. Finally, the three curvesof solid symbol data indicate how performance is shifted with changing spacerthickness. The curves can be shifted left or right by using larger or smallerspacer radii. In this- way, the hybrid flow limiter can be optimized for aparticular biowaste resistojet application. The curves are also shifted withspacer thickness; for example, a thicker spacer delays center orifice closingto a. higher pressure differential.
Taking, as a typical case, a thrustor supply pressure of 3.06 atmospheres(45 psia) and a chamber pressure of 2.04 atmospheres (30 psia), the data offigure 12 can be compared. The pressure conditions correspond to an initialpressure differential of 3.06 atmospheres (45 psia) decreasing to a finalpressure differential of 1.02 atmospheres (15 psia). Table IV compares theinitial to final mass ratios for these typical pressure conditions and forthe data of figure 12. In effect, the data have been normalized and do showthe relative improvement in mass flow limiting offered by the hybrid device.The pressure differential range chosen for comparison is arbitrary and doesnot reflect optimums in terms of minimum mass flow rate ratios. Shifting the
43

TEST FLUID: WATER at 25°COPEN SYMBOLS OUTER HOLES ALIGNEDSOLID SYMBOLS OUTER HOLES STAGGERED
Oo.0230cm>
A 0.01 32cm
D 0.0078cm
Oo.0053cm
THICKNESS
O FIXED ORIFICE RESTRICTOR
0.0460 80 100
0.2 0.4 0.6 0.8 I 2 3
PRESSURE DIFFERENTIAL, AP, atmospheres
5 6
Figure 12.- Hybrid flow limiter performance.
44

curves to the right in figure 12 would yield lower mass flow ratios, for example.Table IV also includes values of sensitivity n (see equation 18) taken betweenthe 3.06 and 1.02 atmosphere points along each curve. While the orifice demon-strates a sensitivity of 0.56, the hybrid flow limiter shows considerableimprovement at 0.22.
TABLE IV
HYBRID FLOW LIMITER PERFORMANCE
Device
Fixed Orifice
Hybrid - NoDiaphragm Action
Hybrid
Hybrid
Hybrid
Hybrid
Figure 12Symbol
0AA
SpacerThickness
cm
0.0230
0.0132
0.0132
0.0078
0.0053
Initial to FinalMass Flow RateRatio, m,./m.
1.83
1.85
1.33
1.29
1.27
1.30
Sensitivity,n
.56
.56
.30
.23
.22
.24
For all the hybrid flow limiter data presented in figure 12, a 1.4 cm(0.55 inches) spacer radius r was used. The effective value of r is slightlylarger than that because of the inlet end body radius effect. Referring backto the analytical interpretation of the hybrid flow limiter performance infigure 7, a diaphragm orifice diameter D of 0.020 cm (0.0079 inches) indicatesthat a mass flow rate ratio of 1.15 woula occur and that a spacer internalradius r of 1.44 cm should be used. A total deflection x of 0.0154 cm isindicated, suggesting the spacer thickness to be used. For the 'thickest spacerfabricated (0.0132 -cm) and used in the test-, -a mass-flow rate ratio of -1-. 29(solid triangular data) resulted. Had a slightly thicker spacer, say 0.0154cm thick been used, the solid triangular data curve of figure 12 would havemoved to the right and, for the pressure differential range used to interpretmass flow ratios in table IV, a lower mass flow ratio would have resulted.The same effect could be obtained by using a larger spacer radius to increasethe diaphragm working area.
It appears that the hybrid flow limiter performance can be predicted withsufficient accuracy to make the hybrid concept a readily usable device. Amore rigorous analytical treatment (involving equation 39) and elimination ofdiaphragm deflection interaction with the off-center holes should bring theanalysis and experimental performance into close agreement. Using photo etchingtechniques, the critical parts of the hybrid flow limiter (diaphragm andorifice plate) can be fabricated with sufficient accuracy to obtain a high
45

degree of performance repeatability between assemblies. The mass flow rateratio obtainable with the hybrid device can be tailored to match dynamicrequirements of the biowaste resistojet. In this respect, the mass flow rateratio of the simpler .contraction-expansion device may also be suitable. Thesedevices - both hybrid and fixed geometry configurations - offer a range of massflow rate limiting capability which can be used to optimize the transient per-formance of the thrustor and provide safe and reliable start-up characteristicswith liquid water propellant.
THERMAL PUMPS
General Considerations
Thermal pumps were studied as possible replacements for the mechanicalpumps being considered on the baseline space station for desorption of themolecular sieve of its C02. A cyclic-constant volume cryopumping conceptappears attractive for this function using radiation to dark space for a heatsink and using the space station as a heat source. Figure 13 presents themodel being considered using, for typical parameters, the baseline molecularsieve specifications per reference 11.
The baseline C02 system includes two mechanical pumps. All of the molec-ular sieve desorbed C02 is pumped to an intermediate storage vessel at apressure of 2 to 3 atmospheres. Sixty percent of the desorbed C02 flows tothe Sabatier reactor for conversion to oxygen and 40 percent is availableas resistojet propellant. This propellant is pumped by a second pump to thepropellant storage tanks having a maximum pressure of 20 atmospheres. Threethermal pumping configurations were considered sufficiently attractive fortrade-off studies:
(1) Utilization of two separate thermal pumping systems to replacethe baseline mechanical pumps.
(2) One thermal pump which pumps the entire molecular sieve desorbedC02 to the 20 atmosphere propellant storage tanks with a pressure-regulated return from the propellant storage tanks to the inter-mediate storage tanks.
(3) Thermal pumping between the molecular sieve and intermediatetank only with mechanical pumping of the propellant to thepropellant storage tanks.
Configuration (3) was considered in case thermal pumping to the 20 atmos-phere level was found to be impractical. This option is still attractivefrom a power consumption point of view since the low pressure mechanicalpump~~requires 75 percenf~o"f""tKe~toT;al"~C02 pumping power requirement.
As indicated in figure 13, two molecular sieves are used and desorbedalternately on one-hour cycles. While one sieve is being desorbed for 30minutes, the other is adsorbing for 30 minutes. The molecular sieve outputis 12 Kg'of C02 per day. Exposed to space, the cryopump solidifies C02.
46

OS
Cueex
03
0)
£
I
K)
ooU.
47

By valving off the molecular sieve and valving into the storage tank throughcheck valves, subsequent heating with phase change results in pressurizationand a transfer of the C02 to the storage tanks.
The cryopump is divided into four sections with each section occupying aquadrant in order to have a dark side exposure available for the cryotrappingportion of the cycle. The cryopumping system involves a significant weightpenalty compared to a mechanical pumping system, but offers the following <advantages: \ - ' . • ' . /
/ . . •(1) Negligible electrical power consumption relative to mechanical
pumps.
(2) The bulk of the pump weight is in the space radiators whicheffectively serve to dump spacecraft waste heat. In thisrespect, the radiators supplement or replace a portion of thenormal waste heat radiator system.
, (3) The cryopumping system could be developed to pump a variety /1 of fluids serving other than the resistpjet propulsion system
requirements.
(4) In the case of pumping of desorbed C02, some oxygen is trans-ferred from the sieves. It may be possible to vent a goodportion of this oxygen during the cryotrapping, permittinghigher temperature operation with the resistojets.
Water and Freon waste heat loops are available for heating the thermalpump. In cryotrapping C02, however, temperatures to 162°K are reached whichwould present a freezing problem with the water. The figure 13 model depictsFreon-21 at about 300°K to heat the pump for pressurization of.the C02 intothe storage tanks. Storage tank pressures from 2 to 20 atmospheres were con-sidered in this study per the baseline system requirements.
During cryotrapping, either valve 1 or 2 and valve 3 are open (see figure13). Valves 4 and 5 are closed. The molecular sieve being desorbed is heatedto about 400°K.C02 passes to the thermal pump at a pressure of^O.034 atmospheres(0.5 psia). Since the sieves may be located some distance from the pump andbecause of the low density at 400°K and 0.034 atmospheres, line conductanceeffects can be important and are evaluated in the next section. Cryotrappingoccurs with a dark side exposure on the radiator being used and with .valve 6closed to prevent the introduction of waste heat. To pressurize and pump C02to the storage tanks, valve 3 is closed and valve 6 is opened, as is eithervalve 4 or 5, depending on which tank is to receive C02. t
It would be possible to shutter off the pump to space to minimize its heatloss by radiation to effect a minimum heat-up time. This is not considered~practrcal"~andT~fortunate'ly7 rsJ~hot~necessaryT Th1e~waste~h"eat""input""overwh"elmsthe cooling rate and overall pump cycle time is not greatly affected.
Detailed calculations for the thermal pump are presented in the nextsections. These show feasibility of the pumprconcept; however, practicalityrelative to mechanical pumps is doubtful at this time in view of the following:
48

(1) Large radiator areas relative to small gas sidevolumes necessitate long,slender gas side spaces inwhich blockage by maldistribution in the cryotrappedC02 is very likely.
(21 Using a state-of-the-art value of radiator specificmass, the cool down time for the radiator is found tobe long" relative to sieve desorb cycles. Forexample, on the order of 50 minutes chill time isrequired relative to a 30-minute desorb cyclerequirement. This necessitates desorbing multiplesieve loads with less frequent pumping phases. Inthis way the chill time is amortized for aneffective cycle time of 30 minutes. The actualoverall pump cycle time may be of the order of 100minutes. This becomes a potential problem in thatthe pump may not be in a dark side exposure for thislength of time. It may be possible to match the pumpcycling to dark side (desorbing) and sun side(pumping) exposure times; however, this presents anundesirable restriction on the pump concept.
Noncbndensables (typically oxygen and nitrogen) may be present in the desorbedCOj. The baseline system projects a one percent level of noncondensables.'Depending on whether or not the noncondensables are cryotrapped in the solidC02, these could affect pump performance. In the event these remain as untrap-ped gas and contribute a partial pressure to the pump background pressure,periodic venting would effectively remove the noncondensables. A small massloss would occur; however, the oxygen, undesirable for high temperature opera-tion in resistojets having metal heaters would be removed.
The following assumptions have been made in the thermal pump cycle analysiswhich follows:
(1) Radiators are not shuttered; rather, they areexposed to space at all times.
(2) Radiator emissivity is in the range of 0.9 to 1.0.
(3) The effective radiator area to actual projected panelarea is 1.0, a realistic value.
(4) The radiator specific mass is 4.9 Kg/m2 (1.0 lb/ft2),a realistic value.
(5) The pump chill time is amortized by collecting mul-tiple sieve desorbs between pumping cycles.
(6) High pressure side gas line conductances are high"relative to the low pressure side.
(7) A noncondensable mixture of oxygen and nitrogen ofone percent by weight is present in the desorbed
49

Thermodynamics of the Cooling Cycle
Desorption cycle time is a function of many design parameters andinvolves cooling of the pump. For the radiation cooling portion of thecycle, the important parameters are:
(1) surface emissivity of the radiator .
(2) panel mass per unit area .
The energy balance of a radiation panel at temperature Tp radiating tospace (0°K) is given by:
(40)
where a is the Stefan-Boltzmann constant and is equal to 5.67 x 10"^watt/m2-°K4j e is the emissivity, Ap is the frontal area of the panelradiating to space in m^, mp is the mass of the panel in Kg, and C is thethermal capacity of the radiator material in (watt-minutes)/(Kg-°K).
The time for the panel to cool from TI to T2 is found by integrating theabove energy balance:
t =3aeTT
(41)
For aluminum, C = 15.5 (watt-minutes)/ (Kg- °K) . To cool fromdown to T2 = 190°K,
= 300°K
t = (42)
Note that this metal chill time is a funct-ibn of the radiator panel massper unit size. The chill time is displayed in figure 14; and it is seenthat, for reasonable times, light specific weight panels are required.For a given specific weight, the chill time is independent of radiator-panel— srze-—A— real-is ti-c-specifrc-werght-of-4T9-ICg/m2—(-prO—ttr/f t'2')~~rs"being used for this study.
The solidification of the C02 will begin at about 190°K. The mainenergy requirement is the latent heat, which is
50

100
PANELEMISSIVITY
UNIT MASS OF PANEL.Pg-) ,Kg/m2
Figure 14.- Time to chill radiator panel £rom.300°K to 190°K.
51
L = 9660 watt-minutes/Kg
Applying the cooling power to the C02 solidification and including thesensible heat of the C02 from 400°K down,
(43)
where mco is the C02 freeze rate in Kg/min. a - 0.31 is the ratio ofsensible Seat (from 400°K) to the latent heat. The panel size in square .meters to solidify C02 at 190°K becomes • • .
mcoAp = 363 (44)
and is presented graphically in figure 15. Of course, the metal is alsocooling during this time, and this calculation is thus a simplifiedrepresentation. Considering both the metal chilling and the C02freezing,
A; V IT + 1-3lSco2L (45)
d mpTP dt = ATV (T
Pl - TP^ + x-31 Amco?
L
A numerical analysis could precisely accommodate the varying value of Tpfrom TI down to ^2- Here we use an average value, TAyQ, yielding the
time as .
mpC (Tp - T ) 1.31
At = 1 —2- + _ -L - (47)
52

100
Eo.•»
<UJor
LUza.ccoi-
oo:
PANELEMISSIViTY
.001
CONDENSING RATE, mco , Kg/min
Figure 15.- Radiator panel area required to solidify C02.
53

For e = 0.9 and aluminum,- the time in minutes from Tp = 190°K downto 162°K is:
At = 9.42 /• + 265 —.—- (48)Ap Ap
Figure 16 presents this dependence. For this phase of the cycle,increasing the panel area is beneficial in reducing the process time.However, the specific weight (first term) of 4.9 Kg/m^ used introduces 46minutes into the cycle for the radiator chilling.
During the cooling cycle, the resistance of the line from themolecular sieve to the thermal pump is of importance. A measure of thisresistance is its reciprocal, conductance. Figure 17 displays the depen- •••••'.dence of conductance on line diameter and length. For the CC>2 flow rates .of interest, line flow is in the viscous regime. Also presented infigure 17 is the corresponding pressure drop for a typical mass flow rateof 0.5 Kg/hr. Relative to a nominal sieve desorb pressure of 0,034atmospheres, pressure drop is negligible for lines with inside diametersof at least 2 centimeters.
The thermal radiated power removed during cooling is just
q= aeApTp4 (49) '
and is plotted in figure 18. An integration of the overall cooling rate(heat from the desorbed CO- and Freon-21) of the thermal pump yields anaverage cooling rate of about 3 kilowatts for a typical radiator panelsize of 10 square meters. It is this factor which could partly justify theaddition of radiators to the spacecraft to effect thermal pumping of C0_.
Thermodynamics of the Heating Cycle
Figure 19 presents a phase diagram for carbon dioxide and characterizesthe thermodynamic events of the thermal pump. As a design objective, 0.034atm (0.5 psia) was selected for the desorb pump level. This pressure corres-ponds to 162°K on the solid-vapor CO- equilibrium phase line, state 1 in theP-T plot of figure 19. After desorbing, the pump volume is isolated. Heatingwill drive the pressure up along the equilibrium line until the CO is allvapor, point 2 in figure 19, for example. Subsequent heating will thenfollow a constant volume line (P ~.T) to the.final t.emp.er.a.tur.e_at a_maxi. —mum pressure at point 4. It is convenient to consider the pump in thisway to generalize the pumping-capability relative to different storagetank pressures. Realistically, however, the pump would be connectedthrough a check valve to a storage tank at some pressure at point 3.Continued heating would transfer the expanding C02 along the constantpressure line (dashed in figure 19) to the pressure at point 5. A slightpressure rise would occur from point 3 to point 5 depending on the actualvolume of the storage tank.
54

140
120
u.
H 100oCO
Xo
PANEL UNIT MASS, -= 4 :9 Kg/m2 ( I.OIb/ft2)P
PANEL EMISSIVITY, €=0.9
0.2 0.4 0.6 0.8
MASS OF C02 CHARGE, Amco. , Kg
1.0
Figure 16.- Time to chill radiator from-190°K to 162°K and solidify C02.
55

10
1.0o
^ «2 O.I§281
z'-9 0.01
0.001
Insidediameter
4cm
10"
a.occ.a
tr•IDCO(OUJcra.
10
10'
-2
Inside 'diameter
8 12 20 24
LINE LENGTH, meters
Figure 17.- Line conductance and pressure drop.
56
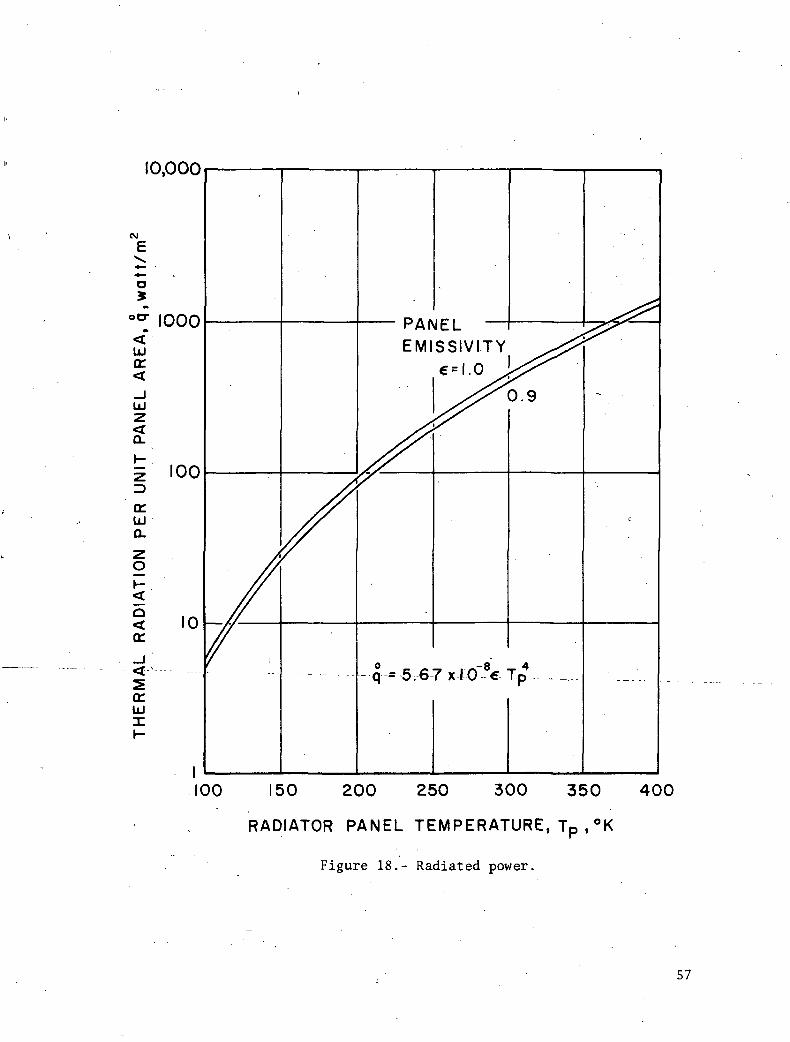
10,000
CM
o51000
LUtr.
LUz<Q.
5 100
o:LUQ.
O<cr
crLUXh-
10
q =5,67x10"8eTp
100 150 200 250 300 350 400
RADIATOR PANEL TEMPERATURE, Tp ,°K
Figure 18.- Radiated power.
57

100
tn
<D
0.VIO6"o
LU
IDCOCOLU(EQ.
MOLECULARSIEVE DESORBCONDITION
0.01150 200 350 400250 300
TEMPERATURE, °K
Figure 19.- Phase diagram characteristics of the thermal pump.
58
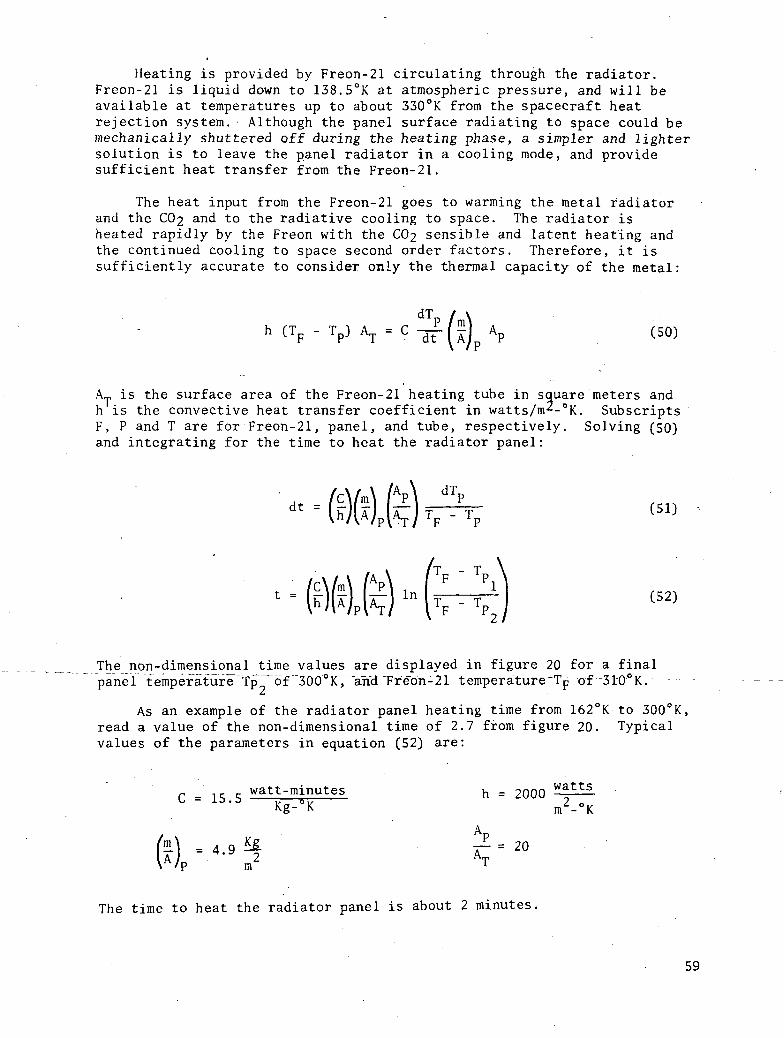
Heating is provided by Freon-21 circulating through the radiator.Freon-21 is liquid down to 138.5°K at atmospheric pressure, and will beavailable at temperatures up to about 330°K from the spacecraft heatrejection system. Although the panel surface radiating to space could bemechanically shuttered off during the heating phase, a simpler and lightersolution is to leave the panel radiator in a cooling mode, and providesufficient heat transfer from the Freon-21.
The heat input from the Freon-21 goes to warming the metal radiatorand the CC>2 and to the radiative cooling to space. The radiator isheated rapidly by the Freon with the C02 sensible and latent heating andthe continued cooling to space second order factors. Therefore, it issufficiently accurate to consider only the thermal capacity of the metal:
h CTF - V = C dt (50)
AT is the surface area of the Freon-21 heating tube in square meters andh is the convective heat transfer coefficient in watts/m2-°K. SubscriptsF, P and T are for Freon-21, panel, and tube, respectively. Solving (50)and integrating for the time to heat the radiator panel:
(51)
(52)
The non-dimensional time values are displayed in figure 20 for a finalpanel "temperafufeTp'~6f ~300°K,~~and Treon-21 temperature"Tp of-310°K.
As an example of the radiator panel heating time from 162°K to 300°K,read a value of the non-dimensional time of 2.7 from figure 20. Typicalvalues of the parameters in equation (52) are:
C = 15.5 watt-minutes
=H = 4.9m
h = 2000
Ap- = 20
watts
m2-°K
The time to heat the radiator panel is about 2 minutes
59
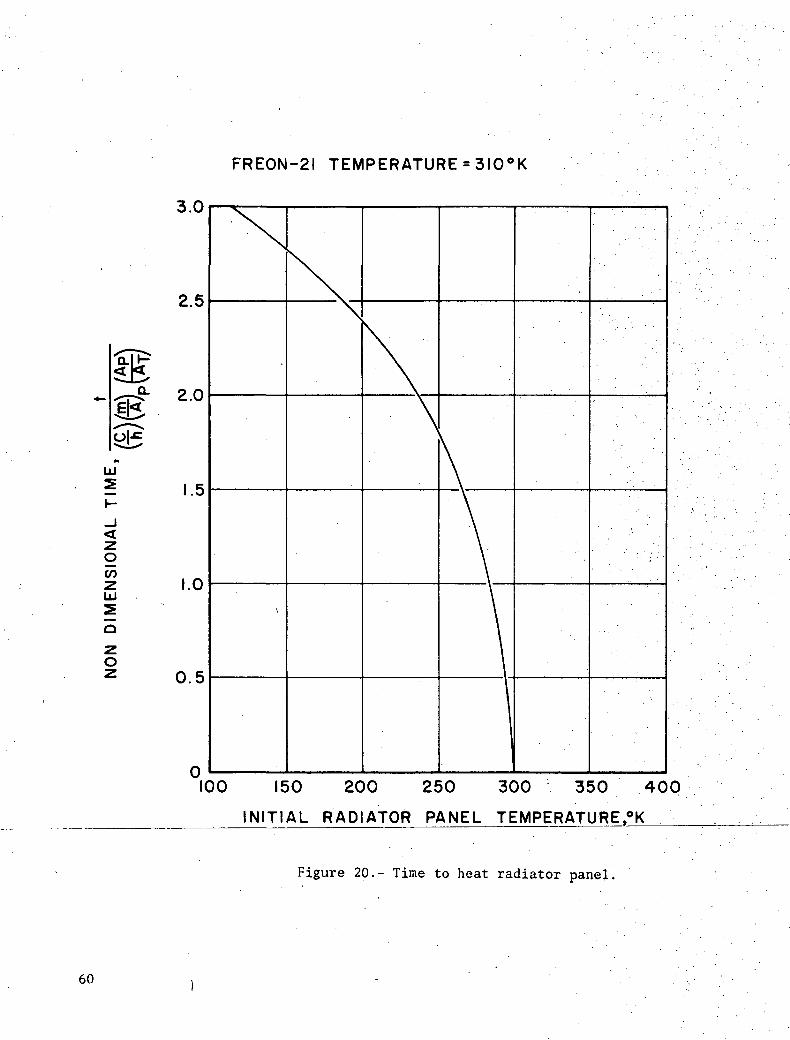
FREON-21 TEMPERATURE=3IO°K
3.0
oCO
azo
100 150 200 250 300 350 400
INITIAL RADIATOR PANEL TEMPERATURE,°K
Figure 20.- Time to heat radiator panel.
60

Pump volume is a critical parameter for the pressurizing phase of thethermal pump cycle as well as for insuring that the dry ice does notclog the inlet regions and preclude additional solidification. The ratioof solid CC>2 volume to the total volume in the pump after it is isolatedfrom the molecular sieve is called fv.
The relationship between the volumes occupied by solid (or liquid)and vapor C02 can be derived as follows:
Define fy = volume of solid/total volume. Since
"VOTAL = -"SOLID + "VAPOR = ps£vv + pv (1 - Vv = pV
— <7where m is the mass in Kg, p is the average density in Kg/m°, V is thetotal volume, and subscripts S and V are for solid and vapor phases.Solving,
= pSfv + PV(1 - V
Solving for the volume fraction, then
- PVf = - — (55)v PS - pv
Often the mass fraction is required. The analogous derivation is
f M (1 - f )M ...v = v, + Vv = J=- + Q
m - ' (56)s v PS PV p
where fm is the mass of solid/total mass and M is the total mass.Solving,
, f 1 - fI =_2L + 5L- (57)p Ps Pv
Solving for the mass fraction,
_ _ I^ _ L_ (58)
PV
61

The volume and mass fractions are related by:
.(59)
A typical calculation is presented to display the use of these para-meters. Select fv = 0.01. This means that as the heating phase starts,1 percent of the pump volume is occupied by solid C02 at 162°K and 0.034atm (0.5 psia) . At that point on the solid-vapor equilibrium line, point1 of figure 19, the solid and vapor densities are
Ps = 1608 Kg/m3 pv = 0.11 Kg/m3 •
Thus • . . ' " • • • . . . . . .
3 ' . - % • '' " •1 p = 1608(0.01) + 0.11(0.99) = 16.19 Kg/m
The mass fraction which is solid is very large: /i • ' . -
_L _ L • ' '•;•-• ••'pv " P . pv(ps • P) •
£m = T ~X e l -- - - as PV « PS>PV PS
f = 1 - 0.00067 = 0.99933 for this casem . . .
Heating now drives the pressure up the equilibrium line* in figure19until the C02 is all vapor. At this point 2,
Py = p = 16.19 Kg/m3
and
P2 = 6.3 atm T2 = 220°K
*Note that for the case displayed, the triple point was passed in heating,and the liquid-vapor line followed to state 2. The volume fractionwhich corresponds to full vapor at the triple point is fv =0.0086.
62

Constant volume heating thereafter to 74 = 330°K, for example, gives thefinal pressure at point 4 L
P. = 6.3[|gy = 9.4 atm
General results are plotted in figure 21 for one nominal value of finaltemperature 14 equal to 300°K. The final pressure P^ is simply proportionalto the final temperature for other values.
The fraction of the CC>2 in the thermal pump volume which will bedelivered to a receiver depends on the pressure in that receiver, P$ infigure 19. Consider the mass (now all vapor,) in the pump volume before
P4Vm4 = RT7 C61)
and after tripping a relief valve set at receiver pressure
P5Vm5 = RT7
The fraction of the original mass delivered is then
m - m P T
The process -will--be between -isothermal--andJ adiabatic,._prpbably closer toadiabatic. For y = 1.25, the charge fraction pumped is
The results are plotted in figure 22 for receiver pressures from 2to 20 atmospheres. The dotted line in figure 19, point 3 to point 5,represents the process for a receiver pressure .of 7.5 atm with theexample presented following equation (59) for fv = 0.01. Figures 21 and22 are used to determine the amount of C02 'actually pumped and, conversely,the amount of C02 which remains in the pump to be recycled.
63

INITIAL CONDITION = 0.034 atm, 162 °KFINAL CONDITION = 300°K
0.001 0.01 O.I
-ERA.C-T-10-N-O-F- P U MP-V 0 LU ME-
1.0
OCCUPIED BY SOLID C02 , fv
Figure 21.- Effect of volume ratio on pumped pressure.
64

FINAL PUMP TEMPERATURE =300°K
\-o<
0 oo \<UJ (T
1°9 en
oo
O Q.<o:
0.8
0.6 —
STORAGE TANKPRESSURE
2atm
0.4 —
0.2 -
20 40 60
FINAL PRESSURE OF PUMP, atm
Figure 22.- Pumping effectiveness.
65
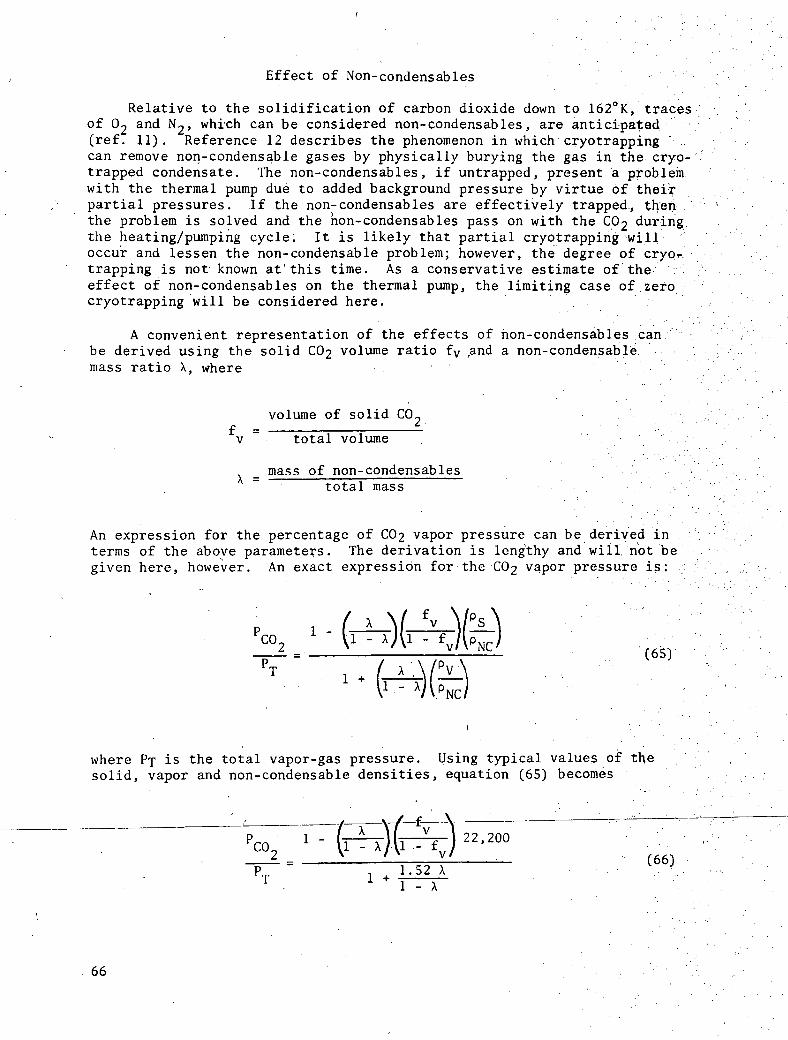
Effect of Non-condensables
Relative to the solidification of carbon dioxide down to 162°K, tracesof C>2 and N2, which can be considered non-condensables, are anticipated(ref. 11). Reference 12 describes the phenomenon in which cryotrapping "• ..can remove non-condensable gases by physically burying the gas in the cryo-trapped condensate. The non-condensables, if untrapped, present a problemwith the thermal pump due to added background pressure by virtue of theirpartial pressures. If the non-condensables are effectively trapped., then,the problem is solved and the non-condensables pass on with the CO 2 during,the heating/pumping cycle. It is likely that partial cryotrapping willoccur and lessen the non-condensable problem; however, the degree of cryq-rtrapping is not known at'this time. As a conservative estimate of the .effect of non-condensables on the thermal pump, the limiting case of:zerocryotrapping will be considered here.
A convenient representation of the effects of non-condensables canbe derived using the solid CC>2 volume ratio fv fand a non-condensablemass ratio X. where .
volume of solid CO-£ =
v total volume
mass of non-condensablesX = total mass
An expression for the percentage of C02 vapor pressure can be derived interms of the above parameters. The derivation is lengthy and will, not begiven here, however. An exact expression for the C02 vapor pressure is:
X 1-_2 . . ____^_^_ (65)
T
where PT is the total vapor-gas pressure. Using typical values ofsolid, vapor and non-condensable densities, equation (65) becomes
Pco9 l -2 = . * '— U. _ (66)
PT 1 + 1.52 X1 - X
66

fv and X are both much less than one, permitting the following approxi-mation
- 1 - (22,200) A£ (67)
pco,-=-*- - 1 - (22,200) XI. T
Figure 23 presents the permissible non-condensable mass ratio X forlevels of CO volume ratio f relative to the acceptable values of non-condensable partial pressure. The limit line for all non-condensables (noCO-) is given from the exact equation (65) and is academic. A reasonablepartial pressure of non-condensables would be about 10 percent, forexample. Too high a non-condensable pressure would offer back pressureresistance to the sieve and would require higher sieve pressures or, con-versely, lower pump temperatures. For 10 percent non-condensables and adesired solid CO- volume ratio of 0.01, as an example, figure 23 indicatesthat non-condensables can reach a mass ratio X of 4 x 10 . Values pro-jected in reference 11, however, indicate an 0 + N- mass ratio of about10 2. Unless cryotrapping is very effective., the non-condensables wouldhave to be vented out of the thermal pump at intervals to maintain X ator below the 4 x 10 ** value.
Venting would be simple, involving a momentary venting to space vacuum.Losses due to such venting have not been analyzed but should be small (ofthe order of a few percent). An advantageous effect of the venting wouldbe to decrease the amount of oxygen contained in the biowaste resistojetpropellant which would permit higher operating_temperatures with thecurrent resistojet design (ref. 13).
Overall Cycle Time
The overall cycle time to pump CO- from the molecular sieves at 0.034atm to the storage tanks at 2 to 20 atm is found to be reasonable. Thefirst term in equation (48) reflects a predominate radiator cool-down termfollowing the heating/pumping portion of the cycle. It was pointed outthat the chrll time is^ independent of radiator-si-ze.- -For-a realistic--radiator mass to area- ratio of 4.9 Kg/m2, 54 minutes are required forchilling the radiator from 300 to 190°K (fig. 14) plus 46 minutes, reflectedby the starting point for the curves in figurev!6, to chill from 190 to162°K. On the other hand, the heating time is insignificant at about 2minutes, as shown in the example evaluated for equation (52).
The molecular sieves desorb every 30 minutes. However, a 30-minutepumping cycle is not possible with the 100-minute chill time. Unlessthe radiator mass-to-area ratio can be reduced to about one Kg/m2 orless, the pump cycle time will exceed 30 minutes. To effect pumping, then,several sieve desorbs must be condensed into the pump in order to amortizethe radiator chill time.
67

CMoo
o(O
U.O
UJ5Z)_Jo
ZERO C02 VAPOR
NONCONDENSABLEPARTIAL PRESSURE
IO"3 I0~2
MASS RATIO OF NONCONDENSABLES, X
Figure 23.- Effect of non-condensables on C02 solid volume ratio.
68

Two typical example cases will be examined here to show thermal pumpfeasibility relative to cycle time.
Case I -> Assume a storage tank pressure P$ of 2 atm and asolid CC>2 volume ratio fv of 0.01 for which the non-condensableproblem is not severe. From figure 21, the hypothetical P^ isfound to be 9.3 atm. From figure 22, the fraction pumped is72 percent. This means that 28 percent of the C02 accumulated
in the pump must be recycled. To pump 0.5 Kg/hr, it is thennecessary to condense 0.5/0.72 or 0.695 Kg/hr, equal to 0.0116Kg/min. From figure 14, the chill to 190°K is 54 minutes.From figure 15, we see that a radiator area of 4.5 m2 (e = 0.9)will handle the solidification of the CC . Additional panelarea will be needed to handle the chill time and effect areasonable overall cycle time. Assume twice the above area orabout 10 m^. The overall cycle time is obtained from figure .16by iteration. Assume a cycle time t^. Obtain the C02 chargemass as 0.0116 t^. Find the time to chill the radiator andsolidify the CC>2 from figure 16. Add 2 minutes (reheat time)and the above 54 minutes to this value to get the tQ required.A solution is obtained when the required t^ equals the assumed•t£. For the above parameters, we find the overall cycle timeto be 150 minutes.
Case II - Assume a storage tank pressure PC; of 20 atm anda solid C02 volume ratio of 0.1. The value of f of 0.1 (higherthan for Case I) is dictated by figures 21 and ^2 in order tohave a reasonable (low) recycled amount of CC . If too muchC02 is recycled, overall cycle times can become prohibitivelylong. As before, from figure 21, find P^ equal to 52 atm. Thefraction pumped is now 53 percent from figure 22. Therefore,to pump 0.5 Kg/hr, we need to condense 0.5/0.53 or 0.943 Kg/hror 0.0157 Kg/min. The chill to 190°K is again 54 minutes.Figure L5 indicates 6.2 m^ of radiator area are sufficient forC02 solidification. Again, use 10 m^ to cover the heatingrequirement. From an iteration around figure 16, the overallcycle time is found to be 175 minutes. Non-condensables, ifnot cryotrapped to a significant degree, become a problem with"ani fv of 0.1 as~s~een~ in "figure 23. ~~ Frequent ~ven"tings~wduTd~b"e "required to maintain a reasonable partial pressure of non-condensables.
Case II, to pump to a 20 atmosphere storage tank pressure, requiresa higher value of the volume ratio fy of 0.1 compared to Case I (fv equalto 0.01). Gas-side volume is larger for the Case I situation. For 10 m2of radiator surface, the pump would consist typically of panels about 0.2meter wide with a total length of about 50 meters. The total volumes ofthe C02 gas-side space would be about 0.05 and 0.008 m^, respectively,for the Case I and II situations. Respective gas side tube diameterswould be about 4 and 1.5 cm with length to diameter ratios of about 1300and 3500. Some manifolding would be possible to reduce the L/D of thegas side tubes. Manifolding would be limited, however, since the
69

condensing space would become smaller in cross section as manifold volumewas added. It does appear that a CC>2 blockage problem from localcondensation will occur.
The thermal pump cycle has not been examined for the effects ofspace station orientation relative to the sun. The radiator will not beable to condense C02 when in a direct sunny-side exposure. The 150 and175 minute cycle times calculated as examples above may not be compatiblewith some space station orientations. In any case, more than one pumpwould be required to have always available a dark side exposure. Thepurpose of this study is to determine feasibility of the cycle. Thecycle appears to be thermodynamitally feasible if cycle times up to about200 minutes are, subsequently, feasible with spacecraft orientation .relative to the sun.
The.thermal pump is considered heavy (for example, 10 m^ at 4.9Kg/m2 equates to about 50 Kg or 100 Ib) relative to mechanical pumps.This factor is compensated, however, by the advantages of not requiringelectrical power (other than small solenoid power consumption) and bysupplementing or replacing part of the space station waste heat radiatorsystem. The pump has been shown to be able to handle a 20 atmospherestorage tank pressure requirement in a not too unreasonable cycle time ofless than 200 minutes. The cycle time and weight can be reducedconsiderably with a lower radiator mass to area ratio. A realisticspecific mass of 4.9 Kg/m^ has been used in the above evaluation,however, and significant improvements in this direction are not likely.
CONCLUSIONS
Mass Flow Limiters
A dozen techniques were considered which could provide flow limitingof liquid water propellant to the biowaste resistojet. Flow limitingrelative to an unrestricted - constant pressure supply is required toprevent thermal quenching of the thrustor, erratic thrusting performance,and the formation of ice crystals in the thrustor nozzle. A pre-evaporatorcan provide the necessary flow stability during start-up transients ofthe thrustor provided the evaporator is sufficiently large and has adequatethermal capacity. The evaporator must be preheated to a ready-to-steamcondition to provide sufficient flow stability. A more effective flowlimiting device can provide the following improvements in the propellant-thrustor system: • • (
1. Shorten the start-up transient.
2 Rermit_a_smal.ler-,—lighter— evaporator- — —— '———
3. Improve the system reliability against adverse start-upconditions. \
4. Reduce the sensitivity of thrust to changes in thepropellant supply pressure.
70
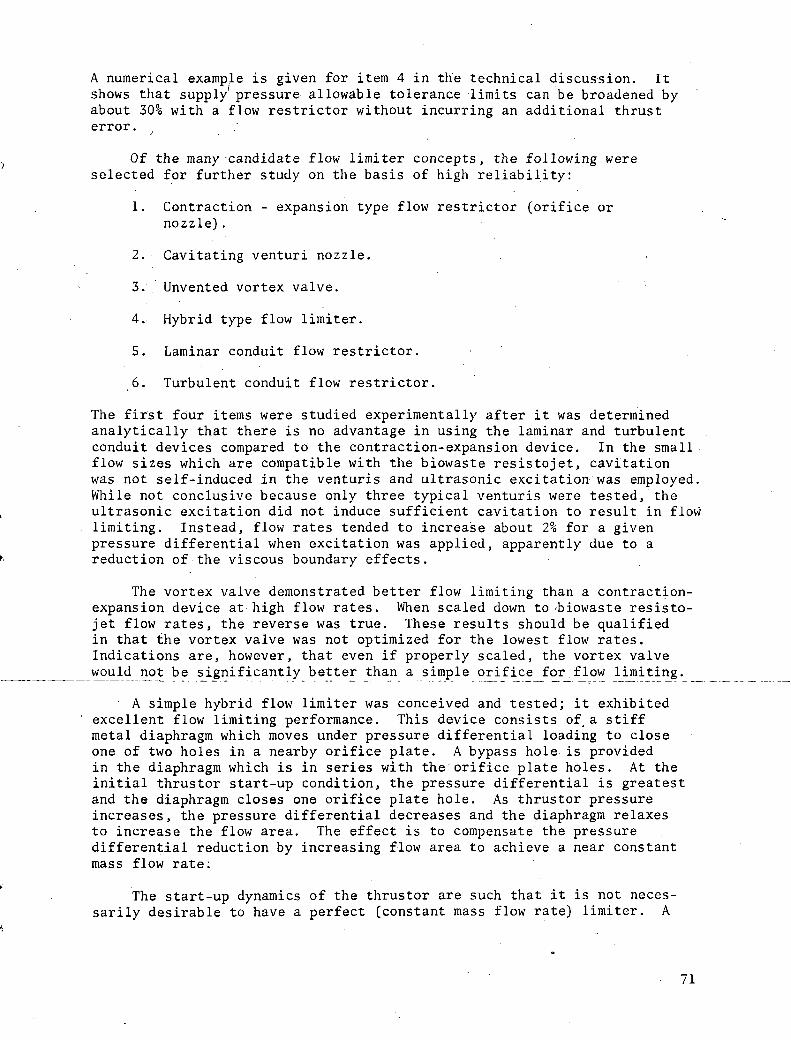
A numerical example is given for item 4 in the technical discussion. Itshows that supply pressure allowable tolerance limits can be broadened byabout 30% with a flow restrictor without incurring an additional thrusterror. ' ;
Of the many candidate flow limiter concepts, the following wereselected for further study on the basis of high reliability:
1. Contraction - expansion type flow restrictor (orifice ornozzle).
2. Cavitating venturi nozzle.
3. Unvented vortex valve.
4. Hybrid type flow limiter.
5. Laminar conduit flow restrictor.
6. Turbulent conduit flow restrictor.
The first four items were studied experimentally after it was determinedanalytically that there is no advantage in using the laminar and turbulentconduit devices compared to the contraction-expansion device. In the smallflow sizes which are compatible with the biowaste resistojet, cavitationwas not self-induced in the Venturis and ultrasonic excitation was employed.While not conclusive because only three typical Venturis were tested, theultrasonic excitation did not induce sufficient cavitation to result in flowlimiting. Instead, flow rates tended to increase about 2% for a givenpressure differential when excitation was applied, apparently due to areduction of the viscous boundary effects.
The vortex valve demonstrated better flow limiting than a contraction-expansion device at high flow rates. When scaled down to 'biowaste resisto-jet flow rates, the reverse was true. These results should be qualifiedin that the vortex valve was not optimized for the lowest flow rates.Indications are, however, that even if properly scaled, the vortex valvewould not be significantly better than a simple orifice for.flow limiting.
A simple hybrid flow limiter was conceived and tested; it exhibitedexcellent flow limiting performance. This device consists of_a stiffmetal diaphragm which moves under pressure differential loading to closeone of two holes in a nearby orifice plate. A bypass hole is providedin the diaphragm which is in series with the orifice plate holes. At theinitial thrustor start-up condition, the pressure differential is greatestand the diaphragm closes one orifice plate hole. As thrustor pressureincreases, the pressure differential decreases and the diaphragm relaxesto increase the flow area. The effect is to compensate the pressuredifferential reduction by increasing flow area to achieve a near constantmass flow rate.
The start-up dynamics of the thrustor are such that it is not neces-sarily desirable to have a perfect (constant mass flow rate) limiter. A
71

slightly higher initial mass flow rate helps build thrustor pressure upfaster. Too high an initial flow may,.on the other hand, increase thethermal response time. The hybrid flow limiter can be adjusted to providean optimum flow limiting characteristic to match a specific propellant-thrustbr system application.,
Sensivitity of mass flow rate to pressure differential was used tocompare the effectiveness of the various flow limiters. In the low massflow rates of interest (a 25-mlb size biowas'te resistojet is typical), thecontraction-expansion device demonstrated a sensitivity (see equation 18)of about 0.7 as compared to a theoretical value of 0.5. The higher 0.7value is the result of viscous effects becoming predominate at the low flowrates of interest. For the same flow conditions, the hybrid flow limiterdemonstrated a sensitivity of 0.2. This is a considerable improvement overthe contraction-expansion device. The hybrid device is inherently reliable.Stress levels in the hybrid device diaphragm are very low and are compatiblewith millions of cycles for corrosion resistant steel.
For applications of the resistojet using liquid water as a propellant,either the hybrid device or the contraction-expansion device (orifice ornozzle) can be recommended for propellant flow limiting. Either of thesedevices can be used effectively with a pre-evaporator or an integratedevaporator stage to optimize the start-up transient response of the resisto-jet, to prevent thrust instabilities, and to maximize the effective specificimpulse of the thrustor.
Thermal Pumps
A typical biowaste propulsion system pumping requirement, that ofpumping desorbed CO- from the molecular sieve to storage tanks, at 2 to20 atmospheres pressure, has been evaluated. The thermal pump concept,using cryopumping in space radiators with waste heat to raise the pressureof solidified CO™, appears feasible with one possible exception. The re-quirement for a small cryopump gas-side volume relative to large spaceradiator areas involves a gas-side space long and slender which would besusceptible to local blockage by solidifying CO-.
Another factor which may present difficulties is the cycle time ofthe thermal pump. A realistic radiator specific weight of 4.9 Kg/m^ (1.0Ib/ft2) results in a 100 minute time to chill the radiator, after heating,to begin a new solidification cycle. The expected molecular sieve desorbcycle is 30 minutes. The thermal pump must be operated in a 150 to 175minute cycle which may, under certain space station orientations, involvea conflict with dark side-sun side exposures. Unless a significantlylower specific weight is possible to shorten the radiator chill time, itthen may be necessary to use several thermal pumps at about 50 Kg or about"100 pounds mass per pump. Wh n~thermal~pump's~ar'e~n'ot~b"eing~used~"to-pump—C02, they can be used as waste heat radiators. In effect, the thermalpump is nothing more than modified waste heat radiator already proposedfor the space station.
72

Advantages of the thermal pump concept include elimination of theelectrical power consumption of the baseline mechanical pumps, and possibleremoval of oxygen trace gas which would benefit the metal heater typeresistojet thrustor. This latter factor may actually involve a trade-off,higher specific impulse with the resistojet not. having to handle oxygenversus more propellant if the oxygen is not vented from the thermal pump.An advanced biowaste resistojet using ceramic heater elements is underdevelopment (ref. 14) which is not affected by oxygen in the basic biowastepropellants. The size and weight of the thermal pump are compensated byits capacity for dumping waste heat and thereby supplementing or replacingpart of the spacecraft radiator.
The thermal pump is essentially a space radiator structure whichwould normally be integral with and serve as space station structure andmeteor shielding. Final practicality and feasibility must include thejudgment of the space station structural designer. In addition, otherpumping situations, not necessarily related to the resistojet propulsionsystem, may adapt to the thermal pump concept. This report presents apreliminary design method using the C02 for resistojet propulsion as anexample. It is recommended that further consideration by EC/LS studygroups be made of the thermal pump concept.
73

REFERENCES
1. Halbach, C.R.: Technology Development of a Biowaste Resistojet.First Quarterly Report, Marquardt Co. Report 25203, December 1969.
2. Schreib, R.R.; Pugmire, T.K.; andChapin, S.G. : The Hybrid (Hydrazine)Resistojet. Paper No. 69-496, presented at the AIAA 5th PropulsionJoint Specialist Conference, U.S. Air Force Academy, Colorado, June9-13, 1969. . .
3. Halbach, C.R.: 10-mlb Biowaste Resistojet Performance. Paper No.71-687, presented at the AIAA/SAE 7th Propulsion Joint SpecialistConference, Salt Lake City, Utah, June 14-18, 1971.
4. Pugmire, T.K.; et al.: Electrothermal Hydrazine Engine Performance.Paper No. 71-760, presented at the AIAA/SAE 7th Propulsion Joint .Specialist Conference, Salt Lake City, Utah, June 14-18, 1971.
5. Knapp, R.T.: Cavitation Scale Effects. Proc. Seventh General MeetingIAHR, Lisbon, vol. I, paper A-6, 1957. .
6. Oshima, R.: Theory of Scale Effects on Cavitation Inception onAxially Symmetric Bodies. Trans. ASME, 83, Ser. D., J. Basic Engr.,p. 379-384, 1961.
7. Kermeen, R.W. ; McGraw, J.T.; and Parkin, B.R.: ^Mechanism of CavitationInception and the Related Scale-effects Problem. Trans. ASME, 77 (4), •p. 533-540, 1955. .
8. . Streeter, V.L. (Editor): Handbook of Fluid Dynamics. First Edition,McGraw-Hill, p. 12-13, 1961. • V
- v" •'
9. Halbach, C.R.: Technology Development of a Biowaste ResistojetV . :
Sixth Quarterly Report, The Marquardt Co. Report S-998, March 1971. .;
10. Roark, R.J.: Formulas for Stress and Strain. Third Edition, McGraw-Hill, Chapter 10, 1954.
• 11. Greco, R.V.; and Bliss, J..R. : Resistojet Systems Studies Directedto the Space Station/Space Base, Volume I, Station/Base BiowasteResistojet System Design, NASA CR-111879, McDonnell Douglas Report ;
G2125, April 1971. -
12. Anon: Basic Mechanisms of Noncondensable Gas Cryofrapping. General'"";,.-.Technology Corporation Technical Documentary Report No. AEDC-TDR-63-•'..147, July 1963.
13. Halbach, C.R.: Technology Development of a Biowaste Resistojet.Fourth Quarterly Report, The Marquardt Co. Report 25,313, Sept, 1970.
14. Halbach, C.R.; Page, R.J.; and Short, R.A.: High Temperature BiowasteResistojets Using Electrically Conducting Ceramic Heaters. Preprint72-454 presented at the AIAA 9th Electric Propulsion Conference,Bethesda, Maryland, April 17-19, 1972.
74 ' , ,;- • .