Evaluation of a viral vector system, based on a defective ...
123
"Evaluation of a viral vector system, based on a defective interfering RNA of tomato bushy stunt virus, for protein expression and the induction of gene silencing" D i s s e r t a t i o n zur Erlangung des Grades "Doktor der Naturwissenschaften" am Fachbereich Biologie der Johannes Gutenberg-Universität in Mainz Christian Naumer geb. Am 14.12.1972 in Speyer Mainz, 2005
Transcript of Evaluation of a viral vector system, based on a defective ...
"Evaluation of a viral vector system, based on a defective interfering
RNA of tomato bushy stunt virus, for protein expression and the
induction of gene silencing"
D i s s e r t a t i o n
zur Erlangung des Grades
"Doktor der
Naturwissenschaften"
am Fachbereich Biologie
der Johannes Gutenberg-Universität
in Mainz
Christian Naumer
geb. Am 14.12.1972 in Speyer
Mainz, 2005

Dekan:
1.Berichterstatter:
2.Berichterstatter:
Tag der mündlichen Prüfung: 04. Oktober 2005
Table of Contents
1 Table of Contents
1 Table of Contents....................................................................................................................................................I
2 Abbreviations .......................................................................................................................................................V
3 Abstract................................................................................................................................................................VI
4 Introduction............................................................................................................................................................1
4.1 Molecular farming.........................................................................................................................................1
4.1.1 Viral vectors in molecular farming.......................................................................................................3
4.2 Post transcriptional gene silencing (PTGS)..................................................................................................4
4.2.1 Virus-induced gene silencing (VIGS)..................................................................................................6
4.3 Effect of DI sequences on gene silencing.....................................................................................................7
4.4 Tomato bushy stunt virus (TBSV)................................................................................................................8
4.4.1 Replication of TBSV............................................................................................................................9
4.4.2 Defective interfering particles............................................................................................................10
4.5 Aim..............................................................................................................................................................11
5 Materials and Methods.........................................................................................................................................13
5.1 Chemicals....................................................................................................................................................13
5.2 Enzymes......................................................................................................................................................13
5.3 Antibodies....................................................................................................................................................13
5.4 Plants...........................................................................................................................................................13
5.5 Bacterial strains...........................................................................................................................................14
5.6 Plasmids.......................................................................................................................................................14
5.7 Cultivation media........................................................................................................................................15
5.8 Cultivation conditions of greenhouse material...........................................................................................15
5.9 Molecular biology methods.........................................................................................................................16
5.9.1 Mini-preparation of plasmid DNA with Qiaprep spin miniprep kit .................................................16
5.9.2 Mini-preparation of plasmid DNA from Agrobacterium tumefaciens with Wizard Plus DNA
purification system.......................................................................................................................................16
5.9.3 Cryopreservation of bacterial cells.....................................................................................................16
5.9.4 Determination of DNA and RNA concentration by UV spectrometry..............................................16
5.9.5 T-tailing of plasmid DNA...................................................................................................................16
5.9.6 Restriction enzyme digests.................................................................................................................17
5.9.7 Agarose gel electrophoresis................................................................................................................17
5.9.8 Agarose gel extraction........................................................................................................................18
5.9.9 Klenow fragment “fill in” reaction.....................................................................................................18
5.9.10 Phenol/chloroform purification of nucleic acids..............................................................................18
5.9.11 Phosphorylation of nucleic acids using T4 polynucleotide kinase (T4 PNK).................................19
5.9.12 Dephosphorylation of digested plasmid DNA with shrimp alkaline phosphatase (SAP)...............19
5.9.13 Ligation with T4 ligase.....................................................................................................................19
I
Table of Contents
5.9.14 Production of chemically competent E. coli cells............................................................................20
5.9.15 Production of electro competent Agrobacterium tumefaciens cells.................................................20
5.9.16 Transformation of chemically competent E. coli cells.....................................................................20
5.9.17 Transformation of electro competent Agrobacterium tumefaciens cells.........................................21
5.9.18 PCR and sequencing primers............................................................................................................21
5.9.19 PCR with Taq DNA polymerase......................................................................................................22
5.9.20 PCR with Pfx DNA polymerase.......................................................................................................23
5.9.21 Sequencing PCR...............................................................................................................................23
5.9.22 QuickChange™ site-directed mutagenesis kit.................................................................................24
5.9.23 RNA extraction from plants.............................................................................................................24
5.9.24 RT-PCR using SuperScript One-Step RT-PCR kit from Invitrogen ..............................................25
5.9.25 Northern blot.....................................................................................................................................25
5.9.26 In vitro transcription of RNA...........................................................................................................27
5.10 Protein analysis..........................................................................................................................................27
5.10.1 Histochemical GUS staining............................................................................................................27
5.10.2 Sample preparation for SDS-PAGE.................................................................................................28
5.10.3 SDS-PAGE.......................................................................................................................................28
5.10.4 Coomassie staining...........................................................................................................................29
5.10.5 Western blot......................................................................................................................................29
5.10.6 ELISA (enzyme linked immuno sorbent assay)...............................................................................30
5.11 Inoculation of Nicotiana benthamiana with RNA transcripts..................................................................31
5.12 Agrobacterium infiltration.........................................................................................................................32
5.13 Fluorescence microscopy and photography of GFP.................................................................................32
5.14 ClustalX alignments..................................................................................................................................32
5.15 Protoplast isolation and transfection.........................................................................................................33
6 Results..................................................................................................................................................................35
6.1 Functionality of the TBSV replicase expressed in transgenic plants.........................................................35
6.2 Protein expression using the DI vector system...........................................................................................36
6.2.1 Cloning strategy of the ppDI-GUS construct.....................................................................................36
6.2.2 Inoculation experiments with DI-GUS RNA transcripts...................................................................37
6.2.3 Introduction of GFP, scFv, and viral coat protein genes into the vector ..........................................37
6.2.4 Insertion of the viral movement protein into the vector.....................................................................38
6.2.5 Inoculation experiments with DI reporter gene RNA transcripts......................................................40
6.2.6 Northern blot analysis of DI-scFv/TBSV-infected plants..................................................................41
6.2.7 Protoplast transfection with DI RNA transcripts...............................................................................43
6.2.8 Northern blot analysis of protoplast RNA..........................................................................................44
6.2.9 Construction of the ppmDI plasmid...................................................................................................45
6.2.10 Insertion of GUS, GFP, SCFV, YFP, CP and p22 into the ppmDI construct..................................47
6.2.11 Inoculation experiments with mDI RNA transcripts........................................................................48
II
Table of Contents
6.3 Induction of gene silencing using the DI vector system.............................................................................49
6.3.1 Cloning of pTBSVDp19 ....................................................................................................................49
6.3.2 Construction of pTBSVDDp19...........................................................................................................50
6.3.3 Isolation of a FtsH gene fragment from N. benthamiana..................................................................52
6.3.4 Insertion of the FtsH fragment into the ppDI vector..........................................................................53
6.3.5 Insertion of a phytoene desaturase (PDS) gene fragment into the ppDI vector.................................53
6.3.6 Construction of a GFP silencing vector.............................................................................................54
6.3.7 Inoculation experiments with TR4 plants..........................................................................................55
6.3.8 Inoculation experiments with the GFP silencing construct................................................................55
6.3.9 Inoculation experiments with the FtsH and PDS silencing construct................................................57
6.3.10 Construction of infectious TBSV clones for A. tumefaciens infiltration experiments....................59
6.3.11 Construction of an infectious TBSVDp19 clone for A. tumefaciens infiltration experiments.........62
6.3.12 Construction of a binary vector for the inoculation of plants with DI-PDS....................................62
6.3.13 A. tumefaciens infiltration experiments with DI-PDS binary vectors on TR4 plants......................64
6.3.14 A. tumefaciens infiltration experiments with DI-PDS binary vectors..............................................64
6.3.15 A. tumefaciens infiltration experiments with DI-PDS and virus binary vectors..............................65
6.3.16 Northern blot analysis of TBSVDp19/DI-FtsH infected plants.......................................................66
6.3.17 RT-PCR and cloning of the DI-FtsH fragment................................................................................67
6.3.18 Differences between TBSVDp19 and TBSVDDp19........................................................................68
6.4 Protection from gene silencing....................................................................................................................71
6.4.1 Construction of a binary vector harboring DI-gfpER and mDI-gfpER.............................................71
6.4.1.1 Cloning of pBSK-mgfp5............................................................................................................71
6.4.1.2 Cloning of pUC-gfpER..............................................................................................................71
6.4.1.3 Cloning of pBSK-gfpER............................................................................................................72
6.4.1.4 Cloning of pTPCR-gfpER..........................................................................................................74
6.4.1.5 Cloning of ppDI-gfpER and ppmDI-gfpER..............................................................................74
6.4.1.6 Cloning of pTPCR-DI-gfpER and pTPCR-mDI-gfpER...........................................................74
6.4.1.7 Cloning of pTPCR-DI-gfpERK and pTPCR-mDI-gfpERK......................................................75
6.4.1.8 Transfer of DI-gfpERK and mDI-gfpERK constructs into 35S promoter cassette...................76
6.4.1.9 Cloning of pGJ-DI-gfpER and pGJ-mDI-gfpER.......................................................................76
6.4.2 Agroinfiltration for transient expression of GFP constructs on N. benthamiana .............................77
6.4.3 Agroinfiltration for transient expression of GUS constructs on N. tabacum and GUS silenced N.
tabacum........................................................................................................................................................77
7 Discussion............................................................................................................................................................79
8 Literature..............................................................................................................................................................92
9 Appendix............................................................................................................................................................100
9.1 ClustalX alignment of the isolated DI-FtsH Sequences...........................................................................100
9.2 Plasmid map of ppDI-scFv, -mGFP and -CP............................................................................................103
III
Table of Contents
9.3 Plasmid map of ppDI-p22 and ppDI-p22M..............................................................................................104
9.4 Plasmid map of ppmDI.............................................................................................................................105
9.5 Plasmid map of ppmDI-GUS, -GFP, -scFv, -YFP, -CP, -p22..................................................................106
9.6 Plasmid map of pTBSVDp19 and pTBSVDDp19.....................................................................................109
9.7 Plasmid map of ppDI-FtsH and ppDI(-)3'gfp...........................................................................................110
9.8 Plasmid map of ppDI-PDS(+) and ppDI-PDS(-)......................................................................................111
9.9 Plasmid map of ppdS and dTBSV............................................................................................................112
9.10 Plasmid map of ppzp-TBSV and ppzp-TBSVDp19................................................................................113
9.11 Plasmid map of ppzp-SDI-PDS(+) and ppzp-SDI-PDS(-).....................................................................114
9.12 Plasmid map of pGJ-DIgfpERK and pGJ-mDIgfpERK.........................................................................115
IV
Abbreviations
2 Abbreviations
Amp ampicillin
AP alkaline phosphatase
APS ammonium persulfate
Asn asparagine
bp base pairs
DI defective interfering particle
DNA deoxyribonucleic acid
dNTP deoxynucleotide triphosphate
dpi days post inoculation
EDTA ethylenediaminetetraacetic
acid
ELISA enzyme linked immuno sorbent
assay
ER endoplasmatic reticulum
EtOH ethanol
GFP green fluorescents protein
GUS β-D-glucuronidase
His histidine
IgG immunoglobulin G
kb kilo bases
kD kilo dalton
Man mannitol
MeOH methanol
MES 2-Morpholinoethansulfonsäure
MS Murashige and Skoog
nt nucleotides
NTP nucleotide triphosphate
ORF open reading frames
PAGE polyacrylamide gel
electrophoresis
PBS phosphate buffered saline
PCR polymerase chain reaction
PDS phytoen desaturase
PEG polyethylenglycol
PNK polynucletide kinase
POD peroxidase
PTGS post transkriptional gene
silencing
PVDF polyvinylidene fluoride
RNA ribonucleic acid
rpm rounds per minute
SAP shrimp alkaline phosphatase
scFv single chain antibody variable
fragment
SDS sodiumdodecylsulfate
Ser serine
TAE tris acetate EDTA
TBE tris borate EDTA
TBS tris buffered saline
TBST tris buffered saline tween
TBSV tomato bushy stunt virus
TEMED N,N,N,N,tetramethyl-
ethyleneamine
Thr threonine
VIGS virus-induced gene silencing
X-GlcA 5-bromo-4-chloro-3-indolyl-β-
G-glucoronic acid
YFP yellow fluorescents protein
V
Abstract
3 Abstract
In this thesis a viral vector system was developed based on a DI-RNA, a sub-viral particle
derived from TBSV-BS3-statice. This newly designed vector system was tested for its
applicability in protein expression and induction of gene silencing. Two strategies were
pursued in this study. The first strategy being the replication of the DI-RNA by a
transgenically expressed TBSV replicase and the second being the replication by a so called
helper virus. It could be demonstrated by northern blot analysis that the viral replicase,
expressed by the transgenic N. benthamiana plant line TR4 or supplied by the helper virus, is
able to replicate DI-RNA introduced into the plant cells. Various genes were inserted into
different DI constructs in order to study the vector system with regard to protein expression.
However, independent of how the replicase was provided no detectable amounts of protein
were produced in the plants. Possible reasons for this failure are identified: the lack of
systemic movement of the DI-RNA in the transgenic TR4 plants and the occurrence of
deletions in the inserted genes in both systems. As a consequence the two strategies were
considered unsuitable for protein expression.
The DI-RNA vector system was able to induce silencing of transgenes as well as
endogenous genes. Several different p19 deficient helper virus constructs were made to
evaluate their silencing efficiency in combination with our DI-RNA constructs. In addition to
the various helper virus constructs different inoculation methods were studied to adapt the
vector system for a high efficiency, high throughput screening approach. However, it was
found that our vector system can not compete with other existing VIGS (virus induced gene
silencing) systems in this field.
Finally, the influence of DI sequences on mRNA stability on transient GFP and GUS
expression experiments in GFP/GUS silenced plants was evaluated. However, A. tumefaciens
infiltration with the binary vectors carrying the GFP gene did not result in GFP expression in
wild type N. benthamiana plants. Therefore, further experiments with GFP silenced plants
were not conducted. The alternative GUS reporter gene system was found to be unsuitable for
distinguishing between expression levels of wild type plants and GUS silenced transgenic
plants. Nevertheless, the results indicate a positive effect of the DI sequences on the level of
protein expression and therefore further research into this area is recommended.
VI
Introduction
4 Introduction
4.1 Molecular farming
Commercial success of plant based production processes has demonstrated that plants
expression systems possess an enormous potential for large scale production of recombinant
proteins. Plants have several advantages in terms of practical, economical and safety issues
compared to other expression systems. There are already several efficient plant based
expression systems available and development still continues driven by those advantages.
Many different proteins have been successfully produced in plants including antibodies,
vaccines and hormones [Fischer and Emans, 2000; Giddings, 2001]. A key advantage of using
transgenic plants as “bioreactors” is the comparatively low cost of large scale production.
This is mostly due to the fact that no expensive fermenters and peripheral equipment are
needed. Extensive research in this field is fueled by the possibility of high protein yields. For
instance, yields of 0.1 to 1 % of total soluble protein are already competitive with other
expression systems.
Conventional bioreactors have certain restrictions regarding the scale-up whereas plant
systems can be scaled up rapidly in response to the market demand.
The largest part of the production costs are caused by downstream processing and
purification of the recombinant protein. Regardless of the protein expression system the
purification processes are similar and the costs do not vary greatly. However, several types of
recombinant proteins produced in plants can be used in an unprocessed or only partially
processed state. Since, plant material is usually unproblematic for human consumption,
recombinant vaccines can be administered by the consumption of raw fruits or vegetables.
Accepting many advantages of plant based systems one has to acknowledge a major
drawback which is the time needed to establish a stable transgenic plant line. Transient
expression systems, as for example Agrobacterium tumefaciens infiltration and viral protein
expression vectors try to address this problem.
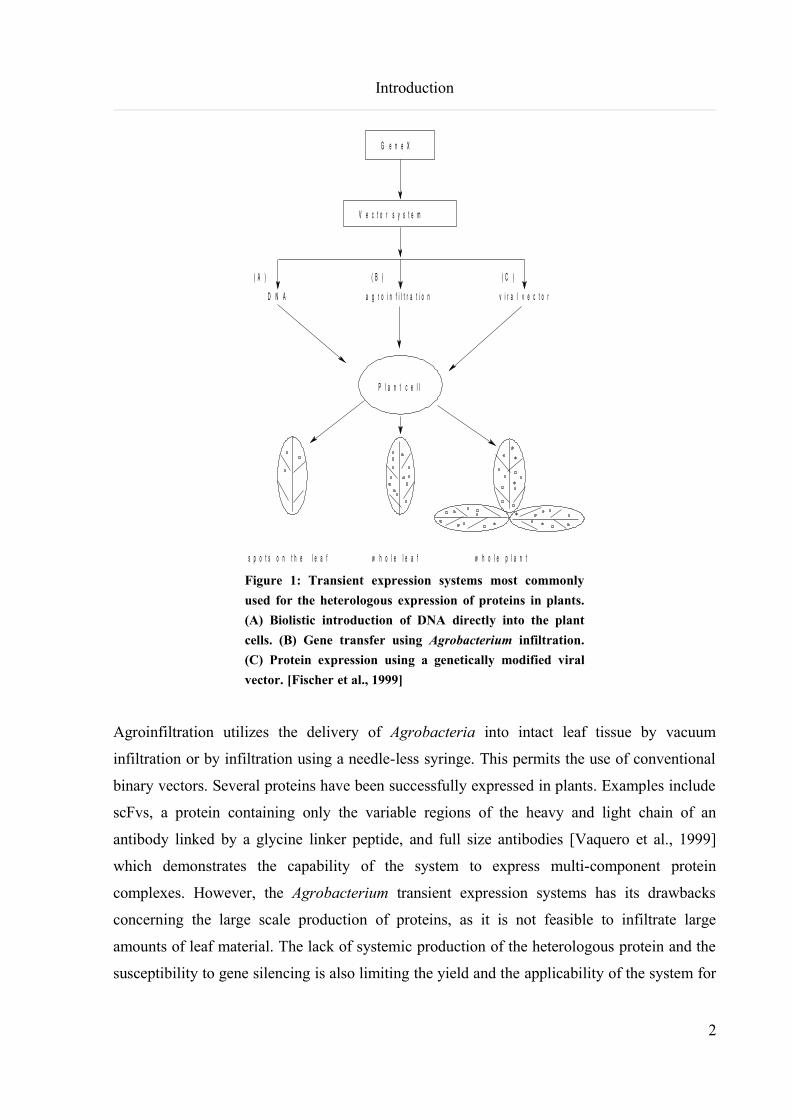
Transient expression systems commonly use three different approaches (Fig. 1); biolistic
delivery of DNA, infiltration with Agrobacteria and infection with modified viral vectors.
However, the first system using particle bombardment is not suitable for the expression of
large amounts of proteins in plants since only a small number of cells per leaf express the
protein of interest (Fig. 1).
1
Introduction
Figure 1: Transient expression systems most commonly
used for the heterologous expression of proteins in plants.
(A) Biolistic introduction of DNA directly into the plant
cells. (B) Gene transfer using Agrobacterium infiltration.
(C) Protein expression using a genetically modified viral
vector. [Fischer et al., 1999]
Agroinfiltration utilizes the delivery of Agrobacteria into intact leaf tissue by vacuum
infiltration or by infiltration using a needle-less syringe. This permits the use of conventional
binary vectors. Several proteins have been successfully expressed in plants. Examples include
scFvs, a protein containing only the variable regions of the heavy and light chain of an
antibody linked by a glycine linker peptide, and full size antibodies [Vaquero et al., 1999]
which demonstrates the capability of the system to express multi-component protein
complexes. However, the Agrobacterium transient expression systems has its drawbacks
concerning the large scale production of proteins, as it is not feasible to infiltrate large
amounts of leaf material. The lack of systemic production of the heterologous protein and the
susceptibility to gene silencing is also limiting the yield and the applicability of the system for
2
G e n e X
V e c t o r s y s t e m
D N A a g r o i n f i l t r a t i o n v i r a l v e c t o r
P l a n t c e l l
s p o t s o n t h e l e a f w h o l e l e a f w h o l e p l a n t
( A ) ( B ) ( C )
Introduction
large scale productions. Systemic production is one of the major advantages of viral vector
systems and therefore considerable research is done to develop novel viral vector systems.
4.1.1 Viral vectors in molecular farming
Viral vectors have several advantages in common with agroinfiltration. The rapidness in
which milligram amounts of protein can be produced and also the ease of use are similar for
both systems. So far the system has mostly been applied to test the usability of the plant
expression system for a specific protein under small scale production conditions but field
trials have also been conducted to produce recombinant protein [Fischer et al., 1999].
Additionally, viral vector systems are less susceptible to gene silencing due to the fact that
most plant viruses have developed strategies to suppress this plant defense mechanism.
In virus-mediated expression systems, the gene of interest is cloned into a plant virus
genome and plants are infected with the modified virus to produce the protein. Approximately
80 % of all plant viruses are RNA viruses and replicate to high titers which makes them ideal
protein expression tools. Some plant viruses like TBSV additionally have a wide host range
and are easily transmissible by mechanical inoculation making it possible to inoculate whole
fields of crop plants. There are different strategies to insert the gene of interest into the viral
vectors: Gene replacement, where viral genes, e. g. that encode the coat protein, dispensable
for replication and infection are replaced by a foreign gene; Gene insertion, where the gene of
interest is inserted into the viral genome under the control of a viral subgenomic promoter
[Fischer et al., 1999]; Gene fusion, where the foreign gene is translationally fused to a viral
gene and insertion of the heterologous gene into a satellite or any other subgenomic viral
RNA. The most suitable strategy is dependent on the host/virus combination and the target
gene. Most plant viruses have constraints on genome size and because of this, gene
replacement is predominantly chosen.
The gene insertion technology is employed, if large coding sequences need to be
expressed. Fusions with viral proteins were generally carried out with the coat protein and are
very efficient for presenting foreign peptides on the surface of the viral particle [Joelson et al.,
1997]. The insertion of genes into satellite or other subgenomic RNAs has not been widely
applied up to now.
For inoculation of plants, the recombinant viral vectors are transcribed in vitro using
3
Introduction
bacterial phage RNA polymerases like T7- and SP6- RNA polymerase. The synthesized RNA
is inoculated by gently rubbing the leaves with an abrasive. For the infection of a large
number of plants extracts of the initially infected plants can be used. Efficiency improvements
of this technique may involve the use of Agrobacteria to introduce the viral vectors into the
plant. However, there are several issues that still need to be approached with viral vectors.
The stability of these recombinant vectors is often poor and the containment of the virus has
to be addressed. One of the aims of this study was to approach the problem of containment so
that replication of the viral sequence is only possible if the viral replicase is supplied in trans.
4.2 Post transcriptional gene silencing (PTGS)
As mentioned above gene silencing can be a problem in generating transgenic plants for
effective protein expression in both stable and transient systems. Gene silencing is an
evolutionary highly conserved defense mechanism against invasive nucleic acids, e. g. viruses
and transposable elements. The phenomenon was first discovered in 1990 when plant
biologists introduced an additional chalcone synthase gene into petunias to achieve a darker
purple flower color [Napoli et al., 1990; Van Der Krol et al., 1990] . Surprisingly the flowers
of the transformants were found to be white or patchy instead of darker. The introduced
transgenes had silenced both themselves and the endogenous genes of the plants. This
phenomenon was termed cosuppression. A similar effect was observed when plants were
infected with a genetically engineered RNA virus harboring a plant gene fragment [Lindbo
and Dougherty, 1992]. However, this process was not understood at that time. The results of
Fire and coworkers [Fire et al., 1998] shed new light on the relationship between the two
phenomena, since they could demonstrate that double stranded RNA (dsRNA) triggered gene
silencing in Caenorhabditis elegans. Detailed examinations of gene silencing phenomena in
plants revealed a similar mechanism. Simultaneous expression of sense and antisense
transgene constructs [Waterhouse et al., 1998], induced silencing to a higher degree than
expression of the sense construct alone. Similar to this RNA viruses replicating through
dsRNA intermediates, multicopy transgenes, occasionally producing low levels of dsRNA
and inverted repeat constructs likewise provide efficient silencing trigger molecules in plants.
Considerable progress in this field has been achieved in the past years like the isolation of
short interfering RNAs (siRNA), two 21 nt long RNA strands paired in a staggered duplex
4
Introduction
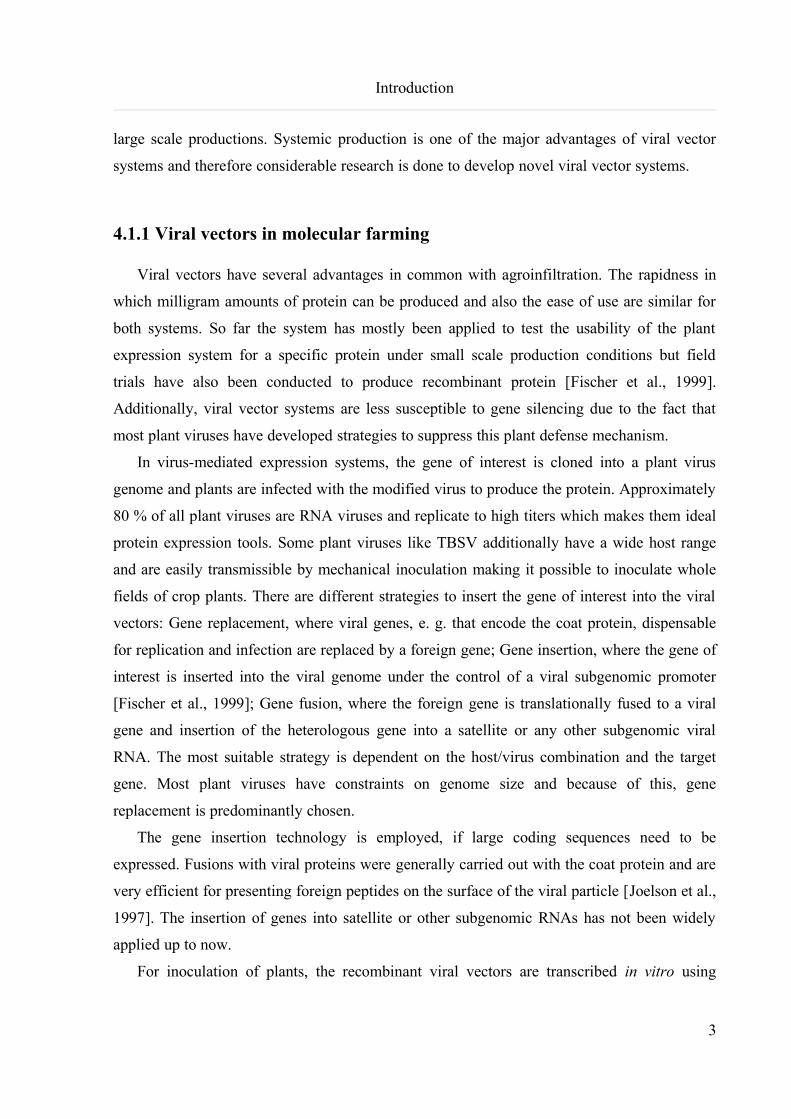
that are derived from the silenced gene, but the understanding of the mechanism (Fig. 2) is not
yet complete.
Figure 2: The current model of RNA-mediated gene silencing in plants. Double-
stranded RNA (dsRNA) from replicating viral RNA, viral-vector-derived (VIGS, or
virus-induced gene silencing) RNA or hairpin RNA (hpRNA) transcribed from a
transgene, is processed by a Dicer-containing complex to generate siRNAs. An
endonuclease-containing complex (called the RNA induced silencing complex, RISC), is
guided by the antisense strand of the siRNA to cleave specific mRNAs, so promoting
their degradation [Waterhouse and Helliwell, 2003].
The first step in the silencing process is the cleavage of the dsRNA into siRNAs by an
enzyme called Dicer [Bernstein et al., 2001]. The next step is the removal of the sense strand
of the siRNA, leaving the antisense strand which is complementary to the target gene. The
antisense strand guides a protein complex named RISC (RNA induced silencing complex) to
the mRNA of the target gene. The mRNA is then degraded by the protein complex. In plants,
5
Introduction
gene silencing by siRNAs requires the activity of an RNA-dependent RNA polymerase
(RdRP), which uses the antisense strand of a siRNA as primer in the synthesis of more
dsRNA, thus amplifying the signal. This enables siRNA-mediated silencing to spread
throughout the plant, by cell-to-cell movement of silencing associated RNA [Yoo et al.,
2004], resulting in the resistance of the plant against further viral infection.
Gene silencing is becoming a valuable tool in genetic research since it can be applied to
study the function of unknown genes. This and the fact that silencing is a major problem in
the production of transgenic plant lines initiated intensive research in order to develop a better
understanding of this phenomenon.
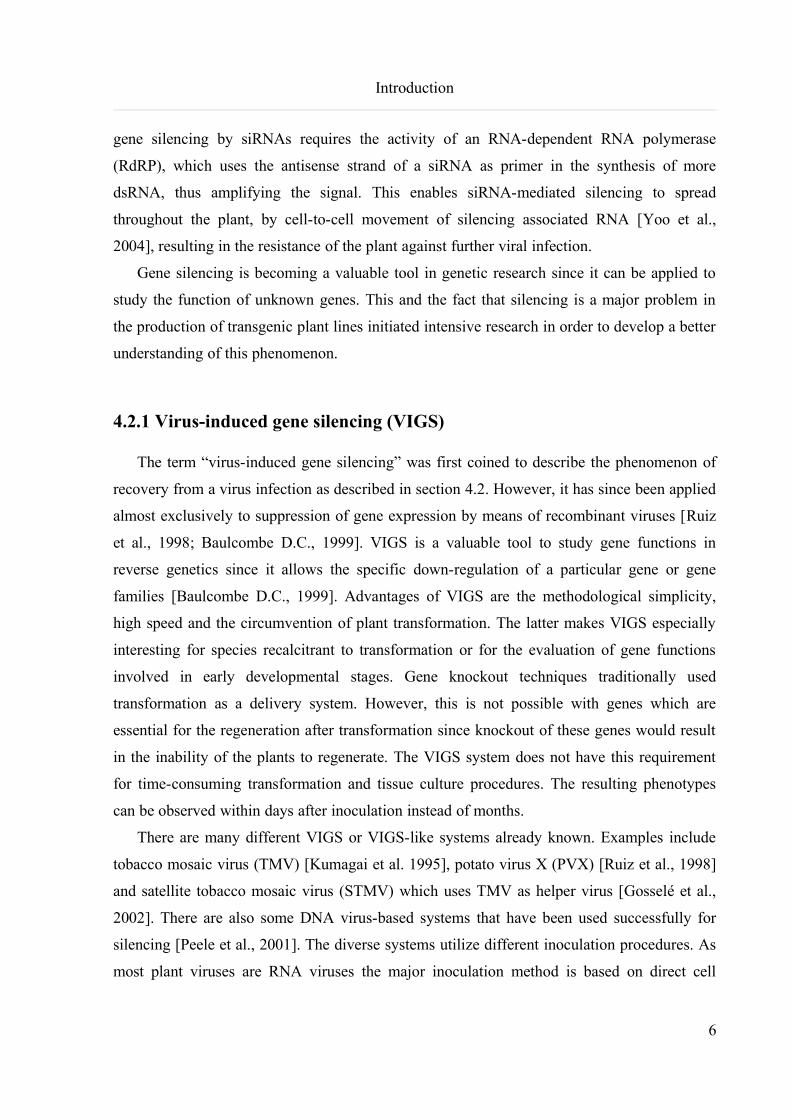
4.2.1 Virus-induced gene silencing (VIGS)
The term “virus-induced gene silencing” was first coined to describe the phenomenon of
recovery from a virus infection as described in section 4.2. However, it has since been applied
almost exclusively to suppression of gene expression by means of recombinant viruses [Ruiz
et al., 1998; Baulcombe D.C., 1999]. VIGS is a valuable tool to study gene functions in
reverse genetics since it allows the specific down-regulation of a particular gene or gene
families [Baulcombe D.C., 1999]. Advantages of VIGS are the methodological simplicity,
high speed and the circumvention of plant transformation. The latter makes VIGS especially
interesting for species recalcitrant to transformation or for the evaluation of gene functions
involved in early developmental stages. Gene knockout techniques traditionally used
transformation as a delivery system. However, this is not possible with genes which are
essential for the regeneration after transformation since knockout of these genes would result
in the inability of the plants to regenerate. The VIGS system does not have this requirement
for time-consuming transformation and tissue culture procedures. The resulting phenotypes
can be observed within days after inoculation instead of months.
There are many different VIGS or VIGS-like systems already known. Examples include
tobacco mosaic virus (TMV) [Kumagai et al. 1995], potato virus X (PVX) [Ruiz et al., 1998]
and satellite tobacco mosaic virus (STMV) which uses TMV as helper virus [Gosselé et al.,
2002]. There are also some DNA virus-based systems that have been used successfully for
silencing [Peele et al., 2001]. The diverse systems utilize different inoculation procedures. As
most plant viruses are RNA viruses the major inoculation method is based on direct cell
6
Introduction
inoculation with RNA transcripts. A vector containing the viral genome under the control of a
bacterial phage promoter, such as T7, SP6 or T3, allows in vitro transcription of large
amounts of RNA. The RNA solution, together with an abrasive substance is mechanically
inoculated onto plant leaves in order to deliver the RNA into parenchyma cells. DNA viruses
have the advantage of eliminating the transcription step, allowing direct inoculation with
plasmid DNA. Since in vitro transcription can be economically prohibitive on a large scale,
plasmid DNA provides a cheaper alternative for application of a large number of vectors.
Agroinfiltration is another method to introduce the viral genome into the plant. Agrobacteria
infiltration is more suitable in the application of VIGS in high-throughput screening of cDNA
libraries since it is cheaper and not as time consuming as RNA transcript rub-inoculation.
For the purpose of testing new VIGS systems there are a set of genes that have previously
been reported to function in VIGS vectors, such as the phytoen desaturase (PDS) gene [Mann
et al., 1994]. PDS participates in the carotenoid metabolic pathway, acting on the antenna
complex of the thylakoid membranes and it protects the chlorophyll from photo oxidation.
Deficiency in PDS activity results in white bleached spots on affected leaves. Further genes
that have also been successfully adopted in VIGS systems include the FtsH protease, the GFP,
and the cellulose synthase A gene. These approaches demonstrated that the entire coding
sequence is not required to induce silencing. A partial sequence of 100 to 800 bp is sufficient.
Until now the VIGS system has only been efficiently applied to a few plant species,
including N. benthamiana, tomato and barley. In order to expand this group of species that
respond efficiently to VIGS, considerable effort is being put towards developing novel
vectors. The tomato bushy stunt virus (TBSV)/defective interfering particle (DI) system was
assumed to represent such a novel silencing vector because it has a broad host range, a small
construct size and it can be introduced by A. tumefaciens infiltration.
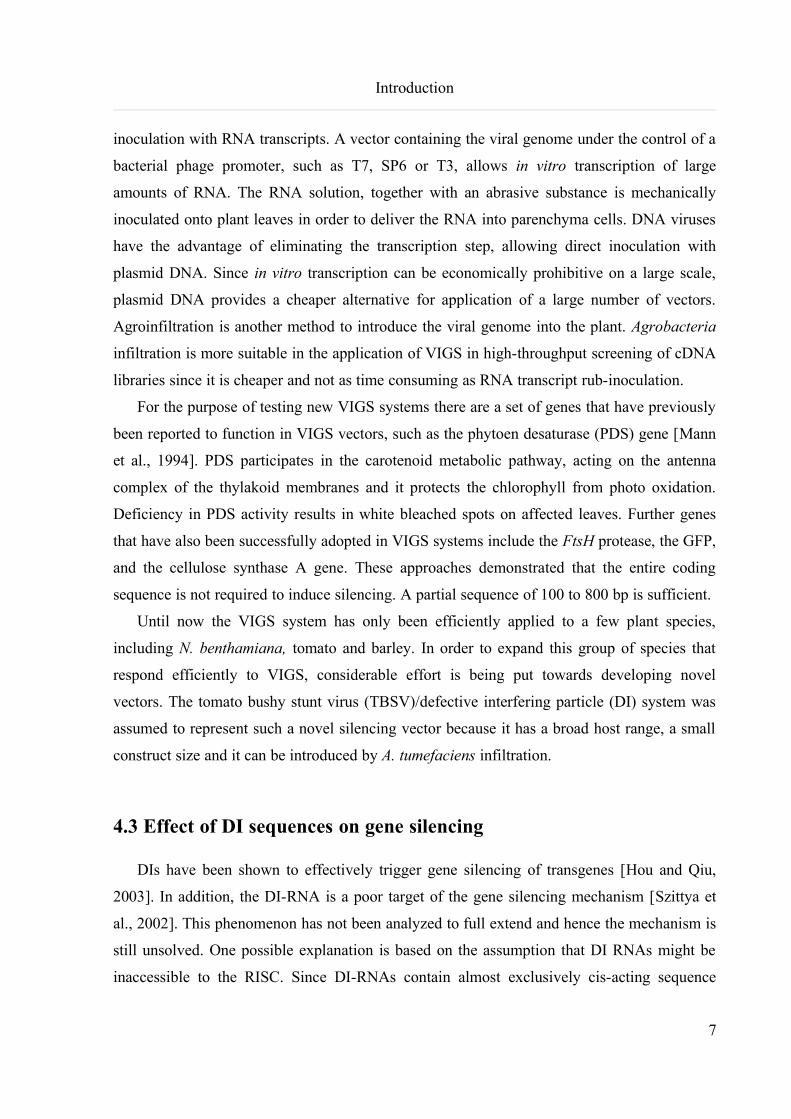
4.3 Effect of DI sequences on gene silencing
DIs have been shown to effectively trigger gene silencing of transgenes [Hou and Qiu,
2003]. In addition, the DI-RNA is a poor target of the gene silencing mechanism [Szittya et
al., 2002]. This phenomenon has not been analyzed to full extend and hence the mechanism is
still unsolved. One possible explanation is based on the assumption that DI RNAs might be
inaccessible to the RISC. Since DI-RNAs contain almost exclusively cis-acting sequence
7
Introduction
elements required for replication and are tightly associated with the replication complex.
Alternatively, the secondary structure of the RNA may prevent their degradation by PTGS as
indicated by correlations of the size of DI RNAs and the degradation by PTGS [Szittya et al.,
2002]. Further, DI sequences have been shown to enhance translation of uncapped RNA in
protoplasts [Wu and White, 1999; Ray and White, 2003] since they carry a cap-independent
translational enhancer (3' CITE). To investigate the suitability of DI sequences for protein
expression in plants several projects have been conducted in our institute. One project showed
that a binary vector construct containing a DI-GUS sequence led to a five times higher GUS
activity than constructs without DI sequences when adopted in transient Agrobacterium
infiltration experiments [Eilers, 2002]. In stable transformants harboring these constructs this
difference was not observed. Since gene silencing is an even greater problem in transient
expression than with stable transformants, it was thought that DI sequences may protect the
mRNA from degradation by PTGS. To further investigate this possibility it was decided to
construct additional DI binary vector constructs and infiltrate them in silenced GFP or GUS
plants respectively. DI sequences could be a valuable tool to minimize the problem of gene
silencing since it is a major problem in the generation of transgenic plants.
4.4 Tomato bushy stunt virus (TBSV)
Tomato bushy stunt virus (TBSV) is a member the Tombusviridae family [Brunt et al.,
1997; Hull, 2002] and within this family TBSV belongs to the genus Tombusvirus. It forms
isometric icosahedral particles which contain a positive-sense single stranded RNA (ssRNA)
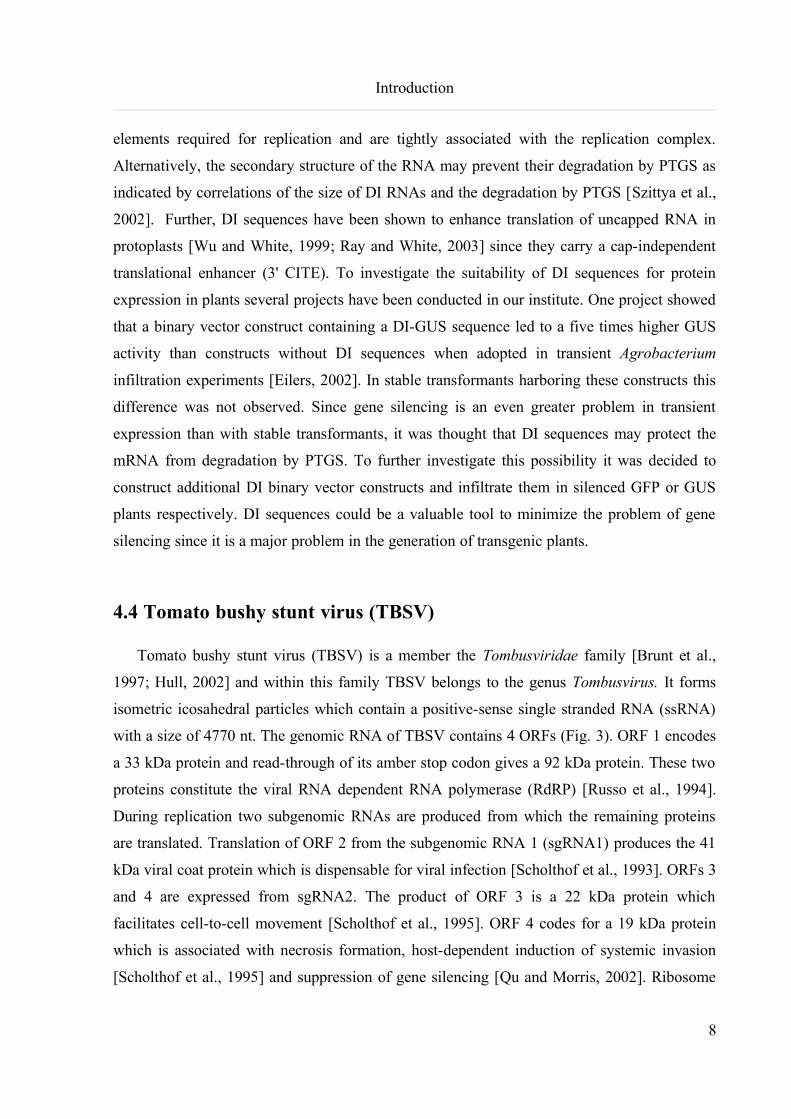
with a size of 4770 nt. The genomic RNA of TBSV contains 4 ORFs (Fig. 3). ORF 1 encodes
a 33 kDa protein and read-through of its amber stop codon gives a 92 kDa protein. These two
proteins constitute the viral RNA dependent RNA polymerase (RdRP) [Russo et al., 1994].
During replication two subgenomic RNAs are produced from which the remaining proteins
are translated. Translation of ORF 2 from the subgenomic RNA 1 (sgRNA1) produces the 41
kDa viral coat protein which is dispensable for viral infection [Scholthof et al., 1993]. ORFs 3
and 4 are expressed from sgRNA2. The product of ORF 3 is a 22 kDa protein which
facilitates cell-to-cell movement [Scholthof et al., 1995]. ORF 4 codes for a 19 kDa protein
which is associated with necrosis formation, host-dependent induction of systemic invasion
[Scholthof et al., 1995] and suppression of gene silencing [Qu and Morris, 2002]. Ribosome
8
Introduction
scanning occurs, allowing translation of ORF 4 [Hull, 2002] since the initiation codon of ORF
3 is in suboptimal context. For plant mRNAs, the most crucial elements of AUG context are
the purine at position +3, not present in the context of ORF 3, and guanine at position +4
[Kozak, 2002; Kozak, 1984].
Figure 3: Schematic representation of the genomic RNA sequence of TBSV-BS3-Statice [Krczal
et al., 1994; Galetzka et al., 2000]. The 4 ORFs of TBSV are depicted as red arrows. The p92
ORF is the product of read-through of the amber stop codon of p33. CP is translated from the
sg1 RNA. p22 and p19 are translated from sg2 RNA.
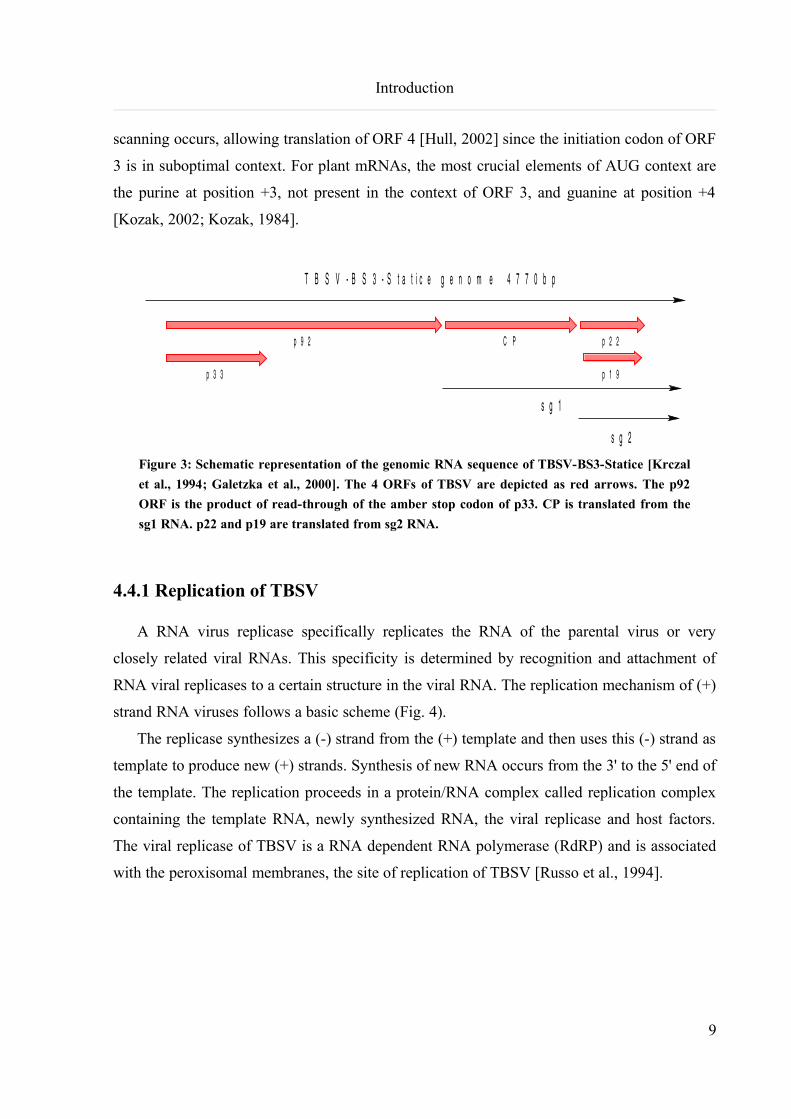
4.4.1 Replication of TBSV
A RNA virus replicase specifically replicates the RNA of the parental virus or very
closely related viral RNAs. This specificity is determined by recognition and attachment of
RNA viral replicases to a certain structure in the viral RNA. The replication mechanism of (+)
strand RNA viruses follows a basic scheme (Fig. 4).
The replicase synthesizes a (-) strand from the (+) template and then uses this (-) strand as
template to produce new (+) strands. Synthesis of new RNA occurs from the 3' to the 5' end of
the template. The replication proceeds in a protein/RNA complex called replication complex
containing the template RNA, newly synthesized RNA, the viral replicase and host factors.
The viral replicase of TBSV is a RNA dependent RNA polymerase (RdRP) and is associated
with the peroxisomal membranes, the site of replication of TBSV [Russo et al., 1994].
9
p 9 2
p 3 3
C P p 2 2
p 1 9
T B S V - B S 3 - S t a t i c e g e n o m e 4 7 7 0 b p
s g 1
s g 2
Introduction
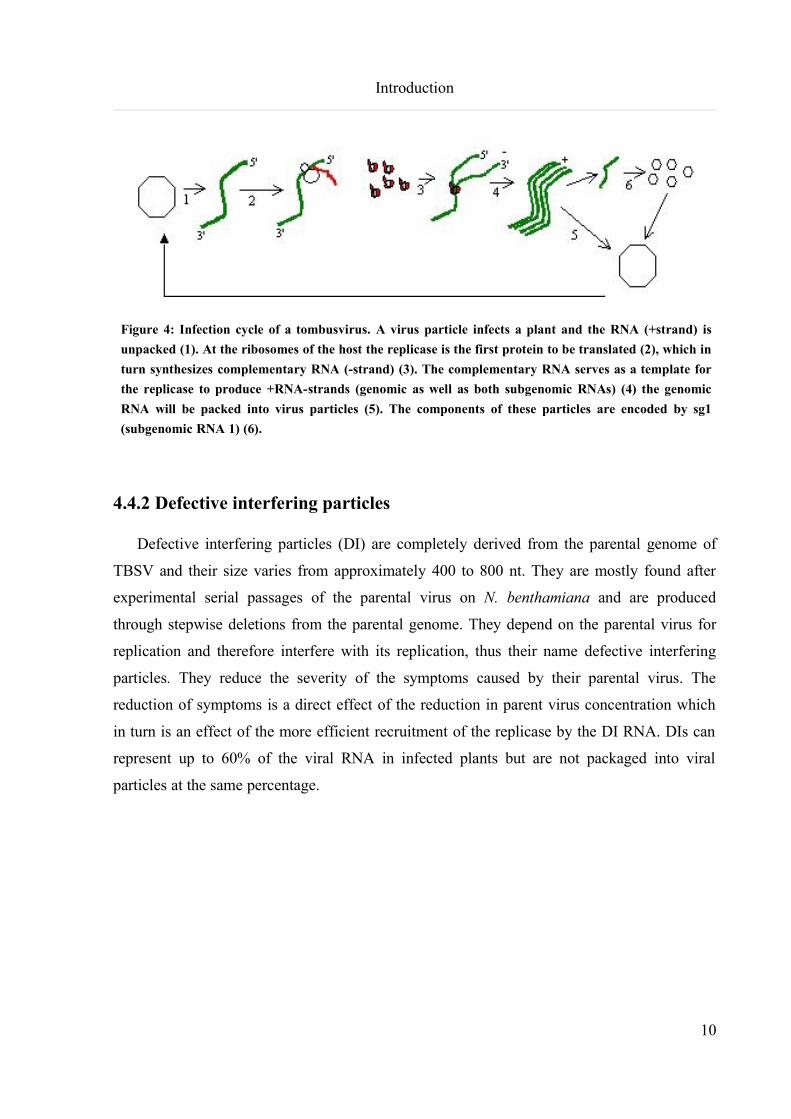
Figure 4: Infection cycle of a tombusvirus. A virus particle infects a plant and the RNA (+strand) is
unpacked (1). At the ribosomes of the host the replicase is the first protein to be translated (2), which in
turn synthesizes complementary RNA (-strand) (3). The complementary RNA serves as a template for
the replicase to produce +RNA-strands (genomic as well as both subgenomic RNAs) (4) the genomic
RNA will be packed into virus particles (5). The components of these particles are encoded by sg1
(subgenomic RNA 1) (6).
4.4.2 Defective interfering particles
Defective interfering particles (DI) are completely derived from the parental genome of
TBSV and their size varies from approximately 400 to 800 nt. They are mostly found after
experimental serial passages of the parental virus on N. benthamiana and are produced
through stepwise deletions from the parental genome. They depend on the parental virus for
replication and therefore interfere with its replication, thus their name defective interfering
particles. They reduce the severity of the symptoms caused by their parental virus. The
reduction of symptoms is a direct effect of the reduction in parent virus concentration which
in turn is an effect of the more efficient recruitment of the replicase by the DI RNA. DIs can
represent up to 60% of the viral RNA in infected plants but are not packaged into viral
particles at the same percentage.
10
Introduction
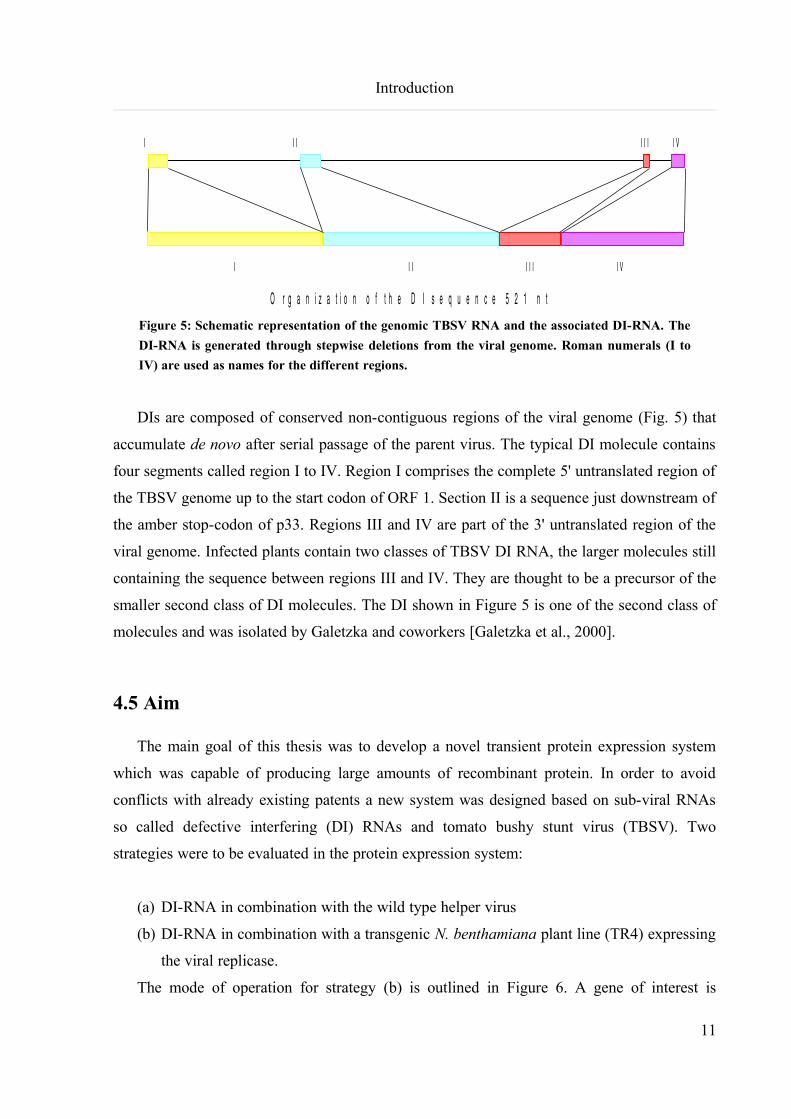
Figure 5: Schematic representation of the genomic TBSV RNA and the associated DI-RNA. The
DI-RNA is generated through stepwise deletions from the viral genome. Roman numerals (I to
IV) are used as names for the different regions.
DIs are composed of conserved non-contiguous regions of the viral genome (Fig. 5) that
accumulate de novo after serial passage of the parent virus. The typical DI molecule contains
four segments called region I to IV. Region I comprises the complete 5' untranslated region of
the TBSV genome up to the start codon of ORF 1. Section II is a sequence just downstream of
the amber stop-codon of p33. Regions III and IV are part of the 3' untranslated region of the
viral genome. Infected plants contain two classes of TBSV DI RNA, the larger molecules still
containing the sequence between regions III and IV. They are thought to be a precursor of the
smaller second class of DI molecules. The DI shown in Figure 5 is one of the second class of
molecules and was isolated by Galetzka and coworkers [Galetzka et al., 2000].
4.5 Aim
The main goal of this thesis was to develop a novel transient protein expression system
which was capable of producing large amounts of recombinant protein. In order to avoid
conflicts with already existing patents a new system was designed based on sub-viral RNAs
so called defective interfering (DI) RNAs and tomato bushy stunt virus (TBSV). Two
strategies were to be evaluated in the protein expression system:
(a) DI-RNA in combination with the wild type helper virus
(b) DI-RNA in combination with a transgenic N. benthamiana plant line (TR4) expressing
the viral replicase.
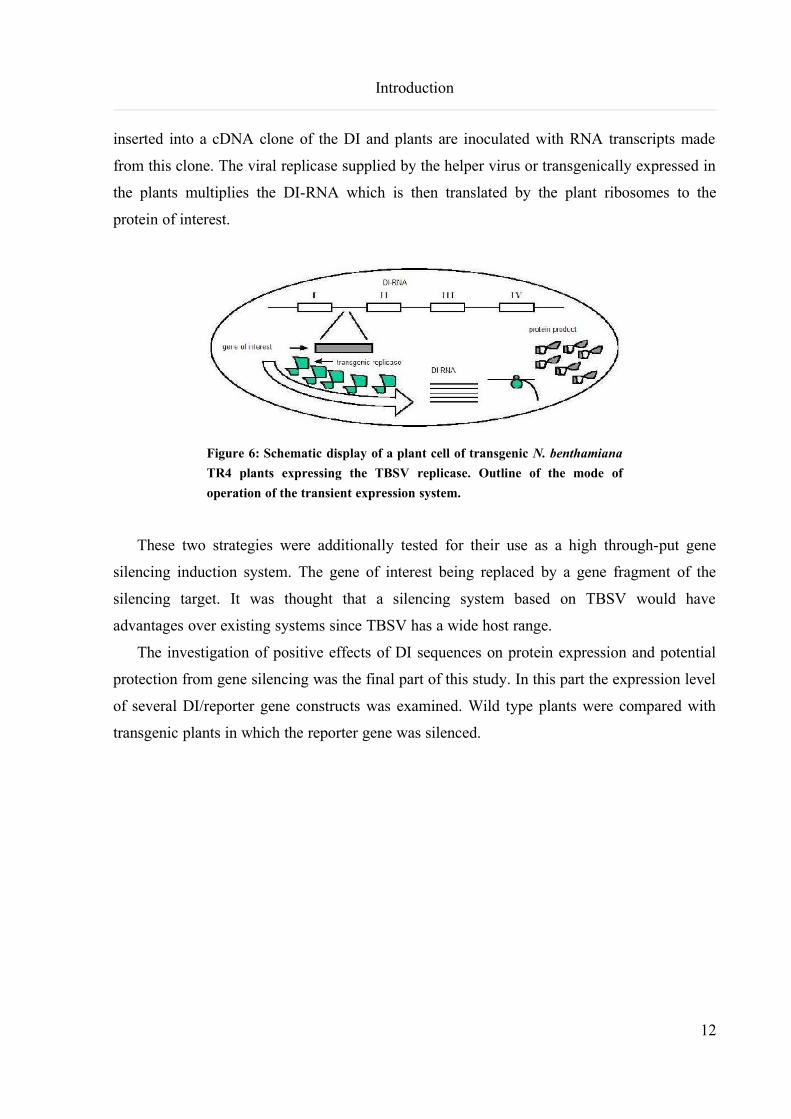
The mode of operation for strategy (b) is outlined in Figure 6. A gene of interest is
11
I I I I I I I V
I I I I I I I V
O r g a n i z a t i o n o f t h e D I s e q u e n c e 5 2 1 n t
Introduction
inserted into a cDNA clone of the DI and plants are inoculated with RNA transcripts made
from this clone. The viral replicase supplied by the helper virus or transgenically expressed in
the plants multiplies the DI-RNA which is then translated by the plant ribosomes to the
protein of interest.
Figure 6: Schematic display of a plant cell of transgenic N. benthamiana
TR4 plants expressing the TBSV replicase. Outline of the mode of
operation of the transient expression system.
These two strategies were additionally tested for their use as a high through-put gene
silencing induction system. The gene of interest being replaced by a gene fragment of the
silencing target. It was thought that a silencing system based on TBSV would have
advantages over existing systems since TBSV has a wide host range.
The investigation of positive effects of DI sequences on protein expression and potential
protection from gene silencing was the final part of this study. In this part the expression level
of several DI/reporter gene constructs was examined. Wild type plants were compared with
transgenic plants in which the reporter gene was silenced.
12
Materials and Methods
5 Materials and Methods
5.1 Chemicals
All chemicals that were used in this work were p. a. quality.
5.2 Enzymes
• T4-polynucleotide kinase 10000 U/ml M0201S New England Biolabs
• Pfx DNA polymerase 2000 U/ml M0254S Invitrogen
• Taq DNA polymerase 5U/µl Eppendorf
• T7 RNA polymerase 50000 U/ml M0251L New England Biolabs
• All other enzymes New England Biolabs
Roche
MBI Fermentas
5.3 Antibodies
• Anti-TBSV-IgG Loewe
• Anti-TBSV-IgG-AP-conjugate Loewe
• Anti-HexaHis Novagen
• Anti-Mouse-IgG-IgG Sigma
• Anti-Mouse-IgG-IgG-POD-conjugate Boehringer
5.4 Plants
• Nicotiana benthamiana
• Nicotiana tabacum
• TR4 (Nicotiana benthamiana carrying the replicase gene from TBSV-BS3-Statice
under the control of an enhanced 35S promoter)
13
Materials and Methods
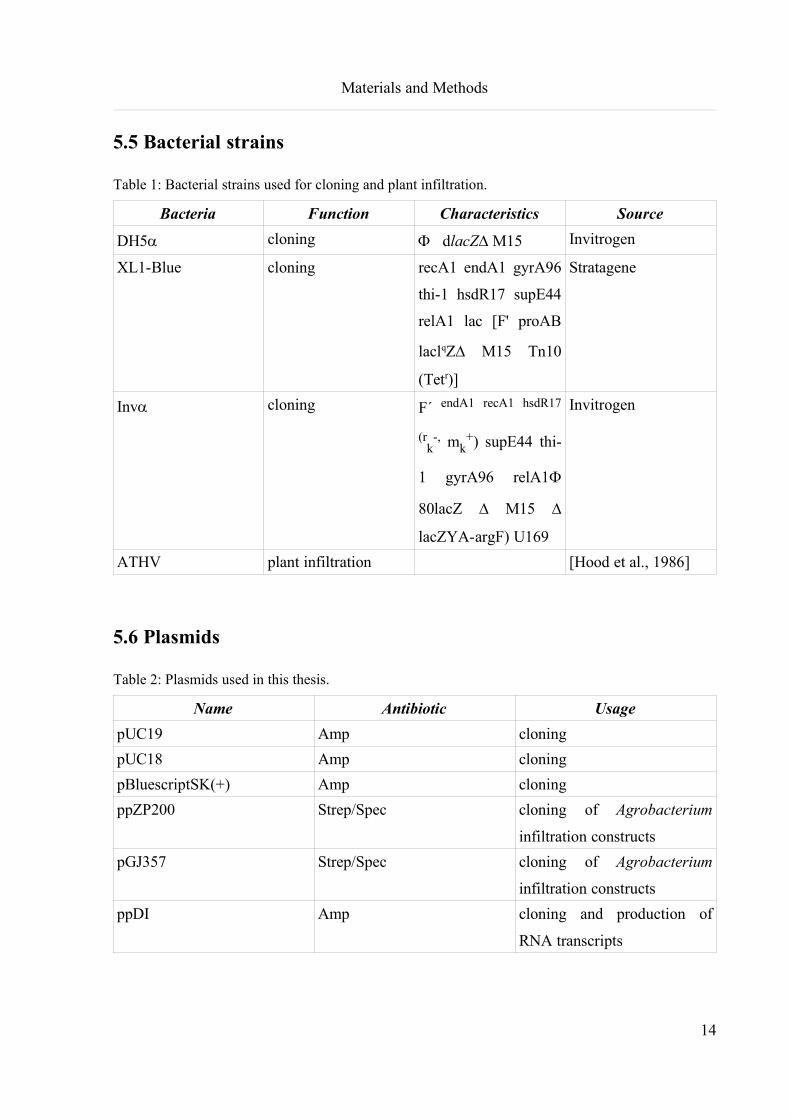
5.5 Bacterial strains
Table 1: Bacterial strains used for cloning and plant infiltration.
Bacteria Function Characteristics Source
DH5a cloning dlacZD M15 Invitrogen
XL1-Blue cloning recA1 endA1 gyrA96
thi-1 hsdR17 supE44
relA1 lac [F' proAB
laclqZD M15 Tn10
(Tetr)]
Stratagene
Inva cloning F´ endA1 recA1 hsdR17
(rk
-, mk+) supE44 thi-
1 gyrA96 relA1
80lacZ D M15 D
lacZYA-argF) U169
Invitrogen
ATHV plant infiltration [Hood et al., 1986]
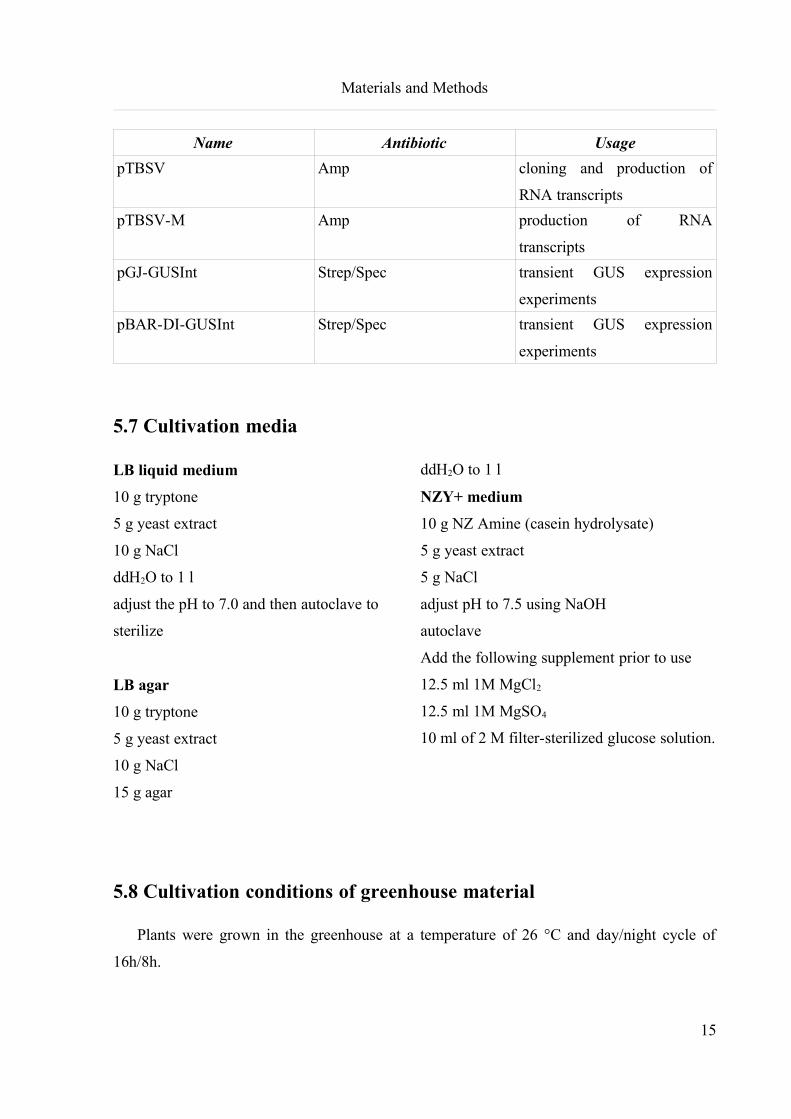
5.6 Plasmids
Table 2: Plasmids used in this thesis.
Name Antibiotic Usage
pUC19 Amp cloning
pUC18 Amp cloning
pBluescriptSK(+) Amp cloning
ppZP200 Strep/Spec cloning of Agrobacterium
infiltration constructs
pGJ357 Strep/Spec cloning of Agrobacterium
infiltration constructs
ppDI Amp cloning and production of
RNA transcripts
14
Materials and Methods
Name Antibiotic Usage
pTBSV Amp cloning and production of
RNA transcripts
pTBSV-M Amp production of RNA
transcripts
pGJ-GUSInt Strep/Spec transient GUS expression
experiments
pBAR-DI-GUSInt Strep/Spec transient GUS expression
experiments
5.7 Cultivation media
LB liquid medium
10 g tryptone
5 g yeast extract
10 g NaCl
ddH2O to 1 l
adjust the pH to 7.0 and then autoclave to
sterilize
LB agar
10 g tryptone
5 g yeast extract
10 g NaCl
15 g agar
ddH2O to 1 l
NZY+ medium
10 g NZ Amine (casein hydrolysate)
5 g yeast extract
5 g NaCl
adjust pH to 7.5 using NaOH
autoclave
Add the following supplement prior to use
12.5 ml 1M MgCl2
12.5 ml 1M MgSO4
10 ml of 2 M filter-sterilized glucose solution.
5.8 Cultivation conditions of greenhouse material
Plants were grown in the greenhouse at a temperature of 26 °C and day/night cycle of
16h/8h.
15
Materials and Methods
5.9 Molecular biology methods
5.9.1 Mini-preparation of plasmid DNA with Qiaprep spin miniprep kit
The overnight bacterial culture was submitted for plasmid DNA mini-preparation using
the QIAprep spin miniprep kit. Isolation was performed according to the instructions of the
manufacturer.
5.9.2 Mini-preparation of plasmid DNA from Agrobacterium tumefaciens
with Wizard Plus DNA purification system
The bacterial culture was submitted for plasmid DNA mini-preparation using the Wizard
Plus DNA purification system. Isolation was performed according to the instructions of the
manufacturer. After isolation, E. coli cells were transformed with the purified DNA.
5.9.3 Cryopreservation of bacterial cells
Validated recombinant bacterial clones were maintained as glycerol stocks [300 µl
glycerol (87%) + 700 L bacterial culture] at -80 °C.
5.9.4 Determination of DNA and RNA concentration by UV spectrometry
The concentration of DNA was measured by adding 5 µl of the DNA solution to 95 µl of
water. The absorption at 260 and 280 nm was measured using a UV photometer (UV-160 1PC
Shimadzu). OD260 = 1 is equal to a DNA concentration of 50 µg/ml [Sambrook et al., 1989].
The concentration of RNA was measured by adding 2 µl of the RNA solution to 98 µl of
water. The absorption was measured at 260 and 280 nm using a UV photometer (UV-160 1PC
Shimadzu). OD260 = 1 is equal to a RNA concentration of 42 µg/ml [Sambrook et al., 1989].
5.9.5 T-tailing of plasmid DNA
About 8 µg of SmaI digested and gel purified pUC19 plasmid was dissolved in 69 µl of
16
Materials and Methods
water. To the resuspended plasmid 10 µl of 10x Taq DNA polymerase reaction buffer, 20 µl
of 10 mM dTTP solution and 1 µl of Taq DNA polymerase were added. The reaction was
incubated for 3h at 70 °C. After incubation the DNA was purified by phenolization and
subsequent precipitation. The DNA was dissolved in water and stored at -80 °C for analysis.
5.9.6 Restriction enzyme digests
For preparative digests 1 µg of DNA was digested with 10 U of restriction enzyme in the
appropriate buffer in a total volume of 20 µl. A 1 µl aliquot was taken after 1 h for
electrophoresis analysis.
5.9.7 Agarose gel electrophoresis
Analytical as well as preparative gel electrophoresis of plasmid DNA and PCR fragments
was performed as described preciously [Sambrook et al., 1989]. The percentage of the agarose
gels ranged from 0.8%-1.5% (w/v) made in 1x TAE, supplemented with the fluorescent
intercalating dye ethidiumbromide (0.1 µg/ml). To determine the fragment size and estimate
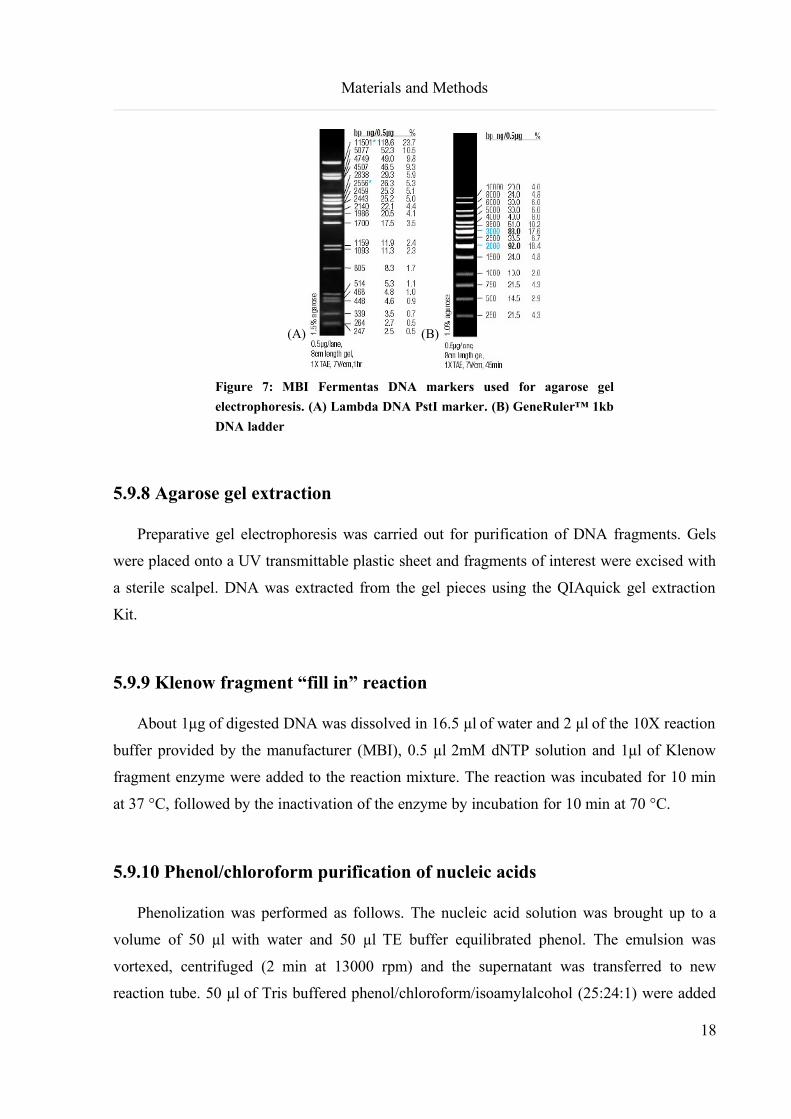
the concentration, DNA markers (Fig. 7) with known sizes of fragments were
coelectrophoresed. Bands were visualized using an ultraviolet (UV) transilluminator (306 nm
max) and photographs were taken using INTAS computer documentation system.
17
Materials and Methods
(A) (B)
Figure 7: MBI Fermentas DNA markers used for agarose gel
electrophoresis. (A) Lambda DNA PstI marker. (B) GeneRuler™ 1kb
DNA ladder
5.9.8 Agarose gel extraction
Preparative gel electrophoresis was carried out for purification of DNA fragments. Gels
were placed onto a UV transmittable plastic sheet and fragments of interest were excised with
a sterile scalpel. DNA was extracted from the gel pieces using the QIAquick gel extraction
Kit.
5.9.9 Klenow fragment “fill in” reaction
About 1µg of digested DNA was dissolved in 16.5 µl of water and 2 µl of the 10X reaction
buffer provided by the manufacturer (MBI), 0.5 µl 2mM dNTP solution and 1µl of Klenow
fragment enzyme were added to the reaction mixture. The reaction was incubated for 10 min
at 37 °C, followed by the inactivation of the enzyme by incubation for 10 min at 70 °C.
5.9.10 Phenol/chloroform purification of nucleic acids
Phenolization was performed as follows. The nucleic acid solution was brought up to a
volume of 50 µl with water and 50 µl TE buffer equilibrated phenol. The emulsion was
vortexed, centrifuged (2 min at 13000 rpm) and the supernatant was transferred to new
reaction tube. 50 µl of Tris buffered phenol/chloroform/isoamylalcohol (25:24:1) were added
18
Materials and Methods
and mixed. After centrifugation the supernatant was transferred to a new reaction tube and the
nucleic acids were precipitated by adding 1/10 volume of 3M NaAc (pH 5.2) solution and 2.5
volumes of EtOH. The DNA was then pelleted by centrifugation (10 min at 18000 rpm) and
subsequently washed with 70% EtOH. The pellet was dried and then dissolved in 10 µl of
water.
5.9.11 Phosphorylation of nucleic acids using T4 polynucleotide kinase (T4
PNK)
Phosphorylation of DNA was done using T4 PNK from MBI Fermentas. Up to 1 µg of
DNA was dissolved in 19 µl of water and 2.5 µl of 10X reaction buffer, 2.5 µl of 10mM ATP
solution and 1 µl of T4 PNK were added to the reaction mixture. The reaction was incubated
for 15 min at 37 °C, then the enzyme was inactivated by incubation at 70 °C for 10 min.
5.9.12 Dephosphorylation of digested plasmid DNA with shrimp alkaline
phosphatase (SAP)
For the dephosphorylation of digested plasmid-DNA 20 µl of the digest reaction were
mixed with 3 µl of 10X SAP (shrimp alkaline phosphatase) buffer, 6 µl of H2O and 1µl of
SAP. The reaction was incubated for one hour at 37 °C, and then the enzyme was deactivated
by incubation for 20 min at 68 °C. The plasmid DNA was purified by agarose gel extraction
(5.9.8).
5.9.13 Ligation with T4 ligase
A vector and DNA-fragment with compatible cohesive termini were ligated in a 10 µl
reaction mixture containing DNA (molar ratio vector / DNA-fragment, 1:2), 1 µl 10x ligation
Buffer and 1 µl T4 DNA ligase. The mixture was incubated on room temperature for 4 h or
overnight.
19
Materials and Methods
5.9.14 Production of chemically competent E. coli cells
Bacteria were cultivated overnight at 37 °C, 180 rpm in liquid LB medium. 20 µl of the
bacterial suspension were used to inoculate 10 ml of LB medium. After incubation at 37 °C,
180 rpm for 3.5 h, the bacteria were pelleted by centrifugation for 5 min at 6000 rpm. The
supernatant was discarded and the pellet was gently resuspended with 4 ml of KZB buffer and
kept on ice for 20 min. Centrifugation (6000 rpm, 5 min) the supernatant was discarded and
the pellet resuspended with 600 µl of KZB buffer. 50-100 µl of suspended competent cells
were used for transformation.
5.9.15 Production of electro competent Agrobacterium tumefaciens cells
Bacteria were cultivated overnight at 28 °C, 180 rpm in liquid LB medium. 5 ml of the
bacterial suspension were used to inoculate 500 ml of LB medium. After incubation at 28 °C,
180 rpm for 3.5 h, the bacteria were incubated on ice for 30 min. The bacteria were then
pelleted by centrifugation for 10 min at 4000 rpm. The supernatant was discarded and the
pellet was gently resuspended with 5 ml of water. After resuspension the volume was adjusted
to 500ml and the cells were centrifuged for 20 min at 4000 rpm. The supernatant was
discarded and the cells were resuspended in 5 ml of water. The volume was adjusted to 500
ml and the bacteria were centrifuged for 20 min at 400 rpm. The supernatant was discarded
and the pellet was resuspended in 80 ml of an ice cold 10% glycerol solution. After
centrifugation (4000 rpm, 20 min) the supernatant was discarded and the pellet resuspended
with 500 µl of ice cold 10% glycerol. 50 µl of resuspended competent cells were used for
transformation.
5.9.16 Transformation of chemically competent E. coli cells
The cloned plasmids were transformed in competent E. coli (DH5-alpha, XLBlue, Inv-
alpha). To 100 µl of competent E. coli 4 µl ligation mixture were added and incubated on ice
for 30 min. A heat shock was performed by incubating the mixture at 42 °C for 45 s, then
quickly put on ice. 175 µl of prewarmed SOC solution were added and incubated at 37 °C for
1 h. The mixture was plated on 50 µg/ml antibiotic supplemented LB solid media and
incubated overnight at 37 °C
20
Materials and Methods
5.9.17 Transformation of electro competent Agrobacterium tumefaciens cells
The electro competent cells were thawed on ice and 1 µl of plasmid DNA was added. The
cells were then transferred to a chilled electroproration cuvette, which was placed in the
electroporator. The settings of the apparatus were as follows. Capacitance at 25 µF, charging
voltage at 2.5 kV and resistance at 200-400 ohm. After the application of the electro pulse
450 µl of SOC medium were added. The suspension was transferred to a 2 ml reaction tube
and incubated for 1 h at 28 °C. After incubation, 200 µl of the bacterial culture were plated on
the appropriate antibiotics supplemented solid LB medium.
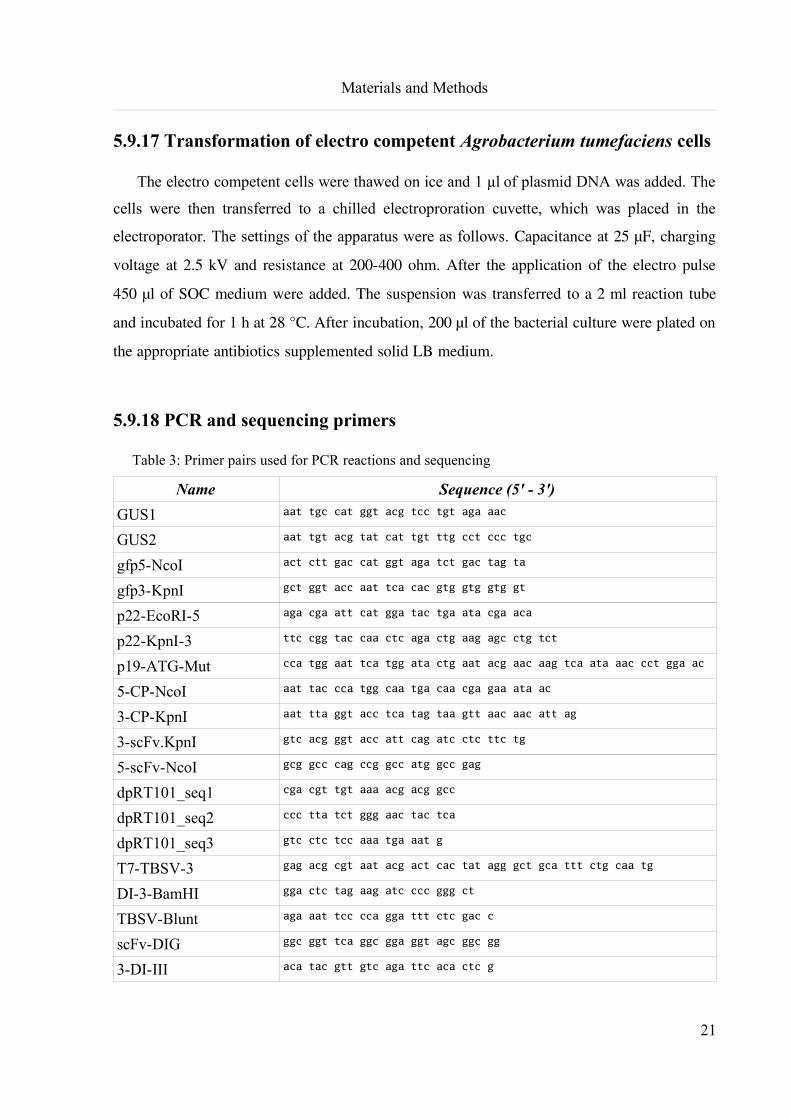
5.9.18 PCR and sequencing primers
Table 3: Primer pairs used for PCR reactions and sequencing
Name Sequence (5' - 3')
GUS1 aat tgc cat ggt acg tcc tgt aga aac
GUS2 aat tgt acg tat cat tgt ttg cct ccc tgc
gfp5-NcoI act ctt gac cat ggt aga tct gac tag ta
gfp3-KpnI gct ggt acc aat tca cac gtg gtg gtg gt
p22-EcoRI-5 aga cga att cat gga tac tga ata cga aca
p22-KpnI-3 ttc cgg tac caa ctc aga ctg aag agc ctg tct
p19-ATG-Mut cca tgg aat tca tgg ata ctg aat acg aac aag tca ata aac cct gga ac
5-CP-NcoI aat tac cca tgg caa tga caa cga gaa ata ac
3-CP-KpnI aat tta ggt acc tca tag taa gtt aac aac att ag
3-scFv.KpnI gtc acg ggt acc att cag atc ctc ttc tg
5-scFv-NcoI gcg gcc cag ccg gcc atg gcc gag
dpRT101_seq1 cga cgt tgt aaa acg acg gcc
dpRT101_seq2 ccc tta tct ggg aac tac tca
dpRT101_seq3 gtc ctc tcc aaa tga aat g
T7-TBSV-3 gag acg cgt aat acg act cac tat agg gct gca ttt ctg caa tg
DI-3-BamHI gga ctc tag aag atc ccc ggg ct
TBSV-Blunt aga aat tcc cca gga ttt ctc gac c
scFv-DIG ggc ggt tca ggc gga ggt agc ggc gg
3-DI-III aca tac gtt gtc aga ttc aca ctc g
21
Materials and Methods
Name Sequence (5' - 3')
5-DI-III gta aga cag gct ctt cag tct g
5-TBSV-T7-MunI cat tat caa ttg taa tac gac tca cta tag gaa att ccc c
FtsH-5 caa atg gca gtt gca ctt gg
FtsH-3 cat cga tga aaa ggc tca tg
5-FtsH-KpnI ttt tat ggt accc caa atg gca gtt gca ctt gg
3-FtsH-EcoRI aaa aaa aga att ctc atc gat gaa aag gct cat
5-p19-Stop cga ttt cga att aag ata atc ccc ttg gtt tct aga aaa gc
IR28 ggg ctg cat ttc tgc aat g
p19-ATG-M-TBSV-F gga tac tga ata cga aca agt caa taa acc ctg gaa cga gct ata caa gg
p19-ATG-M-TBSV-R cct tgt ata gct cgt tcc agg gtt tat tga ctt gtt cgt att cag tat cc
5-p19stop cga ttt cga att aag ata atc ccc ttg gtt tct aga aaa gc
5-gfp-MunI-linker caa ttg agt aaa gga gaa gaa ctt ttc act gga
3-gfpER-KpnI ggt acc tta aag ctc atc atg ttt gta tag ttc atc cat gcc atg
5-gfp5-NcoI2 cca tgg gta tga aga cta atc ttt t
IR28 Marcello gac tct aga gga tcc ccg ggc tgc att tct gca atg
5-TBSV-EcoRI gaa ttc aga aat tcc cca gga ttt ctc g
3-TBSV-SalI gtc gac ggg ctg cattt ctg caa tgt tcc gg
3-Rep-EcoRI ggc aga att caa cct ctt cc
pUC-FW cag cac tga ccc ttt tgg gac cgc
pUC-RV agc gga taa caa ttt cac aca gga
35S-FW cac tat cct tcg caa gac cc
5.9.19 PCR with Taq DNA polymerase
Taq DNA polymerase was only used for control PCR reactions and never for the
amplification of DNA fragments for cloning.
For a total reaction volume of 50 µl, 1 µl of the appropriate 3'-primer, 1 µl of the
appropriate 5'-primer, 1 µl of dNTP solution (10 mM), 2.5µl of DNA (~0.05 µg), 5 µl of 10X
PCR-buffer and 0.5 µl of Taq DNA-polymerase (5U/µl) were added to 39.3 µl of water. The
applied PCR cycler-program is shown in Figure 8.
22
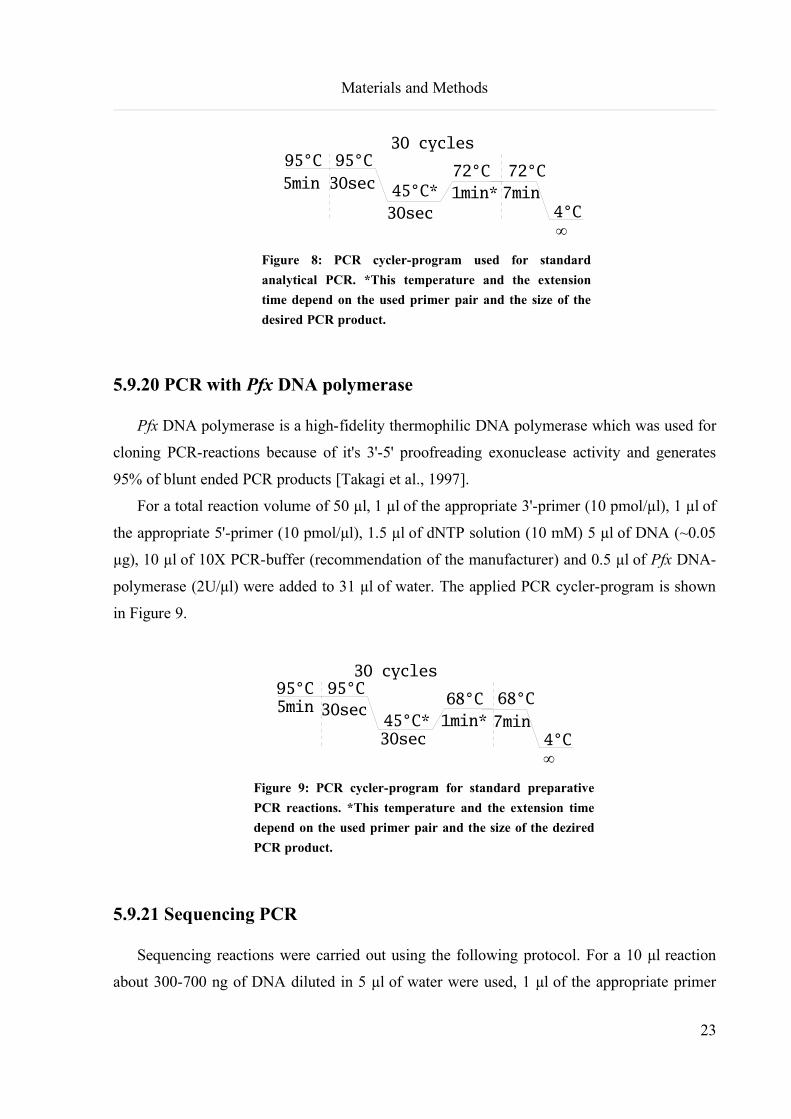
Materials and Methods
Figure 8: PCR cycler-program used for standard
analytical PCR. *This temperature and the extension
time depend on the used primer pair and the size of the
desired PCR product.
5.9.20 PCR with Pfx DNA polymerase
Pfx DNA polymerase is a high-fidelity thermophilic DNA polymerase which was used for
cloning PCR-reactions because of it's 3'-5' proofreading exonuclease activity and generates
95% of blunt ended PCR products [Takagi et al., 1997].
For a total reaction volume of 50 µl, 1 µl of the appropriate 3'-primer (10 pmol/µl), 1 µl of
the appropriate 5'-primer (10 pmol/µl), 1.5 µl of dNTP solution (10 mM) 5 µl of DNA (~0.05
µg), 10 µl of 10X PCR-buffer (recommendation of the manufacturer) and 0.5 µl of Pfx DNA-
polymerase (2U/µl) were added to 31 µl of water. The applied PCR cycler-program is shown
in Figure 9.
Figure 9: PCR cycler-program for standard preparative
PCR reactions. *This temperature and the extension time
depend on the used primer pair and the size of the dezired
PCR product.
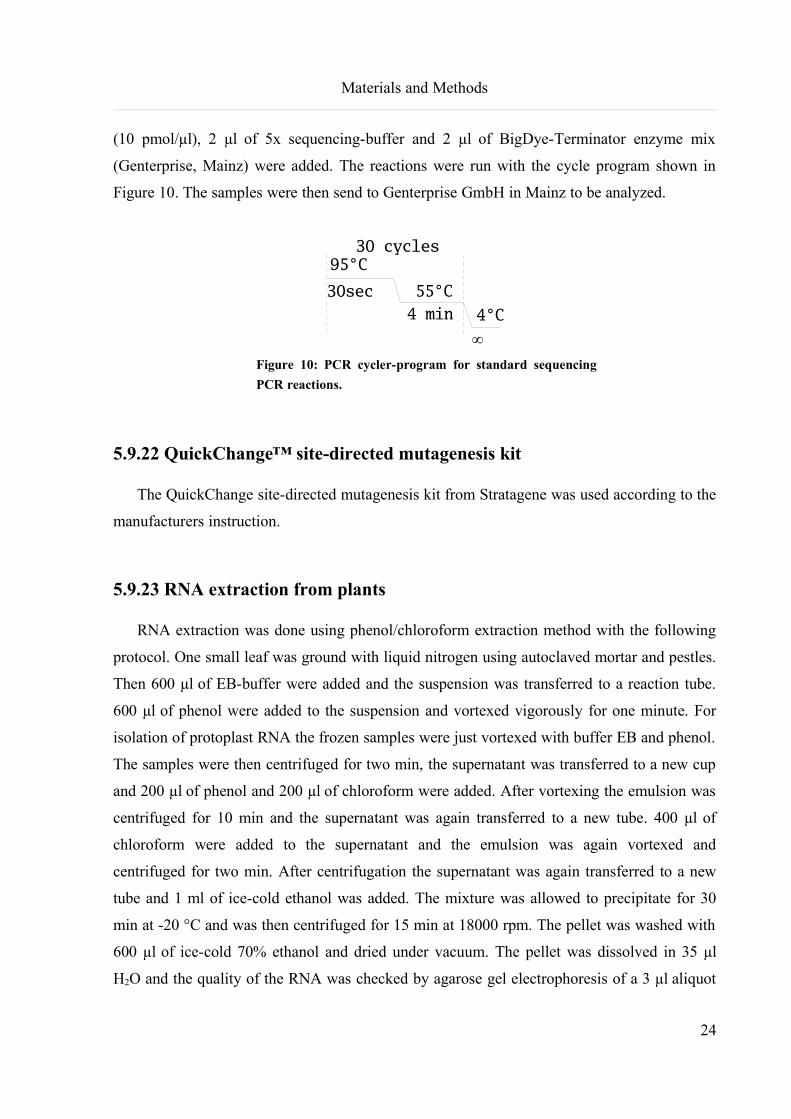
5.9.21 Sequencing PCR
Sequencing reactions were carried out using the following protocol. For a 10 µl reaction
about 300-700 ng of DNA diluted in 5 µl of water were used, 1 µl of the appropriate primer
23
30 cycles
7min72°C
¥
95°C 95°C
45°C*72°C
5min 30sec
30sec1min*
4°C
30 cycles
7min68°C
4°C1min*
30sec
30sec5min 68°C45°C*
95°C95°C
¥
Materials and Methods
(10 pmol/µl), 2 µl of 5x sequencing-buffer and 2 µl of BigDye-Terminator enzyme mix
(Genterprise, Mainz) were added. The reactions were run with the cycle program shown in
Figure 10. The samples were then send to Genterprise GmbH in Mainz to be analyzed.
Figure 10: PCR cycler-program for standard sequencing
PCR reactions.
5.9.22 QuickChange™ site-directed mutagenesis kit
The QuickChange site-directed mutagenesis kit from Stratagene was used according to the
manufacturers instruction.
5.9.23 RNA extraction from plants
RNA extraction was done using phenol/chloroform extraction method with the following
protocol. One small leaf was ground with liquid nitrogen using autoclaved mortar and pestles.
Then 600 µl of EB-buffer were added and the suspension was transferred to a reaction tube.
600 µl of phenol were added to the suspension and vortexed vigorously for one minute. For
isolation of protoplast RNA the frozen samples were just vortexed with buffer EB and phenol.
The samples were then centrifuged for two min, the supernatant was transferred to a new cup
and 200 µl of phenol and 200 µl of chloroform were added. After vortexing the emulsion was
centrifuged for 10 min and the supernatant was again transferred to a new tube. 400 µl of
chloroform were added to the supernatant and the emulsion was again vortexed and
centrifuged for two min. After centrifugation the supernatant was again transferred to a new
tube and 1 ml of ice-cold ethanol was added. The mixture was allowed to precipitate for 30
min at -20 °C and was then centrifuged for 15 min at 18000 rpm. The pellet was washed with
600 µl of ice-cold 70% ethanol and dried under vacuum. The pellet was dissolved in 35 µl
H2O and the quality of the RNA was checked by agarose gel electrophoresis of a 3 µl aliquot
24
30sec
¥4°C4 min
55°C
30 cycles95°C
Materials and Methods
of each extraction. Concentration of the RNA was determined by UV-spectrometry.
10X EB-buffer
7.7g Glycine
5.8g NaCl
20ml EDTA 0.5M (pH8)
2g SDS
1g N-Lauryl sarcosine
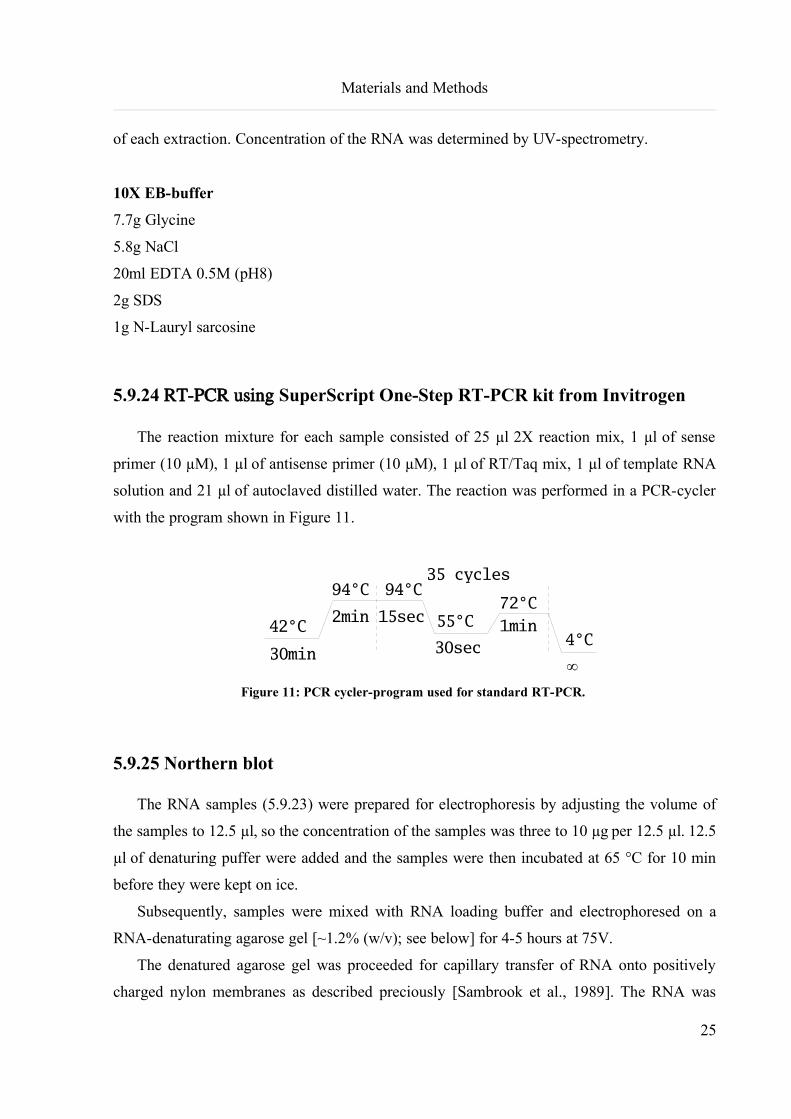
5.9.24 RT-PCR using SuperScript One-Step RT-PCR kit from Invitrogen
The reaction mixture for each sample consisted of 25 µl 2X reaction mix, 1 µl of sense
primer (10 µM), 1 µl of antisense primer (10 µM), 1 µl of RT/Taq mix, 1 µl of template RNA
solution and 21 µl of autoclaved distilled water. The reaction was performed in a PCR-cycler
with the program shown in Figure 11.
Figure 11: PCR cycler-program used for standard RT-PCR.
5.9.25 Northern blot
The RNA samples (5.9.23) were prepared for electrophoresis by adjusting the volume of
the samples to 12.5 µl, so the concentration of the samples was three to 10 µg per 12.5 µl. 12.5
µl of denaturing puffer were added and the samples were then incubated at 65 °C for 10 min
before they were kept on ice.
Subsequently, samples were mixed with RNA loading buffer and electrophoresed on a
RNA-denaturating agarose gel [~1.2% (w/v); see below] for 4-5 hours at 75V.
The denatured agarose gel was proceeded for capillary transfer of RNA onto positively
charged nylon membranes as described preciously [Sambrook et al., 1989]. The RNA was
25
72°C
¥
42°C
94°C
55°C 1min
35 cycles
4°C30sec
15sec
30min
2min
94°C
Materials and Methods
immobilized on the membrane by incubation at 80 °C for 2 h. The membrane was proceeded
for pre-hybridization with DIG Easy Hyp buffer (Roche Diagnostics) at 68 °C for 1 h and
hybridized in a hybridization oven (Amersham) at 50 °C for 12-16 h. The RNA immobilized
on the membrane was hybridized to a DIG labeled DNA probe made according to
manufacturers instructions (DIG PCR labeling Kit, Roche Diagnostics) or to a DIG labeled
DNA primer ordered from MWG Biotech. After hybridization the blot was washed twice for
5 min with 2 x SSC/0.1% SDS at 68 °C. Then again twice for 5 min with 0.1xSSC/0.1% SDS
at 68 °C. Further development of the blot was done to the manufacturers instructions
(Chemiluminescence DIG Detection Kit, Roche Diagnostics). The X-ray films were exposed
for 1 to 10 min depending on signal intensity.
10x MOPS
400 mM MOPS (pH 7.0)
100 mM NaAc
10 mM EDTA
Denaturing puffer
500 µl deionized formamide
120 µl deionized formaldehyde
200 µl 10x MOPS
120 µl H2O
1 µl EtBr
RNA-Loading buffer
30%Ficoll
10 mM EDTA (pH 8,0)
0.25% bromophenole blue
0.25% xylencyanol
RNA-Denaturating gel
100 ml H2O
11.5ml MOPS(10x)
1.38g agarose
after boiling the solution was cooled to 60 °C
and 3.45ml formaldehyde were added.
20x SSC
175.3 g NaCl
88.2 g Na-Citrate
ad. 1000ml
pH 7.2
10xSSC, 5xSSC, 2xSSC/0,1 % SDS and 0.1x
SSC/0.1% SDS were made from 20xSSC
Maleat buffer
11.6 g maleic acid
8.76 g NaCl
pH 7.5
Developing buffer
12.11 g Tris-HCl
5.84 g NaCl
pH 9.5
26
Materials and Methods
5.9.26 In vitro transcription of RNA
About 2 µg of the appropriate plasmid were digested (2 h at 30 °C, 20 µl total reaction
volume) with 20 U of the restriction enzyme SmaI to linearize the DNA. Gel electrophoresis
was done to check if digestion was complete. Alternatively to obtain (-) strand RNA a PCR
was done using the TBSV-Blunt/T7-TBSV-3 primer pair. This introduces a T7 promoter at
the 3' end of the DI sequences. To purify the DNA, 20 µl phenol and 20 µl chloroform were
added to the reaction mixture, vortexed and centrifuged for 2 min at 13000 rpm. The
supernatant was transferred to a new reaction tube, 40 µl of chloroform were added, this
mixture was vortexed and centrifuged for 2 min at 13000 rpm. The supernatant was
transferred and the DNA was precipitated by adding 4 µl of a 2 M NaCl solution and 88 µl of
ice-cold ethanol. The reaction was then centrifuged for 10 min at 18000 rpm, the obtained
pellet was washed by adding 200 µl of 70% ethanol and another centrifugation step (2 min at
13000 rpm). The DNA was dissolved in 80 µl of H2O, 10 µl of RNA NTP's (2.5 µM of each
NTP), 10 µl of 10X T7 RNA polymerase buffer, 1 µl of RNase inhibitor (RNA Guard,
Invitrogen) and 2 µl of T7 RNA polymerase were added to the solution. The reaction mixture
was incubated for a minimum of 3 h at 37 °C. To check if RNA is present in the reaction
mixture gel electrophoresis was performed with 2 µl of the mixture. For transfection of
protoplasts the reaction was treated with DNase to remove the plasmid-DNA. To 100 µl of
transcription reaction 5 µl of DNase were added and incubated at 37 °C for 1 h. After
incubation the RNA was purified by phenol/chloroform as described in section 5.9.10.
5.10 Protein analysis
5.10.1 Histochemical GUS staining
For the histochemical detection of β-D-glucuronidase (GUS) expression in plants leaves
were covered in an appropriate volume of GUS staining solution and incubated for at least 3 h
at 37 °C or overnight. After incubation the leaves were destained (removal of chlorophyll) in
70% EtOH. The staining patterns were documented using a standard computer scanner.
X-GlcA stock solution
50mg/ml X-GlcA in DMF
K3[Fe(CN)6] stock solution
100mM K3[Fe(CN)6]
27
Materials and Methods
K4[Fe(CN)6] stock solution
100mM K4[Fe(CN)6]
GUS staining solution
50mM Sodium phosphate buffer pH 7
0.025% Triton X 100
0.5 mM K4[Fe(CN)6]
0.6mM K3[Fe(CN)6]
500 µg/ml X-GlcA
5.10.2 Sample preparation for SDS-PAGE
For the use in SDS-PAGE (5.10.3) plant leaves together with 200 µl of SDS-PAGE
sample buffer were ground with mortar and pestles. The samples were then incubated at 100
°C for 10 min after which they were centrifuged for 10 min. The supernatant was transferred
and used for SDS-PAGE.
5.10.3 SDS-PAGE
For the experiments the Biorad mini-protein III dual slab gel was used. For a total volume
of 12.5 ml (sufficient for 2 gels) of 12.5% running gel, 5.2 ml of 30%/0.8%
acrylamide/bisacrylamide (Roth), 3.1 ml distilled water, 0.125 ml (10%) SDS solution, 4.2 ml
1.5 M Tris-HCl (pH 8.8), 16 µl TEMED (N,N,N,N,tetramethylethylenediamine) and 125 µl of
10% APS as reaction starter were mixed. The mixture was then poured between the glass
plates of the gels. Then it was overlaid with 1-2 ml water saturated butanol. After
polymerization of the gel, the overlay was removed and the surface of the gel was cleaned
with running buffer. The 5% collecting gel, which was composed of 0.67 ml 30%/0.8%
acrylamide/bisacrylamide, 3.63 ml water, 0.1 ml SDS (10%), 0.67 ml 1M Tris-HCl (pH 6.8),
200 µl 10% APS and 12 µl TEMED, was poured and then the combs were placed.
Electrophoresis was carried out in Laemmli [Laemmli, 1970] buffer system. After filling the
upper and lower reservoir with running buffer, the combs were removed and protein samples
(25 µl per well) were applied to the slots using a Hamilton syringe. For protein stacking the
gel was run at 90 volt and for the protein separation the gel was run at 175 Volt.
28
Materials and Methods
10X Protein electrophoresis buffer
144g Glycine
30g Tris-Base
100 ml 10% SDS-solution
ad. 1000 ml ddH2O
pH 8.8
4X Tris-HCl / SDS buffer
6.5 g Tris-Base
ad. 100 ml ddH2O
adjust pH to 6.8
add 400 mg of SDS
Protein sample buffer
7 ml 4X Tris-HCl / SDS buffer
3 ml Glycerol
1 g SDS
0.93 g DTT
1.2 mg Bromophenol blue
ad. 10 ml ddH2O
10% Ammonium persulfate (APS)
0.2 g APS
ddH2O to 2 ml
store at -20 °C
10% SDS (sodium dodecyl sulfate)
10 g SDS
ddH2O to 100 ml
5.10.4 Coomassie staining
The gels were stained for 30 min by shaking in the staining solution and were destined
for 2 h with destaining solution. Staining solution was composed of 2 g Coomassie-Brilliant-
Blue R250 , 450 ml methanol, 50 ml acetic acid and 500 ml of H2O. Any undissolved
particles were filtered off before use. Destaining solution was prepared using 300 ml of
methanol, 100 ml of acetic acid and 600 ml of H2O.
5.10.5 Western blot
All fiber pads, filter papers, and the transfer membrane were soaked in transfer buffer
previous to the assembly of the transfer cassette. It was made sure that no bubbles were
trapped in the filters or fiber pads. (PVDF membranes were prewetted in methanol before
they were soaked in transfer buffer.). The transfer cassette was assembled according to the
manufacturer's instructions.
The transfer was run at 175 mA for 45 min [Kyhse-Andersen, 1984] in a semi-dry blot
29
Materials and Methods
apparatus from Biorad or at 30 V, or over night in an tankblotting apparatus from the same
company.
After the transfer, the membrane was placed in blocking solution on a rocker platform for
at least 60 min at RT or over night at 4 °C. The membrane was incubated with primary
antibody diluted (1:1000) in blocking solution on a rocker plate 1 h at RT. The membrane was
washed twice with TBST and twice with blocking solution each for 10 min. The secondary
antibody POD-conjugate (1:10000 in blocking solution) was incubated with the membrane for
30 min at RT on a rocker plate. The membrane was washed 4 times with TBST for 10 min
each. Substrate solution was added and allowed to react for 1 min. Membrane was removed
from the substrate and laid between to transparency films. Air bubbles were removed using a
paper towel. Film exposure was done for 1-30 min and development was done according to
manufacturer's instructions.
Transfer buffer for westernblotting
3.03 g Tris-Base
14.4 g Glycine
100 ml Methanol
ad. 1000 ml ddH2O
pH 8.4
TBS buffer pH 7.4
50 mM Tris-HCl
200 mM NaCl
TBST buffer pH 7.4
50 mM Tris-HCl
200 mM NaCl
0.1% Tween 20
5.10.6 ELISA (enzyme linked immuno sorbent assay)
ELISA was performed using 96 well Nunc Maxisorb ELISA microtiter plates. The plates
were coated with the first antibody by incubating each well with 200 µl of first antibody
solution (1:200 in coating buffer) for 4 h at 37 °C. After 4 washing steps the samples were
applied to each well (200 µl) and incubated over night at 4 °C.
After another 5 washing steps and the addition of 200 µl per well of secondary antibody
(coat protein-antibody-AP-conjugate) solution (1:200 in sample buffer) the plates were
incubated at 37 °C for 4 h. Enzymatic assay was performed after 5 washing steps and addition
30
Materials and Methods
of 200 µl of substrate solution per well. Detection of the results was done after 1-2 h
incubation with an ELISA reader (Anthos Reader, Anthos Microsystems).
ELISA Coating buffer
1.59 g Na2CO3
2.93 g NaHCO3
ddH2O to 1000ml pH 9.6
ELISA Sample buffer
8 g NaCl
2.9 g Na2HPO4 x 12H2O
0.2 g KH2PO4
0.2g KCl
0.5 ml Tween 20
add ddH2O to 1 L pH 7.4
ELISA Conjugate buffer
20 g polyvinyl pyrrolidone
2 g BSA
0.1 g NaN3
add ddH2O to 1 L pH 7.4
ELISA Substrate buffer
97 ml diethanolamine
0.2 g MgCl2 x 6 H2O
add ddH2O to 1 l, pH 9.8
ELISA Substrate solution
1mg/ml 4-nitrophenyl phosphate di-Na-salt in
substrate buffer
Prepare immediately prior to use.
5.11 Inoculation of Nicotiana benthamiana with RNA transcripts
For the inoculation of 10 N. benthamiana plants with RNA transcripts about 40 µl of each
transcription reaction were used. Inoculation buffer was added up to a volume of 600 µl. 20 µl
of this solution were applied to each leaf (three leaves per plant) and were spread with
autoclaved glass spatulas.
Inoculation buffer
522 mg K2HPO4
375 mg Glycerol
1 g Bentonit
1 g Cenit
adjust pH to 9.2 with KOH
31
Materials and Methods
5.12 Agrobacterium infiltration
Agrobacterium infiltration was essentially done as described by Kapila and coworkers
[Kapila et al., 1997]. The Agrobacteria strain transformed with the desired plant
transformation vector was grown in 20 ml of YEB media (pH 5.6) containing the appropriate
antibiotics (300 µg/ml spectinomycin, 300 µg/ml streptinomycin an 15 µg/ml rifampicine) and
10 µM acetosyringone at 28 °C over night to an OD600 of maximum 1.0. The bacteria were
then pelleted and resuspended in induction media at OD 600 of 0.8. After incubation for 2
hours at room temperature the bacterial suspension was applied to the plants using a needle-
less syringe.
YEB media pH 5.6
5 g Beef extract
1 g Yeast extract
5 g Sucrose
25 ml 0.4 M MES pH 5.6
add ddH2O to 1 L pH 5.6
Induction media
1 ml 1M MgCl
2.5 ml 0.4 M MES pH 5.6
20 µl 0.5 M Acetosyringone
add ddH2O to 100 ml pH 5.6
5.13 Fluorescence microscopy and photography of GFP
GFP expression was monitored with a hand-held UV light or under a Leica MZ12
microscope with GFP Plus fluorescence unit. Photos were taken with Nikon Coolpix digital
camera and a yellow optical filter.
5.14 ClustalX alignments
For multiple alignments the ClustalX program [Thompson et al., 1997] was used with the
following alignment parameters. A gap opening penalty of 10, a gap extension penalty of 0.2
and a DNA transition weight of 0.5. The DNA weight matrix was IUB.
32
Materials and Methods
5.15 Protoplast isolation and transfection
The transfection was done as described preciously [Sheen, 2001] with some
modifications. The leaves were cut from the plants and put in a petri dish. They were washed
with MgMan solution and cut into 0.5-1 mm leaf strips with a fresh razor blade without
excessive wounding. For about 10 g of leaves 50 ml of enzyme solution were used. The leaf
strips were transferred to a petri dish together with the enzyme solution and covered with a
filter pad to ensure that the strips are submerged in the enzyme solution during vacuum
infiltration. A vacuum was applied for 10 min and then released rapidly. The digestion was
continued for another three hours in the dark, without shaking. After incubation the enzyme
solution turned green indicating the release of protoplasts. Protoplasts were released by
shaking at 80 rpm for 1 min. To float the protoplasts, they were centrifuged at 80 g in a round-
bottomed tube for 10 min. The floating protoplasts were collected with a Pasteur pipette, then
washed and resuspended in W5 solution (2x10 ml). About 5-7x10⁵ protoplasts were pelleted
for each transfection.
For PEG transfection all steps were carried out at room temperature. To the protoplast
pellet 40 µl of purified and DNA free RNA transcripts were added (as positive control 20 µg
of pCat-gfp [Reichel et al., 1996] was adopted). Then 200 µl of a 10% mannitol solution were
added, gently mixed for 15 s 300µl 40% PEG solution were added to the reaction and gently
mixed for 15 s. Next, two times 600 µl of 10% mannitol were added and mixed gently. The
mixture was incubated for 15 min on ice. After incubation the protoplasts were pelleted by
centrifugation at 70 x g for 6 min. The supernatant was removed and the protoplasts were
resuspended in 2 ml MS 0.4. After incubation at 25° C for 24 h (16 h light/8h dark) the
protoplasts were harvested by centrifugation at 100 x g, frozen in liquid nitrogen and stored at
-80 °C for analysis.
Enzyme solution
1-1.5 % cellulase R10
0.2-0.4 % macerozyme R10 (Yakult Honsha,
Tokyo, Japan)
14 % sucrose
10 mM CaCl2
20 mM KCl
20 mM MES, pH 5.7
0.1 % BSA (Sigma A-6793)
The enzyme solution is light brown but clear
(passed through a 0.22 µm filter).
PEG solution (40 %, v/v)
40 g PEG4000 (Fluka, #81240)
33
Materials and Methods
3 mM CaCl2
4 mM MES
ad 100ml
W5 solution
154 mM NaCl
125 mM CaCl2
5 mM KCl
4 mM MES (pH 5.7)
MgMan solution
10 % mannitol
15 mM MgCl2
4 mM MES (pH 5.7)
MS 0.4
2.2 g MS salts incl. vitamins
0,4 M sucrose
(pH 5.7)
34
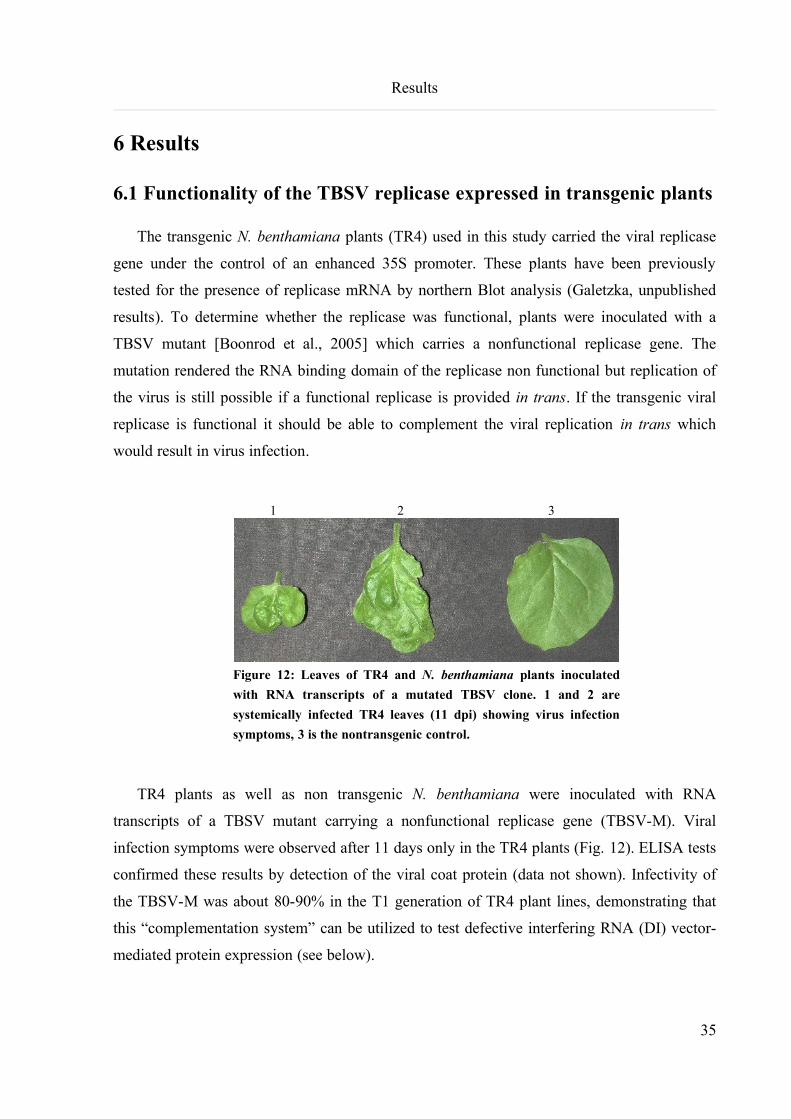
Results
6 Results
6.1 Functionality of the TBSV replicase expressed in transgenic plants
The transgenic N. benthamiana plants (TR4) used in this study carried the viral replicase
gene under the control of an enhanced 35S promoter. These plants have been previously
tested for the presence of replicase mRNA by northern Blot analysis (Galetzka, unpublished
results). To determine whether the replicase was functional, plants were inoculated with a
TBSV mutant [Boonrod et al., 2005] which carries a nonfunctional replicase gene. The
mutation rendered the RNA binding domain of the replicase non functional but replication of
the virus is still possible if a functional replicase is provided in trans. If the transgenic viral
replicase is functional it should be able to complement the viral replication in trans which
would result in virus infection.
1 2 3
Figure 12: Leaves of TR4 and N. benthamiana plants inoculated
with RNA transcripts of a mutated TBSV clone. 1 and 2 are
systemically infected TR4 leaves (11 dpi) showing virus infection
symptoms, 3 is the nontransgenic control.
TR4 plants as well as non transgenic N. benthamiana were inoculated with RNA
transcripts of a TBSV mutant carrying a nonfunctional replicase gene (TBSV-M). Viral
infection symptoms were observed after 11 days only in the TR4 plants (Fig. 12). ELISA tests
confirmed these results by detection of the viral coat protein (data not shown). Infectivity of
the TBSV-M was about 80-90% in the T1 generation of TR4 plant lines, demonstrating that
this “complementation system” can be utilized to test defective interfering RNA (DI) vector-
mediated protein expression (see below).
35
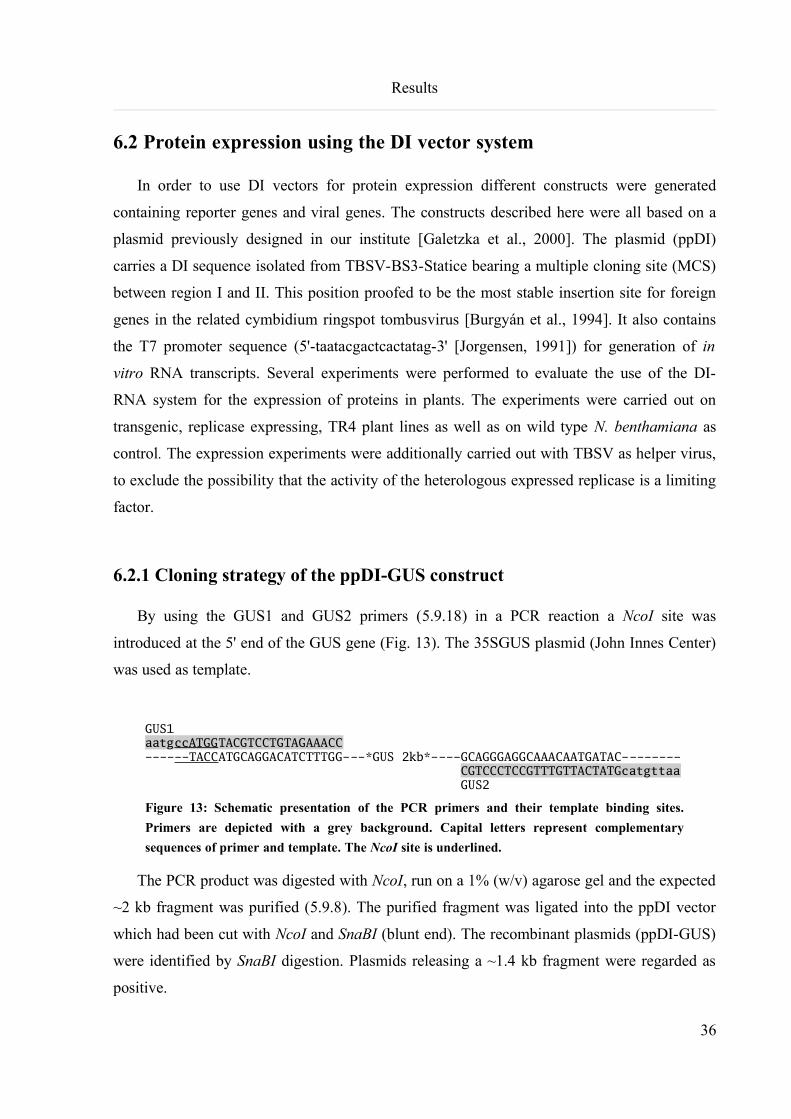
Results
6.2 Protein expression using the DI vector system
In order to use DI vectors for protein expression different constructs were generated
containing reporter genes and viral genes. The constructs described here were all based on a
plasmid previously designed in our institute [Galetzka et al., 2000]. The plasmid (ppDI)
carries a DI sequence isolated from TBSV-BS3-Statice bearing a multiple cloning site (MCS)
between region I and II. This position proofed to be the most stable insertion site for foreign
genes in the related cymbidium ringspot tombusvirus [Burgyán et al., 1994]. It also contains
the T7 promoter sequence (5'-taatacgactcactatag-3' [Jorgensen, 1991]) for generation of in
vitro RNA transcripts. Several experiments were performed to evaluate the use of the DI-
RNA system for the expression of proteins in plants. The experiments were carried out on
transgenic, replicase expressing, TR4 plant lines as well as on wild type N. benthamiana as
control. The expression experiments were additionally carried out with TBSV as helper virus,
to exclude the possibility that the activity of the heterologous expressed replicase is a limiting
factor.
6.2.1 Cloning strategy of the ppDI-GUS construct
By using the GUS1 and GUS2 primers (5.9.18) in a PCR reaction a NcoI site was
introduced at the 5' end of the GUS gene (Fig. 13). The 35SGUS plasmid (John Innes Center)
was used as template.
GUS1aatgccATGGTACGTCCTGTAGAAACC------TACCATGCAGGACATCTTTGG---*GUS 2kb*----GCAGGGAGGCAAACAATGATAC-------- CGTCCCTCCGTTTGTTACTATGcatgttaa GUS2
Figure 13: Schematic presentation of the PCR primers and their template binding sites.
Primers are depicted with a grey background. Capital letters represent complementary
sequences of primer and template. The NcoI site is underlined.
The PCR product was digested with NcoI, run on a 1% (w/v) agarose gel and the expected
~2 kb fragment was purified (5.9.8). The purified fragment was ligated into the ppDI vector
which had been cut with NcoI and SnaBI (blunt end). The recombinant plasmids (ppDI-GUS)
were identified by SnaBI digestion. Plasmids releasing a ~1.4 kb fragment were regarded as
positive.
36
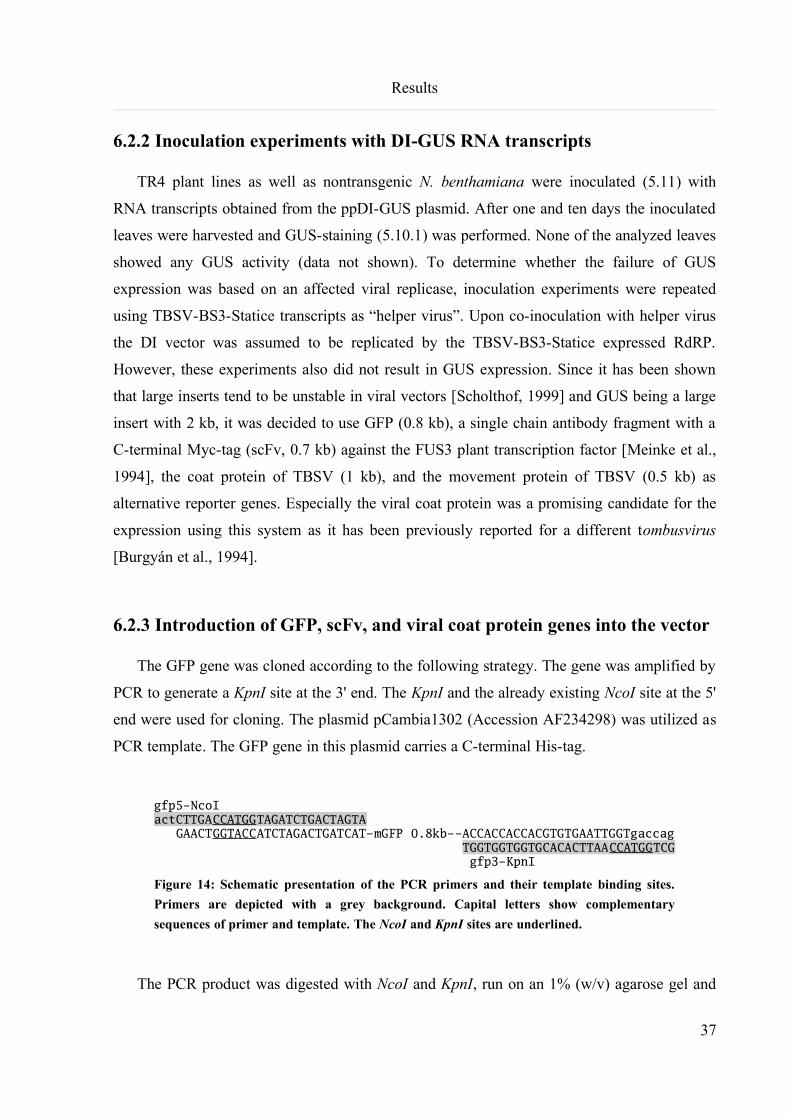
Results
6.2.2 Inoculation experiments with DI-GUS RNA transcripts
TR4 plant lines as well as nontransgenic N. benthamiana were inoculated (5.11) with
RNA transcripts obtained from the ppDI-GUS plasmid. After one and ten days the inoculated
leaves were harvested and GUS-staining (5.10.1) was performed. None of the analyzed leaves
showed any GUS activity (data not shown). To determine whether the failure of GUS
expression was based on an affected viral replicase, inoculation experiments were repeated
using TBSV-BS3-Statice transcripts as “helper virus”. Upon co-inoculation with helper virus
the DI vector was assumed to be replicated by the TBSV-BS3-Statice expressed RdRP.
However, these experiments also did not result in GUS expression. Since it has been shown
that large inserts tend to be unstable in viral vectors [Scholthof, 1999] and GUS being a large
insert with 2 kb, it was decided to use GFP (0.8 kb), a single chain antibody fragment with a
C-terminal Myc-tag (scFv, 0.7 kb) against the FUS3 plant transcription factor [Meinke et al.,
1994], the coat protein of TBSV (1 kb), and the movement protein of TBSV (0.5 kb) as
alternative reporter genes. Especially the viral coat protein was a promising candidate for the
expression using this system as it has been previously reported for a different tombusvirus
[Burgyán et al., 1994].
6.2.3 Introduction of GFP, scFv, and viral coat protein genes into the vector
The GFP gene was cloned according to the following strategy. The gene was amplified by
PCR to generate a KpnI site at the 3' end. The KpnI and the already existing NcoI site at the 5'
end were used for cloning. The plasmid pCambia1302 (Accession AF234298) was utilized as
PCR template. The GFP gene in this plasmid carries a C-terminal His-tag.
gfp5-NcoIactCTTGACCATGGTAGATCTGACTAGTA GAACTGGTACCATCTAGACTGATCAT-mGFP 0.8kb--ACCACCACCACGTGTGAATTGGTgaccag TGGTGGTGGTGCACACTTAACCATGGTCG gfp3-KpnI
Figure 14: Schematic presentation of the PCR primers and their template binding sites.
Primers are depicted with a grey background. Capital letters show complementary
sequences of primer and template. The NcoI and KpnI sites are underlined.
The PCR product was digested with NcoI and KpnI, run on an 1% (w/v) agarose gel and
37
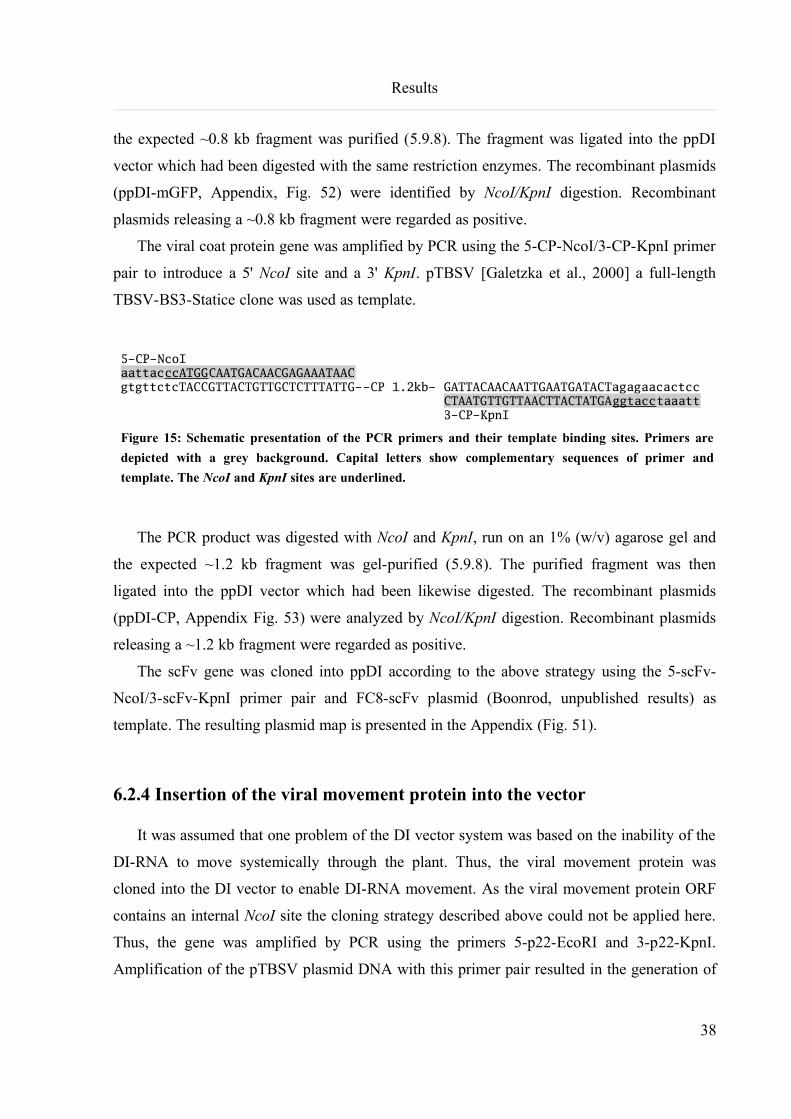
Results
the expected ~0.8 kb fragment was purified (5.9.8). The fragment was ligated into the ppDI
vector which had been digested with the same restriction enzymes. The recombinant plasmids
(ppDI-mGFP, Appendix, Fig. 52) were identified by NcoI/KpnI digestion. Recombinant
plasmids releasing a ~0.8 kb fragment were regarded as positive.
The viral coat protein gene was amplified by PCR using the 5-CP-NcoI/3-CP-KpnI primer
pair to introduce a 5' NcoI site and a 3' KpnI. pTBSV [Galetzka et al., 2000] a full-length
TBSV-BS3-Statice clone was used as template.
5-CP-NcoIaattacccATGGCAATGACAACGAGAAATAACgtgttctcTACCGTTACTGTTGCTCTTTATTG--CP 1.2kb- GATTACAACAATTGAATGATACTagagaacactcc CTAATGTTGTTAACTTACTATGAggtacctaaatt 3-CP-KpnI
Figure 15: Schematic presentation of the PCR primers and their template binding sites. Primers are
depicted with a grey background. Capital letters show complementary sequences of primer and
template. The NcoI and KpnI sites are underlined.
The PCR product was digested with NcoI and KpnI, run on an 1% (w/v) agarose gel and
the expected ~1.2 kb fragment was gel-purified (5.9.8). The purified fragment was then
ligated into the ppDI vector which had been likewise digested. The recombinant plasmids
(ppDI-CP, Appendix Fig. 53) were analyzed by NcoI/KpnI digestion. Recombinant plasmids
releasing a ~1.2 kb fragment were regarded as positive.
The scFv gene was cloned into ppDI according to the above strategy using the 5-scFv-
NcoI/3-scFv-KpnI primer pair and FC8-scFv plasmid (Boonrod, unpublished results) as
template. The resulting plasmid map is presented in the Appendix (Fig. 51).
6.2.4 Insertion of the viral movement protein into the vector
It was assumed that one problem of the DI vector system was based on the inability of the
DI-RNA to move systemically through the plant. Thus, the viral movement protein was
cloned into the DI vector to enable DI-RNA movement. As the viral movement protein ORF
contains an internal NcoI site the cloning strategy described above could not be applied here.
Thus, the gene was amplified by PCR using the primers 5-p22-EcoRI and 3-p22-KpnI.
Amplification of the pTBSV plasmid DNA with this primer pair resulted in the generation of
38
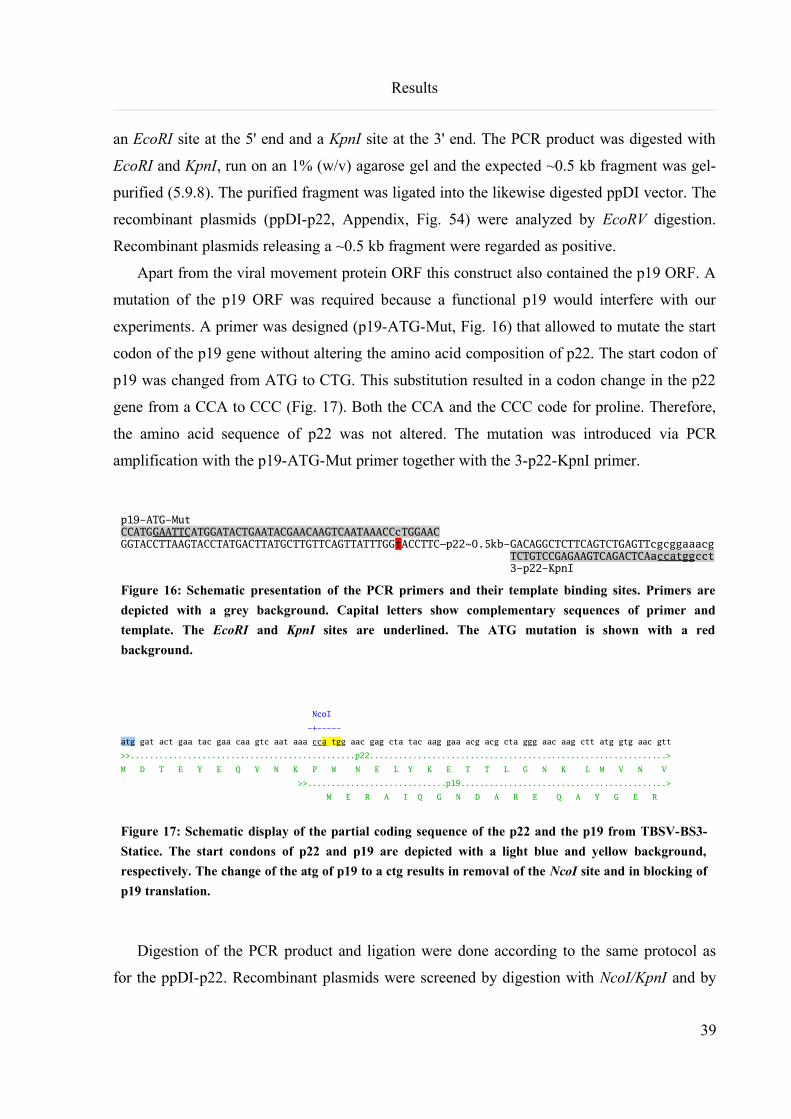
Results
an EcoRI site at the 5' end and a KpnI site at the 3' end. The PCR product was digested with
EcoRI and KpnI, run on an 1% (w/v) agarose gel and the expected ~0.5 kb fragment was gel-
purified (5.9.8). The purified fragment was ligated into the likewise digested ppDI vector. The
recombinant plasmids (ppDI-p22, Appendix, Fig. 54) were analyzed by EcoRV digestion.
Recombinant plasmids releasing a ~0.5 kb fragment were regarded as positive.
Apart from the viral movement protein ORF this construct also contained the p19 ORF. A
mutation of the p19 ORF was required because a functional p19 would interfere with our
experiments. A primer was designed (p19-ATG-Mut, Fig. 16) that allowed to mutate the start
codon of the p19 gene without altering the amino acid composition of p22. The start codon of
p19 was changed from ATG to CTG. This substitution resulted in a codon change in the p22
gene from a CCA to CCC (Fig. 17). Both the CCA and the CCC code for proline. Therefore,
the amino acid sequence of p22 was not altered. The mutation was introduced via PCR
amplification with the p19-ATG-Mut primer together with the 3-p22-KpnI primer.
p19-ATG-MutCCATGGAATTCATGGATACTGAATACGAACAAGTCAATAAACCcTGGAACGGTACCTTAAGTACCTATGACTTATGCTTGTTCAGTTATTTGGtACCTTC—p22~0.5kb-GACAGGCTCTTCAGTCTGAGTTcgcggaaacg TCTGTCCGAGAAGTCAGACTCAaccatggcct 3-p22-KpnI
Figure 16: Schematic presentation of the PCR primers and their template binding sites. Primers are
depicted with a grey background. Capital letters show complementary sequences of primer and
template. The EcoRI and KpnI sites are underlined. The ATG mutation is shown with a red
background.
NcoI
-+-----
atg gat act gaa tac gaa caa gtc aat aaa cc a tgg aac gag cta tac aag gaa acg acg cta ggg aac aag ctt atg gtg aac gtt
>>...............................................p22..............................................................>
M D T E Y E Q V N K P W N E L Y K E T T L G N K L M V N V
>>.............................p19...........................................>
M E R A I Q G N D A R E Q A Y G E R
Figure 17: Schematic display of the partial coding sequence of the p22 and the p19 from TBSV-BS3-
Statice. The start condons of p22 and p19 are depicted with a light blue and yellow background,
respectively. The change of the atg of p19 to a ctg results in removal of the NcoI site and in blocking of
p19 translation.
Digestion of the PCR product and ligation were done according to the same protocol as
for the ppDI-p22. Recombinant plasmids were screened by digestion with NcoI/KpnI and by
39
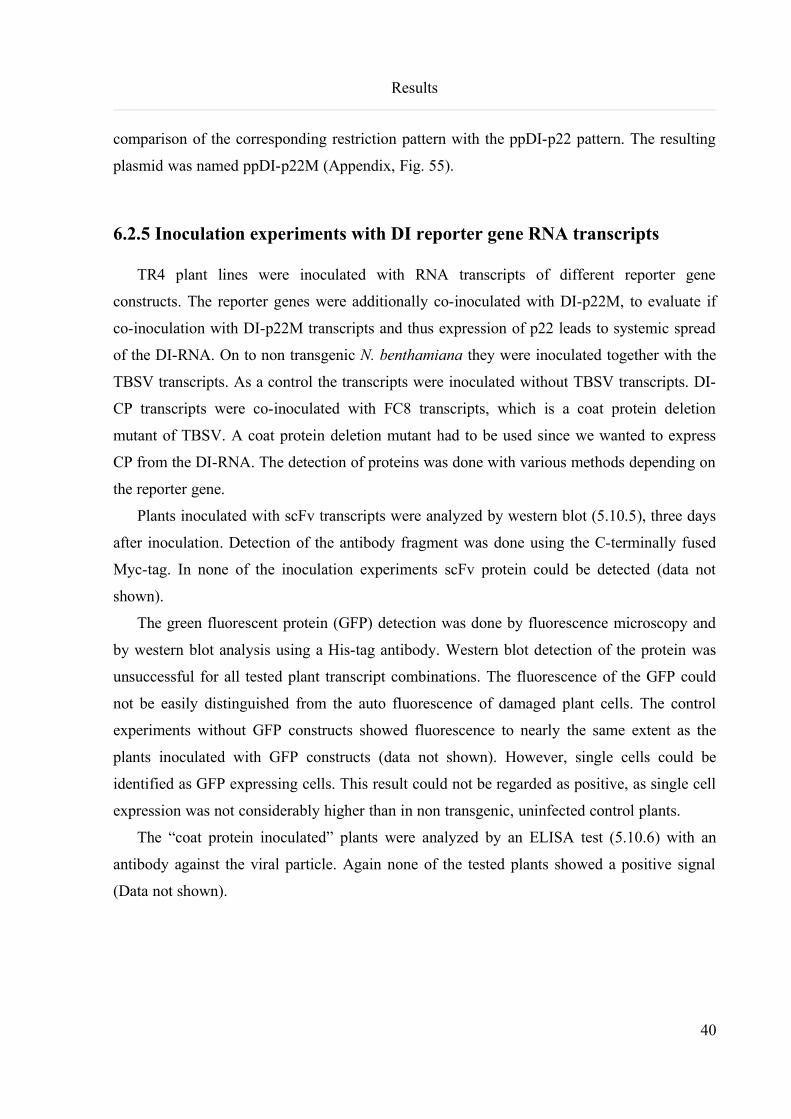
Results
comparison of the corresponding restriction pattern with the ppDI-p22 pattern. The resulting
plasmid was named ppDI-p22M (Appendix, Fig. 55).
6.2.5 Inoculation experiments with DI reporter gene RNA transcripts
TR4 plant lines were inoculated with RNA transcripts of different reporter gene
constructs. The reporter genes were additionally co-inoculated with DI-p22M, to evaluate if
co-inoculation with DI-p22M transcripts and thus expression of p22 leads to systemic spread
of the DI-RNA. On to non transgenic N. benthamiana they were inoculated together with the
TBSV transcripts. As a control the transcripts were inoculated without TBSV transcripts. DI-
CP transcripts were co-inoculated with FC8 transcripts, which is a coat protein deletion
mutant of TBSV. A coat protein deletion mutant had to be used since we wanted to express
CP from the DI-RNA. The detection of proteins was done with various methods depending on
the reporter gene.
Plants inoculated with scFv transcripts were analyzed by western blot (5.10.5), three days
after inoculation. Detection of the antibody fragment was done using the C-terminally fused
Myc-tag. In none of the inoculation experiments scFv protein could be detected (data not
shown).
The green fluorescent protein (GFP) detection was done by fluorescence microscopy and
by western blot analysis using a His-tag antibody. Western blot detection of the protein was
unsuccessful for all tested plant transcript combinations. The fluorescence of the GFP could
not be easily distinguished from the auto fluorescence of damaged plant cells. The control
experiments without GFP constructs showed fluorescence to nearly the same extent as the
plants inoculated with GFP constructs (data not shown). However, single cells could be
identified as GFP expressing cells. This result could not be regarded as positive, as single cell
expression was not considerably higher than in non transgenic, uninfected control plants.
The “coat protein inoculated” plants were analyzed by an ELISA test (5.10.6) with an
antibody against the viral particle. Again none of the tested plants showed a positive signal
(Data not shown).
40
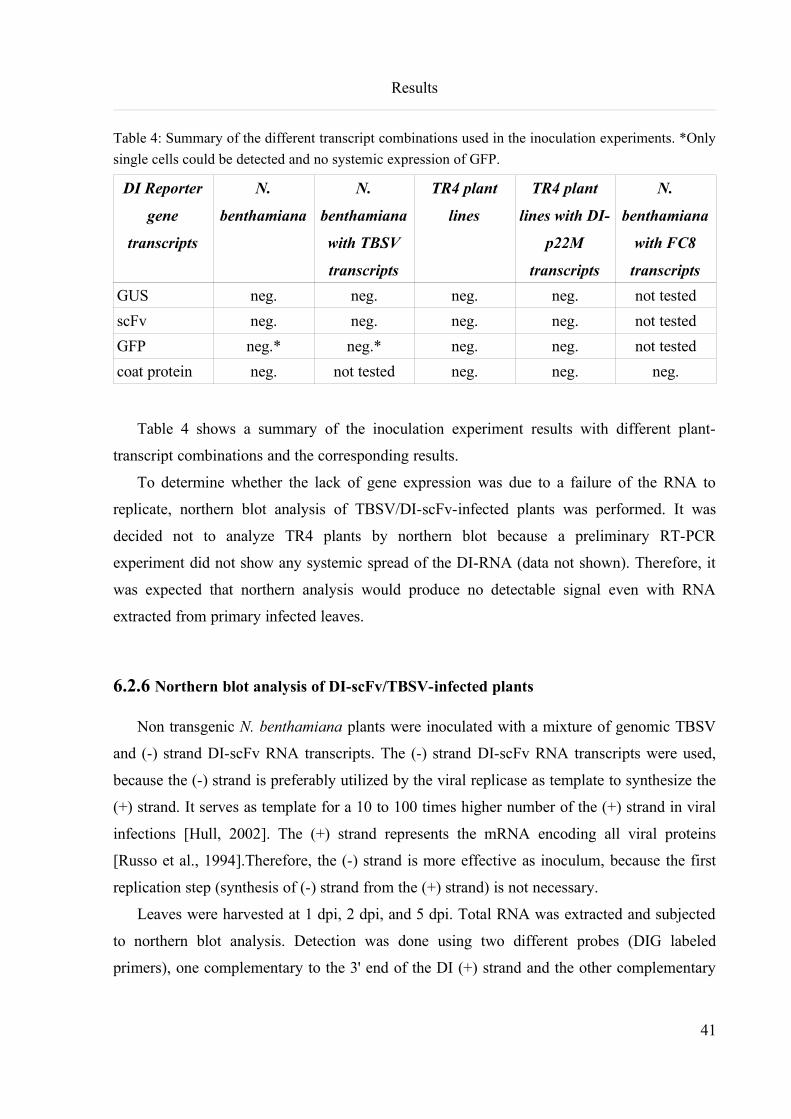
Results
Table 4: Summary of the different transcript combinations used in the inoculation experiments. *Only
single cells could be detected and no systemic expression of GFP.
DI Reporter
gene
transcripts
N.
benthamiana
N.
benthamiana
with TBSV
transcripts
TR4 plant
lines
TR4 plant
lines with DI-
p22M
transcripts
N.
benthamiana
with FC8
transcripts
GUS neg. neg. neg. neg. not tested
scFv neg. neg. neg. neg. not tested
GFP neg.* neg.* neg. neg. not tested
coat protein neg. not tested neg. neg. neg.
Table 4 shows a summary of the inoculation experiment results with different plant-
transcript combinations and the corresponding results.
To determine whether the lack of gene expression was due to a failure of the RNA to
replicate, northern blot analysis of TBSV/DI-scFv-infected plants was performed. It was
decided not to analyze TR4 plants by northern blot because a preliminary RT-PCR
experiment did not show any systemic spread of the DI-RNA (data not shown). Therefore, it
was expected that northern analysis would produce no detectable signal even with RNA
extracted from primary infected leaves.
6.2.6 Northern blot analysis of DI-scFv/TBSV-infected plants
Non transgenic N. benthamiana plants were inoculated with a mixture of genomic TBSV
and (-) strand DI-scFv RNA transcripts. The (-) strand DI-scFv RNA transcripts were used,
because the (-) strand is preferably utilized by the viral replicase as template to synthesize the
(+) strand. It serves as template for a 10 to 100 times higher number of the (+) strand in viral
infections [Hull, 2002]. The (+) strand represents the mRNA encoding all viral proteins
[Russo et al., 1994].Therefore, the (-) strand is more effective as inoculum, because the first
replication step (synthesis of (-) strand from the (+) strand) is not necessary.
Leaves were harvested at 1 dpi, 2 dpi, and 5 dpi. Total RNA was extracted and subjected
to northern blot analysis. Detection was done using two different probes (DIG labeled
primers), one complementary to the 3' end of the DI (+) strand and the other complementary
41
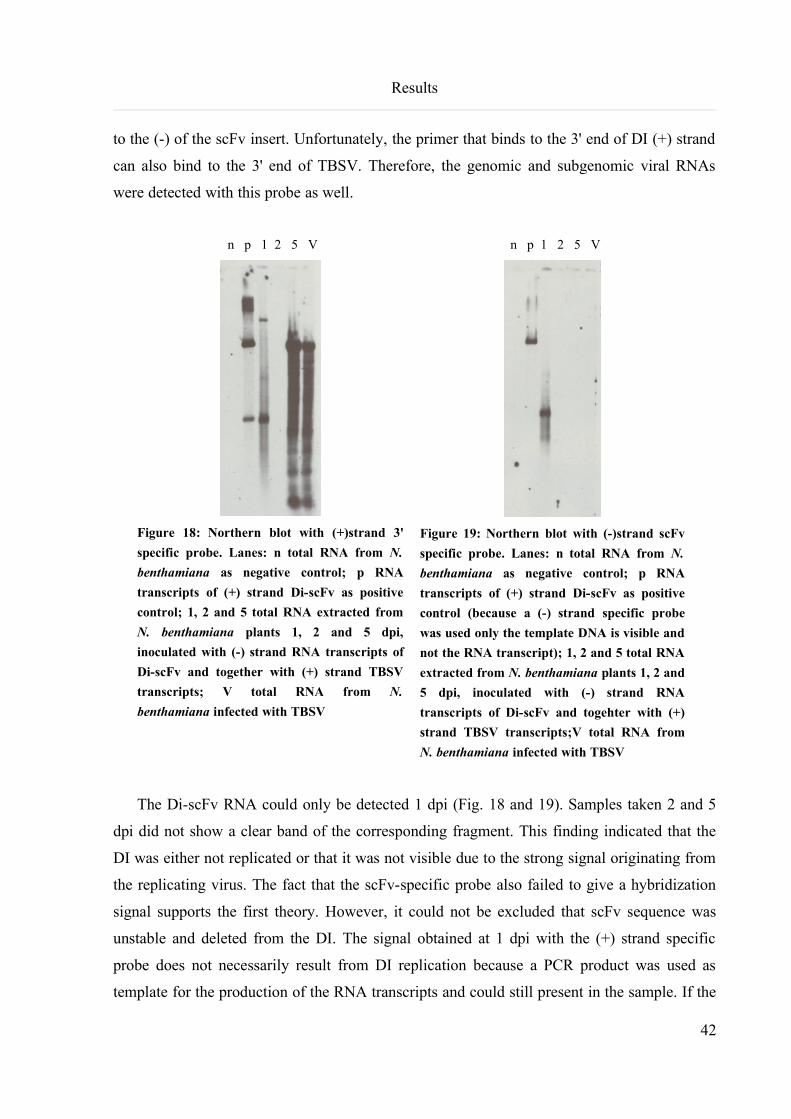
Results
to the (-) of the scFv insert. Unfortunately, the primer that binds to the 3' end of DI (+) strand
can also bind to the 3' end of TBSV. Therefore, the genomic and subgenomic viral RNAs
were detected with this probe as well.
n p 1 2 5 V
Figure 18: Northern blot with (+)strand 3'
specific probe. Lanes: n total RNA from N.
benthamiana as negative control; p RNA
transcripts of (+) strand Di-scFv as positive
control; 1, 2 and 5 total RNA extracted from
N. benthamiana plants 1, 2 and 5 dpi,
inoculated with (-) strand RNA transcripts of
Di-scFv and together with (+) strand TBSV
transcripts; V total RNA from N.
benthamiana infected with TBSV
n p 1 2 5 V
Figure 19: Northern blot with (-)strand scFv
specific probe. Lanes: n total RNA from N.
benthamiana as negative control; p RNA
transcripts of (+) strand Di-scFv as positive
control (because a (-) strand specific probe
was used only the template DNA is visible and
not the RNA transcript); 1, 2 and 5 total RNA
extracted from N. benthamiana plants 1, 2 and
5 dpi, inoculated with (-) strand RNA
transcripts of Di-scFv and togehter with (+)
strand TBSV transcripts;V total RNA from
N. benthamiana infected with TBSV
The Di-scFv RNA could only be detected 1 dpi (Fig. 18 and 19). Samples taken 2 and 5
dpi did not show a clear band of the corresponding fragment. This finding indicated that the
DI was either not replicated or that it was not visible due to the strong signal originating from
the replicating virus. The fact that the scFv-specific probe also failed to give a hybridization
signal supports the first theory. However, it could not be excluded that scFv sequence was
unstable and deleted from the DI. The signal obtained at 1 dpi with the (+) strand specific
probe does not necessarily result from DI replication because a PCR product was used as
template for the production of the RNA transcripts and could still present in the sample. If the
42
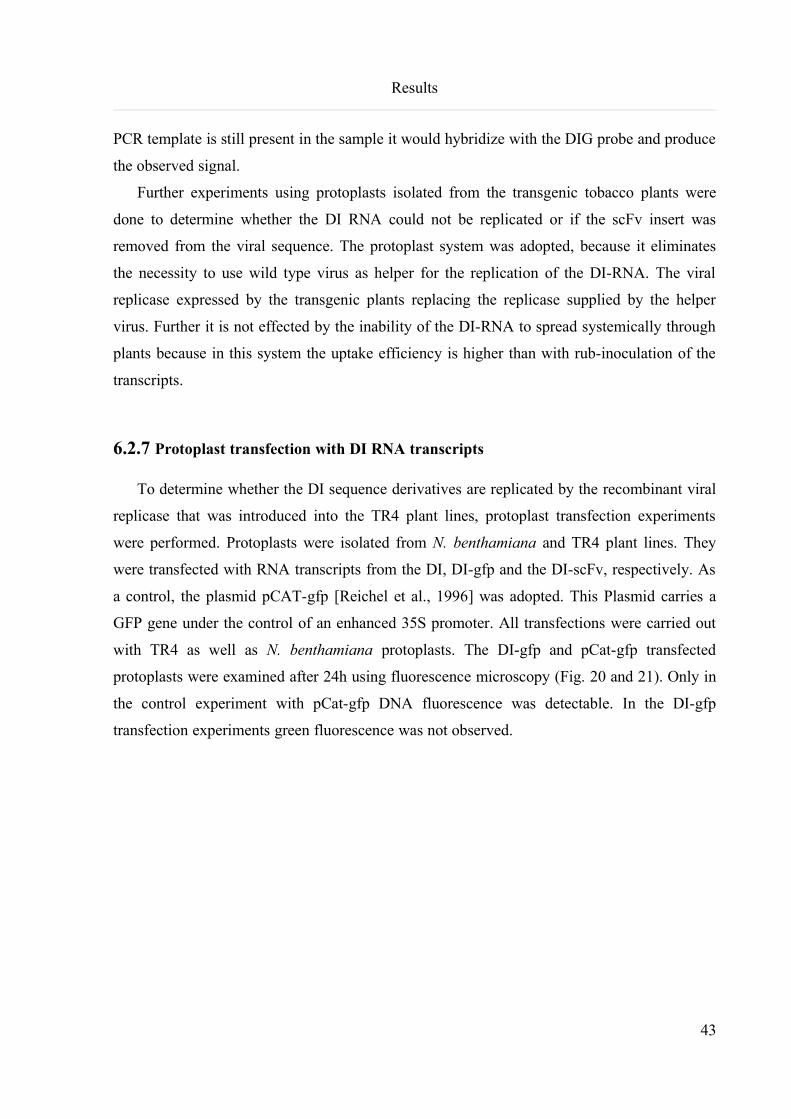
Results
PCR template is still present in the sample it would hybridize with the DIG probe and produce
the observed signal.
Further experiments using protoplasts isolated from the transgenic tobacco plants were
done to determine whether the DI RNA could not be replicated or if the scFv insert was
removed from the viral sequence. The protoplast system was adopted, because it eliminates
the necessity to use wild type virus as helper for the replication of the DI-RNA. The viral
replicase expressed by the transgenic plants replacing the replicase supplied by the helper
virus. Further it is not effected by the inability of the DI-RNA to spread systemically through
plants because in this system the uptake efficiency is higher than with rub-inoculation of the
transcripts.
6.2.7 Protoplast transfection with DI RNA transcripts
To determine whether the DI sequence derivatives are replicated by the recombinant viral
replicase that was introduced into the TR4 plant lines, protoplast transfection experiments
were performed. Protoplasts were isolated from N. benthamiana and TR4 plant lines. They
were transfected with RNA transcripts from the DI, DI-gfp and the DI-scFv, respectively. As
a control, the plasmid pCAT-gfp [Reichel et al., 1996] was adopted. This Plasmid carries a
GFP gene under the control of an enhanced 35S promoter. All transfections were carried out
with TR4 as well as N. benthamiana protoplasts. The DI-gfp and pCat-gfp transfected
protoplasts were examined after 24h using fluorescence microscopy (Fig. 20 and 21). Only in
the control experiment with pCat-gfp DNA fluorescence was detectable. In the DI-gfp
transfection experiments green fluorescence was not observed.
43
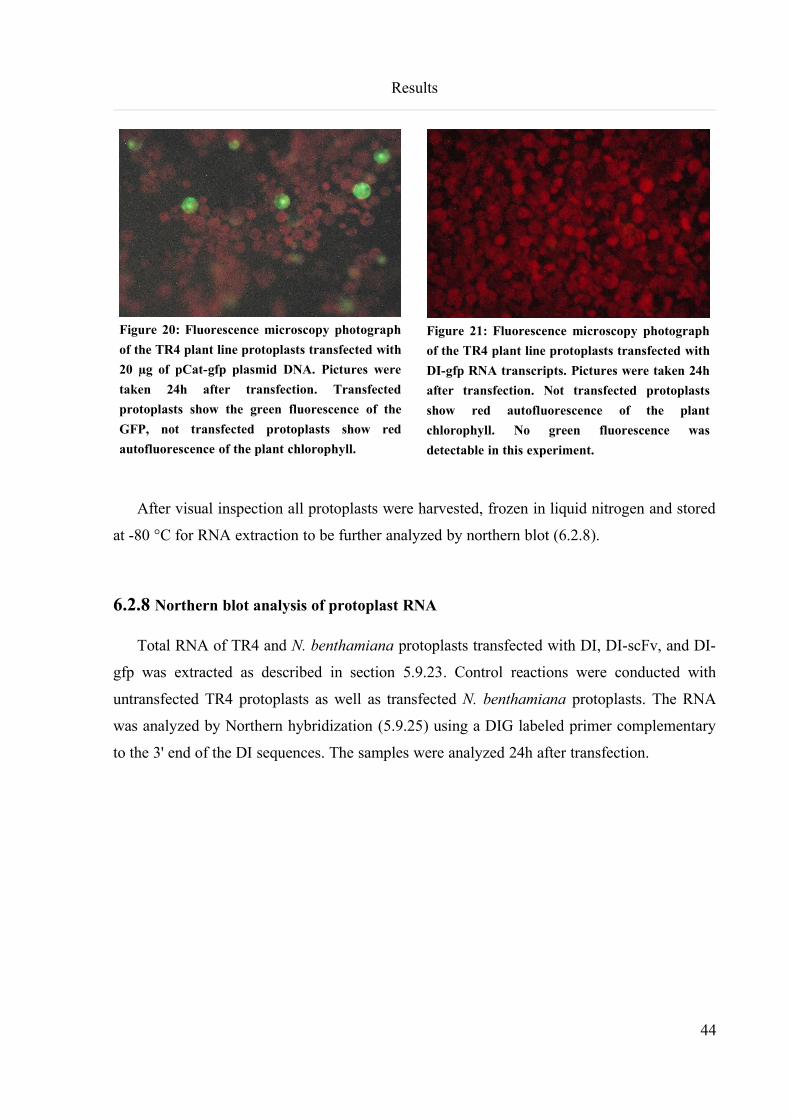
Results
Figure 20: Fluorescence microscopy photograph
of the TR4 plant line protoplasts transfected with
20 µg of pCat-gfp plasmid DNA. Pictures were
taken 24h after transfection. Transfected
protoplasts show the green fluorescence of the
GFP, not transfected protoplasts show red
autofluorescence of the plant chlorophyll.
Figure 21: Fluorescence microscopy photograph
of the TR4 plant line protoplasts transfected with
DI-gfp RNA transcripts. Pictures were taken 24h
after transfection. Not transfected protoplasts
show red autofluorescence of the plant
chlorophyll. No green fluorescence was
detectable in this experiment.
After visual inspection all protoplasts were harvested, frozen in liquid nitrogen and stored
at -80 °C for RNA extraction to be further analyzed by northern blot (6.2.8).
6.2.8 Northern blot analysis of protoplast RNA
Total RNA of TR4 and N. benthamiana protoplasts transfected with DI, DI-scFv, and DI-
gfp was extracted as described in section 5.9.23. Control reactions were conducted with
untransfected TR4 protoplasts as well as transfected N. benthamiana protoplasts. The RNA
was analyzed by Northern hybridization (5.9.25) using a DIG labeled primer complementary
to the 3' end of the DI sequences. The samples were analyzed 24h after transfection.
44
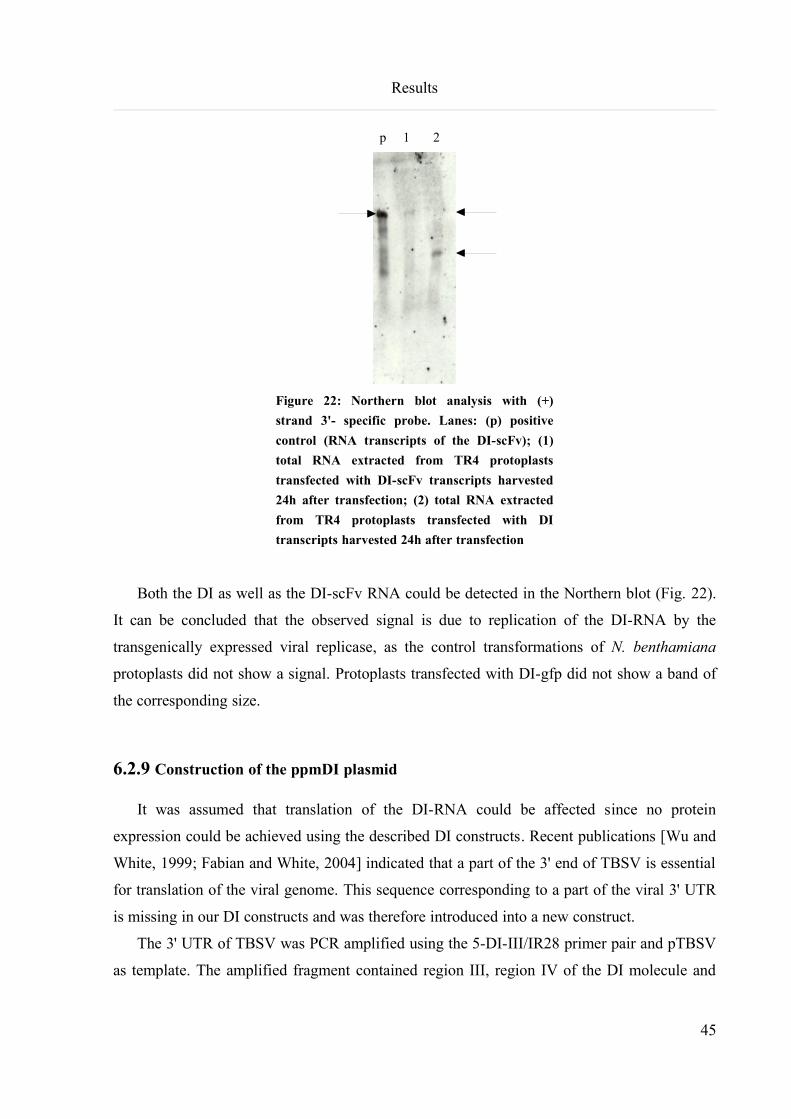
Results
p 1 2
Figure 22: Northern blot analysis with (+)
strand 3'- specific probe. Lanes: (p) positive
control (RNA transcripts of the DI-scFv); (1)
total RNA extracted from TR4 protoplasts
transfected with DI-scFv transcripts harvested
24h after transfection; (2) total RNA extracted
from TR4 protoplasts transfected with DI
transcripts harvested 24h after transfection
Both the DI as well as the DI-scFv RNA could be detected in the Northern blot (Fig. 22).
It can be concluded that the observed signal is due to replication of the DI-RNA by the
transgenically expressed viral replicase, as the control transformations of N. benthamiana
protoplasts did not show a signal. Protoplasts transfected with DI-gfp did not show a band of
the corresponding size.
6.2.9 Construction of the ppmDI plasmid
It was assumed that translation of the DI-RNA could be affected since no protein
expression could be achieved using the described DI constructs. Recent publications [Wu and
White, 1999; Fabian and White, 2004] indicated that a part of the 3' end of TBSV is essential
for translation of the viral genome. This sequence corresponding to a part of the viral 3' UTR
is missing in our DI constructs and was therefore introduced into a new construct.
The 3' UTR of TBSV was PCR amplified using the 5-DI-III/IR28 primer pair and pTBSV
as template. The amplified fragment contained region III, region IV of the DI molecule and
45
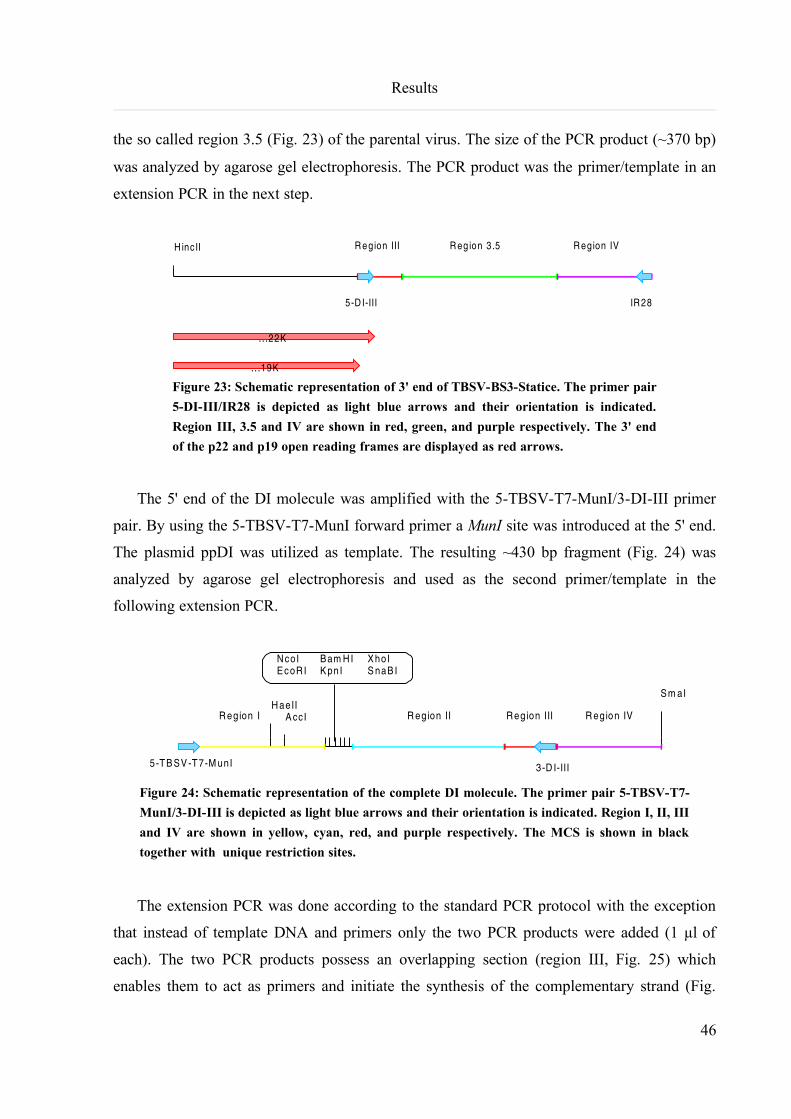
Results
the so called region 3.5 (Fig. 23) of the parental virus. The size of the PCR product (~370 bp)
was analyzed by agarose gel electrophoresis. The PCR product was the primer/template in an
extension PCR in the next step.
Figure 23: Schematic representation of 3' end of TBSV-BS3-Statice. The primer pair
5-DI-III/IR28 is depicted as light blue arrows and their orientation is indicated.
Region III, 3.5 and IV are shown in red, green, and purple respectively. The 3' end
of the p22 and p19 open reading frames are displayed as red arrows.
The 5' end of the DI molecule was amplified with the 5-TBSV-T7-MunI/3-DI-III primer
pair. By using the 5-TBSV-T7-MunI forward primer a MunI site was introduced at the 5' end.
The plasmid ppDI was utilized as template. The resulting ~430 bp fragment (Fig. 24) was
analyzed by agarose gel electrophoresis and used as the second primer/template in the
following extension PCR.
Figure 24: Schematic representation of the complete DI molecule. The primer pair 5-TBSV-T7-
MunI/3-DI-III is depicted as light blue arrows and their orientation is indicated. Region I, II, III
and IV are shown in yellow, cyan, red, and purple respectively. The MCS is shown in black
together with unique restriction sites.
The extension PCR was done according to the standard PCR protocol with the exception
that instead of template DNA and primers only the two PCR products were added (1 µl of
each). The two PCR products possess an overlapping section (region III, Fig. 25) which
enables them to act as primers and initiate the synthesis of the complementary strand (Fig.
46
H aeIIA ccI
N coIEcoR I
Bam H IKpn I
XhoIS naB I
Sm aI
5-TB SV -T7-M unI
R egion I R eg ion II R eg ion III
3 -D I-III
R eg ion IV
H inc II
...22K
...19K
5-D I-III
R egion III R eg ion 3 .5 R egion IV
IR 28
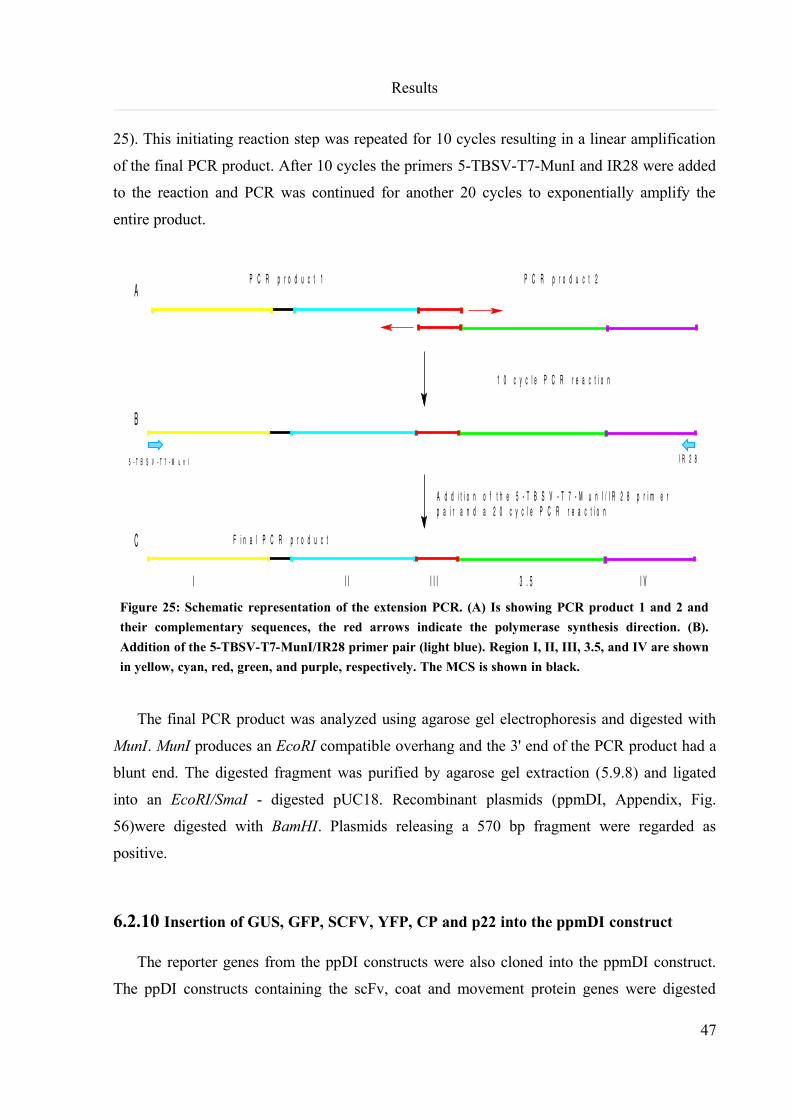
Results
25). This initiating reaction step was repeated for 10 cycles resulting in a linear amplification
of the final PCR product. After 10 cycles the primers 5-TBSV-T7-MunI and IR28 were added
to the reaction and PCR was continued for another 20 cycles to exponentially amplify the
entire product.
Figure 25: Schematic representation of the extension PCR. (A) Is showing PCR product 1 and 2 and
their complementary sequences, the red arrows indicate the polymerase synthesis direction. (B).
Addition of the 5-TBSV-T7-MunI/IR28 primer pair (light blue). Region I, II, III, 3.5, and IV are shown
in yellow, cyan, red, green, and purple, respectively. The MCS is shown in black.
The final PCR product was analyzed using agarose gel electrophoresis and digested with
MunI. MunI produces an EcoRI compatible overhang and the 3' end of the PCR product had a
blunt end. The digested fragment was purified by agarose gel extraction (5.9.8) and ligated
into an EcoRI/SmaI - digested pUC18. Recombinant plasmids (ppmDI, Appendix, Fig.
56)were digested with BamHI. Plasmids releasing a 570 bp fragment were regarded as
positive.
6.2.10 Insertion of GUS, GFP, SCFV, YFP, CP and p22 into the ppmDI construct
The reporter genes from the ppDI constructs were also cloned into the ppmDI construct.
The ppDI constructs containing the scFv, coat and movement protein genes were digested
47
5 - T B S V - T 7 - M u n I I R 2 8
P C R p r o d u c t 1 P C R p r o d u c t 2
1 0 c y c l e P C R r e a c t i o n
A d d i t i o n o f t h e 5 - T B S V - T 7 - M u n I / I R 2 8 p r i m e r p a i r a n d a 2 0 c y c l e P C R r e a c t i o n
I I I I I I 3 . 5 I V
F i n a l P C R p r o d u c t
A
B
C
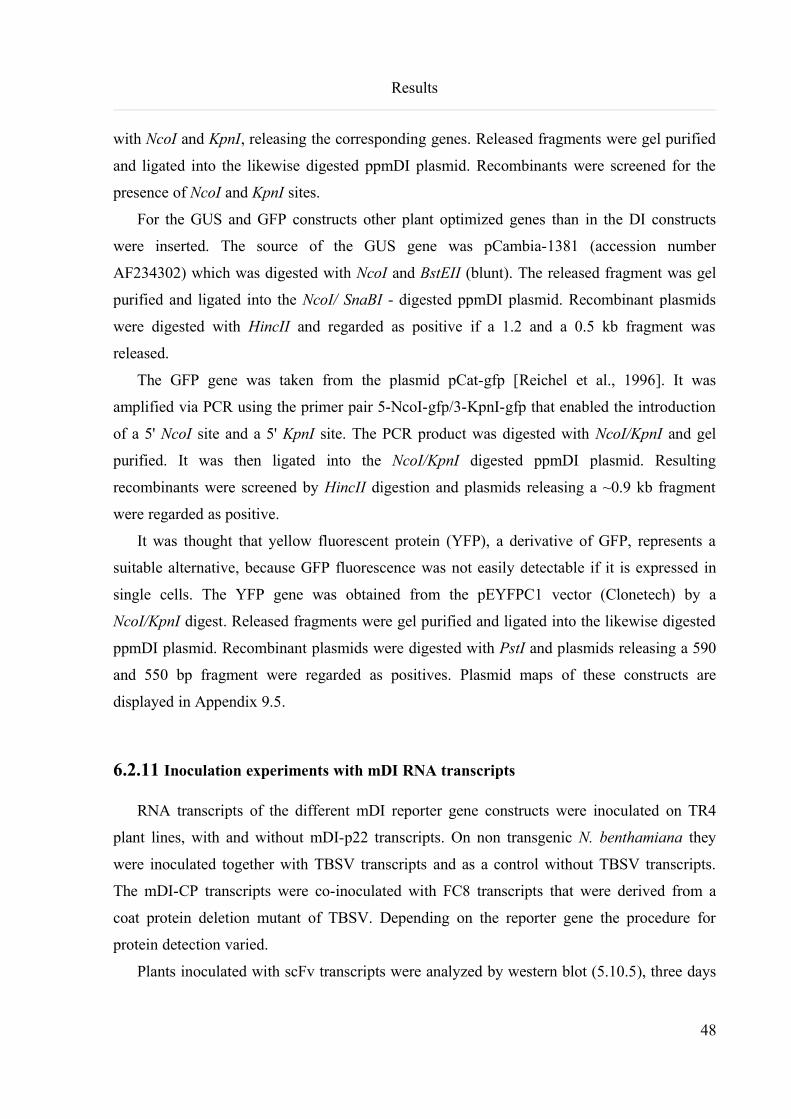
Results
with NcoI and KpnI, releasing the corresponding genes. Released fragments were gel purified
and ligated into the likewise digested ppmDI plasmid. Recombinants were screened for the
presence of NcoI and KpnI sites.
For the GUS and GFP constructs other plant optimized genes than in the DI constructs
were inserted. The source of the GUS gene was pCambia-1381 (accession number
AF234302) which was digested with NcoI and BstEII (blunt). The released fragment was gel
purified and ligated into the NcoI/ SnaBI - digested ppmDI plasmid. Recombinant plasmids
were digested with HincII and regarded as positive if a 1.2 and a 0.5 kb fragment was
released.
The GFP gene was taken from the plasmid pCat-gfp [Reichel et al., 1996]. It was
amplified via PCR using the primer pair 5-NcoI-gfp/3-KpnI-gfp that enabled the introduction
of a 5' NcoI site and a 5' KpnI site. The PCR product was digested with NcoI/KpnI and gel
purified. It was then ligated into the NcoI/KpnI digested ppmDI plasmid. Resulting
recombinants were screened by HincII digestion and plasmids releasing a ~0.9 kb fragment
were regarded as positive.
It was thought that yellow fluorescent protein (YFP), a derivative of GFP, represents a
suitable alternative, because GFP fluorescence was not easily detectable if it is expressed in
single cells. The YFP gene was obtained from the pEYFPC1 vector (Clonetech) by a
NcoI/KpnI digest. Released fragments were gel purified and ligated into the likewise digested
ppmDI plasmid. Recombinant plasmids were digested with PstI and plasmids releasing a 590
and 550 bp fragment were regarded as positives. Plasmid maps of these constructs are
displayed in Appendix 9.5.
6.2.11 Inoculation experiments with mDI RNA transcripts
RNA transcripts of the different mDI reporter gene constructs were inoculated on TR4
plant lines, with and without mDI-p22 transcripts. On non transgenic N. benthamiana they
were inoculated together with TBSV transcripts and as a control without TBSV transcripts.
The mDI-CP transcripts were co-inoculated with FC8 transcripts that were derived from a
coat protein deletion mutant of TBSV. Depending on the reporter gene the procedure for
protein detection varied.
Plants inoculated with scFv transcripts were analyzed by western blot (5.10.5), three days
48
Results
after inoculation. Detection of the antibody fragment was done using the C-terminally fused
Myc-tag. In none of the inoculated plants the scFv protein could be detected (data not shown).
The presence of coat protein was analyzed by an ELISA (5.10.6), with an antibody against
the viral particle. Again none of the tested plants that were inoculated with coat protein-
containing transcripts gave a positive signal (data not shown).
For GFP and YFP detection fluorescence microscopy was applied. Similar problems
occurred as in section 6.2.5. The fluorescence of GFP and YFP could not be distinguished
from the autofluorescence of dead plant cells.
From the mDI-GUS inoculated plants, leaves were harvested after one and ten days and
GUS-staining (5.10.1) was performed. None of the analyzed leaves showed any GUS activity
(data not shown).
6.3 Induction of gene silencing using the DI vector system
The second part of this project was to adapt and optimize the DI vector system for the
induction of gene silencing. In order to do this several plasmid constructs were created. The
first goal was to create two p19 deficient mutants, as p19 is a strong suppressor of gene
silencing, it was expected that this would increase the silencing signal. Different DI silencing
constructs were created carrying sequences homologous to different endogenous genes and
transgenes. Inoculation experiments with these constructs were performed to evaluate the
potential of the DI system as a silencing inducer.
6.3.1 Cloning of pTBSVDp19
It was necessary to create a deletion mutant of TBSV which does not express p19, because
p19 of TBSV is a strong gene silencing suppressor [Qiu et al., 2002]. The site-directed
mutagenesis kit from Stratagene was applied (5.9.22) to create this mutant. The primer pair
was p19-ATG-M-TBSV-F and p19-ATG-M-TBSV-R (Fig. 26). The primers are
complementary to each other and the A of the ATG start codon is changed to a C. This does
not change the amino acid sequence of p22 (Fig. 17). This change also removes the NcoI site
which cuts the ccatgg sequence .
49
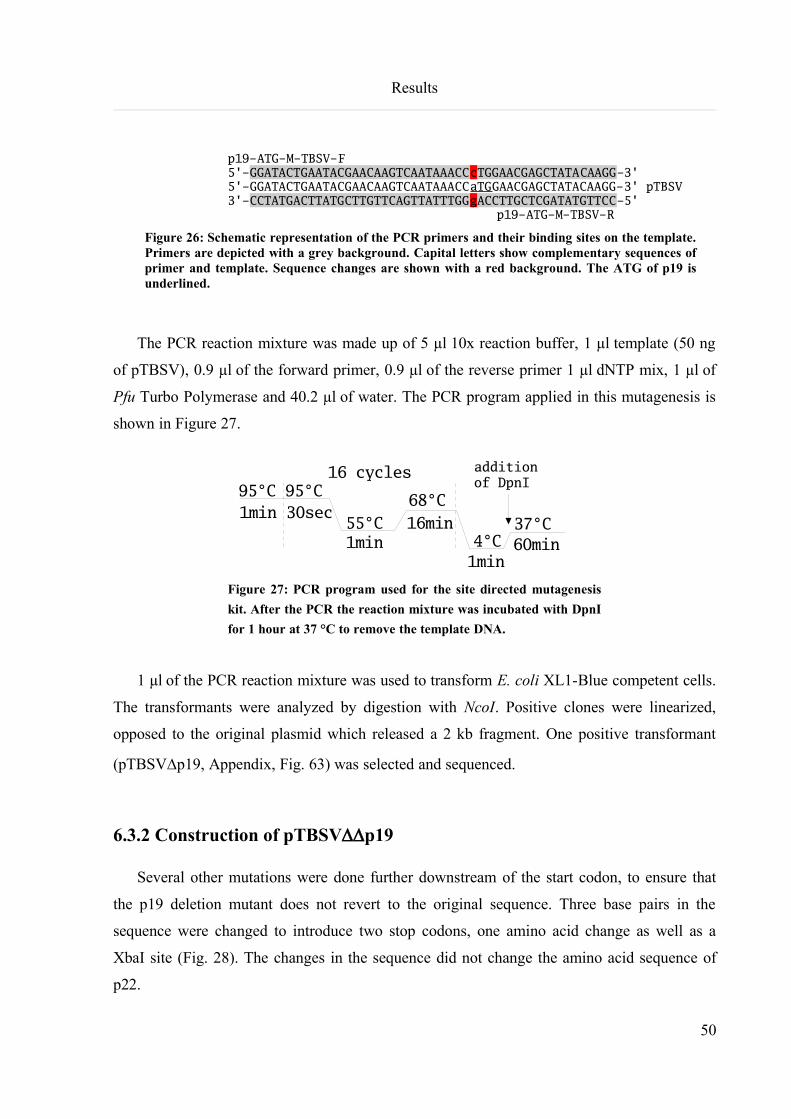
Results
p19-ATG-M-TBSV-F5'-GGATACTGAATACGAACAAGTCAATAAACCcTGGAACGAGCTATACAAGG-3'5'-GGATACTGAATACGAACAAGTCAATAAACCaTGGAACGAGCTATACAAGG-3' pTBSV3'-CCTATGACTTATGCTTGTTCAGTTATTTGGgACCTTGCTCGATATGTTCC-5'
p19-ATG-M-TBSV-R
Figure 26: Schematic representation of the PCR primers and their binding sites on the template. Primers are depicted with a grey background. Capital letters show complementary sequences of primer and template. Sequence changes are shown with a red background. The ATG of p19 is underlined.
The PCR reaction mixture was made up of 5 µl 10x reaction buffer, 1 µl template (50 ng
of pTBSV), 0.9 µl of the forward primer, 0.9 µl of the reverse primer 1 µl dNTP mix, 1 µl of
Pfu Turbo Polymerase and 40.2 µl of water. The PCR program applied in this mutagenesis is
shown in Figure 27.
Figure 27: PCR program used for the site directed mutagenesis
kit. After the PCR the reaction mixture was incubated with DpnI
for 1 hour at 37 °C to remove the template DNA.
1 µl of the PCR reaction mixture was used to transform E. coli XL1-Blue competent cells.
The transformants were analyzed by digestion with NcoI. Positive clones were linearized,
opposed to the original plasmid which released a 2 kb fragment. One positive transformant
(pTBSVDp19, Appendix, Fig. 63) was selected and sequenced.
6.3.2 Construction of pTBSVDDp19
Several other mutations were done further downstream of the start codon, to ensure that
the p19 deletion mutant does not revert to the original sequence. Three base pairs in the
sequence were changed to introduce two stop codons, one amino acid change as well as a
XbaI site (Fig. 28). The changes in the sequence did not change the amino acid sequence of
p22.
50
1min60min37°C
4°C16min
1min
30sec1min68°C
55°C
95°C95°C
addition of DpnI
16 cycles
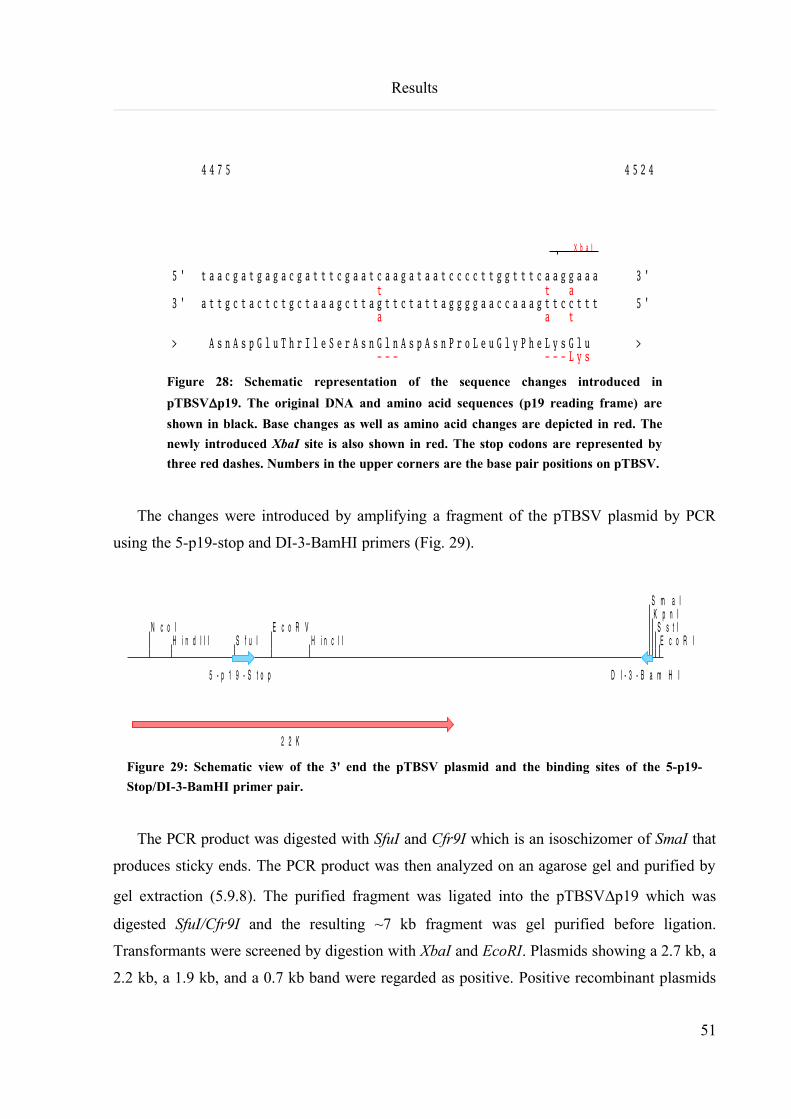
Results
Figure 28: Schematic representation of the sequence changes introduced in
pTBSVDp19. The original DNA and amino acid sequences (p19 reading frame) are
shown in black. Base changes as well as amino acid changes are depicted in red. The
newly introduced XbaI site is also shown in red. The stop codons are represented by
three red dashes. Numbers in the upper corners are the base pair positions on pTBSV.
The changes were introduced by amplifying a fragment of the pTBSV plasmid by PCR
using the 5-p19-stop and DI-3-BamHI primers (Fig. 29).
Figure 29: Schematic view of the 3' end the pTBSV plasmid and the binding sites of the 5-p19-
Stop/DI-3-BamHI primer pair.
The PCR product was digested with SfuI and Cfr9I which is an isoschizomer of SmaI that
produces sticky ends. The PCR product was then analyzed on an agarose gel and purified by
gel extraction (5.9.8). The purified fragment was ligated into the pTBSVDp19 which was
digested SfuI/Cfr9I and the resulting ~7 kb fragment was gel purified before ligation.
Transformants were screened by digestion with XbaI and EcoRI. Plasmids showing a 2.7 kb, a
2.2 kb, a 1.9 kb, and a 0.7 kb band were regarded as positive. Positive recombinant plasmids
51
4 5 2 44 4 7 5
X b a I
5 ' t a a c g a t g a g a c g a t t t c g a a t c a a g a t a a t c c c c t t g g t t t c a a g g a a a 3 ' t t a
3 ' a t t g c t a c t c t g c t a a a g c t t a g t t c t a t t a g g g g a a c c a a a g t t c c t t t 5 ' a a t
A s n A s p G l u T h r I l e S e r A s n G l n A s p A s n P r o L e u G l y P h e L y s G l u > > - - - - - - L y s
N c o IH i n d I I I S f u I
E c o R VH i n c I I
S m a IK p n I
S s t IE c o R I
2 2 K
5 - p 1 9 - S t o p D I - 3 - B a m H I
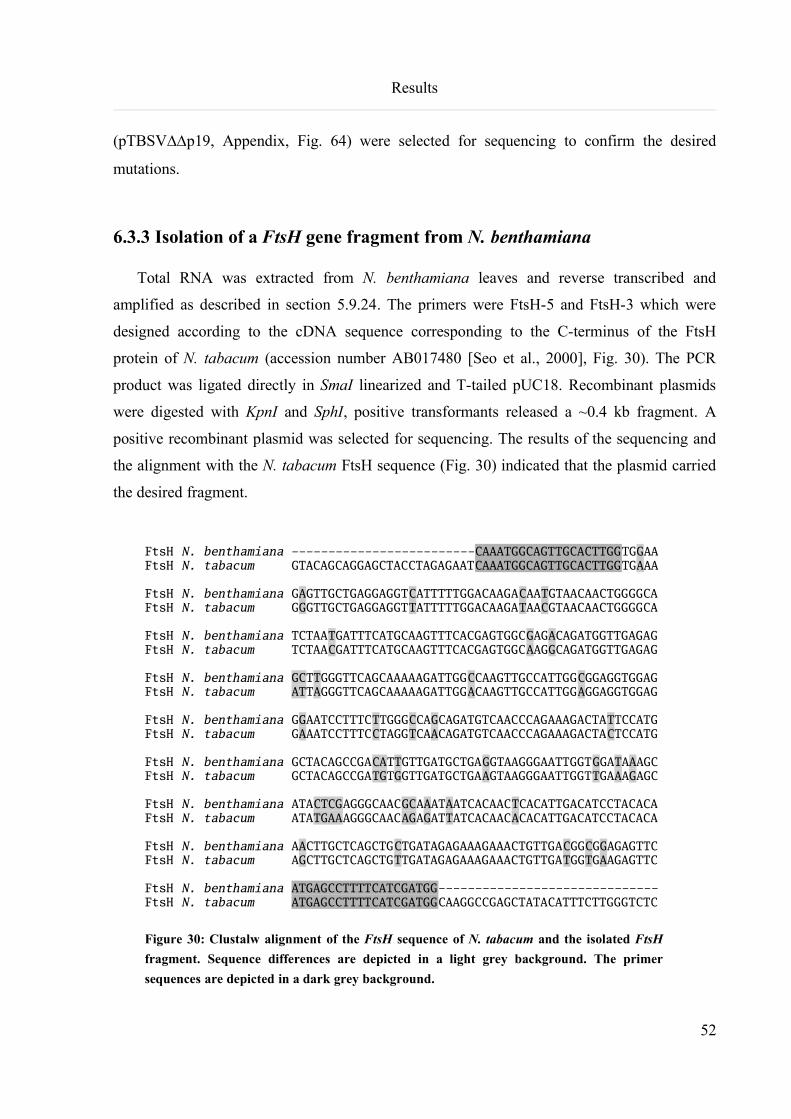
Results
(pTBSVDDp19, Appendix, Fig. 64) were selected for sequencing to confirm the desired
mutations.
6.3.3 Isolation of a FtsH gene fragment from N. benthamiana
Total RNA was extracted from N. benthamiana leaves and reverse transcribed and
amplified as described in section 5.9.24. The primers were FtsH-5 and FtsH-3 which were
designed according to the cDNA sequence corresponding to the C-terminus of the FtsH
protein of N. tabacum (accession number AB017480 [Seo et al., 2000], Fig. 30). The PCR
product was ligated directly in SmaI linearized and T-tailed pUC18. Recombinant plasmids
were digested with KpnI and SphI, positive transformants released a ~0.4 kb fragment. A
positive recombinant plasmid was selected for sequencing. The results of the sequencing and
the alignment with the N. tabacum FtsH sequence (Fig. 30) indicated that the plasmid carried
the desired fragment.
FtsH N. benthamiana -------------------------CAAATGGCAGTTGCACTTGGTGGAAFtsH N. tabacum GTACAGCAGGAGCTACCTAGAGAATCAAATGGCAGTTGCACTTGGTGAAA
FtsH N. benthamiana GAGTTGCTGAGGAGGTCATTTTTGGACAAGACAATGTAACAACTGGGGCAFtsH N. tabacum GGGTTGCTGAGGAGGTTATTTTTGGACAAGATAACGTAACAACTGGGGCA
FtsH N. benthamiana TCTAATGATTTCATGCAAGTTTCACGAGTGGCGAGACAGATGGTTGAGAGFtsH N. tabacum TCTAACGATTTCATGCAAGTTTCACGAGTGGCAAGGCAGATGGTTGAGAG
FtsH N. benthamiana GCTTGGGTTCAGCAAAAAGATTGGCCAAGTTGCCATTGGCGGAGGTGGAGFtsH N. tabacum ATTAGGGTTCAGCAAAAAGATTGGACAAGTTGCCATTGGAGGAGGTGGAG
FtsH N. benthamiana GGAATCCTTTCTTGGGCCAGCAGATGTCAACCCAGAAAGACTATTCCATGFtsH N. tabacum GAAATCCTTTCCTAGGTCAACAGATGTCAACCCAGAAAGACTACTCCATG
FtsH N. benthamiana GCTACAGCCGACATTGTTGATGCTGAGGTAAGGGAATTGGTGGATAAAGCFtsH N. tabacum GCTACAGCCGATGTGGTTGATGCTGAAGTAAGGGAATTGGTTGAAAGAGC
FtsH N. benthamiana ATACTCGAGGGCAACGCAAATAATCACAACTCACATTGACATCCTACACAFtsH N. tabacum ATATGAAAGGGCAACAGAGATTATCACAACACACATTGACATCCTACACA
FtsH N. benthamiana AACTTGCTCAGCTGCTGATAGAGAAAGAAACTGTTGACGGCGGAGAGTTCFtsH N. tabacum AGCTTGCTCAGCTGTTGATAGAGAAAGAAACTGTTGATGGTGAAGAGTTC
FtsH N. benthamiana ATGAGCCTTTTCATCGATGG------------------------------FtsH N. tabacum ATGAGCCTTTTCATCGATGGCAAGGCCGAGCTATACATTTCTTGGGTCTC
Figure 30: Clustalw alignment of the FtsH sequence of N. tabacum and the isolated FtsH
fragment. Sequence differences are depicted in a light grey background. The primer
sequences are depicted in a dark grey background.
52
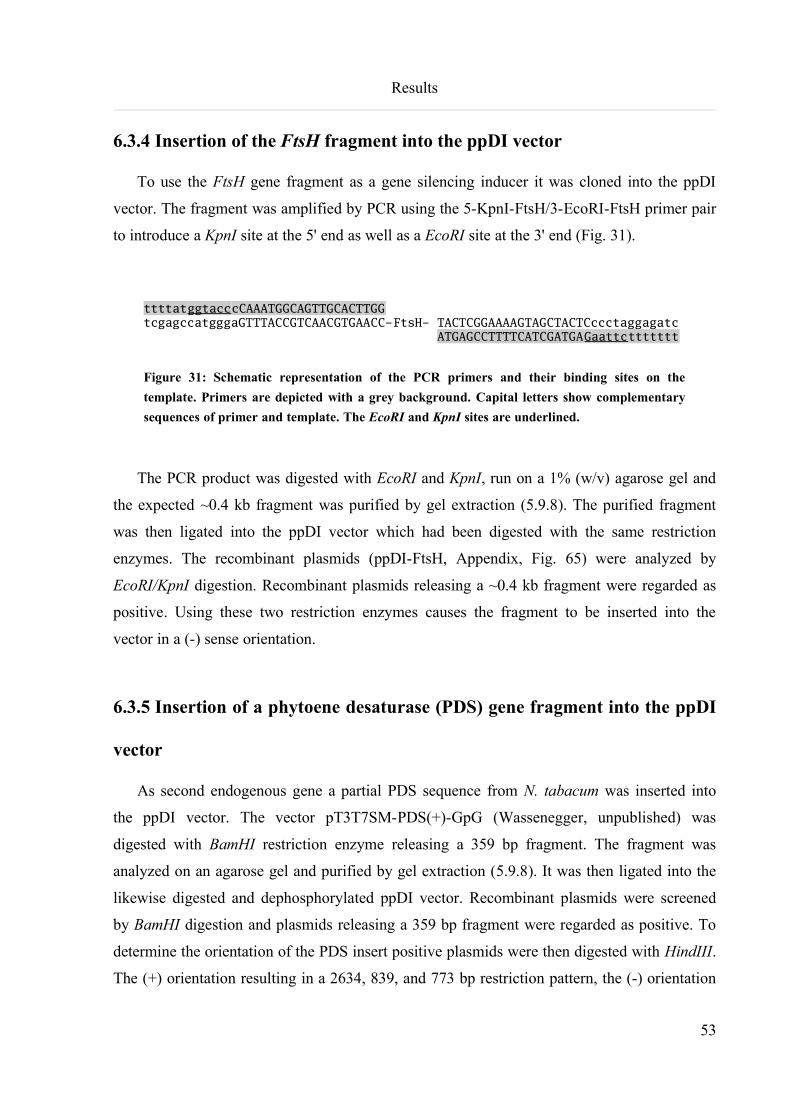
Results
6.3.4 Insertion of the FtsH fragment into the ppDI vector
To use the FtsH gene fragment as a gene silencing inducer it was cloned into the ppDI
vector. The fragment was amplified by PCR using the 5-KpnI-FtsH/3-EcoRI-FtsH primer pair
to introduce a KpnI site at the 5' end as well as a EcoRI site at the 3' end (Fig. 31).
ttttatggtacccCAAATGGCAGTTGCACTTGGtcgagccatgggaGTTTACCGTCAACGTGAACC-FtsH- TACTCGGAAAAGTAGCTACTCccctaggagatc ATGAGCCTTTTCATCGATGAGaattcttttttt
Figure 31: Schematic representation of the PCR primers and their binding sites on the
template. Primers are depicted with a grey background. Capital letters show complementary
sequences of primer and template. The EcoRI and KpnI sites are underlined.
The PCR product was digested with EcoRI and KpnI, run on a 1% (w/v) agarose gel and
the expected ~0.4 kb fragment was purified by gel extraction (5.9.8). The purified fragment
was then ligated into the ppDI vector which had been digested with the same restriction
enzymes. The recombinant plasmids (ppDI-FtsH, Appendix, Fig. 65) were analyzed by
EcoRI/KpnI digestion. Recombinant plasmids releasing a ~0.4 kb fragment were regarded as
positive. Using these two restriction enzymes causes the fragment to be inserted into the
vector in a (-) sense orientation.
6.3.5 Insertion of a phytoene desaturase (PDS) gene fragment into the ppDI
vector
As second endogenous gene a partial PDS sequence from N. tabacum was inserted into
the ppDI vector. The vector pT3T7SM-PDS(+)-GpG (Wassenegger, unpublished) was
digested with BamHI restriction enzyme releasing a 359 bp fragment. The fragment was
analyzed on an agarose gel and purified by gel extraction (5.9.8). It was then ligated into the
likewise digested and dephosphorylated ppDI vector. Recombinant plasmids were screened
by BamHI digestion and plasmids releasing a 359 bp fragment were regarded as positive. To
determine the orientation of the PDS insert positive plasmids were then digested with HindIII.
The (+) orientation resulting in a 2634, 839, and 773 bp restriction pattern, the (-) orientation
53
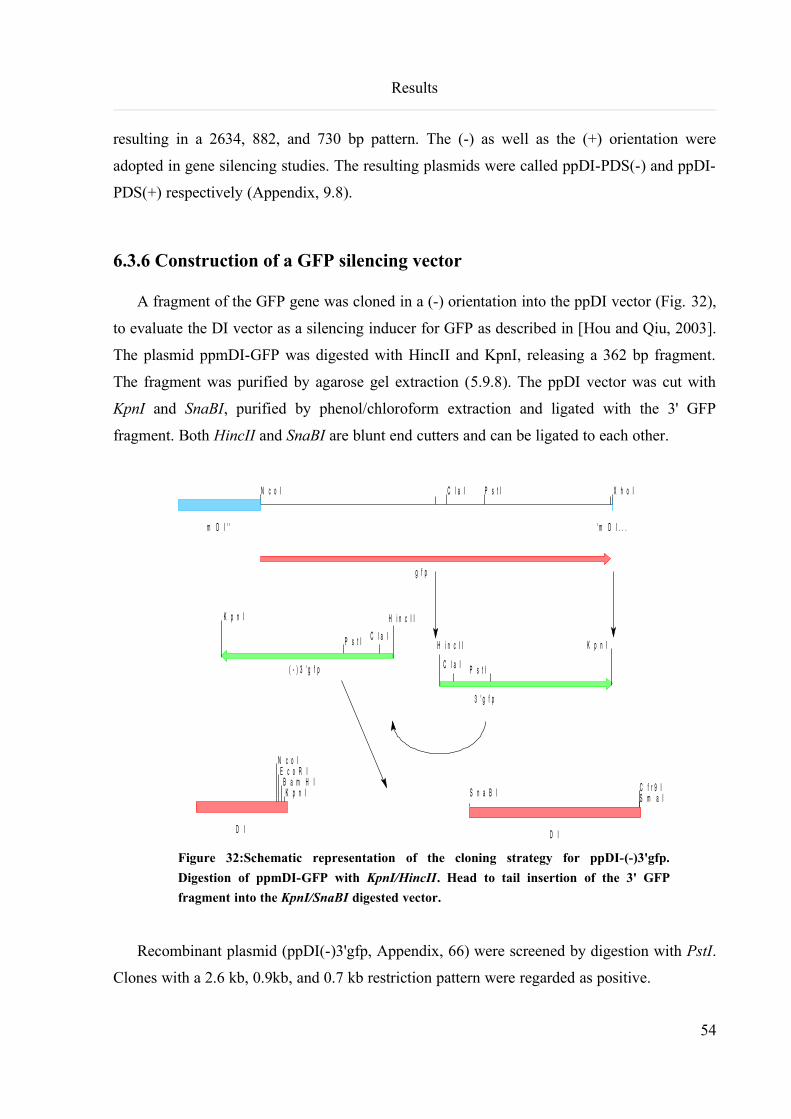
Results
resulting in a 2634, 882, and 730 bp pattern. The (-) as well as the (+) orientation were
adopted in gene silencing studies. The resulting plasmids were called ppDI-PDS(-) and ppDI-
PDS(+) respectively (Appendix, 9.8).
6.3.6 Construction of a GFP silencing vector
A fragment of the GFP gene was cloned in a (-) orientation into the ppDI vector (Fig. 32),
to evaluate the DI vector as a silencing inducer for GFP as described in [Hou and Qiu, 2003].
The plasmid ppmDI-GFP was digested with HincII and KpnI, releasing a 362 bp fragment.
The fragment was purified by agarose gel extraction (5.9.8). The ppDI vector was cut with
KpnI and SnaBI, purified by phenol/chloroform extraction and ligated with the 3' GFP
fragment. Both HincII and SnaBI are blunt end cutters and can be ligated to each other.
Figure 32:Schematic representation of the cloning strategy for ppDI-(-)3'gfp.
Digestion of ppmDI-GFP with KpnI/HincII. Head to tail insertion of the 3' GFP
fragment into the KpnI/SnaBI digested vector.
Recombinant plasmid (ppDI(-)3'gfp, Appendix, 66) were screened by digestion with PstI.
Clones with a 2.6 kb, 0.9kb, and 0.7 kb restriction pattern were regarded as positive.
54
N c o I C l a I P s t I X h o I
m D I ' '
g f p
' m D I . . .
N c o IE c o R I
B a m H IK p n I
D I
C f r 9 IS m a I
D I
S n a B I
H i n c I IK p n I
P s t I C l a I
( - ) 3 ' g f p
3 ' g f p
H i n c I I K p n I
P s t IC l a I
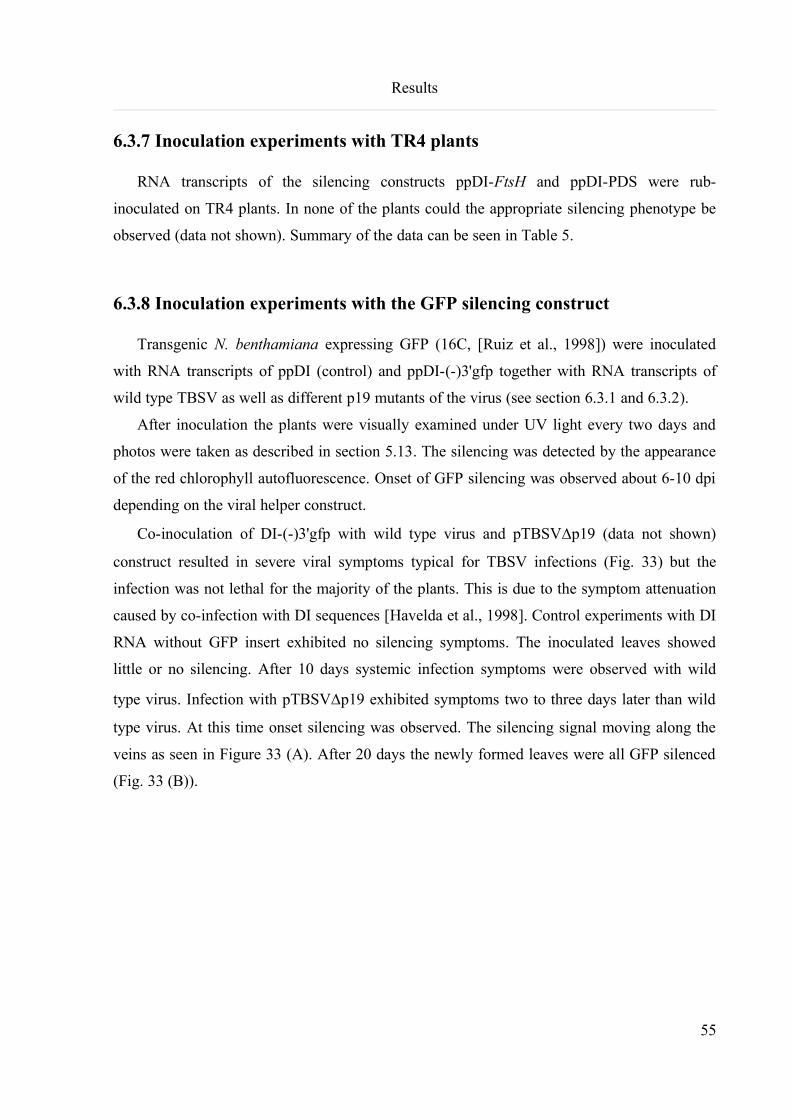
Results
6.3.7 Inoculation experiments with TR4 plants
RNA transcripts of the silencing constructs ppDI-FtsH and ppDI-PDS were rub-
inoculated on TR4 plants. In none of the plants could the appropriate silencing phenotype be
observed (data not shown). Summary of the data can be seen in Table 5.
6.3.8 Inoculation experiments with the GFP silencing construct
Transgenic N. benthamiana expressing GFP (16C, [Ruiz et al., 1998]) were inoculated
with RNA transcripts of ppDI (control) and ppDI-(-)3'gfp together with RNA transcripts of
wild type TBSV as well as different p19 mutants of the virus (see section 6.3.1 and 6.3.2).
After inoculation the plants were visually examined under UV light every two days and
photos were taken as described in section 5.13. The silencing was detected by the appearance
of the red chlorophyll autofluorescence. Onset of GFP silencing was observed about 6-10 dpi
depending on the viral helper construct.
Co-inoculation of DI-(-)3'gfp with wild type virus and pTBSVDp19 (data not shown)
construct resulted in severe viral symptoms typical for TBSV infections (Fig. 33) but the
infection was not lethal for the majority of the plants. This is due to the symptom attenuation
caused by co-infection with DI sequences [Havelda et al., 1998]. Control experiments with DI
RNA without GFP insert exhibited no silencing symptoms. The inoculated leaves showed
little or no silencing. After 10 days systemic infection symptoms were observed with wild
type virus. Infection with pTBSVDp19 exhibited symptoms two to three days later than wild
type virus. At this time onset silencing was observed. The silencing signal moving along the
veins as seen in Figure 33 (A). After 20 days the newly formed leaves were all GFP silenced
(Fig. 33 (B)).
55
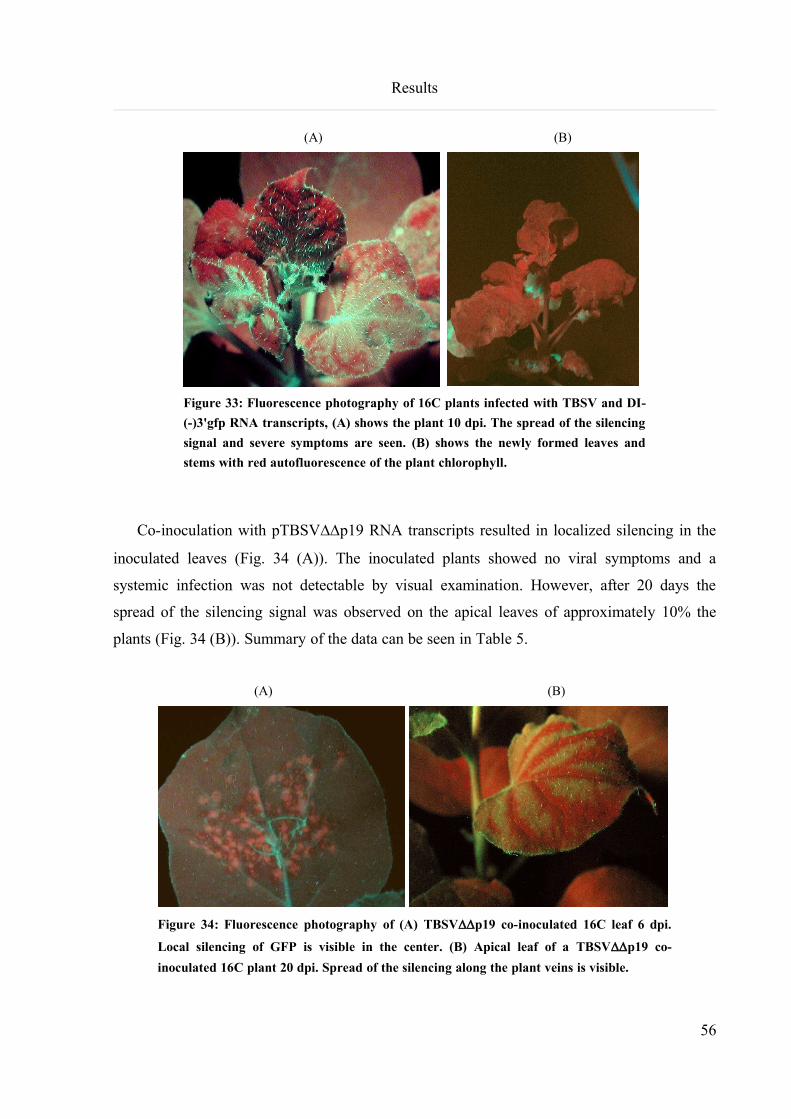
Results
(A) (B)
Figure 33: Fluorescence photography of 16C plants infected with TBSV and DI-
(-)3'gfp RNA transcripts, (A) shows the plant 10 dpi. The spread of the silencing
signal and severe symptoms are seen. (B) shows the newly formed leaves and
stems with red autofluorescence of the plant chlorophyll.
Co-inoculation with pTBSVDDp19 RNA transcripts resulted in localized silencing in the
inoculated leaves (Fig. 34 (A)). The inoculated plants showed no viral symptoms and a
systemic infection was not detectable by visual examination. However, after 20 days the
spread of the silencing signal was observed on the apical leaves of approximately 10% the
plants (Fig. 34 (B)). Summary of the data can be seen in Table 5.
(A) (B)
Figure 34: Fluorescence photography of (A) TBSVDDp19 co-inoculated 16C leaf 6 dpi.
Local silencing of GFP is visible in the center. (B) Apical leaf of a TBSVDDp19 co-
inoculated 16C plant 20 dpi. Spread of the silencing along the plant veins is visible.
56
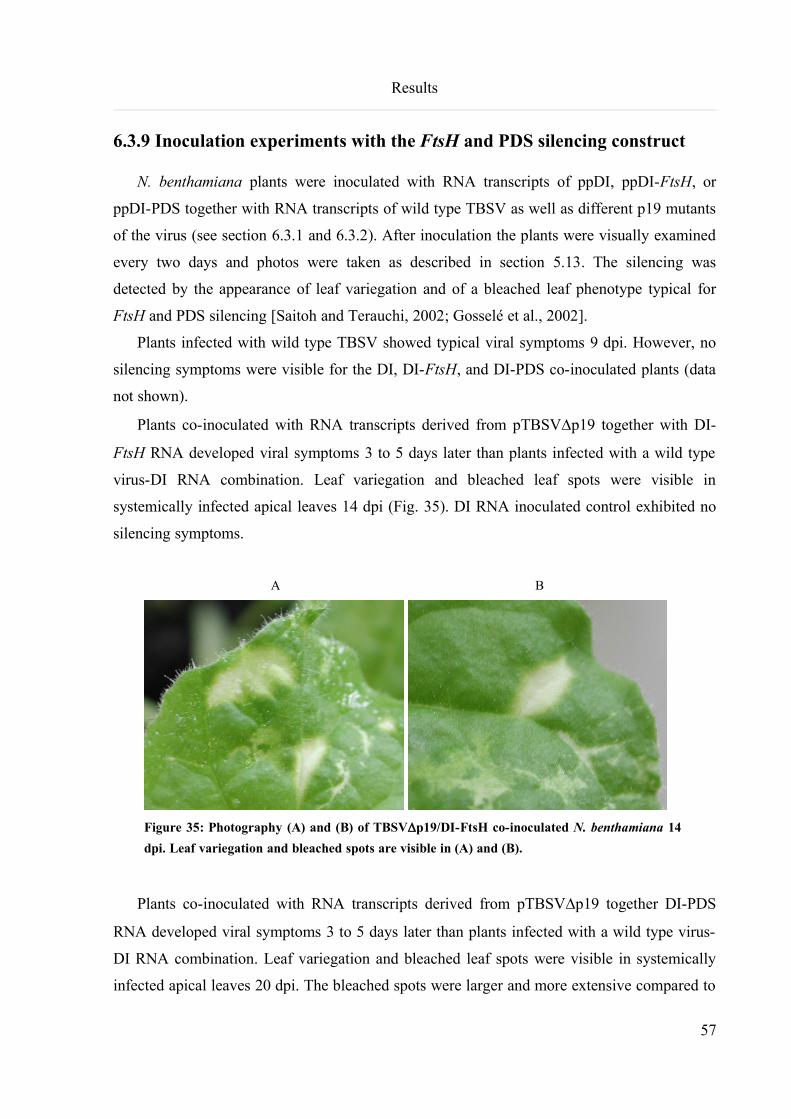
Results
6.3.9 Inoculation experiments with the FtsH and PDS silencing construct
N. benthamiana plants were inoculated with RNA transcripts of ppDI, ppDI-FtsH, or
ppDI-PDS together with RNA transcripts of wild type TBSV as well as different p19 mutants
of the virus (see section 6.3.1 and 6.3.2). After inoculation the plants were visually examined
every two days and photos were taken as described in section 5.13. The silencing was
detected by the appearance of leaf variegation and of a bleached leaf phenotype typical for
FtsH and PDS silencing [Saitoh and Terauchi, 2002; Gosselé et al., 2002].
Plants infected with wild type TBSV showed typical viral symptoms 9 dpi. However, no
silencing symptoms were visible for the DI, DI-FtsH, and DI-PDS co-inoculated plants (data
not shown).
Plants co-inoculated with RNA transcripts derived from pTBSVDp19 together with DI-
FtsH RNA developed viral symptoms 3 to 5 days later than plants infected with a wild type
virus-DI RNA combination. Leaf variegation and bleached leaf spots were visible in
systemically infected apical leaves 14 dpi (Fig. 35). DI RNA inoculated control exhibited no
silencing symptoms.
A B
Figure 35: Photography (A) and (B) of TBSVDp19/DI-FtsH co-inoculated N. benthamiana 14
dpi. Leaf variegation and bleached spots are visible in (A) and (B).
Plants co-inoculated with RNA transcripts derived from pTBSVDp19 together DI-PDS
RNA developed viral symptoms 3 to 5 days later than plants infected with a wild type virus-
DI RNA combination. Leaf variegation and bleached leaf spots were visible in systemically
infected apical leaves 20 dpi. The bleached spots were larger and more extensive compared to
57
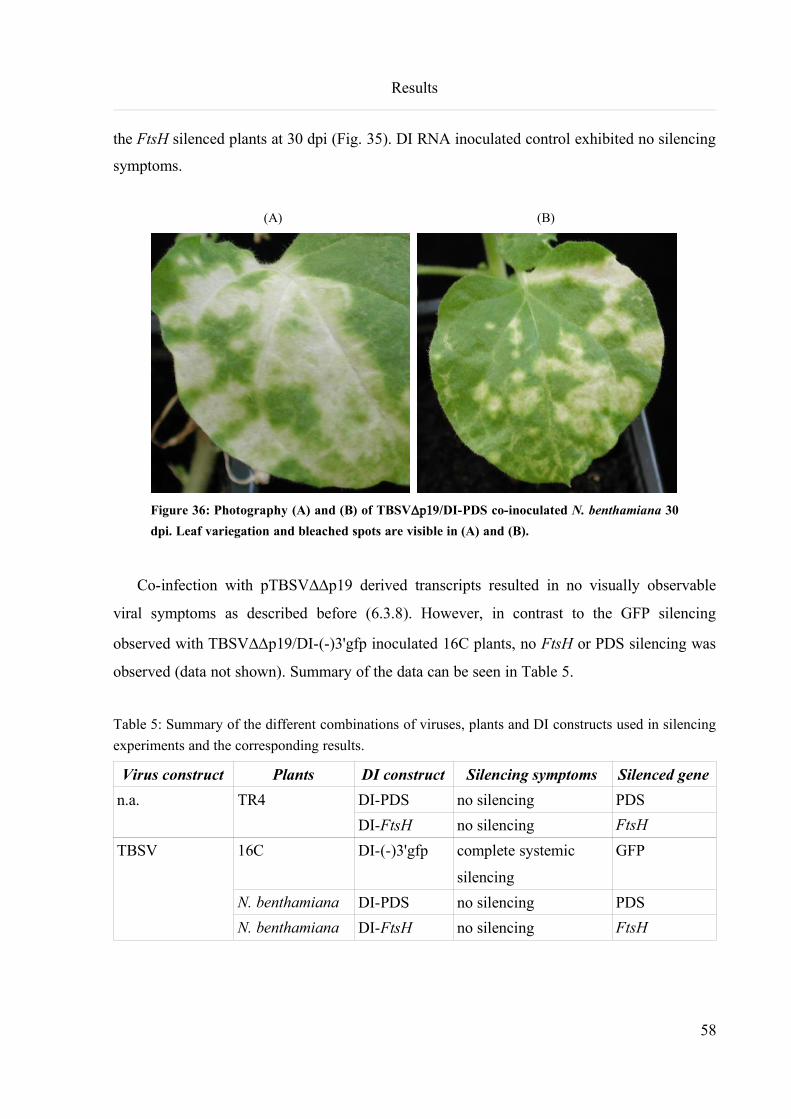
Results
the FtsH silenced plants at 30 dpi (Fig. 35). DI RNA inoculated control exhibited no silencing
symptoms.
(A) (B)
Figure 36: Photography (A) and (B) of TBSVDp19/DI-PDS co-inoculated N. benthamiana 30
dpi. Leaf variegation and bleached spots are visible in (A) and (B).
Co-infection with pTBSVDDp19 derived transcripts resulted in no visually observable
viral symptoms as described before (6.3.8). However, in contrast to the GFP silencing
observed with TBSVDDp19/DI-(-)3'gfp inoculated 16C plants, no FtsH or PDS silencing was
observed (data not shown). Summary of the data can be seen in Table 5.
Table 5: Summary of the different combinations of viruses, plants and DI constructs used in silencing
experiments and the corresponding results.
Virus construct Plants DI construct Silencing symptoms Silenced gene
n.a. TR4 DI-PDS no silencing PDS
DI-FtsH no silencing FtsH
TBSV 16C DI-(-)3'gfp complete systemic
silencing
GFP
N. benthamiana DI-PDS no silencing PDS
N. benthamiana DI-FtsH no silencing FtsH
58
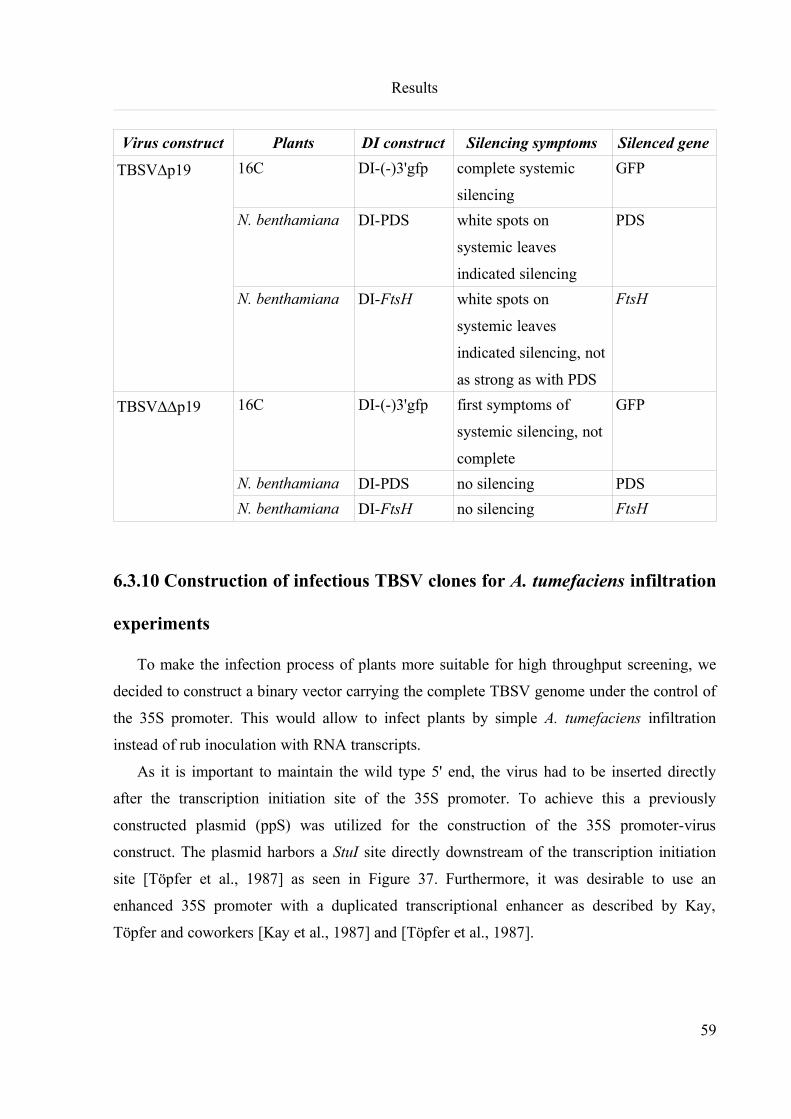
Results
Virus construct Plants DI construct Silencing symptoms Silenced gene
TBSVDp19 16C DI-(-)3'gfp complete systemic
silencing
GFP
N. benthamiana DI-PDS white spots on
systemic leaves
indicated silencing
PDS
N. benthamiana DI-FtsH white spots on
systemic leaves
indicated silencing, not
as strong as with PDS
FtsH
TBSVDDp19 16C DI-(-)3'gfp first symptoms of
systemic silencing, not
complete
GFP
N. benthamiana DI-PDS no silencing PDS
N. benthamiana DI-FtsH no silencing FtsH
6.3.10 Construction of infectious TBSV clones for A. tumefaciens infiltration
experiments
To make the infection process of plants more suitable for high throughput screening, we
decided to construct a binary vector carrying the complete TBSV genome under the control of
the 35S promoter. This would allow to infect plants by simple A. tumefaciens infiltration
instead of rub inoculation with RNA transcripts.
As it is important to maintain the wild type 5' end, the virus had to be inserted directly
after the transcription initiation site of the 35S promoter. To achieve this a previously
constructed plasmid (ppS) was utilized for the construction of the 35S promoter-virus
construct. The plasmid harbors a StuI site directly downstream of the transcription initiation
site [Töpfer et al., 1987] as seen in Figure 37. Furthermore, it was desirable to use an
enhanced 35S promoter with a duplicated transcriptional enhancer as described by Kay,
Töpfer and coworkers [Kay et al., 1987] and [Töpfer et al., 1987].
59
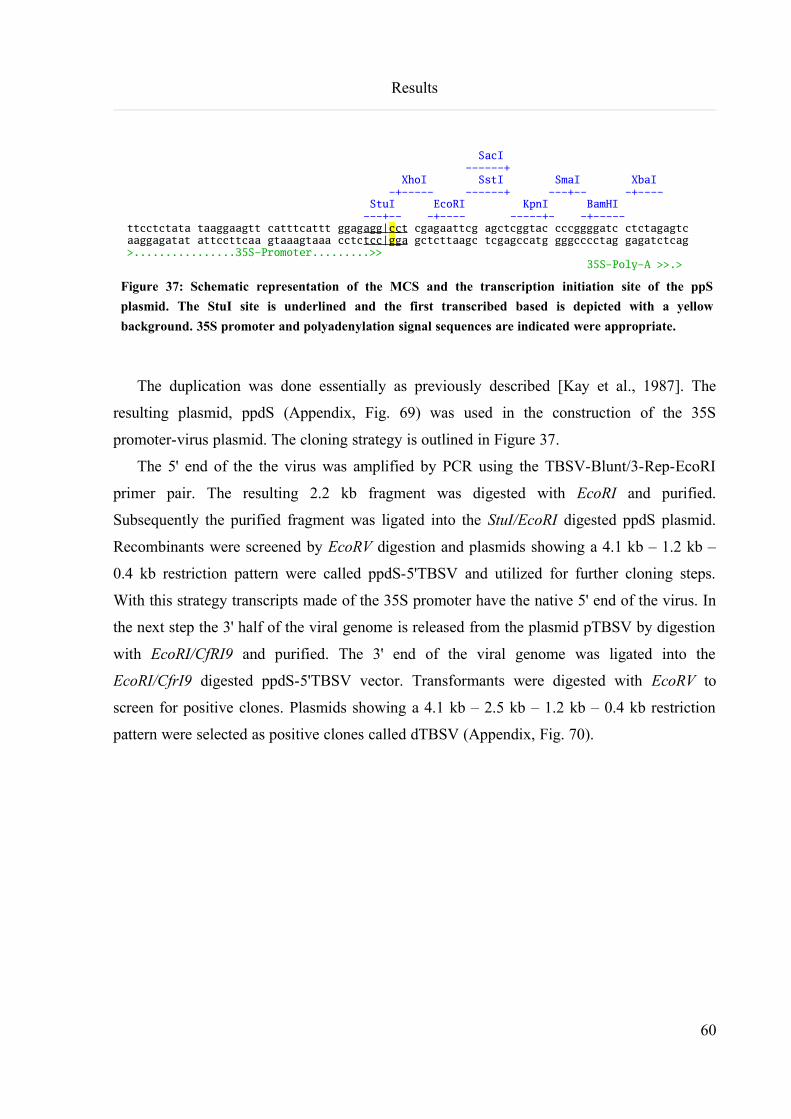
Results
SacI ------+ XhoI SstI SmaI XbaI -+----- ------+ ---+-- -+---- StuI EcoRI KpnI BamHI ---+-- -+---- -----+- -+----- ttcctctata taaggaagtt catttcattt ggagagg| c ct cgagaattcg agctcggtac cccggggatc ctctagagtc aaggagatat attccttcaa gtaaagtaaa cctctcc| g ga gctcttaagc tcgagccatg gggcccctag gagatctcag >................35S-Promoter.........>> 35S-Poly-A >>.>
Figure 37: Schematic representation of the MCS and the transcription initiation site of the ppS
plasmid. The StuI site is underlined and the first transcribed based is depicted with a yellow
background. 35S promoter and polyadenylation signal sequences are indicated were appropriate.
The duplication was done essentially as previously described [Kay et al., 1987]. The
resulting plasmid, ppdS (Appendix, Fig. 69) was used in the construction of the 35S
promoter-virus plasmid. The cloning strategy is outlined in Figure 37.
The 5' end of the the virus was amplified by PCR using the TBSV-Blunt/3-Rep-EcoRI
primer pair. The resulting 2.2 kb fragment was digested with EcoRI and purified.
Subsequently the purified fragment was ligated into the StuI/EcoRI digested ppdS plasmid.
Recombinants were screened by EcoRV digestion and plasmids showing a 4.1 kb – 1.2 kb –
0.4 kb restriction pattern were called ppdS-5'TBSV and utilized for further cloning steps.
With this strategy transcripts made of the 35S promoter have the native 5' end of the virus. In
the next step the 3' half of the viral genome is released from the plasmid pTBSV by digestion
with EcoRI/CfRI9 and purified. The 3' end of the viral genome was ligated into the
EcoRI/CfrI9 digested ppdS-5'TBSV vector. Transformants were digested with EcoRV to
screen for positive clones. Plasmids showing a 4.1 kb – 2.5 kb – 1.2 kb – 0.4 kb restriction
pattern were selected as positive clones called dTBSV (Appendix, Fig. 70).
60
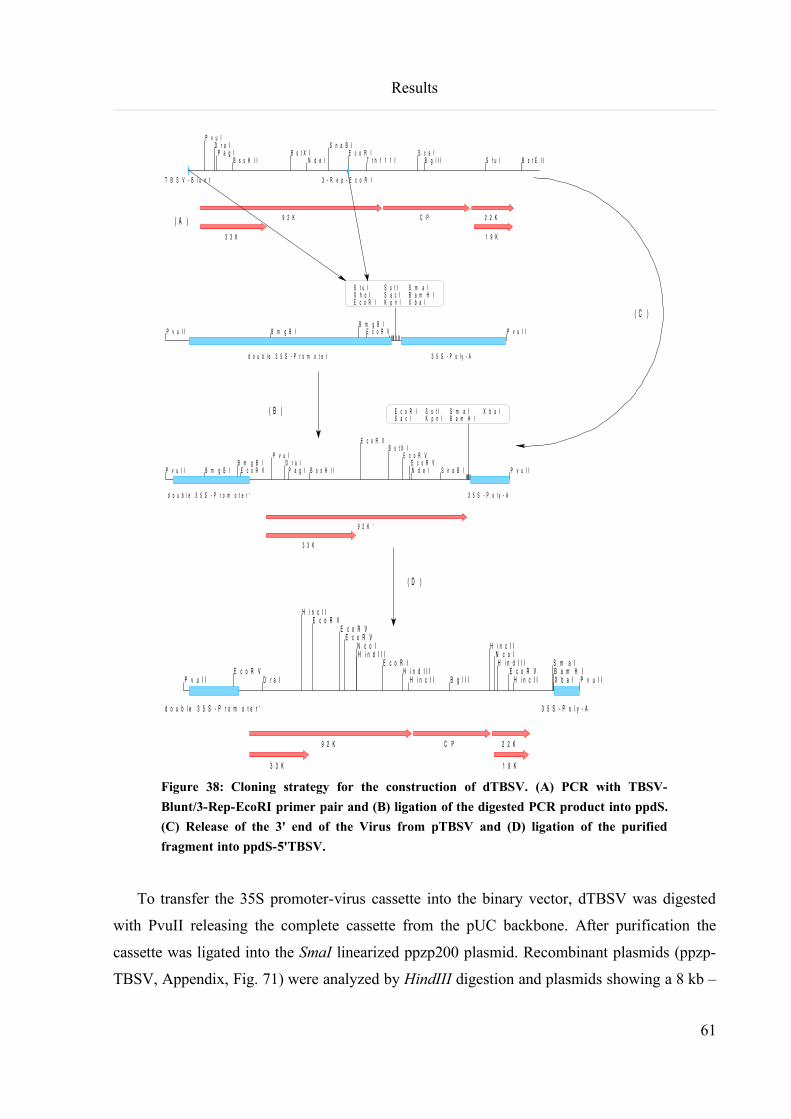
Results
P v u ID r a I
P a g IB s s H I I
B s t X IN d e I
S n a B IE c o R I
T t h 1 1 1 IS c a I
B g l I I S f u I B s t E I I
T B S V - B l u n t
9 2 K
3 3 K
3 - R e p - E c o R I
C P 2 2 K
1 9 K
P v u I I B m g B IB m g B I
E c o R V
S t u IX h o IE c o R I
S s t IS a c IK p n I
S m a IB a m H IX b a I
P v u I I
d o u b l e 3 5 S - P r o m o t e r 3 5 S - P o l y - A
P v u I I B m g B IB m g B I
E c o R V
P v u ID r a I
P a g I B s s H I I
E c o R VB s t X I
E c o R VE c o R VN d e I S n a B I
E c o R IS a c I
S s t IK p n I
S m a IB a m H I
X b a I
P v u I I
d o u b l e 3 5 S - P r o m o t e r '
9 2 K '
3 3 K
3 5 S - P o l y - A
P v u I IE c o R V
D r a I
H i n c I IE c o R V
E c o R VE c o R V
N c o IH i n d I I I
E c o R IH i n d I I I
H i n c I I B g l I I
H i n c I IN c o I
H i n d I I IE c o R V
H i n c I I
S m a IB a m H IX b a I P v u I I
d o u b l e 3 5 S - P r o m o t e r '
9 2 K
3 3 K
C P 2 2 K
1 9 K
3 5 S - P o l y - A
( A )
( C )
( B )
( D )
Figure 38: Cloning strategy for the construction of dTBSV. (A) PCR with TBSV-
Blunt/3-Rep-EcoRI primer pair and (B) ligation of the digested PCR product into ppdS.
(C) Release of the 3' end of the Virus from pTBSV and (D) ligation of the purified
fragment into ppdS-5'TBSV.
To transfer the 35S promoter-virus cassette into the binary vector, dTBSV was digested
with PvuII releasing the complete cassette from the pUC backbone. After purification the
cassette was ligated into the SmaI linearized ppzp200 plasmid. Recombinant plasmids (ppzp-
TBSV, Appendix, Fig. 71) were analyzed by HindIII digestion and plasmids showing a 8 kb –
61
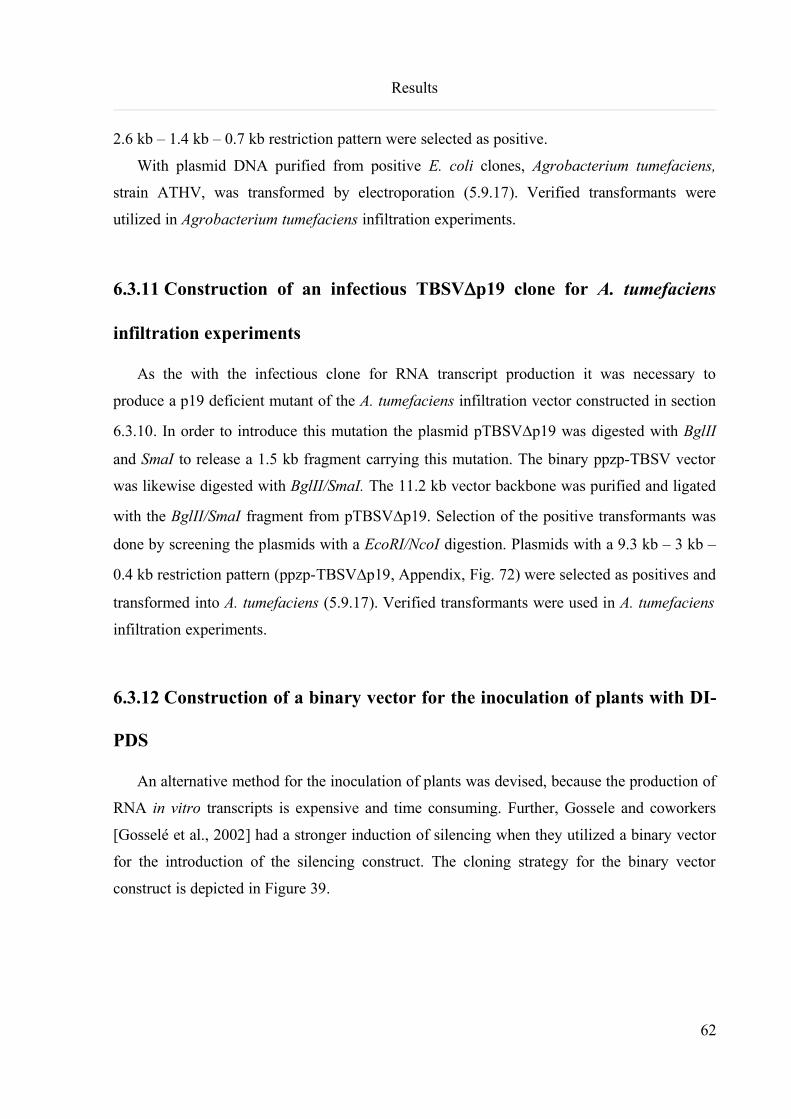
Results
2.6 kb – 1.4 kb – 0.7 kb restriction pattern were selected as positive.
With plasmid DNA purified from positive E. coli clones, Agrobacterium tumefaciens,
strain ATHV, was transformed by electroporation (5.9.17). Verified transformants were
utilized in Agrobacterium tumefaciens infiltration experiments.
6.3.11 Construction of an infectious TBSVDp19 clone for A. tumefaciens
infiltration experiments
As the with the infectious clone for RNA transcript production it was necessary to
produce a p19 deficient mutant of the A. tumefaciens infiltration vector constructed in section
6.3.10. In order to introduce this mutation the plasmid pTBSVDp19 was digested with BglII
and SmaI to release a 1.5 kb fragment carrying this mutation. The binary ppzp-TBSV vector
was likewise digested with BglII/SmaI. The 11.2 kb vector backbone was purified and ligated
with the BglII/SmaI fragment from pTBSVDp19. Selection of the positive transformants was
done by screening the plasmids with a EcoRI/NcoI digestion. Plasmids with a 9.3 kb – 3 kb –
0.4 kb restriction pattern (ppzp-TBSVDp19, Appendix, Fig. 72) were selected as positives and
transformed into A. tumefaciens (5.9.17). Verified transformants were used in A. tumefaciens
infiltration experiments.
6.3.12 Construction of a binary vector for the inoculation of plants with DI-
PDS
An alternative method for the inoculation of plants was devised, because the production of
RNA in vitro transcripts is expensive and time consuming. Further, Gossele and coworkers
[Gosselé et al., 2002] had a stronger induction of silencing when they utilized a binary vector
for the introduction of the silencing construct. The cloning strategy for the binary vector
construct is depicted in Figure 39.
62
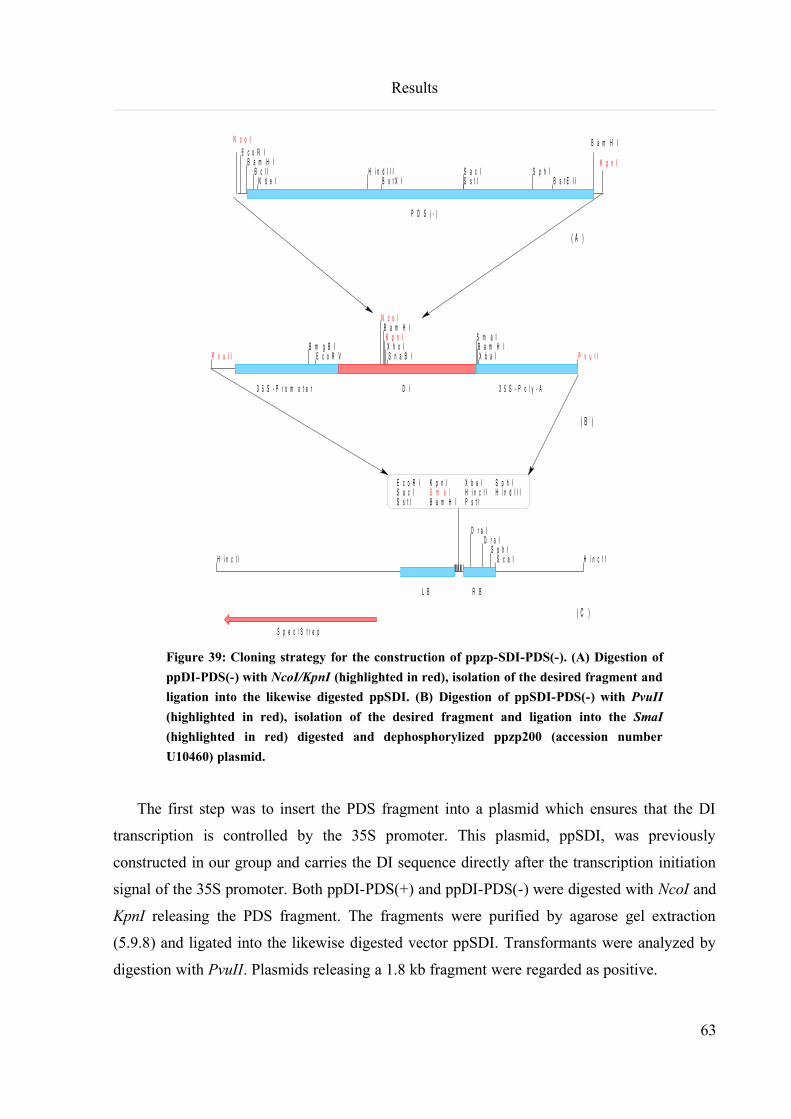
Results
H i n c I I
E c o R IS a c IS s t I
K p n IS m a IB a m H I
X b a IH i n c I IP s t I
S p h IH i n d I I I
D r a ID r a I
S p h IS c a I H i n c I I
S p e c / S t r e p
L B R B
E c o R IB a m H I
B c l IN d e I
H i n d I I IB s t X I
S a c IS s t I
S p h IB s t E I I
B a m H I
P D S ( - )
N c o I
K p n I
P v u I IB m g B I
E c o R V
N c o IB a m H I
K p n IX h o IS n a B I
S m a IB a m H IX b a I P v u I I
3 5 S - P r o m o t e r D I 3 5 S - P o l y - A
( A )
( B )
( C )
Figure 39: Cloning strategy for the construction of ppzp-SDI-PDS(-). (A) Digestion of
ppDI-PDS(-) with NcoI/KpnI (highlighted in red), isolation of the desired fragment and
ligation into the likewise digested ppSDI. (B) Digestion of ppSDI-PDS(-) with PvuII
(highlighted in red), isolation of the desired fragment and ligation into the SmaI
(highlighted in red) digested and dephosphorylized ppzp200 (accession number
U10460) plasmid.
The first step was to insert the PDS fragment into a plasmid which ensures that the DI
transcription is controlled by the 35S promoter. This plasmid, ppSDI, was previously
constructed in our group and carries the DI sequence directly after the transcription initiation
signal of the 35S promoter. Both ppDI-PDS(+) and ppDI-PDS(-) were digested with NcoI and
KpnI releasing the PDS fragment. The fragments were purified by agarose gel extraction
(5.9.8) and ligated into the likewise digested vector ppSDI. Transformants were analyzed by
digestion with PvuII. Plasmids releasing a 1.8 kb fragment were regarded as positive.
63
Results
The constructs ppSDI-PDS(+) and (-) were both digested with PvuII and the released 1.8
kb fragments purified by agarose gel extraction. After SmaI digestion the ppzp200 binary
vector (accession number U10460, [Hajdukiewicz et al., 1994]) was treated with SAP (5.9.12)
and purified by phenolization, subsequent precipitation with EtOH and resuspension in 10 µl
of water. Both purified PDS fragments were ligated into the ppzp200 vector and transformed
in chemically competent XL Blue cells. Transformants were screened by HindIII digestion
and plasmids (ppzp-SDI-PDS(+) and ppzp-SDI-PDS(-), Appendix 9.11) releasing a 839 bp
fragment were regarded as positive.
With plasmid DNA purified from positive E. coli clones, Agrobacterium tumefaciens,
strain ATHV, was transformed by electroporation (5.9.17). Verified transformants were used
in Agrobacterium tumefaciens infiltration experiments.
6.3.13 A. tumefaciens infiltration experiments with DI-PDS binary vectors
on TR4 plants
Transgenic replicase expressing TR4 plants were infiltrated with A. tumefaciens bacterial
suspension as described in section 5.12 to evaluate if this inoculation method was sufficient to
induce a systemic silencing. A. tumefaciens cultures were utilized which carried the ppzp-
SDI-PDS(+) and (-) plasmids. However, none of the infiltrated plants showed silencing of
PDS (data not shown).
6.3.14 A. tumefaciens infiltration experiments with DI-PDS binary vectors
Wild type N. benthamiana plants were inoculated with TBSV, TBSVDp19, and
TBSVDDp19 RNA transcripts. Two h after rub-inoculation the plants where infiltrated with
ppzp-SDI-PDS(+ and -). The infection behavior of the different virus mutants was the same as
in previous experiments. Wild type TBSV infected plants showed the first systemic symptoms
after 6-7 dpi, TBSVDp19 infected plants after 10 dpi and TBSVDDp19 infected plants showed
no symptoms. However, none of the ppzp-SDI-PDS(+ and -) infiltrated plants showed any
silencing symptoms (data not shown) which is in contrast to the previously described
experiments using RNA transcripts of DI-PDS.
64
Results
6.3.15 A. tumefaciens infiltration experiments with DI-PDS and virus binary
vectors
To evaluate the effectiveness of Agrobacterium tumefaciens mediated infection and
induction of gene silencing with TBSV in comparison to the RNA transcript rub inoculation,
N. benthamiana plants were infiltrated with A. tumefaciens bacterial suspension as described
in section 5.12. The bacterial suspensions were a mixture of A. tumefaciens carrying the ppzp-
TBSV or ppzp-TBSVDp19 plasmid together with A. tumefaciens carrying the ppzp-SDI-
PDS(-) or ppzp-SDI-PDS(+) plasmids.
Figure 40: Systemically infected N. benthamiana leaves showing PDS silencing symptoms. Viral
symptoms like severe stunting of leaves can also be seen. Plants were infiltrated with ppzp-TBSV and
ppzp-SDI-PDS(+) 10 days before.
Plants infiltrated with with a combination ppzp-TBSV and ppzp-SDI-PDS(+ or -)
developed the first systemic after 5-7 dpi which is one to two days earlier then on RNA
transcript inoculated plants. Additionally, in contrast to the inoculation with RNA transcripts
plants infiltrated with a mixture of ppzp-TBSV and ppzp-SDI-PDS(+ or -) exhibited PDS
silencing symptoms (Fig. 40). There was no significant difference between plants infiltrated
with the (+) or (-) sense PDS constructs. Therefore, further experiments were done with the
(+) sense construct alone.
N. benthamiana plants infiltrated with a combination ppzp-TBSVDp19 and ppzp-SDI-
PDS(+) exhibited comparatively mild viral infection symptoms after approximately 25 dpi.
Minor silencing symptoms appeared after 30 dpi (Fig. 41). An interesting difference between
the wild type virus and the TBSVDp19 mutant was that silencing symptoms mostly appeared
65
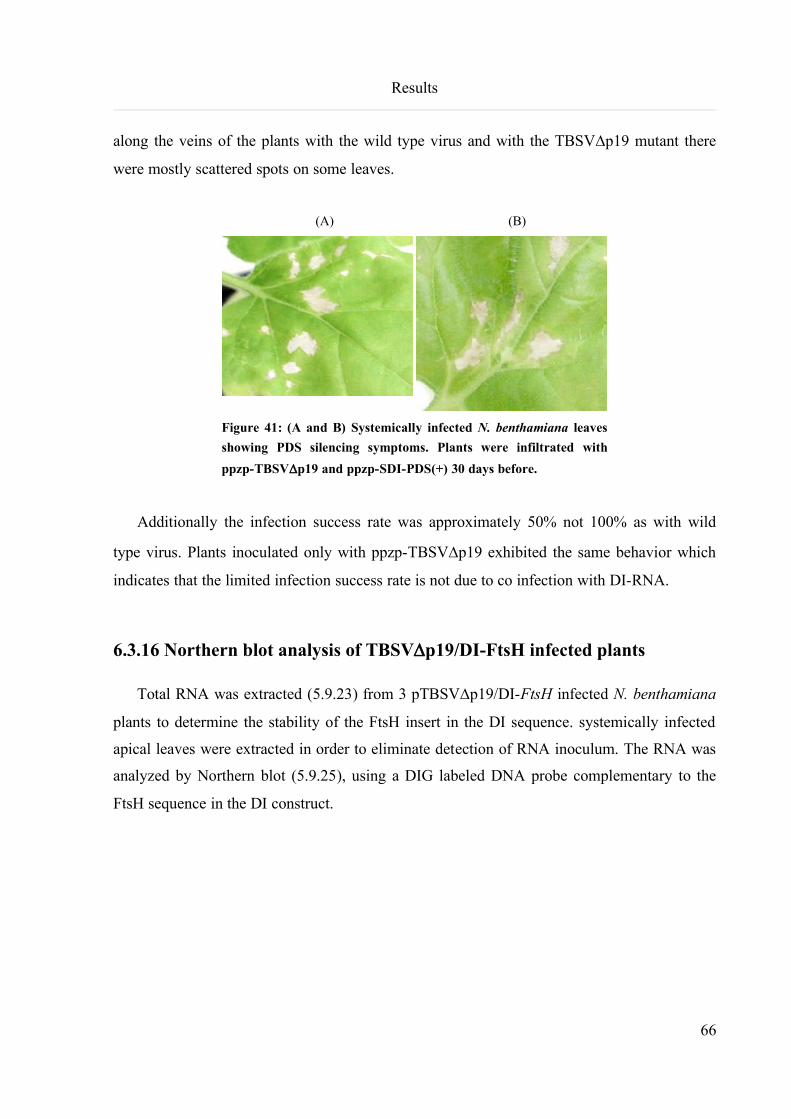
Results
along the veins of the plants with the wild type virus and with the TBSVDp19 mutant there
were mostly scattered spots on some leaves.
(A) (B)
Figure 41: (A and B) Systemically infected N. benthamiana leaves
showing PDS silencing symptoms. Plants were infiltrated with
ppzp-TBSVDp19 and ppzp-SDI-PDS(+) 30 days before.
Additionally the infection success rate was approximately 50% not 100% as with wild
type virus. Plants inoculated only with ppzp-TBSVDp19 exhibited the same behavior which
indicates that the limited infection success rate is not due to co infection with DI-RNA.
6.3.16 Northern blot analysis of TBSVDp19/DI-FtsH infected plants
Total RNA was extracted (5.9.23) from 3 pTBSVDp19/DI-FtsH infected N. benthamiana
plants to determine the stability of the FtsH insert in the DI sequence. systemically infected
apical leaves were extracted in order to eliminate detection of RNA inoculum. The RNA was
analyzed by Northern blot (5.9.25), using a DIG labeled DNA probe complementary to the
FtsH sequence in the DI construct.
66
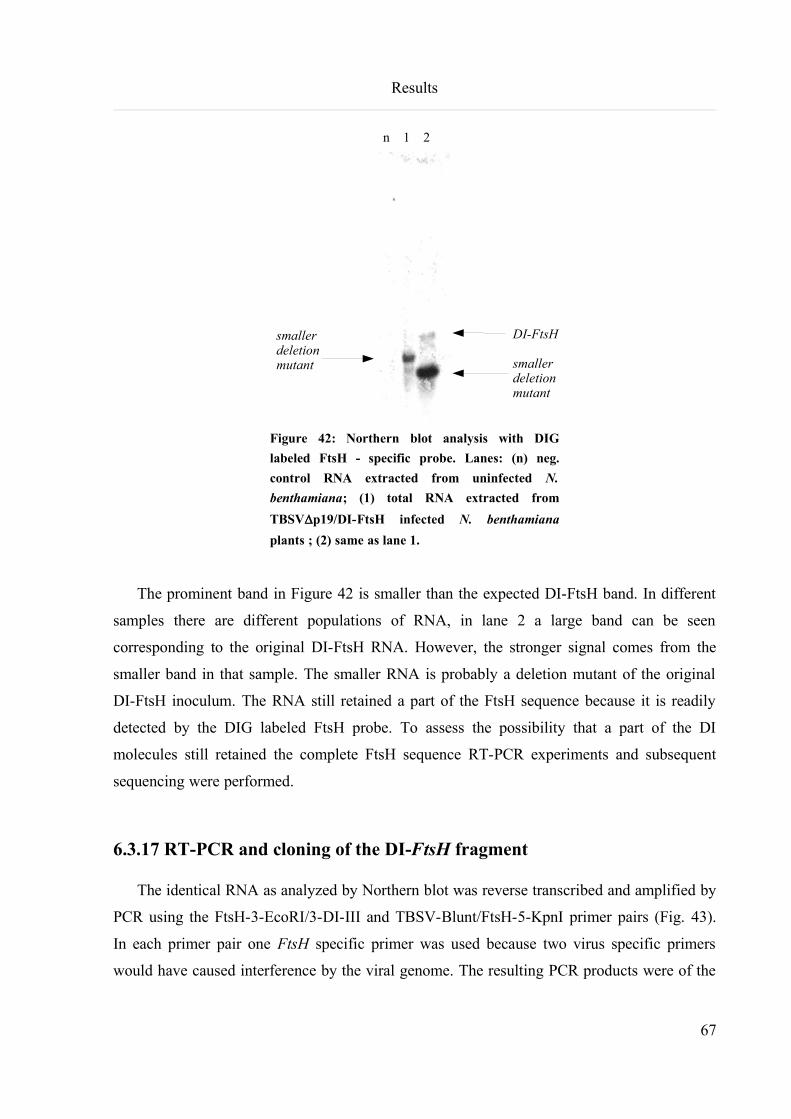
Results
n 1 2
Figure 42: Northern blot analysis with DIG
labeled FtsH - specific probe. Lanes: (n) neg.
control RNA extracted from uninfected N.
benthamiana; (1) total RNA extracted from
TBSVDp19/DI-FtsH infected N. benthamiana
plants ; (2) same as lane 1.
The prominent band in Figure 42 is smaller than the expected DI-FtsH band. In different
samples there are different populations of RNA, in lane 2 a large band can be seen
corresponding to the original DI-FtsH RNA. However, the stronger signal comes from the
smaller band in that sample. The smaller RNA is probably a deletion mutant of the original
DI-FtsH inoculum. The RNA still retained a part of the FtsH sequence because it is readily
detected by the DIG labeled FtsH probe. To assess the possibility that a part of the DI
molecules still retained the complete FtsH sequence RT-PCR experiments and subsequent
sequencing were performed.
6.3.17 RT-PCR and cloning of the DI-FtsH fragment
The identical RNA as analyzed by Northern blot was reverse transcribed and amplified by
PCR using the FtsH-3-EcoRI/3-DI-III and TBSV-Blunt/FtsH-5-KpnI primer pairs (Fig. 43).
In each primer pair one FtsH specific primer was used because two virus specific primers
would have caused interference by the viral genome. The resulting PCR products were of the
67
DI-FtsH
smaller deletion mutant
smaller deletion mutant
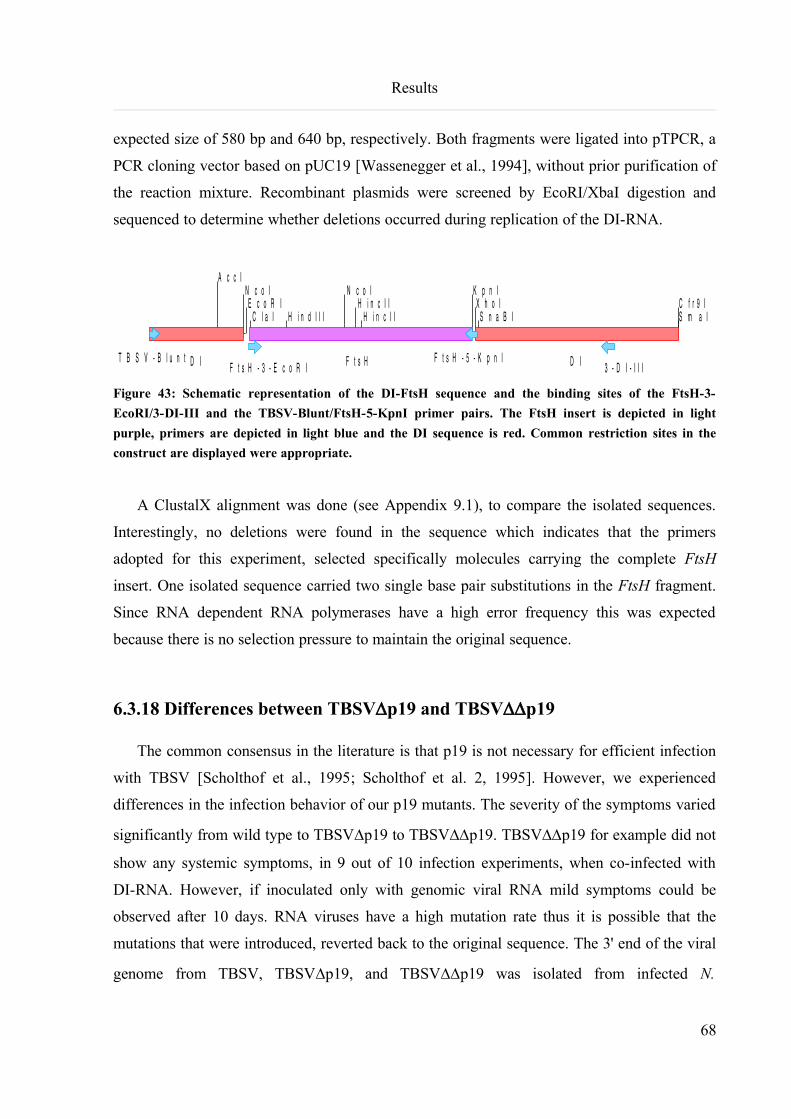
Results
expected size of 580 bp and 640 bp, respectively. Both fragments were ligated into pTPCR, a
PCR cloning vector based on pUC19 [Wassenegger et al., 1994], without prior purification of
the reaction mixture. Recombinant plasmids were screened by EcoRI/XbaI digestion and
sequenced to determine whether deletions occurred during replication of the DI-RNA.
Figure 43: Schematic representation of the DI-FtsH sequence and the binding sites of the FtsH-3-
EcoRI/3-DI-III and the TBSV-Blunt/FtsH-5-KpnI primer pairs. The FtsH insert is depicted in light
purple, primers are depicted in light blue and the DI sequence is red. Common restriction sites in the
construct are displayed were appropriate.
A ClustalX alignment was done (see Appendix 9.1), to compare the isolated sequences.
Interestingly, no deletions were found in the sequence which indicates that the primers
adopted for this experiment, selected specifically molecules carrying the complete FtsH
insert. One isolated sequence carried two single base pair substitutions in the FtsH fragment.
Since RNA dependent RNA polymerases have a high error frequency this was expected
because there is no selection pressure to maintain the original sequence.
6.3.18 Differences between TBSVDp19 and TBSVDDp19
The common consensus in the literature is that p19 is not necessary for efficient infection
with TBSV [Scholthof et al., 1995; Scholthof et al. 2, 1995]. However, we experienced
differences in the infection behavior of our p19 mutants. The severity of the symptoms varied
significantly from wild type to TBSVDp19 to TBSVDDp19. TBSVDDp19 for example did not
show any systemic symptoms, in 9 out of 10 infection experiments, when co-infected with
DI-RNA. However, if inoculated only with genomic viral RNA mild symptoms could be
observed after 10 days. RNA viruses have a high mutation rate thus it is possible that the
mutations that were introduced, reverted back to the original sequence. The 3' end of the viral
genome from TBSV, TBSVDp19, and TBSVDDp19 was isolated from infected N.
68
A c c IN c o I
E c o R IC l a I H i n d I I I
N c o IH i n c I I
H i n c I I
K p n IX h o I
S n a B IC f r 9 IS m a I
D IT B S V - B l u n tF t s H - 3 - E c o R I F t s H F t s H - 5 - K p n I D I 3 - D I - I I I
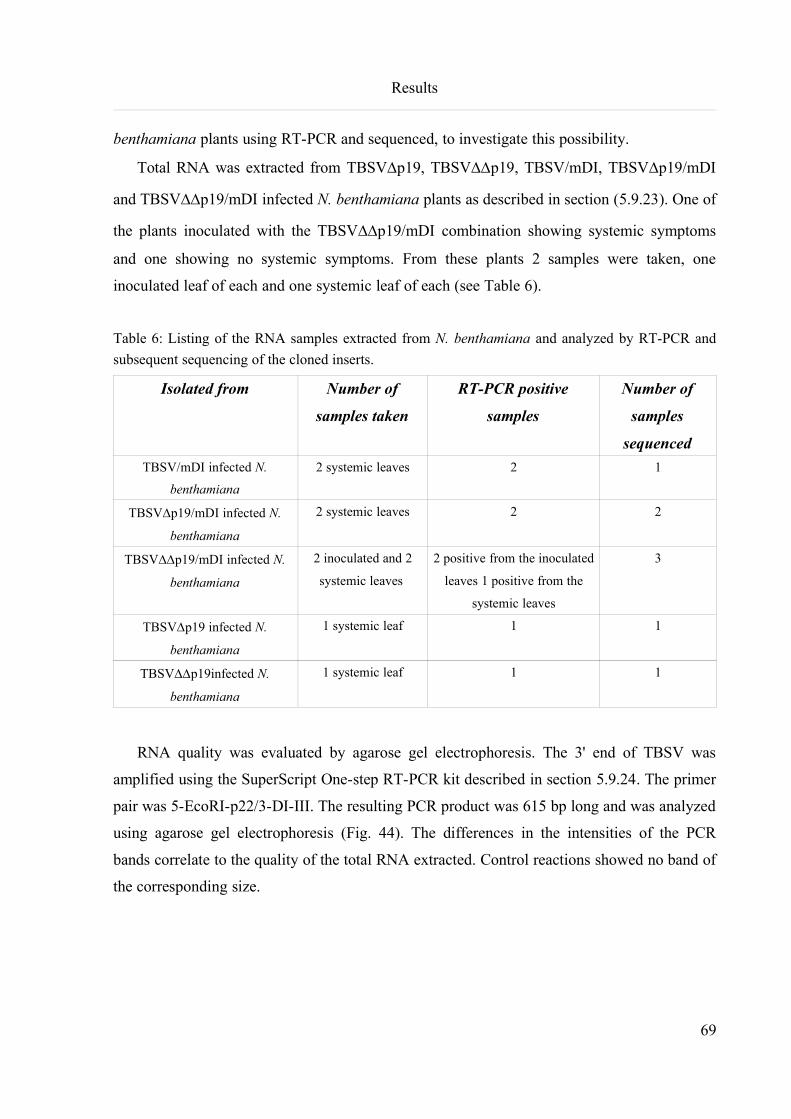
Results
benthamiana plants using RT-PCR and sequenced, to investigate this possibility.
Total RNA was extracted from TBSVDp19, TBSVDDp19, TBSV/mDI, TBSVDp19/mDI
and TBSVDDp19/mDI infected N. benthamiana plants as described in section (5.9.23). One of
the plants inoculated with the TBSVDDp19/mDI combination showing systemic symptoms
and one showing no systemic symptoms. From these plants 2 samples were taken, one
inoculated leaf of each and one systemic leaf of each (see Table 6).
Table 6: Listing of the RNA samples extracted from N. benthamiana and analyzed by RT-PCR and
subsequent sequencing of the cloned inserts.
Isolated from Number of
samples taken
RT-PCR positive
samples
Number of
samples
sequenced
TBSV/mDI infected N.
benthamiana
2 systemic leaves 2 1
TBSVDp19/mDI infected N.
benthamiana
2 systemic leaves 2 2
TBSVDDp19/mDI infected N.
benthamiana
2 inoculated and 2
systemic leaves
2 positive from the inoculated
leaves 1 positive from the
systemic leaves
3
TBSVDp19 infected N.
benthamiana
1 systemic leaf 1 1
TBSVDDp19infected N.
benthamiana
1 systemic leaf 1 1
RNA quality was evaluated by agarose gel electrophoresis. The 3' end of TBSV was
amplified using the SuperScript One-step RT-PCR kit described in section 5.9.24. The primer
pair was 5-EcoRI-p22/3-DI-III. The resulting PCR product was 615 bp long and was analyzed
using agarose gel electrophoresis (Fig. 44). The differences in the intensities of the PCR
bands correlate to the quality of the total RNA extracted. Control reactions showed no band of
the corresponding size.
69
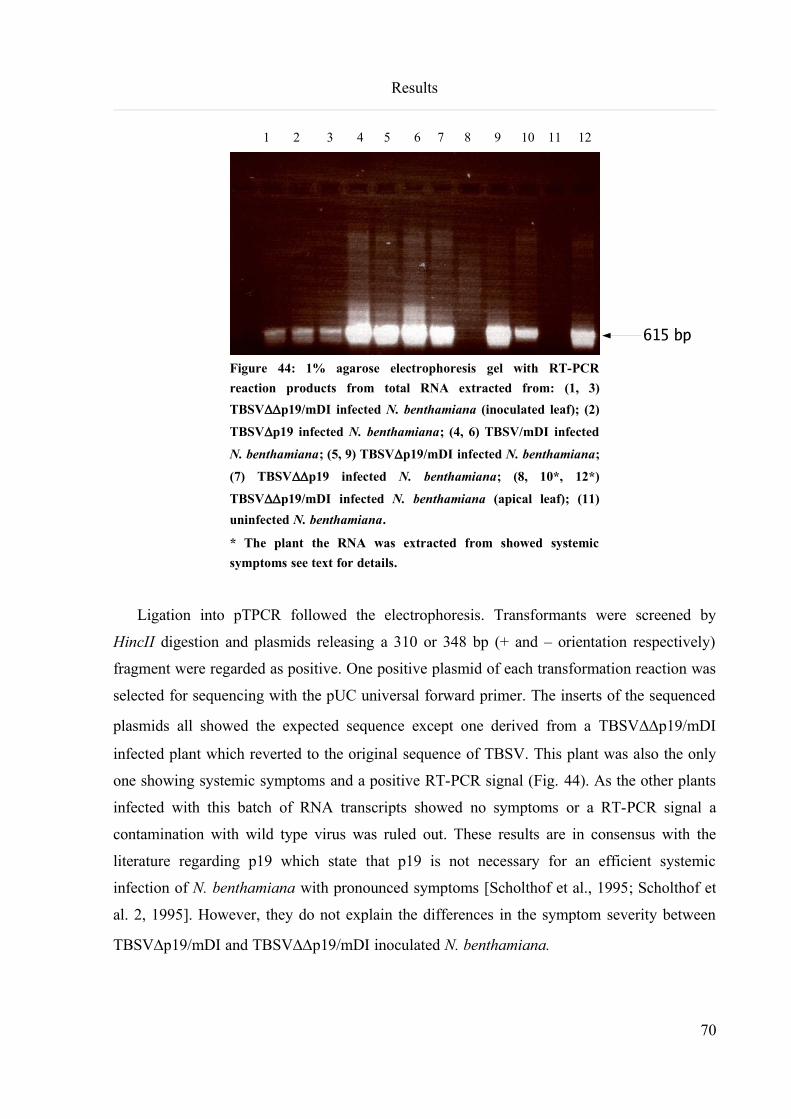
Results
1 2 3 4 5 6 7 8 9 10 11 12
Figure 44: 1% agarose electrophoresis gel with RT-PCR
reaction products from total RNA extracted from: (1, 3)
TBSVDDp19/mDI infected N. benthamiana (inoculated leaf); (2)
TBSVDp19 infected N. benthamiana; (4, 6) TBSV/mDI infected
N. benthamiana; (5, 9) TBSVDp19/mDI infected N. benthamiana;
(7) TBSVDDp19 infected N. benthamiana; (8, 10*, 12*)
TBSVDDp19/mDI infected N. benthamiana (apical leaf); (11)
uninfected N. benthamiana.
* The plant the RNA was extracted from showed systemic
symptoms see text for details.
Ligation into pTPCR followed the electrophoresis. Transformants were screened by
HincII digestion and plasmids releasing a 310 or 348 bp (+ and – orientation respectively)
fragment were regarded as positive. One positive plasmid of each transformation reaction was
selected for sequencing with the pUC universal forward primer. The inserts of the sequenced
plasmids all showed the expected sequence except one derived from a TBSVDDp19/mDI
infected plant which reverted to the original sequence of TBSV. This plant was also the only
one showing systemic symptoms and a positive RT-PCR signal (Fig. 44). As the other plants
infected with this batch of RNA transcripts showed no symptoms or a RT-PCR signal a
contamination with wild type virus was ruled out. These results are in consensus with the
literature regarding p19 which state that p19 is not necessary for an efficient systemic
infection of N. benthamiana with pronounced symptoms [Scholthof et al., 1995; Scholthof et
al. 2, 1995]. However, they do not explain the differences in the symptom severity between
TBSVDp19/mDI and TBSVDDp19/mDI inoculated N. benthamiana.
70
615 bp
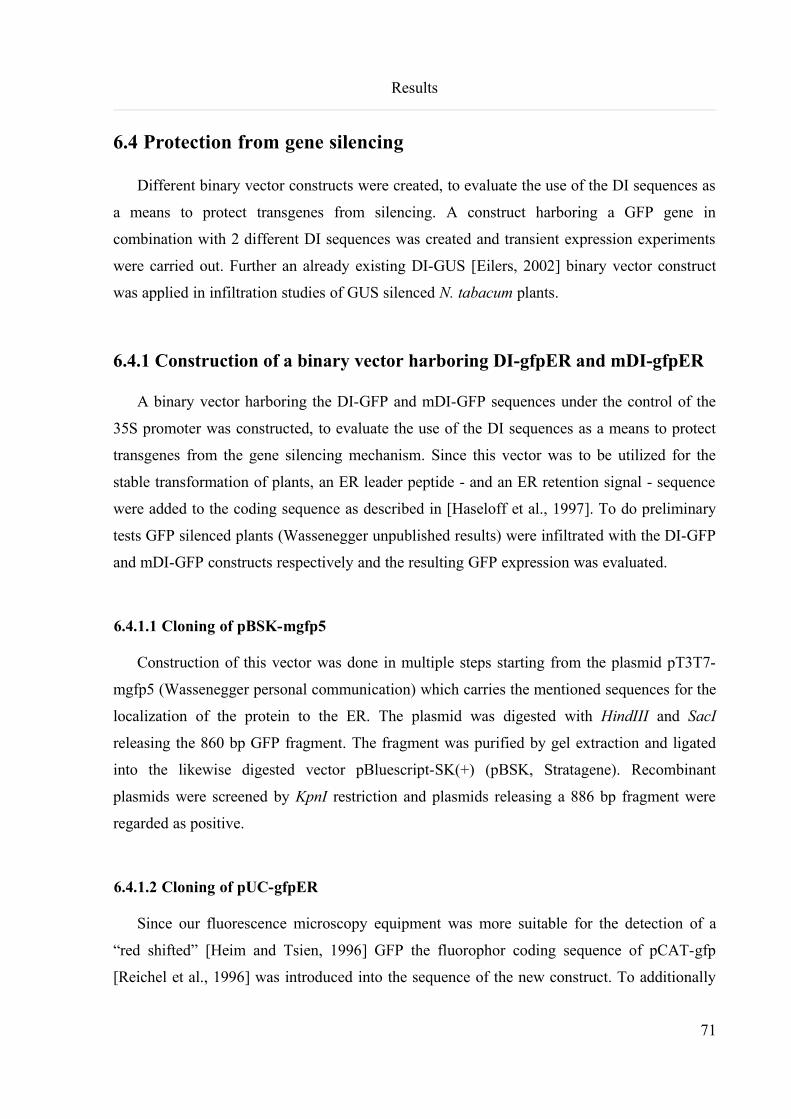
Results
6.4 Protection from gene silencing
Different binary vector constructs were created, to evaluate the use of the DI sequences as
a means to protect transgenes from silencing. A construct harboring a GFP gene in
combination with 2 different DI sequences was created and transient expression experiments
were carried out. Further an already existing DI-GUS [Eilers, 2002] binary vector construct
was applied in infiltration studies of GUS silenced N. tabacum plants.
6.4.1 Construction of a binary vector harboring DI-gfpER and mDI-gfpER
A binary vector harboring the DI-GFP and mDI-GFP sequences under the control of the
35S promoter was constructed, to evaluate the use of the DI sequences as a means to protect
transgenes from the gene silencing mechanism. Since this vector was to be utilized for the
stable transformation of plants, an ER leader peptide - and an ER retention signal - sequence
were added to the coding sequence as described in [Haseloff et al., 1997]. To do preliminary
tests GFP silenced plants (Wassenegger unpublished results) were infiltrated with the DI-GFP
and mDI-GFP constructs respectively and the resulting GFP expression was evaluated.
6.4.1.1 Cloning of pBSK-mgfp5
Construction of this vector was done in multiple steps starting from the plasmid pT3T7-
mgfp5 (Wassenegger personal communication) which carries the mentioned sequences for the
localization of the protein to the ER. The plasmid was digested with HindIII and SacI
releasing the 860 bp GFP fragment. The fragment was purified by gel extraction and ligated
into the likewise digested vector pBluescript-SK(+) (pBSK, Stratagene). Recombinant
plasmids were screened by KpnI restriction and plasmids releasing a 886 bp fragment were
regarded as positive.
6.4.1.2 Cloning of pUC-gfpER
Since our fluorescence microscopy equipment was more suitable for the detection of a
“red shifted” [Heim and Tsien, 1996] GFP the fluorophor coding sequence of pCAT-gfp
[Reichel et al., 1996] was introduced into the sequence of the new construct. To additionally
71
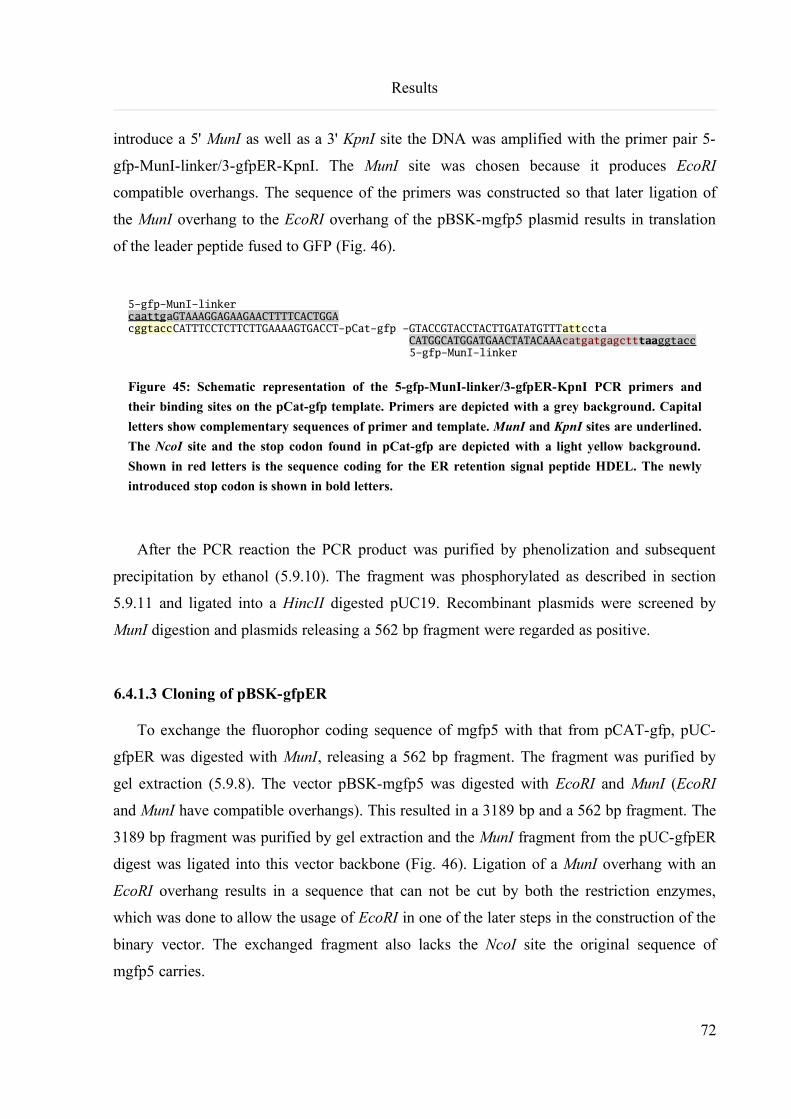
Results
introduce a 5' MunI as well as a 3' KpnI site the DNA was amplified with the primer pair 5-
gfp-MunI-linker/3-gfpER-KpnI. The MunI site was chosen because it produces EcoRI
compatible overhangs. The sequence of the primers was constructed so that later ligation of
the MunI overhang to the EcoRI overhang of the pBSK-mgfp5 plasmid results in translation
of the leader peptide fused to GFP (Fig. 46).
5-gfp-MunI-linkercaattgaGTAAAGGAGAAGAACTTTTCACTGGAcggtaccCATTTCCTCTTCTTGAAAAGTGACCT-pCat-gfp -GTACCGTACCTACTTGATATGTTTattccta CATGGCATGGATGAACTATACAAAcatgatgagctttaaggtacc
5-gfp-MunI-linker
Figure 45: Schematic representation of the 5-gfp-MunI-linker/3-gfpER-KpnI PCR primers and
their binding sites on the pCat-gfp template. Primers are depicted with a grey background. Capital
letters show complementary sequences of primer and template. MunI and KpnI sites are underlined.
The NcoI site and the stop codon found in pCat-gfp are depicted with a light yellow background.
Shown in red letters is the sequence coding for the ER retention signal peptide HDEL. The newly
introduced stop codon is shown in bold letters.
After the PCR reaction the PCR product was purified by phenolization and subsequent
precipitation by ethanol (5.9.10). The fragment was phosphorylated as described in section
5.9.11 and ligated into a HincII digested pUC19. Recombinant plasmids were screened by
MunI digestion and plasmids releasing a 562 bp fragment were regarded as positive.
6.4.1.3 Cloning of pBSK-gfpER
To exchange the fluorophor coding sequence of mgfp5 with that from pCAT-gfp, pUC-
gfpER was digested with MunI, releasing a 562 bp fragment. The fragment was purified by
gel extraction (5.9.8). The vector pBSK-mgfp5 was digested with EcoRI and MunI (EcoRI
and MunI have compatible overhangs). This resulted in a 3189 bp and a 562 bp fragment. The
3189 bp fragment was purified by gel extraction and the MunI fragment from the pUC-gfpER
digest was ligated into this vector backbone (Fig. 46). Ligation of a MunI overhang with an
EcoRI overhang results in a sequence that can not be cut by both the restriction enzymes,
which was done to allow the usage of EcoRI in one of the later steps in the construction of the
binary vector. The exchanged fragment also lacks the NcoI site the original sequence of
mgfp5 carries.
72
Results
Figure 46: Schematic representation of the cloning strategy applied to obtain the pBSK-gfpER plasmid.
(A) Digestion of pUC-gfpER with MunI yields the desired partial GFP fragment. (B) Digestion of pBSK-
mgfp5 with EcoRI/MunI yields the desired plasmid backbone. (C) Ligation of the two nucleic acids yields
the desired pBSK-gfpER construct. The GFP insert is depicted in light green, the leader peptide for the
localization to the ER and the T7 promoter of pBSK are depicted in light blue. Common restriction sites
in the construct are displayed were appropriate.
Recombinant plasmids were screened by PstI digestion and plasmids releasing a 289 bp
fragment were regarded as positive clones carrying the insert in the right orientation.
73
E c o R IK p n IS m a I
B a m H IX b a I
M u n IH a e I I
S n a B I H i n c I I M u n IK p n I
H i n d I I I
g f p
p a r t i a l g f p
M u n IH a e I I
S n a B I H i n c I I M u n I
p U C - g f p E R
H i n c I IH i n d I I I
S p h IH i n c I I
X b a IM u n IH i n c I IH a e I IN c o IE c o R IB a m H I
T 7m g f p 5l e a d e r p e p t i d e
E c o R IB a m H I
l e a d e r p e p t i d e
H i n d I I IS p h I
H i n c I IX b a IM u n I
T 7
H i n c I I
d i s c a r d
l i g a t e
K p n IS m a IB a m H I
H a e I IS n a B I
P m l IH i n c I I M u n I P v u I I
X b a IH i n c I I
S p h IH i n d I I I
H i n c I IX h o I
K p n I
g f p E RT 7
l e a d e r p e p t i d e
p B S K - m g f p 5
p B S K - g f p E R
( A )
( B )
( C )
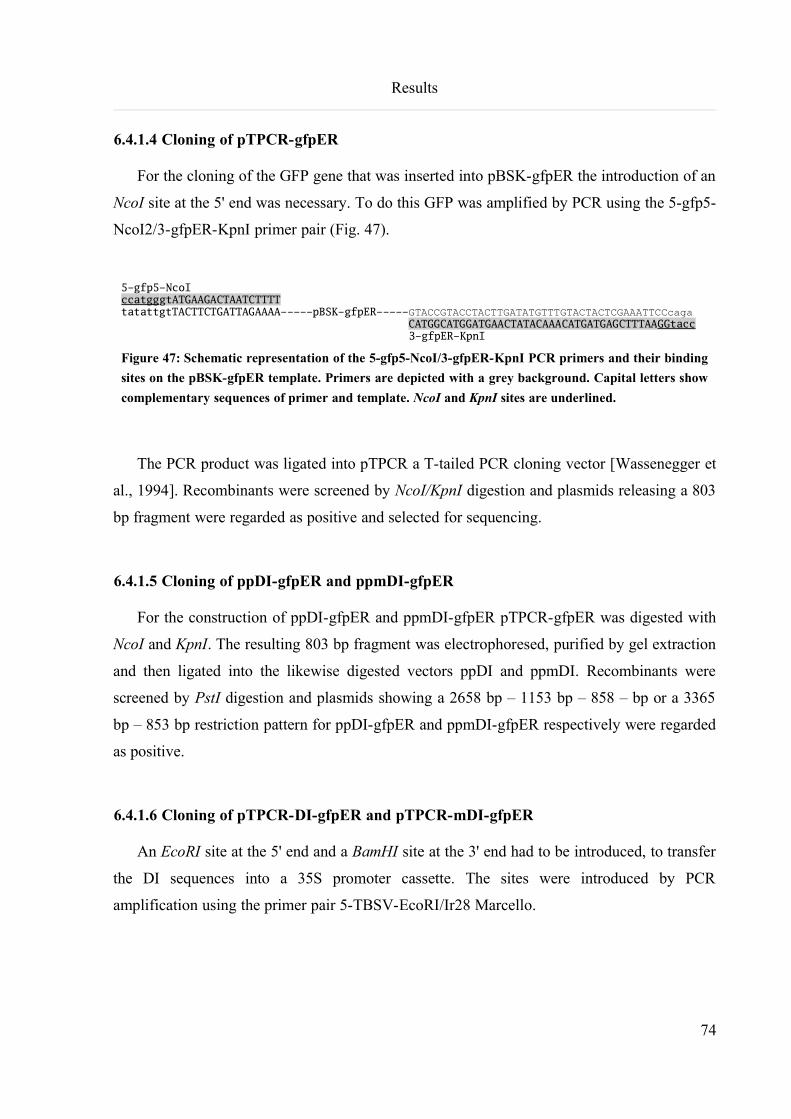
Results
6.4.1.4 Cloning of pTPCR-gfpER
For the cloning of the GFP gene that was inserted into pBSK-gfpER the introduction of an
NcoI site at the 5' end was necessary. To do this GFP was amplified by PCR using the 5-gfp5-
NcoI2/3-gfpER-KpnI primer pair (Fig. 47).
5-gfp5-NcoIccatgggtATGAAGACTAATCTTTTtatattgtTACTTCTGATTAGAAAA-----pBSK-gfpER-----GTACCGTACCTACTTGATATGTTTGTACTACTCGAAATTCCcaga CATGGCATGGATGAACTATACAAACATGATGAGCTTTAAGGtacc
3-gfpER-KpnI
Figure 47: Schematic representation of the 5-gfp5-NcoI/3-gfpER-KpnI PCR primers and their binding
sites on the pBSK-gfpER template. Primers are depicted with a grey background. Capital letters show
complementary sequences of primer and template. NcoI and KpnI sites are underlined.
The PCR product was ligated into pTPCR a T-tailed PCR cloning vector [Wassenegger et
al., 1994]. Recombinants were screened by NcoI/KpnI digestion and plasmids releasing a 803
bp fragment were regarded as positive and selected for sequencing.
6.4.1.5 Cloning of ppDI-gfpER and ppmDI-gfpER
For the construction of ppDI-gfpER and ppmDI-gfpER pTPCR-gfpER was digested with
NcoI and KpnI. The resulting 803 bp fragment was electrophoresed, purified by gel extraction
and then ligated into the likewise digested vectors ppDI and ppmDI. Recombinants were
screened by PstI digestion and plasmids showing a 2658 bp – 1153 bp – 858 – bp or a 3365
bp – 853 bp restriction pattern for ppDI-gfpER and ppmDI-gfpER respectively were regarded
as positive.
6.4.1.6 Cloning of pTPCR-DI-gfpER and pTPCR-mDI-gfpER
An EcoRI site at the 5' end and a BamHI site at the 3' end had to be introduced, to transfer
the DI sequences into a 35S promoter cassette. The sites were introduced by PCR
amplification using the primer pair 5-TBSV-EcoRI/Ir28 Marcello.
74
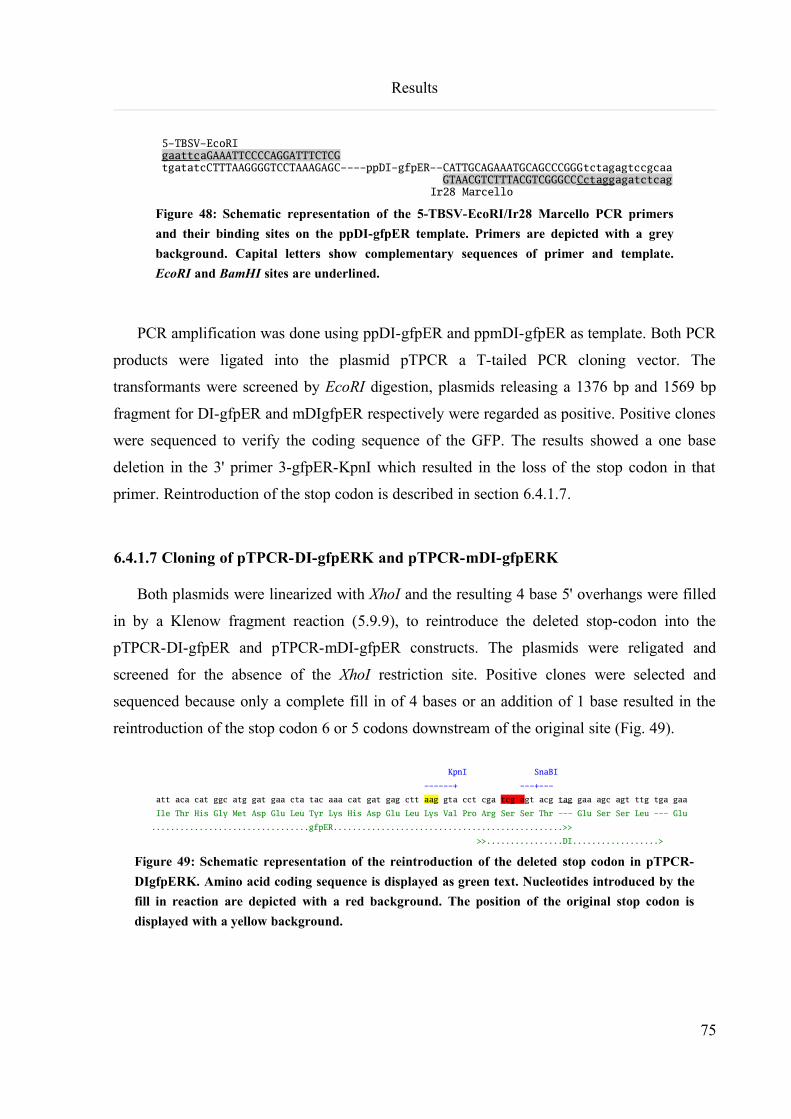
Results
5-TBSV-EcoRI gaattcaGAAATTCCCCAGGATTTCTCG tgatatcCTTTAAGGGGTCCTAAAGAGC----ppDI-gfpER--CATTGCAGAAATGCAGCCCGGGtctagagtccgcaa GTAACGTCTTTACGTCGGGCCCct agg agatctcag
Ir28 Marcello
Figure 48: Schematic representation of the 5-TBSV-EcoRI/Ir28 Marcello PCR primers
and their binding sites on the ppDI-gfpER template. Primers are depicted with a grey
background. Capital letters show complementary sequences of primer and template.
EcoRI and BamHI sites are underlined.
PCR amplification was done using ppDI-gfpER and ppmDI-gfpER as template. Both PCR
products were ligated into the plasmid pTPCR a T-tailed PCR cloning vector. The
transformants were screened by EcoRI digestion, plasmids releasing a 1376 bp and 1569 bp
fragment for DI-gfpER and mDIgfpER respectively were regarded as positive. Positive clones
were sequenced to verify the coding sequence of the GFP. The results showed a one base
deletion in the 3' primer 3-gfpER-KpnI which resulted in the loss of the stop codon in that
primer. Reintroduction of the stop codon is described in section 6.4.1.7.
6.4.1.7 Cloning of pTPCR-DI-gfpERK and pTPCR-mDI-gfpERK
Both plasmids were linearized with XhoI and the resulting 4 base 5' overhangs were filled
in by a Klenow fragment reaction (5.9.9), to reintroduce the deleted stop-codon into the
pTPCR-DI-gfpER and pTPCR-mDI-gfpER constructs. The plasmids were religated and
screened for the absence of the XhoI restriction site. Positive clones were selected and
sequenced because only a complete fill in of 4 bases or an addition of 1 base resulted in the
reintroduction of the stop codon 6 or 5 codons downstream of the original site (Fig. 49).
KpnI SnaBI
------+ ---+---
att aca cat ggc atg gat gaa cta tac aaa cat gat gag ctt aag gta cct cga tcg agt acg tag gaa agc agt ttg tga gaa
Ile Thr His Gly Met Asp Glu Leu Tyr Lys His Asp Glu Leu Lys Val Pro Arg Ser Ser Thr --- Glu Ser Ser Leu --- Glu
.................................gfpER................................................>>
>>................DI..................>
Figure 49: Schematic representation of the reintroduction of the deleted stop codon in pTPCR-
DIgfpERK. Amino acid coding sequence is displayed as green text. Nucleotides introduced by the
fill in reaction are depicted with a red background. The position of the original stop codon is
displayed with a yellow background.
75
Results
For both constructs positive clones were found, the plasmids were named pTPCR-
DIgfpERK and pTPCR-mDIgfpERK respectively to differentiate between constructs without
stop codon. The next cloning steps were carried out with the “K” constructs.
6.4.1.8 Transfer of DI-gfpERK and mDI-gfpERK constructs into 35S promoter cassette
The pTPCR-DI-gfpERK and pTPCR-mDI-gfpERK plasmids were digested with EcoRI
and BamHI and the desired fragment purified by agarose gel extraction (5.9.8), to clone the
DI-gfpERK and mDI-gfpERK constructs into 35S promoter cassette. Ligation of the purified
fragment into the likewise digested pRT101 [Töpfer et al., 1987] yielded the pRT-DI-gfpERK
and pRT-mDI-gfpERK constructs. Transformants were screened by PstI digestion and
plasmids having a 2.6 – 1.1 – 1.0 – kb (mDI construct) and a 2.6 – 1.1 – 0.8 kb(DI construct)
band pattern were regraded as positive.
6.4.1.9 Cloning of pGJ-DI-gfpER and pGJ-mDI-gfpER
The final step in the construction of the binary vector was the insertion of the 35S-
DIgfpERK construct into the pGJ357 plasmid, a ppzp200 [Hajdukiewicz et al., 1994] based
binary vector harboring a kanamycin resistance gene. The promoter cassette containing the DI
and mDI constructs was released from the pRT101 plasmid by digestion with HindIII. The
fragment was purified and ligated into, the likewise digested and dephosphorylated, pGJ357.
Recombinant plasmids, pGJ-mDIgfpERK and pGJ-DIgfpERK, were screened by digestion
with EcoRI and plasmids releasing a 2.3 kb fragment were selected as positive clones with the
“right” (head to head) orientation.
With plasmid DNA purified from positive E. coli clones, Agrobacterium tumefaciens,
strain ATHV, was transformed by electroporation (5.9.17). Verified transformants were used
in Agrobacterium tumefaciens infiltration experiments.
76
Results
6.4.2 Agroinfiltration for transient expression of GFP constructs on N.
benthamiana
N. benthamiana plants were agroinfiltrated with ATHV bacteria carrying the pGJ-
mDIgfpERK and pGJ-DIgfpERK constructs to evaluate the GFP expression of the 2
plasmids. As control plants were infiltrated with pGJ-gfp, a binary vector construct based on
pGJ357 harboring a GFP gene under the control of an enhanced 35S promoter, as described
preciously [Reichel et al., 1996]. After 3 days the plants were visually examined with the
fluorescence microscope. Both DI constructs showed no GFP fluorescence which was readily
detectable in the pGJ-gfp infiltrated plants. Therefore it was decided not to generate stable
transformants using the DI and mDI GFP constructs.
6.4.3 Agroinfiltration for transient expression of GUS constructs on N.
tabacum and GUS silenced N. tabacum
N. tabacum plants were agroinfiltrated (5.12) with ATHV bacteria carrying the pBar-
DIGUSInt and pGJ-GUSInt constructs to evaluate the GUS expression of the 2 plasmids.
After 5 days, histochemical GUS staining was performed (5.10.1). Both constructs showed
GUS expression in N. tabacum (Fig. 50 (A) and (C)) and were utilized for further infiltration
experiments with GUS silenced N. tabacum. GUS staining of non infiltrated wild type N.
tabacum and the silenced N. tabacum plants did not exhibit GUS expression.
Further infiltration experiments were done with GUS silenced N. tabacum plants
(Wassenegger, personal communication). Histochemical GUS staining was performed one dpi
and five dpi. Leaves stained one dpi did not exhibit GUS expression (data not shown). The
resulting GUS stained leaves, which were stained five dpi, can be seen in Figure 50.
77
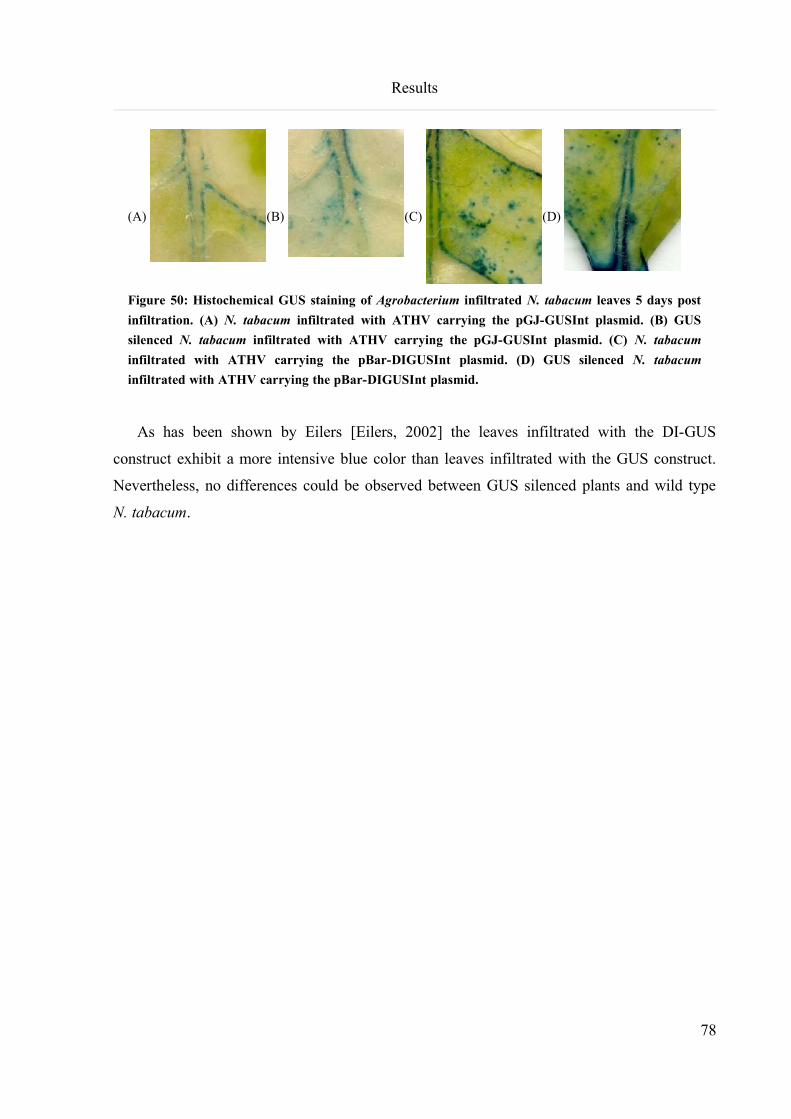
Results
(A) (B) (C) (D)
Figure 50: Histochemical GUS staining of Agrobacterium infiltrated N. tabacum leaves 5 days post
infiltration. (A) N. tabacum infiltrated with ATHV carrying the pGJ-GUSInt plasmid. (B) GUS
silenced N. tabacum infiltrated with ATHV carrying the pGJ-GUSInt plasmid. (C) N. tabacum
infiltrated with ATHV carrying the pBar-DIGUSInt plasmid. (D) GUS silenced N. tabacum
infiltrated with ATHV carrying the pBar-DIGUSInt plasmid.
As has been shown by Eilers [Eilers, 2002] the leaves infiltrated with the DI-GUS
construct exhibit a more intensive blue color than leaves infiltrated with the GUS construct.
Nevertheless, no differences could be observed between GUS silenced plants and wild type
N. tabacum.
78
Discussion
7 Discussion
Functionality of the viral replicase
The in trans complementation system utilizing a replicase deficient mutant of tomato
bushy stunt virus (TBSV-M) was able to prove the functionality of the transgenically
expressed replicase (biological assay). However, the system was not able to give an indication
of the level of activity of the heterologous protein (biological assay). The number of plants
susceptible to the mutant virus varied among different experiments and showed only mild
viral infection symptoms. The infection however did not result in lethal necrosis as with the
wild type virus. The lack of lethal necrosis could be a result of silencing effects due to the
presence of the viral replicase in the plant genome. Indication for this was that the plants only
showed mild viral symptoms and recovered from the infection after the initial appearance of
systemic symptoms.
Earlier studies conducted in our institute [Boonrod et al., 2005] showed that viral RNA,
isolated from replicase expressing TR4 plants showing mild viral symptoms upon infection
with TBSV-M, possessed mutations restoring the replicase activity. These mutations could
only be the result of an active viral replicase present in these plants, since wild type N.
benthamiana did not show any infection symptoms. This suggests that the replicase expressed
in the TR4 plants is active and replicates the viral genome. However, for an efficient infection
the viral replicase needs to be expressed from the viral genome. Therefore, only plants which
altered the viral genome to produce a functional replicase showed viral symptoms. The
different infection ratios of the inoculation experiments (section 6.1) can be explained by this
phenomenon because the successful infection depended on random errors made by the
transgenic replicase. Although the activity of the recombinant replicase expressed in the TR4
plants was low it was assumed the activity was sufficient for the replication of the DI-RNA
for protein expression and the induction of gene silencing.
Protein expression utilizing the DI vector system
In the conducted protein expression studies (section 6.2) no protein could be detected
regardless of the gene or the source of the replicase (transgenic expression or helper virus).
Reporter genes of different sizes were inserted in the vector to exclude the possibility of size
79
Discussion
constraints of the DI vector [Scholthof, 1999]. The reporter genes (GFP, GUS and scFv) had
been previously expressed in plants [Meinke et al., 1994] and thus the possibility of a general
expression problem with those genes was unlikely.
Furthermore, experiments with several homologous viral genes were not successful,
although expression of viral proteins from DI-RNAs has previously been reported for
cymbidium ringspot tombusvirus [Burgyán et al., 1994]. Homologous viral genes like the coat
protein were utilized to minimize the possibility of negative effects of the RNA secondary
structure which might have the potential to interfere with DI-RNA replication. The failure to
detect the viral coat protein might be explained by the assay that was applied to detect this
protein. Burgyán and coworkers [Burgyán et al., 1994] detected the coat protein by western
blot analysis which was not possible in this work because no TBSV coat protein antibodies
were available. The ELISA adopted in this work can only detect viral particles not the
monomeric coat protein. The assembly of the viral particles is dependent on several factors
and the lack of a coat protein gene can not easily be compensated in trans [Burgyán et al.,
1994]. The authors state that they were unable to detect viral particles if a virus mutant was
used as helper virus which had large deletions in the coat protein gene. However, utilization
of a different mutant, carrying only point mutations in the coat protein gene which render the
protein translated from the genome unable to form viral particles, resulted in the formation of
detectable viral particles.
Therefore, it is possible that the coat protein was expressed but our detection assays were
not sensitive enough. However, as the aim of the project was to produce large amounts of
protein a more sensitive method was not desired.
Replication of DI RNA
Previous publications [Kollár and Burgyán, 1994; Burgyán et al., 1994] demonstrated the
instability of some DI/insert combinations. Consequently, replication of our DI constructs was
analyzed by different methods to investigate the general ability of the DI to replicate and the
possible instabilities of the inserts. Northern analysis of TBSV/DI inoculated wild type N.
benthamiana with a virus specific probe, failed to detect the replication of the DI-RNA. The
helper virus also hybridized with the DI-probe and caused a background signal which made it
impossible to distinguish between the DI and the viral background. With a scFv specific
80
Discussion
probe no signal could be detected in samples taken from DI-ScFv inoculated plants after the
first day post inoculation (dpi). Two possible reasons were considered:
(a) No replication occurred. If so, the signal from the first day would have originated from
the inoculum.
(b) The scFv insert was unstable during replication and thus the DIG labeled scFv specific
primer was unable to detect the RNA. As the length of the labeled primer was only 20
bp, a deletion of the homologous sequence can not excluded.
Indeed, subsequent Northern blot experiments with a DI-FtsH RNA, demonstrated that
the insert is gradually deleted from the DI and that only a small portion of the DI-RNA retains
the complete insert (Fig. 42). They additionally showed that the DI-RNA moves systemically
throughout the plant.
A different system had to be adopted to eliminate the viral background signal and to
further analyze the replication of the DI-RNA. Protoplasts isolated from TR4 plants were
chosen because they should be able to replicate the DI-RNA without helper virus. The
replication can be detected even though the DI-RNA can not move systemically which was
not possible in TR4 plants. This method made it possible to monitor the replication without
interference of the parental virus and was described previously [Kollár and Burgyán, 1994].
Protoplast transfection experiments prove that the transgenically expressed replicase
replicates two of the DI-RNA constructs. For both of these RNAs a band of the corresponding
size could be detected in samples taken from protoplasts 24 h after transfection confirming
that the RNAs were amplified by the replicase. However, not all the DI constructs were able
to replicate. DI-gfp was not detectable after 24 h which could have several reasons like
instability of the insert [Scholthof, 1999] or the formation of a secondary RNA structure
inhibiting the replication.
Translation of DI-RNA
Since the replication of the DI-RNA constructs and the stability of inserts was not the
limitation of our system in all cases, it was assumed that translation of the DI-RNA could be
an obstacle. White and coworkers [Wu and White, 1999; Fabian and White, 2004] found that
81
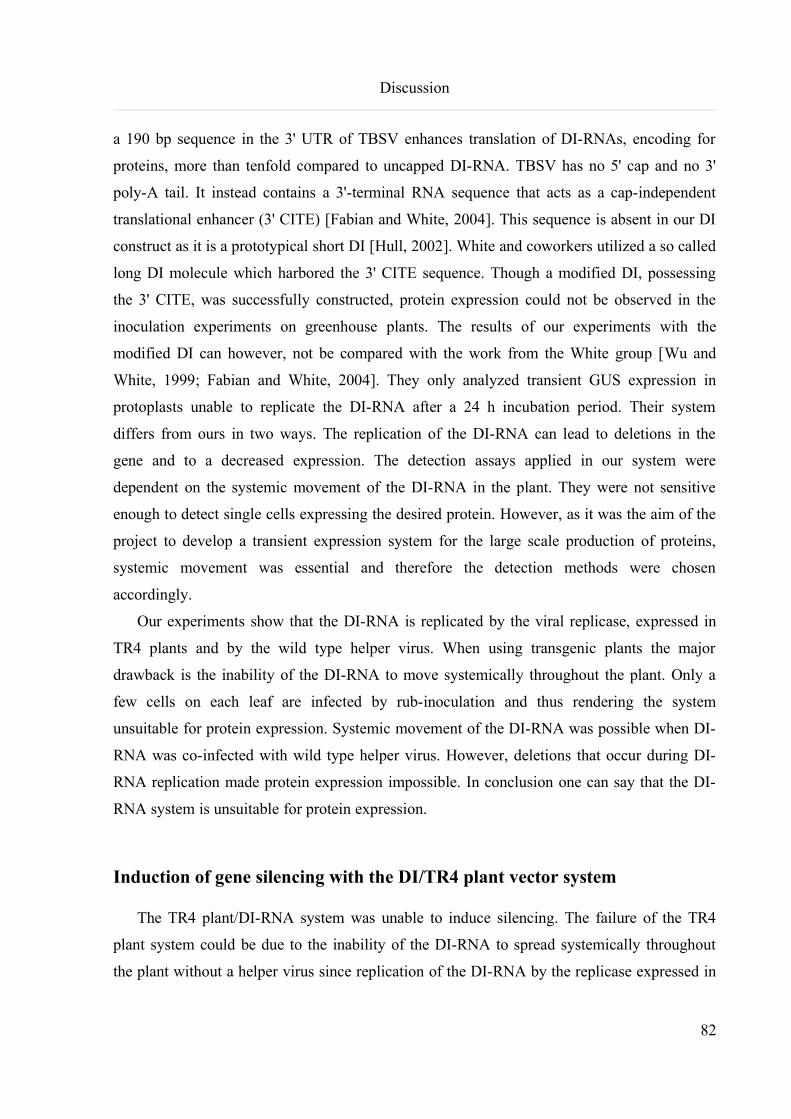
Discussion
a 190 bp sequence in the 3' UTR of TBSV enhances translation of DI-RNAs, encoding for
proteins, more than tenfold compared to uncapped DI-RNA. TBSV has no 5' cap and no 3'
poly-A tail. It instead contains a 3'-terminal RNA sequence that acts as a cap-independent
translational enhancer (3' CITE) [Fabian and White, 2004]. This sequence is absent in our DI
construct as it is a prototypical short DI [Hull, 2002]. White and coworkers utilized a so called
long DI molecule which harbored the 3' CITE sequence. Though a modified DI, possessing
the 3' CITE, was successfully constructed, protein expression could not be observed in the
inoculation experiments on greenhouse plants. The results of our experiments with the
modified DI can however, not be compared with the work from the White group [Wu and
White, 1999; Fabian and White, 2004]. They only analyzed transient GUS expression in
protoplasts unable to replicate the DI-RNA after a 24 h incubation period. Their system
differs from ours in two ways. The replication of the DI-RNA can lead to deletions in the
gene and to a decreased expression. The detection assays applied in our system were
dependent on the systemic movement of the DI-RNA in the plant. They were not sensitive
enough to detect single cells expressing the desired protein. However, as it was the aim of the
project to develop a transient expression system for the large scale production of proteins,
systemic movement was essential and therefore the detection methods were chosen
accordingly.
Our experiments show that the DI-RNA is replicated by the viral replicase, expressed in
TR4 plants and by the wild type helper virus. When using transgenic plants the major
drawback is the inability of the DI-RNA to move systemically throughout the plant. Only a
few cells on each leaf are infected by rub-inoculation and thus rendering the system
unsuitable for protein expression. Systemic movement of the DI-RNA was possible when DI-
RNA was co-infected with wild type helper virus. However, deletions that occur during DI-
RNA replication made protein expression impossible. In conclusion one can say that the DI-
RNA system is unsuitable for protein expression.
Induction of gene silencing with the DI/TR4 plant vector system
The TR4 plant/DI-RNA system was unable to induce silencing. The failure of the TR4
plant system could be due to the inability of the DI-RNA to spread systemically throughout
the plant without a helper virus since replication of the DI-RNA by the replicase expressed in
82
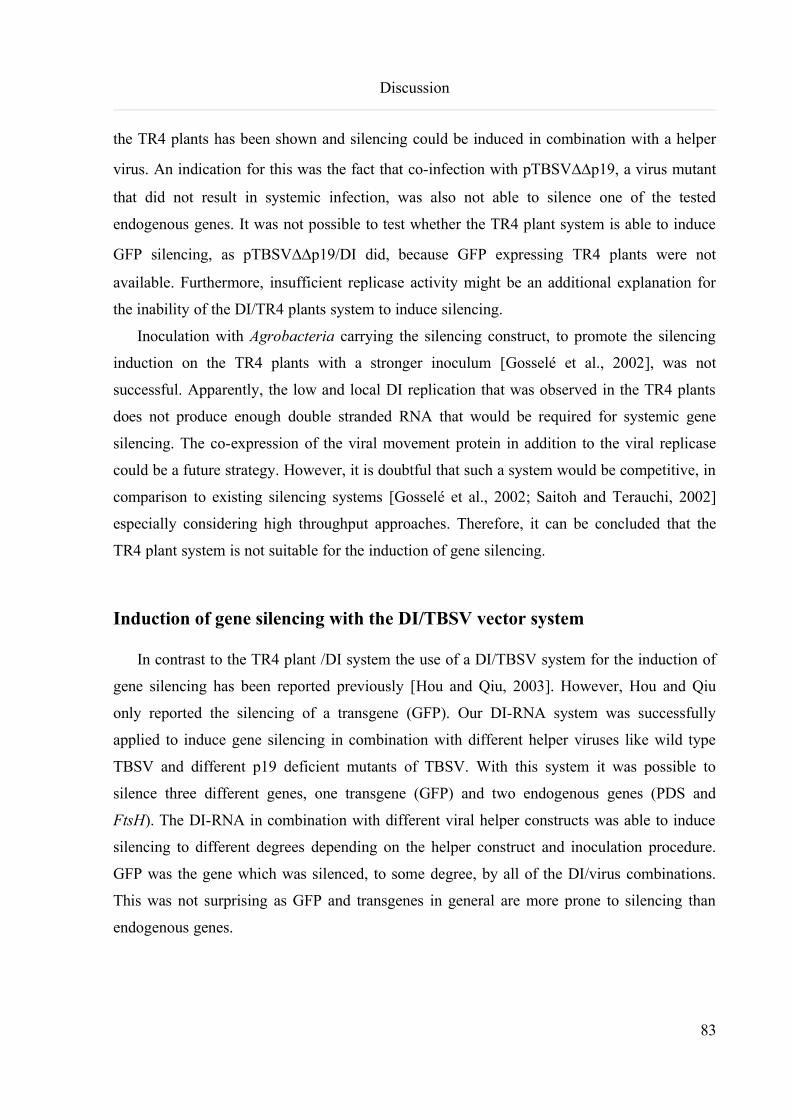
Discussion
the TR4 plants has been shown and silencing could be induced in combination with a helper
virus. An indication for this was the fact that co-infection with pTBSVDDp19, a virus mutant
that did not result in systemic infection, was also not able to silence one of the tested
endogenous genes. It was not possible to test whether the TR4 plant system is able to induce
GFP silencing, as pTBSVDDp19/DI did, because GFP expressing TR4 plants were not
available. Furthermore, insufficient replicase activity might be an additional explanation for
the inability of the DI/TR4 plants system to induce silencing.
Inoculation with Agrobacteria carrying the silencing construct, to promote the silencing
induction on the TR4 plants with a stronger inoculum [Gosselé et al., 2002], was not
successful. Apparently, the low and local DI replication that was observed in the TR4 plants
does not produce enough double stranded RNA that would be required for systemic gene
silencing. The co-expression of the viral movement protein in addition to the viral replicase
could be a future strategy. However, it is doubtful that such a system would be competitive, in
comparison to existing silencing systems [Gosselé et al., 2002; Saitoh and Terauchi, 2002]
especially considering high throughput approaches. Therefore, it can be concluded that the
TR4 plant system is not suitable for the induction of gene silencing.
Induction of gene silencing with the DI/TBSV vector system
In contrast to the TR4 plant /DI system the use of a DI/TBSV system for the induction of
gene silencing has been reported previously [Hou and Qiu, 2003]. However, Hou and Qiu
only reported the silencing of a transgene (GFP). Our DI-RNA system was successfully
applied to induce gene silencing in combination with different helper viruses like wild type
TBSV and different p19 deficient mutants of TBSV. With this system it was possible to
silence three different genes, one transgene (GFP) and two endogenous genes (PDS and
FtsH). The DI-RNA in combination with different viral helper constructs was able to induce
silencing to different degrees depending on the helper construct and inoculation procedure.
GFP was the gene which was silenced, to some degree, by all of the DI/virus combinations.
This was not surprising as GFP and transgenes in general are more prone to silencing than
endogenous genes.
83
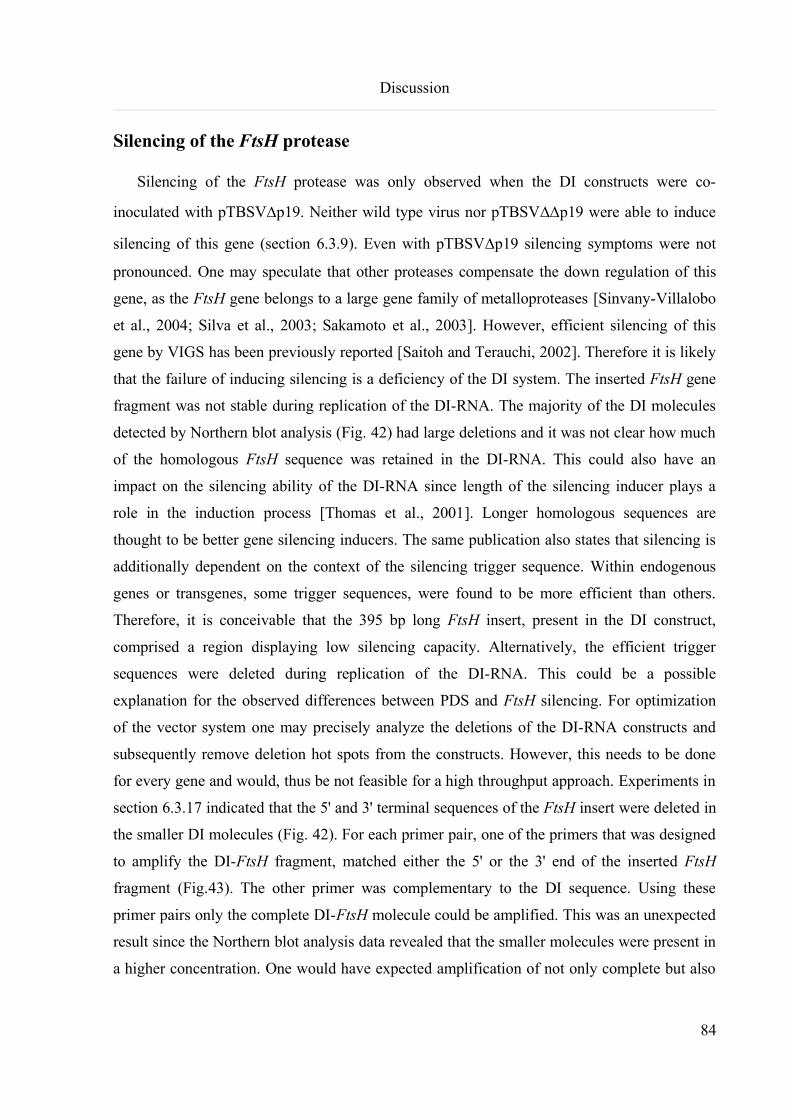
Discussion
Silencing of the FtsH protease
Silencing of the FtsH protease was only observed when the DI constructs were co-
inoculated with pTBSVDp19. Neither wild type virus nor pTBSVDDp19 were able to induce
silencing of this gene (section 6.3.9). Even with pTBSVDp19 silencing symptoms were not
pronounced. One may speculate that other proteases compensate the down regulation of this
gene, as the FtsH gene belongs to a large gene family of metalloproteases [Sinvany-Villalobo
et al., 2004; Silva et al., 2003; Sakamoto et al., 2003]. However, efficient silencing of this
gene by VIGS has been previously reported [Saitoh and Terauchi, 2002]. Therefore it is likely
that the failure of inducing silencing is a deficiency of the DI system. The inserted FtsH gene
fragment was not stable during replication of the DI-RNA. The majority of the DI molecules
detected by Northern blot analysis (Fig. 42) had large deletions and it was not clear how much
of the homologous FtsH sequence was retained in the DI-RNA. This could also have an
impact on the silencing ability of the DI-RNA since length of the silencing inducer plays a
role in the induction process [Thomas et al., 2001]. Longer homologous sequences are
thought to be better gene silencing inducers. The same publication also states that silencing is
additionally dependent on the context of the silencing trigger sequence. Within endogenous
genes or transgenes, some trigger sequences, were found to be more efficient than others.
Therefore, it is conceivable that the 395 bp long FtsH insert, present in the DI construct,
comprised a region displaying low silencing capacity. Alternatively, the efficient trigger
sequences were deleted during replication of the DI-RNA. This could be a possible
explanation for the observed differences between PDS and FtsH silencing. For optimization
of the vector system one may precisely analyze the deletions of the DI-RNA constructs and
subsequently remove deletion hot spots from the constructs. However, this needs to be done
for every gene and would, thus be not feasible for a high throughput approach. Experiments in
section 6.3.17 indicated that the 5' and 3' terminal sequences of the FtsH insert were deleted in
the smaller DI molecules (Fig. 42). For each primer pair, one of the primers that was designed
to amplify the DI-FtsH fragment, matched either the 5' or the 3' end of the inserted FtsH
fragment (Fig.43). The other primer was complementary to the DI sequence. Using these
primer pairs only the complete DI-FtsH molecule could be amplified. This was an unexpected
result since the Northern blot analysis data revealed that the smaller molecules were present in
a higher concentration. One would have expected amplification of not only complete but also
84
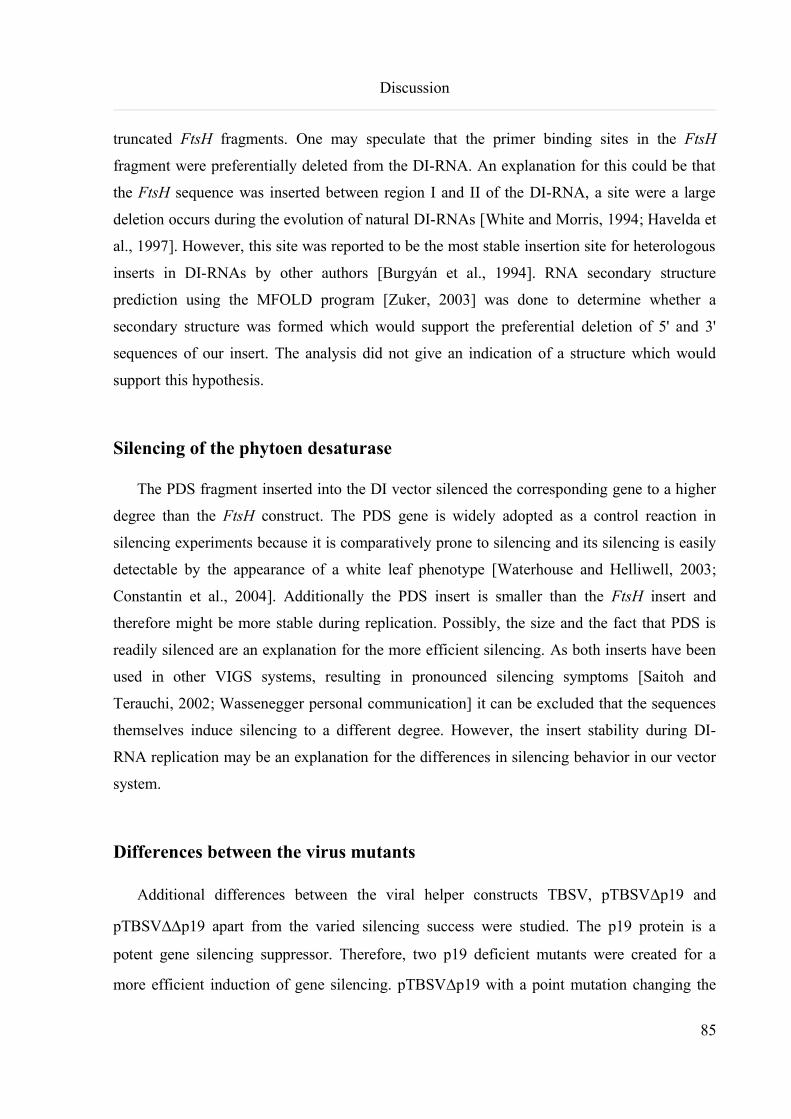
Discussion
truncated FtsH fragments. One may speculate that the primer binding sites in the FtsH
fragment were preferentially deleted from the DI-RNA. An explanation for this could be that
the FtsH sequence was inserted between region I and II of the DI-RNA, a site were a large
deletion occurs during the evolution of natural DI-RNAs [White and Morris, 1994; Havelda et
al., 1997]. However, this site was reported to be the most stable insertion site for heterologous
inserts in DI-RNAs by other authors [Burgyán et al., 1994]. RNA secondary structure
prediction using the MFOLD program [Zuker, 2003] was done to determine whether a
secondary structure was formed which would support the preferential deletion of 5' and 3'
sequences of our insert. The analysis did not give an indication of a structure which would
support this hypothesis.
Silencing of the phytoen desaturase
The PDS fragment inserted into the DI vector silenced the corresponding gene to a higher
degree than the FtsH construct. The PDS gene is widely adopted as a control reaction in
silencing experiments because it is comparatively prone to silencing and its silencing is easily
detectable by the appearance of a white leaf phenotype [Waterhouse and Helliwell, 2003;
Constantin et al., 2004]. Additionally the PDS insert is smaller than the FtsH insert and
therefore might be more stable during replication. Possibly, the size and the fact that PDS is
readily silenced are an explanation for the more efficient silencing. As both inserts have been
used in other VIGS systems, resulting in pronounced silencing symptoms [Saitoh and
Terauchi, 2002; Wassenegger personal communication] it can be excluded that the sequences
themselves induce silencing to a different degree. However, the insert stability during DI-
RNA replication may be an explanation for the differences in silencing behavior in our vector
system.
Differences between the virus mutants
Additional differences between the viral helper constructs TBSV, pTBSVDp19 and
pTBSVDDp19 apart from the varied silencing success were studied. The p19 protein is a
potent gene silencing suppressor. Therefore, two p19 deficient mutants were created for a
more efficient induction of gene silencing. pTBSVDp19 with a point mutation changing the
85
Discussion
ATG start codon to a CTG and pTBSVDDp19 with three further mutations introducing two
stop codons and one amino acid exchange approximately 200 bp downstream of the start
codon. The p19 ORF is situated within the ORF of p22 (Fig. 3). p22 is essential for systemic
infection of plants. Mutations had to be designed in such a way that the amino acid sequence
of p22 remained unchanged. Variations between the wild type virus and the two p19 deficient
mutants were expected [Hou and Qiu, 2003; Qu and Morris, 2002; Qiu et al., 2002] due to
the lack of p19 expression. However, differences between the two p19 mutants were
surprising since both were unable to express p19. pTBSVDp19 showed systemic symptoms 2-
3 days before pTBSVDDp19 when inoculated without DI transcripts. When inoculated with
DI transcripts, pTBSVDDp19 was not able to infect the plants systemically. An attempt to
explain this phenomenon was done and the codon usage of p22 in the two mutants was
analyzed. However, the codon usage of both mutants does not differ significantly compared to
the average for higher plants or to highly expressed plant genes [Murray et al., 1989].
Therefore, the phenomenon seems to be related directly to the RNA sequence of the
constructs. Until now no secondary RNA structure elements have been reported involving the
region of the second mutation in p19 (~200bp downstream of the 5' end of sgRNA2) [Fabian
and White, 2004]. Results concerning the necessary RNA/RNA interactions to initiate
translation of sgRNA2 postulate that the interactions involved are between 5' and 3' end of the
sgRNA2 and not the mutated region.
The disposition of RNA virus replicases to a high mutation rate during replication could
be an alternative explanation [Hull, 2002]. It enables the viruses to revert to a functional
sequence as demonstrated by Boonrod and coworkers [Boonrod et al., 2005] for viral
replicase mutants. This ability of RNA viruses was the reason for the construction of the
pTBSVDDp19 mutant. The second mutation at a different position decreasing the possibility
of reverting to a functional sequence. Nevertheless, it was decided to further investigate this
difference in infection behavior. The possibility that the pTBSVDp19 mutant reverted to its
original sequence and therefore exhibited a different infection behavior was investigated by
isolating RNA from infected plants, reverse transcribing the RNA into DNA, amplifying and
cloning the DNA into a suitable vector for sequencing. The sequencing results showed that
the mutations were stable and no reversions occurred. Consequently, the differences between
the two mutants do not result from differential expression of p19.
86
Discussion
There are two further possible explanation for the infection behavior of these two mutants.
One theory postulates that the mutations favor the formation of a RNA secondary structure
that inhibits the translation of p22 from sgRNA2. Computer aided comparison of the wild
type sgRNA2 secondary RNA structure with the two mutants with the MFOLD program
[Zuker, 2003] revealed differences between the two mutants and the wild type virus but no
significant differences between the two mutants themselves (data not shown). It was decided
to abandon this theory as the computer analysis did not support it.
The most likely explanation was that the mutations in pTBSVDDp19 inhibit the
replication of the viral RNA by the replicase. The replication ability of RNA viruses can be
destroyed by point mutations in the viral genome even if the protein sequence is unaltered
[Hull, 2002]. There have been no reports about the region carrying the mutation being a
control signal. The majority of control signals reported for TBSV or RNA viruses in general
lie near the 5' and 3' end of the genome, but other interactions are also possible [Hull, 2002].
This theory is supported by the fact that co-inoculation with DI-RNA had an additional
impact on the infection with the virus mutants. DI-RNA have an attenuating effect on
symptom development in wild type virus infections [Havelda et al., 1998]. The effect is based
on the preferential replication of the DI-RNA compared to the viral genome. This preference
could become more pronounced because of the mutation introduced into the pTBSVDDp19
construct. As a consequence the titer of the genomic RNA becomes to low for an efficient
infection of the plant. The effect is also present in wild type infections, however for our
mutant, which has no gene silencing repressor, it becomes so pronounced that systemic
infection does not occur. This effect has been described before, though not as severe, [Qiu et
al., 2002]. These authors stated that the efficient infection of plants is dependent on the
dosage of p19 and the coat protein.
Further research into the infection behavior of our two mutants would be required to get a
better understanding of this process.
Introduction of the silencing construct by A. tumefaciens infiltration
It was decided to inoculate the silencing inducer by A. tumefaciens infiltration, as other
experiments with satellite viruses have shown that efficient silencing is to a large extent
dependent on the inoculation of the silencing inducer [Gosselé et al., 2002, Helliwell and
87
Discussion
Waterhouse, 2005].
Infiltration of TR4 plants with a binary vector DI-PDS construct did not induce silencing
symptoms. One can only speculate about the reasons for this since no further investigations
were conducted to explain this phenomenon. One hypothesis is that systemic movement of the
viral RNA is essential for the successful induction of gene silencing in our system. This is
supported by the fact that none of the endogenous genes showed silencing symptoms in
inoculated leaves.
Furthermore, infiltration of the silencing inducer in combination with rub-inoculation of
helper virus (wild type and p19 deficient mutants) did not induce gene silencing which
contradicts findings of Gossele and coworkers [Gosselé et al., 2002]. Their system being
similar to ours in regards to separate delivery of the silencing inducer and the helper virus. It
was speculated that this could be a further dosage effect. The different findings could be
explained in that the large excess of DI-RNA present in the plant, efficiently utilizes all the
viral replicase and therefore replication of the genomic RNA is inhibited. This phenomenon
was not further pursued and instead the helper virus and the silencing inducer were introduced
by A. tumefaciens infiltration.
Inoculation of both helper virus and silencing construct by A. tumefaciens
infiltration
Infiltration of wild type helper virus together with the DI-PDS construct induced silencing
6-7 dpi. This finding contradicts experiments with the wild type virus inoculated as RNA
transcripts. This supports the idea that the DI gene silencing system is influenced by an
dosage effect. The onset of silencing was 10-15 days earlier than with the TBSVDp19 mutant
which indicates that the infection with the wild type virus was more efficient. However, the
silencing symptoms were not as pronounced as with the TBSVDp19 mutant. The major reason
for this is probably the severe stunting of the leaves from the viral infection. This causes a
reduced growth of the plants and as a result only small white bleached spots are formed.
Severe viral symptoms make this system unsuitable as a VIGS vector as they interfere with
the detection of silencing symptoms.
88
Discussion
Agrobacterium mediated inoculation with the TBSVDp19 mutant and the DI-PDS
silencing inducer resulted in the appearance of mild viral symptoms approximately 25 dpi.
White bleached spots appeared about 30 dpi (Fig. 41). However, the infection was only
successful with about 50% of the inoculated plants. The delayed onset of the viral infection is
most likely due to the combination of two facts, the missing gene silencing repressor and the
high inoculum concentration derived from A. tumefaciens infiltration.
For the binary vector constructs it might be possible to enhance the replication by
introducing a ribozyme further downstream of the 3' end of the virus. Since the poly-A tail
interferes with the replication of the virus [Scholthof, 1999], the ribozyme would remove the
poly-A tail and restore the native 3' end of the virus. However, it is unlikely that this
modification would remedy all the limitations of our system.
In conclusion one can say that the combination of DI and TBSV can be applied for the
induction of gene silencing. However, the system has some limitations which make
competing systems like SVISS superior. The limitations are mainly the instability of the
silencing trigger sequence and the fact that the silencing symptoms are not as pronounced.
The symptoms can not clearly be distinguish from the viral infection symptoms. This may be
explained by the fact that TBSV is known to be an aggressive virus [Hull, 2002] and therefore
it is possible that it escapes the gene silencing mechanism as described for other viruses
[Taliansky et al., 2004]. Escape of the helper virus from silencing means that the silencing
mechanism is somehow repressed and therefore the silencing of the target gene may be also
effected.
As an outlook, there are some optimizations that could be performed on the DI/TBSV
system, like introduction of a weaker gene silencing repressor replacing p19 [Hou and Qiu,
2003]. However, the possible benefits of optimizations like this would have to be evaluated
carefully since progress in this field is made continuously and other VIGS systems seem more
promising.
Influence of the DI sequences on transient protein expression and gene
silencing
Using the two binary vector GFP constructs, made for evaluating the potential of the DI
sequences to protect RNA from gene silencing, no GFP expression could be observed.
89
Discussion
Several factors could be the reason for this, as the constructs were assembled out of numerous
different parts which have not been tested together. The ER-leader peptide had to be altered
because a NcoI site at the 5’ end of the gene was necessary for the insertion into the DI vector.
The modification of the 5’ end to introduce the NcoI site resulted in the addition of Met-Gly
at the N-terminal end of the protein. In order to find out whether this has an effect on the
cleavage of the leader peptide, the protein sequence was analyzed with the computer program
sigcleave [Rice et al., 2000] which predicts the site of cleavage between a signal sequence and
the mature exported protein with an accuracy of 75-80 %. The analysis showed that cleavage
of the signal peptide was not responsible for the lack of GFP expression. The C-terminal end
of GFP was also modified due to an error in the 3' end primer. The error resulted in the loss of
the stop codon which had to be reintroduced by a XhoI digestion, subsequent fill in of the
overhangs and religation. This resulted in the addition of the amino acids Lys-Val-Pro-Arg-
Ser-Ser-Thr before the newly introduced stop codon. However, GFP is readily expressed as a
N- or C-terminal fusion-protein so the additional amino acids should have no effect on GFP
fluorescence. They could however influence the function of the ER retention signal His-Asp-
Glu-Leu (HDEL) but this should not cause the protein to be degraded [Ellgaard and Helenius,
2001; Brandizzi et al., 2003] and therefore GFP fluorescence should still be detectable. The
most likely reason for the absence of GFP fluorescence is the formation of a RNA secondary
structure which inhibits translation of the mRNA. This would also explain the lack of GFP
expression in protoplasts transfected with DI-GFP RNA. The analysis of this problem would
be beyond the scope of this thesis and it was decided not to use the GFP constructs for further
experiments. An already existing DI-GUS construct was used instead.
GUS expression was detected for both the DI-GUS and GUS constructs. The expression
level as far as it could be distinguished by histochemical GUS staining was higher in DI-GUS
infiltrated plants then in GUS infiltrated plants. However, infiltration of GUS silenced N.
tabacum plants with GUS and DI-GUS exhibited GUS expression with both constructs. This
is contrary to the expected behavior that the GUS construct would exhibit no GUS expression
in the silenced plants [Voinnet et al., 1998]. The reasons for the absence of GUS silencing
were unknown. The GUS enzyme is reportedly [Cervera, 2005] widely utilized in plant
transformation because of its stability and the sensitivity of the detection assay. The high
sensitivity of the may be one reason for the inability of our assay to detect the inhibition of
GUS expression after A. tumefaciens infiltration. The higher sensitivity of the enzymatic
90
Discussion
assay compared to the direct detection of GFP was also the basis for green fluorescent protein
as the first choice in infiltration experiments on silenced plants since GFP silencing is easily
detectable.
When using A. tumefaciens infiltration for transient expression of proteins, the role of
gene silencing increases greatly within the time course of experiments [Voinnet et al., 2003].
It is therefore possible that at five dpi silencing was occurring in the wild type N.
benthamiana as well as in the GUS silenced plants. This would be an explanation for the
different expression levels observed in our experiments. However, the use of histochemical
GUS staining to distinguish between different intensities of GUS expression was not ideal
since it is not suitable for the detection of small differences.
In our opinion it would be viable to do more studies regarding the influence of the DI
sequences on mRNA stability and protein translation. With a deeper understanding of the
effects of DI sequences on mRNA one would be able to differentiate between effects during
viral replication [Pantaleo et al., 2004] and others useful for the generation of plant
transformation constructs.
It is desirable that experiments with other reporter genes should be performed to get a
more general statement about the influence of DI sequences. A different GFP or another
unrelated fluorescent protein like RFP would be a good starting point. However, since the
experiments would require the generation of transgenic plants this should be done in a new
project.
91
Literature
8 Literature
[Baulcombe D.C., 1999]: Baulcombe D C, Fast forward genetics based on virus-induced
gene silencing, Current Opinion in Plant Biology, 2, 109-113, (1999)
[Bernstein et al., 2001]: Bernstein, E; Caudy, A A; Hammond, S M; Hannon, G J, Role for a
bidentate ribonuclease in the initiation step of RNA interference., Nature, 6818, 363-6, (2001)
[Boonrod et al., 2005]: Boonrod, K; Chotewutmontri, S; Galetzka, D; Krczal, G, Analysis of
tombusvirus revertants to identify essential amino acid residues within RNA-dependent RNA
polymerase motifs., Journal of General Virology, Pt 3, 823-6, (2005)
[Brandizzi et al., 2003]: Brandizzi, F; Hanton, S; Dasilva, L, L; Boevink, P; Evans, D;
Oparka, K; Denecke, J; Hawes, C, ER quality control can lead to retrograde transport from
the ER lumen to the cytosol and the nucleoplasm in plants., The Plant Journal, 3, 269-81,
(2003)
[Brunt et al., 1997]: Brunt, A A; Crabtree, K; Dallwitz, M J; Gibbs, A J; Watson, L, Plant
Viruses Online: Descriptions and lists from the VIDE database, 1997,
http://www.im.ac.cn/vide/descr825.htm
[Burgyán et al., 1994]: Burgyán, J; Salánki, K; Dalmay, T; Russo, M, Expression of
homologous and heterologous viral coat protein-encoding genes using recombinant DI RNA
from cymbidium ringspot tombusvirus., Gene, 1-2, 159-63, (1994)
[Cervera, 2005]: Cervera, M, Histochemical and fluorometric assays for uidA (GUS) gene
detection., Methods in Molecular Biology, 286, 203-14, (2005)
[Constantin et al., 2004]: Constantin, G D; Krath, B N; Macfarlane, S A; Nicolaisen, M;
Johansen, I E; Lund, O S, Virus-induced gene silencing as a tool for functional genomics in a
legume species., The Plant Journal, 4, 622-31, (2004)
[Eilers, 2002]: Eilers J, Defective interfering particles (DI) and their influence on gene
expression, FH Bingen, (2002)
[Ellgaard and Helenius, 2001]: Ellgaard, L; Helenius, A, ER quality control: towards an
understanding at the molecular level., Current Opinion in Cell Biology, 4, 431-7, (2001)
[Fabian and White, 2004]: Fabian, M R; White, K A, 5'-3' RNA-RNA interaction facilitates
cap- and poly(A) tail-independent translation of tomato bushy stunt virus mRNA: a potential
92
Literature
common mechanism for tombusviridae., Journal of Biological Chemistry, 28, 28862-72,
(2004)
[Fire et al., 1998]: Fire, A; Xu, S; Montgomery, M K; Kostas, S A; Driver, S E; Mello, C C,
Potent and specific genetic interference by double-stranded RNA in Caenorhabditis elegans.,
Nature, 6669, 806-11, (1998)
[Fischer and Emans, 2000]: Fischer, R; Emans, N, Molecular farming of pharmaceutical
proteins., Transgenic Research, 4-5, 279-99; discussion 277, (2000)
[Fischer et al., 1999]: Fischer, R; Vaquero-Martin, C; Sack, M; Drossard, J; Emans, N;
Commandeur, U, Towards molecular farming in the future: transient protein expression in
plants., Biotechnology and Applied Biochemistry, 30, 113-6, (1999)
[Galetzka et al., 2000]: Galetzka, D; Russo, M; Rubino, L; Krczal, G, Molecular
characterization of a tombusvirus associated with a disease of statice [Goniolimon Tataricum
(L.) Boiss.], Journal of Plant Pathology, 82, 151-155, (2000)
[Giddings, 2001]: Giddings, G, Transgenic plants as protein factories., Current Opinion in
Biotechnology, 5, 450-4, (2001)
[Gosselé et al., 2002]: Gosselé, V; Faché, I; Meulewaeter, F; Cornelissen, M; Metzlaff, M,
SVISS - a novel transient gene silencing system for gene function discovery and validation in
tobacco plants., The Plant Journal, 5, 859-66, (2002)
[Hajdukiewicz et al., 1994]: Hajdukiewicz, P; Svab, Z; Maliga, P, The small, versatile pPZP
family of Agrobacterium binary vectors for plant transformation., Plant Molecular Biology, 6,
989-94, (1994)
[Haseloff et al., 1997]: Haseloff, J; Siemering, K R; Prasher, D C; Hodge, S, Removal of a
cryptic intron and subcellular localization of green fluorescent protein are required to mark
transgenic Arabidopsis plants brightly., Proceedings of the National Academy of Sciences of
the United States of America, 6, 2122-7, (1997)
[Havelda et al., 1997]: Havelda, Z; Dalmay, T; Burgyán, J, Secondary structure-dependent
evolution of cymbidium ringspot virus defective interfering RNA., Journal of General
Virology, 78, 1227-34, (1997)
[Havelda et al., 1998]: Havelda, Z; Szittya, G; Burgyán, J, Characterization of the molecular
mechanism of defective interfering RNA-mediated symptom attenuation in tombusvirus-
93
Literature
infected plants., Journal of Virology, 7, 6251-6, (1998)
[Heim and Tsien, 1996]: Heim, R; Tsien, R Y, Engineering green fluorescent protein for
improved brightness, longer wavelengths and fluorescence resonance energy transfer.,
Current Biology, 2, 178-82, (1996)
[Helliwell and Waterhouse, 2005]: Helliwell, C A; Waterhouse, P M, Constructs and
methods for hairpin RNA-mediated gene silencing in plants., Methods in Enzymology, 392,
24-35, (2005)
[Hood et al., 1986]: Hood, E E; Helmer, G L; Fraley, R T; Chilton, M D, The hypervirulence
of Agrobacterium tumefaciens A281 is encoded in a region of pTiBo542 outside of T-DNA.,
Journal of Bacteriology, 3, 1291-301, (1986)
[Hou and Qiu, 2003]: Hou, H; Qiu, W, A novel co-delivery system consisting of a tomato
bushy stunt virus and a defective interfering RNA for studying gene silencing., Journal of
Virological Methods, 1, 37-42, (2003)
[Hull, 2002]: Hull Roger, Matthews' Plant Virology, 4th Edition, Academic Press, (2002)
[Joelson et al., 1997]: Joelson, T; Akerblom, L; Oxelfelt, P; Strandberg, B; Tomenius, K;
Morris, T J, Presentation of a foreign peptide on the surface of tomato bushy stunt virus.,
Journal of General Virology, 78, 1213-7, (1997)
[Jorgensen, 1991]: Jorgensen, E D, Specific contacts between the bacteriophage T3, T7, and
SP6 RNA polymerases and their promoters, Journal of Biological Chemistry, 266, 645-651,
(1991)
[Kapila et al., 1997]: Kapila, J; De Rycke, R; Van Montagu, R; Angenon, G, An
Agrobacterium-mediated transient gene expression system for intact leaves, Plant Science, 1,
101-108, (1997)
[Kay et al., 1987]: Kay, R; Chan, A; Daly, M; McPherson, J, Duplication of CaMV 35S
promoter sequences creates a strong enhancer for plant genes., Science, 236, 1299-1302,
(1987)
[Kollár and Burgyán, 1994]: Kollár, A; Burgyán, J, Evidence that ORF 1 and 2 are the only
virus-encoded replicase genes of cymbidium ringspot tombusvirus., Virology, 1, 169-72,
(1994)
[Kozak, 1984]: Kozak, M, Compilation and analysis of sequences upstream from the
94
Literature
translational start site in eukaryotic mRNAs., Nucleic Acids Research, 2, 857-72, (1984)
[Kozak, 2002]: Kozak, M, Pushing the limits of the scanning mechanism for initiation of
translation., Gene, 1-2, 1-34, (2002)
[Krczal et al., 1994]: Krczal, G; Beutel, M, A new soilborne virus disease in statice
(Goniolimon tataricum), Acta Horticulturae, 377, 115-122, (1994)
[Kumagai et al. 1995]: Kumagai M H; Donson J; della-Cioppa G; Harvey D; Hanley K; Grill
L K, Cytoplasmic inhibition of carotenoid biosynthesis with virus-derived RNA.,
Proceedings of the National Academy of Sciences of the United States of America, 5, 1679-
1683, (1995)
[Kyhse-Andersen, 1984]: Kyhse-Andersen, J, Electroblotting of multiple gels: a simple
apparatus without buffer tank for rapid transfer of proteins from polyacrylamide to
nitrocellulose., Journal of Biochemical and Biophysical Methods, 3-4, 203-9, (1984)
[Laemmli, 1970]: Laemmli, U K, Cleavage of structural proteins during the assembly of the
head of bacteriophage T4., Nature, 5259, 680-5, (1970)
[Lindbo and Dougherty, 1992]: Lindbo, J A; Dougherty, W G, Untranslatable transcripts of
the tobacco etch virus coat protein gene sequence can interfere with tobacco etch virus
replication in transgenic plants and protoplasts., Virology, 2, 725-33, (1992)
[Mann et al., 1994]: Mann, V; Pecker, I; Hirschberg, J, Cloning and characterization of the
gene for phytoene desaturase (Pds) from tomato (Lycopersicon esculentum)., Plant Molecular
Biololgy, 3, 429-34, (1994)
[Meinke et al., 1994]: Meinke D W; Franzmann L H; Nickle T C; Yeung E C, Leafy
cotyledon mutants of Arabidopsis., Plant Cell, 8, 1049-1064., (1994)
[Murray et al., 1989]: Murray, E E; Lotzer, J; Eberle, M, Codon usage in plant genes.,
Nucleic Acids Research, 2, 477-98, (1989)
[Napoli et al., 1990]: Napoli, Lemieux, Jorgensen, Introduction of a chimeric chalcone
synthase gene into petunia results in reversible co-suppression of homologous genes in trans.,
The Plant Cell, 4, 279-289, (1990)
[Pantaleo et al., 2004]: Pantaleo, V; Rubino, L; Russo, M, The p36 and p95 replicase
proteins of carnation italian ringspot virus cooperate in stabilizing defective interfering RNA.,
Journal of General Virology, Pt 8, 2429-33, (2004)
95
Literature
[Peele et al., 2001]: Peele C; Jordan C V; Muangsan N; Turnage M; Egelkrout E; Eagle P;
Hanley-Bowdoin L; Robertson D, Silencing of a meristematic gene using geminivirus-derived
vectors., Plant Journal, 4, 357-366, (2001)
[Qiu et al., 2002]: Qiu, W; Park, J-W; Scholthof, H B, Tombusvirus p19-mediated
suppression of virus-induced gene silencing is controlled by genetic and dosage features that
influence pathogenicity., Molecular Plant Microbe Interactions, 3, 269-80, (2002)
[Qu and Morris, 2002]: Qu, F; Morris, T J, Efficient infection of Nicotiana benthamiana by
tomato bushy stunt virus is facilitated by the coat protein and maintained by p19 through
suppression of gene silencing., Molecular Plant Microbe Interactions, 3, 193-202, (2002)
[Ray and White, 2003]: Ray, D; White, K A, An internally located RNA hairpin enhances
replication of tomato bushy stunt virus RNAs., Journal of Virology, 1, 245-57, (2003)
[Reichel et al., 1996]: Reichel, C; Mathur, J; Eckes, P; Langenkemper, K; Koncz, C; Schell,
J; Reiss, B; Maas, C, Enhanced green fluorescence by the expression of an Aequorea victoria
green fluorescent protein mutant in mono- and dicotyledonous plant cells., Proceedings of the
National Academy of Sciences of the United States of America, 12, 5888-93, (1996)
[Rice et al., 2000]: Rice, P; Longden, I; Bleasby, A, EMBOSS: the European Molecular
Biology Open Software Suite., Trends in Genetics, 6, 276-7, (2000)
[Ruiz et al., 1998]: Ruiz, M T; Voinnet, O; Baulcombe, D C, Initiation and maintenance of
virus-induced gene silencing, The Plant Cell, 6, 937-46, (1998)
[Russo et al., 1994]: Russo, M; Burgyan, J; Martelli, G P, Molecular biology of
tombusviridae., Advances in Virus Research, 44, 381-428, (1994)
[Saitoh and Terauchi, 2002]: Saitoh, H; Terauchi, R, Virus-induced silencing of FtsH gene
in Nicotiana benthmiana causes a striking bleached leaf phenotype., Genes and Genetic
Systems, 5, 335-40, (2002)
[Sakamoto et al., 2003]: Sakamoto, W; Zaltsman, A; Adam, Z; Takahashi, Y, Coordinated
regulation and complex formation of yellow variegated1 and yellow variegated2,
chloroplastic FtsH metalloproteases involved in the repair cycle of photosystem II in
Arabidopsis thylakoid membranes., The Plant Cell, 12, 2843-55, (2003)
[Sambrook et al., 1989]: Sambrook, J; Fritsch, E F; Maniatis, L; Ford, N, Molecular Cloning,
2nd Edition, Cold Spring Harbour Laboratory Press, (1989)
96
Literature
[Scholthof et al. 2, 1995]: Scholthof, K B; Scholthof, H B; Jackson, A O, The effect of
defective interfering RNAs on the accumulation of tomato bushy stunt virus proteins and
implications for disease attenuation., Virology, 1, 324-8, (1995)
[Scholthof et al., 1993]: Scholthof, H B; Morris, T J; Jackson, A O, The capsid protein gene
of tomato bushy stunt virus is dispensable for systemic movment and can be replaced for
localized expression of foreign genes, Molecular Plant Microbe Interactions, 3, 309-322,
(1993)
[Scholthof et al., 1995]: Scholthof, H B; Scholthof, K B; Kikkert, M; Jackson, A O, Tomato
bushy stunt virus spread is regulated by two nested genes that function in cell-to-cell
movement and host-dependent systemic invasion., Virology, 2, 425-38, (1995)
[Scholthof, 1999]: Scholthof, H B, Rapid delivery of foreign genes into plants by direct rub-
inoculation with intact plasmid DNA of a tomato bushy stunt virus gene vector., Journal Of
Virology, 9, 7823-9, (1999)
[Seo et al., 2000]: Seo, S; Okamoto, M; Iwai, T; Iwano, M; Fukui, K; Isogai, A; Nakajima, N;
Ohashi, Y, Reduced levels of chloroplast FtsH protein in tobacco mosaic virus-infected
tobacco leaves accelerate the hypersensitive reaction., The Plant Cell, 6, 917-32, (2000)
[Sheen, 2001]: Sheen, J, Signal transduction in maize and Arabidopsis mesophyll
protoplasts., Plant Physiology, 4, 1466-75, (2001)
[Silva et al., 2003]: Silva, P; Thompson, E; Bailey, S; Kruse, O; Mullineaux, C W; Robinson,
C; Mann, N H; Nixon, P J, FtsH is involved in the early stages of repair of photosystem II in
Synechocystis sp PCC 6803., The Plant Cell, 9, 2152-64, (2003)
[Sinvany-Villalobo et al., 2004]: Sinvany-Villalobo, G; Davydov, O; Ben-Ari, G; Zaltsman,
A; Raskind, A; Adam, Z, Expression in multigene families. Analysis of chloroplast and
mitochondrial proteases., Plant Physiology, 3, 1336-45, (2004)
[Szittya et al., 2002]: Szittya, G; Molnár, A; Silhavy, D; Hornyik, C; Burgyán, J, Short
defective interfering RNAs of tombusviruses are not targeted but trigger post-transcriptional
gene silencing against their helper virus., The Plant Cell, 2, 359-72, (2002)
[Takagi et al., 1997]: Takagi, M; Nishioka, M; Kakihara, H; Kitabayashi, M; Inoue, H;
Kawakami, B; Oka, M; Imanaka, T, Characterization of DNA polymerase from Pyrococcus
sp. strain KOD1 and its application to PCR., Applied and Environmental Microbiology, 11,
97
Literature
4504-10, (1997)
[Taliansky et al., 2004]: Taliansky, M; Kim, S H; Mayo, M A; Kalinina, N O; Fraser, G;
Mcgeachy, K D; Barker, H, Escape of a plant virus from amplicon-mediated RNA silencing is
associated with biotic or abiotic stress., The Plant Journal, 2, 194-205, (2004)
[Thomas et al., 2001]: Thomas, C L; Jones, L; Baulcombe, D C; Maule, A J, Size constraints
for targeting post-transcriptional gene silencing and for RNA-directed methylation in
Nicotiana benthamiana using a potato virus X vector., The Plant Journal, 4, 417-25, (2001)
[Thompson et al., 1997]: Thompson, J D; Gibson, T J; Plewniak, F; Jeanmougin, F; and
Higgins, D G; The ClustalX windows interface: flexible strategies for multiple
sequencealignment aided by quality analysis tools., Nucleic Acids Research, 25, 4876-4882,
(1997)
[Töpfer et al., 1987]: Töpfer, R; Matzeit, V; Gronenborn, B; Schell, J; Steinbiss, H H, A set
of plant expression vectors for transcriptional and translational fusions., Nucleic Acids
Research, 14, 5890, (1987)
[Van Der Krol et al., 1990]: Van Der Krol, A R; Mur, L A; Beld, M; Mol, J N; Stuitje, A R,
Flavonoid genes in petunia: addition of a limited number of gene copies may lead to a
suppression of gene expression., The Plant Cell, 4, 291-9, (1990)
[Vaquero et al., 1999]: Vaquero, C; Sack, M; Chandler, J; Drossard, J; Schuster, F;
Monecke, M; Schillberg, S; Fischer, R, Transient expression of a tumor-specific single-chain
fragment and a chimeric antibody in tobacco leaves., Proceedings of the National Academy of
Sciences of the United States of America, 20, 11128-33, (1999)
[Voinnet et al., 1998]: Voinnet, O; Vain, P; Angell, S; Baulcombe, D C, Systemic spread of
sequence-specific transgene RNA degradation in plants is initiated by localized introduction
of ectopic promoterless DNA., Cell, 2, 177-87, (1998)
[Voinnet et al., 2003]: Voinnet, O; Rivas, S; Mestre, P; Baulcombe, D, An enhanced transient
expression system in plants based on suppression of gene silencing by the p19 protein of
tomato bushy stunt virus., The Plant Journal, 5, 949-56, (2003)
[Wassenegger et al., 1994]: Wassenegger, M; Heimes, S; and Sänger, H L, An infectious
viroid RNA replicon evolved from an in vitro-generated non-infectious viroid deletion mutant
via a complementary deletion in vivo., EMBO Journal, 13, 6172-6177, (1994)
98
Literature
[Waterhouse and Helliwell, 2003]: Waterhouse, P M; Helliwell, C A, Exploring plant
genomes by RNA-induced gene silencing., Nature Reviews Genetics, 1, 29-38, (2003)
[Waterhouse et al., 1998]: Waterhouse, PM; Graham, MW; Wang, MB; Virus resistance and
gene silencing in plants can be induced by simultaneous expression of sense and antisense
RNA, Proceedings of the National Academy of Sciences of the United States of America, 23,
13959-64, (1998)
[White and Morris, 1994]: White, K A; Morris, T J, Nonhomologous RNA recombination in
tombusviruses: generation and evolution of defective interfering RNAs by stepwise deletions.,
Journal of Virology, 1, 14-24, (1994)
[Wu and White, 1999]: Wu, B; White, K A, A primary determinant of cap-independent
translation is located in the 3'-proximal region of the tomato bushy stunt virus genome.,
Journal of Virology, 11, 8982-8, (1999)
[Yoo et al., 2004]: Yoo, B-C; Kragler, F; Varkonyi-Gasic, E; Haywood, V; Archer-Evans, S;
Lee, Y M; Lough, T J; Lucas, W J, A systemic small RNA signaling system in plants., The
Plant Cell, 8, 1979-2000, (2004)
[Zuker, 2003]: Zuker, M, Mfold web server for nucleic acid folding and hybridization
prediction., Nucleic Acids Research, 13, 3406-15, (2003)
99
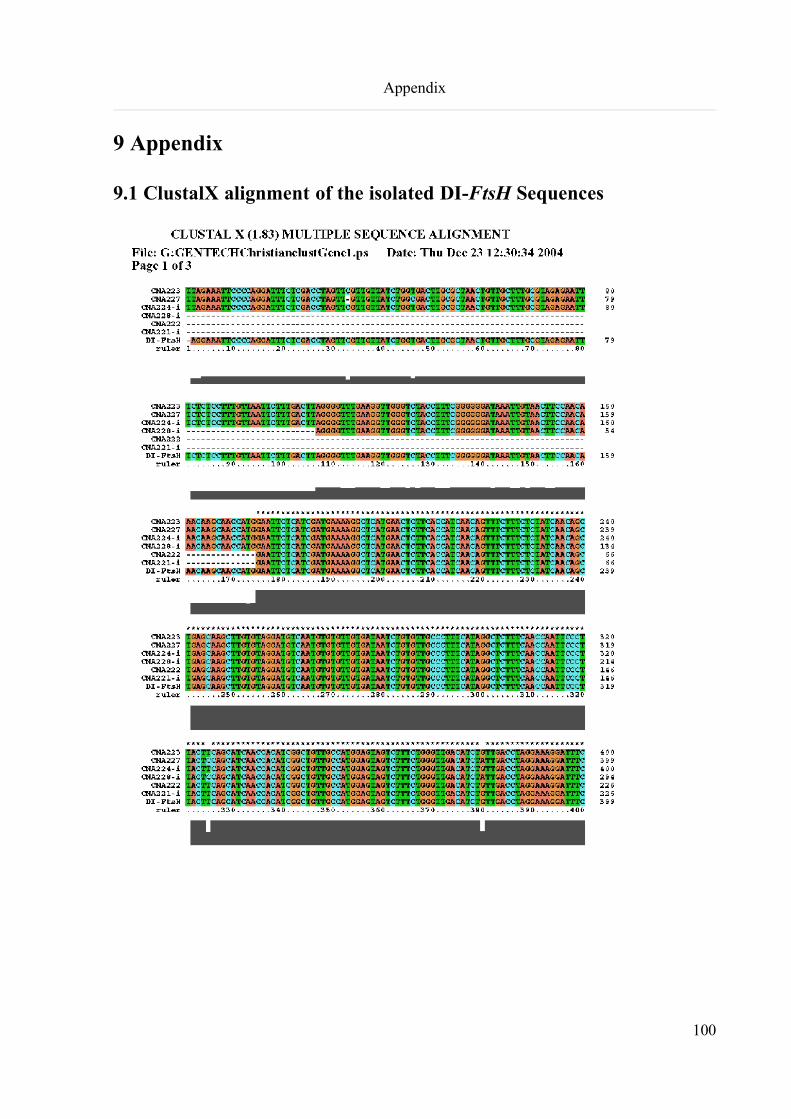
Appendix
9 Appendix
9.1 ClustalX alignment of the isolated DI-FtsH Sequences
100
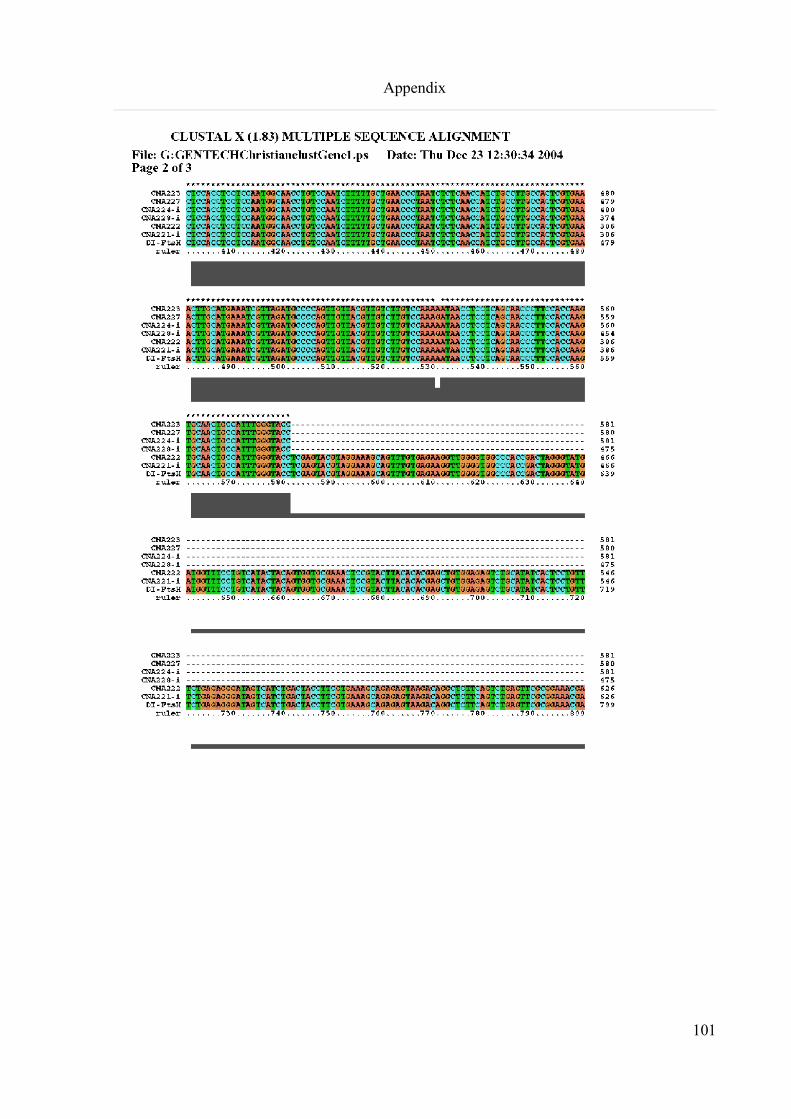
Appendix
101
Appendix
102
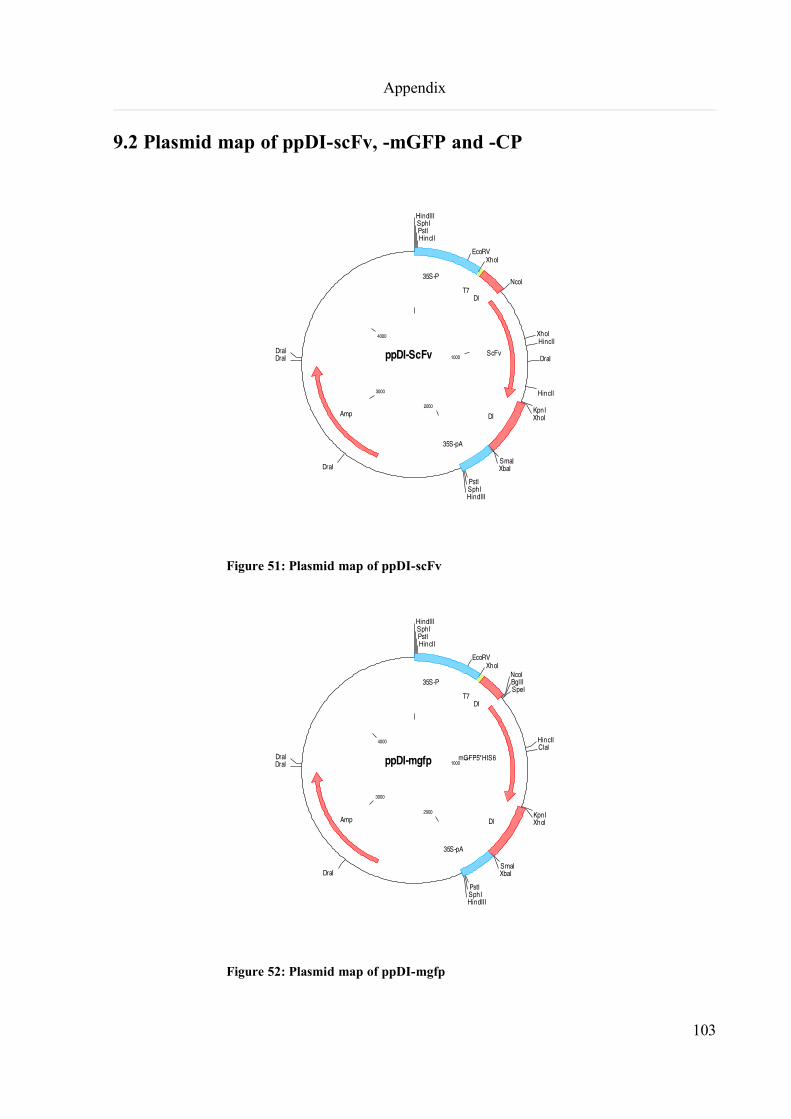
Appendix
9.2 Plasmid map of ppDI-scFv, -mGFP and -CP
Figure 51: Plasmid map of ppDI-scFv
Figure 52: Plasmid map of ppDI-mgfp
103
ppDI-ScFv 1000
2000
3000
4000
HindIIISphIPstIHincII
EcoRVXhoI
NcoI
XhoIHincII
DraI
HincII
KpnIXhoI
SmaIXbaI
PstISphIHindIII
DraI
DraIDraI
35S-P
T7DI
ScFv
DI
35S-pA
Amp
ppDI-mgfp 1000
2000
3000
4000
HindIIISphIPstIHincII
EcoRVXhoI
NcoIBglIISpeI
HincIIClaI
KpnIXhoI
SmaIXbaI
PstISphIHindIII
DraI
DraIDraI
35S-P
T7DI
mGFP5*HIS6
DI
35S-pA
Amp
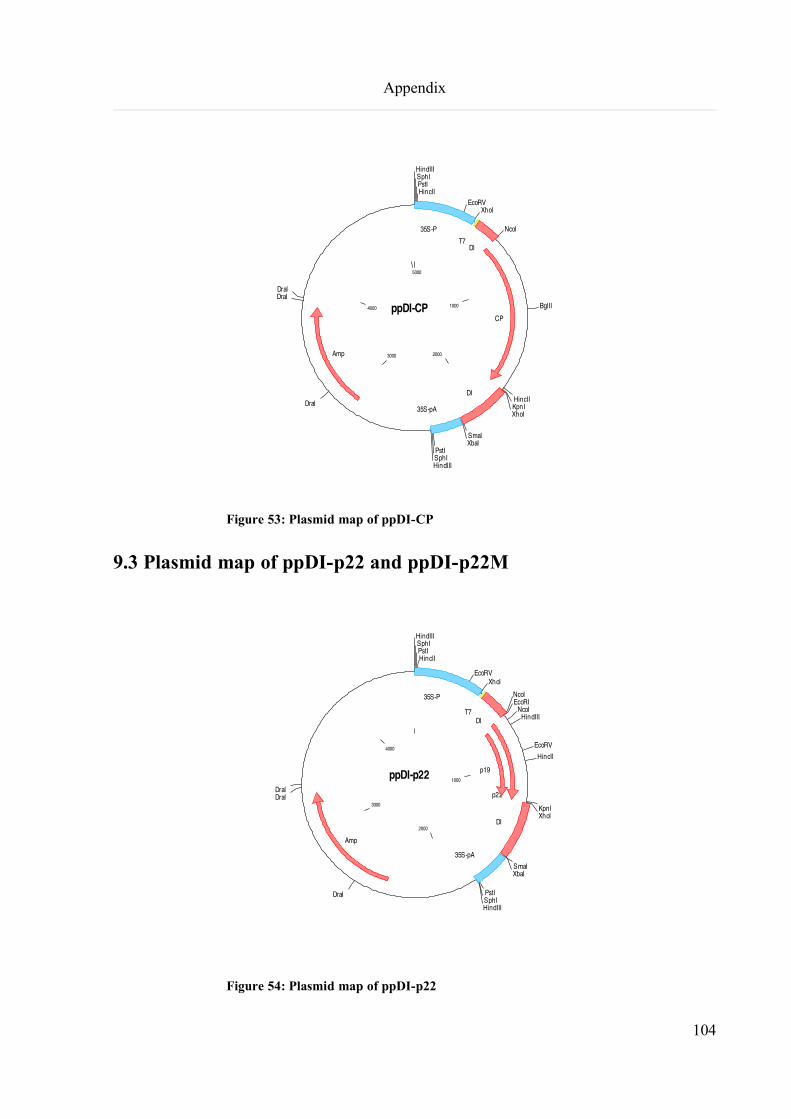
Appendix
Figure 53: Plasmid map of ppDI-CP
9.3 Plasmid map of ppDI-p22 and ppDI-p22M
Figure 54: Plasmid map of ppDI-p22
104
ppDI-CP 1000
20003000
4000
5000
HindIIISphIPstIHincII
EcoRVXhoI
NcoI
BglII
HincIIKpnIXhoI
SmaIXbaI
PstISphIHindIII
DraI
DraIDraI
35S-P
T7DI
CP
DI
35S-pA
Amp
ppDI-p22 1000
2000
3000
4000
HindIIISphIPstIHincII
EcoRVXhoI
NcoIEcoRI
NcoIHindIII
EcoRVHincII
KpnIXhoI
SmaIXbaI
PstISphIHindIII
DraI
DraIDraI
35S-P
T7DI
p22
p19
DI
35S-pA
Amp
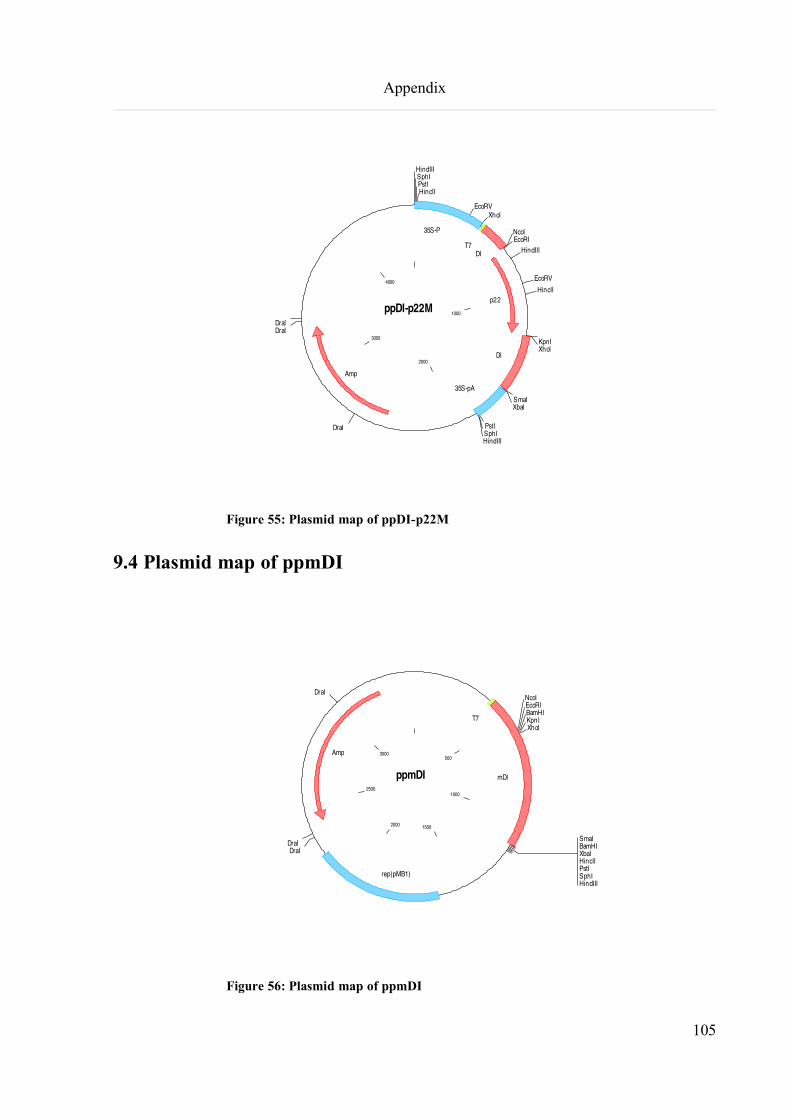
Appendix
Figure 55: Plasmid map of ppDI-p22M
9.4 Plasmid map of ppmDI
Figure 56: Plasmid map of ppmDI
105
ppDI-p22M 1000
2000
3000
4000
HindIIISphIPstIHincII
EcoRVXhoI
NcoIEcoRI
HindIII
EcoRV
HincII
KpnIXhoI
SmaIXbaI
PstISphIHindIII
DraI
DraIDraI
35S-P
T7DI
p22
DI
35S-pA
Amp
ppmDI500
1000
15002000
2500
3000
NcoIEcoRIBamHIKpnIXhoI
SmaIBamHIXbaIHincIIPstISphIHindIII
DraIDraI
DraI
T7
mDI
rep(pMB1)
Amp
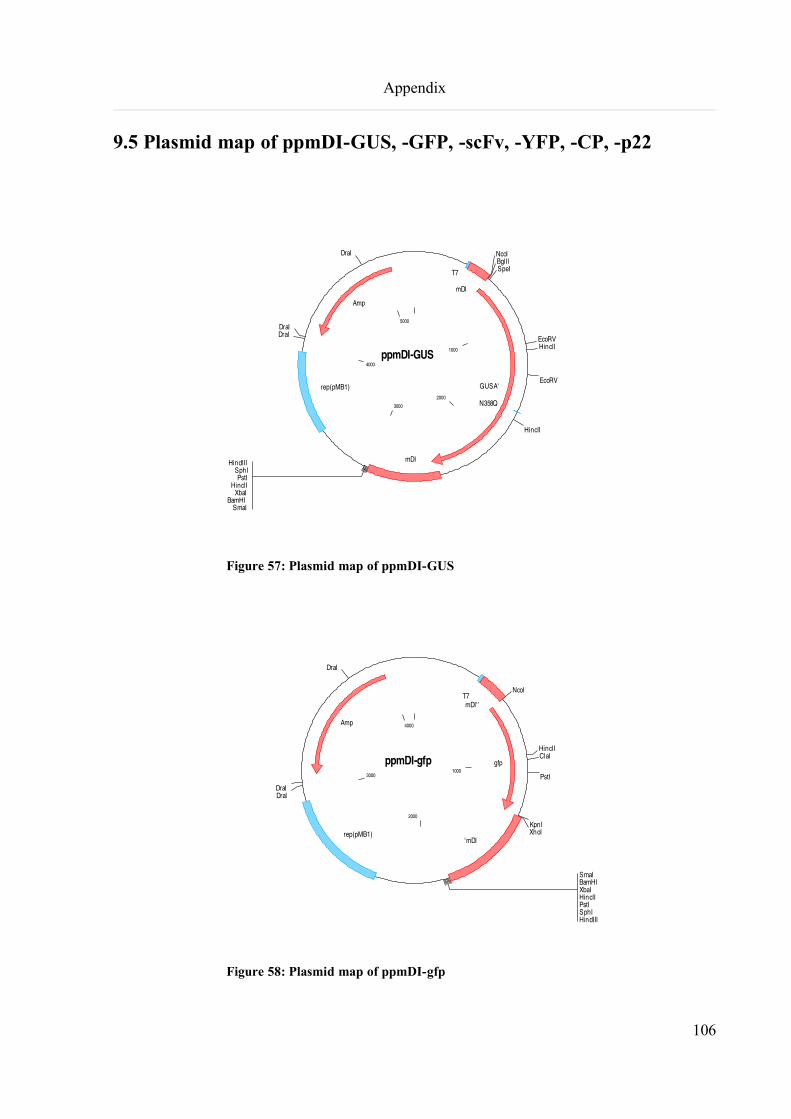
Appendix
9.5 Plasmid map of ppmDI-GUS, -GFP, -scFv, -YFP, -CP, -p22
Figure 57: Plasmid map of ppmDI-GUS
Figure 58: Plasmid map of ppmDI-gfp
106
ppmDI-GUS 1000
2000
3000
4000
5000
NcoIBglIISpeI
EcoRVHincII
EcoRV
HincII
SmaIBamHI
XbaIHincII
PstISphI
HindIII
DraIDraI
DraI
T7
mDI
GUSA'
N358Q
mDI
rep(pMB1)
Amp
ppmDI-gfp1000
2000
3000
4000
NcoI
HincIIClaI
PstI
KpnIXhoI
SmaIBamHIXbaIHincIIPstISphIHindIII
DraIDraI
DraI
T7mDI''
gfp
'mDIrep(pMB1)
Amp
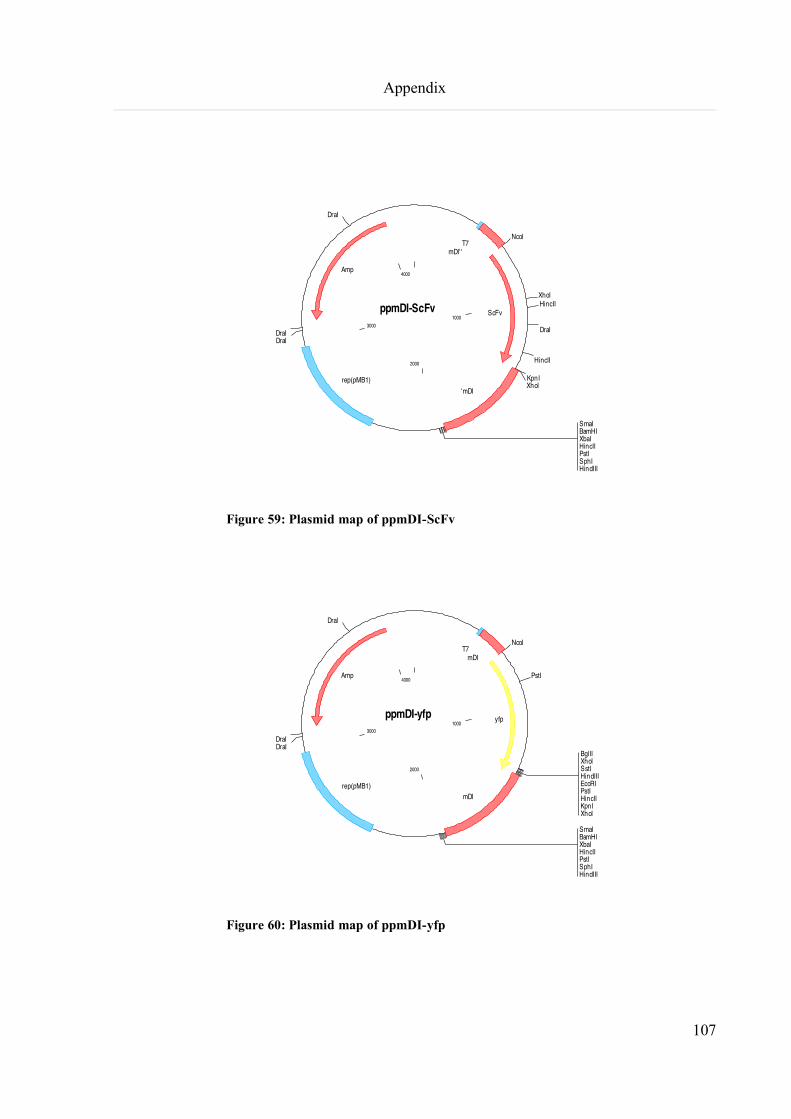
Appendix
Figure 59: Plasmid map of ppmDI-ScFv
Figure 60: Plasmid map of ppmDI-yfp
107
ppmDI-ScFv1000
2000
3000
4000
NcoI
XhoIHincII
DraI
HincII
KpnIXhoI
SmaIBamHIXbaIHincIIPstISphIHindIII
DraIDraI
DraI
T7mDI' '
ScFv
'mDIrep(pMB1)
Amp
ppmDI-yfp1000
2000
3000
4000
NcoI
PstI
BglIIXhoISstIHindIIIEcoRIPstIHincIIKpnIXhoI
SmaIBamHIXbaIHincIIPstISphIHindIII
DraIDraI
DraI
T7mDI
yfp
mDIrep(pMB1)
Amp
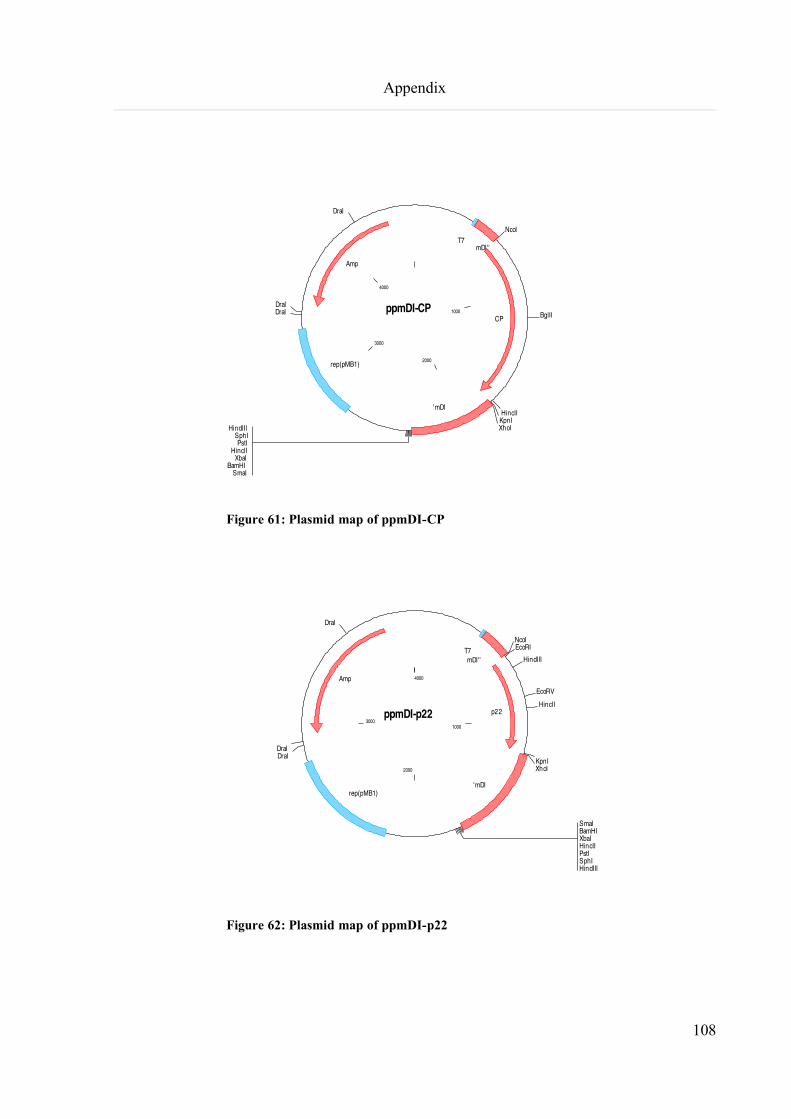
Appendix
Figure 61: Plasmid map of ppmDI-CP
Figure 62: Plasmid map of ppmDI-p22
108
ppmDI-CP 1000
2000
3000
4000
NcoI
BglII
HincIIKpnIXhoI
SmaIBamHI
XbaIHincII
PstISphI
HindIII
DraIDraI
DraI
T7mDI' '
CP
'mDI
rep(pMB1)
Amp
ppmDI-p221000
2000
3000
4000
NcoIEcoRI
HindIII
EcoRV
HincII
KpnIXhoI
SmaIBamHIXbaIHincIIPstISphIHindIII
DraIDraI
DraI
T7mDI' '
p22
'mDIrep(pMB1)
Amp
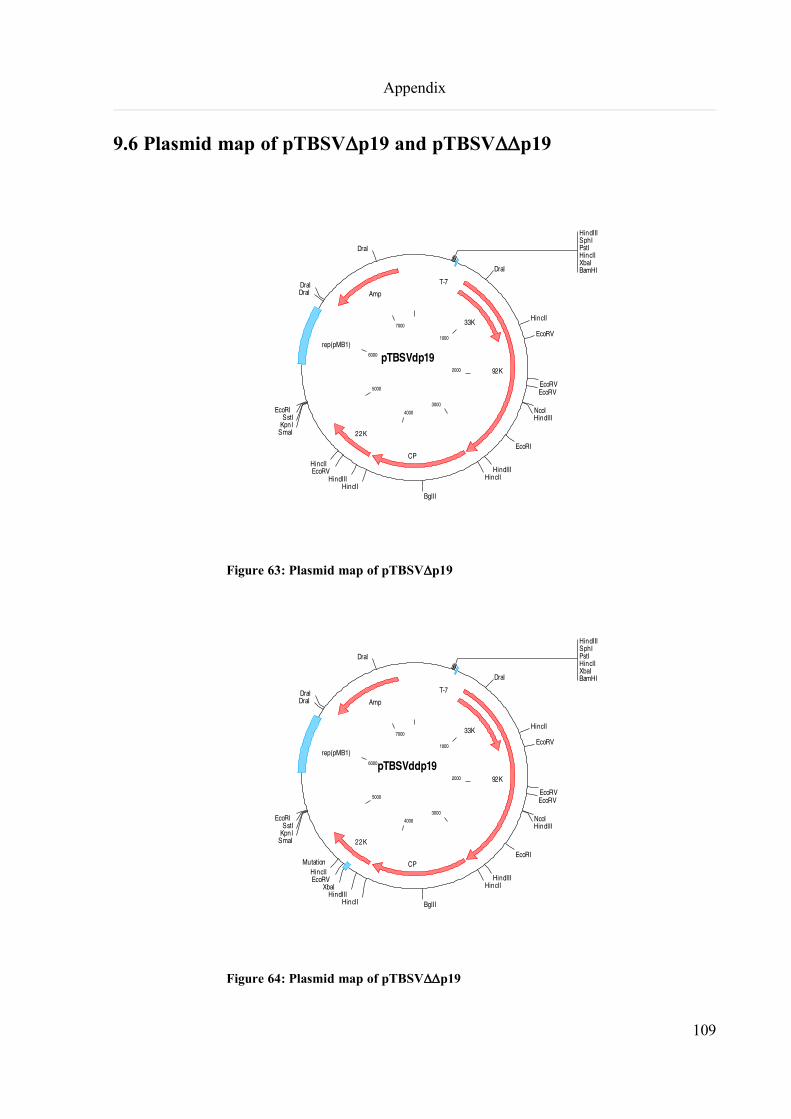
Appendix
9.6 Plasmid map of pTBSVDp19 and pTBSVDDp19
Figure 63: Plasmid map of pTBSVDp19
Figure 64: Plasmid map of pTBSVDDp19
109
pTBSVdp19
1000
2000
3000
4000
5000
6000
7000
HindIIISphIPstIHincIIXbaIBamHIDraI
HincII
EcoRV
EcoRVEcoRV
NcoIHindIII
EcoRI
HindIIIHincII
BglIIHincII
HindIIIEcoRVHincII
SmaIKpnISstI
EcoRI
DraIDraI
DraI
T-7
92K
33K
CP
22K
rep(pMB1)
Amp
pTBSVddp19
1000
2000
30004000
5000
6000
7000
HindIIISphIPstIHincIIXbaIBamHIDraI
HincII
EcoRV
EcoRVEcoRV
NcoIHindIII
EcoRI
HindIIIHincII
BglIIHincIIHindIII
XbaIEcoRVHincII
SmaIKpnISstI
EcoRI
DraIDraI
DraI
T-7
92K
33K
CP
22K
Mutation
rep(pMB1)
Amp
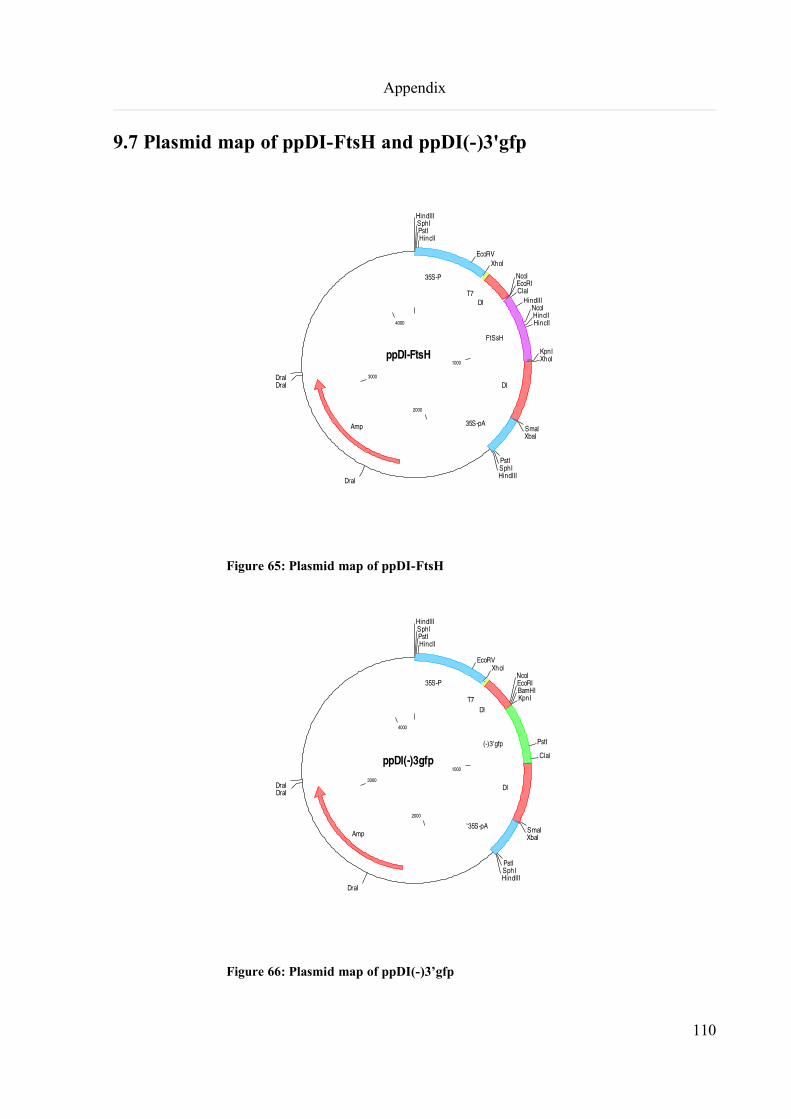
Appendix
9.7 Plasmid map of ppDI-FtsH and ppDI(-)3'gfp
Figure 65: Plasmid map of ppDI-FtsH
Figure 66: Plasmid map of ppDI(-)3’gfp
110
ppDI-FtsH1000
2000
3000
4000
HindIIISphIPstIHincII
EcoRVXhoI
NcoIEcoRIClaI
HindIIINcoIHincIIHincII
KpnIXhoI
SmaIXbaI
PstISphIHindIII
DraI
DraIDraI
35S-P
T7DI
FtSsH
DI
35S-pAAmp
ppDI(-)3gfp1000
2000
3000
4000
HindIIISphIPstIHincII
EcoRVXhoI
NcoIEcoRIBamHIKpnI
PstI
ClaI
SmaIXbaI
PstISphIHindIII
DraI
DraIDraI
35S-P
T7DI
(-)3'gfp
DI
'35S-pAAmp
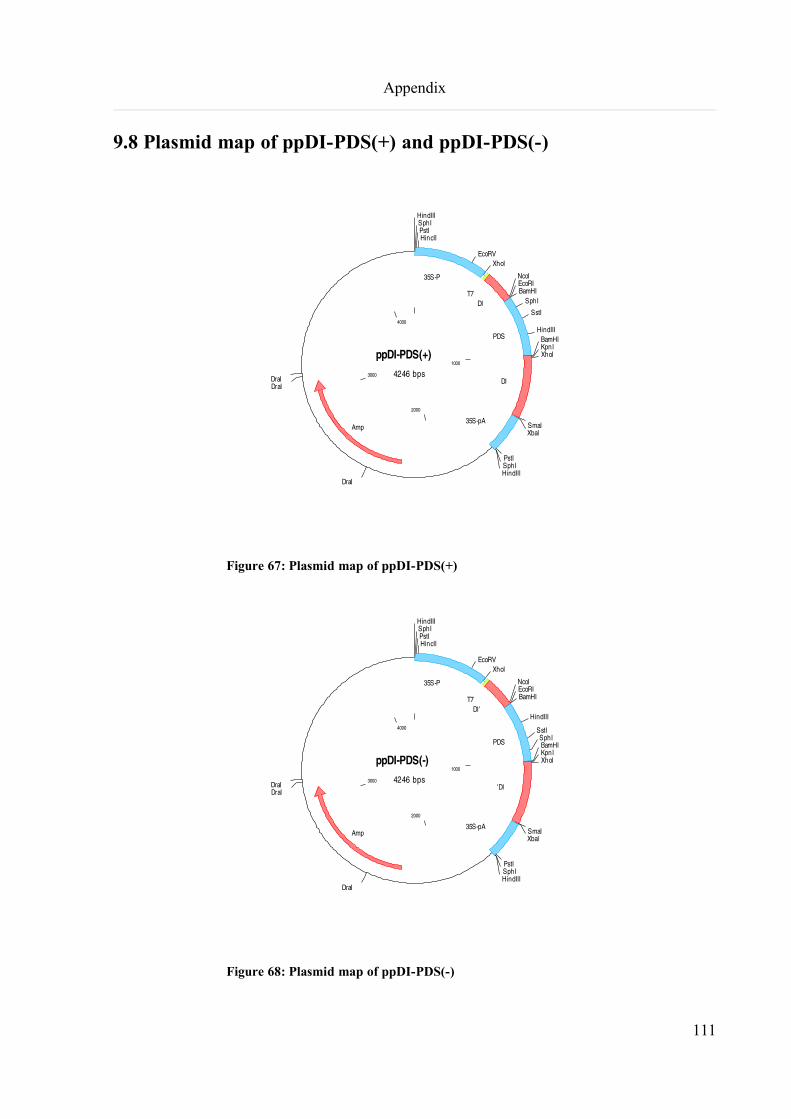
Appendix
9.8 Plasmid map of ppDI-PDS(+) and ppDI-PDS(-)
ppDI-PDS(+)4246 bps
1000
2000
3000
4000
HindIIISphIPstIHincII
EcoRVXhoI
NcoIEcoRIBamHI
SphI
SstI
HindIIIBamHIKpnIXhoI
SmaIXbaI
PstISphIHindIII
DraI
DraIDraI
35S-P
T7DI
PDS
DI
35S-pAAmp
Figure 67: Plasmid map of ppDI-PDS(+)
Figure 68: Plasmid map of ppDI-PDS(-)
111
ppDI-PDS(-)4246 bps
1000
2000
3000
4000
HindIIISphIPstIHincII
EcoRVXhoI
NcoIEcoRIBamHI
HindIII
SstISphIBamHIKpnIXhoI
SmaIXbaI
PstISphIHindIII
DraI
DraIDraI
35S-P
T7DI'
PDS
'DI
35S-pAAmp
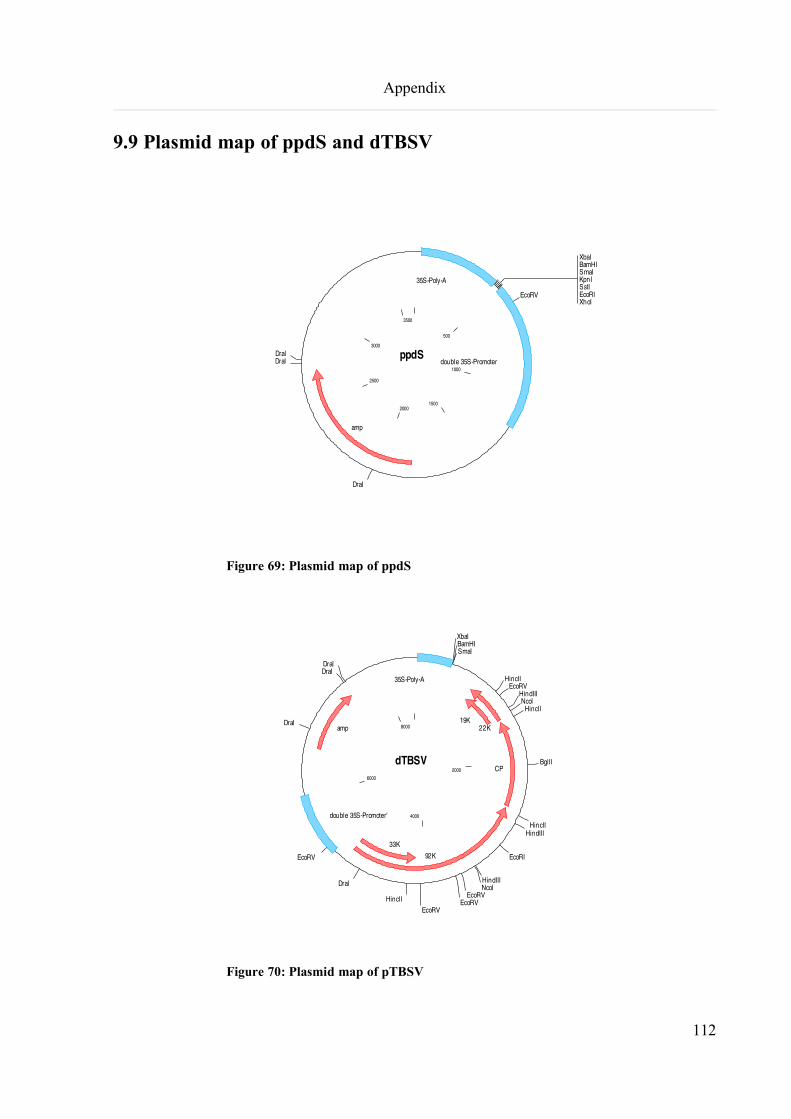
Appendix
9.9 Plasmid map of ppdS and dTBSV
Figure 69: Plasmid map of ppdS
Figure 70: Plasmid map of pTBSV
112
ppdS
500
1000
15002000
2500
3000
3500
XbaIBamHISmaIKpnISstIEcoRIXhoI
EcoRV
DraI
DraIDraI
35S-Poly-A
double 35S-Promoter
amp
dTBSV2000
4000
6000
8000
XbaIBamHISmaI
HincIIEcoRV
HindIIINcoI
HincII
BglII
HincIIHindIII
EcoRI
HindIIINcoI
EcoRVEcoRV
EcoRVHincII
DraI
EcoRV
DraI
DraIDraI
35S-Poly-A
22K19K
CP
92K33K
double 35S-Promoter'
amp
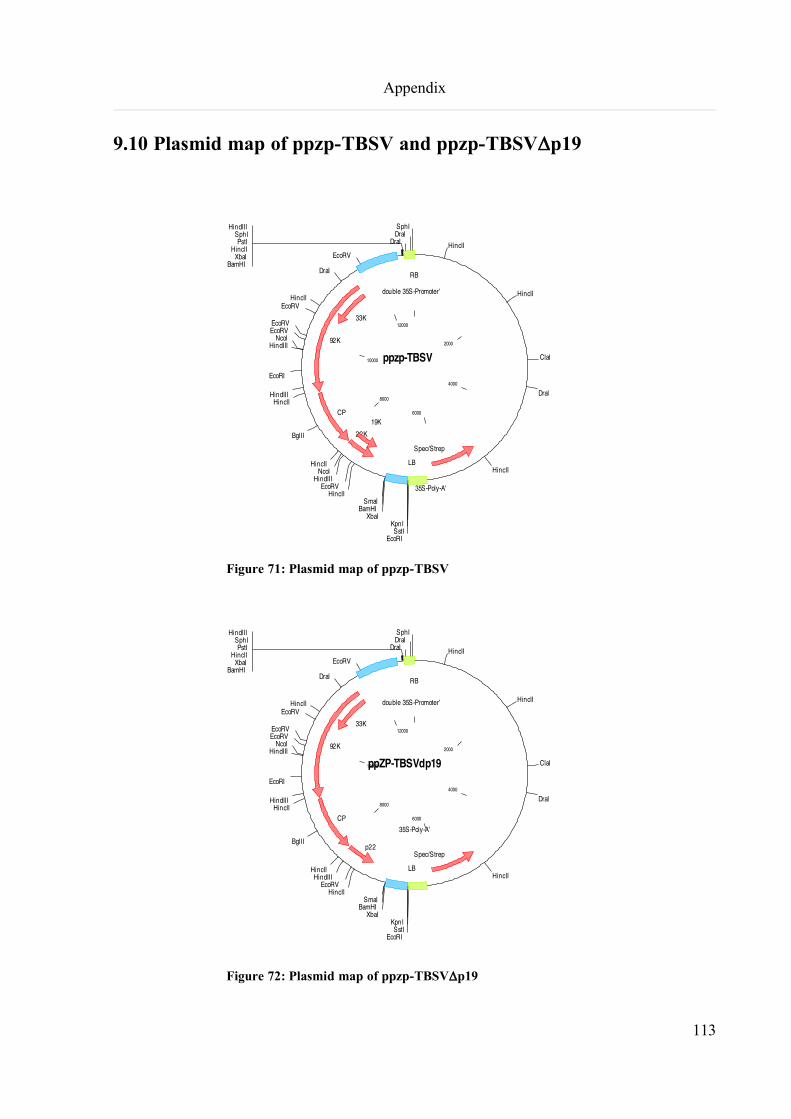
Appendix
9.10 Plasmid map of ppzp-TBSV and ppzp-TBSVDp19
Figure 71: Plasmid map of ppzp-TBSV
Figure 72: Plasmid map of ppzp-TBSVDp19
113
ppzp-TBSV2000
4000
6000
8000
10000
12000
HincII
HincII
ClaI
DraI
HincII
EcoRISstI
KpnIXbaI
BamHISmaI
HincIIEcoRV
HindIIINcoI
HincII
BglII
HincIIHindIII
EcoRI
HindIIINcoI
EcoRVEcoRV
EcoRVHincII
DraI
EcoRVBamHI
XbaIHincII
PstISphI
HindIII
DraIDraISphI
Spec/Strep
LB
35S-Poly-A'
22K
19KCP
92K
33K
double 35S-Promoter'
RB
ppZP-TBSVdp192000
4000
6000
8000
10000
12000
HincII
HincII
ClaI
DraI
HincII
EcoRISstI
KpnIXbaI
BamHISmaI
HincIIEcoRV
HindIIIHincII
BglII
HincIIHindIII
EcoRI
HindIIINcoI
EcoRVEcoRV
EcoRVHincII
DraI
EcoRVBamHI
XbaIHincII
PstISphI
HindIII
DraIDraISphI
Spec/Strep
LB
35S-Poly-A'
p22
CP
92K
33K
double 35S-Promoter'
RB
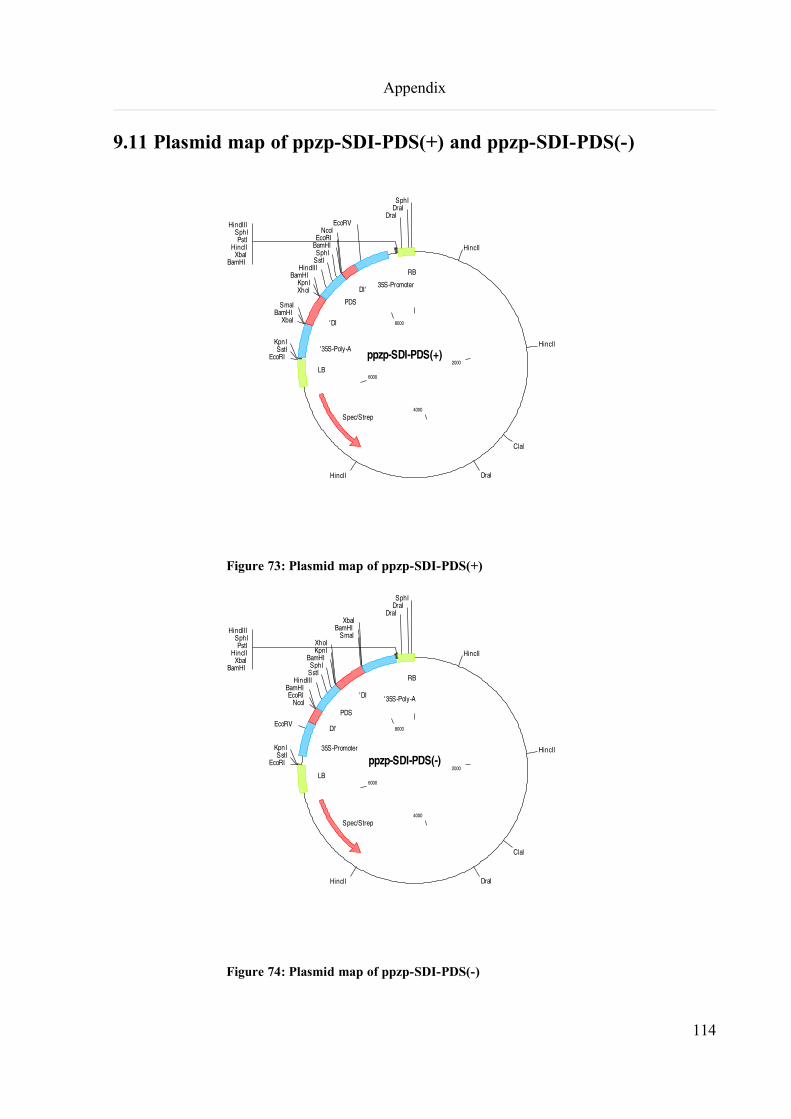
Appendix
9.11 Plasmid map of ppzp-SDI-PDS(+) and ppzp-SDI-PDS(-)
Figure 73: Plasmid map of ppzp-SDI-PDS(+)
Figure 74: Plasmid map of ppzp-SDI-PDS(-)
114
ppzp-SDI-PDS(+)2000
4000
6000
8000
HincII
HincII
ClaI
DraIHincII
EcoRISstI
KpnI
XbaIBamHI
SmaI
XhoIKpnI
BamHIHindIII
SstISphI
BamHIEcoRI
NcoIEcoRV
BamHIXbaI
HincIIPstI
SphIHindIII
DraIDraISphI
Spec/Strep
LB
'35S-Poly-A
'DI
PDS
DI'35S-Promoter
RB
ppzp-SDI-PDS(-)2000
4000
6000
8000
HincII
HincII
ClaI
DraIHincII
EcoRISstI
KpnI
EcoRV
NcoIEcoRI
BamHIHindIII
SstISphI
BamHIKpnIXhoI
SmaIBamHI
XbaI
BamHIXbaI
HincIIPstI
SphIHindIII
DraIDraISphI
Spec/Strep
LB
35S-Promoter
DI'
PDS
'DI '35S-Poly-A
RB
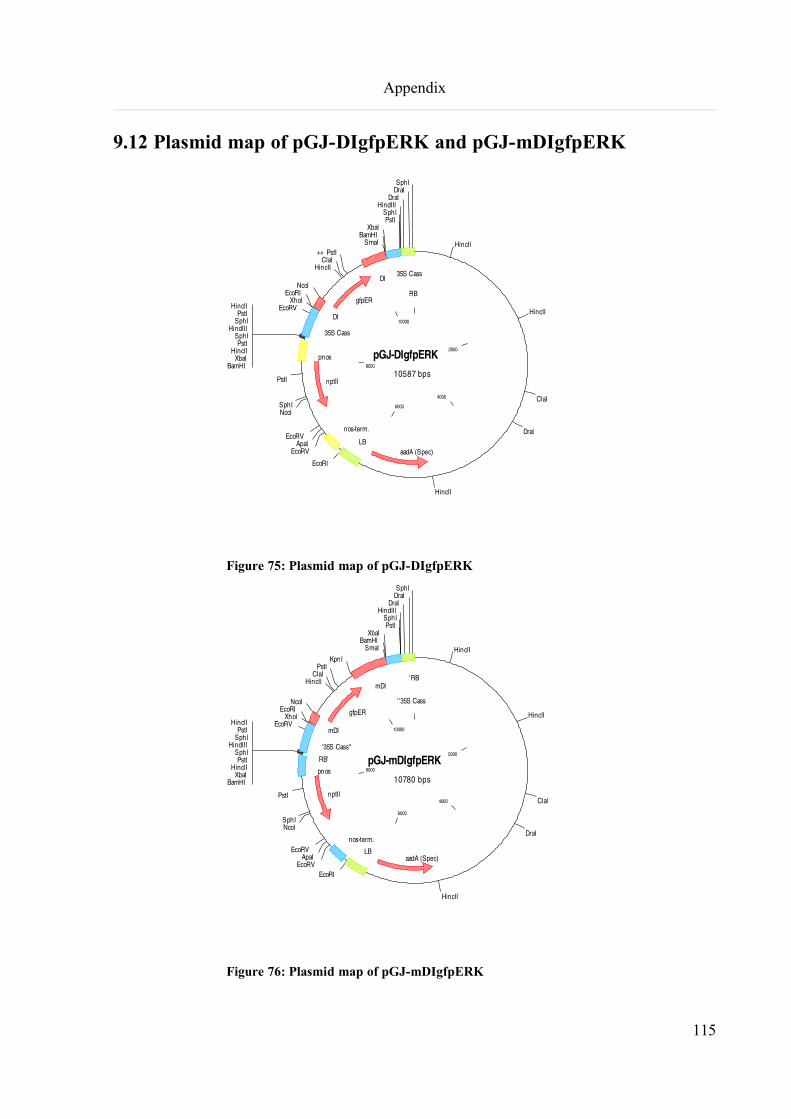
Appendix
9.12 Plasmid map of pGJ-DIgfpERK and pGJ-mDIgfpERK
Figure 75: Plasmid map of pGJ-DIgfpERK
Figure 76: Plasmid map of pGJ-mDIgfpERK
115
pGJ-DIgfpERK10587 bps
2000
4000
6000
8000
10000
HincII
HincII
ClaI
DraI
HincII
EcoRI
EcoRVApaI
EcoRV
NcoISphI
PstI
BamHIXbaI
HincIIPstI
SphIHindIII
SphIPstI
HincII EcoRVXhoI
EcoRINcoI
HincIIClaI
PstI++SmaI
BamHIXbaI
PstISphI
HindIIIDraI
DraISphI
aadA (Spec)LB
nos-term.
nptII
pnos
35S Cass
DI
gfpER
DI35S Cass
RB
pGJ-mDIgfpERK10780 bps
2000
4000
6000
8000
10000
HincII
HincII
ClaI
DraI
HincII
EcoRIEcoRV
ApaIEcoRV
NcoISphI
PstI
BamHIXbaI
HincIIPstI
SphIHindIII
SphIPstI
HincII EcoRVXhoI
EcoRINcoI
HincIIClaI
PstIKpnI
SmaIBamHI
XbaIPstI
SphIHindIII
DraIDraISphI
aadA (Spec)LB
nos-term.
nptII
pnos
RB'
'35S Cass''
mDI
gfpER
mDI
' '35S Cass
'RB