Evaluation of a full-scale lunar-gravity simulator by ... · relation standard. The apparatus and...
50
NASA TECHNICAL NOTE d h d P n z EVALUATION OF A FULL-SCALE NASA TN - D-4474 LOAN COPY: RETURN TO AFWL (WLIL-2) KiRTLAND AFB, N MEX LUNAR-GRAVITY SIMULATOR BY COMPARISON OF LANDING-IMPACT TESTS OF A FULL-SCALE AND A 1/6-SCALE MODEL by UlysseJ. Blanchard Langley Research Center Langley Station, Hampton, Vu. NATIONAL AERONAUTICS AND SPACE ADMINISTRATION WASHINGTON, D. C. JUNE 1968 c https://ntrs.nasa.gov/search.jsp?R=19680016381 2020-04-18T15:07:06+00:00Z
Transcript of Evaluation of a full-scale lunar-gravity simulator by ... · relation standard. The apparatus and...

NASA TECHNICAL NOTE
d h d P n z
EVALUATION OF A FULL-SCALE
N A S A TN- D-4474
LOAN COPY: RETURN TO AFWL (WLIL-2)
KiRTLAND AFB, N MEX
LUNAR-GRAVITY SIMULATOR BY COMPARISON OF LANDING-IMPACT TESTS OF A FULL-SCALE AND A 1/6-SCALE MODEL
by UlysseJ. Blanchard
Langley Research Center Langley Station, Hampton, Vu.
NATIONAL AERONAUTICS AND S P A C E ADMINISTRATION WASHINGTON, D. C. JUNE 1 9 6 8
c
https://ntrs.nasa.gov/search.jsp?R=19680016381 2020-04-18T15:07:06+00:00Z

'IllllllIll1111111WllllllllllllIIIH1111Ill 0333052
NASA TN D-4474
EVALUATION OF A FULL-SCALE LUNAR-GRAVITY SIMULATOR
BY COMPARISON OF LANDING-IMPACT TESTS OF A
FULL-SCALE AND A 1/6-SCALE MODEL
By Ulysse J . Blanchard
Langley Research Center Langley Station, Hampton, Va.
Technical Film Supplement L-993 available on request.
NATIONAL AERONAUTICS AND SPACE ADMINISTRATION
For sale by the Clearinghouse for Federal Scientific and Technical Information Springfield, Virginia 22151 - CFSTI price $3.00

EVALUATION OF A FULL-SCALE LUNAR-GRAVITY SIMULATOR
BY COMPARISON OF LANDING-IMPACT TESTS OF A
FULL-SCALE AND A 1/6-SCALE MODEL
By Ulysse J. Blanchard Langley Research Center
SUMMARY
In order to subject the structural components of the prototype lunar module (LM) to the dynamic loads and conditions imposed during lunar -landing impact, full-scale tests were needed. To conduct such full-scale tests on earth, lunar gravity must be simulated. A lunar-gravity simulator for conducting landing-impact tests of a full-scale vehicle was constructed and evaluated. Results of landing tes ts of a full-scale test model of the LM conducted on the lunar-gravity simulator compare favorably with results of free-body tests of a similar 1/6-scale dynamic model conducted under earth gravity. Landing-gear strokes, center-of -gravity accelerations, and pitching motions were in good agreement. The full- scale simulator adequately reproduces two-dimensional landing-impact dynamics and is suitable for conducting detailed studies of prototype LM structure during landing impact. The effect of structural elasticity on landing motions and stability could also be investigated with the simulator.
INTRODUCTION
In the development of a soft-landing vehicle such as the lunar module (LM), landing stability and structural integrity a re of great importance. Landing stability of the LM has been extensively investigated with small-model tests and computer analyses. Structural studies of a single landing gear have also been made during controlled drop tests. However, landing of an actual full-size prototype vehicle will occur only in the first Apollo mission involving a landing on the remote lunar surface. Prior to this event, tests of full-size vehicles on earth a re needed in order to subject prototype structural components to landing-impact dynamics and loads typical of a lunar landing. The present paper evaluates a facility for proof loading prototype structures during landing impact at simulated lunar gravity by comparing experimental results with those from free-body model tests.

In order to obtain dynamic similarity during landing tests of a full-scale lunar vehicle on earth, the lunar gravity must be simulated. Various methods have been proposed for simulating lunar gravity for landing-impact tests (refs. 1, 2, and 3). Results of the small-model investigation reported in reference 3 indicated that a technique which employed a cable-supported vehicle and an inclined-plane landing surface was a suitable and economical method for conducting those full-scale LM landing tests which involve essentially planar motions.
A full-scale inclined-plane simulator and a full-size test model were constructed and put into operation at Langley Research Center. The test model has the geometric and mass-inertia properties of the LM and is also configured for later incorporation of prototype structural components. In the present paper, dynamic behavioral results from eight selected landing tests of the full-scale model on the lunar-gravity simulator are compared with corresponding results of free-body tests of a similar l/6-scale dynamic model under earth gravity. Vehicle motions, accelerations, and landing-gear strokes a re compared. By using the free-body 1/6-scale model as a standard, the correlation achieved should be significant in determination of the suitability of the full-scale simulator for conducting tests of prototype components.
SYMBOLS
The units used for the physical quantities defined in .this paper a re given both in U.S. Customary Units and in the International System of Units (SI). (See ref. 4.) Appendix A presents factors relating these two systems.
g acceleration due to gravity, 32.2 ft/sec2 (9.81 meters/second2)
vh horizontal velocity, ft/sec (meters/second)
VR resultant velocity, ft/sec (meters/second)
V V vertical velocity, ft/sec (meters/second)
body axes
P gravitational ratio, ratio of the gravity field of the model (earth gravity o r one-sixth earth gravity) to the lunar gravity (one-sixth earth gravity)
Y flight-path angle, deg
2

x
P
geometric model scale, ratio of the characteristic model dimension to the prototype dimension
coefficient of friction
DESCRIPTION OF MODELS
Two test vehicles and two test techniques were used for the present investigation. (See fig. 1.) A full-size model of the LM was tested on the inclined-plane lunar-gravity simulator, and a similar 1/6-scale dynamic model was tested as a free body with earth gravity acting upon it. The two models were dynamically similar because the important parameters for similarity, such as mass, center-of-gravity location, mass moments of inertia, landing-gear geometry, energy-absorption characteristics, and minimum vehicle elasticity, were adequately scaled for these comparative purposes.
Full-Scale Model
The full-scale model used for the lunar-gravity simulator tes ts is shown in figures 2 and 3. The modelPertinent characteristics a re given in figure 3 and table I. was designed and constructed at the Langley Research Center.
Body frame.- The primary structural frame of the full-scale model (fig. 2) is made of welded 4130 steel tubing. Four steel outrigger trusses provide the attachment points for the landing-gear struts. The frame is designed to accommodate the necessary ballast to approximate the mass and inertial properties of the LM. The model does not duplicate the elastic characteristics of the prototype LM body. All available mass is used for ballast and structure, and the result is a model both stronger and less flexible than the prototype. The present body configuration is tailored to provide for simulator suspension and launch equipment as well as later incorporation of the LM prototype landing-gear and descent-stage structures.
Landing gear.- The landing gear used for the full-scale tests, constructed at the Langley Research Center and shown in figure 4, is a heavier and stronger version of the 160-inch (4.1-m) radius gear of the early LM. The additional strength assured structural integrity and met the requirements of the present tests since dynamic behavior, and not detailed structural characteristics, of the two models is to be compared. Each of the four landing-gear assemblies consists of a prjmary strut (with a footpad at its lower end) and two secondary struts. The arrangement shown in figure 4 is referred to as the "cantilever" gear. Details of the strut assemblies are shown in figure 5. The landing-gear struts are constructed of 7075-T6 aluminum. The primary strut consists of an inner cylinder, an outer cylinder connected through a universal joint at its upper end to the outrigger truss, and a crushable aluminum honeycomb cartridge that acts in compression to absorb energy. Each secondary strut consists of an inner cylinder
3

connected through a sleeve-journal universal joint to the outer cylinder of the primary strut, an outer cylinder connected through a universal joint to the outrigger truss, and an arrangement of honeycomb cartridges that can absorb energy while the double-acting secondary strut is lengthening or shortening. The mechanical design of the secondary strut is such that during a tension (lengthening) stroke of the strut one honeycomb cartridge is crushed, and during the compression (shortening) stroke a different cartridge is crushed. (See fig. 5.) All s t ruts were vented to minimize air entrapment.
Shock absorbers.- The energy-absorbing cartridges used for the present tests were aluminum honeycomb cylinders. (See fig. 6.) These cylinders were crushed in compression (accordion-like column failure) by the landing loads imposed upon the telescoping landing-gear struts. Each cylinder stage was designed to crush at a predeter
.mined force level which remains essentially constant during the strut stroke. The crush loads of the struts were staged, and nominal static crush load and stroke characteristics for the present tests are shown in table I.
1/6-Scale Model
A photograph of the 1/6-scale model used for the free-body (earth-gravity) tests is shown in figure 7. Pertinent characteristics a r e presented in table 11. Scale factors relating the 1/6-scale model parameters to the full-scale a re given in appendix B and described in reference 5. Because of the evolution of the LM design, the full-scale model does not represent the current LM except in general configuration. The 1/6-scale model is dynamically similar to the present full-scale model. (See tables I and II.)
The model body is formed by two beams of triangular cross section 90° apart which intersect at a center post or mast. The lightweight beam structure consists of an aluminum frame covered with an aluminum skin (monocoque). The four landing-gear legs a r e attached at the outer ends of the beams, and the hollow center mast accommodates necessary ballast, instrumentation, and launch equipment. The landing gear, shown in figure 8, is constructed of machined aluminum and has geometry and shock-absorption characteristics similar to the full-scale model. (See tables I and II.)
APPARATUS AND PROCEDURE
In order to evaluate the landing-impact dynamics of the full-scale model on the lunar-gravity simulator, the 1/6-scale free-body dynamic-model test was used as a correlation standard. The apparatus and procedures used for conducting these full-scale and 1/6-scale comparison tes ts a r e described in the following sections.
Full-scale Test
The lunar-gravity simulator (fig. 9) at the Langley lunar landing research facility consists of an inclined-plane landing surface, an overhead trolley and track, and a 4

fixed-length cable which supports the test model from the overhead trolley in a near-horizontal position on the landing surface. Lunar gravity is obtained by displacing the model from directly beneath the overhead trolley so that the force exerted statically by the model on the landing surface is equal to its lunar weight. (See fig. 1.) Another system of cables and winches is used to position the model so that gravity can impart the desired landing speeds.
Support system.- The overhead track and trolley a re installed on the upper longitudinal t russ of the Langley lunar landing research facility. The slotted track consists of a pair of rails formed by weldments of parallel steel beams. The free-rolling unpowered trolley is located between the track rails to provide a mobile support system capable of a 200-ft (61-m) horizontal translation. The model support cable is attached to the trolley eye bolt which protrudes through the track slot.
The fixed-length support cable is approximately 190 f t (58 m) long, and its axis passes through the modei center of gravity. This support-cable geometry provides freedom in pitch but constrains the model in roll and yaw. The support-cable angle relative to the local earth vertical is nominally 9-
2 10 so that with the model at res t on the landing
surface (flat impact attitude), the "gravity" with respect to the surface is one-sixth earth gravity. Displacement of the center of gravity of the model normal to the landing surface due to touchdown attitude, pitch motions, or landing-gear stroke produces small changes in the support-cable angle and subsequently a very small gravity-ratio change (0.015 o r less) as determined in reference 6. The trolley translates and follows the model centerof-gravity motions parallel to the landing surface (that is, along the horizontal velocity vector) by means of the connecting support cable. The ratio of the mass of the trolley and cable to that of the model w a s approximately 1 to 28 for the present investigation.
Landing surface.- The landing surface (fig. 10) is a wood-faced, movable, structural-steel frame supported on steel rails which a re embedded in a concrete slab foundation. Five triangular trusses support the .371-- by 100-ft (11- by 30-m) frame at
2 an angle of 91'2 from the vertical. The landing surface consists of pine planks 3 in. (0.08 m) thick bolted to the steel frame, and covered with fir plywood for the present tests. (See figs. 10 and 11.) The landing-surface structure has a mass of approximately 60 tons (54400 kg). The structure can be anchored to the concrete slab with chain load-binders during landing tests, moved to desired impact positions, or stored clear of the test area.
In the present test, with the aluminum pads on the fir plywood, the coefficient of friction for sliding was approximately 0.4. A coefficient of friction of about 0.7 was obtained by applying a coarse grit material to the pad surfaces. A coefficient of friction of 03 was simulated by replacing the pads with steel spikes which penetrated the wood surface.
5

Launch system.- Landing velocities are obtained with a cable-launch system comprising electric winches, a double-cable pendulum, and a pullback or release cable (figs. 9, 10, and 11). Vertical velocity is obtained by pulling the model a predetermined distance from the landing surface with the pair of pendulum cables (figs. 9 and 10). When the model is released, it is accelerated by gravity to attain the desired velocity at impact. Simultaneous separation of the pendulum cables permits the model to swing on the support cable onto the landing surface. Cable separation is effected with explosive bolts at a cable-model connector fixture. A parallelogram linkage formed by this pair of cables, the cable-winch fairleads, and the model connection brackets provides the means for obtaining horizontal velocity relative to the landing surface. The model is retracted a predetermined distance through an a r c prescribed by the pendulum and support cables with the pullback o r release cable (figs. 9 and 11). The pullback cable acts in a plane approximately parallel to the landing surface, or 90° from the pendulum cables. When the model is released by the pullback cable, it accelerates under the influence of gravity through the pendulum a r c to dead center (maximum horizontal velocity relative to the landing surface). At this point, the model is automatically released from the pendulum cables by a sensor switch, falls toward the landing surface, and accelerates to the desired vertical velocity. All launch cable connections are designed so that their lines of action pass through the model center of gravity and separate at the model. The pitch attitude of the model relative to the landing surface is preset with special pendulum-cable connector brackets (pendulum cables always of equal length). During retraction, flight, and landing impact, the overhead trolley responds to the movement of the model through the connecting support cable. The trolley moves with the 'model to provide planar motion during impact and slideout.
Test parameters. - The orientation of model axes, accelerations, attitudes, velocity vectors, and flight-path angle during landings is shown in figure 12. Two symmetric landing-gear orientations were used for the present tests: one gear leg leading and one trailing (1-2-1 orientation), and two gear legs leading and two trailing (2-2 orientation). The landings made with the full-scale model were duplicates of those made with the l/6-scale free-body model. The conditions for each of the eight landings a re listed in table III.
Instrumentation and measurements. - Landing-impact accelerations were measured at the model center of gravity with linear servo accelerometers rigidly mounted on a platform attached to the lower face of the large lead-filled counterweight (see figs. 2 and 3). To measure normal, longitudinal, and angular accelerations, 50g accelerometers having natural frequencies of approximately 650 cycles per second were used. They were damped to about 65 percent of critical damping. Angular acceleration was measured by coupling a pair of linear accelerometers which had been adjusted so that their response and phase characteristics were identical. The response of the recording galvanometers
6

w a s flat to 24 cycles per second (24 hertz) for the angular and longitudinal accelerometers. Signals of the normal accelerometer were fed through two recording galvanometers , one having a flat response to 24 cycles per second and the other to 120 cycles per second. Axial forces on the landing-gear struts were measured with resistance-wire strain gages installed on the truss-connection fittings of each of the 12 struts. Response of the recording galvanometers was 240 to 360 cycles per second. Total strut strokes were obtained by measuring the honeycomb-cartridge lengths before and after each landing. Landing impacts were visually observed and were also recorded by motion-picture cameras located at the overhead track. Motion pictures (taken at 24 and 64 frames per second) were used to determine model landing pitch attitude and attitude change during the landing impact.
1/6-Scale Test
A conventional and much used small-model technique described in reference 5 was used to conduct the free-body 1/6-scale model tests. Model. scale factors were selected to provide dynamic similarity under the full influence of earth gravity; that is, the acceleration-gravity ratio of the 1/6-scale model was equal to the acceleration-gravity ratio of the full-scale model at lunar gravity. Landings were made by launching the model as a free body from a four-bar pendulum mechanism illustrated in figure 1. The test parameters, landing-surface characteristics, type of instrumentation, and measurements were similar to those for the full-scale tests. However, the axial forces on the landing-gear struts were not measured. Camera recording speeds were 128 and 400 frames per second. The tes ts were conducted indoors. Landings of the 1/6-scale model were made over a sufficient range of speeds and attitudes to provide comparative data and also to establish stability and gear stroke limits for the full-scale tests. Eight of these landing conditions were selected for duplication during the full-scale landing tests.
RESULTS AND DISCUSSION
Accelerations a r e expressed in te rms of earth gravity. Gear stroke, vehicle acceleration, and pitching data obtained during the full-scale and 1/6-scale model tes ts are compared.
A motion-picture supplement L-993 showing the tests discussed in this paper has been prepared and is available on loan. A request card form and a description of the film are included at the back of this paper.
7

Landing-Gear Stroke
In general, the stroking patterns of corresponding struts of both models were similar for duplicate landing conditions. In several cases, the secondary struts stroked erratically, usually in the case of very small strokes. These occurrences were about equally divided between the two models, and were caused by variations in symmetry of landing, landing-surface friction, and rebound characteristics (elasticity) of the two models.
The correlation of primary-strut stroke between the full-scale and 1/6-scale models during simulator and free-body tests, respectively, is shown in figure 13. The percentages of design stroke used during each landing by each of the four corresponding primary struts of the 1/6-scale and full-scale models are plotted as ordinate and abscissa, respectively, for the eight comparative landings. The solid line (1to 1 slope) represents exact correlation. Good correlation is indicated by the equal distribution of the data points on either side of the solid line. Most of the data points fall within a 10-percent zone (dashed lines) on either side of the exact-correlation line.
The scatter in primary-strut stroke data suggests similar variations in strut energy-absorption forces. The total first-stage axial forces measured on the four primary struts during eight full-scale landings a r e presented in figure 14. The data points are the aggregate forces due to dynamic crushing of the honeycomb cartridge, strut-bearing friction, secondary-strut components, and possibly some pumping due to entrapped air. The hatched band below the data points is the predetermined static crush-force range (nominal *5 percent) of the first-stage honeycomb cartridges (table I). The increase in the average of the measured axial force over the static honeycomb crush force is primarily due to dynamic (strain-rate) effect on the honeycomb crush force and strut-bearing friction (binding) inherent with the "cantilever" design of the primary strut. Variations in bearing friction, secondary-strut component, and landing conditions result in some data scatter. Most of the data points a r e within *9 percent of the average value. This is indicative of the scatter experienced in strut-stroke measurements (fig. 13).
Center -of -Gravity Acceleration
A comparison of the time histories of center-of-gravity accelerations obtained during full-scale and 1/6-scale model landings is shown in figure 15. The time histories are generally in good agreement with respect to acceleration magnitudes, patterns, and time durations. The dissimilarities noted between some of the time histories are probably due to differences in actual landing speed, orientation and attitude, landing-surface friction, structural elasticity, and instrumentation of the two models. These dissimilarities are considered acceptable in the general correlation between the two model tests.
8
. ..... . .... ... - . - .. . ... ... ...--.-_..-.- _._ . I

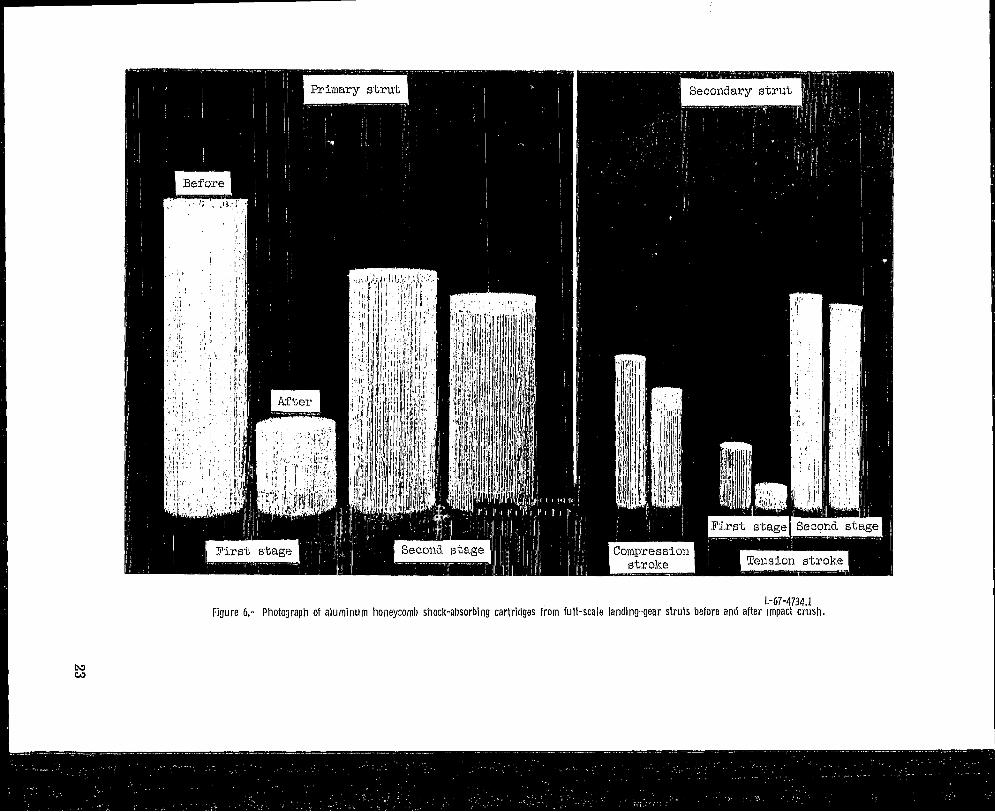
The correlation of maximum center-of-gravity normal accelerations between the ful l -scale and 1/6-scale models during simulator and free-body landing tests, respectively, is shown in figure 16. The overall correlation of time and load values indicates that the impact-load experience of the full-scale model on the simulator was similar to that of the free-body 1/6-scale model. Therefore, prototype structural components incorporated into the full-scale model would be subjected to typical lunar-landing load experiences.
Pitching Motion
Since the internal forces (mass and inertia) and the applied forces (force-stroke and acceleration) are similar for the tests of the two models, motions should also be similar. Time histories of pitching motion during landing impacts were obtained from motion-picture film and a r e compared in figure 17 for eight landings of both models. For all landings presented, the model is initially at a positive pitch attitude (fig. 17) and impact 1 (0 sec) occurs on one or two rear legs, depending upon the gear orientation. As a result of impact 1 the model rotates (pitches) downward, and impact 2 occurs when the front leg or legs contact the surface. Approximate time of impact 2 is indicated by the arrows. The actual pitch attitude at touchdown is noted at zero time. For the full-scale tests, in most cases the touchdown attitude was within 1 / 2 O of the preset value of 15O. For landing 2, a pitching velocity was inadvertently imposed during launch, and a maximum e r ro r of about 3 O was obtained. The 1/6-scale model data shows variations of about 1' from nominal. The pitch time histories of the two models compare very well, and the time to second impact correlates within less than 0.1 sec for all but one of the landings. The general correlation obtained for initial- and second-impact angles and time between the two is summarized in figure 18. The values obtained during each landing of the 1/6-scale and full-scale models a re plotted as ordinate and abscissa, respectively. The overall agreement is good.
Landing Stability
The pitching time history in figure 19 is a continuation of landing 8 (fig. 17) to show the rocking motion. Subsequent to the second impact, the rear legs lifted off the surface and returned to cause a third (final) impact. The maximum pitch attitude reached by both models during the stability rock was in close agreement. The discrepancy in time between the two models for the occurrence of the final impact is about 0.35 sec over a total period of about 4 sec. The correlation achieved between the two present model tests adds to the confidence in using small-model and computerized analytical studies for extensive and general investigations of rigid-body stability parameters. However, reproduction of prototype elastic behavior in small-scale models or analytical programs is difficult. Limited studies of the effect of structural elasticity on landing motions and
9

stability should be possible if prototype structural components are incorporated in the present full-scale model.
CONCLUDING REMARKS
Comparison of results of landing te.qts of a full-scale test model of the lunar module conducted on the lunar-gravity simulator compare favorably with results of free-body tests of a similar 1/6-scale dynamic model conducted under earth gravity. Landing-gear strokes, center-of-gravity accelerations, and pitch motions were in good agreement. The full-scale simulator adequately reproduces two-dimensional landing-impact dynamics, and is considered suitable for conducting detailed studies of the characteristics and integri ty of prototype LM structural components during landing impact at lunar gravity. The effect of prototype structural elasticity on landing motions and stability could also be investigated.
Langley Research Center, National Aeronautics and Space Administration,
Langley Station, Hampton, Va., February 13, 1968, 124-08-04-09-23.
10

APPENDIX A
CONVERSION OF U.S. CUSTOMARY UNITS TO SI UNITS
The International System of Units (SI) was adopted by the Eleventh General Conference on Weights and Measures held in Paris in 1960. (See ref. 4.) Conversion factors for the units used are given in the following table:
Physical quantity U.S. Customary Conversion SI Unitunit factor (*) (**I
Length . . . . . . . . .
in. f t
0.0254 0.3048
meters (m) meters (m)
M a s s . . . . . . . . . slug 14.594 kilograms (kg)
Force . . . . . . . . lbf 4.4482 newtons (N)
Moment of inertia . . slug-ft2 1.3558 kilogram-meters2 (kg-m?
Velocity . . . . . . . *
ft/sec 0.3048 meters/second (m/s)
Multiply value given in U.S. Customary Unit by conversion factor to obtain equivalent value in 'SI Units.
**Prefixes to indicate multiples of units are as follows:
Prefix Multiple
centi ( c ) kilo (k)
11

APPENDIX B
SCALE RELATIONSHIPS
__ ...... -.
Quantity .. . - ~..
Lengtha . . . . . . . . . . . . Linear accelerations . . . . . Stressa (shock absorber) . . . A r e a , . . . . . . . . . . . . . Force . . . . . . . . . . . . . Mass . . . . . . . . . . . . . Moment of iner t ia . . . . . . . Velocity . . . . . . . . . . . . Time . . . . . . . . . . . . . Angular acceleration . . . . .
-.
aScale factor preselected.
= Geometric model sca ld
Lp = Gravitational ratio J
--.
Lunar prototype Full-scale model 1/6-scale mode (A = 1; = 1) (X = 1/6; P = 6)
1 1 XI
a a Pa U U U
12 A X2A
uA F X2F
F/a m ~ 3 m
mL2 I X ~ I
m V V
V/a t A t
l / t 2 CY Z/h2CY
12

REFERENCES
1. Carden, Huey D.; Herr, Robert W.; and Brooks, George W.: Technique for the Simulation of Lunar and Planetary Gravitational Fields Including Pilot Model Studies. NASA T N D-2415, 1964.
2. Garba, J. A.: A Comparison of Some Predicted and Measured Variables for ' a Full-Scale Surveyor Drop Test. Tech. Rep. 32-1084 (Contract No. NAS7-loo), Jet Propulsion Lab., California Inst. Technol., Mar. 1, 1967.
3. Blanchard, Ulysse J.: Model Investigation of Technique for Conducting Full-scale Landing-Impact Tests at Simulated Lunar Gravity. NASA T N D-2586, 1965.
4. Comm. on Metric Pract.: ASTM Metric Practice Guide. NBS Handbook 102, U.S. Dep. Com., Mar. 10, 1967.
5. Blanchard, Ulysse J.: Characteristics of a Lunar Landing Configuration Having Various Multiple-Leg Landing-Gear Arrangements. NASA TN D-2027, 1964.
6. Hewes, Donald E.; and Spady, Amos A., Jr.: Evaluation of a Gravity-Simulation Technique for Studies of Man's Self -Locomotion in Lunar Environment. NASA TN D-2176, 1964.
13

TABLE 1.- PERTINENT CHARACTERISTICS OF FULL-SCALE MODEL
Model mass. slugs (kg) . . . . . . . . . . . . . . . . . . . . . . . . . . . 394.4 ( 5756) Moment of inertia. slug-ft2 (kg-m2):
Pitch . . . . . . . . . . . . . . . . . . . . . . . . . . . . . . . . . . . . 9600 (13000) Yaw . . . . . . . . . . . . . . . . . . . . . . . . . . . . . . . . . . . . . Constrained Roll . . . . . . . . . . . . . . . . . . . . . . . . . . . . . . . . . . . . . Constrained
Height of center of gravity above ground line. in. (m) . . . . . . . . . . . . 139 ( 3.53) Landing-gear radius. in. (m) . . . . . . . . . . . . . . . . . . . . . . . . . 160 ( 4.06) Landing-gear mass. slugs (kg) . . . . . . . . . . . . . . . . . . . . . . . 25.2 ( 368) Landing-gear strut stroke. in. (m):
Primary. first stage . . . . . . . . . . . . . . . . . . . . . . . . . . . . . 14.7 ( 0.373) Primary. second stage . . . . . . . . . . . . . . . . . . . . . . . . . . . 10.8 ( 0.274) Secondary compression . . . . . . . . . . . . . . . . . . . . . . . . . . . 7.4 ( 0.188) Secondary tension. first stage . . . . . . . . . . . . . . . . . . . . . . . . . 3.0 ( 0.076) Secondary tension. second stage . . . . . . . . . . . . . . . . . . . . . . 10.5 ( 0.267)
Honeycomb-cartridge static crush force. Ibf (N). &5%: Primary. first stage . . . . . . . . . . . . . . . . . . . . . . . . . . . . 6000 (26 700) Primary. second stage . . . . . . . . . . . . . . . . . . . . . . . . . . 12 000 (53400) Secondary compression . . . . . . . . . . . . . . . . . . . . . . . . . . 5000 (22 200) Secondary tension. first stage . . . . . . . . . . . . . . . . . . . . . . . 1500 ( 6670) Secondary tension. second stage . . . . . . . . . . . . . . . . . . . . . 6000 (26 700)
14

TABLE II.- PERTINENT CHARACTERISTICS OF 1/6-SCALE MODEL
Model mass. slugs (kg) . . . . . . . . . Moment of inertia. slug-ft2 (kg-m2):
Pitch . . . . . . . . . . . . . . . . . . Roll . . . . . . . . . . . . . . . . . . Yaw . . . . . . . . . . . . . . . . . .
Height of center of gravity above ground line. in. (m) . . . . . .
Landing-gear radius. in. (m) . . . . . . Landing-gear mass. slugs (kg) . . . . . Landing-gear strut stroke. in. (m):
Primary. first stage . . . . . . . . . . Primary. second stage . . . . . . . . Secondary compression . . . . . . . . Secondary tension. first stage . . . . . Secondary tension. second stage . . .
Honeycomb cartridge static crush force. lbf (N). *5%: Primary. first stage . . . . . . . . . . Primary. second stage . . . . . . . . Secondary compression . . . . . . . . Secondary tension. first stage . . . . Secondary tension. second stage . . .
l/G-scale magnitude ~
1.78 ( 26.0)
1.7 ( 2.3) 1.7 ( 2.3) 1.1 ( 1.5)
22.7 ( 0.577) 26.7 ( 0.678) 0.19 ( 2.8)
2.45 ( 0.062) 1.80 ( 0.046) 1.23 ( 0.031) 0.5 ( 0.013)
1.75 ( 0.044)
167 ( 743.0) 333 (1481.0) 139 ( 618.0) 4 1 ( 182.0)
167 ( 742.0)
Magnitude scaled to fu l l size
384.5 (5611.4)
13 200 ( 17 900) 13 200 ( 17 900)
8500 (11600)
136 ( 3.45) 160 ( 4.06)
41.0 ( 598)
14.7 ( 0.373) 10.8 ( 0.274)
7.4 ( 0.188) 3.0 ( 0.076)
10.5 ( 0.267)
6000 (26700) 12 000 (53 400)
5000 (22200) 1500 ( 6670) 6000 (26700)
15

.,.. , , ._.. .. . .. -
TABLE III.- LANDING-TEST CONDITIONS FOR
FULL-SCALE AND 1/6-SCALE MODELS
.. ~- ._
Preset pitch
.. ~Landing orientation attitude, P
~ _ __ .-~ _ _ _ -
15 D.4 15 4.6 0 0 15 .4 10 3.0 10 3.0 15 .7 15 4.6 0 0
4 15 .7 10 3.0 6 1.8 1-2-1 15 .7 12 3.7 0 0 1-2-1 15 .7 10 3.0 10 3.O
deg ft/sec m/sec
15 00 10 3.0 01 ! 1 ;:; 15 00 10 3.0 0 8
~~
2.4
16

:. ..... ....'> . ......ff6l g
Inclined plane
Figure 1.- Sketch i l lustrat ing techniques used for conducting landing-impact tests of full-scale and 1/6-scale LM models.

Figure 2.- Photograph of full-scale model. L-66-9297.1

Figure 3.- General arrangement of the full-scale model. Dimensions are given first i n inches and parenthetically i n meters.
19

Figure 4.- Photograph of full-scale landing gear constructed at Langley Research Center. L-66-9723.1
20

Crushable aluminum honeycomb cartridge r 7.252 diam (0.184) r 5.750 dim (0.146)
(a) Pr imary strut.
Figure 5.- Full-scale landing-gear struts. Dimensions are given f i rst i n inches and parenthetically i n meters.

N N
Crushable aJ.uminum honeycomb cartridge
Compression stroke Tension stroke
(b) Secondary strut.
Figure 5.- Concluded.
1-67-4734.1 Figure 6.- Photograph of a luminum honeycomb shock-absorbing cartridges from full-scale landing-gear struts before and after impact crush.

Figure 7.- Photograph of 11’6-scale model, L-65-567.1

Figure 8.- Photograph of 1/6-scaie landing gear. 1-65-570 .I
25

Langley lunar landing/- research f a c i l i t y
Figure 9.- Sketch showing general arrangement of fu l l -scale lunar-gravi ty s imulator.

Figure 10.- Photograph of full-scale model being retracted for vertical impact velocity Vv. L-66-6082.1

h~wr*f;cable I
?
i
Figure 11.- Photograph of full-scale model being retracted for hor izontal impact velocity vh, I.-66-6083.1

Y
Landing surface LongitudinatL accel.erakLon
Oo pitch attitude a-- .--
tan-1 "v-'h
Figure 12,- Sketches Ident i fy ing axes, accelerations, attitudes, speeds, and f l ight path.

-. w 0
/ /
80 - Ekact correlation
60
40
20
0
Full-scale model stroke, percent of design
Figure 13.- Correlation of pr imary-strut strokes of full-scale and 1/6-scale models d u r i n g landing tests. Design stroke ( f i r s t p lus second stage) i s 25.5 in. (0.648 m).

I
T-Average axid force (first stage)
HoneyconitbcaxtriQe static crush force (first stage)
Laading-gear nuuiber
Figure 14.- Pr imary -s t ru t axial forces measured d u r i n g fu l l -scale model landing tests.
31
I

-----
f 41bD
d 0 2 .. Impact128d 0
3 0
1 i
#2 -m
0 V (d
fB ! x
Full-scale mDdel ------1/6 -scale m ~ d e l
Impact 2
-
-
Landing 1
(Orientation, 2 2 )
Pitch (preset) . . . 15"
Vv . . . . . . . . .15 ft/sec (4.6 m/sec)
V h . . . . . . . . . o
)1 . . . . . . . . .0.4
*.+I- ~I ..... ---I-- _.I.I- - -.I- ..... .... I-J .2 .4 .6 .a
Time, 6ec
Figure 15.- Comparison of center-of-gravity accelerations d u r i n g landings with full-scale and 1/6-scale models. A l l values are full scale.
:32
...---.---.......................... . . . . . . . . . . . . . . . . . . . . . . . . . . . . . .

Figure 15.- Continued.
33

(Orientation, 2-2)
Pitch (preset) . . .15" Vv . . . . . . . . . 15 ft/sec (4.6 m / s e c )
Time, 6eC
Figure 15.- Continued.
834

- - 1. - - 1 I 1 I I I 1 0 .2 .4 .6 .a
Time, sec
Figure 15.- Continued.
35

-tn $ 2 9 bo
3 -(uQ 20
3k
20
b o
1 .&
V, . . . . . . .12 ft/sec (3.7 m/sec)
V h . . . e . . 8 0 8 0
p . . . . . . * .0.7
A
U
I I I --_C--II-L----r / I
Time, sec
Figure 15.- Continued.
36

--
Landing 6
(orientation, 1-2-1)
Htch (preset) . . .150
ki a
i -- 1 I I I - 1 . . I I I I 1-40
Figure 15.- Continued.
37
V

W 03
Impact 2 hh
-ing 7
-2 1c
i- r,
L
ai I I I I I I I I I i
0 .2 .4 .6 .8 .10 Time, sec
Figure 15.- Continued.

r Impact1 Impact 2 . A _ . Impact 3
(2.4 m / ~ e ~ )4 201- Vh . . 8 f t / ~ e ~
08a% o w oc O
a3 I 1 1 I 1 I I I I I I I I I
.a .4 .6 3.6 3.8 4.0 4.2
Tlme, sec
Figure 15.- Concluded.
w CD
Ebmct correlation
0 1 2
F'ullecale model acceleration, g units
Figure 16.- Correlat ion of maximum norma l accelerations of center of gravi ty for fu l l -scale and 1/6-scale model landing tests. Al l values are full scale in terms of earth gravity.
40
3

---
--------
Full-scale model - - - - - 1/6 -scale modd.
Landing 1
(orientation, 2-2)
Pitch (preset) ...15"
V, . . . . . . . . .15 ft/sec (4.6 m/sec)
V h . . ...... . o
CI .........0.4
4 .
I t-=
Landing 2
(Orientation, 2-2)12
Pitch (preset) . . .15"
Vv . . . . . . . . . 10 ft/sec (3.0 m/sec)
8 vh . . . . . . . . .10 ft/sec (3.0 m / s e ~ )
I.I . . . . . . . . .0.4 4
0
-4
. I ........ ..I .. .---8 0 .2 .4 .6 .a
Time, sec
Figure 17.- Comparison of p i tch ing motions d u r i n g landings of ful l-scale and 1/6-scale models. Approximate t ime of impact 2 i s indicated by arrows.
I

---
a
Latlaiw3 3 (Orientation, 2 2 )
Pitch (preset) ... \ vv . . . . . . . . . (4.6 m/secl
8 - Vh . . . . . . . . . p . . . . . . . . .
4 -
Lading 4
(Orientation, 2-2)
Pitch (preset) . . .15" vV . . . . . . . . .10 f t / s e c (3.0 J s e c )
Vh . . . . . . . . . 6 f t / s e c (1.8 J s e c )
)I . . . . . . . . .0.7
I 1 . - . I I . . . . --I...... I ....... 1 ..... .-I
0 .2 .4 .6 .a Time, sec
Figure 17.- Continued.
42
I

. x CI
12
a
4
0
-4
-5 (orientation, 1-2-1)
Pltch (preset) . . .15"
v, .........12 f.t/sec (3.7 m/sec)
V h . . .......0 u .........0.7
Laading 6
(Orientation, 1-2-1)
Pltch (preset) . . . (3.0 J s e c )
(3.0 p/sec)
I... I . . - I J I - - . - . I _ - . . .I .. I . . . . . . . L - I 0 .2 .4 .6 .a
Time, eec
Figure 17.- Continued.
'43

- - -- Full-scale model
1/6 -scale mdel 16
4
0
8
4
0
-Lt:; \
4
.- AI . - . - I - - . -1- -I-, ___ I.-. _._ I _____ -1. _ _ _ _ 1 - ____ Time, 8ec
Figure 17.- Concluded.
44

1.0
.2
15
10
-
-
5
td I I I 1
05 10 15 20
Full-scale model pitch attitude, deg
(a) P i tch attitude.
, I I I 4 I
02 04 .6 .8 1.0
Full4cale model time, sec
(b) Time to impact 2.
Figure 18.- Correlat ion of impact p i tch att i tude and t ime for ful l-scale and 1/6-scale model landing tests. All values are f u l l scale.
h cn

-- 16 Impact 1
12
8 \
~ \ 4 . \ \ n
0
-4
-8
-12
L- 8
(Orientation, 24)
Pitch (preset) . ..15" Vv 10 f ' t / ~ e ~(3.0 P ~ / s ~ c ) vh 8 ft/SeC (2.4 4 8 W )
CI . . . . . . . . . 00
4.6 li I I I I I I I 1
1 2 3 4 Time, sec
T Figure 19.- Comparison of stabil ity of full-scale and 1/6-scale models d u r i n g landing. Al l values are ful l scale.

- -
A motion-picture film supplement L-993 is available on loan. Requests will be filled in the order received. You will be notified of the approximate date scheduled.
The film (16 mm, 11.5 min, color, silent) shows test procedures and landings of the tethered full-scale model and the free-body 1/6-scale model.
Requests for the film should be addressed to:
Chief, Photographic Division NASA Langley Research Center Langley Station Hampton, Va. 23365
I
I Date Please send, on loan, copy of film supplement L-993 to
I TN D-4474. I
- . - _____Name of organization
I - ~ __ -
1 Street number I
- _ _ _.-I -~ I City and State Zip code I Attention: Mr. - -I Title I
I

NATIONAL AND SPACEADMINISTRATION POSTAGE AND FEES PAIDAERONAUTICS WASHINGTON,D. C. 20546 NATIONAL AERONAUTICS AND
SPACE ADMINISTRATION OFFICIAL BUSINESS FIRST CLASS MAIL
I ’
POSTMASTER: If Undeliverable (Section 158 I , Postal Manual) Do Not Return
‘ T h e aeronautical and space activities of the United Stdtes sha21 be conducted so as t o contribute . . . t o the expansion of human knowledge of phenomena in the atmosphere and space. The Administration shall provide for the widest practicable and appropriate dissemination of information concerning its actiwities and the results thereof.”
-NATIONAL AERONAUTICSAND SPACE ACT OF 1958
NASA SCIENTIFIC AND TECHNICAL PUBLICATIONS
TECHNICAL REPORTS: Scientific and technical information considered important, complete, and a lasting contribution to existing knowledge.
TECHNICAL NOTES: Information less broad in scope but nevertheless of importance as a contribution to existing knowledge.
TECHNICAL MEMORANDUMS : Information receiving limited distribution because of preliminary data, security classification, or other reasons.
CONTRACTOR REPORTS: Scientific and technical information generated under a NASA contract or grant and considered an important contribution to existing knowledge.
TECHNICAL TRANSLATIONS: Information published in a foreign language considered to merit NASA distribution in English.
SPECIAL PUBLICATIONS: Information derived from or of value to NASA activities. Publications include conference proceedings, monographs, data compilations, handbooks, sourcebooks, and special bibliographies.
TECHNOLOGY UTILIZATION PUBLICATIONS: Information on technology used by NASA that may be of particular interest in commercial and other non-aerospace applications. Publications include Tech Briefs, Technology Utilization Reports and Notes, and Technology Surveys.
Details on the availability of these publications may be obtained from:
SCIENTIFIC AND TECHNICAL INFORMATION DIVISION
NATIONAL AERONAUTICS AND SPACE ADMINISTRATION Washington, D.C. 20546