Evaluation of 3D-Projection Image Capture
16
Evaluation of 3D-Projection Image Capture Peter D. Burns, Burns Digital Imaging Don Williams, Image Science Associates [email protected] © 2015 Peter D. Burns and Don Williams
-
Upload
burns-digital-imaging-llc -
Category
Technology
-
view
117 -
download
2
Transcript of Evaluation of 3D-Projection Image Capture

Evaluation of 3D-Projection Image Capture
Peter D. Burns, Burns Digital Imaging Don Williams, Image Science Associates
© 2015 Peter D. Burns and Don Williams

Introduction • Now common to monitor imaging performance for acquisition • Important aspects of imaging practice influence
• Lighting • Camera position and settings • Lens selection and settings
• We now have guidelines for controlling variation • FADGI Guidelines • Metamorfoze Preservation Imaging Guidelines
• What about 3D objects? • Can we adapt current methods? • Simple, repeatable evaluation
2
Object-level target

2-D projection images
3
Test objects
• Aimed at visual evaluation if lens focus
• Note fixed geometry

Object-level targets
4
Arthur M. Sackler and Freer Galleries of Art 1
2
3
• Intra-image variation
• Repeated edge features to measure image resolution
• 3 measurements for 3 positions
• Used to monitor performance
• Quality assurance for digital collections
• Mostly used for near-flat objects and documents
• Inter-image variation measurement

Example use of test targets
5
Arthur M. Sackler and Freer Galleries of Art
• Test chart normal to lens axis
• Works well for evaluating imaging performance in primary plane through the object
camera lens
chart holder
test chart
• What about performance with scene depth ?
- Optical depth of field

Use of tilted test chart • Tilt target to cover depth of
object
• Repeated test features now sample scene depth
6
cameralens
chartholder
testchart
Holder courtesy of Image Science Associates
• Adjustable chart holder
• Maintains object depth as camera angle is adjusted

Experiment
7
• Image capture at Cooper Hewitt, Smithsonian Design Museum
• Mass digitization effort, Nov. 2014
• Measure image resolution as per standard methods
• Test chart
• Analysis software
• Adapt to sample scene depth
• Digital view camera by Picturae BV
• Upper part of test chart is tilting way from camera

View camera
8
Film or detector plane
Lens plane
Plane of Sharp focus
Lens axis
Scheimpflug intersection
• Lens is tilted to vary the plane of sharp focus
• Used in architectural photography to change camera perspective
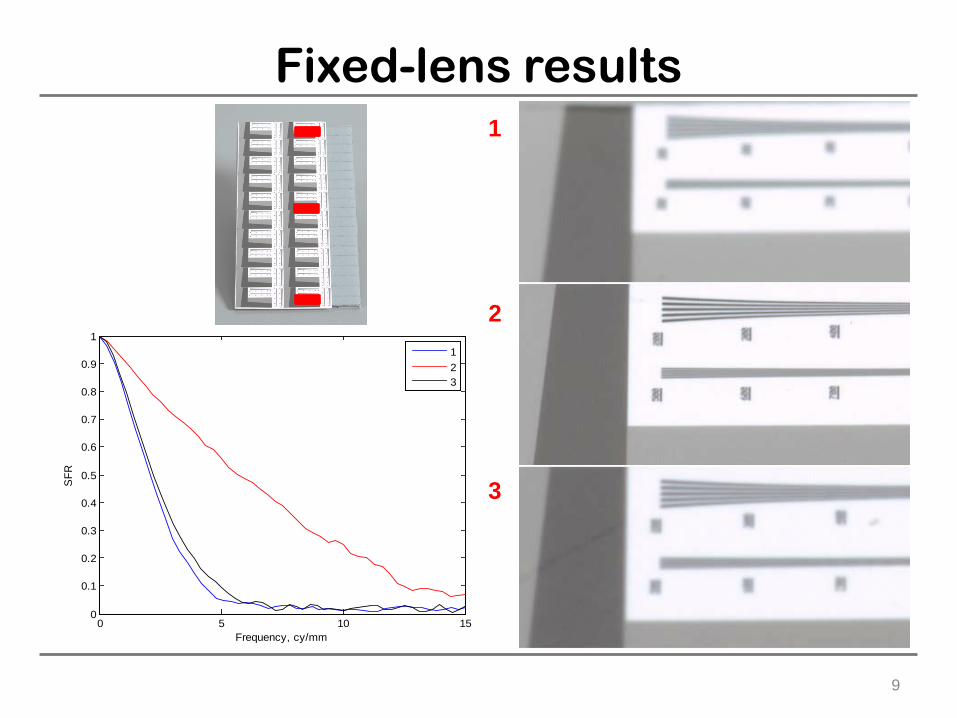
Fixed-lens results
9
0 5 10 150
0.1
0.2
0.3
0.4
0.5
0.6
0.7
0.8
0.9
1
Frequency, cy/mm
SFR
123
1
2
3

Tilted-lens results
10
1
2
3
0 5 10 150
0.1
0.2
0.3
0.4
0.5
0.6
0.7
0.8
0.9
1
Frequency, cy/mm
SFR
123

Simplified edge target
11
• Nikon DSLR camera, zoom lens
• Simple extended edge for image resolution
• Uniform areas to evaluate illumination variation
Single edgechart
Test image

Camera aperture series
12
• Capture series oft test images varying lens aperture setting
• Automated evaluation of image depth of focus

Aperture series results
13

Illumination profile measurement
14
• Illumination profile based on light uniform chart region
• Computed are average pixel row in the region
Single edge chart
Distance, cm0 1 2 3 4 5 6 7 8 9
Prof
ile
180
185
190
195
200
205
210
215
220
225
230
• Uniform lighting may not be the goal
• Consistency normally is

15
Conclusions
1. Methods and tools for monitoring of imaging performance are well-established for near flat objects
2. We investigated adapting these for 2D, perspective images of 3D objects
• Both DSLR and view camera testing was completed
• Objective-level test targets
• Tilted chart used to sample scene depth
• Chart holder with adjustable angle
3. Image resolution • Multiple region selection • Reference analysis (unchanged) was used
4. illumination uniformity evaluated
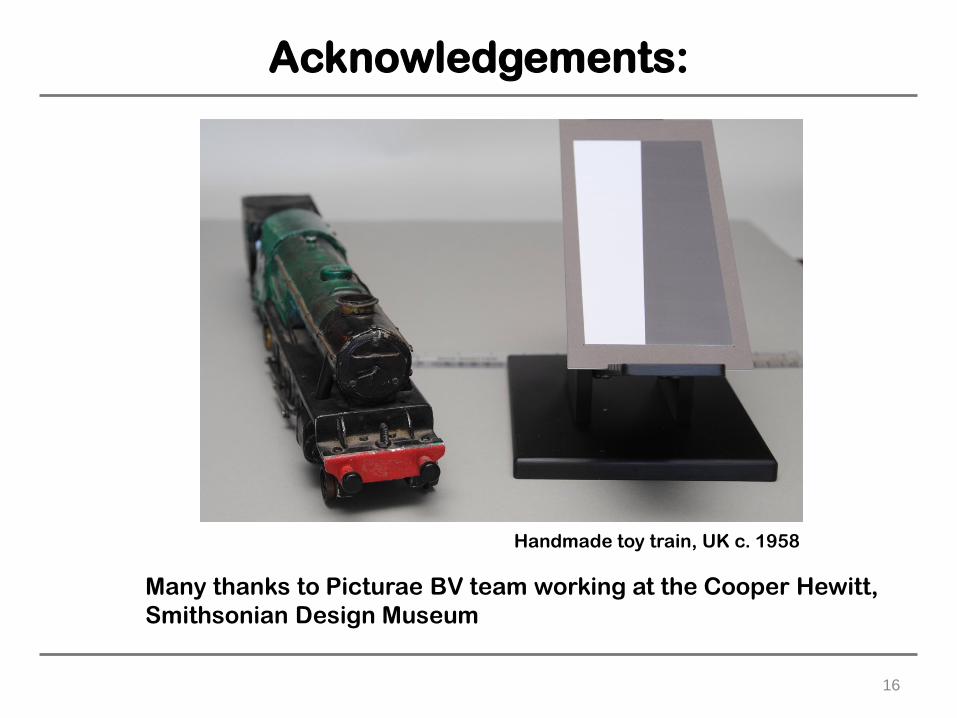
Acknowledgements:
16
Many thanks to Picturae BV team working at the Cooper Hewitt, Smithsonian Design Museum
Handmade toy train, UK c. 1958