EVALUATION, MODELLING AND CONTROL OF ULTRAFILTRATION...
235
EVALUATION, MODELLING AND CONTROL OF ULTRAFILTRATION MEMBRANE WATER TREATMENT SYSTEMS CHEW CHUN MING FACULTY OF ENGINEERING UNIVERSITY OF MALAYA KUALA LUMPUR 2017 University of Malaya
Transcript of EVALUATION, MODELLING AND CONTROL OF ULTRAFILTRATION...

EVALUATION, MODELLING AND CONTROL OF ULTRAFILTRATION MEMBRANE WATER
TREATMENT SYSTEMS
CHEW CHUN MING
FACULTY OF ENGINEERING UNIVERSITY OF MALAYA
KUALA LUMPUR
2017Univ
ersity
of M
alaya

EVALUATION, MODELLING AND CONTROL OF ULTRAFILTRATION MEMBRANE WATER
TREATMENT SYSTEMS
CHEW CHUN MING
THESIS SUBMITTED IN FULFILMENT OF THE REQUIREMENTS FOR THE DEGREE OF
DOCTOR OF PHILOSOPHY
FACULTY OF ENGINEERING UNIVERSITY OF MALAYA
KUALA LUMPUR
2017 Univers
ity of
Mala
ya

ii
UNIVERSITY OF MALAYA
ORIGINAL LITERARY WORK DECLARATION
Name of Candidate: CHEW CHUN MING
Matric No: KHA130010
Name of Degree: DOCTOR OF PHILOSOPHY
Title of Thesis (“this Work”): EVALUATION, MODELLING AND CONTROL OF
ULTRAFILTRATION MEMBRANE WATER TREATMENT SYSTEMS
Field of Study: PROCESS SYSTEMS ENGINEERING AND CONTROL
I do solemnly and sincerely declare that:
(1) I am the sole author/writer of this Work; (2) This Work is original; (3) Any use of any work in which copyright exists was done by way of fair
dealing and for permitted purposes and any excerpt or extract from, or reference to or reproduction of any copyright work has been disclosed expressly and sufficiently and the title of the Work and its authorship have been acknowledged in this Work;
(4) I do not have any actual knowledge nor do I ought reasonably to know that the making of this work constitutes an infringement of any copyright work;
(5) I hereby assign all and every rights in the copyright to this Work to the University of Malaya (“UM”), who henceforth shall be owner of the copyright in this Work and that any reproduction or use in any form or by any means whatsoever is prohibited without the written consent of UM having been first had and obtained;
(6) I am fully aware that if in the course of making this Work I have infringed any copyright whether intentionally or otherwise, I may be subject to legal action or any other action as may be determined by UM.
Candidate’s Signature Date:
Subscribed and solemnly declared before,
Witness’s Signature Date:
Name:
Designation:
Univers
ity of
Mala
ya

iii
ABSTRACT
Ultrafiltration (UF) membrane water treatment systems are swiftly gaining
acceptance for large-scale production of potable/drinking water supply in Malaysia. In
the first part of this research, extensive efforts have been taken to analyze and evaluate
an industrial-scale UF membrane water treatment plant in Malaysia through detailed
case studies. Analysis of the UF membrane water treatment plant was performed to
highlight the common design and operational issues with suggested solutions obtained
from literature. Subsequently, evaluation and comparison between the UF membrane
water treatment system and the conventional media/sand filtration water treatment
system was conducted. Detailed analyses on commercial, quality and environmental
aspects were examined on both water treatment systems. Capital costs of the UF system
was 5.6% higher while the operational cost was more than three times than the
conventional media/sand filtration water treatment system. Apparent advantages of the
UF system were exhibited through its production of consistent filtrate turbidity of less
than 1 Nephelometric Turbidity Units (NTU) and non-hazardous sludge as by-products.
The sludge from the conventional system contains 58 mg/L of Aluminium residual
originates from the Aluminium Chlorohydrate (ACH) utilized as coagulant in the
process. Considerable efforts were also made to elucidate the key issues of scaling-up
industrial-scale UF membrane water treatment system from data obtained through
laboratory and pilot-scale experiments. Results have indicated that all three UF systems
(laboratory-scale, pilot-scale and industrial-scale) have exhibited similar trans-
membrane pressure (TMP) profiles pattern under same operational conditions.
In the second part of this research work, a pilot-scale UF system has been utilized to
gather data for the process modelling. A practical hybrid model which encompassed the
theoretical model of Darcy’s law and artificial neural networks (ANN) predictive model
has been developed. This hybrid model utilizes data from commonly available on-line
Univers
ity of
Mala
ya

iv
monitoring analyzers and laboratory analysis data in a typical UF membrane water
treatment plant. Results have indicated close agreement between the simulated model
and experimental data on feed water with turbidity of 10 NTU and 20 NTU
respectively.
In the final part of this research work, an UF experimental system equipped with
supervisory control and data acquisition software has been commissioned to implement
various on-line control systems. The predictive model developed earlier has been
utilized together with ANN controllers to provide an alternative control system for the
dead-end constant flux UF process. Experiments were conducted to compare the results
from both the ANN and conventional set-points control systems. The ANN control
system has exhibited capability to reduce water losses to 4.9 % compared to the
conventional set-points control system of 9.6% while maintaining acceptable potential
membrane fouling propensity for low turbidity of feed water. Main objectives of this
research are to demonstrate the feasible utilization of UF membrane water treatment
systems and viable suggestions to improve its operations. The major contributions of
this research were highlighted through case studies evaluation of the UF membrane
water treatment systems, development of hybrid model for potential membrane fouling
parameters estimation and a proposed alternative ANN process control system to reduce
water losses.
Univers
ity of
Mala
ya

v
ABSTRAK
Sistem rawatan air membran ultrafiltrasi telah mendapat sambutan yang amat
menggalakkan sebagai teknologi pemprosesan air minum secara skala-besar di
Malaysia. Dalam bahagian pertama penyelidikan ini, analisa dan penilaian secara
mendalam telah diusahakan ke atas sebuah loji rawatan air membran ultrafiltrasi skala-
industri di Malaysia melalui kajian kes yang terperinci. Analisa terhadap loji rawatan air
membran ultrafiltrasi skala-industri ini telah dijalankan untuk mengetengahkan isu
umum dalam reakabentuk dan operasi loji dengan cadangan penyelesaian yang
diperolehi daripada laporan kajian. Seterusnya, penilaian dan perbandingan di antara
sistem membran ultrafiltrasi dan rawatan penapisan media/pasir yang lazim telah
dilaksanakan. Analisa secara terperinci dalam aspek komersial, kualiti dan persekitaran
telah dikaji ke atas kedua-dua sistem rawatan air. Kos modal untuk sistem ultrafiltrasi
adalah 5.6% lebih tinggi sementara kos operasi adalah lebih tiga kali ganda daripada
sistem penapisan media/pasir yang lazim. Kelebihan yang jelas sistem ultrafiltrasi
adalah dalam pengeluaran tapisan dengan kekeruhan di bawah 1 NTU secara
bereterusan dan penghasilan enap cemar yang tidak berbahaya. Enap cemar daripada
sistem rawatan yang lazim mengandungi 58 mg/L sisa Aluminium yang berasal
daripada Aluminium Chlorohydrate (ACH) yang digunakan sebagai koagulan dalam
process. Usaha mendalam juga telah dijalankan untuk menjelaskan isu utama dalam
menaik taraf sistem rawatan air membran ultrafiltrasi melalui data yang diperolehi
daripada makmal dan kajian skala-rintis. Hasil kajian ketiga-tiga sistem ultrafiltrasi
(skala-makmal, skala-rintis dan skala-industri) telah menunjukkan corak profil tekanan
trans-membran yang serupa dalam keadaan operasi yang sama.
Dalam bahagian kedua penyelidikan ini, sistem ultrafiltrasi skala-rintis telah
digunakan untuk mengumpul data bagi menghasilkan model proses. Satu model hibrid
praktikal yang melibatkan penggunaan model teori hukum Darcy dan model jangkaan
Univers
ity of
Mala
ya

vi
rangkaian neural buatan telah direka. Model hibrid ini menggunakan data daripada
peranti pemantauan dalam talian dan analisa makmal yang sering dijumpai di
kebanyakkan loji rawatan air membran ultrafiltrasi. Hasil kajian telah menunjukkan
keputusan yang hampir sama di antara model simulasi dan data eksperimen untuk air
mentah dengan kekeruhan 10 NTU dan 20 NTU.
Untuk bahagian terakhir dalam penyelidikan ini, sistem ultrafiltrasi kajian
eksperimen yang dilengkapi dengan perisisan kawalan penyeliaan dan perolehan data
telah diuji untuk menjalankan pelbagai sistem kawalan atas talian. Model jangkaan yang
telah direka sebelum ini telah digunakan dengan sistem kawalan rangkaian neural
buatan untuk mewujudkan satu sistem kawalan alternatif kepada proses ultrafiltrasi
haluan tamat dengan kadar aliran tetap. Eksperimen telah dijalankan untuk
membandingan keputusan daripada kedua-dua sistem kawalan rangkaian neural buatan
dan sistem kawalan had tetapan yang lazim. Sistem kawalan rangkaian neural buatan
menunjukkan keupayaan untuk mengurangkan jumlah kehilangan air sehingga 4.9%
berbanding dengan 9.6% untuk sistem kawalan had tetapan yang lazim dan memastikan
tahap kecenderungan potensi sumbatan membran yang boleh diterima untuk air mentah
yang mempunyai kekeruhan rendah. Objektif utama penyelidikan ini adalah untuk
menunjukkan keupayaan perlaksanaan sistem rawatan air membran ultrafiltrasi dan
cadangan untuk memperbaiki operasi dalam sistem ini. Sumbangan terbesar dalam
kajian ini adalah mengetengahkan penilaian sistem rawatan air membrane ultrafiltrasi
secara kajian kes, rekaan model hibrid untuk jangkaan parameter kecenderungan potensi
sumbatan membran dan cadangan kawalan proses alternatif rangkaian neural buatan
untuk mengurangkan kehilangan air.
Univers
ity of
Mala
ya

vii
ACKNOWLEDGEMENTS
First and foremost the author would like to express his sincere gratitude to University
of Malaya for providing a conducive campus environment to conduct his research. The
facilities and dedicated staff of the university have assisted the author in many ways to
complete this task.
Throughout this research study, the author is very fortunate to be blessed with the
guidance and encouragements from his research supervisors, Prof. Dr. M. Kheireddine
Aroua and Ir. Prof. Dr. M. Azlan Hussain. The author would also like to express his
gratitude to the Ministry of Higher Education (MOHE) for financing his research study
through the MyBrain15 (MyPhd) sponsorship. This research project is possible through
the funding of Postgraduate Research Grant or PPP (Project No.: PG041 – 2013B) from
University of Malaya. Special acknowledgement to Techkem Water Sdn. Bhd. and Air
Kelantan Sdn. Bhd. for providing technical support and facilities throughout this
research.
Last but not least the author would like to express his appreciation on the
encouragements and supports from his family and friends which have spurred him to go
the “extra miles” on his journey to seek knowledge in this research.
Univ
ersity
of M
alaya

viii
TABLE OF CONTENTS
Abstract ............................................................................................................................ iii Abstrak .............................................................................................................................. v Acknowledgements ......................................................................................................... vii Table of Contents ........................................................................................................... viii List of Figures ................................................................................................................ xiii List of Tables .................................................................................................................. xv List of Symbols and Abbreviations ............................................................................... xvii List of Appendices ......................................................................................................... xix
CHAPTER 1: GENERAL INTRODUCTION ............................................................. 1
1.1 Background of study ................................................................................................ 1
1.2 Scope of this research .............................................................................................. 3
1.3 Problems statement .................................................................................................. 3
1.4 Aim and objectives .................................................................................................. 4
1.5 Outline of the thesis ................................................................................................. 5
CHAPTER 2: LITERATURE REVIEW ...................................................................... 9
2.1 Introduction ............................................................................................................. 9
2.2 Ultrafiltration membranes for drinking water treatment systems .......................... 10
2.3 Analysis and evaluation of UF membrane water treatment systems ..................... 13
2.4 Modelling of UF membrane filtration process ...................................................... 15
2.5 Process control and fouling of UF membrane water treatment systems ............... 19
2.6 Summary of overall literature review .................................................................... 21
Univers
ity of
Mala
ya

ix
CHAPTER 3: ANALYSIS OF INDUSTRIAL-SCALE ULTRAFILTRATION
MEMBRANE WATER TREATMENT SYSTEM .................................................... 22
3.1 Introduction ........................................................................................................... 22
3.2 Background ............................................................................................................ 23
3.3 Methodology .......................................................................................................... 25
3.4 Results and discussions ......................................................................................... 29
3.4.1 Membrane surface area ............................................................................. 30
3.4.2 Feed/raw water characteristics .................................................................. 32
3.4.3 Chemicals for UF membrane cleaning ...................................................... 34
3.4.4 Hydraulic backwash and chemicals cleaning efficiency ........................... 35
3.4.5 UF membrane fouling ............................................................................... 40
3.4.6 Electricity consumption ............................................................................. 42
3.5 Findings of the case study ..................................................................................... 44
3.6 Summary ................................................................................................................ 46
CHAPTER 4: EVALUATION AND COMPARISON OF ULTRAFILTRATION
AND CONVENTIONAL WATER TREATMENT SYSTEMS ............................... 47
4.1 Introduction ........................................................................................................... 47
4.2 Background ............................................................................................................ 48
4.3 Methodology .......................................................................................................... 51
4.4 Results and discussions ......................................................................................... 55
4.4.1 Capital cost of treatment systems .............................................................. 56
4.4.2 Operational cost of treatment systems ....................................................... 60
4.4.3 Maintenance cost of treatment systems ..................................................... 65
4.4.4 Analysis of filtrate quality ......................................................................... 66
4.4.5 Overall water losses ................................................................................... 71
Univers
ity of
Mala
ya
x
4.5 Findings of the evaluation and comparison ........................................................... 73
4.6 Summary ................................................................................................................ 77
CHAPTER 5: KEY ISSUES OF ULTRAFILTRATION MEMBRANE WATER
TREATMENT SYSTEM SCALE-UP FROM LABORATORY AND PILOT-
SCALE EXPERIMENTAL RESULTS ...................................................................... 78
5.1 Introduction ........................................................................................................... 78
5.2 Background ............................................................................................................ 79
5.3 Methodology ......................................................................................................... 80
5.4 Results and discussions ......................................................................................... 82
5.4.1 Analysis of filtrate quality ......................................................................... 83
5.4.2 Trans-membrane pressure of membrane modules ..................................... 85
5.4.3 Electricity utilization ................................................................................. 88
5.5 Scaling-up industrial-scale systems based on experimental data .......................... 90
5.6 Summary ................................................................................................................ 95
CHAPTER 6: POTENTIAL MEMBRANE FOULING PARAMETERS
PREDICTION USING HYBRID MODELLING FOR ULTRAFILTRATION
MEMBRANE WATER TREATMENT SYSTEM .................................................... 96
6.1 Introduction ........................................................................................................... 96
6.2 Background ............................................................................................................ 97
6.3 Methodology ........................................................................................................ 103
6.3.1 Data collection and water sample analysis for the model ....................... 103
6.3.2 Hybrid modelling procedures .................................................................. 106
6.3.2.1 Development of first principle model ..................................... 107
6.3.2.2 Using ANN model to predict specific cake resistance ............ 111
6.3.2.3 Details of the hybrid model ..................................................... 113
Univers
ity of
Mala
ya

xi
6.4 Results and discussions ....................................................................................... 114
6.4.1 Determination of membrane resistance, Rm ............................................. 114
6.4.2 Filtration data with natural river water .................................................... 116
6.4.3 Analysis to establish correlation of the feed water parameters ............... 118
6.4.4 Estimation of specific cake resistance with Darcy’s law ........................ 120
6.4.5 Development of the ANN predictive model ............................................ 121
6.4.6 Validating the hybrid model with experimental results .......................... 124
6.4.7 Sensitivity analysis of the hybrid model ................................................. 126
6.5 Applying the hybrid model in UF membrane water treatment plant ................... 129
6.6 Summary .............................................................................................................. 132
CHAPTER 7: ARTIFICIAL NEURAL NETWORKS CONTROL FOR
ULTRAFILTRATION MEMBRANE WATER TREATMENT
SYSTEM……………. ................................................................................................. 134
7.1 Introduction ......................................................................................................... 134
7.2 Background .......................................................................................................... 135
7.3 Methodology ........................................................................................................ 141
7.3.1 Implementation of conventional set-points control system ..................... 144
7.3.2 Development and implementation of ANN control system .................... 145
7.3.2.1 ANN predictive model for estimation of specific cake
resistance ................................................................................. 147
7.3.2.2 Development of ANN controllers for filtration and
backwash sequences ................................................................ 147
7.3.2.3 Conventional set-points and ANN control systems ................ 152
7.4 Results and discussions ....................................................................................... 153
7.4.1 Results of the conventional set-points control system ............................ 154
7.4.2 Gathering information and data for the ANN training ............................ 156
Univers
ity of
Mala
ya

xii
7.4.3 Results of the ANN control system ......................................................... 164
7.4.4 Analysis of the conventional and ANN control systems ......................... 176
7.5 Comparisons between conventional and ANN control systems .......................... 178
7.6 Summary .............................................................................................................. 179
CHAPTER 8: CONCLUSIONS AND RECOMMENDATIONS ....................... 180
8.1 Findings and conclusions ..................................................................................... 180
8.2 Contributions and novelty of the study ................................................................ 183
8.3 Recommendations for future research works ...................................................... 184
REFERENCES ............................................................................................................ 186
LIST OF PUBLICATIONS AND PAPERS PRESENTED .................................... 214
APPENDIX .................................................................................................................. 216
Univers
ity of
Mala
ya

xiii
LIST OF FIGURES
Figure 2.1: UF hollow fibre membrane module produced by Inge GmbH
(Germany) and its cross-sectional view …11
Figure 2.2: Dead-end and cross-flow filtration operation modes …12
Figure 2.3: Various sizes and membrane surface area of UF membrane modules
produced by Inge GmbH (Germany) …14
Figure 2.4: A cake layer membrane filtration model …17
Figure 3.1: UF membrane water treatment plant at Kelantan, Malaysia …26
Figure 3.2: Flowchart of the industrial-scale UF membrane water treatment plant …27
Figure 3.3: UF hollow fibre membrane utilized at the water treatment plant …29
Figure 3.4: Feed water turbidity to UF membrane water treatment plant …33
Figure 3.5: Feed water pressure profile after backwash and alkaline CEB …37
Figure 3.6: Feed water pressure profile after backwash and acid CEB …37
Figure 3.7: Electricity and feed water pressure increase in 2013 …43
Figure 4.1: Illustration of conventional media filtration and UF …49
Figure 4.2: Process flow block diagram of water treatment systems …52
Figure 4.3: Schematic block diagram of the conventional water treatment system …54
Figure 4.4: Schematic block diagram of the UF system …55
Figure 4.5: Construction cost in 2013 estimated based on annual inflation rate …57
Figure 4.6: Capital expenditure estimated based on various land values …59
Figure 4.7: Four categories of sensitivity analysis on operational expenditure …64
Figure 4.8: Feed water and filtrate turbidity in May 2013 …67
Figure 5.1: Three UF systems utilized for the case study …82
Figure 5.2: Annular gap (left) and central core (right) hollow fibre configurations
of UF membrane modules …86
Figure 5.3: TMP profiles of UF systems …87
Figure 6.1: Actual and schematic diagram of the pilot-scale UF system …104
Figure 6.2: Schematic diagram of the ANN predictive model …112
Figure 6.3: UF membrane filtration data with purified water …116
Figure 6.4: Filtration TMP profiles of feed water samples …117
Figure 6.5: Analysis results of river water solids concentrations against turbidity …119
Figure 6.6: Estimated specific cake resistance based on Darcy’s law …120
Figure 6.7: MSE of various numbers of hidden nodes during ANN training …122
Univers
ity of
Mala
ya
xiv
Figure 6.8: Simulation and experimental results of the specific cake resistance …123
Figure 6.9: Simulation and experimental results of the TMP …125
Figure 6.10: Sensitivity analyses of the ANN predictive model outputs …127
Figure 7.1: Filtration and backwash sequences for dead-end UF process …137
Figure 7.2: Schematic diagram of the conventional set-points control system …139
Figure 7.3: UF experimental system equipped with laptop computer control …141
Figure 7.4: Process and instrumentation diagram (P&ID) of the UF experimental
system …142
Figure 7.5: Block diagram of ANN control system architecture …143
Figure 7.6: Graphical user’s interface of the SCADA system …144
Figure 7.7: Block diagram of ANN controller number 1 …149
Figure 7.8: Architecture of ANN process control loop …151
Figure 7.9: TMP profile of feed water with 8 NTU of turbidity …155
Figure 7.10: TMP profile of feed water with 18 NTU of turbidity …155
Figure 7.11: Established correlation between cs and turbidity of the river water …157
Figure 7.12: TMP profiles for various feed water samples …158
Figure 7.13: Estimated values of cs for various turbidity of feed water …159
Figure 7.14: Data of m during filtration for various feed water samples …160
Figure 7.15: Estimation of specific cake resistance during filtration sequence …160
Figure 7.16: Correlation between filtration duration and feed water turbidity …163
Figure 7.17 (a) TMP profiles during filtration (8 NTU sample) …168
Figure 7.17 (b) Output from ANN predictive model (8 NTU sample) …168
Figure 7.17 (c) Output from ANN controller number1 – filtration sequence
(8 NTU sample) …168
Figure 7.17 (d) Output from ANN controller number 2 – backwash sequence
(8 NTU sample) …168
Figure 7.18 (a) TMP profiles during filtration (18 NTU sample) …171
Figure 7.18 (b) Output from ANN predictive model (18 NTU sample) …171
Figure 7.18 (c) Output from ANN controller number 1 – filtration sequence
(18 NTU sample) …171
Figure 7.18 (d) Output from ANN controller number 2 – backwash sequence
(18 NTU sample) …171
Figure 7.19 TMPrev profiles and ANN controller number 2 outputs …175
Univers
ity of
Mala
ya

xv
LIST OF TABLES
Table 2.1: Characteristics of commonly used modelling methods …18
Table 2.2: Literature reports on process control of UF systems …20
Table 3.1: On-line analyzers/sensors for digital data monitoring …28
Table 3.2: Definitions of various flux conditions for membrane systems …30
Table 3.3: Analysis of feed water and UF filtrate …39
Table 3.4: Operational parameters of the acid and alkaline CEB …39
Table 3.5: Ionic product and Ksp of feed water …41
Table 3.6: Summary analysis in the case study …45
Table 4.1: Capital expenditure and land area required …58
Table 4.2: Chemical consumption and estimated cost of water treatment …62
Table 4.3: Electricity utilization and estimated cost of water treatment …62
Table 4.4: Estimated maintenance cost for the UF and conventional systems …66
Table 4.5: Removal efficiency of DOC and COD …69
Table 4.6: Breakdown and overall water losses …71
Table 4.7: Summary of various aspects in the case study …76
Table 5.1: Operating conditions of the three UF systems …83
Table 5.2: Feed water and UF filtrate analysis results …84
Table 5.3: Average TMP of UF systems under similar operational conditions …85
Table 5.4: Feed pumps operational conditions and estimated efficiency …89
Table 5.5: Summary of the three UF systems results …94
Table 6.1: Applications of ANN in water and wastewater UF processes …102
Table 6.2: ANN predictive model architecture …121
Table 6.3: Hybrid model simulation and laboratory analysis results …124
Table 6.4: Calculated values of membrane resistance (Rm,cal) and data from
literature …126
Table 6.5: Comparisons between theoretical filtration and hybrid models …132
Table 7.1: Operational conditions and parameters of the UF experimental
system …154
Table 7.2: Estimated values of cs and α for various feed water samples …161
Table 7.3: Inputs and outputs of the ANN model and controllers …166
Table 7.4: Results for the 8 NTU feed water sample …169
Table 7.5: Results for the 18 NTU feed water sample …172
Univers
ity of
Mala
ya

xvi
Table 7.6: Results for the 30 NTU feed water sample …173
Table 7.7: Comparison of results between control systems …176
Table 7.8: Summary of the conventional and ANN control systems …179
Univers
ity of
Mala
ya
xvii
LIST OF SYMBOLS AND ABBREVIATIONS
W : Electricity power requirement (Watt) H : Pressure of the system (Pascal) µ : Filtrate viscosity (kg m-1 s-1) m : Cake mass per unit membrane area (kg m-2) J : Filtration flux (m s-1) ∆P : Trans-membrane pressure (Pascal) Rm : Membrane resistance (m-1) Q : Operating flowrate (m3 s-1) Jw : Filtration flux for purified water (m s-1) ∆Pw : Trans-membrane pressure for purified water (Pascal)
α : Specific cake resistance (m kg-1)
cs : Feed water solids concentration (kg m-3)
Vs : Volume of feed water (m3)
Vbw : Volume of clean water utilized during backwash (m3)
Ksp : Solubility product
Tfil : Estimated filtration duration (s)
TMPol : On-line trans-membrane pressure reading (Pascal)
TMPrev : On-line reverse trans-membrane pressure reading (Pascal)
A : Membrane surface area (m2)
ACH : Aluminium Chlorohydrate
ANN : Artificial neural networks
APHA : American Public Health Association
ATR-FTIR : Attenuated total reflectance Fourier transform infrared spectroscopy
CAPEX : Capital expenditure
CEB : Chemical enhanced backwash
CIP : Clean in place
COD : Chemical oxygen demand
DOC : Dissolved organic carbon
EDX : Energy dispersive X-ray analysis
GA : Genetic algorithm
GUI : Graphical user’s interface
Univers
ity of
Mala
ya

xviii
MEUF : Micellar-enhanced ultrafiltration
MLD : Million liters a day
MOH : Ministry of Health Malaysia
mPES : Modified Polyethersulfone
MSE : Mean squared errors
MWCO : Molecular weight cut-off
NIPS : Non-solvent induced phase separation
NOM : Natural organic matter
NTU : Nephelometric Turbidity Units
OPEX : Operational expenditure
P&ID : Process and instrumentation diagram
PES : Polyethersulfone
PLC : Programmable logic controller
PVDF : Polyvinylidene fluoride
ROI : Return of investment
RO : Reverse osmosis
SCADA : Supervisory control and data acquisition
SEM : Scanning electron microscopy
TIPS : Thermally induced phase separation
TMP : Trans-membrane pressure
TSS : Total suspended solids
UF : Ultrafiltration
USD : United States Dollar
VSD : Variable speed drive
WHO : World Health Organization
Univers
ity of
Mala
ya

xix
LIST OF APPENDICES
Appendix A: First page of published journal articles….…………………………... 216
Appendix B: MATLAB source code……………………………………………... 217
Univers
ity of
Mala
ya
1
CHAPTER 1: GENERAL INTRODUCTION
As the global human population reaches a new high of 7.4 billion in 2016, there is a
pressing demand for more potable/drinking water supply. Technology advancement in
water purification has allowed consumers to enjoy clean water supply through public-
piped networks. Large-scale water treatment plants are built to produce high volume of
potable water from various raw water sources such as rivers. Membrane technology
such as ultrafiltration (UF) is making headways in the water treatment industry due to
its many advantages. The following sections in this chapter provide a concise
introduction of this research topic on UF membrane water treatment systems and the
objectives of this study.
1.1 Background of study
In recent years, Malaysia has been plagued by public-piped water supply crisis both
in terms of poor quality and insufficient quantity particularly in urban areas. Besides
seeking for more raw water sources, advanced water treatment facilities are deemed
necessary as it is one of the key focused areas in the 11th Malaysia Plan for
“strengthening infrastructure to support economic expansion”. Conventional water
treatment processes might not be able to cope with the constant demand for higher
quantity and more stringent drinking water quality (Makungo et al., 2011). Membrane
technologies particularly UF has gained wide acceptance in large-scale drinking water
production in many developed countries (Mierzwa et al., 2012). The adoptions of UF
for drinking water production in these countries have indicated the feasibility and
Univers
ity of
Mala
ya

2
maturity of the technology. UF membrane technology has vast potential in the growing
water treatment industry of developing Southeast Asian countries such as Malaysia.
Majority of the government-owned water treatment facilities/plants in Malaysia are
utilizing conventional treatment processes (Ab Razak et al., 2015). These treatment
plants often face operational issues which are caused by the fluctuation of surface raw
water characteristics (Davies & Mazumder, 2003). This scenario poses an immense
challenge to the operators of water treatment plants as the final treated water quality
should always comply with the drinking water specification stipulated by the Ministry
of Health Malaysia (MOH) and World Health Organization (WHO) (Ab Razak et al.,
2016). In the conventional water treatment systems, the initial coagulation-flocculation
process requires precise chemical dosage and pH adjustment to yield satisfactory solid-
liquid separation in the subsequent clarification and media/sand filtration processes
(Zhao et al., 2014). The current pollution level caused by human activities and
unpredictable weather conditions has caused surface raw water characteristics to change
more often and requires frequent adjustment of chemical dosage (Mitrouli et al., 2008).
This is the main drawback of the conventional water treatment systems which disrupt
the smooth operation of the systems to produce consistent filtrate quality.
UF has been seen as a more reliable technology than the conventional media/sand
filtration process to achieve proper solid-liquid separation results (Tian et al., 2013a).
The UF process operates based on surface/cake filtration concept and does not require
an initial coagulation-flocculation process prior to filtration. Industrial-scale UF
membrane water treatment plant has reported very consistent high quality of filtrate
during operation (Xiao et al., 2012).
Univers
ity of
Mala
ya

3
1.2 Scope of this research
This work focused on the evaluation of UF membrane water treatment systems and
the development of a hybrid model as well as control system for the process. All the
case studies in this study were based on an industrial-scale UF membrane water
treatment plant located in Malaysia. Detailed evaluation of the operational data and
laboratory analysis were conducted under these case studies. The hybrid model and the
artificial neural networks (ANN) control system in this study were developed using
mathematical computer simulation software. UF experimental systems (laboratory-scale
and pilot-scale) have been designed and commissioned to conduct all the relevant
filtration experiments. Natural river water was used as feed water to the UF
experimental systems. Various on-line process control experiments were conducted
using the UF experimental system to collect the required data. The overall scope of this
research encompasses case studies, development of process model and control system
for the UF membrane water treatment systems.
1.3 Problems statement
The major drawbacks of UF systems are membrane fouling (El-Abbassi et al., 2014;
Filloux et al., 2012; Shirazi et al., 2010; Wang et al., 2014; Xiarchos et al., 2003) and
higher overall cost compared to the conventional systems (Barello et al., 2014; Massé et
al., 2011). These problems have received tremendous attention from researchers and
engineers to improve the efficiency of UF systems. Identifying the root causes of such
problems are the keys towards developing effective solutions. There is a lack of actual
case studies on industrial-scale UF membrane water treatment systems in Malaysia
reported in literature to evaluate its performance. Comprehensive evaluations and case
studies of UF systems provide essential information to further highlight the challenges
Univers
ity of
Mala
ya

4
and substantiate the feasibility of such water treatment systems to accommodate future
requirements. The common problems identified from these evaluations lead to detailed
analysis of possible solutions from various literature sources.
Increasing the process efficiency by reducing resources utilizations and losses are
rigorously pursued by engineers to ensure feasibility of the UF membrane water
treatment systems. The procedures to analyze potential membrane fouling conditions
typically required competent staff with advanced laboratory equipment. Most industrial-
scale UF membrane water treatment plants have limited facilities and resources in their
own in-house laboratory to conduct analysis. There is a lack of practical predictive
models suitable for implementation at these water treatment plants to detect potential
membrane fouling conditions due to feed water characteristics changes. A more
comprehensive process control system could be devised together with the predictive
models to enhance the efficiency of the UF process. This research work intends to
provide detailed evaluation studies and highlight the practical solutions through process
modelling and control of UF membrane water treatment systems.
1.4 Aim and objectives
This research aims at evaluating technical issues of UF membrane water treatment
systems and suggesting solutions to the problems statement mentioned earlier. Detailed
analysis and experimental works have been implemented to justify the research
findings. All these efforts have been executed to achieve the objectives of this research
study on UF membrane water treatment systems. There are five major objectives in this
research work stated as follows:-
Univers
ity of
Mala
ya

5
1. To highlight the design and operational issues of an industrial-scale UF
membrane water treatment plant.
2. To evaluate and compare both the UF and conventional water treatment systems
on various commercial, quality and environmental aspects.
3. To evaluate key issues to scale-up the UF systems from laboratory-scale and
pilot-scale systems results.
4. To develop a practical hybrid model for the prediction of potential membrane
fouling parameters in UF membrane water treatment systems.
5. To develop an efficient ANN control system for the dead-end constant flux UF
membrane water treatment systems.
Detailed analysis and experimental works were designed to achieve the five
objectives relating to the UF membrane water treatment systems of this research work.
1.5 Outline of the thesis
This thesis is presented in the article style format which consists of eight chapters.
First two chapters provide a general introduction and literature review on the research
topic. The following five chapters address each objectives and finally the conclusions in
the last chapter.
CHAPTER 1: GENERAL INTRODUCTION
This chapter provides an introduction of the research topic on UF membrane water
treatment systems, problems statement and the main objectives of this research.
Univers
ity of
Mala
ya
6
CHAPTER 2: LITERATURE REVIEW
Under this chapter, information from various sources has been gathered to produce
an overall literature review which highlights relevant aspects of the UF process.
CHAPTER 3: ANALYSIS OF INDUSTRIAL-SCALE ULTRAFILTRATION
MEMBRANE WATER TREATMENT SYSTEM
Chapter 3 presents a case study of an industrial-scale UF membrane water treatment
plant located at Kelantan, Malaysia. Issues related to feed water characteristics,
membrane surface area, fouling, chemicals cleaning, hydraulic backwash efficiency and
energy consumption of the UF membrane water treatment plant have been further
elaborated in this chapter.
CHAPTER 4: EVALUATION AND COMPARISON OF ULTRAFILTRATION
AND CONVENTIONAL WATER TREATMENT SYSTEMS
This chapter highlights the case study of a detailed evaluation and comparison on
both the industrial-scale UF and conventional media/sand filtration water treatment
systems. Five aspects of comparison have been presented in this study which includes
capital cost, operational cost, maintenance cost, analysis of filtrate quality and the
overall water losses.
Univers
ity of
Mala
ya
7
CHAPTER 5: KEY ISSUES OF ULTRAFILTRATION MEMBRANE WATER
TREATMENT SYSTEM SCALE-UP FROM LABORATORY AND PILOT-
SCALE EXPERIMENTAL RESULTS
Chapter 5 presents a case study on three UF systems with different capacities to
represent laboratory-scale, pilot-scale and industrial-scale systems. The three UF
systems were compared in operational aspects such as filtrate quality, trans-membrane
pressure of membrane modules and the electricity utilization.
CHAPTER 6: POTENTIAL MEMBRANE FOULING PARAMETERS
PREDICTION USING HYBRID MODELLING FOR ULTRAFILTRATION
MEMBRANE WATER TREAMENT SYSTEM
This chapter presents a practical hybrid modelling approach with consists of an ANN
model and a theoretical first principle model using Darcy’s law. The development and
results of this hybrid model has been further elaborated with experimental data in this
chapter.
CHAPTER 7: ARTIFICIAL NEURAL NETWORKS CONTROL FOR
ULTRAFILTRATION MEMBRANE WATER TREATMENT SYSTEM
Chapter 7 highlights an alternative process control system utilizing ANN model and
controllers to reduce water losses. Comparisons between this control system and the
conventional set-points control system have been conducted with on-line experiments
with an UF experimental system.
Univers
ity of
Mala
ya

8
CHAPTER 8: CONCLUSIONS AND RECOMMENDATIONS
In this final chapter, summary findings of this research work and conclusions have
been highlighted. Recommendations for future studies relevant to this research have
also been suggested.
Univers
ity of
Mala
ya

9
CHAPTER 2: LITERATURE REVIEW
The main research topic discussed in this work is related to the UF process of natural
surface water to produce potable/drinking water. Information from various sources was
gathered and a detailed literature review has been conducted to highlight the various
aspects of UF membrane water treatment systems of this research. Throughout this
chapter, relevant information is further elaborated and critical assessment has been
presented on the overall literature findings of the UF process.
2.1 Introduction
Membrane filtration systems are becoming significantly important in various solid-
liquid separation processes. One of the main applications of membrane filtration
systems is in the water treatment industry particularly in large-scale potable/drinking
water production. UF is one of the most commonly utilized membrane filtration systems
in the water treatment industry due to its various advantages. There are common
perceptions that membrane filtration systems for water treatment are “expensive”
technologies which required high capital and operational costs. Common technical
complications such as membrane fouling issues are rigorously researched and reported
in various literature sources. UF membrane applications in potable/drinking water
treatment systems are consistently receiving positive feedbacks. In the following
sections of this chapter, various aspects of the UF systems related to water treatment
have been further elaborated in details. Commonly encountered technical terms in UF
membrane systems such as hollow fibre, foulant, dead-end filtration and cross-flow
filtration are also further elaborated.
Univers
ity of
Mala
ya

10
2.2 Ultrafiltration membranes for drinking water treatment systems
Most water treatment plants are infrastructure or facilities administered by
government of local authorities to provide safe potable/drinking water to the people
through public-piped water supply (Marzouk & Elkadi, 2016). In Malaysia, 99% water
supply for domestic use originates from natural surface water while the balance 1% of
the supply comes from groundwater (Ab Razak et al., 2015). Raw water sources for
water treatment plants primarily consists of freshwater inflow such as surface river
water (Davies & Mazumder, 2003). One of the main solid-liquid separation process in
water treatment plants is filtration (Zouboulis et al., 2007). The two most commonly
used filtration systems in full-scale water treatment plants are sand/media and
membrane filters. In recent years, membrane filtration systems including UF have
garnered a lot of attention from researchers and engineers on its feasibility in water
purification.
UF process utilizes semi-permeable synthetic membranes (commonly known as
either polymeric or ceramic membranes) which are capable of segregating fine particles,
bacteria and viruses from the filtrate to produce water which is safe for human
consumption (Di Zio et al., 2005). The past decades of technology advancement have
promoted descending membrane fabrication cost due to mass production, competitive
pricing from manufacturers and the spur of demands for membrane systems (Suárez et
al., 2015). Polymeric membranes are more commonly used in the water treatment
industries because of its lower cost compared to ceramic membranes (Fujioka et al.,
2014). Polyethersulfone (PES) and Polyvinylidene fluoride (PVDF) are some of the
most widely used polymeric UF membrane in water treatment (Jalali et al., 2016; Wang
et al., 2016b). Polymeric membranes are commonly fabricated using either non-solvent
induced phase separation (NIPS) or thermally induced phase separation (TIPS) methods
(Jung et al., 2016).
Univers
ity of
Mala
ya

11
Membrane technology is applied in various formats such as hollow fibre, tubular, flat
plate, spiral, stirred cell and rotating. The most commonly used format for water
treatment is the hollow fibre system due to its high specific packing density (Arndt et
al., 2016). The hollow fibre membranes are usually contained in cylindrical shaped
pressure housing and collectively known as membrane modules. Figure 2.1 shows the
UF hollow fibre membrane module produced by Inge GmbH from Germany and its
cross-sectional view. These membrane modules usually consist of proprietary design
developed and produced by the membrane manufactures to suit the application of their
membrane (Wan et al., 2017).
Figure 2.1: UF hollow fibre membrane module produced by Inge GmbH (Germany) and its cross-sectional view
There are two common operation modes for UF membranes applied on industrial-
scale systems which are dead-end and cross-flow filtrations (Mota et al., 2002). Among
these operation modes, dead-end filtration is more desirable for industrial-scale UF
membrane water treatment plants because of its lower specific energy requirement
(kWh/m3) compared to cross-flow filtration (Mendret et al., 2009). The dead-end
Cross section of UF membrane module (hollow fibre membranes)
Univers
ity of
Mala
ya

12
filtration operation requires an intermittent backwash to be carried out as physical
cleaning after each filtration sequence. Cross-flow filtration is a continuous operation
process whereby both filtrate and concentrate (sludge) streams are produced
simultaneously. Figure 2.2 illustrate the dead-end and cross-flow filtration operation
modes.
Figure 2.2: Dead-end and cross-flow filtration operation modes
UF is utilized in water treatment plants to ensure high efficiency of solid-liquid,
bacteria and viruses separation in order to achieve potable/drinking water standards
(Besmer & Hammes, 2016). Pore size of the UF membrane plays a major role for the
separation process and reported to fall within 35 – 20 nm for water treatment
applications (Akhondi et al., 2017). The pore size of the UF membrane is a complex and
important characteristic of the membrane (Arkhangelsky et al., 2012).
Membrane
Feed water Feed water
Filtrate Filtrate
Concentrate
Dead-end filtration Cross-flow filtration
Univers
ity of
Mala
ya

13
2.3 Analysis and evaluation of UF membrane water treatment systems
In-depth understanding of the difficulties encountered in UF membrane water
treatment systems enables the possibilities for viable solutions on membrane fouling
and other operational issues. In order to highlight the technical problems encountered in
UF systems, case studies on industrial-scale systems were highly recommended for
detailed analysis (Petrinic et al., 2015; Vera et al., 2017; Xiao et al., 2012) . Some of the
most common issues in membrane systems are the irreversible fouling of the
membranes (Guo et al., 2012; Shirazi et al., 2010; Thekkedath et al., 2007; Wang et al.,
2014) and the higher cost of operation compared to the conventional media/sand
filtration systems (Massé et al., 2011). Membrane fouling is defined as depositions of
unwanted and non-integral substances known as foulant on the membrane surface which
causes undesirable consequences and additional resistance (Ho et al., 2016; Porcelli &
Judd, 2010).
In recent years, many researchers have conducted laboratory analyses on membrane
fouling mechanism to determine the causes which eventually might leads to feasible
solutions for the cleaning procedures (Arkhangelsky et al., 2011; Sioutopoulos &
Karabelas, 2012; Stoller et al., 2013; Tian et al., 2013a; Xiao et al., 2012). These
analyses provided more insights and hypotheses on the causes of such problems
encountered in UF membrane systems particularly in water treatment under laboratory
controlled environment. Case study of an actual system would allow a much rigorous
investigation protocol to be implemented and provides much reliable results (Arroyo et
al., 2016).
Besides laboratory-scale analyses, experiments on pilot-scale UF membrane systems
were also reported in literature to provide much precise information (Arnal et al.,
2008b; Arnal et al., 2007). These pilot-scale studies are usually conducted over a
prolong period of time (ranges from a few weeks to a few months) which could yield
Univers
ity of
Mala
ya

14
results which have much closer approximation to a full-scale system. Laboratory
experiments and pilot-scale studies are preliminary evaluation methods to analyze the
effect of the feed water on particular types of industrial-scale UF membrane systems
(Bu-Rashid & Czolkoss, 2007; Glueckstern et al., 2000; Halpern et al., 2005; Rajca,
2016). These laboratory-scale and pilot-scale UF systems are distinctively smaller size
than industrial-scale systems but they should retain the same type of UF membrane
(produced by the same manufacturer) to ensure similar characteristics. Figure 2.3
indicates the example of various sizes and membrane surface area contained in each
type of UF membrane modules (produced by the same manufacturer) for the laboratory-
scale, pilot-scale and industrial-scale systems.
Figure 2.3: Various sizes and membrane surface area of UF membrane modules produced by Inge GmbH (Germany)
603 mm
Laboratory-scale UF module with 1.0 m2 membrane surface area
Pilot-scale UF module with 6.0 m2 membrane surface area
Industrial-scale UF module with 60 m2 membrane surface area
1130 mm
1689 mm
Univers
ity of
Mala
ya

15
Case studies involving industrial-scale systems are commonly utilized to evaluate
and demonstrate the capabilities of certain processes or systems (Altuntas et al., 2016;
Marshall et al., 2016; Pitkänen et al., 2016). Various researchers have conducted case
studies on industrial-scale water treatment systems in recent years to demonstrate the
relation to economic and environmental impacts (Tornevi et al., 2016; Walsh et al.,
2017; Weidhaas et al., 2017). These case studies were relevant towards specific
locations from where the data were obtained and might not be accurate to represent
some other locations. There are not many case studies in Malaysia related to industrial-
scale UF membrane water treatment systems reported in literature mainly because
conventional media/sand filtration is still dominant in most industrial-scale water
treatment systems.
2.4 Modelling of UF membrane filtration process
Process modelling is a fundamental method to understand or estimate how the input
parameters of a process affect the outputs (Al-Obaidi et al., 2017). Membrane filtration
processes are swiftly gaining acceptance as mainstream solid-liquid separation methods
and the modelling of membrane filtration pose a significant importance to optimize the
operation and address the membrane fouling problems (Llanos et al., 2013).
Fundamental models of solid-liquid membrane filtration have been developed by
researchers and these models were validated through laboratory experiments (Kim &
DiGiano, 2009; Tien et al., 2014). These researchers applied the Darcy’s law to
establish correlation between flux, resistance and pressure in their models. According to
the Darcy’s equation, a cake layer of fine solids formed on the upstream membrane
surface causes resistance to the liquid molecules and raises the trans-membrane pressure
(TMP) of the filtration process (Osterroth et al., 2016). The TMP is proportional to the
Univers
ity of
Mala
ya

16
resistance of the fouling layer under constant flux filtration conditions (Oishi et al.,
2015). A commonly accepted definition of TMP is the pressure drop across the
membrane barrier typically measured through the inlet and filtrate ports of the
membrane (Boyd & Duranceau, 2013).
The cake layer permeability is an important parameter which affects the filtration
process substantially. Permeability of a UF membrane filtration system is defined as the
filtration flux at a given TMP (Lee & Park, 2016). Under constant flux filtration, the
cake layer permeability decreases over time due to the accumulation of higher solids
concentrations on the membrane surface. In order to maintain constant flux filtration,
the feed water pressure would need to be increased to overcome the higher TMP.
Membrane filtration at high TMP increases the electricity power requirement which
translates to higher operational cost. Various membrane cleaning methods are often
implemented to reduce the TMP.
One of the main obstacles to predict the cake layer permeability arises due to the
difficulty in estimating the average, effective, particle size present in the feed water.
High-end laboratory analysis equipment or methods such as scanning electron
microscopy (SEM), energy dispersive X-ray analysis (EDX) and attenuated total
reflectance Fourier transform infrared spectroscopy (ATR-FTIR) were often used to
analyze the chemical composition of membrane surface, size and shape factor
distribution of the solid particles attached on the membrane surface (Bourcier et al.,
2016; Marbelia et al., 2016). These expensive and high-end laboratory equipment for
analysis procedures are seldom available in large-scale membrane water treatment
plants and usually these analyses are conducted by third party specialist laboratories.
Figure 2.4 illustrates the formation of fine solids cake layer on the UF membrane
surface.
Univers
ity of
Mala
ya

17
Figure 2.4: A cake layer membrane filtration model
Under ideal laboratory conditions, the feed solution/water should have fixed
concentration of the suspended solids with similar particle size so that the cake layer
could be uniformly developed (Sioutopoulos & Karabelas, 2012; Tian et al., 2013b; Yi
et al., 2013). A typical industrial-scale UF membrane water treatment plant rarely has
such ideal feed water as the surface water is subjected to weather condition such as
heavy rain falls and surface run-off which changes the suspended solids concentration
drastically. Most feed water sources to water treatment plants originates from freshwater
inflow such as river water (Davies & Mazumder, 2003). Various pre-treatment
processes such as chemical coagulation-flocculation prior to UF are often implemented
to reduce the impact of feed water characteristic changes on the membrane filtration
(Tian et al., 2013c; Wei et al., 2016; Yu & Graham, 2015). All pre-treatment processes
UF membrane
Feed water
Filtrate
Fine solids (foulant)
Cake layer
Univers
ity of
Mala
ya

18
incurred additional cost and equipment to facilitate the systems which might not be
feasible for some water treatment plants.
Modelling of an actual membrane filtration system poses many challenges (Li et al.,
2016a). The significant variation and changes of the feed water characteristics
mentioned earlier would require certain parameters of the model to be changed as well.
There are three common methods of modelling a process reported in literature which are
known as the white-box model, black-box model and grey-box model (Afram & Janabi-
Sharifi, 2015). The complexity level of the process determines which modelling method
is more suitable. In UF systems, the grey-box model or hybrid model has been utilized
to predict the TMP of the process with much higher accuracy than the white-box or
physical model (Liu et al., 2016). Hybrid models have the advantage of combining both
the white-box and black-box models characteristics to yield a much accurate results in
some processes. Table 2.1 shows the characteristics of the three commonly utilized
modelling methods.
Table 2.1: Characteristics of commonly used modelling methods
White-box model Black-box model Grey-box model
• understanding of the system physics
• using the required
parameters to model the system dynamics
• good generalization
capabilities but poor accuracy in some systems
• little or no understanding of the system is required
• using regression method to fit the inputs and outputs data with mathematical function.
• poor generalization but high accuracy in some systems
• partial combinations of the white-box and black-box model
• use the physics based model as the mathematical structure
• measured inputs and outputs data to estimate parameters of the model
• acceptable level of generalization and accuracy for some systems
Univers
ity of
Mala
ya

19
2.5 Process control and fouling of UF membrane water treatment systems
UF membrane fouling is the most critical problem that many researchers have tried
to overcome (Guo et al., 2012). Various methods to reduce membrane fouling such as
physical cleaning, membrane surface modification and others hydrodynamic flushing
procedures to dislodge the attached solids on the membrane surface have been
suggested (Aslam et al., 2017; Shamsuddin et al., 2015). A typical definition of
membrane cleaning is a set of procedures applied to relieve non-integral substance
which are also known as foulant from the membrane surface (Porcelli & Judd, 2010).
Hydraulic backwash is a type of physical cleaning method widely applied in UF
membrane water treatment systems to reduce irreversible fouling (Chang et al., 2015).
Under the dead-end operation mode, intermittent backwash is carried out after each
filtration sequence to clean the membrane from foulant (Mendret et al., 2009). The
backwash sequence has been acknowledged to decrease membrane pore and cake
fouling to improve the filtration flux (Akhondi et al., 2017).
Another important factor defining the performance of membrane systems is to
ensure high recovery rate and reduce water losses (Zhang et al., 2017). Rigorous studies
on effective backwash methods of UF systems were investigated by various researchers
(Chang et al., 2016a; Chang et al., 2016b; Chang et al., 2015). Effective process control
of the backwash process in UF systems is the key element to mitigate membrane fouling
(Gu et al., 2016). Most of the municipal and industrial-scale membrane water treatment
plants implement fixed durations of filtration and backwash sequences based on
membrane manufacturer and the design engineers recommendations (Cogan & Chellam,
2014). The process control logic sequences are normally programmed based on pre-
determined set-points (Alphonsus & Abdullah, 2016). This might not provide the most
effective process control as external factors such as feed water characteristic changes
have not been taken into considerations.
Univers
ity of
Mala
ya
20
Optimizing the operating conditions of the membrane filtration and backwash
processes could mitigate membrane fouling (Shi et al., 2014). Process control plays an
important role to ensure the products/outputs quality and minimized the resources
required for the system (Foscoliano et al., 2016). Most large-scale water treatment
plants utilized natural surface water such as river as feed water (Davies & Mazumder,
2003). The natural feed water consists of various particles and matrix of organic matter
which were known as organic foulants for membranes (Shang et al., 2015). In order to
ensure smooth and efficient membrane systems operation, various process control
strategies have been proposed by researchers (Córdova et al., 2016; Gao et al., 2016; Gu
et al., 2016). These were very specific process control strategies catered for certain
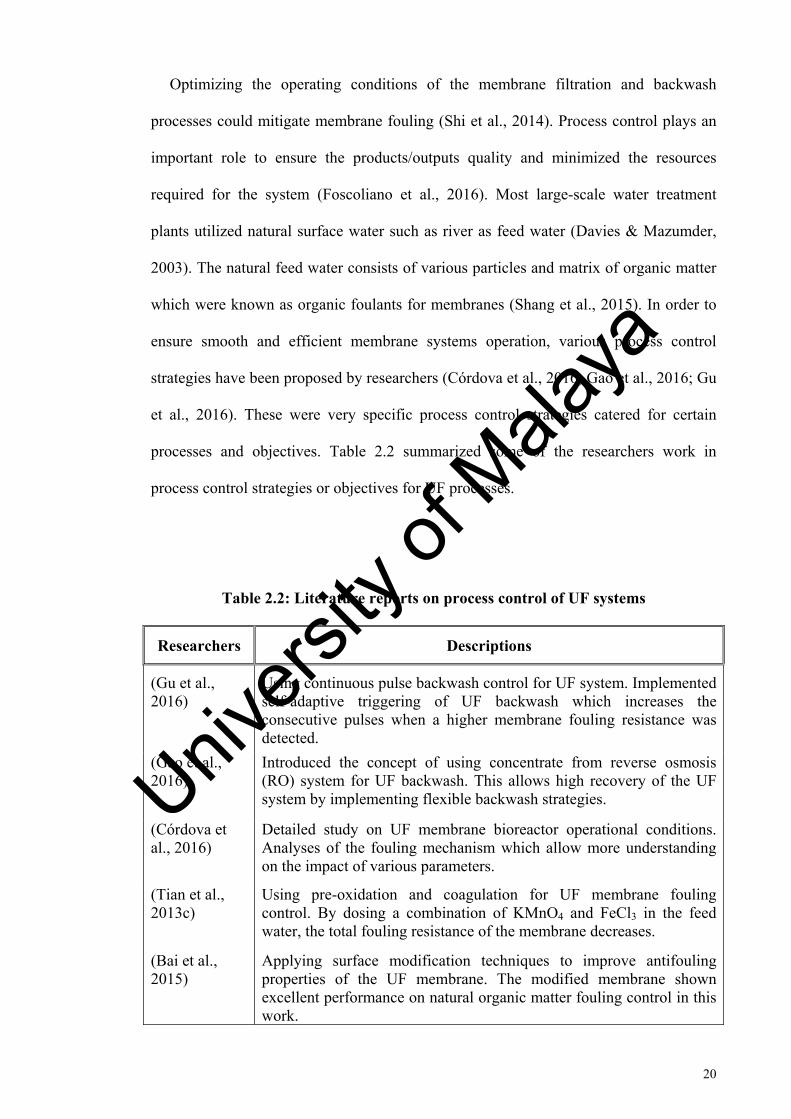
processes and objectives. Table 2.2 summarized some of the researchers work in
process control strategies or objectives for UF processes.
Table 2.2: Literature reports on process control of UF systems
Researchers Descriptions
(Gu et al., 2016)
Using continuous pulse backwash control for UF system. Implemented self-adaptive triggering of UF backwash which increases the consecutive pulses when a higher membrane fouling resistance was detected.
(Gao et al., 2016)
Introduced the concept of using concentrate from reverse osmosis (RO) system for UF backwash. This allows high recovery of the UF system by implementing flexible backwash strategies.
(Córdova et al., 2016)
Detailed study on UF membrane bioreactor operational conditions. Analyses of the fouling mechanism which allow more understanding on the impact of various parameters.
(Tian et al., 2013c)
Using pre-oxidation and coagulation for UF membrane fouling control. By dosing a combination of KMnO4 and FeCl3 in the feed water, the total fouling resistance of the membrane decreases.
(Bai et al., 2015)
Applying surface modification techniques to improve antifouling properties of the UF membrane. The modified membrane shown excellent performance on natural organic matter fouling control in this work.
Univers
ity of
Mala
ya

21
Most of the process controls for UF water treatment systems are aimed at enhancing
the efficiency of the process. Reducing the energy/electricity and water losses are some
of the major achievements of high efficiency process control for UF systems. Both of
these aspects (energy and water losses) are inter-related as membrane fouling causes
higher TMP which requires more energy to drive the feed pump and higher water
volume to clean the membrane. Ensuring minimal or acceptable UF membrane fouling
is the key element to achieve efficient process control in the long term.
2.6 Summary of overall literature review
Literature research findings reported on UF has indicated its feasibility for
commercialization in water treatment systems. The dead-end filtration operation mode
is a more efficient process for industrial-scale UF membrane water treatment plants
which could potentially lowered down operational cost. Detailed analysis of the UF
membrane fouling model enables a better control strategy to be developed on the
process. Main objectives of this research are to highlight some of the important aspects
of industrial-scale UF membrane water treatment systems through case studies and
propose practical modelling as well as process control approach to mitigate some of the
problems.
Univers
ity of
Mala
ya

22
CHAPTER 3:
ANALYSIS OF INDUSTRIAL-SCALE ULTRAFILTRATION MEMBRANE
WATER TREATMENT SYSTEM
The average household water tariff (denoted in United States Dollar or USD) in
Malaysia (0.39 USD/m3) is among the lowest in Southeast Asia region compared with
neighboring countries such as Indonesia (0.77 USD/m3) and Singapore (1.88 USD/m3)
(Lee et al., 2016b). One of the reasons is because most of the industrial-scale water
treatment plants in Malaysia are still utilizing conventional media/sand filtration
systems which require low capital construction and operational cost (Ab Razak et al.,
2015). Developed countries in Asia such as Singapore and Japan have adopted
membrane technologies over the conventional media/sand filtration in large-scale
potable/drinking water treatment facilities to fulfill their countries industrial and
domestic demands. Membrane technologies are still relatively new for industrial-scale
water treatment plants in Malaysia and further analysis of such systems are much
needed.
3.1 Introduction
In this chapter, a detailed case study of an industrial-scale UF membrane water
treatment plant located at Kelantan, Malaysia has been highlighted. This is one of the
largest government-owned UF membrane water treatment plant in the country which
provides potable/drinking water to a small town through the public-piped water supply
networks. Under this case study, actual operational data of the UF membrane water
treatment plant was recorded and analyzed to elucidate the performance of this water
Univers
ity of
Mala
ya
23
treatment plant. Comparison between literature report and the actual findings from this
case study was made to further elaborate the analysis. These findings would assist in
bridging the gaps between literature findings and the actual difficulties encountered in
an industrial-scale UF membrane system. Understanding these differences and
similarities would have significant impacts and benefits to improve the operation and
design of such UF membrane systems.
3.2 Background
In recent decades, the manufacturing cost of polymeric UF membrane has decreased
significantly due to mass production. This type of UF membrane has garnered high
acceptance for utilization in industrial-scale water treatment systems (Laîné et al.,
2000). It was reported that UF has been considered as one of the most commonly
applied alternative water treatment systems to produce drinking water in large-scale
(Mierzwa et al., 2012). This conclusion arise from the fact that the UF systems are
capable of substituting the entire conventional water treatment process to remove fine
solids, bacteria and virus from the feed water (Tian et al., 2013a). UF systems are
considered highly efficient and environmentally friendly pre-treatment technology prior
to seawater desalination (Tang et al., 2016b). There are a lot of challenges in the
operation of industrial-scale UF membrane water treatment plants associated with the
fluctuations of inputs parameters such as feed water and difficulties to scale-up the
optimum conditions from the laboratory-scale and pilot-scale systems (Zupančič et al.,
2014).
One of the common methods deployed to analyze large-scale UF membrane systems
are through case studies (Petrinic et al., 2015; Vera et al., 2017). Researchers have
shown that an industrial-scale UF membrane water treatment plant at Nantong, China
Univers
ity of
Mala
ya

24
produced very consistent filtrate quality with 99% turbidity reduction and no coliform
bacteria was detected (Xiao et al., 2012). These results have clearly exhibited UF
capability to replace conventional water treatment system to produce safe drinking
water.
Besides the membrane fouling issues, most industrial-scale UF membrane water
treatment systems also faced higher overall construction and operational costs than the
conventional systems (Massé et al., 2011). Drinking water production cost model
correlating membrane characteristics such as strength, fouling propensity and
permeability has been reported in the literature to highlight some of the commercial
issues (Pearce, 2012). Even though dead-end UF operation mode is more preferable in
water treatment systems (Mendret et al., 2009), it has a major disadvantage of high
velocity of fine solids deposited on the membrane surface (Remize et al., 2010). One of
the most promising advantage of dead-end UF operations reported is the lower energy
requirement per unit of filtrate production under low TMP ranging from 0.2 to 0.8 Bar
(Massé et al., 2011).
Designing efficient fouling control is one of the many challenges towards an efficient
UF system operations (Shirazi et al., 2010). Laboratory experiments have shown that
membrane fouling causes flux declined and increased TMP (Xiao et al., 2012). Some
researchers have proposed the use of hybrid membrane process utilizing activated
carbon to alleviate membrane fouling issues but encountered with other challenges such
as membrane abrasion (Stoquart et al., 2012). Another effective method to restore flux
decline due to membrane fouling is through specific chemical cleaning (Arkhangelsky
et al., 2007; Arnal et al., 2008a; Levitsky et al., 2011). Although chemical cleaning is an
effective method to remove foulant, it has the tendency to enlarge the pore structure
causing deformation of the membrane material. Hydraulic backwash is a much more
preferable but less rigorous membrane cleaning method to remove fouling which is
Univers
ity of
Mala
ya
25
under tremendous attention by scientific researchers (Bessiere et al., 2009; Katsoufidou
et al., 2008; Lipp & Baldaufb, 2002; Remize et al., 2010; Ye et al., 2011).
Limiting flux or volume of filtrate per membrane area (m3/m2hr) is also a common
method to control membrane fouling and optimize the filtration operation (Field &
Pearce, 2011; Zhang et al., 2016). Under normal circumstances, a lower flux correlates
to a lower fouling rate and vice versa. The characteristic of the feed water has a high
impact on this limiting flux. Prior to the design of a large-scale membrane system, pilot-
scale studies are often carried out to determine the specific flux based on the feed water
characteristics (Manth et al., 1998). Design engineers are often faced with challenges in
determining optimum design parameters in order to reduce the cost of membrane
required and ensuring minimum membrane fouling possibilities.
All these issues related to feed water characteristics, membrane surface area, fouling,
chemicals cleaning, hydraulic backwash efficiency and energy consumption of an
industrial-scale UF membrane water treatment plant have been further elaborated in this
research work. Data obtained from this case study water treatment plant was compared
with literature findings to establish possible solutions for the problems. The subsequent
sections in this chapter provide details of the analysis methodology and the findings
with relevant discussions.
3.3 Methodology
An industrial-scale UF membrane water treatment plant located at Kelantan,
Malaysia has been selected for the case study in this research. Figure 3.1 shows the
actual site photo of the water treatment plant.
Univers
ity of
Mala
ya

26
Figure 3.1: UF membrane water treatment plant at Kelantan, Malaysia
This water treatment plant was designed to produce up to 14 million liters a day
(MLD) or 576 m3/hr of potable water commences operation since February 2013. The
potable water from this treatment plant was channeled to the public-piped water supply
networks. Feed water to this water treatment plant was extracted from a riverbank
filtration intake and subsequently pumped to a cascading aerator. After passing through
cascading aerator, further forced-aeration with mechanical blowers was carried out in an
extended aerator for the oxidation of manganese and iron constituents.
Preliminary filtration process was achieved using pressurized media/sand filters
before proceeding to the UF systems. Finally the filtrate was disinfected with liquid
chlorine before supplying to the public-piped water supply networks. Figure 3.2 shows
the flowchart of the industrial-scale UF membrane water treatment plant processes.
Univers
ity of
Mala
ya

27
Figure 3.2: Flowchart of the industrial-scale UF membrane water treatment plant
This UF membrane water treatment plant implemented direct filtration without the
addition of any chemical as coagulant and flocculant. The water treatment plant was
designed for fully automated operation with minimal human intervention except during
abnormal conditions. Most of the operational data was recorded digitally using on-line
analyzers and recorders. Table 3.1 shows the on-line analyzers/sensors available for
digital data monitoring in this case study.
Riverbank filtration intake
Cascading aerator
Extended aerator
14 MLD Ultrafiltration (UF)
system
Treated water tank
Pressurized sand filter
Liquid chlorine
High lift pump
Public-piped water supply networks
Univers
ity of
Mala
ya

28
Table 3.1: On-line analyzers/sensors for digital data monitoring
Analyzer/Sensor Location Measured data
Electromagnetic flowmeter
Feed/raw water pipeline and treated water pipeline
Flow rate of feed/raw water and treated water from the treatment plant
Turbidity analyzer
Feed/raw water pipeline and treated water pipeline
Turbidity of the feed/raw water and treated water from the treatment plant
Pressure transmitters
UF membrane modules inlet and filtrate header pipes
Determine the trans-membrane pressure (TMP) of the UF membrane
Electricity usage meter
Main incoming electricity supply cable
Electricity consumption of the UF membrane water treatment plant
Besides the on-line analyzers/sensors, the water treatment plant was also equipped
with an in-house laboratory to conduct water quality analysis on a daily basis. All these
available facilities were to ensure that the water treatment plant produces safe potable
water to the public-piped supply networks. This UF membrane water treatment plant
comprises 120 units of Dizzer XL 0.9 MB 60W UF membrane modules (produced by
Inge GmbH, Germany) as one of the main components. The total membrane surface
area of all these UF modules combined was equivalent to 7, 200 m2 which have been
recommended to operate at 80 L/m2hr of flux rate. These were polymeric membranes
made from modified Polyethersulfone (mPES). The membranes were manufactured into
strands of hollow fibre consisting of 7 capillaries of 0.9 mm diameter each. Average
pore size of the membrane was approximately 0.02 µm with molecular weight cut-off
(MWCO) of about 100 kDa. Figure 3.3 shows the hollow fibre membrane and its cross-
sectional view.
Univers
ity of
Mala
ya

29
Figure 3.3: UF hollow fibre membrane utilized at the water treatment plant
Utilizing the availability of all the facilities in this industrial-scale UF membrane
water treatment plant, the relevant operational data of the system was collated and
analyzed in detailed. The following sections in this chapter further elaborate on the
findings and discussions.
3.4 Results and discussions
In this section, all the relevant operational data from the water treatment plant was
compiled, analyzed critically and discussed. The analyses encompassed aspects such as
membrane surface area, feed/raw water characteristics, chemicals for UF membrane
0.9 mm
Univers
ity of
Mala
ya

30
cleaning, hydraulic backwash/chemical cleaning efficiency, UF membrane fouling and
electricity consumption.
3.4.1 Membrane surface area
The first and foremost important design parameter of UF membrane systems is to
ascertain the required membrane surface area to achieve the design filtrate capacity
(Manth et al., 1998). Flux rate of between 50 – 130 L/m2hr in UF water treatment
systems are common and dependence on the characteristics of the feed/raw water. There
are 3 common definitions of filtration fluxes reported in literature (Field & Pearce,
2011) and further elaborated in Table 3.2.
Table 3.2: Definitions of various flux conditions for membrane systems
Terms Definitions
Critical flux Flux at which fouling is first observed at a known cross-flow velocity
Sustainable flux Flux that is maintained by chemical and mechanical cleaning methods to ensure the desired operations cost and the membrane service life.
Threshold flux Flux which a low and consistent rate of membrane fouling take place
These various flux conditions have suggested laboratory experiments or pilot-scale
studies should be carried out to determine the most suitable filtration flux and
subsequently the required membrane surface area. This case study industrial-scale UF
Univers
ity of
Mala
ya

31
membrane water treatment plant was initially designed based on a few samples of the
raw water from the river without going through a rigorous pilot-scale study. The
incoming raw water turbidity from the river bank filtration intake was estimated to be
below 20 Nephelometric Turbidity Units (NTU) and this was used as the basis for the
design of the UF system. Based on this assumption, the filtration flux rate was fixed at
80 L/m2hr as the designed flux to achieve the desired maximum output of 576 m3/hr
with 7, 200 m2 of UF membrane surface area. The UF system was operated under dead-
end constant flux filtration mode with intermittent backwash. During preliminary design
stage, the UF membrane’s manufacturer simulation software (Inge System Design) was
utilized to determine the flux rate based on feed water data such as dissolved organic
carbon (DOC), temperature, chemical oxygen demand (COD), pH, turbidity and
suspended solids concentration.
It is generally a known fact that membrane filtration is a complex process that
involves many interacting factors which requires extensive monitoring, cost and time
(Seyed Shahabadi & Reyhani, 2014). Many researchers have conducted more than 4
months of UF pilot-scale studies to determine the interacting factors for a better
understanding of the systems (Holloway et al., 2015; Loganathan et al., 2016; Urgun-
Demirtas et al., 2013). In many cases (such as this case study water treatment plant),
these extensive pilot-scale studies were often neglected due to budget and time
constraint. Operation problems such as irreversible fouling might not manifest as a
major issue during the initial period of operation but rather at a much later stage.
Complications arise when initial feed water characteristic assumed in the design stage
significantly deviates during the actual operation of the system which has been further
discussed in the subsequent sections.
Univers
ity of
Mala
ya

32
3.4.2 Feed/raw water characteristics
It was mentioned earlier that most of the potable/drinking water sources originated
from surface freshwater such as rivers (Davies & Mazumder, 2003). River water
turbidity is highly dynamic and exhibits significant changes due to heavy rainfalls
conditions (Lee et al., 2016a). Various constituents such as humic acid (Sioutopoulos &
Karabelas, 2012), inorganic salts (Shirazi et al., 2010), biopolymer (Tian et al., 2013a)
and heavy metal ions (Choo et al., 2005) in the feed water are potential foulant in
membrane systems.
Feed water characteristics and the UF flux rate constitute inter-dependency
relationship. Extreme contamination or problematic feed water with high constituents of
potential foulant would necessitate low flux rate and frequent cleaning to reduce
irreversible membrane fouling. River/raw water characteristics fluctuation is most
commonly monitored through on-line turbidity analyzers (Marchant et al., 2015). Raw
water sample turbidity is measured using optical analysis method in Nephelometric
Turbidity Units (NTU). This turbidity measurement is often inferred to the suspended
solids concentrations of the samples. Natural water samples with high suspended solids
concentration often means having high constituents of foulant as well.
Design engineers are usually faced with the dilemma of construction cost and long
term efficiency/durability of a system (Snelgrove & Saleh, 2016). In order to ensure a
fair estimation of the river water characteristics, grab samples were conducted randomly
within a 3 months period prior to the design of this UF membrane water treatment plant.
The average analysis results indicated the river water turbidity was below 20 NTU. This
information was then utilized as the design basis for the UF membrane water treatment
plant which commences construction in 2011. After the treatment plant commenced
commercial operation in 2013, daily feed water analyses from the same river were
Univers
ity of
Mala
ya

33
conducted. Figure 3.4 shows the daily river/feed water turbidity to the water treatment
plant recorded in September 2013.
Figure 3.4: Feed water turbidity to UF membrane water treatment plant
The monthly average of the feed water turbidity in September 2013 was 13.7 NTU
which falls within the design limit of 20 NTU or below. A more detailed analysis
indicated that there were at least 4 days (7th, 8th, 13th and 15th of September 2013) or
approximately 13% of the time the feed water daily average turbidity exceeding 20
NTU with the highest reading recorded at 68 NTU.
Most of the industrial-scale automation systems including this water treatment plant
were executed using programmable logic controllers (PLC) with pre-determined timers
and set-points (Alphonsus & Abdullah, 2016). The control system for this water
treatment plant has been programmed to operate efficiently and automatically with feed
water turbidity of 20 NTU or below. On-line turbidity analyzer in this water treatment
plant would trigger an alarm when the raw water turbidity exceeds 20 NTU to warn the
0
10
20
30
40
50
60
70
80
90
1/9/2013 5/9/2013 9/9/2013 13/9/2013 17/9/2013 21/9/2013 25/9/2013 29/9/2013
Riv
er/f
eed
wat
er t
urb
idit
y(N
TU
)
Date
Design limit (20 NTU)
Univers
ity of
Mala
ya

34
operators. Subsequently the operators could either continue to operate the water
treatment plant under the same operating conditions or totally cease operation. Since
ensuring continuous potable water supply to the public-piped networks is essential to
the consumers, halting operation of the water treatment plant due to high turbidity of the
feed water is seldom a preferred option. Such abnormal conditions do not augur well on
the UF membrane system, as mentioned earlier the higher feed water turbidity would
equate to higher membrane fouling potential as well. The flux rate and membrane
cleaning sequence or procedures would require readjustment to reduce the filtrate output
from the water treatment plant. Most water treatment plants operate under constant flux
filtration to ensure consistent water supply production (Pearce, 2007b). The water
treatment plant’s operator has very little choices but to continue operating at similar flux
rate even though the feed water turbidity has surged up much higher than expected.
3.4.3 Chemicals for UF membrane cleaning
Recent developments on membrane technology focus on the cleaning procedures.
One of the most extensively researched membranes cleaning method is by using
chemicals to remove or dislodge foulant from the membrane surface and pores
(Arkhangelsky et al., 2007; Arnal et al., 2008a; Levitsky et al., 2011; Piasecka et al.,
2015; Ujihara et al., 2016; Wang et al., 2016a). Even though hydraulic cleaning such as
backwash and flushing is a much preferable membrane cleaning method, the
effectiveness of such cleaning was less compared to chemical cleaning (Rabuni et al.,
2015). This case study UF membrane water treatment plant was utilizing two types of
chemical for membrane cleaning recommended by the membrane manufacturer.
According to the manufacturer, the UF membrane was compatible with three categories
of feed water mainly seawater, surface/ground water and wastewater. Different types of
Univers
ity of
Mala
ya

35
chemicals are recommended to different categories of feed water for effective
membrane cleaning.
Since the feed water to this water treatment plant originates from a natural surface
river source, the membrane manufacturer has recommended Hydrochloric Acid (HCl)
and Sodium Hydroxide (NaOH) for the membrane cleaning. Sodium Hypochlorite
(NaOCl) is recommended for chemical cleaning if the feed water is from wastewater or
seawater sources. This is due to the fact that high organic foulant is often found in such
problematic waters. Although NaOCl is an effective membrane cleaning agent, it also
causes membrane disintegration (Ujihara et al., 2016). Under normal circumstances
most polymeric membranes are not highly resistance towards strong chemical such as
NaOCl (Regula et al., 2014). NaOH and HCl are much commonly used cleaning agents
for membrane cleaning with less undesirable membrane deformities. Alkaline such as
NaOH is an effective chemical to remove organic foulants in PES based UF membranes
(Antón et al., 2015). HCl is known as an effective acidic chemical to remove inorganic
foulants on membrane pores and surface (Li et al., 2016b). This case study water
treatment plant implemented what is known as chemical enhanced backwash (CEB)
utilizing both NaOH and HCl separately after every 24 cycles of filtration sequences
with an intermittent hydraulic backwash in between each filtration sequences. Each
cycle consists of a filtration sequence which lasts for 30 minutes and subsequently a
hydraulic backwash for 60 seconds. The effectiveness of the chemical cleaning and
hydraulic backwash on the membrane was further discussed in the following section.
3.4.4 Hydraulic backwash and chemicals cleaning efficiency
Hydraulic backwash of UF membrane systems have been extensively researched and
reported in literature (Bessiere et al., 2009; Katsoufidou et al., 2008; Lipp & Baldaufb,
Univers
ity of
Mala
ya
36
2002; Remize et al., 2010; Ye et al., 2011). Under dead-end filtration operation mode
with high solids accumulation, hydraulic backwash is conducted after each filtration
sequence of between 10 – 60 minutes. Chemical enhanced backwash (CEB) cleaning is
less frequent which is normally performed once between 10 – 50 cycles of continuous
filtration and hydraulic backwash sequences. Nevertheless both hydraulic backwash and
CEB are the most common membrane cleaning procedures. Steadily increase of feed
water pressure and TMP during every subsequent filtration and hydraulic backwash
sequences indicates that CEB might be necessary for a more thorough membrane
cleaning. This case study water treatment plant implements a 20 minutes CEB process
for each chemicals (NaOH and HCl) which includes chemical injection, soaking and
rinsing. CEB is carried out to remove the foulant which was unable to be dislodged
from the membrane pores and surface during the hydraulic backwash. The effectiveness
of the membrane cleaning procedures could be ascertained by examining the pressure
profiles during the filtration sequences. After 30 minutes of filtration sequence, a 60
seconds hydraulic backwash was initiated. This cycle of filtration and backwash was
then repeated until a CEB was required. Figure 3.5 and Figure 3.6 show the feed water
pressure profiles on 23/9/2013 after hydraulic backwash and CEB.
Univers
ity of
Mala
ya
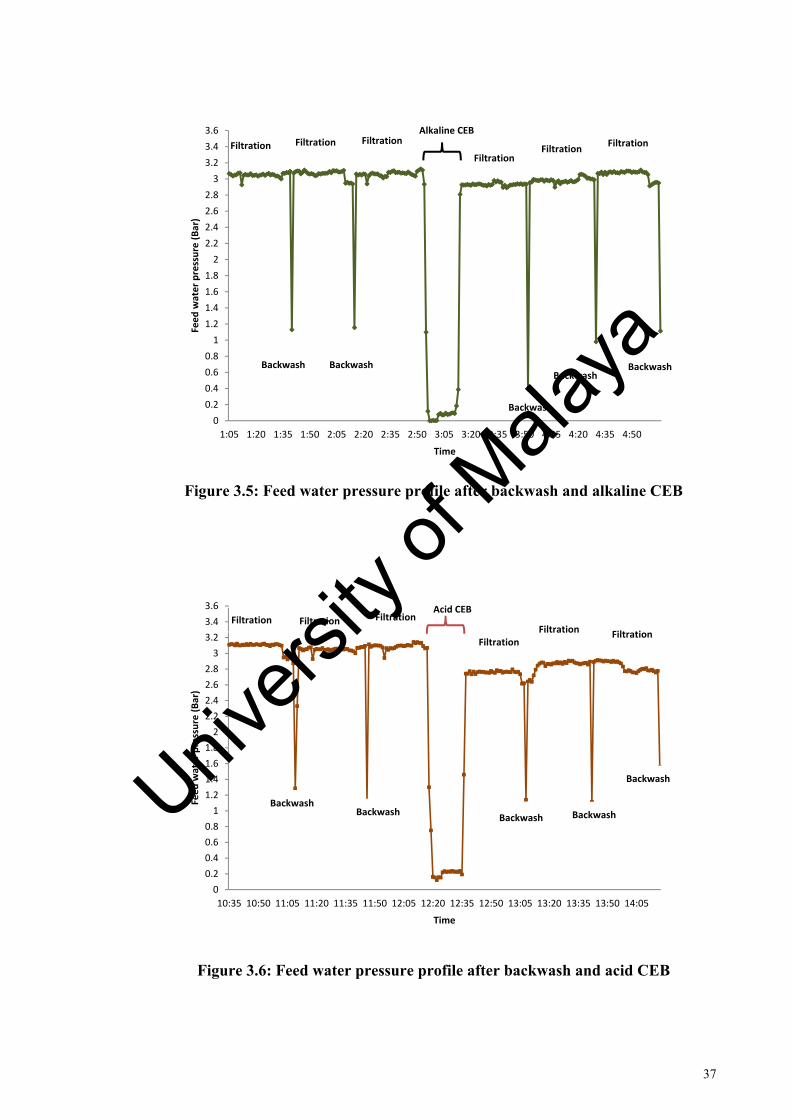
37
00.20.40.60.8
11.21.41.61.8
22.22.42.62.8
33.23.43.6
1:05 1:20 1:35 1:50 2:05 2:20 2:35 2:50 3:05 3:20 3:35 3:50 4:05 4:20 4:35 4:50
Feed
wat
er p
ress
ure
(Bar
)
Time
Alkaline CEB
BackwashBackwash BackwashBackwash
Backwash
Filtration Filtration Filtration
FiltrationFiltration Filtration
00.20.40.60.8
11.21.41.61.8
22.22.42.62.8
33.23.43.6
10:35 10:50 11:05 11:20 11:35 11:50 12:05 12:20 12:35 12:50 13:05 13:20 13:35 13:50 14:05
Feed
wat
er p
ress
ure
(Bar
)
Time
BackwashBackwashBackwash Backwash
Backwash
Acid CEBFiltration FiltrationFiltration
FiltrationFiltration Filtration
Figure 3.5: Feed water pressure profile after backwash and alkaline CEB
Figure 3.6: Feed water pressure profile after backwash and acid CEB
Univers
ity of
Mala
ya

38
The hydraulic backwash only marginally reduces the feed water pressure when the
following filtration sequence was initiated as shown in both Figure 3.5 and Figure 3.6. It
was suggested that during a hydraulic backwash instead of removing the cake filtration
layer, the layer was only being spread out and expanded from the membrane surface
(Ye et al., 2011). The cake filtration layer was then recompressed during the subsequent
filtration sequence resulting in minimal or insignificant reduction of the resistant
pressure shown in Figure 3.5 and Figure 3.6.
A more substantial feed water pressure reduction was noticed after an alkaline
(NaOH) CEB was carried out in Figure 3.5. The pressure declined by 0.2 Bar after the
alkaline CEB. Alkaline chemical cleaning was proven to be effective in restoring
filtration flux for PES membrane (Levitsky et al., 2012). It has also been suggested that
chemical used for membrane cleaning targets specific foulant which exists in the feed
water (Alzahrani et al., 2013). Alkaline chemical is effective to remove organic foulant
in membrane. During alkaline CEB the UF membrane was soaked at pH of more than
12 with the NaOH solution for 20 minutes before hydraulic backwash was initiated to
clean out the chemical from the membrane surface.
In Figure 3.6, the reduction of the feed water pressure of an acid CEB was even more
significant than an alkaline CEB. It has recorded 0.4 Bar of pressure reduction after the
acid CEB. As mentioned earlier, the effectiveness of the chemical cleaning was specific
to the membrane foulant. Table 3.3 indicates a few parameters analyzed in the filtrate
and feed water from the UF membrane water treatment plant.
Univers
ity of
Mala
ya
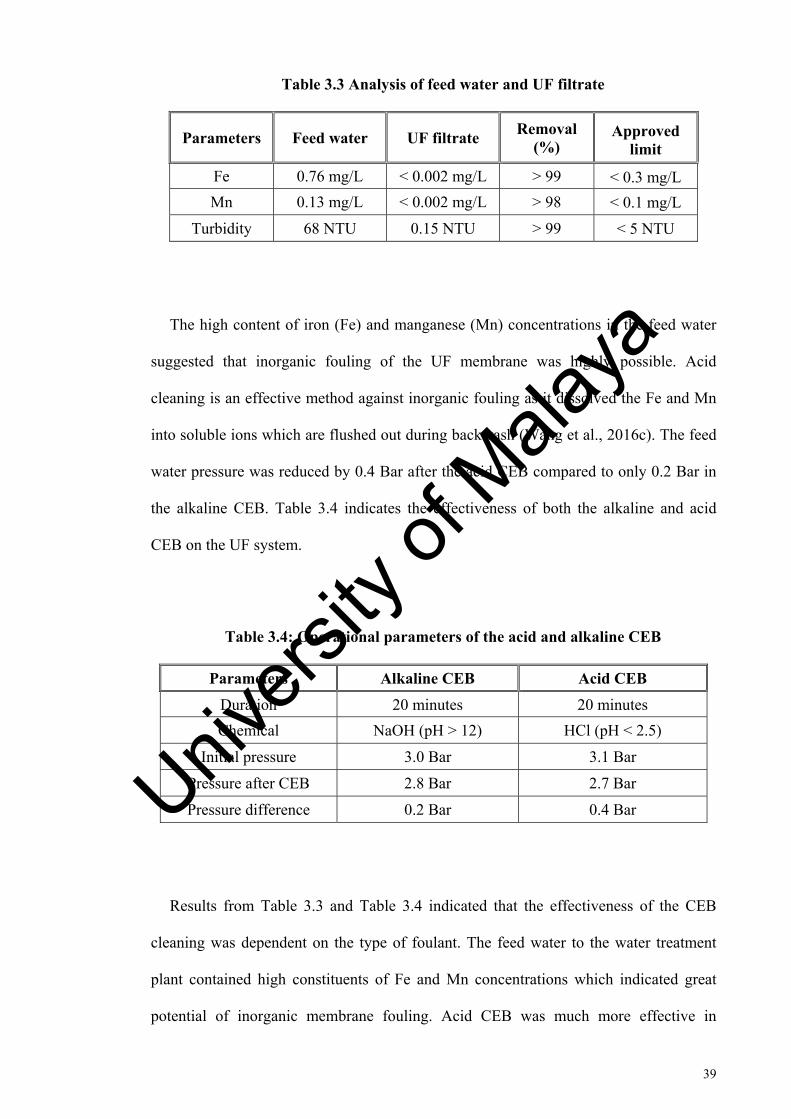
39
Table 3.3 Analysis of feed water and UF filtrate
Parameters Feed water UF filtrate Removal
(%) Approved
limit
Fe 0.76 mg/L < 0.002 mg/L > 99 < 0.3 mg/L
Mn 0.13 mg/L < 0.002 mg/L > 98 < 0.1 mg/L
Turbidity 68 NTU 0.15 NTU > 99 < 5 NTU
The high content of iron (Fe) and manganese (Mn) concentrations in the feed water
suggested that inorganic fouling of the UF membrane was highly possible. Acid
cleaning is an effective method against inorganic fouling as it dissolved the Fe and Mn
into soluble ions which are flushed out during backwash (Wang et al., 2016c). The feed
water pressure was reduced by 0.4 Bar after the acid CEB compared to only 0.2 Bar in
the alkaline CEB. Table 3.4 indicates the effectiveness of both the alkaline and acid
CEB on the UF system.
Table 3.4: Operational parameters of the acid and alkaline CEB
Parameters Alkaline CEB Acid CEB
Duration 20 minutes 20 minutes
Chemical NaOH (pH > 12) HCl (pH < 2.5)
Initial pressure 3.0 Bar 3.1 Bar
Pressure after CEB 2.8 Bar 2.7 Bar
Pressure difference 0.2 Bar 0.4 Bar
Results from Table 3.3 and Table 3.4 indicated that the effectiveness of the CEB
cleaning was dependent on the type of foulant. The feed water to the water treatment
plant contained high constituents of Fe and Mn concentrations which indicated great
potential of inorganic membrane fouling. Acid CEB was much more effective in
Univers
ity of
Mala
ya

40
removing inorganic foulant and this has alleviated the membrane fouling by reducing
the feed water pressure after the chemical cleaning procedures. There are possibilities
that other types of acid cleaning solutions such as citric acid, oxalic acid and sulphuric
acid might perform even better than HCl to remove foulant from the membrane.
Fluctuating characteristic changes of the feed water might require reassessment of the
chemical used for CEB. As mentioned earlier, certain fouling would require specific
cleaning chemical for effective foulant removal from the membrane.
3.4.5 UF membrane fouling
One of the most critical issue for industrial-scale membrane system is the membrane
fouling (Shirazi et al., 2010). Membrane fouling is caused by non-integral substances or
foulant from the feed water attached to the membrane and causes decline in
permeability. Permeability is defined as flux rate through the membrane at a given TMP
(Ma et al., 2016). Membrane foulant could be broadly categorized to four types mainly
organics, inorganics, particulates and micro-organisms (Guo et al., 2012). Table 3.3 has
indicated high concentrations of Fe (0.76 mg/L) and Mn (0.13 mg/L) in the feed water
which suggested inorganic fouling in the UF system was highly possible. Comparisons
of the CEB cleanings effectiveness in Figure 3.5, Figure 3.6 and Table 3.4 have also
pointed out that inorganic membrane fouling occurred in the system.
This case study water treatment plant implements direct filtration of the aerated river
water without dosing any chemical for the coagulation-flocculation process. Aeration on
the river water promotes the oxidation of Fe and Mn ions to precipitate as hydroxides
for solid-liquid separation in the UF process (Choo et al., 2005). In a typical water
treatment plant, the coagulation-flocculation of the river water precedes a clarification
process. Clarification is an important process in water treatment to allow heavy formed
Univers
ity of
Mala
ya

41
solids particles through coagulation-flocculation process to settle down and reduce the
solids loading prior to the filtration system (Burke et al., 2011). Unless the solids
loading of the feed water is low (such as 20 NTU or below), feed water with high solids
loading is normally recommended to undergo a clarification process prior to UF.
Figure 3.4 and Table 3.3 have shown that the feed water turbidity could sometimes
increase up to 68 NTU which contained high concentrations of Fe and Mn as well.
Without coagulation-flocculation and clarification processes, all these metal hydroxides
would attached on the membrane surface together as the cake filtration layer. The
solubility product of metal hydroxides (Ksp) mainly Fe(OH)3 and Mn(OH)3 as well as
the ionic product of the feed water was calculated and shown in Table 3.5. The ionic
product of both the metal hydroxides have higher values than their respective Ksp
suggesting that precipitation of Fe(OH)3 and Mn(OH)3 were very likely to occur on the
UF membrane surface.
Table 3.5: Ionic product and Ksp of feed water
Fe in feed water (mg/L)
[Fe3+] (mol/L)
Feed water pH
[OH-]
(mol/L) Ksp of
Fe(OH)3 Ionic product of
[Fe3+][OH-]3
0.76 1.36 X10⁻⁵
6.8
6.31 X 10⁻⁸ 6.30 X 10-38 3.42 X 10⁻²⁷
Mn in feed water (mg/L)
[Mn3+] (mol/L)
Feed water pH
[OH-]
(mol/L) Ksp of
Mn(OH)3 Ionic product of
[Mn3+][OH-]3
0.13
2.37 X 10⁻⁶
6.8
6.31 X 10⁻⁸
1.00 X 10-36
5.95 X 10⁻²⁸
The pH of 6.8 in the feed water indicates the possibilities of metal hydroxides
precipitation on the membrane surface (Pearce, 2007a). Precipitation of the metal
hydroxides would form a thin cake filtration layer on the membrane surface and
Univers
ity of
Mala
ya

42
eventually causes inorganic fouling. Researchers have reported that metal hydroxides
were common inorganic foulant (Shirazi et al., 2010). The high removal efficiency of
more than 98% for both the Fe and Mn in the filtrate indicated that high concentrations
of metal hydroxides were attached on the membrane surface which might not be
removed completely during hydraulic backwash and CEB.
3.4.6 Electricity consumption
Operational cost is one of the most important commercial aspects of an industrial-
scale UF membrane water treatment plant. Due to the fact that this water treatment plant
operates under direct filtration method, no prior chemical was dosed into the system for
the coagulation-flocculation process. The main operational cost would be the electricity
consumption for the treatment processes. Membrane fouling would incur reduction of
permeability and increased the TMP in order to maintain constant flux filtration. The
pump affinity law shown in equation (3.1) indicates that the increase of electricity
power required (W1 and W2) to reach higher pressure is an exponential correlation to the
pressure in the system (H1 and H2) (Wang et al., 2012).
= . (3.1)
This implies that even a slight 0.1 Bar increase in feed water pressure would have a
significant exponential impact on the electricity consumption. As mentioned earlier, the
fouling of the membrane increases the filtration resistance which raises the feed water
Univers
ity of
Mala
ya

43
0
1
2
3
4
5
0
0.05
0.1
0.15
0.2
0.25
Mac Apr May Jun Jul Aug Sep Oct Nov Dec
Feed
wat
er p
ress
ure
(Bar
)
Elec
tric
ity (k
Wh/
m3 )
Month
Actual electricity
Calculated electricity
Feed water presssure
pressure and TMP. In order to maintain constant flux filtration, higher operation
pressure was necessary to overcome the filtration resistance. Figure 3.7 shows the feed
water pressure and electricity consumption increased from March until December 2013
at the UF membrane water treatment plant.
Figure 3.7: Electricity and feed water pressure increase in 2013
The calculated electricity in Figure 3.7 using equation (3.1) indicated close
agreement with slightly lower values compared with the actual electricity consumption.
Literature has reported an estimated electricity consumption of 0.20 kWh/m3 was
expected for the production of potable water in large-scale using UF membrane systems
(Pearce, 2008). During the initial first few months (March until July 2013) of the water
treatment plant operations, the actual electricity consumption was lower than 0.20
kWh/m3. The increase of the feed water pressure causes the electricity consumption to
surge up in accordance to equation (3.1). A difference of 0.8 Bar or 35% increased of
feed water pressure from March until December 2013 had caused a 60% surge on the
Univers
ity of
Mala
ya

44
electricity consumption. This gradual increase was caused by membrane fouling which
reduces the permeability resulting in higher feed water pressure to generate similar
filtration flux rate. It is relatively common to observe some degree of membrane fouling
conditions after 3 to 6 months of continuous operation on a typical UF membrane water
treatment plant which requires further attention and corrective actions.
One of the more rigorous cleaning methods beside CEB is called clean in place (CIP)
procedures. In the CIP process, instead of soaking the membrane in strong chemicals,
these chemical are circulated in the hollow fibre membrane capillaries for up to 12
hours continuously. The amount of membrane downtime and chemical consumption are
high for CIP process and these cleaning procedures are normally recommended once
between 6 to 12 months of continuous operation and not on a monthly basis. Membrane
fouling is unavoidable in most conditions and these rigorous chemicals cleaning
procedures are necessary to recover back the permeability of the membranes.
3.5 Findings of the case study
The main objective of this case study was to analyze the major issues encountered at
an industrial-scale UF membrane water treatment plant with reference to literature
reports. Through this case study, it could be noticed that most of the problems
encountered in this UF membrane water treatment plant have been reported through
literature. Critical comments on these findings were summarized in Table 3.6. Such
findings suggested that literature information could provide valuable insight to mitigate
some of the problems faced in an industrial-scale UF system. Bridging the gaps between
industrial practices and information from literature would have immense benefits to
improve the overall operation of the UF system. A more efficient UF system operation
would yield much lower operational cost and less wastage of resources.
Univers
ity of
Mala
ya
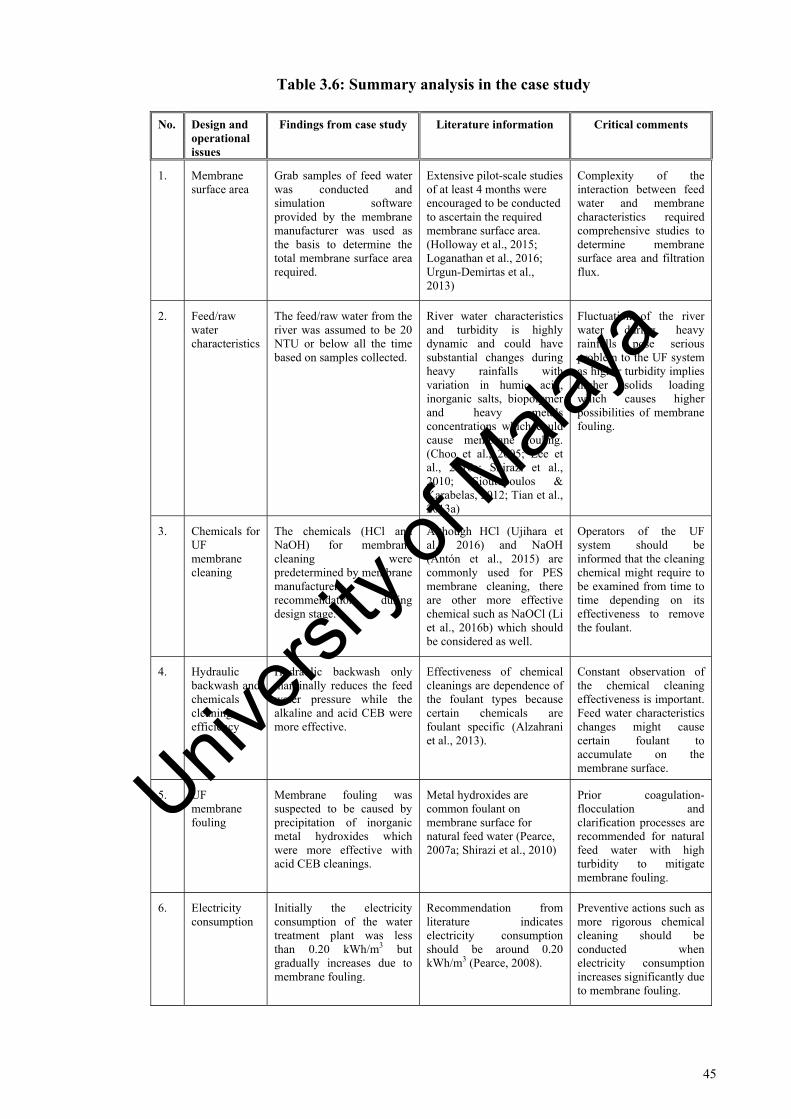
45
Table 3.6: Summary analysis in the case study
No. Design and operational issues
Findings from case study Literature information Critical comments
1. Membrane surface area
Grab samples of feed water was conducted and simulation software provided by the membrane manufacturer was used as the basis to determine the total membrane surface area required.
Extensive pilot-scale studies of at least 4 months were encouraged to be conducted to ascertain the required membrane surface area. (Holloway et al., 2015; Loganathan et al., 2016; Urgun-Demirtas et al., 2013)
Complexity of the interaction between feed water and membrane characteristics required comprehensive studies to determine membrane surface area and filtration flux.
2. Feed/raw water characteristics
The feed/raw water from the river was assumed to be 20 NTU or below all the time based on samples collected.
River water characteristics and turbidity is highly dynamic and could have substantial changes during heavy rainfalls with variation in humic acid, inorganic salts, biopolymer and heavy metals concentrations which could cause membrane fouling. (Choo et al., 2005; Lee et al., 2016a; Shirazi et al., 2010; Sioutopoulos & Karabelas, 2012; Tian et al., 2013a)
Fluctuation of the river water during heavy rainfalls pose serious problem to the UF system as higher turbidity implies higher solids loading which causes higher possibilities of membrane fouling.
3. Chemicals for UF membrane cleaning
The chemicals (HCl and NaOH) for membrane cleaning were predetermined by membrane manufacturer recommendation during design stage.
Although HCl (Ujihara et al., 2016) and NaOH (Antón et al., 2015) are commonly used for PES membrane cleaning, there are other more effective chemical such as NaOCl (Li et al., 2016b) which should be considered as well.
Operators of the UF system should be informed that the cleaning chemical might require to be examined from time to time depending on its effectiveness to remove the foulant.
4. Hydraulic backwash and chemicals cleaning efficiency
Hydraulic backwash only marginally reduces the feed water pressure while the alkaline and acid CEB were more effective.
Effectiveness of chemical cleanings are dependence of the foulant types because certain chemicals are foulant specific (Alzahrani et al., 2013).
Constant observation of the chemical cleaning effectiveness is important. Feed water characteristics changes might cause certain foulant to accumulate on the membrane surface.
5. UF membrane fouling
Membrane fouling was suspected to be caused by precipitation of inorganic metal hydroxides which were more effective with acid CEB cleanings.
Metal hydroxides are common foulant on membrane surface for natural feed water (Pearce, 2007a; Shirazi et al., 2010)
Prior coagulation-flocculation and clarification processes are recommended for natural feed water with high turbidity to mitigate membrane fouling.
6. Electricity consumption
Initially the electricity consumption of the water treatment plant was less than 0.20 kWh/m3 but gradually increases due to membrane fouling.
Recommendation from literature indicates electricity consumption should be around 0.20 kWh/m3 (Pearce, 2008).
Preventive actions such as more rigorous chemical cleaning should be conducted when electricity consumption increases significantly due to membrane fouling.
Univers
ity of
Mala
ya

46
3.6 Summary
Through this case study, a comprehensive analyses of the difficulties encountered in
an industrial-scale UF membrane water treatment plant have been discussed. Issues such
as determining total membrane surface area, fluctuation of feed water characteristics,
selection of chemicals for membrane cleaning, UF membrane fouling, electricity
consumption, efficiency of hydraulic backwash and chemical cleanings have been
elaborated in details. All these analyses were compared to information obtained from
literature to determine the causes and possible solutions. Establishing this link between
information from literature and industrial practices enhances the comprehension of the
problems encountered and effective solutions could be proposed. Some possible
suggestions to improve the operation of the system include increasing the quantity of
the UF membrane modules and further research on using non-Aluminium based
coagulant in the UF membrane water treatment system.
Univers
ity of
Mala
ya

47
CHAPTER 4:
EVALUATION AND COMPARISON OF ULTRAFILTRATION AND
CONVENTIONAL WATER TREATMENT SYSTEMS
Water treatment plants/systems are essential facilities to produce clean and safe
potable/drinking water to consumers through the public-piped water supply networks.
The sustainable development of such facilities are manifested as part of an integrated
approach to ensure environmentally friendly, waste minimization, economic and social
prosperity (Khalili et al., 2015). In this chapter, detailed evaluation and comparison on
both of the industrial-scale UF and conventional water treatment systems have been
further elaborated with comprehensive data analysis.
4.1 Introduction
Previously in Chapter 3, detailed analysis on the common technical issues related to
the industrial-scale UF membrane water treatment plant was presented. The same UF
membrane water treatment system discussed earlier in Chapter 3 was further analyzed in
other aspects. In this chapter, a case study to evaluate and compare various aspects of
this UF system against the conventional water treatment system has been conducted.
Before this UF system was constructed, a conventional water treatment plant was
already in operation 30 years ago at the same location. The UF system was merely the
extension of this water treatment plant to further increase the capacity of the potable
water supply from this treatment facility. Once the UF water treatment system
commences operation, both the UF and conventional water treatment systems were
made available at the same treatment plant and drawing similar river water source
through the common main incoming pipeline.
Univers
ity of
Mala
ya

48
The fact that both the UF and conventional water treatment systems were treating
the same feed water from the river provides a reliable and consistent case study for
comparison. Evaluation and comparison on both treatment systems have been
conducted in five aspects such as capital cost, operational cost, maintenance cost,
analysis of filtrate quality and the overall water losses. All these five aspects
encompassed the commercial feasibility and the treatment systems performance which
have been further elaborated in the subsequent sections of this chapter.
4.2 Background
A typical conventional potable water treatment plant comprises a few common
main processes such as coagulation-flocculation, clarification or sedimentation and final
polishing with media/sand filtration (Pestana et al., 2016). The utilization of media
filtration process is the most common physical particles removal polishing for
industrial-scale water treatment plants (Zouboulis et al., 2007). Rapid development on
membrane technology has motivated design engineers to replace all these conventional
treatment processes with a single step of direct feed UF (Tian et al., 2013a).
In a conventional water treatment system, chemicals such as coagulant and flocculant
are dosed in the raw water to promote the formation of larger flocs for the subsequent
solid-liquid separation processes. The characteristics of the flocs played an important
role to ensure the solid-liquid separation is effective (Zhao et al., 2014). There are many
factors governing the formation of flocs such as pH, temperature, raw water
characteristics, coagulant type and dosage (Mitrouli et al., 2008). Laboratory
experiments have shown that filtration time through the media filter as well as the floc
characteristics have significant impact on the filtrate water turbidity and quality.
Conventional media filtration operates under depth filtration concept whereby the flocs
Univers
ity of
Mala
ya

49
are retained throughout the media bed (Noyes et al., 2015). This indicates that direct
filtration through media filter without the formation of flocs are not possible to produce
the desired filtrate quality.
Unlike the media filter, UF operates under the cake/surface filtration principle. Fine
solids larger than the pore size of the UF membrane are trapped on the surface forming
a porous cake filtration layer (Bugge et al., 2012). Direct feed filtration without flocs
formation in the coagulation-flocculation process is possible with UF membrane to
achieve effective solid-liquid separation. Figure 4.1 illustrate the concepts of depth
filtration on conventional media filter and cake/surface filtration on UF membrane.
Figure 4.1: Illustration of conventional media filtration and UF
Feed water (with coagulation-flocculation)
UF membrane
Filtrate (with cake/surface filtration)
Filter media
Feed water (direct feed)
Filtrate (with depth filtration)
Univers
ity of
Mala
ya

50
Figure 4.1 shows that depth filtration in the conventional system requires a
significant filter media bed height to trapped the particles. Typical filter media bed
height is between 1.0 – 1.5 meter. UF membranes are commonly packed into
pressurized membrane modules to reduce the floor space requirement. Membrane
filtration has definite advantage on the lesser floor space requirement compared to the
conventional media filters (Vedavyasan, 2007). The filtration capability of the UF
systems could be controlled by carefully selecting the membrane pore size and material
allowing it to even segregate viruses and microorganism such as bacteria from the water
(Arkhangelsky et al., 2012). One of the major drawbacks of UF systems is the
membrane fouling issues which are being extensively researched (El-Abbassi et al.,
2014; Filloux et al., 2012; Shirazi et al., 2010; Wang et al., 2014; Xiarchos et al., 2003).
It is also deemed as a relatively “expensive” technology compared to the conventional
system applied in water treatment (Massé et al., 2011).
In recent decades, the concept of sustainable development has been gaining massive
attention (Khalili et al., 2015). Stakeholders and businesses are embracing this concept
by re-aligning their production strategies towards sustainable development (Sen et al.,
2015). Case studies conducted by researchers have demonstrated and highlighted such
sustainability in waste management, commercial production and environmental
protection (Alkaya & Demirer, 2014; Handley et al., 2002; Liu et al., 2014; Nunes et al.,
2014). Commercial, quality outputs and environmental sustainability impacts are
essential issues of any water treatment plants worth investigating for the long term
benefits.
Case study on an industrial-scale membrane system at the Barcelona Metropolitan
Area elucidated the contribution of reverse osmosis (RO) on the quality of drinking
water (Raich-Montiu et al., 2014). The filtrate was examined extensively on
organoleptic quality requirements of potable water. A similar case study was also
Univers
ity of
Mala
ya

51
conducted on an industrial-scale UF membrane water treatment plant at Nantong, China
(Xiao et al., 2012). This case study has indicated high turbidity removal up to 99% with
absence of coliform bacteria from the filtrate. Industrial-scale membrane systems have
been proven through such case studies to be capable of producing consistent high
quality of outputs. Both of these case studies have particularly examined the filtrate
water quality without further detailed analysis on the environmental impact and
commercial aspects of the water treatment systems. The subsequent sections of this
chapter further elaborate on various commercial, quality and environmental aspects of
the industrial-scale UF and conventional water treatment systems.
4.3 Methodology
In this second evaluation or case study, an industrial-scale water treatment plant
located at Kelantan, Malaysia was selected. This water treatment plant consists of both
UF and conventional media filtration systems situated side by side. The industrial-scale
UF membrane water treatment system investigated in this study is the same system
mentioned earlier in Chapter 3. In this subsequent case study, the scope of evaluation
has expanded to include the conventional media filtration water treatment system which
was in operation much earlier and located next to the UF system. There are five aspects
which have been detailed examined and analyzed in both of these systems. The aspects
are capital cost, operational cost, maintenance cost, analysis of filtrate quality and the
overall water losses. Environmental aspects such as the compositions of the sludge
discharge from both treatment systems were also analyzed. Figure 4.2 shows the
simplified flow diagram of all the processes involved in both the water treatment
systems.
Univers
ity of
Mala
ya

52
Figure 4.2: Process flow block diagram of water treatment systems
The water treatment plant depicted in Figure 4.2 shows that both the conventional
and UF systems were drawing the same river water source and subjected to natural
aeration through a cascading aerator before branching to the two different systems. Both
systems have been designed to accommodate different treatment capacity whereby the
conventional system could produce up to 11 million liters a day (MLD) while the UF
system could produce 14 MLD of treated water. The treated water was then supplied to
multiple areas or township through two separate supply pipelines.
Chlorine gas/liquid
Coagulant
SUPPLY TO CONSUMER SUPPLY TO CONSUMER
Surface river water source
Cascading aerator
Coagulation and flocculation
Sedimentation clarifiers
Media filtration system
UF Pre-treatment system
Ultrafiltration system
(UF system) (Conventional system)
Univers
ity of
Mala
ya

53
This water treatment plant was constructed more than 30 years ago with only the
conventional treatment system and has been supplying potable water to the nearby
township ever since. An upgrading works in 2011 encompassed the construction of a
larger cascading aerator in the process line as well as a new UF system. After passing
through the cascading aerator, the raw water to the conventional system was dosed with
Aluminium (Al) based coagulant. The dosed feed water was then channeled to a series
of wooden baffle plates in the flocculation chamber for the coagulation-flocculation
process. This process allows agglomeration of the suspended solids into bigger and
denser flocs for the subsequent sedimentation or solid-liquid clarification process. There
are two units of sedimentation clarifiers arranged in parallel for this process. Each
clarifier was designed with surface loading rate of 2.81 m/hr which were in accordance
to the recommended range of between 0.71 – 3.30 m/hr reported in literature
(Kawamura, 2000). Subsequently the clarified water was channeled to four units of
gravity media/sand filters. These filters consist of fine sand with effective size between
0.7 – 1.4 mm diameter acts as the media bed for the depth filtration. The filtration rate
for each filters were 7.0 m/hr which was well below the reported 10.0 m/hr filtration
rate for gravity filter in most industrial-scale water treatment plants (Zouboulis et al.,
2007). Finally before the filtrate was pumped out and distributed through the pipeline,
chlorine gas was dosed to ensure between 1.5 – 2.0 mg/L of free chlorine residual was
detected in the final treated water. Figure 4.3 shows the detailed process of the
conventional water treatment system.
Univers
ity of
Mala
ya

54
Figure 4.3: Schematic block diagram of the conventional water treatment system
Construction of the new UF membrane water treatment system was completed in
2013 and located next to the conventional treatment system. The pre-treatment of the
UF system comprises of an extended aerator and pressurized sand filters. In the
extended aerator, forced aeration using air blower and diffusers were conducted. After
passing through the extended aerator, the feed water was pumped into 4 units of
pressurized sand filters to remove large particulate matters. The filtration rate of these
pressurized sand filters were set at 15 m/hr which were much higher than gravity filters
systems. After these pressurized filters, the pre-treated water was pumped into 120 units
of UF membrane modules installed in parallel. The UF hollow fibre membrane modules
were made from modified Polyethersulfone (mPES) manufactured by Inge GmbH,
Germany. Finally the filtrate was disinfected with Sodium Hypochlorite (NaOCl) before
supplying to the public-piped supply networks. Figure 4.4 shows the detailed block
diagram of the UF system.
Chlorine gas
Coagulation and flocculation Sludge
Aluminium based coagulant (ACH)
Sludge
River water source
Cascading aerator
Baffle plates chambers
2 units Sedimentation
clarifiers
4 units Conventional media filters
Supply to consumers
Univers
ity of
Mala
ya

55
Figure 4.4: Schematic block diagram of the UF system
The same river water was channeled to both of the conventional and UF water
treatment systems in this water treatment plant. Studies conducted by researchers have
shown that natural organic matter (NOM) in natural water sources was a major issue in
the treatment processes (Joseph et al., 2012). In the conventional water treatment
system, different types and amount of NOM would affect the coagulant dosage to
produce optimum flocs size in the coagulation-flocculation process. NOM has a
significant negative impact on the UF membrane fouling propensity. Using the same
river water source into both systems would allow a more comprehensive and fair
comparison of the systems.
4.4 Results and discussions
The results of this case study on the conventional and UF systems were analyzed and
discussed in this section. All the relevant operational data and laboratory analysis from
both treatment systems were collected from the period between the year 2013 and 2014
Liquid chlorine(NaOCl)
UF Pre-treatment system
Sludge
Sludge River water source
Cascading aerator
Extended aerator
4 units Pressurized sand
filters
120 units Ultrafiltration (UF)
modules
Supply to consumers
Univers
ity of
Mala
ya

56
for evaluations. These data were arranged in five aspects which are further elaborated
and critically discussed in the following sections.
4.4.1 Capital cost of treatment systems
One of the most essential aspects of evaluating the feasibility of a water treatment
system is the capital cost or expenditure. Capital expenditure (CAPEX) is broadly
defined as the cost to procure fixed assets which encompass the land, mechanical
equipment, electrical control system, civil structures and other ancillary hardware to
complete all the treatment processes. Since both of the UF and conventional water
treatment systems were constructed on a gap of a few decades, construction cost
estimation is required to be adjusted for a fair evaluation on current market value. A
rationalized updated cost of construction was established in order for a comprehensive
comparison between the two systems. The conventional system was built more than 30
years ago and it would definitely cost much more in 2013 due to inflation rate. Yearly
inflation data of Malaysia’s domestic market published by “The World Bank” (The
World Bank, 2014) was used to extrapolate and estimate the construction cost for this
conventional system in 2013 which correspond to the completion year of the UF system.
In Figure 4.5, the yearly inflation rate was added into the initial construction cost of the
conventional system back from 1980 until 2013.
Univers
ity of
Mala
ya

57
USD 1,067,000 (Year 1980)
USD 2,760,726(Year 2013)
500,000
1,000,000
1,500,000
2,000,000
2,500,000
3,000,000
3,500,000
1980 2983 1986 1989 1992 1995 1998 2001 2004 2007 2010 2013
Est
imat
ed c
on
stru
ctio
n c
ost
(U
SD
)
Year
Figure 4.5: Construction cost in 2013 estimated based on annual inflation rate
The estimated cost of construction for the conventional system depicted in Figure 4.5
indicated a much reasonable cost of construction in 2013. As mentioned earlier, the
treatment capacity for the conventional system was 11 MLD while the UF system was
designed for 14 MLD. In order to rationalize both treatment capacities, the cost of
construction per m3 of treated water was taken into consideration. Another important
cost factor besides the construction cost would be the cost for the land to accommodate
the treatment systems. Due to scarcity of available land especially in urban area, this
poses a significant cost to the owner of the treatment systems. Table 4.1 shows all the
relevant data of the capital expenditure and land area required by the two systems.
Univers
ity of
Mala
ya

58
Table 4.1: Capital expenditure and land area required
UF system Conventional media filtration
Cost of construction in 2013 USD 3, 710, 000 (actual)
USD 2, 760, 726 (estimated)
Treatment volume/capacity 14, 000 m3/d 11, 000 m3/d
Land requirement 528 m2 1, 376 m2
Cost/m3 capacity USD 265 USD 251
Land/m3 capacity 0.038 m2 0.125 m2
The details presented in Table 4.1 provided a rationalized construction cost and land
requirement for both systems. It was estimated that an 11 MLD conventional media
filtration system would have cost USD 2, 760, 726 to construct while the actual cost of a
14 MLD UF system was USD 3, 710, 000 in the year 2013. The UF system construction
cost would be USD 265/m3 of treated water capacity compared with USD 251/m3 for
the conventional system. Literature has reported that generally the construction cost of
membrane water treatment systems would be significantly higher than the conventional
system (Pearce, 2007b). The advantage of the membrane systems are exhibited through
the smaller land required compared to the conventional water treatment system. Based
on data in Table 4.1 the construction cost for the UF system was only 5.6% higher but it
requires 69.6% less land space for the construction compared to the conventional
system. As the demand for membrane systems continue to increase on a global scale,
more cost efficient membrane manufacturing methods are being developed due to
economies of scale. The continual decline of UF membrane cost and the lesser space
requirement has made this system very attractive for large-scale production (Tian et al.,
2013b). Acquiring land for the construction of water treatment plants especially in the
urban area would become a more costly effort in future. Land in urban area is typically
Univers
ity of
Mala
ya

59
2,600,000
2,800,000
3,000,000
3,200,000
3,400,000
3,600,000
3,800,000
4,000,000
4,200,000
4,400,000
0 100 200 300 400
Capi
tal e
xpen
ditu
re (U
SD)
Land values (USD/m2)
14 MLD (Conventional)
14MLD (UF)
11MLD (Conventional)
11MLD (UF)
more expensive than rural area due to their accessibilities to multiple facilities (Liu et
al., 2015).
Various aspects contributed to the capital expenditure on both treatment systems.
Literature has reported that sensitivity analysis can be applied to identify the key factors
which have significant impacts on certain aspects (Igos et al., 2014). In order to further
illustrate the effect of the land price towards both the systems capital expenditure, a
sensitivity analysis was conducted and shown in Figure 4.6. The capital expenditure
which encompassed the construction cost and the estimated land procurement cost was
calculated. Assumptions were made that the land values were between 10 – 300
USD/m2 as indicated in Figure 4.6.
Figure 4.6: Capital expenditure estimated based on various land values
The sensitivity analysis shown on Figure 4.6 indicated that once the land value
reached or exceeded 170 USD/m2, the UF system capital expenditure (for both 14 MLD
Univers
ity of
Mala
ya

60
and 11 MLD) became much lower compared to the conventional water treatment
system. Higher land savings has made the UF system becomes an attractive and feasible
option in land scarce urban area.
4.4.2 Operational cost of treatment systems
Besides the capital expenditure of the treatment systems, the long term operational
cost or operation expenditure (OPEX) is an equally important factor to stakeholders.
Operational cost is defined as related expenses to operate the treatment systems in order
to produce the required quantity and quality of potable/drinking water from the
facilities. The most significant operational cost for water treatment systems are
electricity and chemical expenditures. Electricity is utilized to drive the motors for
pumps and other mechanical equipment while chemicals are required for the
coagulation-flocculation process, cleaning of the UF membrane and disinfection for the
treated water.
As mentioned earlier, the coagulation-flocculation process is essential for the
conventional media filtration system. Literature has reported that dense flocs from the
coagulation-flocculation process allows high removal efficiency of the fine solids by
attaching them to the media grain (Zahrim & Hilal, 2013). The conventional water
treatment system in this case study was utilizing Aluminium Chlorohydrate (ACH) as
the chemical for coagulation-flocculation. According to literature reports, ACH is a
much more effective chemical than Aluminium Sulfate (alum). It requires 60% – 70%
less dosage than alum to remove organic in water treatment (Wang et al., 2008). ACH
has lower alkalinity consumption and the coagulated suspension pH only decreases by
less than 0.5. Another type of chemical used in the conventional system in this case
study was the chlorine gas (Cl2) for final disinfection. Chlorine is an effective
Univers
ity of
Mala
ya

61
disinfectant to counteract microbial presence in drinking water supply (Monteiro et al.,
2014). The conventional water treatment system maintains the chlorine residual of the
treated water to between 1.5 – 2.0 mg/L with periodical control and monitoring.
The usage of chemical for the UF system in this case study was very minimal as it
was a direct filtration process which does not necessitate any coagulation-flocculation
prior to filtration. Literature has suggested that the coagulation process have minimal
effect on eliminating organic matters which would cause membrane fouling (Xiao et al.,
2012). Most of the large solids particles from the feed water have been separated by the
pressurized sand filters after the aeration process. The UF membrane will further
remove the fine solids, bacteria and viruses which were larger than 0.02 µm to produce
crystal clear filtrate. The final disinfection was conducted by dosing Sodium
Hypochlorite (NaOCl) to the filtrate before supplying as treated water. Besides NaOCl
the other chemicals used for the UF system were Sodium Hydroxide (NaOH) and
Hydrochloric Acid (HCl) for membrane cleaning. Both NaOH and HCl have gained
acceptance as UF membrane cleaning chemicals because of its economic feasibility
(Kumar & Pal, 2013; Regula et al., 2014). The UF membrane manufacturer of this case
study has also expressed their approval and recommendation of both chemicals for the
membrane cleaning through CEB.
Another main component of the operational cost of a water treatment system is the
electricity utilization. Electricity is required to drive the pumps, blowers, compressors
and other mechanical equipment in the treatment processes. Under acceptable raw/feed
water quality conditions, the UF system would incurred much higher cost compared to
the conventional treatment system (Bonnelye et al., 2008). The electricity utilization
was much higher for the UF system in this case study as it was a pressure driven process
unlike the conventional gravity media/sand filtration. Table 4.2 and Table 4.3 indicate
the chemical and electricity consumption for both the UF and conventional water
Univers
ity of
Mala
ya

62
treatment systems. Since this case study water treatment plant is located in Malaysia, all
relevant expenditures were in accordance to local rate. These chemical and electricity
costs were estimated based on Malaysia’s current market values in 2014 and might
differs in other countries or regions of the world.
Table 4.2: Chemical consumption and estimated cost of water treatment
UF system Conventional media filtration Usage
purpose Cost for 1,000 m3 treated water
Average dosage
Cost for 1,000 m3 treated water
Coagulant (ACH) - - 11.0 mg/L USD 9.57
Sodium hydroxide (48%)
Membrane cleaning
USD 2.66 - -
Hydrochloric acid (33%)
Membrane cleaning
USD 1.46 - -
Cost of chemical for each 1,000 m3 of treated water produced
USD 4.12
USD 9.57
Table 4.3: Electricity utilization and estimated cost of water treatment
UF system (power consumption)
Conventional media filtration
(power consumption)
Air blower 32.0 kWh 0.1 kWh
Chlorine booster pump - 4.0 kWh
Backwash pump 2.5 kWh 0.2 kWh
Pressurized filter feed pump 30.0 kWh -
UF feed pump 55.0 kWh -
Air compressor 0.2 kWh -
NaOCl/ACH dosing pump 0.3 kWh 0.2 kWh
Total electricity consumed in 1 hour
120.0 kWh (for 576 m3 of water)
4.5 kWh (for 458 m3 of water)
Total electricity consumed per 1,000 m3 of treated water produced
208.3 kWh 9.8 kWh
Cost of electricity per 1,000 m3 of treated water produced
USD 31.25 USD 1.47
Univers
ity of
Mala
ya

63
The unit price of ACH was estimated at 0.87 USD/kg in Table 4.2 while electricity
was priced at 0.15 USD/kWh in Table 4.3. Data shown in Table 4.2 and Table 4.3
indicated that the estimated operational expenditure for the UF system (inclusive of
chemical and electricity) was much higher at USD 35.37 compared to the conventional
system at USD 11.04 to produce 1, 000 m3 of treated water. The estimated operational
expenditure for the UF system was more than 3 times higher than the conventional
system mainly because of the higher electricity utilization due to the pressure driven
membrane filtration process. Nevertheless, one of the distinctive advantages of UF
system is the cake/surface filtration mechanism which does not require prior
coagulation-flocculation process unlike the conventional system. This enable a huge
reduction in the chemical cost which was only 43% compared to the conventional
system. Chemicals (HCl and NaOH) were used for membrane cleaning in the UF
system while ACH was used as coagulant for the agglomeration of flocs in the
conventional system.
Similar sensitivity analyses presented on the capital expenditure earlier were also
conducted on the operational expenditure. Evaluation was carried out on the various
breakdown of the operational expenditure for both systems in Figure 4.7. This figure
illustrated four possible scenarios in graph form to further correlate various possibilities
of the fluctuations on the operational expenditure as follows:-
Category A – Electricity cost was reduced by 50% and chemical cost remains
Category B – Chemical cost was increased by 100% and electricity price remains
Category C – Electricity cost was reduced by 50% and chemical cost increased by
100%
Category D – Chemical and electricity cost remains the same as indicated in Table
4.2 and Table 4.3.
Univers
ity of
Mala
ya

64
0
5
10
15
20
25
30
35
40
45
A B C D
(OPE
X) U
SD/1
,000
m3
trea
ted
wat
er
Category
Media
UF
Figure 4.7: Four categories of sensitivity analysis on operational expenditure
The information shown in Figure 4.7 indicated that all the four scenarios (Category
A, B, C and D) have a common conclusion that the conventional media filtration
operational cost was always lower than the UF system. It is worth taking note that
Category C has indicated a much smaller margin of operational cost between these two
systems. This scenario shows that when the cost of electricity has gone down
significantly while the cost of chemical continues to escalate due to inflation, there are
high possibilities that the operational costs of both systems might be only marginally
different. One of the possibilities of descending electricity cost is through the use of
renewable energy resources such as solar or wind generation of electricity. The
obstacles of utilizing such renewable energy sources are the huge amount of initial
capital expenditure to construct the required facilities. In a much wider aspect,
renewable energy sources are deemed to be much more environmentally friendly and
should be considered as the “fuel” for the future. Throughout the years, global inflation
Univers
ity of
Mala
ya

65
of commodities has also increased the price of water treatment chemicals on a yearly
basis. There are very little doubts that the price of chemicals would keep on increasing
in years to come. These two main drivers (low cost renewable energy and high cost of
chemicals) would enable the operational cost of the UF system to level off with the
conventional systems in the near future.
4.4.3 Maintenance cost of treatment systems
Water treatment facilities and equipment are prone to wear and tear which requires
periodic maintenance. Maintenance costs are expenses required to ensure the treatment
system components in relatively optimum condition for continuous operation. As
mentioned earlier, the UF system is a pressure driven process which requires a lot of
mechanical rotating equipment unlike the conventional system which is a gravity driven
process. The high pressure built-up in the piping systems causes frequent leakages to
occur and higher maintenance works were required. Table 4.4 shows the comparison of
estimated maintenance cost for the UF system as well as the conventional system. The
estimated maintenance cost for both the treatment systems were conducted based on
records obtained from 2013 until 2014 for a 12 months period. Estimated total yearly
maintenance cost for the UF system was much higher than the conventional system
which were also in accordance to the literature report conducted by other researchers
(Bonnelye et al., 2008). In this case study, the UF system was a fully automated system
while the conventional system was a fully manual operated system. The operators in the
water treatment plant were responsible for the operation of both systems in each
working shifts. These operators spent much longer time attending to the conventional
system as all the filter backwash, coagulant dosage and final disinfection were carried
out by the operators manually.
Univers
ity of
Mala
ya

66
Table 4.4: Estimated maintenance cost for the UF and conventional systems
UF system Conventional media filtration
Automation components maintenance and piping system leakages repair
3, 500 USD/year 500 USD/year
UF membrane chemical cleaning (Clean in place or CIP)
1, 500 USD/year -
Cleaning of sludge in clarifiers and filter tanks
- 1, 000 USD/year
Rotating equipment greasing, lubrication and spare parts replacements
200 USD/year 100 USD/year
Total cost of maintenance in a year 5, 200 USD/year 1, 600 USD/year
Information in Table 4.4 has clearly indicated that up to 67% of the estimated yearly
maintenance cost for the UF system was spent on the automation components and pipes
leakages. Only 31% of the yearly estimated maintenance cost was used for the same
purpose (repairing pipes leakages) on the conventional system. The constant switching
between filtration and backwash sequences every hour for the UF system necessitates
full automation operation. Such automation might not be necessary for the conventional
media filtration system as the backwash was only initiated after 48 hours of filtration
sequence. The backwash sequence for all the media filters were executed by the
operators manually in this case study.
4.4.4 Analysis of filtrate quality
The quality of the filtrate produced by both systems was analyzed in detailed under
this case study as well. Literature has reported experimental studies conducted by
researchers using seawater as the feed water to both conventional and UF systems
Univers
ity of
Mala
ya

67
0
10
20
30
40
50
60
0
2
4
6
8
10
12
14
16
18
20
Fee
d w
ater
tu
rbid
ity
(NT
U)
Filt
rate
tu
rbid
ity
(NT
U)
Sampling date
Media filter (filtrate)
UF (filtrate)
Feed water
(Guastalli et al., 2013). This pilot-scale study has shown that the UF system produced
much higher stability and excellent quality of the filtrate compared to the conventional
system. Similar results were also observed in the evaluation of industrial-scale water
treatment systems under this case study. Figure 4.8 shows the analysis results of the
feed water and the filtrate turbidity from both conventional and UF systems in May
2013. Under normal conditions, the feed water turbidity from the river should be 20
NTU or less which was the designed basis for the UF system. Unfortunately during
certain rainy days, the turbidity increased to more than 20 NTU reaching almost 60
NTU occasionally. Such feed water characteristic/turbidity fluctuation requires the
operators to re-adjust the coagulant dosage to ensure optimum flocs size was formed in
the coagulation-flocculation process for the conventional system.
Figure 4.8: Feed water and filtrate turbidity in May 2013
Univers
ity of
Mala
ya

68
In Figure 4.8, the UF filtrate turbidity was consistently below 1 NTU irrespective of
the feed water turbidity fluctuation. As for the conventional media filtration system, the
filtrate turbidity fluctuates in a similar pattern as the feed water turbidity. The main
reason behind the fluctuation of filtrate turbidity was because the conventional system
would require re-adjustment of the coagulant dosage when there were characteristic
changes such as turbidity fluctuation in the feed water. Operators of the treatment plant
would need to consistently monitor the feed water characteristic and at the same time re-
adjust the coagulant dosage to ensure optimum flocs formation (Wu & Lo, 2010). Any
deficiency in the coagulation-flocculation process would cause the depth filtration
mechanism in the media filter to have lower efficiency of solid-liquid separation and
produce lower quality of filtrate which exhibited higher turbidity.
The average filtrate turbidity for the UF system indicated in Figure 4.8 was 0.37
NTU while the average filtrate turbidity of the conventional system was 1.47 NTU. By
examining these data, it could be concluded that the UF system consistently produced
much higher quality of filtrate in terms of lower turbidity compared to the conventional
system. As mentioned earlier, the cake/surface filtration mechanism of the UF
membrane allows direct feed of the feed water without jeopardizing on the solid-liquid
separation process.
Besides the filtrate turbidity, a few important aspects concerning the quality of the
filtrate are in terms of dissolved organic carbon (DOC) and chemical oxygen demand
(COD) concentrations. A detailed analysis of the feed water and filtrate from both
systems were conducted to determine the removal efficiency as well as the pH. Table
4.5 shows the water samples analysis of the feed water and the filtrate from both
systems.
Univers
ity of
Mala
ya

69
Table 4.5: Removal efficiency of DOC and COD
Feed water UF system
(% removal)
Conventional media filtration
(% removal)
DOC (mg/L) 3.6 0.7 (81%) 2.1 (42%)
COD (mg/L) 8.0 5.0 (38%) 2.0 (75%)
pH 7.1 6.9 6.7
Literature has reported that the DOC removal of membrane processes were much
better than conventional media filtration (Kabsch-Korbutowicz, 2006). The data shown
in Table 4.5 indicates similar observation with 81% removal efficiency of DOC from
the feed water compared with only 42% in the conventional system. The presence of
DOC in surface water was known to be a precursor of the formation of disinfection by-
products which cause a lot of health related issues (Cool et al., 2014). Analyses of the
feed water was found to consists of 3.6 mg/L of DOC which was relatively low
compared to the reported mean average of 7.24 mg/L (Cool et al., 2014). DOC is not a
frequently monitored parameter in drinking water for Malaysia but nevertheless it is a
good practice to consistently ensure the DOC content is low in the chlorinated potable
water to reduce the amount of hazardous disinfectant by-products. Experimental studies
using pilot plant by other researchers have indicated that the removal rate of DOC was
much higher in UF systems compared to the conventional media filtration system
(Guastalli et al., 2013). This case study on UF and conventional industrial-scale water
treatment systems also show similar results as indicated in Table 4.5. The UF system
DOC removal efficiency (81%) was almost double of the conventional media filtration
system (42%).
Besides DOC, other undesired contaminant in drinking water supply is the high COD
content. It was reported that COD was not a major issue in water treatment plants at
Malaysia (Hasan et al., 2011). The high concentration of COD is undesirable mainly
Univers
ity of
Mala
ya

70
because it leads to the exhaustion of dissolved oxygen and promotes the occurrence of
septic or lack of oxygen condition. Analysis of the feed water samples only indicated 8
mg/L of COD which complies with the recommendation of less than 10 mg/L in
drinking water by Ministry of Health Malaysia as well as allowable limit reported in
literature (Sarkar et al., 2007). It was speculated that the coagulation-flocculation
process might be able to reduce some of the COD in surface water. This has been shown
in the results from Table 4.5 whereby there was a 75% reduction in COD for the
conventional water treatment system filtrate compared with only 38% for the direct feed
UF system filtrate without any prior coagulation-flocculation.
There was also a noticeable drop of pH in the filtrate of the conventional system
mainly due to the dosing of ACH for the coagulation-flocculation process. Equation
(4.1) shows the hydrolysis reaction of ACH which lowered down the feed water pH by
producing H+. Since there was no chemical used prior to the filtration process for UF
system, the filtrate would have very minimal pH difference than the feed water as
shown in Table 4.5.
Al2(OH)5Cl → Al2(OH)5+ + Cl- + H2O → 2Al(OH)3 + H+ + Cl- (4.1)
The water samples analyses on both industrial-scale water treatment systems have
shown the consistency of the UF system to produce low turbidity of filtrate without the
use of any coagulant. Both the DOC and COD concentrations of the UF filtrate were
also within acceptable levels.
Univers
ity of
Mala
ya

71
4.4.5 Overall water losses
Water losses are critical issues at certain locations whereby the natural water
resources have very limited feed water flow to the treatment plants. The main water
losses from treatment plants are due to filter/membrane cleaning and sludge discharge.
Table 4.6 shows the breakdown and overall water losses from both the water treatment
systems.
Table 4.6: Breakdown and overall water losses
Ultrafiltration system Conventional media filtration
Feed water into system (average)
7, 420 m3/day 11, 152 m3/day
Filtrate produced (average) 6, 600 m3/day 10, 413 m3/day
Water losses through clarifiers (sludge discharge)
- 4.0%
Water losses through media filter/membrane backwash
11.1% 2.6%
Overall water losses 11.1% 6.6%
Estimated dry sludge generation (80% dryness)
164 ton/month 148 ton/month
Aluminium residual in sludge
Not detected 58 mg/L
The analysis in Table 4.6 was conducted on May 2013 which was the same
corresponding period as the filtrate and feed water data taken in Figure 4.8. Data in
Table 4.6 shows that the UF system had higher water losses of 11.1% compared to the
conventional system water losses of only 6.6%. Literature has reported water losses as
high as 13.3% was recorded in UF system to mitigate the membrane fouling by
allowing more frequent sludge discharge or backwash (Bai et al., 2013). The high
Univers
ity of
Mala
ya

72
frequency of discharges in UF system might be necessary due to the fluctuating feed
water turbidity indicated in Figure 4.8.
Conventional water treatment system has shown overall water losses of less than 7%
which is in compliance to the recommendation by local authority in Malaysia. The
major water losses of 4% were accumulated through the clarifiers whereby high
concentrations of suspended solids were presence. These solids suspension or sludge
consists of high concentrations of Aluminium residual were originated from the ACH
dosed for the coagulation-flocculation process. Generally it was reported that the
Aluminium sludge in a conventional potable water treatment plant was between 1% –
5% depending on the characteristic of the feed water (Tantawy, 2015). There were also
an expected 2% – 3% water losses for the media filter backwash cleaning process
(Kawamura, 2000).
Another issue worth taking note besides the total water losses of each system was the
composition of the discharged sludge. As mentioned earlier, there was no chemical or
coagulant dosed prior to the UF process. The sludge composition for the UF system
should remain the same as the feed water but with much higher solids concentration.
Since Aluminium based coagulant (ACH) was dosed for the coagulation-flocculation
process prior to clarification and filtration, it should be expected that the sludge contains
high concentrations of Aluminum residual. Table 4.6 have indicated that no Aluminium
residual was detected in the sludge from the UF system while as high as 58 mg/L of
Aluminium residual was detected in the sludge from the conventional system. A minor
trace of Aluminium residual was always detected in the filtrate of the conventional
system because of the dosing of ACH. There are reports that Aluminium residual in
water was linked to possible development of Alzheimer’s diseases, mental disorder or
retardation in children and diseases caused by heavy metals accumulation (Tantawy,
2015). Besides not having any additional traces of Aluminium residual in the filtrate,
Univers
ity of
Mala
ya

73
the UF system also does not produce sludge contaminated with Aluminium. The sludge
was merely a more concentrated natural solids suspension from the river and could be
readily discharge back to the downstream of the river with minimal environmental
impact.
Restrictions imposed in some countries require Aluminium contaminated sludge
from water treatment plants to undergo further treatment processes before disposal. It
has been estimated that Aluminium sludge treatment and disposal can incurred cost of
up to 130 USD/ton (Dassanayake et al., 2015). Data from Table 4.6 indicated that 148
tons of Aluminium contaminated sludge was generated every month in the conventional
system. It could increase another additional 0.06 USD/m3 for the overall operational
cost of the conventional system treated water production. Not only that the Aluminium
sludge required more effort and facilities for the disposal and environmental issues, it
has also incurred additional cost to the overall production. A sustainable water treatment
system should embrace long terms economical profit with minimal environmental
impact.
4.5 Findings of the evaluation and comparison
There were five aspects which have been evaluated for both UF and conventional
water treatment systems in this case study. Three of these aspects (capital cost,
operational cost and maintenance cost) were related to the commercial feasibility of the
systems while the remaining two aspects (filtrate quality and water losses) highlighted
the quality and environmental concerns. These five aspects were selected based on its
common acceptance in infrastructure and construction projects to elucidate its viability
in environmental and commercial studies (Britton et al., 2013; Cheng, 2014; Dahal et
al., 2015; Molinos-Senante et al., 2013; Zaman & Lee, 2015).
Univers
ity of
Mala
ya

74
All the evaluation and cost analysis stated in this case study were based on local
Malaysia conditions. It is suggested that the same trend would be observed in other
parts of the world but with different prices due to currency exchange and inflation rates
as all these commodities/chemicals/energy generation require intensive production
techniques and rely on global market for the raw materials (Mercure & Salas, 2013).
The sensitivity analyses indicated in Figure 4.6 and Figure 4.7 have shown that under
certain conditions (eg. decrease in electricity price, increase in chemical cost, higher
cost for land acquisition) the UF system would be very similarly feasible compared to
the conventional system.
As mentioned earlier, sustainable development implies embracing both commercial
and environmental impacts while ensuring quality of the final product. The UF system
has shown promising results in producing consistently good quality of filtrate without
using any coagulant. Although the total water losses of the UF system were much
higher than the conventional system, it was observed that the sludge discharged was
much more environmentally friendly. There was no Aluminium residual contamination
detected in the sludge and it was safe to discharge it at the downstream of the river
without further treatment. These sludge contains the same solids composition as the
feed water with much higher solids concentration. The electricity utilization of this UF
system was 0.21 kWh/m3 of filtrate which was very close to the reported value of 0.20
kWh/m3 in literature (Pearce, 2008). This UF system was generally automated with
minimal operator’s interception. The main drawbacks of the UF system were the overall
higher cost (capital cost, operation cost and maintenance cost) and water losses
compared to the conventional system.
This case study has indicated that the construction cost of the conventional system
was much lower but requires a larger land area than the UF system. Data shown in
Table 4.1 has indicated that construction cost (USD/m3 of treated water) for the UF
Univers
ity of
Mala
ya

75
system was 5.6% higher but requires only 30% land area (m2/m3 of treated water) of the
conventional system. These findings concurred with literature report which stated that
UF system requires higher construction cost but utilize less land area than the
conventional system (Pearce, 2007b). In this case study, it has been highlighted and also
reported in literature that the UF system was a pressure driven process which entails
high operational and maintenance cost (Bonnelye et al., 2008).
Due to the reliance of the coagulation-flocculation process prior to filtration in the
conventional system, the coagulant dosage would need re-adjustment if there were
fluctuations on the feed water characteristics and turbidity (Wu & Lo, 2010). Extra cost
might incur for further treatment or disposal of the Aluminium residual contaminated
sludge which is a common by-product from the conventional systems. The UF system
has a distinct advantage over the conventional system in providing consistently high
quality of filtrate with direct feed without any coagulant required.
Industrial-scale water treatment plants are important facilities required to provide
clean water supply to consumers through the public-piped supply networks. New
construction and expansion of these treatment facilities would have immense economic
and environmental impacts which entail extensive evaluation and feasibilities studies for
long term implications (López-Roldán et al., 2016; Qi & Chang, 2013). This case study
has gathered sufficient data to point out that even though the UF system is currently
considered an “expensive” technology compared to the conventional system, it has
distinctive advantages in terms of consistent filtrate quality and “uncontaminated”
sludge discharged compared to the latter. The estimated operation cost (chemicals,
electricity and maintenance cost) for the UF system was USD 90, 406/year while the
conventional system was USD 43, 560/year based on data from Table 4.2, 4.3, 4.4 and
4.6. Table 4.7 summarized all the findings, literature information and comparison
between the two systems in this case study.
Univers
ity of
Mala
ya

76
Table 4.7: Summary of various aspects in the case study
No. Aspects UF system Conventional media
filtration
Information from literature
Findings from case study
1. Capital cost Actual construction cost in 2013 was 265 USD/m3 of capacity. Required land area was 0.038 m2/m3 of capacity
Estimated construction cost in 2013 was 251 USD/m3 of capacity. Required land area was 0.125 m2/m3 of capacity
UF systems were commonly deemed to require higher construction cost but lesser land area (Pearce, 2007b).
UF systems construction cost was 5.6% higher but utilize only 30% land area compared to the conventional system
2. Operational cost
Total operational expenditure was USD 35.37/1, 000 m3 of treated water
Total operational expenditure was USD 11.04/1, 000 m3 of treated water
UF system incurred higher cost than conventional system under acceptable feed water conditions (Bonnelye et al., 2008)
Sensitivity analyses has shown that if electricity could be generated by lower cost and chemical cost continue to escalate due to general worldwide inflation, the UF system operational cost would be comparable to the conventional system
3. Maintenance cost
Estimated maintenance cost at 5, 200 USD/year
Estimated maintenance cost at 1, 600 USD/year
The UF system is a pressure driven process which requires higher maintenance cost (Bonnelye et al., 2008)
Less attention was required for the UF system because of the automated process. Operators spent substantially more time and efforts to attend the operation of the conventional system
4. Filtrate quality Direct filtration without any coagulant. Consistent filtrate turbidity of less than 1 NTU
ACH was required for coagulation-flocculation prior to filtration. Filtrate turbidity fluctuate between 1 to 4 NTU
Conventional media filtration system requires chemical in the coagulation-flocculation process for efficient solid-liquid separation (Wu & Lo, 2010). It has been reported that consistent good quality of filtrate was observed from the UF systems (Guastalli et al., 2013)
The UF system could produce consistent good quality of filtrate even with fluctuations of the feed water. The conventional system would require proper re-adjustment of the coagulant dosage to achieve good results.
5. Water losses Total water losses were 11.1%. The sludge contained no residual of Al
Total water losses were 6.6%. The sludge contained high Al residual (58 mg/L)
In the conventional system, a total water losses of less than 7% is acceptable (Kawamura, 2000; Tantawy, 2015). In some UF systems, up to 13.3% water losses have been reported (Bai et al., 2013)
The water losses were much higher in the UF system compared to the conventional system. Sludge from the conventional system was contaminated with Al residual and poses health hazard.
Univers
ity of
Mala
ya

77
4.6 Summary
In this case study, five aspects of both the industrial-scale UF and conventional water
treatment systems were evaluated and compared. The commercial aspects have shown
that the UF system was a much “expensive” technology in comparison with the
conventional system. Total water losses from the UF system were also significantly
higher than the conventional system. Apparent advantage of the UF system was
displayed through its consistent filtrate quality which exceeds the conventional system.
The sludge or by-products from both system were analyzed and indicated high
Aluminium residual contaminated sludge from the conventional system compared with
the uncontaminated and more environmentally friendly sludge from the UF system.
Sensitivity analyses in this case study have indicated that the UF system could be made
similar viable as the conventional system in a few scenarios. This case study has
illustrated the potential of industrial-scale UF membrane water treatment system as a
feasible technology in the near future.
Univers
ity of
Mala
ya

78
CHAPTER 5:
KEY ISSUES OF ULTRAFILTRATION MEMBRANE WATER TREATMENT
SYSTEM SCALE-UP FROM LABORATORY AND PILOT-SCALE
EXPERIMENTAL RESULTS
In the previous two chapters, detailed case studies on industrial-scale UF membrane
water treatment system operational issues and the comparison against the conventional
system were highlighted. Before commencing the design of an industrial-scale UF
membrane system, engineers require relevant and accurate preliminary data to
determine the sizing/capacities of the components and equipment. Typically, these
preliminary data is obtained through laboratory and pilot-scale experimental studies.
The data analyses from these experimental studies become an essential part of designing
an efficient industrial-scale UF system. Even after the completion of an UF membrane
water treatment plant, both laboratory-scale and pilot-scale systems could still be
utilized to study various aspects of the UF process which exhibits similar patterns with
the industrial-scale systems.
5.1 Introduction
In this chapter, another case study has been conducted on three UF systems which
were of different capacities to represent laboratory-scale, pilot-scale and industrial-scale
systems. These UF systems were analyzed to determine the differences and similarities
of the operational results. Similar UF membrane and river water have been utilized in
the operations of all the systems to ensure same operational conditions. Results were
compared between all three systems in various aspects such as analysis of filtrate
quality, TMP of membrane modules and the electricity utilization. Knowledge gained
Univers
ity of
Mala
ya

79
from these comparisons is important to ensure accurate interpretation of data to scale-up
an industrial-scale UF system from the experimental results derived from the
laboratory-scale and pilot-scale systems.
5.2 Background
Clean and uncontaminated drinking water is important to human survival as water
related diseases has caused thousands of human deaths every day around the world
(Misra & Singh, 2012). Developing countries encountered higher risk of facing water
crisis with serious health implications due to the increasing population density and the
lack of proper infrastructures (Enders et al., 2015). In order to produce consistent and
higher quality of drinking water to accommodate the demand, large-scale membrane
technology such as UF has becomes a viable option. UF system have been known to be
the ultimate barrier to segregate viruses and bacteria in the production of drinking water
(Di Zio et al., 2005). Since 1960, utilization of polymeric membranes such as
Polyethersulfone (PES) have garnered a wide acceptance in drinking water treatment
systems as it is capable of producing consistent quality of filtrate at competitive cost
(Tang et al., 2016a).
Regulatory requirements for safe drinking water have become more stringent to
avoid contamination crisis. These demands led many water service providers to utilize
highly efficient membrane technology such as UF to produce better quality of drinking
water (Peiris et al., 2013). Besides being able to produce consistently high quality of
filtrate, membrane technologies have also been reported as an effective green design
particularly for municipal/urban implementations for their eco-friendliness, cost-
effectiveness and user-friendliness (Rashidi et al., 2015). Membrane technology has
immense potential to alleviate shortages of potable water supply in many parts of the
world.
Univers
ity of
Mala
ya

80
Under normal circumstances, industrial-scale water treatment systems efficiency in
contaminant removal differs due to the raw water characteristics, engineering design
and operational conditions of the systems (Lohwacharin et al., 2014). Typically before
the commencement of the design for a full-scale/industrial-scale UF system, preliminary
laboratory experiments or pilot-scale studies were conducted to gather the required data
(Keeley et al., 2012). Literature has reported that laboratory-scale experiments have
provided essential information on the most efficient membrane configuration and
operational conditions for UF systems (Howe et al., 2007). In another research, a pilot-
scale system was utilized to investigate the performance of an UF system at the
Oosterschelde estuary, Netherland (Alhadidi et al., 2012). Both laboratory-scale and
pilot-scale studies provide essential information on a particular UF membrane
compatibility with the proposed feed water source.
Engineering system scale-up has been considered a challenging task that requires
proper care and meticulous revisions (Rossetti & Compagnoni, 2016). The conception
of an industrial-scale UF membrane water treatment system involves the reliability of
the preliminary data for the detailed engineering design. Design engineers require these
data to provide a reliable and functioning industrial-scale UF system (Kim & Lee,
2016). In general, preliminary data from laboratory-scale and pilot-scale studies formed
the essential basis of the industrial-scale system design. Detailed analyses have been
conducted on three different scales of UF systems under this study to determine the
similarities and differences of the operational parameters.
5.3 Methodology
In this third case study, operational results from three types of UF system in various
capacities to represent laboratory-scale, pilot-scale and industrial-scale have been
Univers
ity of
Mala
ya

81
analyzed. All these three UF systems were utilizing the same modified Polyethersulfone
(mPES) hollow fibre UF membrane manufactured by the same company (Inge GmbH,
Germany). The feed water for all the UF systems originates from the same river water
source. The same industrial-scale UF membrane water treatment system mentioned
earlier in the previous two chapters was again analyzed in this research. In order to
maintain the same operational conditions, all the three systems were operated under
dead-end constant flux filtration mode with periodic backwash sequences in between.
All these 3 systems have been operated with the same feed water from the river. Similar
filtration and backwash durations were applied on all the systems. Essential operational
data from these systems were recorded and analyzed accordingly to determine the
similarities and differences. Each UF systems were equipped with pressure
transmitters/gauges to record the TMP. Filtration and backwash flux rates were
measured volumetrically or through installed flowmeters. Laboratory analysis using pH
and turbidity analyzers were utilized to analyze the feed water and filtrate samples.
Electricity parameters such as voltage and ampere to the UF feed pumps were measured
using digital multi-meter to determine the electricity utilization.
Detailed analysis of all the data collected from the three UF systems were conducted
and compiled accordingly. These data have been critically examined against literature
reports for a comprehensive study of the results obtained. Aspects such as filtrate
quality, TMP of membrane modules and electricity utilization of the three UF systems
have been further elaborated in the subsequent sections. Figure 5.1 shows the actual
photograph of the three UF systems under this case study.
Univers
ity of
Mala
ya

82
Figure 5.1 (a) Laboratory-scale UF system Figure 5.1 (b) Pilot-scale UF system Figure 5.1 (c) Industrial-scale UF system
Figure 5.1: Three UF systems utilized for the case study
5.4 Results and discussions
All three UF systems were put into operation with the same type of UF membrane
and feed water source. Three different types of UF membrane modules (consisting the
same type of hollow fibre membranes) with various membrane surface area were used.
Table 5.1 shows the capacity and operating conditions of all these three systems. All
these UF systems were operating under the same filtration flux to ensure uniformity.
Univers
ity of
Mala
ya

83
Table 5.1: Operating conditions of the three UF systems
Parameters Laboratory-scale Pilot-scale Industrial-scale
Feed water River water River water River water
UF membrane mPES hollow fibre mPES hollow fibre mPES hollow fibre
Membrane surface 1.0 m2 6.0 m2 7, 200 m2
Filtration flux 80 L/m2hr 80 L/m2hr 80 L/m2hr
Feed water flow 80 L/hr 480 L/hr 576, 000 L/hr
Figure 5.1 and Table 5.1 illustrated the actual size and operational capacities of the
three UF systems. All these systems were evaluated on their respective filtrate quality,
TMP through membrane modules and the specific electricity utilization which have
been further elaborated in the subsequent sections.
5.4.1 Analysis of filtrate quality
Experiments were conducted with the laboratory-scale and pilot-scale systems while
actual operational data were extracted from the in-house laboratory analysis of the
industrial-scale system for further evaluation. As mentioned earlier, all the UF systems
were utilizing the same mPES hollow fibre membrane and taking the same river source
as feed water to ensure uniformity. The initial feed water parameters such as turbidity,
colour and pH were analyzed. Filtrate after the UF process from each systems were
analyzed for these same parameters which represent the physico-chemical properties of
the filtrate quality (Roig et al., 2014). Table 5.2 shows the results of filtrate from the
three UF systems under similar operational conditions as well as the feed water samples
analyses. The analysis results indicated that all the three UF systems produced similar
high quality of filtrate with less than 0.20 NTU and with detected colour lower than 15
Univers
ity of
Mala
ya

84
Pt – Co. Since there was mainly solid-liquid physical separation in the UF process, the
pH of the feed water and filtrate were expected to be quite similar without much
variation. These results indicated that for UF systems, the laboratory-scale and pilot-
scale studies would produce almost similar filtrate results as an industrial-scale system.
Table 5.2: Feed water and UF filtrate analysis results
Parameters Laboratory-scale Pilot-scale Industrial-scale
Feed water turbidity 23 NTU 23 NTU 23 NTU
Feed water colour 56 Pt – Co 56 Pt – Co 56 Pt – Co
Feed water pH 7.3 7.3 7.3
Filtrate turbidity 0.15 NTU 0.18 NTU 0.19 NTU
Filtrate colour < 15 Pt – Co < 15 Pt – Co < 15 Pt – Co
Filtrate pH 7.1 7.2 7.1
Literature has reported that a pilot-scale membrane system was used at Kwai Chung
industrial wastewater pumping station at Hong Kong to verify and substantiate further
upgrading of an existing industrial-scale system (Guan et al., 2014). In another different
study, a laboratory-scale membrane system was set-up to determine the filtrate quality
using seawater from the Mediterranean Sea off the coast of Gruissan, France (Monnot et
al., 2016). These were practical examples whereby the pilot-scale and laboratory-scale
systems were used to determine the filtrate quality for the proposed industrial-scale
system. In general most literature has reported laboratory-scale or pilot-scale membrane
systems were utilized to determine the filtrate quality based on the intended feed
solutions as a basis. In this study, the data shown in Table 5.2 concurred with the
suggested literature common practice in using the pilot-scale and laboratory-scale
membrane systems filtrate results as a good approximation to a full-scale system.
Univers
ity of
Mala
ya

85
5.4.2 Trans-membrane pressure of membrane modules
The trans-membrane pressures (TMP) from all the three systems under similar
operational condition stated in Table 5.1 and Table 5.2 have been recorded. Results in
Table 5.3 indicated that the TMP of all three systems were not very consistent. Both the
laboratory-scale and pilot-scale systems recorded much higher TMP than the industrial-
scale system. The cause of this discrepancy might have originated from the UF
membrane modules design. Most small-scale UF membrane modules were not hydro-
dynamically optimized to ensure lower manufacturing cost in order for more
competitive pricing. These small-scale systems often do not require such high-end
optimized membrane modules as the production volume was small. The membrane
manufacturer (Inge GmbH, Germany) for all UF systems in this case study only
produced central core UF membrane modules for small-scale systems specifically cater
for laboratory experiments and pilot plants. This membrane manufacturer produced a
more hydro-dynamically optimized industrial-scale UF module known as annular gap
configuration to reduce the hydraulic pressure losses within the module itself. Figure 5.2
illustrates the different arrangement of the hollow fibre membranes of the annular gap
and the central core UF membrane modules.
Table 5.3: Average TMP of UF systems under similar operational conditions
Parameters Laboratory-scale Pilot-scale Industrial-scale
UF module design Central core Central core Annular gap
TMP 0.41 Bar 0.42 Bar 0.32 Bar
Univers
ity of
Mala
ya
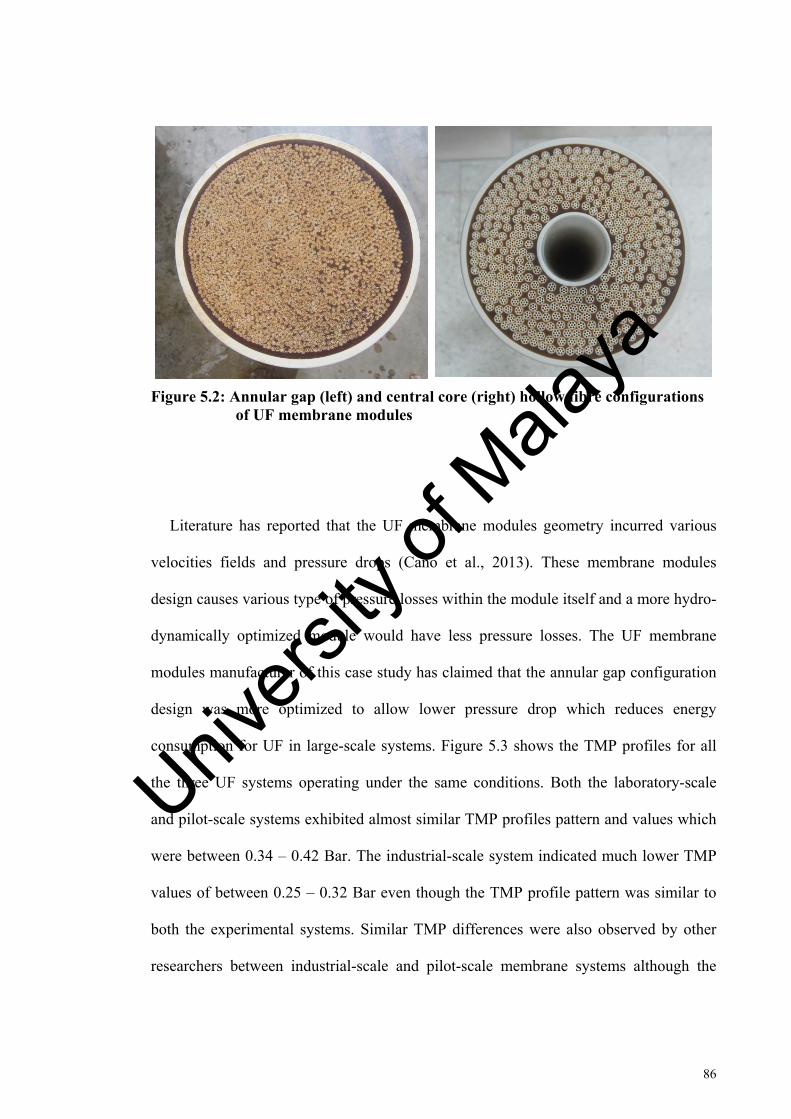
86
Figure 5.2: Annular gap (left) and central core (right) hollow fibre configurations of UF membrane modules
Literature has reported that the UF membrane modules geometry incurred various
velocities fields and pressure drops (Cano et al., 2013). These membrane modules
design causes various type of pressure losses within the module itself and a more hydro-
dynamically optimized module would have less pressure losses. The UF membrane
modules manufacturer of this case study has claimed that the annular gap configuration
design was more optimized to allow lower pressure drop which reduces energy
consumption for UF in large-scale systems. Figure 5.3 shows the TMP profiles for all
the three UF systems operating under the same conditions. Both the laboratory-scale
and pilot-scale systems exhibited almost similar TMP profiles pattern and values which
were between 0.34 – 0.42 Bar. The industrial-scale system indicated much lower TMP
values of between 0.25 – 0.32 Bar even though the TMP profile pattern was similar to
both the experimental systems. Similar TMP differences were also observed by other
researchers between industrial-scale and pilot-scale membrane systems although the
Univers
ity of
Mala
ya

87
0
0.1
0.2
0.3
0.4
0.5
0.6
0 3 5 8 10 13 15 18 20 23 25 28 30 33 35 38 40 43 45 48 50 53 55 58 60
TMP
(Bar
)
Filtration time (min)
Laboratory-scale
Pilot-scale
Industrial-scale
Central core UF modules
Annular gap UF module
1 min backwash
TMP profiles pattern were the same (Kamp et al., 2000). All the systems were operating
under filtration sequence for 30 minutes with an intermittent backwash of 60 seconds.
Figure 5.3: TMP profiles of UF systems
A distinctive difference between the two experimental systems (laboratory-scale and
pilot-scale) and the industrial-scale UF system was the UF membrane modules design
shown in Table 5.3 and Figure 5.2. Both the experimental systems were utilizing central
core UF membrane modules while the industrial-scale system was installed with annular
gap UF membrane modules. The UF membrane modules manufacturer has claimed that
the annular gap configuration was much more hydro-dynamically optimized than the
central core configuration and allows lower pressure losses.
As more hollow fibre membranes were packed into membrane modules, the hollow
fibre networks interact during filtration and causes additional pressure losses compared
to a single strand of hollow fibre membrane (Kostoglou & Karabelas, 2008). The
Univers
ity of
Mala
ya
88
filtration flux for all three UF systems was operated at 80 L/m2hr as shown in Table 5.1.
Higher TMP observed on the central core configuration UF modules was most likely
caused by the hydraulic interaction on hollow fibre networks and the modules geometry.
It is not economically viable to produce hydro-dynamically optimized annular gap
membrane modules when there are only a low number of hollow fibre membranes
packed in these small modules. After the filtration sequence, all the three UF systems
were cleaned under the same backwash condition with 230 L/m2hr water flux for 60
seconds before the next filtration sequence commences.
5.4.3 Electricity utilization
It was mentioned earlier that the pressure driven UF system is an energy intensive
process. Electricity utilization during filtration is an important commercial aspect for the
pressure driven UF system. One of the most significant costs of UF system is the
electricity utilized to operate the feed pumps. UF systems with higher TMP during
filtration would require more electricity power to drive the motor of the pumps. The
correlation between electricity power required and the pressure of the system has been
shown in equation (3.1) at Chapter 3. It was discussed in previous sections that the
annular gap membrane module design for the industrial-scale system was more hydro-
dynamically optimized compared to the smaller central core membrane modules. Both
of the experimental systems (laboratory-scale and pilot-scale) utilizing central core
membrane modules exhibited higher TMP compared to the industrial-scale system
under similar operational conditions.
Another aspect besides the TMP which affects the electricity utilization of any
pressurized system is the feed pump efficiency (Meng et al., 2017). Equation (5.1)
shows the correlation between the overall pump efficiency against operating flow rate or
Univers
ity of
Mala
ya

89
Q (m3/s), operating pressure or H (Pascal) and the electricity power requirement or W
(Watt) for the feed pumps. Measurements and analyses were conducted on the feed
pumps of the experimental systems to determine the pump efficiency based on equation
(5.1). The feed pumps were operated under constant motor speed at certain pressure
(measured with pressure gauge) and the flow rates were determined volumetrically.
Electricity current and voltage to the pumps were measured with digital multi-meter to
ascertain the power requirement of the pumps during operation. Table 5.4 shows the
feed pumps motor ratings, operating conditions of the feed pumps, estimated feed pump
efficiency and the specific electricity utilization for all the three UF systems.
= (5.1)
Table 5.4: Feed pumps operational conditions and estimated efficiency
Laboratory-scale
Pilot-scale Industrial-scale
Pump motor rating 0.38 kW 0.70 kW 65 kW
Actual power consumed 0.31 kW 0.60 kW 61 kW
Pump operating pressure 3.25 Bar 3.25 Bar 3.25 Bar
Pump operating flowrate 0.47 m3/hr 1.77 m3/hr 580 m3/hr
Feed pump efficiency 14% 27% 87%
Specific electricity utilization
0.66 kWh/m3 0.34 kWh/m3 0.11 kWh/m3
The normal operating pressure of the industrial-scale UF membrane water treatment
system feed pump was 3.25 Bar to cater for pressure losses of all the static and dynamic
heads to the elevated treated water storage tank. Both the feed pumps of the
Univers
ity of
Mala
ya

90
experimental systems were operated at similar operating pressure to determine the
respective flow rates. Based on equation (5.1) the feed pumps efficiencies were
estimated and shown in Table 5.4. Data shown in Table 5.4 indicated the laboratory-
scale feed pump has the lowest efficiency at 14% while the industrial-scale feed pump
has the highest efficiency at 87%. The specific electricity utilization of the industrial-
scale feed pump was the lowest at 0.11 kWh/m3 followed by the pilot-scale feed pump
at 0.34 kWh/m3 and finally the highest for laboratory-scale feed pump at 0.66 kWh/m3.
Literature has reported that most high-capacity pumps or motor rating above 0.75
kW was much more energy efficient than the smaller pumps (Sauer et al., 2015).
Typically these small capacity pumps or motor with less than 0.75 kW has very low
energy efficiency of less than 40% only (Skrzypacz, 2014). In Table 5.4 it has been
shown that the industrial-scale feed pump with motor rating of 65 kW has the highest
energy efficiency at 87%. The laboratory-scale feed pump with motor rating of 0.38 kW
has the lowest efficiency at only 14% follow by the pilot-scale feed pump with motor
rating of 0.70 kW at 27%. All the data shown in Table 5.4 has indicated that higher
pump efficiency would require less energy/electricity to produce a unit of filtrate from
the UF systems.
5.5 Scaling-up industrial-scale systems based on experimental data
This case study has highlighted the similarities and differences obtained through the
three UF systems under the same operational conditions. The results shown in this case
study provide some interesting data on the accuracy and limitations of the laboratory-
scale and pilot-scale systems to represent the actual industrial-scale UF system.
Industrial-scale UF systems often incurred very high capital expenditure and precise
engineering design is essential to ensure minimal deviations from the required outputs.
Univers
ity of
Mala
ya

91
The experimental systems (laboratory-scale and pilot-scale) allowed a much lower cost
to develop in order to gather essential data for scaling-up the UF system.
Both the experimental systems provide preliminary design data to scale-up an
industrial-scale UF system on a lower budget. Researchers have agreed with the fact
that higher expenditure cost for system set-up and sampling would provide much higher
accuracy estimation of the process (De Groote & Traoré, 2005). The compatibility
between the feed water source and the UF membrane to produce the desired filtrate
quality is one of the main concerns in scaling-up an UF system. Subsequently design
engineers are required to evaluate the energy utilization of the UF system to determine
the operational cost.
The fluctuating feed water characteristics pose a serious problem to the operation of
industrial-scale UF systems. Characteristic changes and suspended solids concentrations
in the feed water would require adjustment of the filtration flux rate and more frequent
backwash sequences to reduce the membrane fouling. The increase of TMP during
filtration reflects higher electricity utilization which relates to the operational cost. In
this case study, the pilot-scale system provides much closer simulation results in term of
both filtrate quality and specific electricity utilization for the industrial-scale system
under similar operational conditions. Although the laboratory-scale system provides
very similar filtrate quality results to the industrial-scale system, it has much more
limitations on the estimation of the specific energy required for an industrial-scale
system. The cost to build the pilot-scale system was much higher than the laboratory-
scale system in this case study.
Results obtained in Table 5.2, Table 5.3 and Table 5.4 have indicated that certain
assumptions would need to be established in order to scale-up an industrial-scale system
from pilot-scale and laboratory-scale experimental results. Case study conducted by
other researchers in the Netherlands has shown that there were significant differences in
Univers
ity of
Mala
ya

92
absolute TMP values for the pilot-scale and industrial-scale systems but exhibited
similar TMP profiles pattern (Kamp et al., 2000). Similar findings were obtained in this
case study whereby the TMP during filtration for both the laboratory-scale and pilot-
scale systems were much higher than the industrial-scale system under same operational
conditions but the TMP profiles exhibited similar patterns as shown in Figure 5.3. In
order to ensure the design filtration flux of 80 L/m2hr is achieved, a variable speed drive
(VSD) is recommended to be installed to control the motor speed of the feed pump. The
induction motor speed controlled by a VSD enables reduction of electricity utilization
by regulating the motor speed to achieve the required duty point of the pump (Al-
Bassam & Alasseri, 2013). Results obtained in this case study have shown that the TMP
of the industrial-scale system under the same operational conditions was much lower
than both the pilot-scale and laboratory-scale systems. This would suggest that installing
a VSD to regulate the feed pump would allow the pump to operate at a much lower
speed to sustain the lower TMP required. Without such VSD installed, the feed pump
would be operating at nominal speed which might incurred much higher filtration flux
than the required design. Throttling the discharge valve of the feed pump is usually the
solution to reduce the flux but a lot of energy is wasted through the pressure losses of
throttling the valve. A better and more efficient solution to achieve the design flux is to
regulate the motor speed via VSD control.
Filtrate quality remains one of the most important parameter in membrane systems.
The UF process needs to produce the desired filtrate quality based on the feed water
characteristics. In this case study, both the laboratory-scale and pilot-scale systems were
producing similar filtrate quality (in terms of turbidity and colour) as the industrial-scale
system. The quality of the filtrate obtained through both experimental systems using the
same feed water source provides accurate prediction of the filtrate quality in an
industrial-scale system. These accurate predictive results allow the industrial-scale UF
Univers
ity of
Mala
ya

93
system operator to rapidly detect any discrepancy in the filtrate quality by conducting a
laboratory-scale filtration experiments with the same feed water. Any UF membrane
fibre breakages or valve leakages in the industrial-scale system could be determined if
the filtrate quality results in the laboratory were much better. If filtrate turbidity was
much higher in the industrial-scale system compared to the laboratory-scale system, this
usually indicates membrane fibre breakages or mechanical equipment malfunction such
as leaking valves.
In this case study, both the laboratory-scale and pilot-scale systems results have also
provided operational cost estimation of the industrial-scale UF system. Data presented
in Table 5.4 indicated much lower specific electricity utilization on the industrial-scale
system feed pump (0.11 kWh/m3) compared to the laboratory-scale (0.66 kWh/m3) and
pilot-scale (0.34 kWh/m3) systems. The main reason for the differences in electricity
utilization for the three UF systems was caused by the various efficiencies of the feed
pumps. Literature has reported that an industrial-scale UF membrane water treatment
system usually requires specific energy of about 0.20 kWh/m3 (Pearce, 2008). The
industrial-scale UF system in this case study has shown much lower specific energy
requirement than literature reports because only the feed pump electricity utilization
was taken into consideration. Higher TMP during filtration would results in higher
energy utilization to drive the motor of the feed pump. The central core UF membrane
modules for the experimental systems have shown higher TMP than the industrial-scale
annular gap membrane module under similar operational conditions. Both the
laboratory-scale and pilot-scale systems have provided a rough estimation of the
specific energy requirement of the industrial-scale system. It is presumed that the
industrial-scale system would require much lower specific electricity utilization during
operation compared to both the experimental systems due to higher feed pump
Univers
ity of
Mala
ya
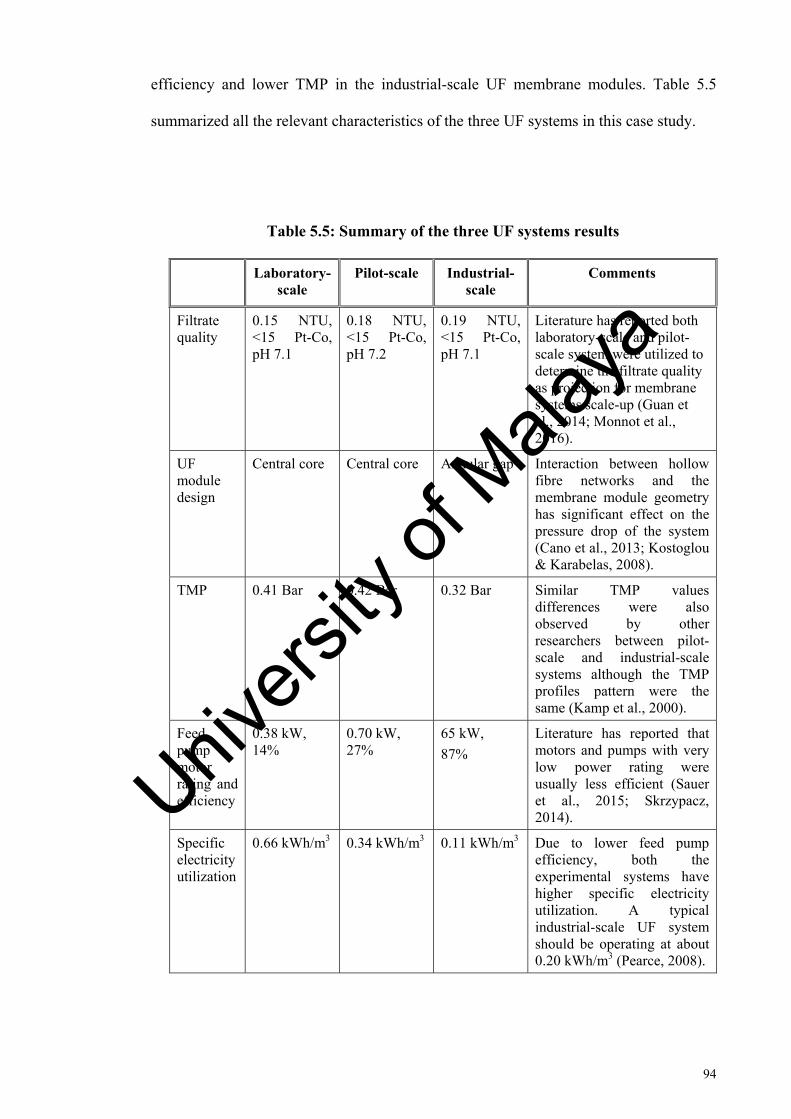
94
efficiency and lower TMP in the industrial-scale UF membrane modules. Table 5.5
summarized all the relevant characteristics of the three UF systems in this case study.
Table 5.5: Summary of the three UF systems results
Laboratory-scale
Pilot-scale Industrial-scale
Comments
Filtrate quality
0.15 NTU, <15 Pt-Co, pH 7.1
0.18 NTU, <15 Pt-Co, pH 7.2
0.19 NTU, <15 Pt-Co, pH 7.1
Literature has reported both laboratory-scale and pilot-scale system were utilized to determine the filtrate quality as projection for membrane systems scale-up (Guan et al., 2014; Monnot et al., 2016).
UF module design
Central core Central core Annular gap Interaction between hollow fibre networks and the membrane module geometry has significant effect on the pressure drop of the system (Cano et al., 2013; Kostoglou & Karabelas, 2008).
TMP 0.41 Bar 0.42 Bar 0.32 Bar Similar TMP values differences were also observed by other researchers between pilot-scale and industrial-scale systems although the TMP profiles pattern were the same (Kamp et al., 2000).
Feed pump motor rating and efficiency
0.38 kW, 14%
0.70 kW, 27%
65 kW,
87%
Literature has reported that motors and pumps with very low power rating were usually less efficient (Sauer et al., 2015; Skrzypacz, 2014).
Specific electricity utilization
0.66 kWh/m3 0.34 kWh/m3 0.11 kWh/m3 Due to lower feed pump efficiency, both the experimental systems have higher specific electricity utilization. A typical industrial-scale UF system should be operating at about 0.20 kWh/m3 (Pearce, 2008).
Univers
ity of
Mala
ya

95
5.6 Summary
Prior to the construction of an industrial-scale UF membrane water treatment plant,
experimental set-up such as pilot-scale and laboratory-scale systems are often
established. These experimental systems are utilized to collect the necessary design
parameters and the expected filtrate quality from a specific feed water source. This case
study has highlighted how the data obtained through laboratory-scale and pilot-scale
studies could be interpreted to scale-up the system with much higher accuracy and
precise information extraction. The results from both the experimental systems
(laboratory-scale and pilot-scale) indicated that the filtrate quality were a good
representation of an industrial-scale system under the same operational conditions.
Although the TMP and specific electricity requirements were much higher in both the
experimental systems, the causes have been identified. Even though the absolute values
of the TMP differ, all three UF systems exhibited similar TMP profiles pattern. This
enables the experimental systems to be utilized for the study of TMP profiles pattern
anticipated in an industrial-scale UF system under similar operational conditions.
Univers
ity of
Mala
ya

96
CHAPTER 6:
POTENTIAL MEMBRANE FOULING PARAMETERS PREDICTION
USING HYBRID MODELLING FOR ULTRAFILTRATION MEMBRANE
WATER TREATMENT SYSTEM
Membrane fouling prediction is a critical operational issue and many comprehensive
studies on this subject have been conducted using advanced analysis methods (Cheng et
al., 2016). Fluctuations of feed water characteristics are some of the main causes for
membrane fouling in the industrial-scale UF membrane water treatment plants. Early
detection or predictions of potential membrane fouling operational conditions are
essential to ensure minimal future complications and operational cost escalations.
Results obtained in Chapter 5 has indicated the TMP profiles pattern exhibited by both
experimental systems were similar with the industrial-scale UF system. This enables the
utilization of UF experimental systems to study the TMP profiles for future
implementation on industrial-scale system with some minor adjustment on the absolute
TMP values.
6.1 Introduction
Predictive models provide important information of the filtration process which is
crucial for efficient operation of UF membrane water treatment systems. Such
information allows mitigation actions to be taken during high potential membrane
fouling conditions caused by feed water characteristics changes. Due to limitations of
available facilities and resources in a typical UF membrane water treatment plant,
extensive and in-depth laboratory analyses of the potential membrane fouling
Univers
ity of
Mala
ya

97
parameters are seldom conducted in-house. Predictions or estimations of these
parameters based on commonly available data and equipment from these water
treatment plants are viable alternative solutions to cater for such requirements. In this
chapter, a practical hybrid modelling approach has been utilized to predict two potential
membrane fouling parameters in the dead-end constant flux UF process.
6.2 Background
There were many successful examples of industrial-scale UF membrane water
treatment plants reported in literature (Laîné et al., 2000; Monnot et al., 2016). Filtrate
quality from UF systems have surpassed the common regulatory requirements such as
total suspended solids (TSS), turbidity, virus and bacteria removal (Kim et al., 2011).
Since the past decade, UF has been considered as one of the most significant advanced
technology for water treatment systems in many countries (Huang et al., 2008). The two
most common drawbacks of UF systems are the higher cost involved (Bonnelye et al.,
2008; Massé et al., 2011; Pearce, 2007b) and the membrane fouling problems (Guo et
al., 2012; Shirazi et al., 2010; Thekkedath et al., 2007; Wang et al., 2014). In order to
address these problems, the modelling of membrane filtration process has become an
exciting and rigorous research area to ensure optimum operational conditions (Llanos et
al., 2013).
Theoretical or first principle modelling is one of the most commonly utilized tool to
represent membrane filtration processes (Saleem et al., 2017). Many researchers have
proposed various fundamental membrane filtration models through laboratory
experimental validation or pilot-scale studies (Guo et al., 2012; Kim & DiGiano, 2009;
Tien et al., 2014). Most of these models proposed the use of Darcy’s law to establish
correlation between filtration resistance, flux and TMP. Particles accumulation and
Univers
ity of
Mala
ya

98
deposition on the membrane surface causes higher resistance which raised the TMP
under constant flux filtration. In order to ensure a predictable and consistent build-up of
the fouling layer during filtration, most laboratory experiments utilized simulated feed
solutions with known concentrations of the solids contents (Sioutopoulos & Karabelas,
2012; Tian et al., 2013b; Yi et al., 2013). These ideal conditions of having feed
solutions with consistent characteristics and solids concentrations are rarely available in
typical industrial-scale UF membrane water treatment plants. Feed water to these water
treatment plants commonly originates from rivers which have tendency to change
characteristics and turbidity abruptly especially during heavy rainfalls conditions
(Davies & Mazumder, 2003; Lee et al., 2016a).
Darcy’s law is based on cake filtration model which is one of the most widely used
theoretical model for process design and modelling (Xu et al., 2008). Literature has
reported that the accumulation of the solids as cake layer increases the TMP during
constant flux filtration (Chen et al., 1997). Solids content in the feed water becomes
consolidated cake structure on the membrane surface which causes fouling and reduces
the flux under constant pressure filtration (Castaing et al., 2010; Pontié et al., 2012). It
was reported that compressible cake filtration model was the most likely mechanism to
describe the dynamic deposition of protein molecules in dead-end UF systems (Iritani et
al., 2002). The cake filtration model is one of the most widely accepted model to
describe the membrane fouling process (Han et al., 2017). Cake layer formation and
accumulation is known to be a complicated dynamic process which ultimately causes
membrane fouling (Zhou et al., 2015). In general, natural surface water sources contain
organic matters which become highly compressible cake layer during filtration (Bugge
et al., 2012). Specific cake resistance is a commonly used parameter to express the
characteristics of the cake layer (Khan et al., 2009). This parameters is highly
Univers
ity of
Mala
ya

99
dependence on the feed water characteristics which affect the cake layer permeability
and porosity (Park et al., 2006).
Specific energy utilization of dead-end filtration operation mode is typically less than
the cross-flow filtration for large-scale drinking water production (Mendret et al., 2009).
The characteristics and structure of the cake layer in dead-end filtration operation mode
plays a significant role on the filtration performance. In order to enhance the filtration
process, some researchers have suggested selecting an appropriate coagulant to improve
the filtration process (Yu et al., 2013). It was reported that most commercial UF
membrane water treatment systems operate under dead-end constant flux conditions to
ensure consistent filtrate capacity with minimal energy requirements (Pearce, 2007b).
Laboratory membrane filtration experimental set-ups reported in literature were
commonly conducted under constant pressure conditions as constant flux operations
were much more difficult to achieve (Mahdi & Holdich, 2013).
Even though theoretical models utilizing the Darcy’s law could provide good
accuracy to the actual filtration process, it requires extensive efforts and time to obtain
precise values of certain filtration parameters (Boerlage et al., 2004). Most of these
parameters relating to the cake layer and feed water characteristics require laborious
experimental study to be ascertained. Parameters estimation models provide a good
alternative method to rapidly produce reliable results. The utilization of hybrid models
were reported to represent the dynamic evolutions of a system that consist of both
logical and continuous components (Karelovic et al., 2015). Artificial neural networks
(ANN) have been applied as part of a hybrid model to leverage on the advantages of the
black box modelling capability to describe statistical data efficiently by some
researchers (Nourani et al., 2014). Experimental data has shown high accuracy of an
adaptive neuro-fuzzy interference system to model cross-flow UF of oily wastewater
(Salahi et al., 2015). ANN and genetic algorithm (GA) were also reported being utilized
Univers
ity of
Mala
ya

100
in the Tehran Refinery wastewater to estimate filtration flux under various operating
parameters and conditions of an UF system (Badrnezhad & Mirza, 2014). The study has
shown the combinations of ANN and GA were capable to predict and optimize process
inputs to achieve the desired flux rate. Most membrane filtration mechanisms have been
reported to be highly unpredictable and requires some estimation method by general
models (Sen et al., 2011). Knowledge based hybrid ANN models have shown promising
results on UF processes with valid assumptions.
It was reported that ANN models have been utilized to predict TMP profiles of a
membrane water treatment system with high accuracy (Delgrange et al., 1998). Relevant
inputs parameters such as feed water characteristics were fed as inputs to the ANN
model to predict the TMP profiles of the UF process. In a much more elaborate study,
two ANN models were combined to estimate parameters for surface water UF
(Delgrange-Vincent et al., 2000). Efforts were also taken to develop two interconnected
ANN models coupled with the Darcy’s law (Cabassud et al., 2002). The ANN models
were used to predict the total resistance of the UF and subsequently Darcy’s law was
utilized to determine the TMP of the filtration process. Multiple feed water input
parameters such as dissolved oxygen, turbidity, ultra-violet absorbency and pH were fed
into the ANN models. Under experimental conditions, the feed water solids
concentrations were more reliable than turbidity to model the membrane filtration
process (Foley, 2006). Some researchers have experimentally shown that even though
there was a reasonable linear correlation between turbidity and total suspended solids
concentrations on natural surface water, but the correlation varies from every catchment
locations (Rügner et al., 2014). In another related study on natural surface feed water,
laboratory-scale experiments were conducted to compare the capabilities between ANN
models and the performance of pores blocking models (Liu & Kim, 2008). The results
Univers
ity of
Mala
ya

101
in this study have indicated that ANN models have better accuracy and agreement with
the experimental data.
The utilization of ANN models were also investigated to optimize operational
conditions and predict permeate flux in wastewater systems (Soleimani et al., 2013).
Some of the reported advantages of ANN models were adaptability, robustness and
simplicity which were suitable for the application in water treatment systems. Reliable
simulations results were also obtained in the study of micellar-enhanced ultrafiltration
(MEUF) for wastewater (Rahmanian et al., 2011). Laboratory-scale study have shown
the capability of ANN models to predict non-linear dynamics processes in wastewater
UF systems (Teodosiu et al., 2000). In a another study, pilot-scale experiments were
utilized to predict performance of a submerged hollow fibre membrane filtration process
(Choi et al., 2012). Besides these laboratory-scale and pilot-scale studies, ANN models
were also utilized to predict performance of an industrial-scale waste water treatment
plant with the capacity of 1 million m3 a day at the Greater Cairo district at Egypt
(Hamed et al., 2004). The application of ANN has also been reported in optimization of
UF membrane fabrication study (Tan et al., 2014). Through the concept of hybrid
modelling, the GA and ANN models have been combined to determine the optimized
UF membrane preparation conditions. Table 6.1 summarizes some of the applications of
ANN in water and wastewater UF processes.
Univers
ity of
Mala
ya

102
Table 6.1: Applications of ANN in water and wastewater UF processes
No. Researchers Applications of ANN in UF of water/wastewater
1. (Cabassud et al., 2002) Predictive control algorithm was developed and utilized to improve productivity of surface feed water UF.
2. (Badrnezhad & Mirza, 2014)
Optimization and modelling with combination of GA and ANN for wastewater UF.
3. (Hamed et al., 2004) ANN models were developed to predict suspended solids concentrations and biochemical oxygen demand for wastewater UF.
4. (Delgrange et al., 1998)
ANN model was utilized to predict the TMP of UF in potable/drinking water treatment system.
5. (Delgrange-Vincent et al., 2000)
ANN was utilized as recurrent model to predict the productivity of a surface feed water UF pilot plant.
6. (Soleimani et al., 2013)
Fouling resistance and permeate flux prediction of wastewater UF tested in laboratory.
7. (Liu & Kim, 2008) ANN and pore blocking UF models performance were compared for surface feed water.
8. (Choi et al., 2012) Using ANN to predict membrane filtration performance on submerged hollow fibre pilot-scale membrane system.
9. (Rahmanian et al., 2011)
Wastewater permeate flux and rejected metal ions prediction in MEUF laboratory experiments.
10. (Tan et al., 2014) Utilizing GA and ANN for optimization of UF membrane fabrication process.
11. (Teodosiu et al., 2000) Flux prediction during UF and after backwashing of wastewater in laboratory experiments was conducted in this work.
Natural surface water originates from rivers are the main feed water sources for most
industrial-scale potable/drinking water treatment plants (Davies & Mazumder, 2003).
Fluctuation of feed water characteristics due to various causes would affect the
operation of UF membrane water treatment plants which might increase the likelihood
of membrane fouling. It has been shown in research studies that the inconsistency of
feed water characteristics incurred severe impact on the filtration efficiency of
membrane systems (Choi & Kim, 2015). The subsequent sections in this chapter further
elaborates on the hybrid modelling approach of this study which enables parameters
prediction related to potential membrane fouling propensity.
Univers
ity of
Mala
ya

103
6.3 Methodology
A pilot-scale UF system has been designed and commissioned to gather the required
experimental data to develop a practical hybrid model for parameters prediction of the
dead-end constant flux UF water treatment process. This was the same pilot-scale UF
system utilized in the previous case study in Chapter 5. Both experimental and software
simulation studies were conducted to develop the process model. Laboratory
experiments and data collection with the pilot-scale UF system was conducted with feed
water originates from a natural surface water source. This pilot-scale UF system was
placed at the industrial-scale UF membrane water treatment plant discussed earlier in
the previous case studies and fed with the same river water. The data collected was
utilized to train the ANN model using computer software. Further elaboration on the
detailed methodology has been highlighted in the following sections of this chapter.
6.3.1 Data collection and water sample analysis for the model
Actual filtration data using the river water source as feed water was recorded from
experimental studies of the pilot-scale UF system. This pilot-scale system consists of
the same hollow fibre UF membrane utilized in the industrial-scale UF membrane water
treatment plant discussed in the previous case studies. The UF membrane module
known as Dizzer P 4040-6.0 (manufactured by Inge GmbH, Germany) for the pilot-
scale UF systems was much smaller with only 6 m2 of membrane surface area. Figure
6.1 shows the actual and schematic diagram of the pilot-scale UF system used for the
data collection and experiments.
Univers
ity of
Mala
ya

104
Figure 6.1 (a): Actual pilot-scale UF system
Figure 6.1 (b): Schematic diagram of the pilot-scale UF system
Figure 6.1: Actual and schematic diagram of the pilot-scale UF system
The UF pilot-scale system in Figure 6.1 resembles closely the industrial-scale UF
membrane water treatment plant which operates under dead-end constant flux filtration
mode in the previous case studies. In order to ensure constant flux filtration was
maintained, variable area flowmeters and manual valves were installed on the pilot-
scale UF system to regulate the feed water flow into the UF membrane module. The
Inlet port
Filtrate port
Inlet port
Flowmeter
Discharge to drain Pressure transmitter
Filtrate tank Backwash pump
Pressure transmitter
UF membrane module
Feed pump Feed water tank
Flowmeter
Filtrate
Univers
ity of
Mala
ya

105
inlet and filtrate ports of the UF membrane module were equipped with pressure
transmitters to determine the TMP during filtration. Filtration duration data was
recorded manually while the feed water turbidity was analyzed using laboratory
turbidity analyzer. The TMP during filtration sequence was recorded every 5 minutes
until 60 minutes was reached. All the experiments with the pilot-scale system were
conducted under dead-end filtration mode with flux rate of 80 L/m2hr. After every
filtration sequence, a hydraulic backwash with 230 L/m2hr of flux rate was initiated to
clean the UF membrane module. These were the same filtration and backwash flux rates
applied on the industrial-scale UF membrane water treatment plant mentioned in the
previous case studies. Each 60 minutes filtration sequence on the pilot-scale UF system
only requires less than 0.5 m3 of feed water volume from the river. It has been reported
that filtration processes of natural surface water were complicated due to the variation
of constituents presence in the water (Delgrange-Vincent et al., 2000).
Laboratory analyses of the feed water and filtrate samples were an essential part of
the data collection in the process modelling. Most water treatment plants utilize in-
house laboratory analysis of their water samples on a daily basis. Turbidity of water
samples are often analyzed instead of the solids concentrations of the samples as it is
much easier and faster to analyze the former. Membrane filtration model utilizing the
Darcy’s law incorporates the solids concentrations of the feed water as part of the
equation (Foley, 2006). The analysis of the solids concentrations of water samples
might require more than 10 hours for an accurate reading in accordance to American
Public Health Association (APHA) analysis method. In order to simplified the
estimation of the water samples solids concentrations, a correlation between turbidity
and solids concentrations of the samples were often established for surface water
catchment area (Rügner et al., 2014).
Univers
ity of
Mala
ya

106
All the relevant data collected through the pilot-scale UF system and laboratory
analysis were compiled digitally to model the filtration process using simulation
software. Initially all the relevant data was organized to develop a hybrid model which
consists of an ANN model and Darcy’s law. Subsequently the simulation results from
the hybrid model were verified against experimental data to validate its accuracy. The
ANN model was utilized to predict filtration parameter known as specific cake
resistance or α. This parameter was then substituted into the theoretical filtration model
using Darcy’s law to determine the feed water solids concentrations or cs. Laboratory
analysis of the feed water solids concentrations data was then utilized to validate the
simulated results. This hybrid model provides estimation of the essential filtration
parameters such as specific cake resistance during filtration and solids concentration of
the feed water. The hybrid model is intended to be used as an alternative estimation
method of these parameters which differs from the conventional method with laborious
experimental studies using specific equipment which is seldom available in an
industrial-scale UF membrane water treatment plant in-house laboratory.
6.3.2 Hybrid modelling procedures
The hybrid model in this study consists of an ANN model and a theoretical first
principle model (Darcy’s law). Under this study, the main intention of developing this
hybrid model is to provide a rapid prediction or estimation method of the filtration
parameters. The estimation of the specific cake resistance (α) during filtration was
achieved by utilizing the ANN predictive model with relevant inputs data. Based on the
estimated values of α from the ANN predictive model, the first principle/conventional
cake filtration model was used to estimate the feed water solids concentrations (cs). The
rational in developing this hybrid model (consisting both ANN and first principle
Univers
ity of
Mala
ya

107
models) was to allow an alternative method of rapidly modelling the membrane
filtration process without the specific analysis equipment which is seldom available at
the in-house laboratory of a typical industrial-scale UF membrane water treatment plant.
Utilizing commonly available on-line and laboratory analysis data (filtration time, TMP
and feed water turbidity) for these filtration parameters estimation is a viable alternative
method as it only requires minimal cost for implementation. It has been reported that
filtration parameters such as α and cs require extensive efforts and time to be determined
experimentally with high accuracy (Boerlage et al., 2000). These two parameters
provide essential information on potential membrane fouling propensity which allows
early warning for water treatment plant operators to take necessary actions. The feed
water characteristics changes are beyond the control of the treatment plant operators and
ensuring minimal or mitigate membrane fouling due to such changes is an important
aspect of the operation.
6.3.2.1 Development of first principle model
The development of a practical filtration model is essential to provide early warning
of potential membrane fouling propensity due to characteristics changes of the feed
water or abnormal operational conditions of the UF system. Besides providing
indication of potential membrane fouling propensity, the model is expected to produce
these information rapidly as feed water characteristics might changes abruptly within
hours. Literature has reported that feed water characteristics is one of the many aspects
that affect the membrane filtration process (Ní Mhurchú & Foley, 2006). The first
principle model based on Darcy’s law is shown in equation (6.1) whereby ∆P is the
TMP, J is the filtrate flux, Rm is the membrane resistance, µ is the filtrate viscosity, m is
the cake mass per unit membrane area and α is the specific cake resistance.
Univers
ity of
Mala
ya

108
= ∆( ) (6.1)
Validity of this first principle or cake filtration model is justified with literature
supports as follow:-
1. The Darcy’s model is relevant to UF membrane filtration process (Zhou et al.,
2015).
2. It is a common used model for process design (Xu et al., 2008).
3. The model takes into account the specific cake resistance of the filtration process
(Park et al., 2006).
4. The model is suitable to represent dead-end filtration (Mendret et al., 2009).
5. The model also takes into consideration changes of feed water characteristics
(Bugge et al., 2012).
The first principle model requires membrane resistance (Rm) to be determined
experimentally prior to the actual filtration process with feed water. A new UF
membrane module was utilized and purified water (m = 0) was filtered through the UF
membrane module. Data of the filtration flux with purified water (Jw), membrane
resistance (Rm) and the respective trans-membrane pressure (∆Pw) were correlated using
Darcy’s law to form equation (6.2). Details of the filtration procedures have been
Univers
ity of
Mala
ya

109
reported in literature (Boerlage et al., 1998; Pellegrin et al., 2015; Roy & De, 2015)
which are commonly utilized to determine Rm with purified water.
= ∆ (6.2)
Specific cake resistance (α) is a filtration parameter which has correlation with
multiple others parameters such as particle size distribution, particle shape, density,
porosity and TMP (Sripui et al., 2011). Since all the experiments in this research were
conducted under dead-end constant flux filtration mode, the power-law developed for
constant pressure filtration (Sripui et al., 2011) was not suitable. Variation of feed water
characteristics and solids concentrations incurred a critical problem to the UF process
which requires attention. Correlation between feed water solids concentrations and filter
cake mass is shown in equation (6.3).
= (6.3)
In equation (6.3), m represents the cake mass per unit membrane area, cs is the feed
water solids concentrations, Vs is the volume of the feed water and A represents the
membrane surface area. This equation indicates that when the surface feed water
characteristics changes due to higher or lower loading of solids concentrations, it would
Univers
ity of
Mala
ya

110
influence the cake mass and ultimately affect the membrane filtration process. Under
the constant flux filtration experiments, assumptions were made that throughout the 60
minutes filtration period the solids concentrations of the feed water samples remain the
same by ensuring constant turbidity. By putting forward such assumption, it was
anticipated that cs was only required to be estimated once during the initial stage of
every filtration sequence for feed water samples with constant turbidity.
It was mentioned earlier in this chapter that feed water turbidity analysis was much
easier and faster to be conducted than its solids concentrations in the laboratories.
Efforts have been made to establish a correlation between the feed water turbidity and
its solids concentrations by using facilities commonly available in a typical water
treatment plant in-house laboratory. Assumptions were made that these correlations
remains valid within the experimental period of 3 months. Analyzing the current feed
water sample turbidity would immediately provide an estimation of the solids
concentrations or cs to solve equation (6.3) and determine m. Both Vs and A were pre-
determined parameters in dead-end constant flux filtration operation mode.
Under normal circumstances, significant increase of TMP for constant flux filtration
is a preliminary warning of potential membrane fouling propensity due to accumulation
of solids on the membrane surface (Huang et al., 2014; Miller et al., 2014). Most
industrial-scale UF membrane water treatment plants operating under dead-end constant
flux filtration operation mode with surface feed water risked of having sudden high
loading of suspended solids during heavy rain which might cause membrane fouling
(Kim & DiGiano, 2009).
Univers
ity of
Mala
ya

111
6.3.2.2 Using ANN model to predict specific cake resistance
An ANN predictive model was utilized to rapidly produce estimation of the specific
cake resistance (α) for the first principle model. Literature has reported that values of α
require laborious experimental works to be determined and it changes very often in
natural water sources (Ní Mhurchú & Foley, 2006). Utilization of the ANN predictive
model allows tremendous savings in cost and efforts to estimate this parameter against
the changing feed water characteristics. A typical industrial-scale UF membrane water
treatment plant is lacked of the necessary equipment and skilled personnel to determine
values of α under the conventional analysis method in their in-house laboratory.
In this research, the estimation of α was achieved by utilizing commonly available
on-line data and simple laboratory analysis results as inputs data to the ANN predictive
model. The utilization of ANN predictive model for estimation of membrane filtration
performance has been reported to be capable of achieving acceptable accuracy (Choi et
al., 2012). It has been reported in literature that feed water turbidity, TMP and filtration
duration affects the potential membrane fouling propensity on dead-end UF processes
(Villacorte et al., 2015). All these relevant parameters were fed as inputs to the ANN
predictive model together with the immediate past value of the estimated specific cake
resistance (αt-1). This is known as dynamic ANN modelling to allow a much more
accurate prediction of the outputs (Gautam & Soh, 2015). Even without any information
concerning organic matter concentrations of the feed water, the ANN model was
reported to be capable of predicting TMP of the UF system with high accuracy
(Delgrange et al., 1998). Figure 6.2 shows the schematic of the ANN predictive model
with the relevant inputs and output.
Univers
ity of
Mala
ya

112
Figure 6.2: Schematic diagram of the ANN predictive model
The hybrid model developed in this research was a combination of the ANN
predictive model and the first principle/cake filtration model. Initially the ANN
predictive model estimates the current value of the specific cake resistance (αt) during
the filtration process by using relevant inputs data including the immediate past value of
the estimated specific cake resistance (αt-1) as shown in Figure 6.2. Subsequently this
parameter (α) was inserted into the cake filtration model to determine the feed water
solids concentrations (cs). The combination of these 2 filtration parameters provides
essential information on the potential membrane fouling propensity based on the
operational conditions and feed water characteristics (Ju & Hong, 2014; Psoch &
Schiewer, 2006). Literature has reported that both of these parameters are challenging to
be precisely determined experimentally in the laboratories (Boerlage et al., 2004). This
hybrid model provides an alternative method to estimate these two parameters without
extensive laboratory analysis. It is essential to simplify the estimation methodology of
these parameters for industrial-scale UF membrane water treatment plants due to
facilities and resources constraint. Under the conventional analysis procedures,
advanced analysis equipment or methods such as liquid chromatography-organic carbon
detection (Chen et al., 2014), SEM (Reingruber et al., 2012), atomic scope microscope
(Lee et al., 2001), ATR-FTIR (Marbelia et al., 2016), EDX (Zuo et al., 2014) or
Output layer
TMP Feed water turbidity
Filtration time ∝t-1 ∝t
Hidden layer
Univers
ity of
Mala
ya

113
fluorescence excitation-emission matrix spectroscopy (Peiris et al., 2013) are required to
detect membrane fouling. Most of the industrial-scale UF membrane water treatment
plants are not equipped with such sophisticated equipment and membrane samples are
normally sent to third party laboratories for further analysis which could takes up a few
weeks to evaluate the results. This hybrid model provides an alternative
prediction/estimation method for the two parameters which allows a more rapid
detection of potential membrane fouling conditions. These conditions could be due to
the feed water characteristic changes or abnormal filtration operation of the water
treatment plants.
6.3.2.3 Details of the hybrid model
In this research work, a hybrid model consisting of the ANN predictive model and
the cake filtration model has been developed to allow rapid estimation of the two
parameters (α and cs) which lead to potential membrane fouling conditions. It was
reported that feed water from natural sources were affected by many non-linear external
factors which changes the water characteristics to a certain extent (Ní Mhurchú &
Foley, 2006). In this hybrid modelling approach, commonly available data from the
water treatment plants (feed water turbidity, filtration duration and TMP) were utilized
as inputs for the parameters estimation. The simplicity of such approach allows a much
easier integration into the water treatment plant monitoring procedures. This hybrid
model was specifically targeted to predict the two parameters for UF systems operating
under dead-end constant flux filtration mode which is the common operation mode for
industrial-scale UF membrane water treatment plants.
In this hybrid model, the ANN predictive model was utilized to predict the specific
cake resistance (α) during filtration. Assumption were made that the feed water
Univers
ity of
Mala
ya

114
characteristics (particularly the solids concentrations of the samples) have negligible
variations in a particular filtration sequence during the experiments. This was
considered a valid assumption since most surface water sources would only have
significant changes of turbidity after a few hours. Estimated values of α shall be
incorporated into the cake filtration model for the estimation of the feed water solids
concentrations. The combination of these two models (ANN and cake filtration) enables
rapid estimation of the parameters (α and cs) which indicates the potential membrane
fouling propensity. Such information allows the necessary precautions to be taken by
the water treatment plant operators to mitigate the possibilities of membrane fouling.
6.4 Results and discussions
Experiments have been conducted using facilities available at the UF membrane
water treatment plant to determine the feed water characteristics (turbidity and solids
concentrations) and membrane resistance (Rm). Subsequently filtration experiments
utilizing the pilot-scale UF system were carried out. All these results were organized for
the ANN predictive model training and simulated using computer software. The
simulated outputs were compared with the experimental results for verification and have
been further elaborated in the following sections.
6.4.1 Determination of membrane resistance, Rm
In order to determine the resistance for this particular UF hollow fibre membrane
module, a graph of ∆Pw against Jw was plotted and shown in Figure 6.3. In equation
(6.1), when purified water (without any solids concentration) was used for the dead-end
constant flux filtration, αm = 0, J = Jw, ∆P = ∆Pw and Rm would be the slope of the
Univers
ity of
Mala
ya

115
graph divided by µ (water viscosity at room temperature) as indicated in equation (6.2).
The data obtained from the filtration experiment using purified water shown in Figure
6.3 have indicated the membrane resistance (Rm) as 1.77 X 10¹² m-1. Data provided by
the UF membrane manufacturer indicated the membrane resistance of their product was
3.60 X 10¹¹ m-1. The discrepancy between the filtration experiment and the
manufacturer’s data occurs mainly because of two reasons. Possible main reason was
because the manufacturer provided data of a single strand of the hollow fibre membrane
resistance while experiments carried out in this work was done using an UF membrane
module which consisted many strands of hollow fibre membrane packed into a module.
The single strand hollow fibre membrane resistance was expected to be much lower
because there was no effect of pressure losses due to hollow fibre networks compared to
the UF membrane module which was packed with many strands of hollow fibre
(Kostoglou & Karabelas, 2008). The second cause for the discrepancy was due to the
hollow fibre geometrical arrangement inside the UF membrane module which causes
various velocity and pressure fields that increase the pressure losses within the module
(Cano et al., 2013). Most of the industrial-scale UF membrane water treatment plants
including the earlier mentioned case studies were utilizing hollow fibre membrane in
pressurized packed modules. It was more appropriate to determine Rm which
incorporated the various pressure losses caused by the module geometry and the hollow
fibre networks which were much higher than a single strand of hollow fibre membrane
resistance. In this research work, Rm refers to the membrane resistance in the UF module
which takes into considerations the additional resistance mentioned earlier. The same
experimental procedures were repeated twice and the values of Rm obtained were
between ±5% from all the experimental data. This indicates a good reproducibility of
the experimental results.
Univers
ity of
Mala
ya

116
R² = 0.9812
0
10
20
30
40
50
60
70
80
15 30 45 60 75 90 105 130 145
∆P
w(k
Pa)
Jw (Liter/m2 hr)
Figure 6.3: UF membrane filtration data with purified water
6.4.2 Filtration data with natural river water
The feed water to the pilot-scale UF system originates from the same river water
source of the previous case studies on the industrial-scale UF membrane water treatment
plant. Hollow fibre UF membrane utilized in the pilot-scale system was similar to the
modified Polyethersulfone (mPES) produced by the same manufacturer of the UF
membrane for the water treatment plant. In order to produce similar filtration condition,
the filtration flux of the pilot-scale system was adjusted to 80 L/m2hr which was the
same filtration flux applied on the industrial- scale system.
River water with turbidity of 96 NTU was collected (typically after a heavy rainfall)
in a few large water containers with total volume about 3 m3 of capacity. Samples water
in these containers were allowed to settle between 1 to 12 hours and the top water layers
from these containers were collected. Within the settling period, some suspended solids
of the river water would have settled down at the bottom of the container producing less
Univers
ity of
Mala
ya

117
30
40
50
60
70
80
90
0 5 10 15 20 25 30 35 40 45 50 55 60
TMP
(kPa
)
Filtration time (min)
Feed water, 96 NTU
Feed water, 52 NTU
Feed water, 25 NTU
Feed water, 12 NTU
Purified water, 0.3 NTU
turbid water on the top layer of the containers. River water samples with various
turbidities of 52 NTU, 25 NTU and 12 NTU were collected for the experiments.
These river water samples (96 NTU, 52 NTU, 25 NTU and 12 NTU) were fed into
the pilot-scale UF system in separate filtration sequences. All the experiments were
conducted under dead-end constant flux filtration mode and the TMP (difference
between the inlet port and filtrate port pressures) profile was recorded for 60 minutes
period for each filtration sequences with different feed water samples. Figure 6.4 shows
the results of the TMP profiles of all the feed water samples and purified water was
utilized as the reference in this filtration test. All the feed water samples except for the
purified water exhibited gradual increase of TMP within the 60 minutes filtration
duration. These results were expected as there were various degrees of suspended solids
concentrations in each feed water samples which had accumulated on the membrane
surface and increased the filtration resistance. Filtration sequence of the sample with the
highest turbidity (96 NTU) indicated the fastest increase of TMP primarily because of
the higher concentration of suspended solids in the sample.
Figure 6.4: Filtration TMP profiles of feed water samples
Univers
ity of
Mala
ya

118
It was reported in literature that a correlation between log of turbidity and filtration
flux of some natural surface water could be established (Shengji et al., 2008). Although
it might be applied in some locations, the mathematical correlation might differ for
some other sources. The feed water samples obtained in this study have very little
variation of pH which normally falls between 6.5 and 7.5 and assumptions were made
that the pH values of the water samples do not have significant effect on the filtration
mechanism.
6.4.3 Analysis to establish correlation of the feed water parameters
A correlation between the feed water turbidity and its solids concentrations was
established with laboratory analysis. It has been reported that a simple correlation
between turbidity and solids concentrations of natural surface water could be
determined experimentally (Solak et al., 2009; Yahyapour et al., 2014). A detailed study
of the River Neckar in Germany conducted by other researchers haven shown the ratio
of solids concentrations/turbidity was between 1.5 – 1.9 mgL-1NTU-1 (Rügner et al.,
2014). The analysis of many feed water samples from the river source to the UF
membrane water treatment plant collected during the year 2015 were shown in Figure
6.5.
Univers
ity of
Mala
ya

119
Figure 6.5: Analysis results of river water solids concentrations against turbidity
The results in Figure 6.5 indicated an almost linear correlation between river water
total suspended solids (TSS) concentrations and its turbidity. Ratio of the TSS
concentrations/turbidity from Figure 6.5 indicated 1.6 mgL-1NTU-1 which falls within
the range of 1.5 – 1.9 mgL-1NTU -1 reported in literature (Rügner et al., 2014). Such
TSS concentrations/turbidity correlation might differ from time to time when the river
water characteristics changes due to natural causes or man-made activities. It is
necessary to update the data from recent laboratory analysis results to re-establish the
correlation to ensure its accuracy (Rügner et al., 2014). The correlation of the data
obtained through analysis could be further utilized to derive the cake mass per unit
membrane area (m) indicated in equation (6.3). Analysis of the feed water turbidity
allows the solids concentrations of the feed water (cs) to be estimated from the
correlation established in Figure 6.5. Since all the experiments were conducted under
dead-end constant flux filtration mode both Vs and A could be derived by knowing the
total membrane surface area in the module (6 m2) and the filtration flux (80 L/m2hr).
R² = 0.9878
0
20
40
60
80
100
120
140
160
180
200
220
0 10 20 30 40 50 60 70 80 90 100 110 120 130
Solid
s con
cent
ratio
n (m
g/L)
River water turbidity (NTU)
Univers
ity of
Mala
ya

120
0.0
0.5
1.0
1.5
2.0
2.5
3.0
5 10 15 20 25 30 35 40 45 50 55 60
α(m
/kg)
Filtration time (min)
Feed water, 96 NTU
Feed water, 52 NTU
Feed water, 25 NTU
Feed water, 12 NTU
6.4.4 Estimation of specific cake resistance with Darcy’s law
All the relevant data in Figure 6.5 were utilized for the estimation of m using
equation (6.3). Subsequently the data of α was determined with Darcy’s law in
equation (6.1) as shown in Figure 6.6. It was mentioned earlier that α is dependence on
the feed water characteristics besides turbidity which complicates the experimental
analysis of this parameter. In this research, data of α from the ANN predictive model
enables rapid estimation of this parameter with simple laboratory analysis. Only feed
water solids concentration and its turbidity analyses were required to establish the TSS
concentrations/turbidity correlation. When a significant feed water TSS
concentrations/turbidity correlation changes was observed, more recent data might be
required to re-train the ANN predictive model.
Figure 6.6: Estimated specific cake resistance based on Darcy’s law
X 1015
Univers
ity of
Mala
ya
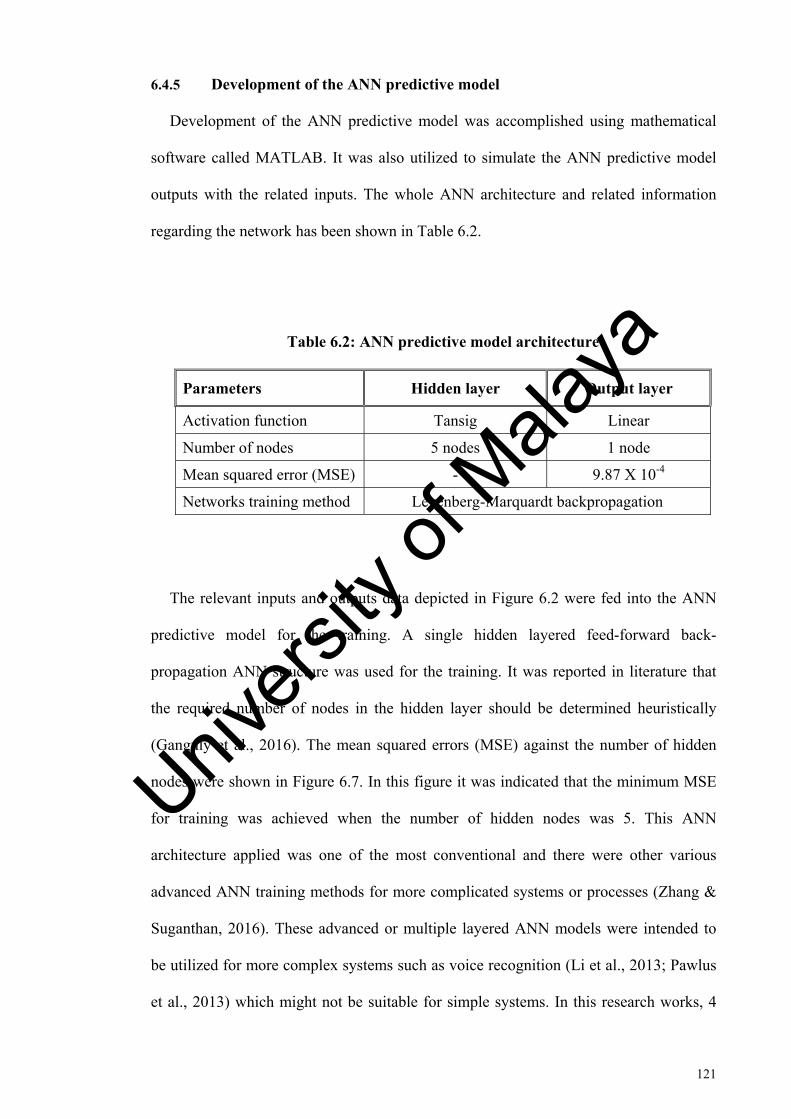
121
6.4.5 Development of the ANN predictive model
Development of the ANN predictive model was accomplished using mathematical
software called MATLAB. It was also utilized to simulate the ANN predictive model
outputs with the related inputs. The whole ANN architecture and related information
regarding the network has been shown in Table 6.2.
Table 6.2: ANN predictive model architecture
Parameters Hidden layer Output layer
Activation function Tansig Linear
Number of nodes 5 nodes 1 node
Mean squared error (MSE) - 9.87 X 10⁻⁴
Networks training method Levenberg-Marquardt backpropagation
The relevant inputs and outputs data depicted in Figure 6.2 were fed into the ANN
predictive model for the training. A single hidden layered feed-forward back-
propagation ANN structure was used for the training. It was reported in literature that
the required number of nodes in the hidden layer should be determined heuristically
(Ganguly et al., 2016). The mean squared errors (MSE) against the number of hidden
nodes were shown in Figure 6.7. In this figure it was indicated that the minimum MSE
for training was achieved when the number of hidden nodes was 5. This ANN
architecture applied was one of the most conventional and there were other various
advanced ANN training methods for more complicated systems or processes (Zhang &
Suganthan, 2016). These advanced or multiple layered ANN models were intended to
be utilized for more complex systems such as voice recognition (Li et al., 2013; Pawlus
et al., 2013) which might not be suitable for simple systems. In this research works, 4
Univers
ity of
Mala
ya

122
sets of TMP profiles with various feed water turbidity (96 NTU, 52 NTU, 25 NTU and
12 NTU) were utilized for the ANN training. The quality and relevance of the training
data was much more important than the quantity of the data. A total of 52 data points
were used and all of the data have been selected based on the relevant impact to the
desired outputs. This is because the ANN estimated output accuracy is strongly related
to the data used during the training process (Sun et al., 2014). The training data covers
the most possible operation conditions of the UF system under this research. Figure 6.7
indicates the MSE of using 5 hidden nodes was 9.87 X 10⁻⁴ which was the lowest
among all the tested number of hidden nodes. Parity plots results indicated the
coefficient of determination or R2 values of above 0.90 between the actual and predicted
data by the ANN predictive model in both the training and validation data sets.
Figure 6.7: MSE of various numbers of hidden nodes during ANN training
Under normal circumstances, the industrial-scale UF membrane water treatment
plant in the case studies mentioned earlier should be treating feed water with turbidity of
20 NTU or below as per the design requirements. Unfortunately during heavy rainfalls,
the feed water could sometimes abruptly exceed this turbidity limit but nevertheless
0
0.01
0.02
0.03
0.04
0.05
0.06
0.07
1 2 3 4 5 6 7 8 9 10
Mea
n sq
uare
d er
ror (
MSE
)
Numbers of hidden nodes for ANNUnivers
ity of
Mala
ya

123
0.0
0.5
1.0
1.5
2.0
2.5
3.0
5 10 15 20 25 30 35 40 45 50 55 60
α(m
/kg)
Filtration time (min)
Experimental results for 10 NTUSimulation results for 10 NTUExperimental results for 20 NTUSimulation results for 20 NTU
X 1015
most of the daily average feed water turbidity was only between 10 – 15 NTU. In this
research, emphasis was made to cover the most probable and common range of feed
water turbidity which was between 10 – 20 NTU. Figure 6.8 shows the simulated results
against the experimental analysis for feed water samples of 10 NTU and 20 NTU
respectively. The ANN predictive model results were simulated using computer
software while the experimental results were obtained using the pilot-scale UF system
shown in Figure 6.1.
Figure 6.8: Simulation and experimental results of the specific cake resistance
Simulation results indicated in Figure 6.8 displayed close agreement against the
laboratory experimental analysis. Initially the values of α were decreasing (the first 20
minutes) and subsequently stabilized into constant values against filtration duration.
When feed water samples consisting of the suspended solids were introduced onto the
Univers
ity of
Mala
ya

124
membrane surface, a solids cake layer starts to form. After certain duration the values of
α gradually stabilized or in a stage known as cake consolidation which very little
changes of α was noticed. Further filtration or accumulation of solids after the cake
consolidation stage would increases the values of α which have been reported in
literature (Sioutopoulos & Karabelas, 2016). Significant increase of α after the cake
consolidation stage is a less desirable condition as the potential membrane fouling
propensity would also increases.
6.4.6 Validating the hybrid model with experimental results
Estimated values of α obtained through computer software simulation of the ANN
predictive model shown in Figure 6.8 was fed into the first principle/cake filtration
model to determine the average values of the feed water solids concentrations (cs). The
results have been tabulated in Table 6.3.
Table 6.3: Hybrid model simulation and laboratory analysis results
Time (min)
Actual TMP (kPa)
Simulated, α (X 1015 m/kg )
Simulated, cs (kg/m3 )
10 NTU 20 NTU 10 NTU 20 NTU 10 NTU 20 NTU 5 40 41 1.44 1.30 0.026 0.029 10 42 42 1.10 0.83 0.017 0.027 15 43 42 0.95 0.59 0.019 0.030 20 45 43 0.86 0.46 0.018 0.029 25 47 46 0.81 0.40 0.019 0.030 30 48 48 0.79 0.38 0.019 0.036 35 49 50 0.78 0.38 0.018 0.037 40 51 52 0.78 0.38 0.017 0.037 45 53 54 0.77 0.39 0.017 0.037 50 54 55 0.77 0.44 0.018 0.033 55 56 56 0.77 0.46 0.017 0.030 60 57 57 0.78 0.48 0.017 0.029
Average simulated results 0.019 0.032 Laboratory analysis results 0.018 0.031
Univers
ity of
Mala
ya
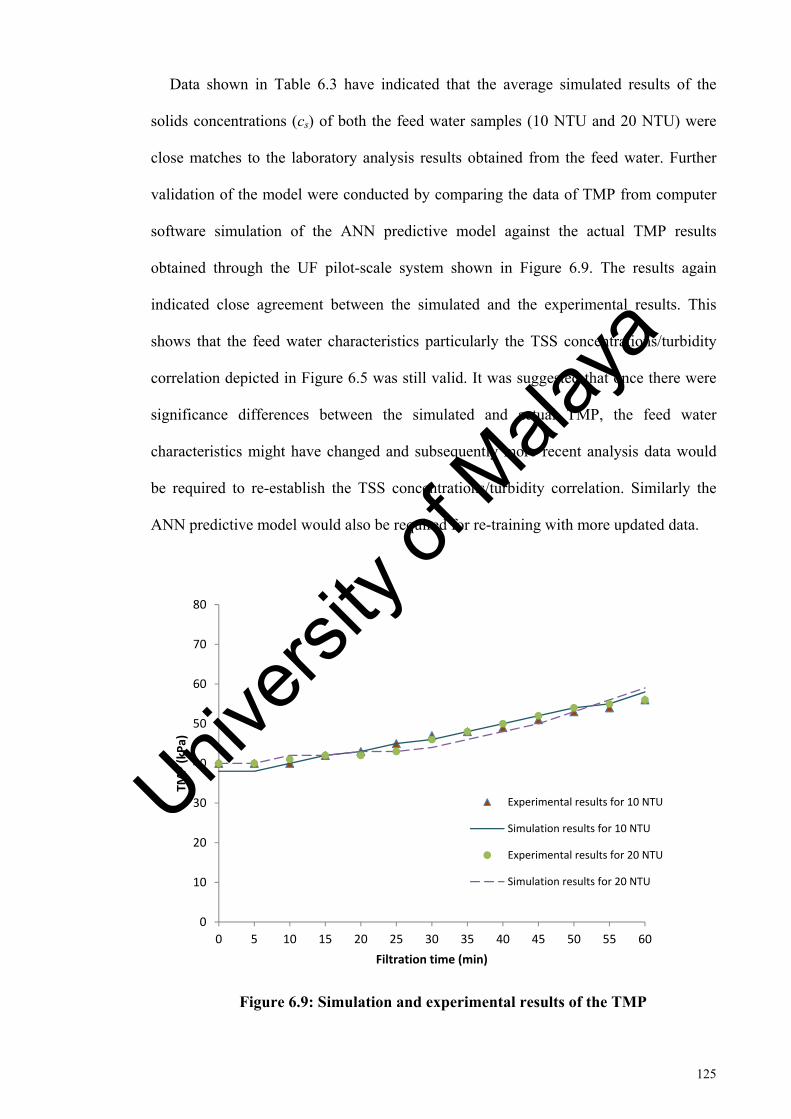
125
0
10
20
30
40
50
60
70
80
0 5 10 15 20 25 30 35 40 45 50 55 60
TMP
(kPa
)
Filtration time (min)
Experimental results for 10 NTU
Simulation results for 10 NTU
Experimental results for 20 NTU
Simulation results for 20 NTU
Data shown in Table 6.3 have indicated that the average simulated results of the
solids concentrations (cs) of both the feed water samples (10 NTU and 20 NTU) were
close matches to the laboratory analysis results obtained from the feed water. Further
validation of the model were conducted by comparing the data of TMP from computer
software simulation of the ANN predictive model against the actual TMP results
obtained through the UF pilot-scale system shown in Figure 6.9. The results again
indicated close agreement between the simulated and the experimental results. This
shows that the feed water characteristics particularly the TSS concentrations/turbidity
correlation depicted in Figure 6.5 was still valid. It was suggested that once there were
significance differences between the simulated and actual TMP, the feed water
characteristics might have changed and subsequently more recent analysis data would
be required to re-establish the TSS concentrations/turbidity correlation. Similarly the
ANN predictive model would also be required for re-training with more updated data.
Figure 6.9: Simulation and experimental results of the TMP
Univers
ity of
Mala
ya

126
In order to further examine the validity of this hybrid model on other system, data
of suspended solids concentrations of feed solutions (cs,data), TMP (TMPdata) and its
specific cake resistance (αdata) from literature (Sripui et al., 2011) were fed into the
hybrid model. These data were obtained from rice wine suspension filtered through
microfiltration membrane under dead-end operation. Table 6.4 indicates the literature
data (αdata, cs,data and TMPdata) and the calculated membrane resistance (Rm,cal) obtained
by using the hybrid model.
Table 6.4: Calculated values of membrane resistance (Rm,cal) and data from
literature
αdata (m/kg) cs,data (kg/m3) TMPdata (kPa) Rm,cal (m-1)
50 X 1010 2.0 1.52 X 10³ 7.7 X 10¹³
45 X 1010 1.0 1.36 X 10³ 6.9 X 10¹³
40 X 1010 0.5 1.21 X 10³ 6.1 X 10¹³
Data from Table 6.4 shows Rm,cal as the calculated values of the microfiltration
membrane resistance using equation (6.1) and (6.3) from the hybrid model. These
calculated Rm,data indicated almost a consistent value of 6.9 X 10¹³ m-1 ± 12% which is
in accordance to Darcy’s law.
6.4.7 Sensitivity analysis of the hybrid model
The main purpose of conducting sensitivity analysis is to compare different inputs or
parameters on a specific process model for evaluation (Amidpour et al., 2015). Even
though all the inputs/parameters to the ANN predictive model were necessary and
important, some have higher weightages than others on the estimated outputs. The
Univers
ity of
Mala
ya

127
0.00.20.40.60.81.01.21.41.61.8
0.010 0.020 0.030 0.040
αdu
ring
filtr
atio
n (m
/kg)
cs (kg/m3)
Simulation results for 10 NTUSimulation results for 20 NTU
X 1015
0.00.20.40.60.81.01.21.41.61.8
35 45 55 65
αdu
ring
filtr
atio
n (m
/kg)
TMP (kPa)
Simulation results for 10 NTU
Simulation results for 20 NTU
X 1015
R² = 0.7604
0.0
0.2
0.4
0.6
0.8
1.0
1.2
0 10 20 30 40 50 60
Ulti
mat
e va
lues
ofα
(m/k
g)
Feed water turbidity (NTU)
X 1015
variations of these inputs/parameters were plotted against the ANN outputs (α) to
determine any relevant or observable patterns. Three inputs/parameters selected for the
sensitivity analyses were feed water solids concentrations (cs), TMP during filtration
sequence and feed water turbidity. In the sensitivity analysis, only one input/parameter
was varied while the other inputs/parameters remain. Figure 6.10 shows the sensitivity
analyses results of various inputs/parameters against the outputs of the ANN predictive
model (α).
Figure 6.10 (a) α against cs Figure 6.10 (b) α against TMP (during filtration) (during filtration)
Figure 6.10 (c) α against feed water turbidity (end of filtration)
Figure 6.10: Sensitivity analyses of the ANN predictive model outputs
Univers
ity of
Mala
ya

128
Figure 6.10 (c) indicated that there was a strong correlation between feed water
turbidity and ultimate values of α at the end of the filtration sequences for the samples.
This might be caused by the fact that all the feed water samples were obtained from the
same river source at similar time with the only major differences in turbidity and solids
concentrations. It was suggested that the main parameters which affects α such as
particle shape, particle size distribution, porosity and density of the suspended solids
(Sripui et al., 2011) in the feed water samples were of same characteristics. Literature
has reported similar linear correlation in membrane filtration for α and solids
concentrations of the feed solutions (Sripui et al., 2011). Therefore it was essential to
ensure the TSS concentrations/turbidity correlation remains relevant to the current
filtration process and feed water characteristics. It has been suggested in literature that
the product of αcs is also known as fouling index which was commonly utilized to
indicate potential membrane fouling propensity (Boerlage et al., 2004; Boerlage et al.,
2003; Boerlage et al., 2000; Boerlage et al., 1998).
Another parameter which exhibited some degree of correlation with α was the TMP
during filtration shown in Figure 6.10 (b). The values of α decrease against TMP during
initial filtration and ultimately stabilized to almost a constant value at the end. Finally
the values of cs and α during filtration exhibited the most minimal correlation shown in
Figure 6.10 (a). This has also been reported in literature whereby it was found that α
was primarily affected by particle size distribution and particle shape which were not
only subjected to the solids concentrations alone (Bourcier et al., 2016).
Univers
ity of
Mala
ya

129
6.5 Applying the hybrid model in UF membrane water treatment plant
As mentioned earlier in this chapter, the main purpose of the hybrid model
development was to allow rapid estimation of the parameters associated with potential
membrane fouling propensity for UF system operating under dead-end constant flux
filtration mode. This estimation method is required to be aligned with the commonly
available facilities in a typical industrial-scale UF membrane water treatment plant.
These facilities include laboratory turbidity analyzer, on-line pressure transmitters (to
record TMP), digital timer (to record filtration duration) and other simple laboratory
equipment to analyze feed water solids concentrations. The two estimated parameters (α
and cs) from this hybrid model were reported to have a direct impact on the potential
membrane fouling propensity (Ju & Hong, 2014). Validation of this hybrid model could
be further substantiated on an industrial-scale UF membrane water treatment plant with
much higher membrane surface area than the pilot-scale system. In this research, the
feed water samples originates from the same river water source to the industrial-scale
UF membrane water treatment plant described earlier in the case studies. Results
obtained in this research works with the pilot-scale UF system paves the way for a much
more extensive plant-trial of the hybrid model for future studies.
One of the most significant differences between this hybrid model and other
conventional models (Lee et al., 2001; Mahdi & Holdich, 2013; Zhou et al., 2015) is the
simplified method of parameters estimation with commonly available facilities in water
treatment plants. It eliminates the use of advanced analysis equipment which is seldom
available at the in-house laboratories of typical water treatment plants. It was reported
that utilization of hybrid models are complementary modelling methods leveraging on
both the advantages of theoretical and black-box models. (Meroney, 2016; Xiaoyi et al.,
2016). The hybrid model developed in this research combined both the first
principle/cake filtration model (theoretical) and the ANN predictive model (black-box)
Univers
ity of
Mala
ya

130
to yield a more comprehensive and rapid estimation method of the two filtration
parameters (α and cs).
It was also reported in literature that a properly trained conventional feed-forward
ANN model could provide better accuracy than regression model (Chithra et al., 2016;
Ghosh et al., 2016). It has been assumed that this hybrid model accuracy was not as
high as other theoretical models reported in literature (Carbonell-Alcaina et al., 2016;
Kostoglou & Karabelas, 2016; Vinther & Jönsson, 2016) but nevertheless this hybrid
model provides an early warning of potential membrane fouling conditions. It is
intended to be implemented on industrial-scale UF membrane water treatment plant
with its existing facilities as part of their monitoring procedures.
One of the main challenges of this hybrid model is the characteristic changes of the
natural river water source. It is important to ensure the TSS concentrations/turbidity
correlation is updated regularly to reflect the latest feed water characteristics. It is not
practical to analyze the feed water solids concentrations a few times a day as it involves
lots of effort and very time consuming (Pavanelli & Bigi, 2005). A weekly updated
database of the feed water TSS concentrations/turbidity correlation is highly
recommended to facilitate the efficient implementation of the hybrid model. Any
significant changes of feed water characteristics could then be observed and re-training
of the ANN predictive model should be conducted if necessary.
There were certain limitations of this hybrid model which require further attentions.
Firstly, any irreversible fouling of the UF membrane was not taken into consideration in
this hybrid model. Moderate irreversible membrane fouling causes much higher
increase of the on-line TMP during filtration which might be significantly different than
the simulated TMP profile from the hybrid model. The discrepancy of the TMP profiles
(simulated and on-line) served as an indication that new data gathering is required to re-
train the ANN model again. It was assumed that after each filtration sequence, a
Univers
ity of
Mala
ya

131
hydraulic backwash sequence would clean or dislodge all foulant from the membrane
surface. Under actual operational conditions, an irreversible fouling layer would be
formed after prolong period of continuous operation usually within a few months. It is a
complicated process to predict the rate of membrane fouling due to various different
operating conditions of the system (Liu et al., 2009). This hybrid model provides an
estimation tools to present information of any potential membrane fouling conditions. It
was suggested that ANN models could also be utilized as process controller to mitigate
the membrane fouling process by allowing more efficient filtration and backwash
sequences which have been reported in literature (Li & Li, 2016; Moon & Jung, 2016).
It should be emphasized that the hybrid model developed in this research was
intended as an alternative method of estimating α and cs. Fundamental theoretical
models was scientifically proven with much higher accuracy to represent the filtration
process. Nevertheless to accommodate the requirements and limited resources available
in an industrial-scale UF membrane water treatment plant, the hybrid model might be a
useful tool for early detection of potential membrane fouling conditions. Table 6.5
highlighted the comparisons of the hybrid model developed in this research against the
conventional/theoretical filtration model.
Univers
ity of
Mala
ya
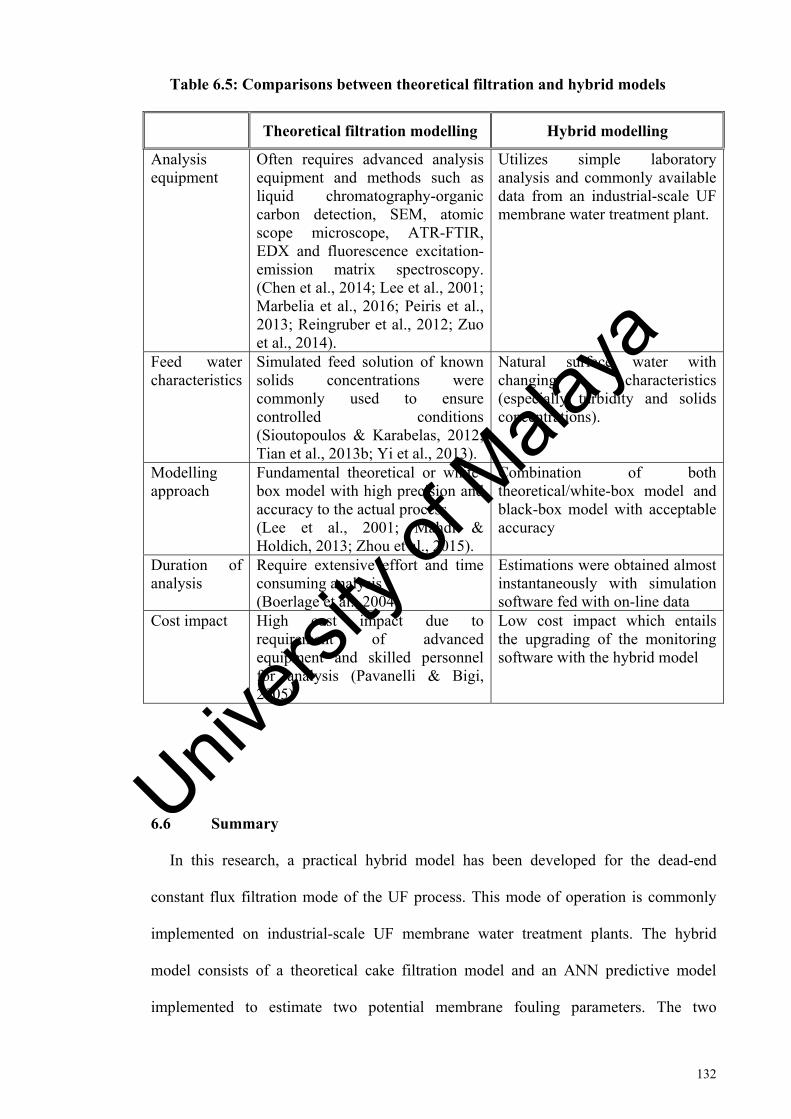
132
Table 6.5: Comparisons between theoretical filtration and hybrid models
Theoretical filtration modelling Hybrid modelling
Analysis equipment
Often requires advanced analysis equipment and methods such as liquid chromatography-organic carbon detection, SEM, atomic scope microscope, ATR-FTIR, EDX and fluorescence excitation-emission matrix spectroscopy. (Chen et al., 2014; Lee et al., 2001; Marbelia et al., 2016; Peiris et al., 2013; Reingruber et al., 2012; Zuo et al., 2014).
Utilizes simple laboratory analysis and commonly available data from an industrial-scale UF membrane water treatment plant.
Feed water characteristics
Simulated feed solution of known solids concentrations were commonly used to ensure controlled conditions (Sioutopoulos & Karabelas, 2012; Tian et al., 2013b; Yi et al., 2013).
Natural surface water with changing characteristics (especially turbidity and solids concentrations).
Modelling approach
Fundamental theoretical or white-box model with high precision and accuracy to the actual process (Lee et al., 2001; Mahdi & Holdich, 2013; Zhou et al., 2015).
Combination of both theoretical/white-box model and black-box model with acceptable accuracy
Duration of analysis
Require extensive effort and time consuming analysis (Boerlage et al., 2004)
Estimations were obtained almost instantaneously with simulation software fed with on-line data
Cost impact High cost impact due to requirement of advanced equipment and skilled personnel for analysis (Pavanelli & Bigi, 2005)
Low cost impact which entails the upgrading of the monitoring software with the hybrid model
6.6 Summary
In this research, a practical hybrid model has been developed for the dead-end
constant flux filtration mode of the UF process. This mode of operation is commonly
implemented on industrial-scale UF membrane water treatment plants. The hybrid
model consists of a theoretical cake filtration model and an ANN predictive model
implemented to estimate two potential membrane fouling parameters. The two
Univers
ity of
Mala
ya

133
parameters predicted in this research were feed water solids concentration (cs) and
specific cake resistance (α). Experimental data from the UF pilot-scale system and
laboratory analysis of the feed water characteristics were utilized to train and validate
the ANN predictive model. Simulation results of the hybrid model have indicated close
agreement with the experimental results for feed water samples of 10 NTU and 20 NTU
respectively. The two parameters estimated from this hybrid model provides early
warning of potential membrane fouling conditions due to changes of feed water
characteristics. Significant differences between the simulated TMP from the hybrid
model and the actual on-line TMP during filtration would indicate changes of the feed
water characteristics which require further attention. The hybrid model could be re-
trained with more updated data of the feed water characteristics for more accurate
prediction of the parameters. Sensitivity analysis conducted on the hybrid model shows
a strong correlation between feed water turbidity and the ultimate values of α. This
hybrid modelling approach is an alternative method to detect potential membrane
fouling conditions in UF membrane water treatment systems. The hybrid model utilized
commonly available on-line data and simple laboratory analysis for the estimation of the
two parameters without requiring advanced analysis facilities which are commonly not
available at the in-house laboratories of water treatment plants.
Univers
ity of
Mala
ya
134
CHAPTER 7:
ARTIFICIAL NEURAL NETWORKS CONTROL FOR ULTRAFILTRATION
MEMBRANE WATER TREATMENT SYSTEM
Ensuring efficient operation of the ultrafiltration membrane water treatment system
through process control is an essential design. The dead-end membrane filtration
process consists of two important sequences known as filtration and backwash.
Implementing efficient process control on both sequences alleviate the potential
membrane fouling propensity while ensuring the required productivities are achieved.
An efficient control system also leads to the reduction of water losses through
intermittent backwash of the dead-end membrane filtration process. Although the
conventional set-points control is widely implemented in the industrial-scale UF
membrane water treatment plant automation system, it has its limitations. An alternative
process control system utilizing ANN model and controllers has the potential to
overcome such limitations.
7.1 Introduction
Fluctuations of the natural feed water characteristics pose huge challenges to the
operation of industrial-scale UF membrane water treatment plants. In order to ensure
continuous automated operation, the conventional set-points control system is often
applied on the maximum limits of TMP, filtration and backwash durations of the dead-
end membrane filtration process. In this chapter, an alternative process control system
utilizing ANN model and controllers has been developed and implemented on-line with
an UF experimental system. This alternative process control has been utilized on the
Univers
ity of
Mala
ya

135
dead-end constant flux UF membrane system to ensure reduction of water losses within
acceptable potential membrane fouling propensity of the system.
7.2 Background
Rapid industrial development and continuous increase of human population has
caused enormous consumption of clean water supply especially in high density urban
areas (Goh et al., 2016). In order to fulfill the ever increasing demand for clean water
supply, countries in the Middle East region have constructed many industrial-scale
membrane water treatment plants to satisfy their nation’s needs (Amy et al., 2017). The
advantages and sustainability of membrane systems are exhibited through their
adaptability, flexibility, lower environmental impacts and minimal foot print necessity
(Le & Nunes, 2016). UF membrane systems are capable of producing consistent filtrate
quality which is free from particles, bacteria and viruses to achieve potable/drinking
water standards (Monnot et al., 2016). Most industrial-scale UF membrane water
treatment plants are operating under dead-end filtration mode with constant flux rate.
This operation mode consists of filtration and intermittent backwash sequences to
significantly reduces energy utilization compared to cross-flow filtration operation
mode (Massé et al., 2011). Majority of the UF membrane water treatment plants utilize
polymeric membranes such as Polivinylidene fluoride (PVDF) or Polyethersulfone
(PES) due to their lower cost of production and acceptable quality (Hög et al., 2015).
Additives could be added in PES membrane to modify or enhance its hydrophilicity and
reduces membrane fouling issues (Vatsha et al., 2014).
One of the most critical and common problems with membrane systems are the
fouling issues (Guo et al., 2012). Efforts to mitigate membrane fouling include various
recommended methods such as physical membrane cleaning, membrane surface
Univers
ity of
Mala
ya

136
modification and hydrodynamic flushing to dislodge and remove attached solids/foulant
on the membrane surface and pores (Shamsuddin et al., 2015). The main purpose of
membrane cleaning is to establish a set of procedures to dislodge non-integral
substances or solids known as foulant from the membrane (Porcelli & Judd, 2010).
Hydraulic backwash is a common physical membrane cleaning method applied to
mitigate or reduce the irreversible fouling of membrane (Chang et al., 2015). Under the
dead-end filtration mode, after each filtration sequence an intermittent backwash is
initiated as physical membrane cleaning to recover the membrane permeability before
the next filtration sequence commences (Mendret et al., 2009). Preventive procedures
such as optimization of the membrane systems operational condition could mitigate and
reduce possibilities of irreversible membrane fouling (Shi et al., 2014). During the
filtration sequence, foulant or solids are accumulated on the membrane side where the
feed water is pressurized. A layer of solids/foulant known as cake would be formed and
increases the resistance of the liquid moving across the membrane. After a specific
duration, the filtration sequence ceases and clean water is introduced from reverse
direction of the UF membrane in the backwash sequence. It is a common practice to use
higher flux rate during backwash to exert the required hydraulic force and dislodge the
foulant. The pore size of the UF membrane segregates the larger solid particles, bacteria
and viruses from contaminating the filtrate under the cake filtration model. During
backwash, this cake layer is hydraulically pressurized from the reverse side of the
membrane with clean water to remove these foulant from the membrane. Figure 7.1
illustrate the filtration and backwash sequences of a typical dead-end UF process.
Univers
ity of
Mala
ya

137
Figure 7.1 (a) Filtration sequence Figure 7.1 (b) Backwash sequence
Figure 7.1: Filtration and backwash sequences for dead-end UF process
Common feed water sources to industrial-scale water treatment plants originate from
natural surface water which is deemed suitable for the treatment processes (Davies &
Mazumder, 2003). These natural water sources contain a variety of organic matters
which constitute major foulant on the UF membranes that reduces its permeability
(Shang et al., 2015). The two most important components which requires attention in
UF systems are operational condition and feed water characteristics (Decarolis et al.,
2001). It was reported in literature that any composition or characteristic changes of the
feed water would causes significant impact on the membrane fouling potential (Massé et
al., 2015). Under normal circumstances, industrial-scale water treatment plant operators
would monitor and analyze the feed water turbidity and pH periodically or on-line to
determine possibilities of feed water characteristics fluctuations. In the membrane
filtration process, specific cake resistance or α is considered an important parameter for
Feed water
Backwash
UF membrane UF membrane
Filtrate
To drain
Univers
ity of
Mala
ya
138
estimation of potential membrane fouling propensity (Sioutopoulos & Karabelas, 2016).
This parameter is generally not measured or analyzed in the industrial-scale UF
membrane water treatment plant’s own in-house laboratory due to the lack of equipment
and skilled personnel.
The Darcy’s equation or model is commonly utilized to represent the resistance
caused by the formation of foulant cake layer in the dead-end filtration mode
(Sioutopoulos & Karabelas, 2015). In this theoretical model, specific cake resistance
during filtration and the solids concentrations of the feed solutions are taken into
considerations. Any significant characteristics changes of the feed water would have
noticeable impact on the filtration process. Natural surface water which is the main
source of feed water to industrial-scale UF systems is known to have fluctuating
characteristics due to weather conditions and man-made activities. Industrial-scale UF
membrane water treatment plants operating under dead-end constant flux filtration
mode encounter issues such as increasing TMP during filtration due to accumulation of
solids/foulant as cake layer which originates from the feed water (Iritani et al., 2015).
The increased of feed water pressure to maintain constant flux is undesirable as more
energy is utilized to produce the same amount of filtrate.
Industrial-scale UF membrane water treatment plants operating under the dead-end
constant flux filtration mode commonly implements the conventional set-points control
system. This system pre-determined the filtration timer and maximum allowable TMP
set-points in the filtration sequence as well as a backwash timer in the backwash
sequence (Cogan & Chellam, 2014). The conventional set-points control is programmed
into programmable logic controllers (PLC) to execute the automation of the processes
(Alphonsus & Abdullah, 2016). Common hardware involved in the UF processes are
control valves, pumps and pressure transmitters. Figure 7.2 shows the typical schematic
diagram of the conventional set-points control for the UF process in dead-end operation
Univers
ity of
Mala
ya
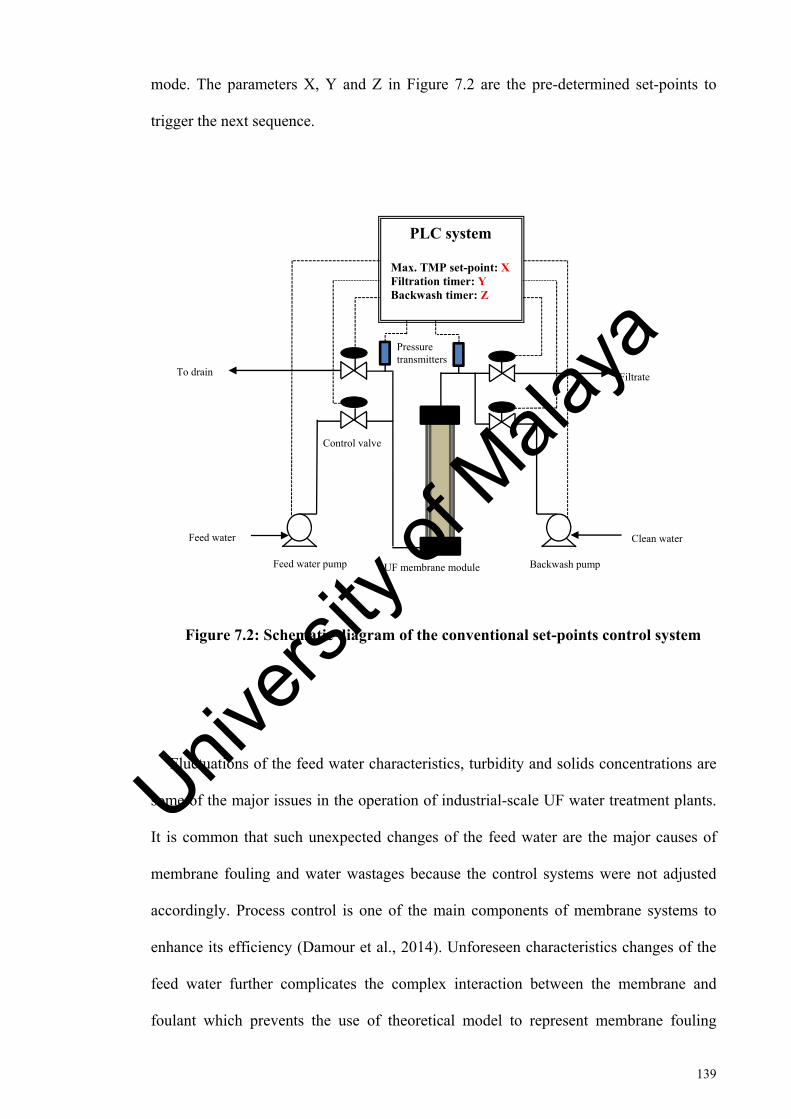
139
mode. The parameters X, Y and Z in Figure 7.2 are the pre-determined set-points to
trigger the next sequence.
Figure 7.2: Schematic diagram of the conventional set-points control system
Fluctuations of the feed water characteristics, turbidity and solids concentrations are
some of the major issues in the operation of industrial-scale UF water treatment plants.
It is common that such unexpected changes of the feed water are the major causes of
membrane fouling and water wastages because the control systems were not adjusted
accordingly. Process control is one of the main components of membrane systems to
enhance its efficiency (Damour et al., 2014). Unforeseen characteristics changes of the
feed water further complicates the complex interaction between the membrane and
foulant which prevents the use of theoretical model to represent membrane fouling
Control valve
Pressure transmitters
UF membrane module Feed water pump Backwash pump
Filtrate
PLC system
Max. TMP set-point: X Filtration timer: Y Backwash timer: Z
To drain
Feed water Clean water
Univers
ity of
Mala
ya

140
processes (Shetty & Chellam, 2003). Under such undesirable conditions, ANN could be
utilized as an alternative black-box model to represent these processes (Shetty et al.,
2003).
Reduction of water losses and mitigation of membrane fouling are essential process
control for membrane filtration to ensure sustainability of the systems. Under the
conventional control of dead-end membrane filtration operation mode, a fixed duration
of intermittent backwash at specific flowrate is introduced at the end of each filtration
sequence (Remize et al., 2010). Literature has reported the utilization of Aluminium-
based coagulant as a significantly effective control procedure to enhance coagulation of
organic matters and reduces UF membrane fouling (Yan et al., 2017). Utilization of
coagulation and pulsed short-wavelength ultraviolet light is another advanced method to
reduce micro-organism from fouling the membrane (Yu et al., 2016). Theoretical
optimized dosing of coagulant in membrane system was also used to control membrane
fouling (Gao et al., 2017). Under this approach, an on-line self-adaptive cycle-to-cycle
coagulant dosing control system has been found to be very robust in performing the
task. The main components of all these highlighted methods mentioned earlier require
the control of coagulant dosage or advanced equipment utilization which incurred
significant cost. Direct feed UF membrane water treatment plants do not require any
coagulant to produce potable/drinking water from low turbidity natural surface water
with substantially lower operational cost. The utilization of common laboratory analysis
and on-line data for process control of such treatment plants to minimize water losses
and mitigate membrane fouling are seldom reported in literature. In this work, an ANN
control system has been developed and compared with the efficiency of a conventional
set-points control system to reduce water losses for the direct feed UF membrane water
treatment system.
Univers
ity of
Mala
ya

141
7.3 Methodology
An UF membrane experimental system was designed to implement real-time process
control and monitoring under dead-end constant flux filtration mode. UF membrane
module model Dizzer P 2521-1.0 manufactured by Inge GmbH, Germany was utilized
in this system. The UF membrane module consists of 1.0 m2 of hollow fibre membrane
surface area made from modified PES (mPES) material. This UF experimental system
was utilized to obtain the necessary filtration data such as TMP profiles, filtration and
backwash durations. Figure 7.3 shows the actual UF experimental system completes
with the supervisory control and data acquisition (SCADA) software linked to a laptop
computer.
Figure 7.3: UF experimental system equipped with laptop computer control
The UF experimental system was equipped with pressure transmitters to record the
TMP profiles in real-time during operation. Another important component of the system
was the final control elements which consist of four units of control valves and two
Univers
ity of
Mala
ya
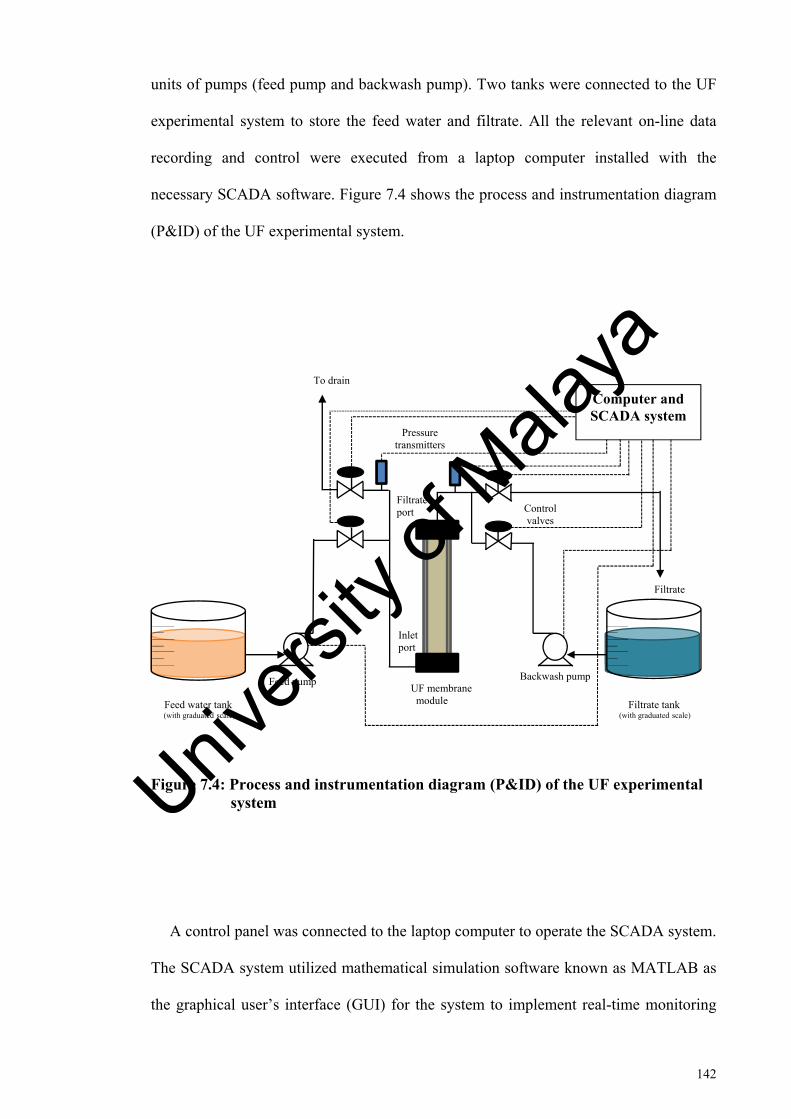
142
units of pumps (feed pump and backwash pump). Two tanks were connected to the UF
experimental system to store the feed water and filtrate. All the relevant on-line data
recording and control were executed from a laptop computer installed with the
necessary SCADA software. Figure 7.4 shows the process and instrumentation diagram
(P&ID) of the UF experimental system.
Figure 7.4: Process and instrumentation diagram (P&ID) of the UF experimental system
A control panel was connected to the laptop computer to operate the SCADA system.
The SCADA system utilized mathematical simulation software known as MATLAB as
the graphical user’s interface (GUI) for the system to implement real-time monitoring
Inlet port
Filtrateport
Backwash pump Feed pump
Filtrate
To drain
UF membrane module Filtrate tank
(with graduated scale)
Feed water tank (with graduated scale)
Pressure transmitters
Control valves
Computer and SCADA system
Univers
ity of
Mala
ya

143
and control. This UF experimental system operational conditions have been designed to
mimic the industrial-scale UF membrane water treatment system mentioned earlier in
the case studies in Chapter 3, 4 and 5 at a much smaller scale. The TMP, filtration and
backwash durations were recorded digitally in the SCADA system. Flow rates during
filtration or backwash and feed water turbidity were measured/analyzed manually. All
of these parameters (filtration flow rate, backwash flow rate and feed water turbidity)
were entered into the SCADA system during the initial stage and assumed to remain
constant during the whole operation.
On-line data was recorded under an open loop system with constant feed water
turbidity and filtration flux rate. The TMP profile and filtration durations were recorded
for further development of the ANN model and controllers. Figure 7.5 shows the block
diagram of the ANN control system architecture in this research.
Figure 7.5: Block diagram of ANN control system architecture
The operation of this UF experimental system was controlled using the SCADA
software as the GUI. There were 6 control elements (4 control valves and 2 pumps) and
2 input sensors (pressure transmitters located at the inlet and filtrate ports of the UF
module) connected to the SCADA system. During operation, all the outputs and inputs
Relevant inputs data during filtration and backwash sequences
Control system using artificial
neural networks (via SCADA system)
Decision on durations of filtration and
backwash sequences
Univers
ity of
Mala
ya

144
data from the filtration and backwash sequences were recorded into the SCADA
software. This UF experimental system allows both the conventional set-points and
ANN control systems to be implemented on-line. The GUI of MATLAB is shown in
Figure 7.6. All the relevant information of the operation including the real-time TMP
profiles were displayed from the computer’s screen and the data was digitally recorded
for further analysis. The following sections further elaborate on the development and
implementation of these control systems.
Figure 7.6: Graphical user’s interface of the SCADA system
7.3.1 Implementation of conventional set-points control system
As mentioned earlier, the conventional set-points control system is commonly
implemented in the industrial-scale UF membrane water treatment plants. Set-points are
pre-determined for both the filtration and backwash sequences of the dead-end filtration
Univers
ity of
Mala
ya

145
mode process. During the filtration sequence, a filtration duration set-point is normally
pre-determined (typically between 20 – 60 minutes) to produce the desired volume of
filtrate. As a precaution, a maximum TMP set-point (typically above 2.0 Bar) is also
introduced to avoid abnormally high pressure on the UF membrane module. Under
normal circumstances the set-point of the filtration duration would be triggered first to
cease the filtration sequence before reaching the maximum TMP set-point. After
completing the filtration sequence, the backwash sequence ensues to provide hydraulic
cleaning of the membrane which is typically between 30 to 120 seconds. The filtration
and backwash sequences operate on alternate basis and the cycle continues until a
chemical cleaning of the membrane is required after completion of 24 continuous cycles
as mentioned earlier in Chapter 3. Under this research, emphasis was laid to control the
duration of both filtration and backwash sequences before reaching the maximum set-
point of the filtration TMP. All the experiments were conducted using the same river
water source as the industrial-scale UF membrane water treatment plant mentioned
earlier in the previous case studies. The same set-points implemented on this industrial-
scale UF membrane water treatment plant were used in the UF experimental system to
mimic the operation of the treatment plant.
7.3.2 Development and implementation of ANN control system
Before developing the ANN control system, actual filtration data was required for the
training of the model and controllers. The TMP profiles data were gathered using the
UF experimental system while the feed water turbidity and solids concentrations
analyses were conducted using facilities available at the in-house laboratory of the
industrial-scale UF membrane water treatment plant. Various feed water samples were
Univers
ity of
Mala
ya

146
collected from the river source to represent turbidity of 5 NTU, 10 NTU, 15 NTU, 20
NTU and 25 NTU. These various feed water samples were obtained by collecting a
large volume of river water when the river water turbidity was about 30 NTU to 40
NTU in a water storage tank. Subsequently the river water in the storage tank was
allowed to settle between 1 to 12 hours and the top water layer in the tank was scooped
out to represents the 5 different turbidity readings. The five samples of river water were
fed into the UF experimental system under dead-end constant flux filtration mode to
obtain the TMP profiles for 60 minutes of filtration duration. Constant flux or flow rate
in this research is defined as ±10% of the desired filtration flux/flow rate. Typically
during the initial commencement of the filtration sequence the flow rate was set at 10%
higher than the desired flowrate. As the TMP increases during filtration sequence, the
flow rate would be reduced to within the ±10% tolerance at the end of the sequence. The
same set of procedures was applied on the backwash sequence as well. Development of
the ANN control system consists of two major components which are:-
1. One ANN predictive model to estimate values of α during filtration.
2. Two ANN controllers to control the backwash and filtration durations respectively.
Data were collected using the UF experimental system to train and validate the ANN
model and controllers. The details on the development of these two major components
have been further highlighted in the following sections.
Univers
ity of
Mala
ya

147
7.3.2.1 ANN predictive model for estimation of specific cake resistance
The detailed development of the ANN predictive model for parameters estimation in
the dead-end filtration process was highlighted in Chapter 6. Potential membrane
fouling propensity represented by the product of αcs is a main concern to ensure
minimal risk of the UF membrane fouling (Boerlage et al., 2000). Utilizing analysis data
of the feed water turbidity and on-line data (TMP profiles and filtration time), the ANN
predictive model continuously estimates the values of α during the filtration sequence.
In order to establish the correlation between feed water turbidity and its solids
concentrations, similar analysis and experimental procedures described in Chapter 6
was applied. The ANN predictive model provides an alternative rapid estimation
method for values of α which are very time consuming to determine under the
conventional laboratory analysis method. This alternative estimation method is suitable
to be implemented on industrial-scale UF membrane water treatment plants which have
limited laboratory resources and skilled staff to analyze it using the conventional
method. Details development of the predictive ANN model has been further elaborated
in Chapter 6.
7.3.2.2 Development of ANN controllers for filtration and backwash sequences
After obtaining the estimated values of α with the predictive model, the ANN control
system utilized this parameter as one of the inputs to decide the filtration duration.
There are two ANN controllers involved which are known as:-
1. ANN controller number 1 – determine filtration duration
2. ANN controller number 2 – determine backwash duration
Univers
ity of
Mala
ya

148
ANN controller number 1 controls the filtration duration and the ANN controller
number 2 controls the backwash duration. Before commencing the filtration sequence,
the turbidity of the feed water sample was analyzed and the value was entered as part of
the ANN controller number 1 inputs. The turbidity of the feed water was assumed to be
constant throughout the whole filtration sequence so the data of the turbidity was only
entered once into the SCADA system. Other inputs data such as on-line TMP (TMPol),
cake mass per unit membrane area (m) and the estimated α from the ANN predictive
model were also fed into the ANN controller number 1.
Initially when the filtration sequence commences, the data of the feed water turbidity
was utilized to estimate the duration of data collection. During this data collection
period the controller would allow the filtration sequence to continue without any
interruptions. This is to allow sufficient on-line TMP (TMPol), m and α data to be
gathered for the ANN controller number 1 to make an accurate estimation of the
filtration duration or Tfil. On-line data of all the inputs were recorded every second in the
SCADA system. The system gathers all the relevant inputs data (feed water turbidity,
TMPol, m and α) for at least 20 minutes before all these data were sent to the ANN
controller for the estimation of Tfil. Once the Tfil for a particular filtration sequence has
been estimated, the filtration sequence would cease when the filtration time is equal or
more than Tfil. The backwash sequence shall be initiated when the filtration sequence
ceased. Figure 7.7 shows the block diagram of the ANN controller number 1 utilized in
the process control.
Univers
ity of
Mala
ya

149
Figure 7.7: Block diagram of ANN controller number 1
Once the filtration sequence has been completed, the ANN controller number 2 shall
be initiated to commence the backwash sequence. During the backwash sequence, the
flow of water was reversed as opposed to the filtration sequence to dislodge the foulant
from the membrane pores and surface as illustrated in Figure 7.1. Clean water enters at
the filtrate port of the UF membrane module and discharged through the inlet port to the
drain by switching the control valves shown in Figure 7.4. The hydraulic pressure
generated during backwash is known as reverse TMP (the difference of pressure
On-line data collection for
ANN controller
Estimation of duration for data
collection
End of data collection and
feed in to ANN controller
ANN controller to estimate filtration
duration or Tfil
If current filtration time < Tfil
If current filtration time ≥ Tfil
Feed water turbidity
TMPol
m
α
Stop filtration sequence
Continue filtration sequence
ANN controller number 1
Univers
ity of
Mala
ya

150
between filtrate port and inlet port of the UF membrane module during backwash
sequence) or TMPrev as the flow of water is from the opposite direction compared to the
filtration sequence. Related inputs data such as on-line TMPrev and the total volume of
clean water utilized during backwash (Vbw) were fed into the ANN controller number 2
to determine the duration of the backwash. Since the backwash sequence normally last
60 seconds or less, the inputs data (TMPrev and Vbw) were fed into the SCADA system
every second and the controller decides whether to continue or stop the sequence every
second as well. Once the controller has decided to end the backwash sequence then the
filtration sequence would be re-initiated again and the whole cycle was repeated until
chemical cleaning of the membrane was required.
During the filtration sequence, the designated control valves were opened and the
feed pump starts. There were only two possible outputs from ANN controller number 1
which were to continue or cease the filtration sequence. Once the controller produced an
output to cease the filtration sequence, the feed pump stops and the all the control valves
were closed. Completion of the filtration sequence would trigger on the initiation of the
ANN controller number 2 to commence with the backwash sequence. The designated
control valves opened and the backwash pump starts to commence the backwash
sequence. Similarly there were only two outputs from this controller which were to
continue or cease the backwash sequence. Once the ANN controller number 2 ceases
the backwash sequence, the next filtration sequence begins and the cycle shall be
repeated. Figure 7.8 shows the whole process control architecture using the ANN
predictive model and controllers.
Univers
ity of
Mala
ya
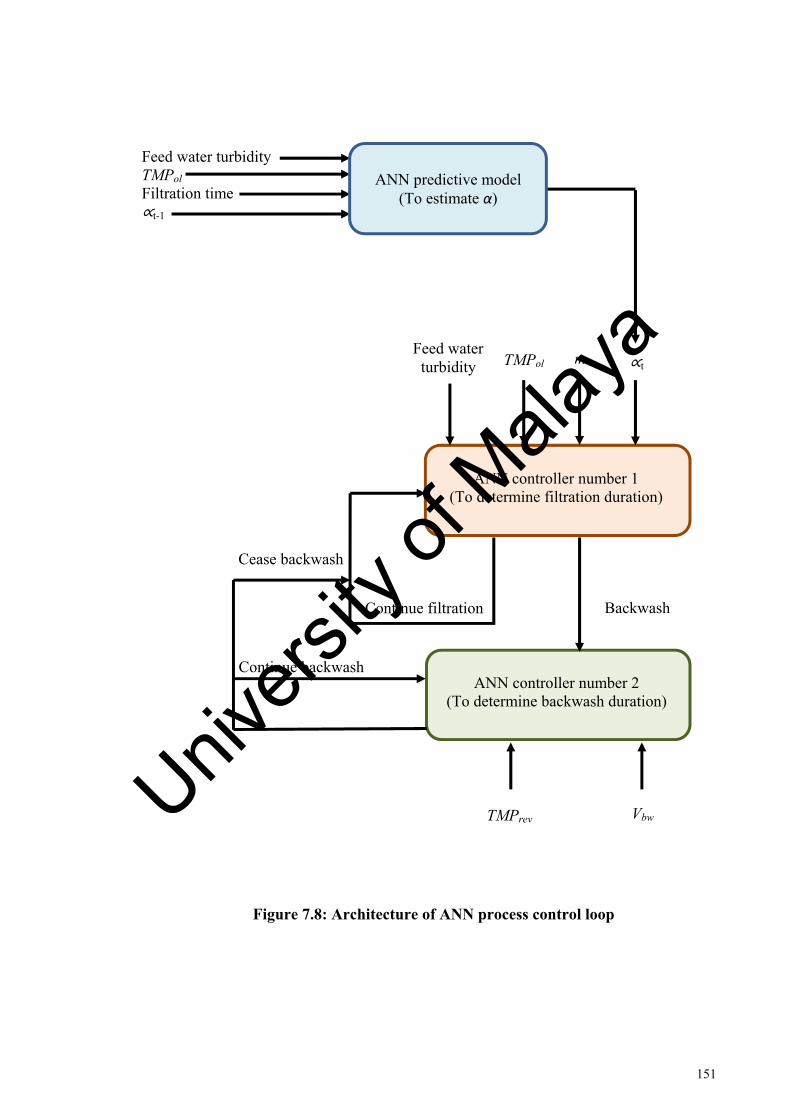
151
Figure 7.8: Architecture of ANN process control loop
Cease backwash
Continue filtration
Continue backwash
Feed water turbidity TMPol Filtration time ∝t-1
ANN controller number 1 (To determine filtration duration)
ANN controller number 2 (To determine backwash duration)
Feed water turbidity ∝t TMPol m
Backwash
TMPrev Vbw
ANN predictive model (To estimate α)
Univers
ity of
Mala
ya

152
7.3.2.3 Conventional set-points and ANN control systems
Implementation of both the ANN and conventional set-points control systems
required the same final control elements (control valves and pumps) and sensors
(pressure transmitters). The main differences between these two control systems were
the durations of the filtrate and backwash sequences. In the conventional set-points
control system, both the filtration and backwash durations were pre-determined
irrespective of the feed water characteristics such as turbidity and feed water solids
concentrations. The ANN control system requires information of the feed water
turbidity to determine the potential membrane fouling propensity represented by the
product of αcs.
Low turbidity feed water has less fouling potential than higher turbidity feed water
on the UF membrane. Based on this assumption, feed water with low turbidity could be
under filtration sequence for a longer period of time before a backwash is initiated. The
amount of water losses through backwash could be reduced significantly when the UF
system is treating low turbidity of feed water. During backwash sequence, the reverse
TMP (TMPrev) data indicates how much solids have accumulated on the membrane
surface. The higher TMPrev during backwash shows higher resistance which represents
more accumulation of solids/foulant on the membrane. Similarly the total volume of
clean water utilized during the backwash sequence (Vbw) provides information on how
much cleaning have been done on the membrane.
The ANN control system is an alternative method that is suitable for implementation
at industrial-scale UF membrane water treatment system to reduce water losses through
backwash. Under the conventional set-points control, water losses remain the same
irrespective of the feed water characteristic changes. The ANN control system has the
advantage of reducing water losses through longer filtration durations if the feed water
has lower potential membrane fouling propensity (such as lower turbidity and solids
Univers
ity of
Mala
ya

153
concentrations). Furthermore the ANN control system would allow much longer
backwash duration if the membrane has accumulated more solids on its surface than
expected based on the on-line TMPrev data. Re-training of the ANN model and
controllers with updated data such as feed water characteristics and TMP profiles enable
the system to “re-learn” the new patterns to suit current operational conditions.
7.4 Results and discussions
The details results of the conventional set-points and ANN control systems were
further examined with the necessary analysis. All the experiments conducted using the
UF experimental system utilized feed water from the same river source. Set-points
(filtration and backwash durations) of the conventional control implemented on the UF
experimental system were similar to the industrial-scale UF membrane water treatment
plant mentioned earlier in the case studies. This allows a close representation of the
industrial-scale UF system by using the same feed water source and similar UF
membrane in a smaller scale.
Data collection using the UF experimental system was initially conducted to gather
the required information to train the ANN model and controllers. Different feed water
samples with various turbidities were fed into the system for 60 minutes of filtration
duration to obtain the TMP profiles. These data were recorded digitally in the SCADA
system during the experiments. Laboratory analysis to determine the solids
concentrations of the feed water samples were also conducted. After the training and
validation of the neural networks, the ANN control system was implemented on-line
with the UF experimental system. Both the conventional set-points and the ANN control
systems results were compared and analyzed.
Univers
ity of
Mala
ya

154
7.4.1 Results of the conventional set-points control system
As mentioned earlier, the set-points implemented on the UF experimental system
were similar to the industrial-scale UF membrane water treatment plant in the previous
case studies. These set-points include the filtration and backwash durations operating
under the dead-end constant flux filtration mode. Table 7.1 shows the operational
parameters of the UF experimental system. Both the filtration and backwash fluxes of
the UF experimental system were similar to the industrial-scale UF membrane water
treatment system. The major differences between these two systems were smaller
membrane surface area was utilized in the UF experimental system (1 m2) compared to
7, 200 m2 for the industrial-scale system.
Table 7.1: Operational conditions and parameters of the UF experimental system
Parameters UF experimental system
Type of UF membrane Hollow fibre (mPES)
Feed water source Natural river water
Membrane surface area 1 m2
Filtration flux 80 L/m2hr
Backwash flux 230 L/m2hr
Filtration duration 30 minutes
Backwash duration 60 seconds
All the required on-line operational data of the UF experimental system such as TMP
profiles, filtration and backwash durations was recorded in the SCADA system. The
conventional system commences with filtration sequence for 30 minutes followed by a
60 seconds backwash sequence. Feed water samples maintained the same turbidity
throughout each filtration sequence. The maximum recommended feed water turbidity
Univers
ity of
Mala
ya

155
0
0.1
0.2
0.3
0.4
0.5
0.6
0.7
10 20 30 40 50 60 70 80 90 100
110
120
130
140
150
160
TMP
(Bar
)
Filtration time (min)
0
0.1
0.2
0.3
0.4
0.5
0.6
0.7
10 20 30 40 50 60 70 80 90 100
110
120
130
140
150
160
TMP
(Bar
)
Filtration time (min)
to the industrial-scale UF membrane water treatment plant should not exceed 20 NTU
which was also practiced on the UF experimental system. Typically the river water
turbidity under clear weather conditions was on the average between 10 – 15 NTU
which was very suitable for direct feed UF membrane systems. Two samples of feed
water with 8 NTU and 18 NTU of turbidity were fed into the UF experimental system
using the conventional set-points control system. The results of the TMP profiles were
shown in Figure 7.9 and Figure 7.10 respectively.
Figure 7.9: TMP profile of feed water with 8 NTU of turbidity
Figure 7.10: TMP profile of feed water with 18 NTU of turbidity
Univers
ity of
Mala
ya

156
Results from both TMP profiles in Figure 7.9 and Figure 7.10 indicated similar
pattern during filtration and backwash sequences in 5 complete cycles. Initially all the
profiles indicated TMP values of between 0.36 – 0.38 Bar and gradually increases to
0.41 – 0.43 Bar at the end of the filtration sequences. Under the conventional set-points
control system, a 30 minutes filtration sequence followed by a 60 seconds backwash
sequence was implemented for feed water samples of 20 NTU or below. After the
backwash sequence, the initial TMP of the next filtration sequence was restored to
between 0.36 – 0.38 Bar.
7.4.2 Gathering information and data for the ANN training
Prior to implementing the ANN control system, relevant data and information of the
filtration, backwash and feed water characteristics were required. Literature has reported
that both solids concentrations of feed water (cs) and the specific cake resistance during
filtration (α) represents the potential membrane fouling propensity (Boerlage et al.,
2004). Analysis of the feed water solids concentrations require almost 10 – 15 hours
under the American Public Health Association (APHA) analysis method. A correlation
between the turbidity and total feed water solids concentrations are usually established
for rapid estimation of cs. Data of feed water turbidity could be easily analyzed using
laboratory turbidity analyzer within a minute and translated to cs with the established
correlation.
Figure 7.11 shows the data collected to establish the correlation between the total
suspended solids (TSS) concentrations or cs against the turbidity of the river water
conducted in the year 2016. A linear correlation was established between cs and the
Univers
ity of
Mala
ya

157
R² = 0.927
0.000
0.005
0.010
0.015
0.020
0.025
0.030
0.035
0 5 10 15 20 25 30
c s (kg
/m3 )
River water turbidity (NTU)
turbidity of the river water in Figure 7.11. The values of cs for different turbidity of feed
water could be rapidly estimated by knowing the turbidity of the feed water.
Figure 7.11: Established correlation between cs and turbidity of the river water
Differences in solids concentrations of the feed water samples implied that longer
filtration duration might be applicable for feed water with low turbidity within the
recommended potential membrane fouling propensity represented by the product of αcs.
Benefit of extending filtration duration includes reducing significant amount of water
losses through backwash. Various feed water turbidity samples (5 NTU, 10 NTU, 15
NTU, 20 NTU and 25 NTU) were collected from the river using the method described
earlier. Each of the feed water samples was fed into the UF experimental system to
obtain the TMP profiles up to 60 minutes under dead-end constant flux filtration. Figure
7.12 shows the TMP profiles for the various samples of feed water on the UF
experimental system.
Univers
ity of
Mala
ya

158
0
0.1
0.2
0.3
0.4
0.5
0.6
0.7
10 20 30 40 50 60
TMP
(Bar
)
Filtration time (min)
5 NTU
10 NTU
15 NTU
20 NTU
25 NTU
Figure 7.12: TMP profiles for various feed water samples
Results shown in Figure 7.12 indicated very little variations or differences in the
TMP profiles for all the feed water samples of 5 NTU, 10 NTU, 15 NTU, 20 NTU and
25 NTU. Initially all the TMP profiles started off with values between 0.36 – 0.38 Bar
in the first few minutes. The TMP increases gradually reaching between 0.46 – 0.49 Bar
after 60 minutes of filtration. There was no significant TMP profiles difference
observed in all the samples which means additional inputs data were necessary to be fed
into the ANN controller number 1 for better control efficiency. The correlation between
the filtration flux, TMP, specific cake resistance and solids concentrations of feed water
could be established using the Darcy’s equation (6.1) shown earlier in Chapter 6.
Value of membrane resistance or Rm was determined using normal experimental
analysis procedures mentioned earlier (Boerlage et al., 1998; Pellegrin et al., 2015; Roy
& De, 2015). Both α and cs have been mentioned in literature as filtration parameters
Univers
ity of
Mala
ya

159
0.000
0.005
0.010
0.015
0.020
0.025
0.030
0.035
0 5 10 15 20 25 30
Estim
ated
c s(k
g/m
3 )
Feed water turbidity (NTU)
which are complicated to be determined experimentally (Boerlage et al., 2004). The
direct relationship between m and cs has been shown in equation (6.3) at Chapter 6.
Correlation shown in this equation indicated a direct relationship between cs and m in
dead-end constant flux filtration mode. Utilizing the cs and turbidity correlation
established in Figure 7.11, the relevant estimated values of cs for the feed water samples
was obtained as shown in Figure 7.13.
Figure 7.13: Estimated values of cs for various turbidity of feed water
It was important to emphasize that during filtration sequence, the values of m
increased linearly with time as more solids/foulant were accumulated on the membrane
surface as cake layer. Feed water with higher turbidity corresponds to higher solids
loading or m values during filtration sequence. Figure 7.14 shows the gradual increase
of m for the various feed water samples during the filtration sequence.
Univers
ity of
Mala
ya

160
0.0000
0.0005
0.0010
0.0015
0.0020
0.0025
0.0030
0 10 20 30 40 50 60
m(k
g/m
2 )
Filtration time (min)
25 NTU
20 NTU
15 NTU
10 NTU
5 NTU
0.0
5.0
10.0
15.0
20.0
25.0
30.0
0 10 20 30 40 50 60
α(m
/kg)
Filtration time (min)
5 NTU
10 NTU
15 NTU
20 NTU
25 NTU
X 1014
Figure 7.14: Data of m during filtration for various feed water samples
By having the relevant correlation and experimental data, all the parameters required
in the Darcy’ equation in equation (6.1) such as J, Rm, µ, m and ∆P could be determined
to estimate α. Values of α throughout the 60 minutes filtration sequence were estimated
based on Darcy’s law and presented in Figure 7.15.
Figure 7.15: Estimation of specific cake resistance during filtration sequence
Univers
ity of
Mala
ya

161
It was shown in Figure 7.15 that all of the feed water samples exhibited values of
decreasing α during the initial 20 minutes of filtration and ultimately reaching a
constant value. These ultimate values of α increase as the turbidity of the feed water
samples decrease. Similar results and observation was also reported in literature stating
that the increase of α values for decreasing solids concentrations of the feed solutions
(Chang & Kim, 2005). It was suggested that for feed water samples with low solids
concentrations, values of α decrease with the increase of solids concentrations of the
feed solutions during the cake layer consolidation stage.
Under the conventional set-points control system for the industrial-scale UF
membrane water treatment plant, the filtration duration was pre-determined to last for
30 minutes before a 60 seconds backwash sequence ensues. The maximum feed water
turbidity entering the UF system was limited to 20 NTU and below based on the initial
design to ensure minimal irreversible membrane fouling potential. Similar set-points
control with feed water samples of 20 NTU and below were carried out using the UF
experimental system to mimic the same operational conditions. Utilizing results from
the UF experimental system shown in Figure 7.12 and applying the Darcy’ law in
equation (6.1) and (6.3), the values of cs and α (Figure 7.13 and Figure 7.15
respectively) were calculated and presented in Table 7.2.
Table 7.2: Estimated values of cs and α for various feed water samples
20 NTU 5 NTU 10 NTU 15 NTU 25 NTU
cs (kg/m3) 0.02451 0.00596 0.01215 0.01833 0.03070
α (m/kg) 3.42 X 10¹⁴ 13.85 X 10¹⁴ 6.79 X 10¹⁴ 4.48 X 10¹⁴ 2.67 X 10¹⁴
αcs (m-2) 8.38 X 10¹² 8.25 X 10¹² 8.24 X 10¹² 8.21 X 10¹² 8.20 X 10¹² Filtration duration
30 min 55 min 50 min 40 min 25 min
Univers
ity of
Mala
ya

162
Data shown in Table 7.2 highlighted that the 30 minutes filtration duration with the
maximum recommended feed water turbidity of 20 NTU produced αcs of 8.38 X 10¹²
m-2. The product of αcs was mentioned earlier to represent potential membrane fouling
propensity and should be kept below a specific value to ensure minimal fouling
potential (Boerlage et al., 2004). All the filtration data for the various feed water
samples (5 NTU, 10 NTU, 15 NTU and 25 NTU) were also analyzed for their
respective αcs values. Data shown in Table 7.2 indicated that experiments using feed
water with turbidity lower than 20 NTU (such as 5 NTU, 10 NTU and 15 NTU) could
continue with filtration for more than 30 minutes before their respective values of αcs
reaching close to 8.38 X 10¹² m-2. Feed water sample with 25 NTU of turbidity could
only undergo filtration duration of up to 25 minutes before reaching close to this value.
Previous correlation of cs and turbidity has indicated that higher feed water turbidity
represents higher solids concentrations. Feed water samples with lower turbidity would
then represent lower cs values suggesting longer filtration duration is possible before
reaching the recommended value of αcs. Examining the product of αcs is a more
accurate analysis to determine the potential membrane fouling propensity compare to
fixing a set-point of filtration duration for all feed water samples in the conventional
control system. Figure 7.16 shows the estimated filtration duration against various feed
water samples indicated in Table 7.2.
Univers
ity of
Mala
ya
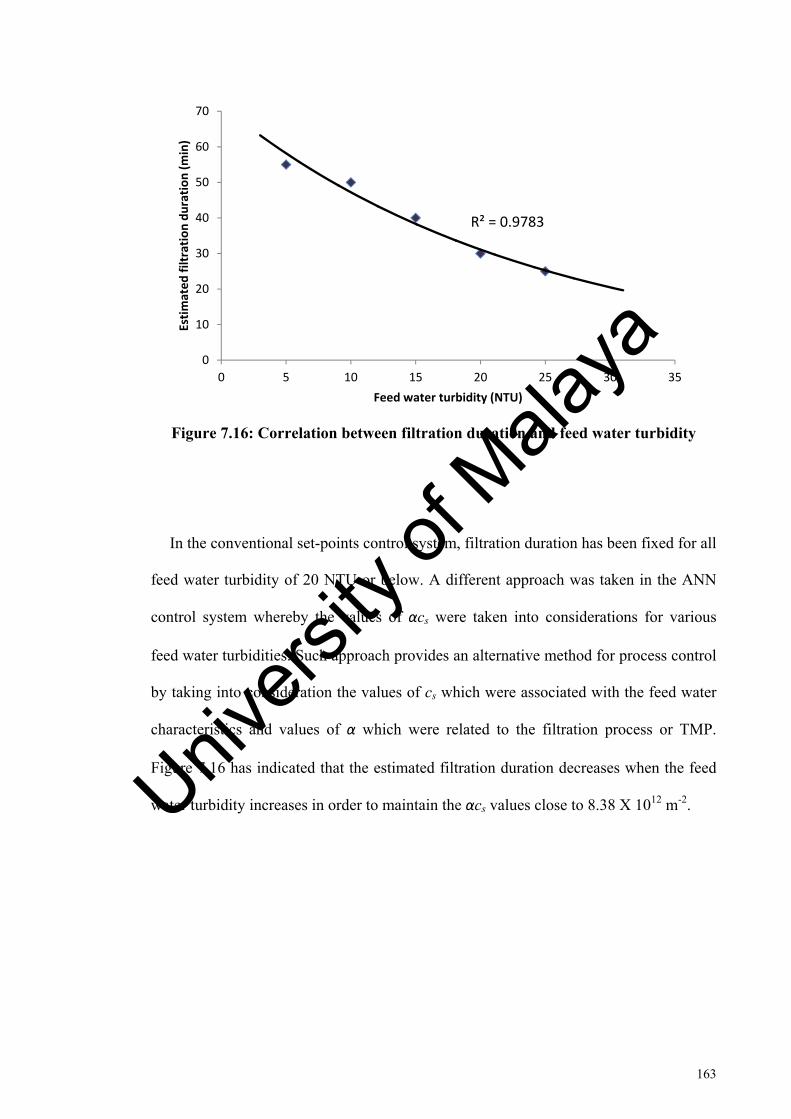
163
R² = 0.9783
0
10
20
30
40
50
60
70
0 5 10 15 20 25 30 35
Estim
ated
filtr
atio
n du
ratio
n (m
in)
Feed water turbidity (NTU)
Figure 7.16: Correlation between filtration duration and feed water turbidity
In the conventional set-points control system, filtration duration has been fixed for all
feed water turbidity of 20 NTU or below. A different approach was taken in the ANN
control system whereby the values of αcs were taken into considerations for various
feed water turbidities. Such approach provides an alternative method for process control
by taking into consideration the values of cs which were associated with the feed water
characteristics and values of α which were related to the filtration process or TMP.
Figure 7.16 has indicated that the estimated filtration duration decreases when the feed
water turbidity increases in order to maintain the αcs values close to 8.38 X 10¹² m-2.
Univers
ity of
Mala
ya
164
7.4.3 Results of the ANN control system
After gathering all the necessary laboratory analysis and on-line data from the UF
experimental system, the ANN model and controllers were trained with these data.
There are three ANN model and controllers which were trained with these data:-
1. ANN predictive model to estimate values of α
2. ANN controller number 1 to control the filtration duration
3. ANN controller number 2 to control the backwash duration
Details of the ANN predictive model development procedures have been highlighted
in Chapter 6. Estimated values of α from the ANN predictive model were used as one of
the continuously fed inputs to the ANN controller number 1. Information from Figure
7.12, Figure 7.13, Figure 7.14, Figure 7.15 and Figure 7.16 were scaled and arranged
accordingly for utilization as training data for the ANN controller number 1. The
outputs from the ANN controller number 1 should provide information to either
continue with the filtration sequence (represented by “1”) or cease filtration
(represented by “0”). Once the output from ANN controller number 1 have indicated
“0” or cease filtration, signal shall be send to ANN controller number 2 to commence
the backwash sequence.
Similarly the ANN controller number 2 has been trained with the relevant data
(TMPrev and Vbw) to ensure sufficient cleaning of the membrane during the backwash
sequence. During the backwash sequence, on-line data of the reverse TMP or TMPrev
was taken into consideration to ensure the backwash or cleaning was effective with the
lowering of resistance (represented by declining values of TMPrev) after a certain period
Univers
ity of
Mala
ya

165
of duration. Initially during the backwash, the TMPrev values would be higher due to
accumulation of solids on the membrane surface. As the backwash progresses, the
TMPrev data shall further decreases indicating the solids cake layer has been removed
from the membrane surface so the backwash sequence should be stopped and the next
filtration sequence could proceed. The total volume of water used during backwash
(Vbw) was also an important input fed into the ANN controller number 2. Under normal
conditions the final value of Vbw would be the same for each backwash sequences
because prior filtration sequences determined by ANN controller number 1 pose similar
potential membrane fouling propensity (αcs). The ANN controller number 2 determines
the backwash duration by recognizing the TMPrev has stabilized with the estimated Vbw
and ceases the backwash sequence. Subsequently the next filtration sequence
commences until reaching another backwash sequence. Table 7.3 shows the inputs and
outputs of all the ANN model and controllers. As mentioned earlier, the filtration flux
was assumed to be constant as long as the tolerance was within ±10% of the desired
values. During the initial stage of the filtration sequence, there was less resistance
caused by accumulation of solids on the membrane compared to the end of the filtration
sequence. The initial filtration flow rate would be higher and gradually decreases.
Efforts were taken to ensure that the flow rate during the whole filtration sequence still
maintains between ±10% of the desired value. Similarly during backwash sequence the
flow rate was measured volumetrically to ensure tolerance of ±10% of the desired value
throughout the sequence.
Univers
ity of
Mala
ya

166
Table 7.3: Inputs and outputs of the ANN model and controllers
Inputs Outputs Parameter Source Parameter
ANN predictive model
Feed water turbidity Laboratory turbidity analyzer
Estimated current value of α (αt)
On-line TMP (TMPol) On-line pressure transmitters signal to SCADA system
Filtration time Timer from SCADA system
Past values of α (αt-1) Feedback from SCADA system
ANN controller number 1 (filtration sequence)
Feed water turbidity
Laboratory turbidity analyzer
Filtration duration or Tfil. If filtration time < Tfil then “1” to continue filtration. If filtration time ≥ Tfil then “0” to stop filtration
On-line TMP (TMPol) On-line pressure transmitters signal to SCADA system
Mass of cake per filter area (m)
Correlation from Figure 7.11 and equation (6.3)
Estimated current values of α (αt)
Output from ANN predictive model
ANN controller number 2 (backwash sequence)
Reverse TMP (TMPrev) On-line pressure transmitters signal to SCADA system
“1” to continue or “0” to stop backwash
Total volume of backwash water used (Vbw)
Timer from SCADA system (assuming constant flow rate from backwash pump)
The three ANN model and controllers were trained individually with the inputs and
outputs data shown in Table 7.3 and validated with other unseen data. These three ANN
model and controllers were developed in the SCADA software environment and ready
to be implemented on-line for actual process control on the UF experimental system.
Feed water with turbidity of 8 NTU was fed into the UF experimental system using the
ANN control system. The on-line TMP during filtration sequence indicated a gradual
increase of pressure from 0.37 Bar to 0.46 Bar as shown in Figure 7.17 (a). In the figure,
filtration duration controlled by ANN controller number 1 continues for 50 minutes
before a backwash was initiated. The backwash sequence controlled by ANN controller
Univers
ity of
Mala
ya

167
number 2 takes about 51 seconds to complete before another filtration sequence was
initiated. When the next filtration sequence commences, the initial TMP returns back to
0.37 Bar which indicated an almost complete removal of the accumulated solids on the
membrane surface during the last backwash sequence. In Figure 7.17 (b), the values of
α remains almost at a constant value of 8.52 X 10¹⁴ m/kg after the initial 10 minutes
representing consolidation of the cake layer throughout the filtration sequence. The
output of ANN controller number 1 was shown in Figure 7.17 (c). In all the 5 filtration
sequences tested using the controller with the 8 NTU feed water, the filtration duration
was averagely 50 minutes which was very close to the estimated duration of 51 minutes
shown on Figure 7.16. The output of ANN controller number 2 was shown on Figure
7.17 (d) which indicated an average 51 seconds of backwash duration.
Results obtained from using the feed water of 8 NTU indicated that the filtration
sequence could be extended up to 50 minutes followed by a 51 seconds of backwash
sequence without causing any increase of TMP in the following next filtration sequence.
This was also in agreement with the data obtained in Table 7.2 indicating that for feed
water with lower turbidity, longer filtration duration was possible while ensuring αcs
close to the recommended value of 8.38 X 10¹² m-2. As mentioned earlier, the product of
αcs is an indication of potential membrane fouling propensity which should be kept
close to the recommended value.
Univers
ity of
Mala
ya

168
00.10.20.30.40.50.60.7
10 20 30 40 50 60 70 80 90 100
110
120
130
140
150
160
170
180
190
200
210
220
230
240
250
260
TMP
(Bar
)
Filtration time (min)
00.20.40.60.8
11.2
10 20 30 40 50 60 70 80 90 100
110
120
130
140
150
160
170
180
190
200
210
220
230
240
250
260AN
N c
ontr
olle
r 1 o
utpu
ts
Filtration time (min)
00.20.40.60.8
11.2
10 20 30 40 50 60 70 80 90 100
110
120
130
140
150
160
170
180
190
200
210
220
230
240
250
260
ANN
con
trol
ler 2
out
puts
Backwash time (min)
8.28.38.48.58.68.78.8
10 20 30 40 50 60 70 80 90 100
110
120
130
140
150
160
170
180
190
200
210
220
230
240
250
260
α( X
1014
m/k
g)
Filtration time (min)
Figure 7.17 (a) TMP profiles during filtration (8 NTU sample)
Figure 7.17 (b) Output from ANN predictive model (8 NTU sample)
Figure 7.17 (c) Output from ANN controller number 1 – filtration sequence (8 NTU sample)
Figure 7.17 (d) Output from ANN controller number 2 – backwash sequence (8 NTU sample)
Univers
ity of
Mala
ya
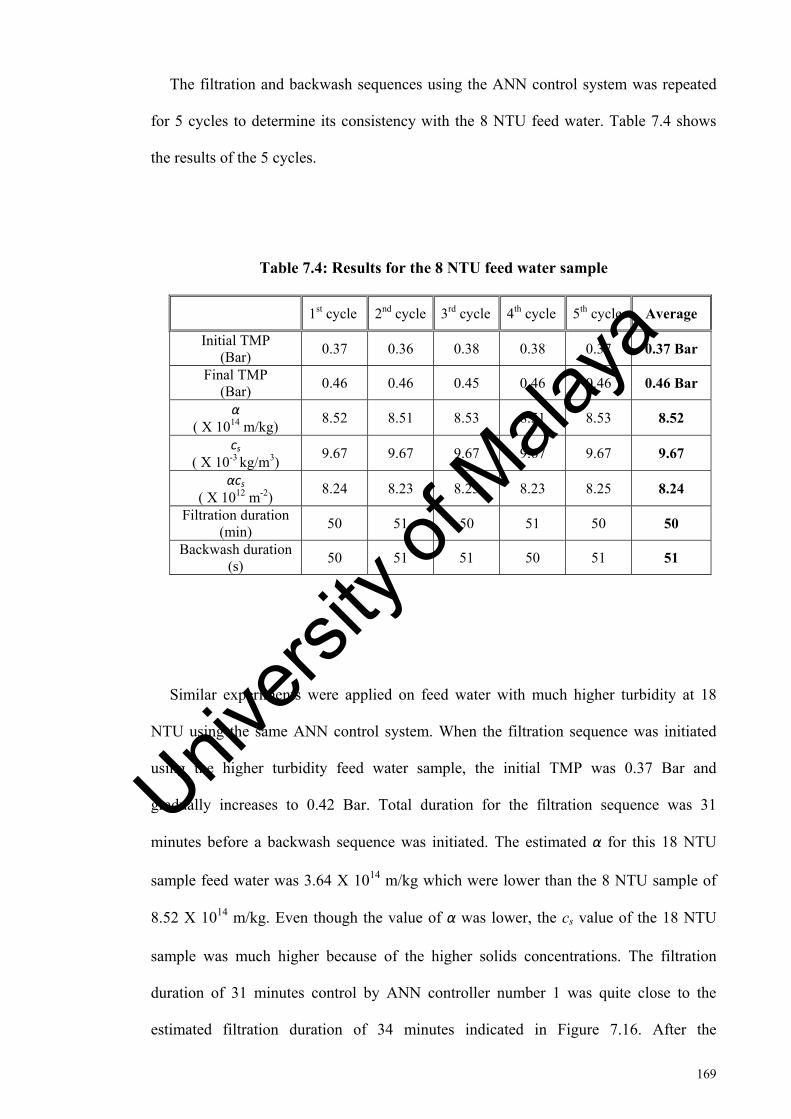
169
The filtration and backwash sequences using the ANN control system was repeated
for 5 cycles to determine its consistency with the 8 NTU feed water. Table 7.4 shows
the results of the 5 cycles.
Table 7.4: Results for the 8 NTU feed water sample
1st cycle 2nd cycle 3rd cycle 4th cycle 5th cycle Average
Initial TMP (Bar)
0.37 0.36 0.38 0.38 0.37 0.37 Bar
Final TMP (Bar)
0.46 0.46 0.45 0.46 0.46 0.46 Bar
α ( X 1014 m/kg)
8.52 8.51 8.53 8.51 8.53 8.52
cs
( X 10-3 kg/m3) 9.67 9.67 9.67 9.67 9.67 9.67
αcs ( X 1012 m-2)
8.24 8.23 8.25 8.23 8.25 8.24
Filtration duration (min)
50 51 50 51 50 50
Backwash duration (s)
50 51 51 50 51 51
Similar experiments were applied on feed water with much higher turbidity at 18
NTU using the same ANN control system. When the filtration sequence was initiated
using the higher turbidity feed water sample, the initial TMP was 0.37 Bar and
gradually increases to 0.42 Bar. Total duration for the filtration sequence was 31
minutes before a backwash sequence was initiated. The estimated α for this 18 NTU
sample feed water was 3.64 X 10¹⁴ m/kg which were lower than the 8 NTU sample of
8.52 X 10¹⁴ m/kg. Even though the value of α was lower, the cs value of the 18 NTU
sample was much higher because of the higher solids concentrations. The filtration
duration of 31 minutes control by ANN controller number 1 was quite close to the
estimated filtration duration of 34 minutes indicated in Figure 7.16. After the
Univers
ity of
Mala
ya

170
completion of the filtration sequence, the ANN controller number 2 takes over to
commence the backwash sequence. The total backwash duration was 51 seconds which
was similar to the 8 NTU sample. This was because both the filtration sequences for the
8 NTU and 18 NTU samples stopped when the αcs values were close to 8.38 X 10¹² m-2.
So this has suggested that both the filtration sequences with the 8 NTU and 18 NTU
samples controlled by ANN controller number 1 have similar potential membrane
fouling propensities and required the same backwash duration to dislodge the solids
from the membrane surface.
Similar to the previous sample, the 18 NTU sample was repeated for 5 cycles of
filtration and backwash sequences to determine the controllers’ consistency. The
average values of αcs for the 18 NTU sample was 8.03 X 10¹² m-2 which was quite close
to the recommended value of 8.38 X 10¹² m-2 as well. After each backwash sequences,
the initial TMP of the next filtration sequence returns to between 0.37 – 0.38 Bar. This
indicated an almost complete removal of the solids cake layer from the membrane
surface after each backwash sequences. Figure 7.18 shows the results of the 18 NTU
sample using the ANN control system. Table 7.5 shows the operational results of 5
cycles with the ANN control system on the 18 NTU feed water sample.
Univers
ity of
Mala
ya

171
3.43.53.63.73.83.9
4
10 20 30 40 50 60 70 80 90 100
110
120
130
140
150
160
170
α( X
1014
m/k
g)
Filtration time (min)
00.10.20.30.40.50.60.7
10 20 30 40 50 60 70 80 90 100
110
120
130
140
150
160
170
TMP
(Bar
)
Filtration time (min)
00.20.40.60.8
11.2
10 20 30 40 50 60 70 80 90 100
110
120
130
140
150
160
170
ANN
con
trol
ler 1
out
puts
Filtration time (min)
00.20.40.60.8
11.2
10 20 30 40 50 60 70 80 90 100
110
120
130
140
150
160
170
ANN
con
trol
ler 2
out
puts
Backwash time (min)
Figure 7.18 (a) TMP profiles during filtration (18 NTU sample)
Figure 7.18 (b) Output from ANN predictive model (18 NTU sample)
Figure 7.18 (c) Output from ANN controller number 1 – filtration sequence (18 NTU sample)
Figure 7.18 (d) Output from ANN controller number 2 – backwash sequence (18 NTU sample)
Univers
ity of
Mala
ya

172
Table 7.5: Results for the 18 NTU feed water sample
1st cycle 2nd cycle 3rd cycle 4th cycle 5th cycle Average
Initial TMP (Bar)
0.37 0.37 0.38 0.37 0.37 0.37 Bar
Final TMP (Bar)
0.41 0.42 0.43 0.42 0.42 0.42 Bar
α ( X 1014 m/kg)
3.64 3.65 3.66 3.64 3.64 3.64
cs
( X 10-3 kg/m3) 22.04 22.04 22.04 22.04 22.04 22.04
αcs ( X 1012 m-2)
8.02 8.04 8.07 8.02 8.02 8.03
Filtration duration (min)
32 32 31 31 31 31
Backwash duration (s)
50 51 51 50 51 51
It was mentioned earlier that all the ANN model and controllers were trained using
data obtained from filtration and backwash sequences for feed water samples with
turbidities range from 5 NTU to 25 NTU. The intention of training the ANN model and
controllers within this range was to correspond to the industrial-scale UF membrane
water treatment plant limit of processing river water with maximum recommended
turbidity of 20 NTU. Typically the river water turbidity was between 10 – 15 NTU.
Direct feed UF system is basically suitable for low turbidity of natural surface water.
Efforts were taken to test the ANN control system beyond the training data with 30
NTU of feed water. Table 7.6 shows the results of using a 30 NTU feed water sample
with the ANN control system. The filtration and backwash sequences were repeated 5
cycles similar to the previous two feed water samples of 8 NTU and 18 NTU.
Univers
ity of
Mala
ya

173
Table 7.6: Results for the 30 NTU feed water sample
Initial TMP Final TMP Filtration duration
Backwash duration
1st cycle 0.36 Bar 0.41 Bar 24 min 50 s
2nd cycle 0.37 Bar 0.42 Bar 24 min 51 s
3rd cycle 0.37 Bar 0.42 Bar 25 min 51 s
4th cycle 0.37 Bar 0.40 Bar 25 min 50 s
5th cycle 0.36 Bar 0.41 Bar 24 min 51 s
Average 0.37 Bar 0.41 Bar 24 min 51 s
The data shown in Table 7.6 indicated that the average filtration duration allowed by
ANN controller number 1 was 24 minutes. By extrapolating the graph on Figure 7.16,
the estimated filtration duration should be 20 minutes for a 30 NTU feed water sample.
The ANN controller number 1 was still able to reduce the filtration duration of the 30
NTU sample to 24 minutes even though it was not trained with the data. It is important
to ensure that the working range of the ANN control system falls within the range of the
training data for optimum performance.
If there are significant changes on the feed water cs and turbidity correlation, the
estimated values of αcs might have differed from the initial training data and much
higher fouling propensity might occurs on the membrane surface before a backwash
sequence is initiated. The ANN controller number 2 should allow longer backwash
duration in case such abnormal condition occurs during the previous filtration sequence.
Such abnormal condition with much higher amount of accumulated solids than expected
during filtration was used to train the ANN controller number 2. The reverse TMP
(TMPrev) during backwash sequence is an important aspect to indicate the amount of
accumulated solids on the membrane surface during the previous filtration sequence.
During the initial stage of the backwash sequence, the values of TMPrev indicate the
Univers
ity of
Mala
ya

174
resistance caused by the cake layer on the membrane. Higher value of TMPrev reading
indicates higher resistance caused by the cake layer on the membrane surface which
increases the backwash hydraulic pressure.
Under normal conditions, the values of αcs should be approximately 8.38 X 10¹² m-2
at the end of the filtration sequence. The characteristics changes of the river water might
altered the cs and turbidity correlation (Figure 7.11) and causes significantly higher
values of αcs which were different than the training data used to train the controller.
This resulted in higher potential membrane fouling propensity on the membrane with
more accumulation of solids at the end of the filtration sequence than expected.
The higher potential membrane fouling propensity was simulated by feeding in a 30
NTU feed water sample into the UF experimental system while entering 8 NTU as the
feed water turbidity in the SCADA system. Data shown in Figure 7.16 and Table 7.4
indicated that for a feed water sample with 8 NTU, the filtration duration would be 50 –
51 minutes followed by a 51 seconds of backwash duration under normal conditions.
Even though the actual feed water sample was 30 NTU, it was entered as 8 NTU in the
SCADA system so the ANN controller number 1 would have allowed up to 50 minutes
of filtration duration before initiating the backwash sequence. Once the backwash
sequence was initiated, the on-line reverse TMP (TMPrev) data was fed into the ANN
controller number 2 to determine the backwash duration required. Due to the higher
potential membrane fouling propensity for the 30 NTU feed water sample accumulated
during the filtration sequence, a much higher resistance would be observed during the
initial backwash sequence which was reflected in the TMPrev profile. Figure 7.19 shows
the TMPrev profiles as well as the ANN controller number 2 outputs for both the 8 NTU
and 30 NTU feed water samples during backwash sequences.
Univers
ity of
Mala
ya

175
0
0.5
1
1.5
2
0 10 20 30 40 50 60 70
TMP re
v(B
ar)
Backwash time (s)
0
0.2
0.4
0.6
0.8
1
1.2
0 10 20 30 40 50 60 70
ANN
con
trol
ler 2
out
puts
Backwash time (s)
0
0.2
0.4
0.6
0.8
1
1.2
0 10 20 30 40 50 60 70
ANN
con
trol
ler 2
out
puts
Backwash time (s)
0
0.5
1
1.5
2
0 10 20 30 40 50 60 70
TMP re
v(B
ar)
Backwash time (s)
Figure 7.19 (a) TMPrev profile for 8 NTU Figure 7.19 (b) TMPrev profile for 30 NTU
Figure 7.19 (c) Outputs from ANN controller Figure 7.19 (d) Outputs from ANN controller number 2 for 8 NTU number 2 for 30 NTU
Figure 7.19: TMPrev profiles and ANN controller number 2 outputs
Figure 7.19 (a) shows the TMPrev profile of the 8 NTU feed water sample was
initially about 1.7 Bar and gradually decreases to 1.6 Bar at the end of the backwash
sequence. Figure 7.19 (c) shows the ANN controller number 2 outputs for this feed
water sample which ceased the backwash sequence after 51 seconds. As mentioned
earlier, to simulate higher potential membrane fouling propensity, a 30 NTU sample
was fed into the UF experimental system by entering it as 8 NTU in the SCADA
system. Figure 7.19 (b) shows the TMPrev profile of the 30 NTU sample during the
Univers
ity of
Mala
ya

176
backwash sequence. The initial TMPrev for this 30 NTU sample was much higher at 1.9
Bar and subsequently decreases to 1.6 Bar after 62 seconds of backwash duration as
shown in Figure 7.19 (d).
ANN controller number 2 has exhibited its capability to distinguish between different
TMPrev profiles to allow longer backwash duration for abnormal condition such as the
30 NTU sample. The extended or much longer backwash duration exceeding 55 seconds
serves as an early indication or warning to the operator of the UF system that the
characteristics of the river water might have changed. Gathering new data to re-establish
the cs and turbidity correlation as well as re-training all the ANN model and controllers
might be required.
7.4.4 Analysis of the conventional and ANN control systems
After obtaining the results from both the conventional and ANN control systems, a
comparison was established and presented. Table 7.7 shows the details and comparison
between the two control systems. The comparisons were made under dead-end constant
flux filtration operation mode for both the control systems.
Table 7.7: Comparison of results between control systems
Parameters Conventional control ANN control
Filtration duration 8 NTU (Feed water) 18 NTU (Feed water)
30 minutes 30 minutes
50 minutes 31 minutes
Fouling propensity(αcs) 8 NTU (Feed water) 18 NTU (Feed water)
8.38 X 10¹² m-2
(based on 20 NTU only)
8.24 X 10¹² m-2 8.03 X 10¹² m-2
Water losses (backwash) 8 NTU (Feed water)
18 NTU (Feed water)
9.6 % 9.6 %
4.9 % 7.9 %
Initial TMP after backwash 8 NTU (Feed water) 18 NTU (Feed water)
0.36 – 0.38 Bar 0.36 – 0.38 Bar
0.36 – 0.38 Bar 0.37 – 0.38 Bar
Univers
ity of
Mala
ya

177
Summarized comparison shown on Table 7.7 indicated that the ANN control system
was capable to regulate filtration durations of different feed water turbidity (8 NTU and
18 NTU) to ensure the potential membrane fouling propensity (αcs) maintained at less
than 8.38 X 10¹² m-2. The value of 8.38 X 10¹² m-2 was taken as a reference point by
using a 20 NTU feed water sample for filtration of 30 minutes in the conventional
control system. It has been mentioned earlier that irrespective of the feed water turbidity
(20 NTU or below) the conventional system would allowed 30 minutes of filtration
duration followed by a 60 seconds of backwash duration. This translates to constant
water losses of 9.6% for the conventional system irrespective of the feed water
turbidity. After the backwash sequence, the cycle was repeated by another filtration
sequence with initial TMP of between 0.36 – 0.38 Bar which indicates a clean
membrane surface has been restored after the backwash.
The ANN control system exhibited a few advantages over the conventional system.
During the filtration sequence, the ANN predictive model was constantly predicting the
values of α which were dependence of the feed water characteristics. The estimated
values of α allowed rapid prediction of the potential membrane fouling propensity (αcs)
to ensure it was approximately the recommended value 8.38 X 10¹² m-2 at the end of the
filtration sequence. The conventional control system does not depend on the values of
αcs and fixed the filtration duration as 30 minutes for all feed water turbidities. Results
of the experiments indicated that the ANN control system allowed feed water with
lower turbidity to undergo longer filtration duration while the higher turbidity feed
water would have shorter filtration duration to ensure the recommend value of αcs at the
end of the filtration sequence.
Once the filtration sequence was completed, ANN controller number 2 would take
control of the backwash sequence. Under normal conditions, at the end of the filtration
sequence the values of αcs for all the feed water samples would be approximately 8.38
Univers
ity of
Mala
ya

178
X 1012 m-2. Typically the backwash duration would be around 50 – 51 seconds before
the commencement of the next filtration sequence. Allowing longer filtration duration
with similar backwash duration reduces water losses significantly when filtering lower
turbidity of feed water (such as the 8 NTU sample). The water losses for the 8 NTU
sample was only 4.9% compare to 9.6% for the conventional system. As for the 18 NTU
sample there was only marginal difference on the water losses for both control systems
because both the filtration and backwash durations were almost similar. The initial TMP
after each backwash for both control systems were between 0.36 – 0.38 Bar which
indicated that the membrane has been thoroughly cleaned after the backwash.
7.5 Comparisons between conventional and ANN control systems
The ANN control system provides an alternative method for the UF system with the
possibility of reducing water losses for low turbidity of feed water. It was also
suggested that the correlation of the cs and turbidity of the feed water is required to be
updated regularly as any significant changes might require re-training of all the ANN
model and controllers. Skilled and competence operators are required for these tasks.
Having unreliable cs and turbidity correlation would cause the estimated αcs to be less
accurate and increasing the chances of higher potential membrane fouling propensity.
Ensuring minimal capital expenditure on the control system upgrades remains a
priority to ensure commercial sustainability. The ANN control system is an alternative
control strategy which utilizes commonly used on-line data and simple laboratory
analysis to reduce water wastages and ensuring acceptable potential membrane fouling
propensity. It is not a control system to eliminate membrane fouling. Table 7.8
summarized the main differences between the conventional and ANN control systems.
Univers
ity of
Mala
ya
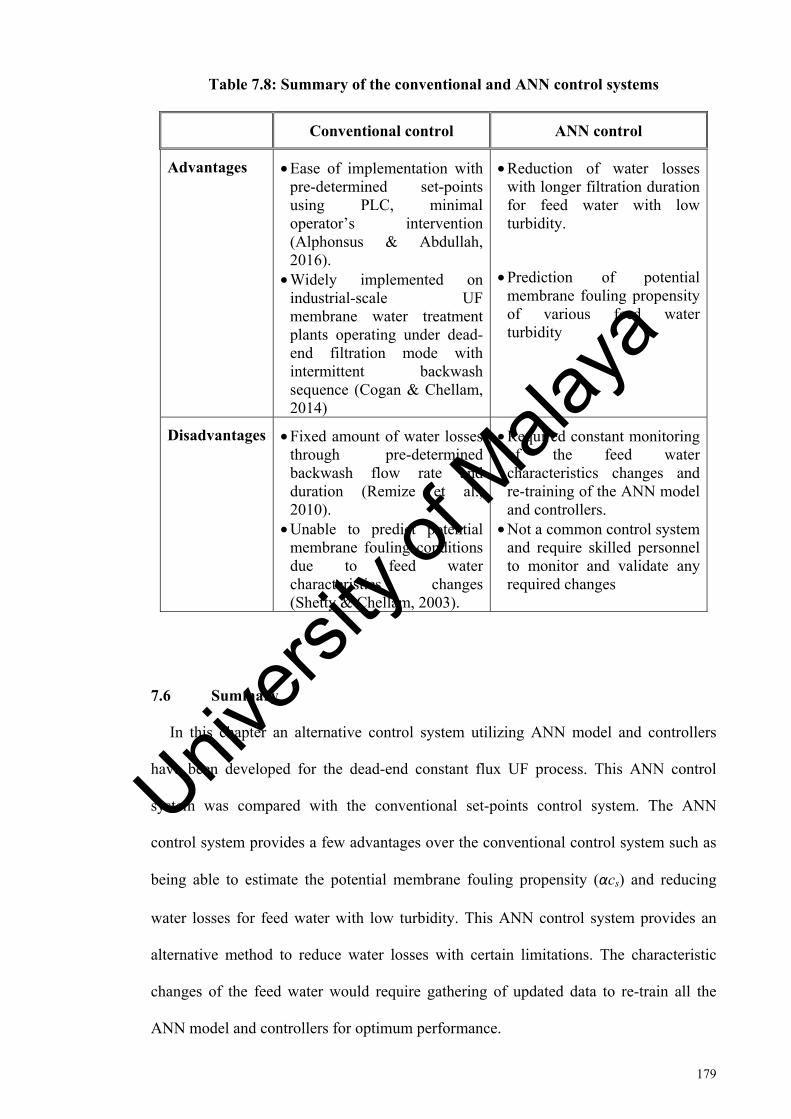
179
Table 7.8: Summary of the conventional and ANN control systems
Conventional control ANN control
Advantages • Ease of implementation with pre-determined set-points using PLC, minimal operator’s intervention (Alphonsus & Abdullah, 2016).
• Widely implemented on industrial-scale UF membrane water treatment plants operating under dead-end filtration mode with intermittent backwash sequence (Cogan & Chellam, 2014)
• Reduction of water losses with longer filtration duration for feed water with low turbidity.
• Prediction of potential membrane fouling propensity of various feed water turbidity
Disadvantages • Fixed amount of water losses through pre-determined backwash flow rate and duration (Remize et al., 2010).
• Unable to predict potential membrane fouling conditions due to feed water characteristics changes (Shetty & Chellam, 2003).
• Required constant monitoring of the feed water characteristics changes and re-training of the ANN model and controllers.
• Not a common control system and require skilled personnel to monitor and validate any required changes
7.6 Summary
In this chapter an alternative control system utilizing ANN model and controllers
have been developed for the dead-end constant flux UF process. This ANN control
system was compared with the conventional set-points control system. The ANN
control system provides a few advantages over the conventional control system such as
being able to estimate the potential membrane fouling propensity (αcs) and reducing
water losses for feed water with low turbidity. This ANN control system provides an
alternative method to reduce water losses with certain limitations. The characteristic
changes of the feed water would require gathering of updated data to re-train all the
ANN model and controllers for optimum performance.
Univers
ity of
Mala
ya

180
CHAPTER 8: CONCLUSIONS AND RECOMMENDATIONS
In this final chapter, summary findings of the research work and conclusions have
been highlighted. The achievements of the five objectives in this research were further
elaborated. Recommendations on possible future research work relevant to this current
study have also been suggested.
8.1 Findings and conclusions
The main objectives of this research encompassed various aspects of evaluations,
modelling and control of ultrafiltration membrane water treatment systems. In the first
objective, efforts were made to present a case study of an industrial-scale UF membrane
water treatment plant in Malaysia. This treatment plant was commissioned in 2013 to
provide safe potable water through the public-piped water supply system to a nearby
township. Both the operational and design criteria such as membrane surface area, feed
water characteristics, chemicals for UF membrane cleaning, membrane fouling,
electricity consumption, hydraulic backwash and chemicals cleaning efficiency were
analyzed in details. These actual issues encountered at the UF membrane water
treatment plant was examined with information obtained from literature. Detailed
analyses have indicated that most of these highlighted issues have been documented in
literature and possible solutions were suggested. This case study has elucidated that
practical and effective solutions could be obtained from literature for more effective
design and operation of industrial-scale UF membrane water treatment plants.
Various aspects of two industrial-scale water treatment systems were investigated
under the second objective. A detail case study was conducted to compare both the
Univers
ity of
Mala
ya

181
industrial-scale UF membrane and conventional media/sand filtration water treatment
systems. Five aspects of evaluation which encompassed capital cost, operational cost,
maintenance cost, filtrate quality and overall water losses were highlighted for both
systems. The overall cost or commercial aspects of the conventional media/sand
filtration system were still much lower than the UF system. In terms of the filtrate
quality, the UF system produced consistently better filtrate. Water losses from the
conventional system were much lower compared to the UF system. Sludge discharged
from the conventional system was heavily polluted by Aluminium based coagulant
which posed serious environmental impact compared with the non-chemical polluted
sludge from the UF system. The overall current cost of UF system was still much higher
than the conventional system but the former could produce consistently much better
filtrate quality and less harmful sludge to the environment. Further efforts to reduce the
overall cost of the UF systems would enable this technology to be more feasible in the
near future.
In the third case study, operational results from three different capacities of UF
systems representing laboratory-scale, pilot-scale and industrial-scale systems were
analyzed. Through this case study, it has been found that certain information from the
UF experimental systems (laboratory-scale and pilot-scale) such as filtrate quality
provides an accurate representation of the industrial-scale system. Other information
from the experimental systems such as UF module design, TMP through membrane
modules, feed pump efficiency and specific electricity utilization differs significantly
than the industrial-scale system. Although the absolute values of TMP differ, all three
UF systems exhibited similar TMP profiles pattern. These results provide a
comprehensive analysis to ensure more precise information extraction and interpretation
from these experimental systems to scale-up an industrial-scale UF system.
Univers
ity of
Mala
ya
182
A pilot-scale UF system has been designed to collect the necessary filtration data of
the dead-end constant flux UF process. These data were utilized to develop a hybrid
model for the process. This hybrid model consists of a first principle model using
Darcy’s law and an artificial neural networks (ANN) predictive model to estimate two
potential membrane fouling parameters. Firstly the specific cake resistance (α) was
predicted using the ANN model and subsequently this parameter was applied into the
first principle model to estimate the solids concentrations of the feed water (cs). The
hybrid model provides an alternative method by using only commonly available on-line
data and simple laboratory analysis to rapidly estimate these two parameters which
could fluctuate significantly due to characteristics changes of the natural feed water.
Regular monitoring of these estimated parameters allows preventive actions to be taken
when there is significantly high potential membrane fouling propensity detected in the
process.
In the final objective of the research, an UF experimental system was designed and
commissioned to conduct on-line experiments on both the conventional set-points and
ANN control systems. The ANN control system which consists of a predictive model
and two controllers were developed and implemented on-line. Similar experiments were
conducted using the conventional set-points control system to compare the efficiencies
of both control systems. The conventional set-points control system exhibited similar
water losses for all feed water samples of 20 NTU and below. Experimental results
using the ANN control system indicates the advantage of water losses reduction for feed
water samples of low turbidity. The ANN control system also provides information on
the estimated potential membrane fouling propensity of the feed water samples. This
alternative ANN control system has the potential to reduce the overall water losses from
an UF membrane water treatment system with fluctuating feed water turbidity under the
dead-end constant flux operation mode.
Univers
ity of
Mala
ya

183
8.2 Contributions and novelty of the study
Although many research studies have been conducted on UF water treatment
systems, they mostly concentrate on laboratory experiments and pilot-scale studies. This
research study delves into industrial-scale UF membrane system with three case studies
on an actual UF membrane water treatment plant in Malaysia. Practical performance
analyses and evaluations have been conducted on this UF membrane water treatment
plant. This process of highlighting the “real” issues and suggesting possible solutions
are much needed by industrial-scale UF membrane water treatment plants’ stakeholders.
Comparisons involving various aspects of the UF and conventional media/sand
filtration water treatment systems were also investigated to present the important
information for further evaluations.
One of the most prominent problems in engineering design is scaling-up processes
from laboratory experiments and pilot-scale results. In this research, efforts have been
taken to provide insights on the interpretation of data obtained from laboratory-scale
and pilot-scale experiments to scale-up an UF membrane water treatment plant.
Analysis and comparison on the operational data of the laboratory-scale, pilot-scale and
industrial-scale UF membrane water treatment systems enable better and more precise
information interpretation to scale-up the system.
A practical hybrid model developed in this research is specifically targeted for
industrial-scale UF membrane water treatment plants. This practical modelling approach
provides a method for predicting potential membrane fouling parameters without using
the laborious procedures required in the conventional analysis procedures. An artificial
neural networks (ANN) control system based on this modelling approach has been
developed and implemented on-line for the UF process to reduce water losses.
The overall scopes of this research work are to evaluate UF membrane water
treatment systems and developed a practical process model as well as control system for
Univers
ity of
Mala
ya

184
the UF process. Information generated from this research work enables better
comprehension on the UF membrane water treatment systems and applicable solutions
to ensure this technology becomes more viable.
8.3 Recommendations for future research works
This research work encompassed evaluation of case studies, development of a hybrid
model and alternative process control of the UF membrane water treatment systems.
Various practical aspects of the UF membrane water treatment systems have been
highlighted and investigated under this study. It is envisaged that the information
elaborated in this research works could provide some alternative practical solutions to
further improve the UF membrane water treatment systems. Several suggestions or
recommendations for future research works related in this field of study are highlighted
as follow:-
1. Evaluation of case study on other possible alternative methods to further
reduce the operational expenditure of the UF processes with renewable energy
resources such as solar or wind power. Case study on actual return of investment
(ROI) of using such renewable energy sources and the environmental impacts
compare to conventional fossil fuel electricity generation is highly beneficial for
stakeholders of industrial-scale water treatment plants.
2. Modelling of the UF process which takes into consideration the irreversible
fouling of the membrane. Although much more extensive efforts are required to
include the gradual increase of irreversible fouling into the model, it is more
Univers
ity of
Mala
ya

185
relevant for long term operations. The inclusion of gradual irreversible fouling
layer on the membrane would allow a more comprehensive study on the minimal
frequency of rigorous chemical cleaning such as clean in place (CIP) procedures
which are undesirable as it might potentially deforms the membranes.
3. Beside the hydraulic backwash cleaning presented in this research, further studies
on alternative control systems which could increase the efficiency of
chemical cleaning procedures should also be investigated. The standard
chemical enhanced backwash (CEB) procedures utilizing conventional set-points
control might not perform optimally under various feed water characteristics.
Alternative process control systems utilizing sufficient but not excessive
chemical to maximize cleaning efficiency on the membrane are highly beneficial
commercially as well as ensuring minimal environmental impacts.
Univers
ity of
Mala
ya

186
REFERENCES
Ab Razak, N. H., Praveena, S. M., Aris, A. Z., & Hashim, Z. (2015). Drinking water studies: A review on heavy metal, application of biomarker and health risk assessment (a special focus in Malaysia). Journal of Epidemiology and Global Health, 5(4), 297-310.
Ab Razak, N. H., Praveena, S. M., Aris, A. Z., & Hashim, Z. (2016). Quality of
Kelantan drinking water and knowledge, attitude and practice among the population of Pasir Mas, Malaysia. Public Health, 131, 103-111.
Afram, A., & Janabi-Sharifi, F. (2015). Black-box modeling of residential HVAC
system and comparison of gray-box and black-box modeling methods. Energy and Buildings, 94, 121-149.
Akhondi, E., Zamani, F., Law, A. W. K., Krantz, W. B., Fane, A. G., & Chew, J. W.
(2017). Influence of backwashing on the pore size of hollow fiber ultrafiltration membranes. Journal of Membrane Science, 521, 33-42.
Al-Bassam, E., & Alasseri, R. (2013). Measurable energy savings of installing variable
frequency drives for cooling towers’ fans, compared to dual speed motors. Energy and Buildings, 67, 261-266.
Al-Obaidi, M. A., Kara-Zaïtri, C., & Mujtaba, I. M. (2017). Wastewater treatment by
spiral wound reverse osmosis: Development and validation of a two dimensional process model. Journal of Cleaner Production, 140, 1429-1443.
Alhadidi, A., Kemperman, A. J. B., Schurer, R., Schippers, J. C., Wessling, M., & van
der Meer, W. G. J. (2012). Using SDI, SDI+ and MFI to evaluate fouling in a UF/RO desalination pilot plant. Desalination, 285, 153-162.
Alkaya, E., & Demirer, G. N. (2014). Sustainable textile production: a case study from a
woven fabric manufacturing mill in Turkey. Journal of Cleaner Production, 65, 595-603.
Alphonsus, E. R., & Abdullah, M. O. (2016). A review on the applications of
programmable logic controllers (PLCs). Renewable and Sustainable Energy Reviews, 60, 1185-1205.
Altuntas, S., Dereli, T., & Kusiak, A. (2016). Assessment of corporate innovation
capability with a data-mining approach: industrial case studies. Computers & Industrial Engineering, 102, 58-68.
Univers
ity of
Mala
ya

187
Alzahrani, S., Mohammad, A. W., Hilal, N., Abdullah, P., & Jaafar, O. (2013). Identification of foulants, fouling mechanisms and cleaning efficiency for NF and RO treatment of produced water. Separation and Purification Technology, 118, 324-341.
Amidpour, M., Hamedi, M. H., Mafi, M., Ghorbani, B., Shirmohammadi, R., & Salimi,
M. (2015). Sensitivity analysis, economic optimization, and configuration design of mixed refrigerant cycles by NLP techniques. Journal of Natural Gas Science and Engineering, 24, 144-155.
Amy, G., Ghaffour, N., Li, Z., Francis, L., Linares, R. V., Missimer, T., & Lattemann,
S. (2017). Membrane-based seawater desalination: Present and future prospects. Desalination, 401, 16-21.
Antón, E., Álvarez, J. R., Palacio, L., Prádanos, P., Hernández, A., Pihlajamäki, A., &
Luque, S. (2015). Ageing of polyethersulfone ultrafiltration membranes under long-term exposures to alkaline and acidic cleaning solutions. Chemical Engineering Science, 134, 178-195.
Arkhangelsky, E., Duek, A., & Gitis, V. (2012). Maximal pore size in UF membranes.
Journal of Membrane Science, 394-395, 89-97. Arkhangelsky, E., Kuzmenko, D., & Gitis, V. (2007). Impact of chemical cleaning on
properties and functioning of polyethersulfone membranes. Journal of Membrane Science, 305(1-2), 176-184.
Arkhangelsky, E., Lerch, A., Uhl, W., & Gitis, V. (2011). Organic fouling and floc
transport in capillaries. Separation and Purification Technology, 80(3), 482-489. Arnal, J. M., Garcia-Fayos, B., Lora, J., Verdú, G., & Sancho, M. (2008a). AQUAPOT:
study of several cleaning solutions to recover permeate flow in a humanitarian drinking water treatment facility based on spiral wound UF membrane. Preliminary test (I). Desalination, 221(1-3), 331-337.
Arnal, J. M., Garcia-Fayos, B., Verdu, G., Lora, J., & Sancho, M. (2008b). AQUAPOT:
Study of the causes in reduction of permeate flow in spiral wound UF membrane. Simulation of a non-rigorous cleaning protocol in a drinkable water treatment facility. Desalination, 222(1-3), 513-518.
Arnal, J. M., Sancho, M., García Fayos, B., Lora, J., & Verdú, G. (2007). Aquapot: UF
real applications for water potabilization in developing countries. Problems, location and solutions adopted. Desalination, 204(1–3), 316-321.
Univers
ity of
Mala
ya

188
Arndt, F., Ehlen, F., Schütz, S., Anlauf, H., & Nirschl, H. (2016). Influence of operating parameters and membrane materials on fouling of ceramic hollow fibre membranes. Separation and Purification Technology, 171, 289-296.
Arroyo, P., Tommelein, I. D., Ballard, G., & Rumsey, P. (2016). Choosing by
advantages: A case study for selecting an HVAC system for a net zero energy museum. Energy and Buildings, 111, 26-36.
Aslam, M., Charfi, A., Lesage, G., Heran, M., & Kim, J. (2017). Membrane bioreactors
for wastewater treatment: A review of mechanical cleaning by scouring agents to control membrane fouling. Chemical Engineering Journal, 307(Supplement C), 897-913.
Badrnezhad, R., & Mirza, B. (2014). Modeling and optimization of cross-flow
ultrafiltration using hybrid neural network-genetic algorithm approach. Journal of Industrial and Engineering Chemistry, 20(2), 528-543.
Bai, L., Liang, H., Crittenden, J., Qu, F., Ding, A., Ma, J., Du, X., Guo, S., & Li, G.
(2015). Surface modification of UF membranes with functionalized MWCNTs to control membrane fouling by NOM fractions. Journal of Membrane Science, 492, 400-411.
Bai, L., Qu, F., Liang, H., Ma, J., Chang, H., Wang, M., & Li, G. (2013). Membrane
fouling during ultrafiltration (UF) of surface water: Effects of sludge discharge interval (SDI). Desalination, 319, 18-24.
Barello, M., Manca, D., Patel, R., & Mujtaba, I. M. (2014). Neural network based
correlation for estimating water permeability constant in RO desalination process under fouling. Desalination, 345, 101-111.
Besmer, M. D., & Hammes, F. (2016). Short-term microbial dynamics in a drinking
water plant treating groundwater with occasional high microbial loads. Water Res, 107, 11-18.
Bessiere, Y., Guigui, C., Remize, P. J., & Cabassud, C. (2009). Coupling air-assisted
backwash and rinsing steps: a new way to improve ultrafiltration process operation for inside-out hollow fibre modules. Desalination, 240, 71-77.
Boerlage, S. F. E., Kennedy, M., Tarawneh, Z., De Faber, R., & Schippers, J. C. (2004).
Development of the MFI-UF in constant flux filtration. Desalination, 161(2), 103-113.
Univers
ity of
Mala
ya

189
Boerlage, S. F. E., Kennedy, M. D., Aniye, M. P., Abogrean, E., Tarawneh, Z. S., & Schippers, J. C. (2003). The MFI-UF as a water quality test and monitor. Journal of Membrane Science, 211, 271-289.
Boerlage, Ś. F. E., Kennedy, M. D., Aniye, M. p., Abogrean, E. M., El-Hodali, D. E. Y.,
Tarawneh, Z. S., & Schippers, J. C. (2000). Modified Fouling Indexultrafiltration to compare pretreatment processes of reverse osmosis feedwater. Desalination, 131(1–3), 201-214.
Boerlage, Ś. F. E., Kennedy, M. D., Aniye, M. P., Abogrean, E. M., Galjaard, G., &
Schippers, J. C. (1998). Monitoring particulate fouling in membrane systems. Desalination, 118(1–3), 131-142.
Bonnelye, V., Guey, L., & Castillo, J. D. (2008). UF/MF as RO pre-treatment: the real
benefit. Desalination, 222, 59-65. Bourcier, D., Féraud, J. P., Colson, D., Mandrick, K., Ode, D., Brackx, E., & Puel, F.
(2016). Influence of particle size and shape properties on cake resistance and compressibility during pressure filtration. Chemical Engineering Science, 144, 176-187.
Boyd, C. C., & Duranceau, S. J. (2013). Evaluation of ultrafiltration process fouling
using a novel transmembrane pressure (TMP) balance approach. Journal of Membrane Science, 446, 456-464.
Britton, T. C., Stewart, R. A., & O'Halloran, K. R. (2013). Smart metering: enabler for
rapid and effective post meter leakage identification and water loss management. Journal of Cleaner Production, 54, 166-176.
Bu-Rashid, K. A., & Czolkoss, W. (2007). Pilot Tests of Multibore UF Membrane at
Addur SWRO Desalination Plant, Bahrain. Desalination, 203(1-3), 229-242. Bugge, T. V., Jørgensen, M. K., Christensen, M. L., & Keiding, K. (2012). Modeling
cake buildup under TMP-step filtration in a membrane bioreactor: Cake compressibility is significant. Water Res, 46(14), 4330-4338.
Burke, D. R., Anderson, J., Gilcrease, P. C., & Menkhaus, T. J. (2011). Enhanced solid–
liquid clarification of lignocellulosic slurries using polyelectrolyte flocculating agents. Biomass and Bioenergy, 35(1), 391-401.
Univers
ity of
Mala
ya

190
Cabassud, M., Delgrange-Vincent, N., Cabassud, C., Durand-Bourlier, L., & Lainé, J. M. (2002). Neural networks: a tool to improve UF plant productivity. Desalination, 145(1–3), 223-231.
Cano, G., Steinle, P., Daurelle, J. V., Wyart, Y., Glucina, K., Bourdiol, D., & Moulin, P.
(2013). Determination of pressure and velocity fields in ultrafiltration membrane modules used in drinking water production. Journal of Membrane Science, 431, 221-232.
Carbonell-Alcaina, C., Corbatón-Báguena, M.-J., Álvarez-Blanco, S., Bes-Piá, M. A.,
Mendoza-Roca, J. A., & Pastor-Alcañiz, L. (2016). Determination of fouling mechanisms in polymeric ultrafiltration membranes using residual brines from table olive storage wastewaters as feed. Journal of Food Engineering, 187, 14-23.
Castaing, J. B., Massé, A., Pontié, M., Séchet, V., Haure, J., & Jaouen, P. (2010).
Investigating submerged ultrafiltration (UF) and microfiltration (MF) membranes for seawater pre-treatment dedicated to total removal of undesirable micro-algae. Desalination, 253(1–3), 71-77.
Chang, H., Liang, H., Qu, F., Ma, J., Ren, N., & Li, G. (2016a). Towards a better
hydraulic cleaning strategy for ultrafiltration membrane fouling by humic acid: Effect of backwash water composition. Journal of Environmental Sciences, 43, 177-186.
Chang, H., Liang, H., Qu, F., Shao, S., Yu, H., Liu, B., Gao, W., & Li, G. (2016b). Role
of backwash water composition in alleviating ultrafiltration membrane fouling by sodium alginate and the effectiveness of salt backwashing. Journal of Membrane Science, 499, 429-441.
Chang, H., Qu, F., Liu, B., Yu, H., Li, K., Shao, S., Li, G., & Liang, H. (2015).
Hydraulic irreversibility of ultrafiltration membrane fouling by humic acid: Effects of membrane properties and backwash water composition. Journal of Membrane Science, 493, 723-733.
Chang, I.-S., & Kim, S.-N. (2005). Wastewater treatment using membrane filtration—
effect of biosolids concentration on cake resistance. Process Biochemistry, 40(3–4), 1307-1314.
Chen, F., Peldszus, S., Peiris, R. H., Ruhl, A. S., Mehrez, R., Jekel, M., Legge, R. L., &
Huck, P. M. (2014). Pilot-scale investigation of drinking water ultrafiltration membrane fouling rates using advanced data analysis techniques. Water Res, 48, 508-518.
Univers
ity of
Mala
ya

191
Chen, V., Fane, A. G., Madaeni, S., & Wenten, I. G. (1997). Particle deposition during membrane filtration of colloids: transition between concentration polarization and cake formation. Journal of Membrane Science, 125(1), 109-122.
Cheng, X., Liang, H., Ding, A., Qu, F., Shao, S., Liu, B., Wang, H., Wu, D., & Li, G.
(2016). Effects of pre-ozonation on the ultrafiltration of different natural organic matter (NOM) fractions: Membrane fouling mitigation, prediction and mechanism. Journal of Membrane Science, 505, 15-25.
Cheng, Y.-M. (2014). An exploration into cost-influencing factors on construction
projects. International Journal of Project Management, 32(5), 850-860. Chithra, S., Kumar, S. R. R. S., Chinnaraju, K., & Alfin Ashmita, F. (2016). A
comparative study on the compressive strength prediction models for High Performance Concrete containing nano silica and copper slag using regression analysis and Artificial Neural Networks. Construction and Building Materials, 114, 528-535.
Choi, J.-S., & Kim, J.-T. (2015). Modeling of full-scale reverse osmosis desalination
system: Influence of operational parameters. Journal of Industrial and Engineering Chemistry, 21, 261-268.
Choi, Y.-J., Oh, H., Lee, S., Nam, S.-H., & Hwang, T.-M. (2012). Investigation of the
filtration characteristics of pilot-scale hollow fiber submerged MF system using cake formation model and artificial neural networks model. Desalination, 297, 20-29.
Choo, K., Lee, H., & Choi, S. (2005). Iron and manganese removal and membrane
fouling during UF in conjunction with prechlorination for drinking water treatment. Journal of Membrane Science, 267(1-2), 18-26.
Cogan, N. G., & Chellam, S. (2014). A method for determining the optimal back-
washing frequency and duration for dead-end microfiltration. Journal of Membrane Science, 469, 410-417.
Cool, G., Lebel, A., Sadiq, R., & Rodriguez, M. J. (2014). Impact of catchment
geophysical characteristics and climate on the regional variability of dissolved organic carbon (DOC) in surface water. Science of The Total Environment, 490, 947-956.
Univers
ity of
Mala
ya
192
Córdova, A., Astudillo, C., Guerrero, C., Vera, C., & Illanes, A. (2016). Assessment of the fouling mechanisms of an ultrafiltration membrane bioreactor during synthesis of galacto-oligosaccharides: Effect of the operational variables. Desalination, 393, 79-89.
Dahal, K., Al-Arfaj, K., & Paudyal, K. (2015). Modelling generator maintenance
scheduling costs in deregulated power markets. European Journal of Operational Research, 240(2), 551-561.
Damour, C., Benne, M., Lebreton, C., Deseure, J., & Grondin-Perez, B. (2014). Real-
time implementation of a neural model-based self-tuning PID strategy for oxygen stoichiometry control in PEM fuel cell. International Journal of Hydrogen Energy, 39(24), 12819-12825.
Dassanayake, K. B., Jayasinghe, G. Y., Surapaneni, A., & Hetherington, C. (2015). A
review on alum sludge reuse with special reference to agricultural applications and future challenges. Waste Management, 38, 321-335.
Davies, J.-M., & Mazumder, A. (2003). Health and environmental policy issues in
Canada: the role of watershed management in sustaining clean drinking water quality at surface sources. Journal of Environmental Management, 68(3), 273-286.
De Groote, H., & Traoré, O. (2005). The cost of accuracy in crop area estimation.
Agricultural Systems, 84(1), 21-38. Decarolis, J., Hong, S., & Taylor, J. (2001). Fouling behavior of a pilot scale inside-out
hollow fiber UF membrane during dead-end filtration of tertiary wastewater. Journal of Membrane Science, 191(1–2), 165-178.
Delgrange-Vincent, N., Cabassud, C., Cabassud, M., Durand-Bourlier, L., & Laîné, J.
M. (2000). Neural networks for long term prediction of fouling and backwash efficiency in ultrafiltration for drinking water production. Desalination, 131(1–3), 353-362.
Delgrange, N., Cabassud, C., Cabassud, M., Durand-Bourlier, L., & Lainé, J. M. (1998).
Neural networks for prediction of ultrafiltration transmembrane pressure – application to drinking water production. Journal of Membrane Science, 150(1), 111-123.
Di Zio, A., Prisciandaro, M., & Barba, D. (2005). Disinfection of surface waters with
UF membranes. Desalination, 179(1-3), 297-305.
Univers
ity of
Mala
ya

193
El-Abbassi, A., Kiai, H., Raiti, J., & Hafidi, A. (2014). Application of ultrafiltration for olive processing wastewaters treatment. Journal of Cleaner Production, 65, 432-438.
Enders, D. W., Zuckerman, A. L., & Fisch, M. R. (2015). A low cost, reusable,
sustainable, batch water purification system. Water Practice and Technology, 10(2), 291-297.
Field, R. W., & Pearce, G. K. (2011). Critical, sustainable and threshold fluxes for
membrane filtration with water industry applications. Adv Colloid Interface Sci, 164(1–2), 38-44.
Filloux, E., Gallard, H., & Croue, J. P. (2012). Identification of effluent organic matter
fractions responsible for low-pressure membrane fouling. Water Res, 46(17), 5531-5540.
Foley, G. (2006). A review of factors affecting filter cake properties in dead-end
microfiltration of microbial suspensions. Journal of Membrane Science, 274(1–2), 38-46.
Foscoliano, C., Del Vigo, S., Mulas, M., & Tronci, S. (2016). Predictive control of an
activated sludge process for long term operation. Chemical Engineering Journal, 304, 1031-1044.
Fujioka, T., Khan, S. J., McDonald, J. A., & Nghiem, L. D. (2014). Nanofiltration of
trace organic chemicals: A comparison between ceramic and polymeric membranes. Separation and Purification Technology, 136, 258-264.
Ganguly, S., Patra, A., Chattopadhyay, P. P., & Datta, S. (2016). New training strategies
for neural networks with application to quaternary Al–Mg–Sc–Cr alloy design problems. Applied Soft Computing, 46, 260-266.
Gao, L. X., Gu, H., Rahardianto, A., Christofides, P. D., & Cohen, Y. (2017). Self-
adaptive cycle-to-cycle control of in-line coagulant dosing in ultrafiltration for pre-treatment of reverse osmosis feed water. Desalination, 401, 22-31.
Gao, L. X., Rahardianto, A., Gu, H., Christofides, P. D., & Cohen, Y. (2016). Novel
design and operational control of integrated ultrafiltration — Reverse osmosis system with RO concentrate backwash. Desalination, 382, 43-52.
Univers
ity of
Mala
ya
194
Gautam, A., & Soh, Y. C. (2015). Stabilizing model predictive control using parameter-dependent dynamic policy for nonlinear systems modeled with neural networks. Journal of Process Control, 36, 11-21.
Ghosh, S., Chatterjee, R., & Shanker, P. (2016). Estimation of ash, moisture content and
detection of coal lithofacies from well logs using regression and artificial neural network modelling. Fuel, 177, 279-287.
Glueckstern, P., Priel, M., Thoma, A., & Gelman, Y. (2000). Desalination of brackish
fish pond effluents — pilot testing and comparative economic evaluation of integrated UF-RO systems vs. conventional systems. Desalination, 132(1–3), 55-64.
Goh, P. S., Matsuura, T., Ismail, A. F., & Hilal, N. (2016). Recent trends in membranes
and membrane processes for desalination. Desalination, 391, 43-60. Gu, H., Rahardianto, A., Gao, L. X., Christofides, P. D., & Cohen, Y. (2016).
Ultrafiltration with self-generated RO concentrate pulse backwash in a novel integrated seawater desalination UF-RO system. Journal of Membrane Science, 520, 111-119.
Guan, D., Fung, W. C., Lau, F., Deng, C., Leung, A., Dai, J., & Chen, G. H. (2014).
Pilot trial study of a compact macro-filtration membrane bioreactor process for saline wastewater treatment. Water Science and Technology, 70(1), 120-126.
Guastalli, A. R., Simon, F. X., Penru, Y., Kerchove, A. d., Llorens, J., & Baig, S.
(2013). Comparison of DMF and UF pre-treatment for particulate material and dissolved organic matter removal in SWRO desalination. Desalination, 322, 144-150.
Guo, W., Ngo, H. H., & Li, J. (2012). A mini-review on membrane fouling. Bioresour
Technol, 122, 27-34. Halpern, D. F., McArdle, J., & Antrim, B. (2005). UF pretreatment for SWRO: pilot
studies. Desalination, 182(1–3), 323-332. Hamed, M. M., Khalafallah, M. G., & Hassanien, E. A. (2004). Prediction of
wastewater treatment plant performance using artificial neural networks. Environmental Modelling & Software, 19(10), 919-928.
Univers
ity of
Mala
ya

195
Han, Q., Li, W., Trinh, T. A., Liu, X., & Chew, J. W. (2017). A network-based approach to interpreting pore blockage and cake filtration during membrane fouling. Journal of Membrane Science, 528, 112-125.
Handley, C., Brandon, N. P., & van der Vorst, R. (2002). Impact of the European Union
vehicle waste directive on end-of-life options for polymer electrolyte fuel cells. Journal of Power Sources, 106(1–2), 344-352.
Hasan, H. A., Abdullah, S. R. S., Kamarudin, S. K., & Kofli, N. T. (2011). Response
surface methodology for optimization of simultaneous COD, NH4+–N and Mn2+ removal from drinking water by biological aerated filter. Desalination, 275(1–3), 50-61.
Ho, J. S., Sim, L. N., Gu, J., Webster, R. D., Fane, A. G., & Coster, H. G. L. (2016). A
threshold flux phenomenon for colloidal fouling in reverse osmosis characterized by transmembrane pressure and electrical impedance spectroscopy. Journal of Membrane Science, 500, 55-65.
Hög, A., Ludwig, J., & Beery, M. (2015). The use of integrated flotation and ceramic
membrane filtration for surface water treatment with high loads of suspended and dissolved organic matter. Journal of Water Process Engineering, 6, 129-135.
Holloway, R. W., Wait, A. S., Fernandes da Silva, A., Herron, J., Schutter, M. D.,
Lampi, K., & Cath, T. Y. (2015). Long-term pilot scale investigation of novel hybrid ultrafiltration-osmotic membrane bioreactors. Desalination, 363, 64-74.
Howe, K. J., Marwah, A., Chiu, K.-P., & Adham, S. S. (2007). Effect of membrane
configuration on bench-scale MF and UF fouling experiments. Water Res, 41(17), 3842-3849.
Huang, H., Young, T. A., & Jacangelo, J. G. (2008). Unified membrane fouling index
for low pressure membrane filtration of natural waters: Principles and methodology. Environmental Science & Technology, 42, 714-720.
Huang, J., Liu, L., Zeng, G., Li, X., Peng, L., Li, F., Jiang, Y., Zhao, Y., & Huang, X.
(2014). Influence of feed concentration and transmembrane pressure on membrane fouling and effect of hydraulic flushing on the performance of ultrafiltration. Desalination, 335(1), 1-8.
Igos, E., Dalle, A., Tiruta-Barna, L., Benetto, E., Baudin, I., & Mery, Y. (2014). Life
Cycle Assessment of water treatment: what is the contribution of infrastructure and operation at unit process level? Journal of Cleaner Production, 65, 424-431.
Univers
ity of
Mala
ya

196
Iritani, E., Katagiri, N., Takenaka, T., & Yamashita, Y. (2015). Membrane pore blocking during cake formation in constant pressure and constant flux dead-end microfiltration of very dilute colloids. Chemical Engineering Science, 122, 465-473.
Iritani, E., Mukai, Y., & Hagihara, E. (2002). Measurements and evaluation of
concentration distributions in filter cake formed in dead-end ultrafiltration of protein solutions. Chemical Engineering Science, 57(1), 53-62.
Jalali, A., Shockravi, A., Vatanpour, V., & Hajibeygi, M. (2016). Preparation and
characterization of novel microporous ultrafiltration PES membranes using synthesized hydrophilic polysulfide-amide copolymer as an additive in the casting solution. Microporous and Mesoporous Materials, 228, 1-13.
Joseph, L., Flora, J. R. V., Park, Y.-G., Badawy, M., Saleh, H., & Yoon, Y. (2012).
Removal of natural organic matter from potential drinking water sources by combined coagulation and adsorption using carbon nanomaterials. Separation and Purification Technology, 95, 64-72.
Ju, Y., & Hong, S. (2014). Nano-colloidal fouling mechanisms in seawater reverse
osmosis process evaluated by cake resistance simulator-modified fouling index nanofiltration. Desalination, 343, 88-96.
Jung, J. T., Kim, J. F., Wang, H. H., di Nicolo, E., Drioli, E., & Lee, Y. M. (2016).
Understanding the non-solvent induced phase separation (NIPS) effect during the fabrication of microporous PVDF membranes via thermally induced phase separation (TIPS). Journal of Membrane Science, 514, 250-263.
Kabsch-Korbutowicz, M. (2006). Impact of pre-coagulation on ultrafiltration process
performance. Desalination, 194(1–3), 232-238. Kamp, P. C., Kruithof, J. C., & Folmer, H. C. (2000). UF/RO treatment plant
Heemskerk: from challenge to full scale application. Desalination, 131(1–3), 27-35.
Karelovic, P., Putz, E., & Cipriano, A. (2015). A framework for hybrid model predictive
control in mineral processing. Control Engineering Practice, 40, 1-12. Katsoufidou, K., Yiantsios, S. G., & Karabelas, A. J. (2008). An experimental study of
UF membrane fouling by humic acid and sodium alginate solutions: the effect of backwashing on flux recovery. Desalination, 220(1-3), 214-227.
Univers
ity of
Mala
ya

197
Kawamura, S. (2000). Integrated design and operation of water treatment facilities (2nd ed.). New York, USA: John Wiley & Sons.
Keeley, J., Jarvis, P., & Judd, S. J. (2012). An economic assessment of coagulant
recovery from water treatment residuals. Desalination, 287, 132-137. Khalili, N. R., Duecker, S., Ashton, W., & Chavez, F. (2015). From cleaner production
to sustainable development: the role of academia. Journal of Cleaner Production, 96, 30-43.
Khan, S. J., Visvanathan, C., & Jegatheesan, V. (2009). Prediction of membrane fouling
in MBR systems using empirically estimated specific cake resistance. Bioresour Technol, 100(23), 6133-6136.
Kim, D. H., Shon, H. K., Sharma, G., & Cho, J. (2011). Charge effect of natural organic
matter for ultrafiltration and nanofiltration membranes. Journal of Industrial and Engineering Chemistry, 17(1), 109-113.
Kim, J., & DiGiano, F. A. (2009). Fouling models for low-pressure membrane systems.
Separation and Purification Technology, 68(3), 293-304. Kim, K., & Lee, K.-p. (2016). Collaborative product design processes of industrial
design and engineering design in consumer product companies. Design Studies, 46, 226-260.
Kostoglou, M., & Karabelas, A. J. (2008). On the structure of the single-phase flow
field in hollow fiber membrane modules during filtration. Journal of Membrane Science, 322(1), 128-138.
Kostoglou, M., & Karabelas, A. J. (2016). Dynamic operation of flat sheet desalination-
membrane elements: A comprehensive model accounting for organic fouling. Computers & Chemical Engineering, 93, 1-12.
Kumar, R., & Pal, P. (2013). Turning hazardous waste into value-added products:
production and characterization of struvite from ammoniacal waste with new approaches. Journal of Cleaner Production, 43, 59-70.
Laîné, J. M., Vial, D., & Moulart, P. (2000). Status after 10 years of operation —
overview of UF technology today. Desalination, 131(1–3), 17-25.
Univers
ity of
Mala
ya

198
Le, N. L., & Nunes, S. P. (2016). Materials and membrane technologies for water and energy sustainability. Sustainable Materials and Technologies, 7, 1-28.
Lee, C.-S., Lee, Y.-C., & Chiang, H.-M. (2016a). Abrupt state change of river water
quality (turbidity): Effect of extreme rainfalls and typhoons. Science of The Total Environment, 557–558, 91-101.
Lee, J., Ahn, W.-Y., & Lee, C.-H. (2001). Comparison of the filtration characteristics
between attached and suspended growth microorganisms in submerged membrane bioreactor. Water Res, 35(10), 2435-2445.
Lee, K.-J., & Park, H.-D. (2016). The most densified vertically-aligned carbon nanotube
membranes and their normalized water permeability and high pressure durability. Journal of Membrane Science, 501, 144-151.
Lee, K. E., Mokhtar, M., Mohd Hanafiah, M., Abdul Halim, A., & Badusah, J. (2016b).
Rainwater harvesting as an alternative water resource in Malaysia: potential, policies and development. Journal of Cleaner Production, 126, 218-222.
Levitsky, I., Duek, A., Arkhangelsky, E., Pinchev, D., Kadoshian, T., Shetrit, H., Naim,
R., & Gitis, V. (2011). Understanding the oxidative cleaning of UF membranes. Journal of Membrane Science, 377(1-2), 206-213.
Levitsky, I., Duek, A., Naim, R., Arkhangelsky, E., & Gitis, V. (2012). Cleaning UF
membranes with simple and formulated solutions. Chemical Engineering Science, 69(1), 679-683.
Li, L. K., Shao, S., & Yiu, K.-F. C. (2013). A new optimization algorithm for single
hidden layer feedforward neural networks1. Applied Soft Computing, 13(5), 2857-2862.
Li, S., & Li, Y. (2016). Model predictive control of an intensified continuous reactor
using a neural network Wiener model. Neurocomputing, 185, 93-104. Li, X., Li, J., Cui, Z., & Yao, Y. (2016a). Modeling of filtration characteristics during
submerged hollow fiber membrane microfiltration of yeast suspension under aeration condition. Journal of Membrane Science, 510, 455-465.
Li, Y.-S., Shi, L.-C., Gao, X.-F., & Huang, J.-G. (2016b). Cleaning effects of oxalic
acid under ultrasound to the used reverse osmosis membranes with an online cleaning and monitoring system. Desalination, 390, 62-71.
Univers
ity of
Mala
ya

199
Lipp, P., & Baldaufb, G. (2002). Application of out-in MF/UF-systems for drinking water treatment with air supported backwash - three case studies. Desalination, 147, 63-68.
Liu, M., Woudstra, T., Promes, E. J. O., Restrepo, S. Y. G., & Aravind, P. V. (2014).
System development and self-sustainability analysis for upgrading human waste to power. Energy, 68, 377-384.
Liu, Q.-F., & Kim, S.-H. (2008). Evaluation of membrane fouling models based on
bench-scale experiments: A comparison between constant flowrate blocking laws and artificial neural network (ANNs) model. Journal of Membrane Science, 310(1–2), 393-401.
Liu, Q.-F., Kim, S.-H., & Lee, S. (2009). Prediction of microfiltration membrane
fouling using artificial neural network models. Separation and Purification Technology, 70(1), 96-102.
Liu, Y., Chou, C.-P., Chen, J., & Lai, J.-Y. (2016). Active learning assisted strategy of
constructing hybrid models in repetitive operations of membrane filtration processes: Using case of mixture of bentonite clay and sodium alginate. Journal of Membrane Science, 515, 245-257.
Liu, Y., Luo, T., Liu, Z., Kong, X., Li, J., & Tan, R. (2015). A comparative analysis of
urban and rural construction land use change and driving forces: Implications for urban–rural coordination development in Wuhan, Central China. Habitat International, 47, 113-125.
Llanos, J., Rodrigo, M. A., Cañizares, P., Furtuna, R. P., & Curteanu, S. (2013). Neuro-
evolutionary modelling of the electrodeposition stage of a polymer-supported ultrafiltration–electrodeposition process for the recovery of heavy metals. Environmental Modelling & Software, 42, 133-142.
Loganathan, K., Chelme-Ayala, P., & Gamal El-Din, M. (2016). Pilot-scale study on the
treatment of basal aquifer water using ultrafiltration, reverse osmosis and evaporation/crystallization to achieve zero-liquid discharge. Journal of Environmental Management, 165, 213-223.
Lohwacharin, J., Yang, Y., Watanabe, A., Phetrak, A., & Takizawa, S. (2014). Removal
of DOM and AOC in a full-scale advanced water treatment plant: effects of operational periods of BAC filters. Water Science and Technology: Water Supply, 14(1), 165-172.
Univers
ity of
Mala
ya

200
López-Roldán, R., Platikanov, S., Martín-Alonso, J., Tauler, R., González, S., & Cortina, J. L. (2016). Integration of Ultraviolet–Visible spectral and physicochemical data in chemometrics analysis for improved discrimination of water sources and blends for application to the complex drinking water distribution network of Barcelona. Journal of Cleaner Production, 112, 4789-4798.
Ma, J., Qin, L., Zhang, X., & Huang, H. (2016). Temporal evolution of the selectivity-
permeability relationship during porous membrane filtration of protein solutions. Journal of Membrane Science, 514, 385-397.
Mahdi, F. M., & Holdich, R. G. (2013). Laboratory cake filtration testing using constant
rate. Chemical Engineering Research and Design, 91(6), 1145-1154. Makungo, R., Odiyo, J. O., & Tshidzumba, N. (2011). Performance of small water
treatment plants: The case study of Mutshedzi Water Treatment Plant. Physics and Chemistry of the Earth, Parts A/B/C, 36(14–15), 1151-1158.
Manth, T., Frenzel, J., & Vlerken, A. v. (1998). Large-scale application of UF and RO
in the production of demineralized water. Desalination, 118, 255-262. Marbelia, L., Mulier, M., Vandamme, D., Muylaert, K., Szymczyk, A., & Vankelecom,
I. F. J. (2016). Polyacrylonitrile membranes for microalgae filtration: Influence of porosity, surface charge and microalgae species on membrane fouling. Algal Research, 19, 128-137.
Marchant, R., Reading, D., Ridd, J., Campbell, S., & Ridd, P. (2015). A drifter for
measuring water turbidity in rivers and coastal oceans. Marine Pollution Bulletin, 91(1), 102-106.
Marshall, L. R., Prakashbabu, B. C., Ferreira, J. P., Buzdugan, S. N., Stärk, K. D. C., &
Guitian, J. (2016). Risk factors for Taenia saginata cysticercus infection in cattle in the United Kingdom: A farm-level case-control study and assessment of the role of movement history, age and sex. Preventive Veterinary Medicine, 135, 1-8.
Marzouk, M., & Elkadi, M. (2016). Estimating water treatment plants costs using factor
analysis and artificial neural networks. Journal of Cleaner Production, 112, 4540-4549.
Univers
ity of
Mala
ya
201
Massé, A., Arab, O., Séchet, V., Jaouen, P., Pontié, M., Sabiri, N.-E., & Plantier, S. (2015). Performances of dead-end ultrafiltration of seawater: From the filtration and backwash efficiencies to the membrane fouling mechanisms. Separation and Purification Technology, 156, 512-521.
Massé, A., Thi, H. N., Legentilhomme, P., & Jaouen, P. (2011). Dead-end and
tangential ultrafiltration of natural salted water: Influence of operating parameters on specific energy consumption. Journal of Membrane Science, 380(1-2), 192-198.
Mendret, J., Guigui, C., Schmitz, P., & Cabassud, C. (2009). In situ dynamic
characterisation of fouling under different pressure conditions during dead-end filtration: Compressibility properties of particle cakes. Journal of Membrane Science, 333(1–2), 20-29.
Meng, F., Zhang, H., Yang, F., Hou, X., Lei, B., Zhang, L., Wu, Y., Wang, J., & Shi, Z.
(2017). Study of efficiency of a multistage centrifugal pump used in engine waste heat recovery application. Applied Thermal Engineering, 110, 779-786.
Mercure, J.-F., & Salas, P. (2013). On the global economic potentials and marginal
costs of non-renewable resources and the price of energy commodities. Energy Policy, 63, 469-483.
Meroney, R. N. (2016). Ten questions concerning hybrid computational/physical model
simulation of wind flow in the built environment. Building and Environment, 96, 12-21.
Mierzwa, J. C., da Silva, M. C. C., Veras, L. R. V., Subtil, E. L., Rodrigues, R., Li, T.,
& Landenberger, K. R. (2012). Enhancing spiral-wound ultrafiltration performance for direct drinking water treatment through operational procedures improvement: A feasible option for the Sao Paulo Metropolitan Region. Desalination, 307, 68-75.
Miller, D. J., Kasemset, S., Paul, D. R., & Freeman, B. D. (2014). Comparison of
membrane fouling at constant flux and constant transmembrane pressure conditions. Journal of Membrane Science, 454, 505-515.
Misra, A. K., & Singh, V. (2012). A delay mathematical model for the spread and
control of water borne diseases. Journal of Theoretical Biology, 301, 49-56.
Univers
ity of
Mala
ya

202
Mitrouli, S. T., Yiantsios, S. G., Karabelas, A. J., Mitrakas, M., Follesdal, M., & Kjolseth, P. A. (2008). Pretreatment for desalination of seawater from an open intake by dual-media filtration: Pilot testing and comparison of two different media. Desalination, 222, 24-37.
Molinos-Senante, M., Hernández-Sancho, F., Sala-Garrido, R., & Cirelli, G. (2013).
Economic feasibility study for intensive and extensive wastewater treatment considering greenhouse gases emissions. Journal of Environmental Management, 123, 98-104.
Monnot, M., Laborie, S., & Cabassud, C. (2016). Granular activated carbon filtration
plus ultrafiltration as a pretreatment to seawater desalination lines: Impact on water quality and UF fouling. Desalination, 383, 1-11.
Monteiro, L., Figueiredo, D., Dias, S., Freitas, R., Covas, D., Menaia, J., & Coelho, S.
T. (2014). Modelling of chlorine decay in drinking water supply systems using EPANET MSX. Procedia Engineering, 70, 1192-1200.
Moon, J. W., & Jung, S. K. (2016). Development of a thermal control algorithm using
artificial neural network models for improved thermal comfort and energy efficiency in accommodation buildings. Applied Thermal Engineering, 103, 1135-1144.
Mota, M., Teixeira, J. A., & Yelshin, A. (2002). Influence of cell-shape on the cake
resistance in dead-end and cross-flow filtrations. Separation and Purification Technology, 27(2), 137-144.
Ní Mhurchú, J., & Foley, G. (2006). Dead-end filtration of yeast suspensions:
Correlating specific resistance and flux data using artificial neural networks. Journal of Membrane Science, 281(1–2), 325-333.
Nourani, V., Hosseini Baghanam, A., Adamowski, J., & Kisi, O. (2014). Applications
of hybrid wavelet–Artificial Intelligence models in hydrology: A review. Journal of Hydrology, 514, 358-377.
Noyes, A., Basha, J., Frostad, J., Cook, S., Millard, D., Mullin, J., LaCasse, D., Wright,
R. S., Huffman, B., et al. (2015). A modular approach for the ultra-scale-down of depth filtration. Journal of Membrane Science, 496, 199-210.
Nunes, B., Bennett, D., & Marques Júnior, S. (2014). Sustainable agricultural
production: an investigation in Brazilian semi-arid livestock farms. Journal of Cleaner Production, 64, 414-425.
Univers
ity of
Mala
ya

203
Oishi, H., Kaneko, H., & Funatsu, K. (2015). Adaptive model and model selection for long-term transmembrane pressure prediction in membrane bioreactors. Journal of Membrane Science, 494, 86-91.
Osterroth, S., Preston, C., Markicevic, B., Iliev, O., & Hurwitz, M. (2016). The
permeability prediction of beds of poly-disperse spheres with applicability to the cake filtration. Separation and Purification Technology, 165, 114-122.
Park, P.-K., Lee, C.-H., & Lee, S. (2006). Variation of specific cake resistance
according to size and fractal dimension of chemical flocs in a coagulation-microfiltration process. Desalination, 199(1–3), 213-215.
Pavanelli, D., & Bigi, A. (2005). Indirect Methods to Estimate Suspended Sediment
Concentration: Reliability and Relationship of Turbidity and Settleable Solids. Biosystems Engineering, 90(1), 75-83.
Pawlus, W., Karimi, H. R., & Robbersmyr, K. G. (2013). Data-based modeling of
vehicle collisions by nonlinear autoregressive model and feedforward neural network. Information Sciences, 235, 65-79.
Pearce, G. (2007a). Introduction to membranes: Filtration for water and wastewater
treatment. Filtration & Separation, 44(2), 24-27. Pearce, G. K. (2007b). The case for UF/MF pretreatment to RO in seawater
applications. Desalination, 203(1–3), 286-295. Pearce, G. K. (2008). UF/MF pre-treatment to RO in seawater and wastewater reuse
applications: a comparison of energy costs. Desalination, 222(1-3), 66-73. Pearce, G. K. (2012). Quantifying the Benefit of Membrane Improvement on the Total
Water Cost of Drinking Water Production. Procedia Engineering, 44, 204-205. Peiris, R. H., Jaklewicz, M., Budman, H., Legge, R. L., & Moresoli, C. (2013).
Assessing the role of feed water constituents in irreversible membrane fouling of pilot-scale ultrafiltration drinking water treatment systems. Water Res, 47(10), 3364-3374.
Pellegrin, B., Mezzari, F., Hanafi, Y., Szymczyk, A., Remigy, J.-C., & Causserand, C.
(2015). Filtration performance and pore size distribution of hypochlorite aged PES/PVP ultrafiltration membranes. Journal of Membrane Science, 474, 175-186.
Univers
ity of
Mala
ya

204
Pestana, C. J., Reeve, P. J., Sawade, E., Voldoire, C. F., Newton, K., Praptiwi, R., Collingnon, L., Dreyfus, J., Hobson, P., et al. (2016). Fate of cyanobacteria in drinking water treatment plant lagoon supernatant and sludge. Science of The Total Environment, 565, 1192-1200.
Petrinic, I., Korenak, J., Povodnik, D., & Hélix-Nielsen, C. (2015). A feasibility study
of ultrafiltration/reverse osmosis (UF/RO)-based wastewater treatment and reuse in the metal finishing industry. Journal of Cleaner Production, 101, 292-300.
Piasecka, A., Bernstein, R., Ollevier, F., Meersman, F., Souffreau, C., Bilad, R. M.,
Cottenie, K., Vanysacker, L., Denis, C., et al. (2015). Study of biofilms on PVDF membranes after chemical cleaning by sodium hypochlorite. Separation and Purification Technology, 141, 314-321.
Pitkänen, K., Antikainen, R., Droste, N., Loiseau, E., Saikku, L., Aissani, L.,
Hansjürgens, B., Kuikman, P. J., Leskinen, P., et al. (2016). What can be learned from practical cases of green economy? –studies from five European countries. Journal of Cleaner Production, 139, 666-676.
Pontié, M., Thekkedath, A., Kecili, K., Dach, H., De Nardi, F., & Castaing, J. B. (2012).
Clay filter-aid in ultrafiltration (UF) of humic acid solution. Desalination, 292, 73-86.
Porcelli, N., & Judd, S. (2010). Chemical cleaning of potable water membranes: A
review. Separation and Purification Technology, 71(2), 137-143. Psoch, C., & Schiewer, S. (2006). Anti-fouling application of air sparging and
backflushing for MBR. Journal of Membrane Science, 283(1–2), 273-280. Qi, C., & Chang, N.-B. (2013). Integrated carbon footprint and cost evaluation of a
drinking water infrastructure system for screening expansion alternatives. Journal of Cleaner Production, 60, 170-181.
Rabuni, M. F., Nik Sulaiman, N. M., Aroua, M. K., Yern Chee, C., & Awanis Hashim,
N. (2015). Impact of in situ physical and chemical cleaning on PVDF membrane properties and performances. Chemical Engineering Science, 122, 426-435.
Rahmanian, B., Pakizeh, M., Mansoori, S. A. A., & Abedini, R. (2011). Application of
experimental design approach and artificial neural network (ANN) for the determination of potential micellar-enhanced ultrafiltration process. Journal of Hazardous Materials, 187(1–3), 67-74.
Univers
ity of
Mala
ya

205
Raich-Montiu, J., Barios, J., Garcia, V., Medina, M. E., Valero, F., Devesa, R., & Cortina, J. L. (2014). Integrating membrane technologies and blending options in water production and distribution systems to improve organoleptic properties. The case of the Barcelona Metropolitan Area. Journal of Cleaner Production, 69, 250-259.
Rajca, M. (2016). The effectiveness of removal of nom from natural water using photocatalytic membrane reactors in PMR-UF and PMR-MF modes. Chemical Engineering Journal, 305, 169-175.
Rashidi, H., GhaffarianHoseini, A., GhaffarianHoseini, A., Nik Sulaiman, N. M., Tookey, J., & Hashim, N. A. (2015). Application of wastewater treatment in sustainable design of green built environments: A review. Renewable and Sustainable Energy Reviews, 49, 845-856.
Regula, C., Carretier, E., Wyart, Y., Gesan-Guiziou, G., Vincent, A., Boudot, D., & Moulin, P. (2014). Chemical cleaning/disinfection and ageing of organic UF membranes: a review. Water Res, 56, 325-365.
Reingruber, H., Zankel, A., Mayrhofer, C., & Poelt, P. (2012). A new in situ method for the characterization of membranes in a wet state in the environmental scanning electron microscope. Journal of Membrane Science, 399–400, 86-94.
Remize, P. J., Guigui, C., & Cabassud, C. (2010). Evaluation of backwash efficiency, definition of remaining fouling and characterisation of its contribution in irreversible fouling: Case of drinking water production by air-assisted ultra-filtration. Journal of Membrane Science, 355(1-2), 104-111.
Roig, B., Baures, E., & Thomas, O. (2014). Perspectives on drinking water monitoring for small scale water systems. Water Science and Technology, 14(1), 1-12.
Rossetti, I., & Compagnoni, M. (2016). Chemical reaction engineering, process design and scale-up issues at the frontier of synthesis: Flow chemistry. Chemical Engineering Journal, 296, 56-70.
Roy, A., & De, S. (2015). Resistance-in-series model for flux decline and optimal conditions of Stevia extract during ultrafiltration using novel CAP-PAN blend membranes. Food and Bioproducts Processing, 94, 489-499.
Rügner, H., Schwientek, M., Egner, M., & Grathwohl, P. (2014). Monitoring of event-based mobilization of hydrophobic pollutants in rivers: Calibration of turbidity as a proxy for particle facilitated transport in field and laboratory. Science of The Total Environment, 490, 191-198.
Univers
ity of
Mala
ya

206
Salahi, A., Mohammadi, T., Mosayebi Behbahani, R., & Hemmati, M. (2015). Asymmetric polyethersulfone ultrafiltration membranes for oily wastewater treatment: Synthesis, characterization, ANFIS modeling, and performance. Journal of Environmental Chemical Engineering, 3(1), 170-178.
Saleem, M., Alibardi, L., Cossu, R., Lavagnolo, M. C., & Spagni, A. (2017). Analysis
of fouling development under dynamic membrane filtration operation. Chemical Engineering Journal, 312, 136-143.
Sarkar, B., Venkateswralu, N., Rao, R. N., Bhattacharjee, C., & Kale, V. (2007).
Treatment of pesticide contaminated surface water for production of potable water by a coagulation-adsorption-nanofiltration approach. Desalination, 212(1–3), 129-140.
Sauer, I. L., Tatizawa, H., Salotti, F. A. M., & Mercedes, S. S. (2015). A comparative
assessment of Brazilian electric motors performance with minimum efficiency standards. Renewable and Sustainable Energy Reviews, 41, 308-318.
Sen, D., Roy, A., Bhattacharya, A., Banerjee, D., & Bhattacharjee, C. (2011).
Development of a knowledge based hybrid neural network (KBHNN) for studying the effect of diafiltration during ultrafiltration of whey. Desalination, 273(1), 168-178.
Sen, P., Roy, M., & Pal, P. (2015). Exploring role of environmental proactivity in
financial performance of manufacturing enterprises: a structural modelling approach. Journal of Cleaner Production, 108, 583-594.
Seyed Shahabadi, S. M., & Reyhani, A. (2014). Optimization of operating conditions in
ultrafiltration process for produced water treatment via the full factorial design methodology. Separation and Purification Technology, 132, 50-61.
Shamsuddin, N., Das, D. B., & Starov, V. M. (2015). Filtration of natural organic matter
using ultrafiltration membranes for drinking water purposes: Circular cross-flow compared with stirred dead end flow. Chemical Engineering Journal, 276, 331-339.
Shang, R., Vuong, F., Hu, J., Li, S., Kemperman, A. J. B., Nijmeijer, K., Cornelissen, E.
R., Heijman, S. G. J., & Rietveld, L. C. (2015). Hydraulically irreversible fouling on ceramic MF/UF membranes: Comparison of fouling indices, foulant composition and irreversible pore narrowing. Separation and Purification Technology, 147, 303-310.
Univers
ity of
Mala
ya

207
Shengji, X., Juanjuan, Y., & Naiyun, G. (2008). An empirical model for membrane flux prediction in ultrafiltration of surface water. Desalination, 221(1–3), 370-375.
Shetty, G. R., & Chellam, S. (2003). Predicting membrane fouling during municipal
drinking water nanofiltration using artificial neural networks. Journal of Membrane Science, 217(1–2), 69-86.
Shetty, G. R., Malki, H., & Chellam, S. (2003). Predicting contaminant removal during
municipal drinking water nanofiltration using artificial neural networks. Journal of Membrane Science, 212(1–2), 99-112.
Shi, X., Tal, G., Hankins, N. P., & Gitis, V. (2014). Fouling and cleaning of
ultrafiltration membranes: A review. Journal of Water Process Engineering, 1, 121-138.
Shirazi, S., Lin, C.-J., & Chen, D. (2010). Inorganic fouling of pressure-driven
membrane processes — A critical review. Desalination, 250(1), 236-248. Sioutopoulos, D. C., & Karabelas, A. J. (2012). Correlation of organic fouling
resistances in RO and UF membrane filtration under constant flux and constant pressure. Journal of Membrane Science, 407–408, 34-46.
Sioutopoulos, D. C., & Karabelas, A. J. (2015). The effect of permeation flux on the
specific resistance of polysaccharide fouling layers developing during dead-end ultrafiltration. Journal of Membrane Science, 473, 292-301.
Sioutopoulos, D. C., & Karabelas, A. J. (2016). Evolution of organic gel fouling
resistance in constant pressure and constant flux dead-end ultrafiltration: Differences and similarities. Journal of Membrane Science, 511, 265-277.
Skrzypacz, J. (2014). Investigating the impact of multi-piped impellers design on the
efficiency of rotodynamic pumps operating at ultra-low specific speed. Chemical Engineering and Processing: Process Intensification, 86, 145-152.
Snelgrove, K. B., & Saleh, J. H. (2016). Toward a new spacecraft optimal design
lifetime? Impact of marginal cost of durability and reduced launch price. Acta Astronautica, 127, 271-282.
Solak, M., Kılıç, M., Hüseyin, Y., & Şencan, A. (2009). Removal of suspended solids
and turbidity from marble processing wastewaters by electrocoagulation: Comparison of electrode materials and electrode connection systems. Journal of Hazardous Materials, 172(1), 345-352.
Univers
ity of
Mala
ya

208
Soleimani, R., Shoushtari, N. A., Mirza, B., & Salahi, A. (2013). Experimental investigation, modeling and optimization of membrane separation using artificial neural network and multi-objective optimization using genetic algorithm. Chemical Engineering Research and Design, 91(5), 883-903.
Sripui, J., Pradistsuwana, C., Kerr, W. L., & Pradipasena, P. (2011). Effects of particle
size and its distribution on specific cake resistance during rice wine microfiltration. Journal of Food Engineering, 105(1), 73-78.
Stoller, M., De Caprariis, B., Cicci, A., Verdone, N., Bravi, M., & Chianese, A. (2013).
About proper membrane process design affected by fouling by means of the analysis of measured threshold flux data. Separation and Purification Technology, 114, 83-89.
Stoquart, C., Servais, P., Bérubé, P. R., & Barbeau, B. (2012). Hybrid Membrane
Processes using activated carbon treatment for drinking water: A review. Journal of Membrane Science, 411-412, 1-12.
Suárez, A., Fernández, P., Ramón Iglesias, J., Iglesias, E., & Riera, F. A. (2015). Cost
assessment of membrane processes: A practical example in the dairy wastewater reclamation by reverse osmosis. Journal of Membrane Science, 493, 389-402.
Sun, S., Yan, H., & Lipeme Kouyi, G. (2014). Artificial neural network modelling in
simulation of complex flow at open channel junctions based on large data sets. Environmental Modelling & Software, 62, 178-187.
Tan, M., He, G., Nie, F., Zhang, L., & Hu, L. (2014). Optimization of ultrafiltration
membrane fabrication using backpropagation neural network and genetic algorithm. Journal of the Taiwan Institute of Chemical Engineers, 45(1), 68-75.
Tang, C., Bai, H., Liu, L., Zan, X., Gao, P., Sun, D. D., & Yan, W. (2016a). A green
approach assembled multifunctional Ag/AgBr/TNF membrane for clean water production & disinfection of bacteria through utilizing visible light. Applied Catalysis B: Environmental, 196, 57-67.
Tang, Y., Xu, J., & Gao, C. (2016b). Ultrafiltration membranes with ultrafast water
transport tuned via different substrates. Chemical Engineering Journal, 303, 322-330.
Tantawy, M. A. (2015). Characterization and pozzolanic properties of calcined alum
sludge. Materials Research Bulletin, 61, 415-421.
Univers
ity of
Mala
ya

209
Teodosiu, C., Pastravanu, O., & Macoveanu, M. (2000). Neural network models for ultrafiltration and backwashing. Water Res, 34(18), 4371-4380.
The World Bank: Inflation, consumer prices annual percentage - Malaysia (2014).
Retrieved 11-10-2014, from http://data.worldbank.org/indicator/FP.CPI.TOTL.ZG?locations=MY
Thekkedath, A., Naceur, W. M., Kecili, K., Sbai, M., Elana, A., Auret, L., Suty, H.,
Machinal, C., & Pontié, M. (2007). Macroscopic and microscopic characterizations of a cellulosic ultrafiltration (UF) membrane fouled by a humic acid cake deposit: First step for intensification of reverse osmosis (RO) pre-treatments. Comptes Rendus Chimie, 10(9), 803-812.
Tian, J. Y., Ernst, M., Cui, F., & Jekel, M. (2013a). Correlations of relevant membrane
foulants with UF membrane fouling in different waters. Water Res, 47(3), 1218-1228.
Tian, J. Y., Ernst, M., Cui, F., & Jekel, M. (2013b). Effect of particle size and
concentration on the synergistic UF membrane fouling by particles and NOM fractions. Journal of Membrane Science, 446, 1-9.
Tian, J. Y., Ernst, M., Cui, F., & Jekel, M. (2013c). KMnO4 pre-oxidation combined
with FeCl3 coagulation for UF membrane fouling control. Desalination, 320, 40-48.
Tien, C., Ramarao, B. V., & Yasarla, R. (2014). A blocking model of membrane
filtration. Chemical Engineering Science, 111, 421-431. Tornevi, A., Simonsson, M., Forsberg, B., Säve-Söderbergh, M., & Toljander, J. (2016).
Efficacy of water treatment processes and endemic gastrointestinal illness – A multi-city study in Sweden. Water Res, 102, 263-270.
Ujihara, R., Mino, Y., Takahashi, T., Shimizu, Y., & Matsuyama, H. (2016). Effects of
the ionic strength of sodium hypochlorite solution on membrane cleaning. Journal of Membrane Science, 514, 566-573.
Urgun-Demirtas, M., Negri, M. C., Gillenwater, P. S., Nnanna, A. G. A., & Yu, J.
(2013). Meeting world's most stringent Hg criterion: A pilot-study for the treatment of oil refinery wastewater using an ultrafiltration membrane process. Journal of Environmental Management, 117, 65-75.
Univers
ity of
Mala
ya

210
Vatsha, B., Ngila, J. C., & Moutloali, R. M. (2014). Preparation of antifouling polyvinylpyrrolidone (PVP 40K) modified polyethersulfone (PES) ultrafiltration (UF) membrane for water purification. Physics and Chemistry of the Earth, Parts A/B/C, 67–69, 125-131.
Vedavyasan, C. V. (2007). Pretreatment trends — an overview. Desalination, 203(1-3),
296-299. Vera, M., Martín-Alonso, J., Mesa, J., Granados, M., Beltran, J. L., Casas, S., Gibert,
O., & Cortina, J. L. (2017). Monitoring UF membrane performance treating surface-groundwater blends: Limitations of FEEM-PARAFAC on the assessment of the organic matter role. Chemical Engineering Journal, 317, 961-971.
Villacorte, L. O., Ekowati, Y., Winters, H., Amy, G., Schippers, J. C., & Kennedy, M.
D. (2015). MF/UF rejection and fouling potential of algal organic matter from bloom-forming marine and freshwater algae. Desalination, 367, 1-10.
Vinther, F., & Jönsson, A.-S. (2016). Modelling of optimal back-shock frequency in
hollow fibre ultrafiltration membranes I: Computational fluid dynamics. Journal of Membrane Science, 506, 130-136.
Walsh, B. P., Bruton, K., & O'Sullivan, D. T. J. (2017). The true value of water: A case-
study in manufacturing process water-management. Journal of Cleaner Production, 141, 551-567.
Wan, C. F., Yang, T., Lipscomb, G. G., Stookey, D. J., & Chung, T.-S. (2017). Design
and fabrication of hollow fiber membrane modules. Journal of Membrane Science, 538, 96-107.
Wang, C., Wei, A., Wu, H., Qu, F., Chen, W., Liang, H., & Li, G. (2016a). Application
of response surface methodology to the chemical cleaning process of ultrafiltration membrane. Chinese Journal of Chemical Engineering, 24(5), 651-657.
Wang, H., Zhao, X., & He, C. (2016b). Innovative permeation and antifouling
properties of PVDF ultrafiltration membrane with stepped hollow SiO2 microspheres in membrane matrix. Materials Letters, 182, 376-379.
Wang, J., Cui, Z., Jia, H., & Zhang, H. (2014). The effect of fiber length on non-
uniform and hysteresis phenomenon in hollow fiber membrane backflushing. Desalination, 337, 98-108.
Univers
ity of
Mala
ya

211
Wang, J., Gao, X., Xu, Y., Wang, Q., Zhang, Y., Wang, X., & Gao, C. (2016c). Ultrasonic-assisted acid cleaning of nanofiltration membranes fouled by inorganic scales in arsenic-rich brackish water. Desalination, 377, 172-177.
Wang, J., Guan, J., Santiwong, S. R., & Waite, T. D. (2008). Characterization of floc
size and structure under different monomer and polymer coagulants on microfiltration membrane fouling. Journal of Membrane Science, 321, 132-138.
Wang, W., Liu, J., Zeng, D., Lin, Z., & Cui, C. (2012). Variable-speed technology used
in power plants for better plant economics and grid stability. Energy, 45(1), 588-594.
Wei, D., Tao, Y., Zhang, Z., & Zhang, X. (2016). Effect of pre-ozonation on mitigation
of ceramic UF membrane fouling caused by algal extracellular organic matters. Chemical Engineering Journal, 294, 157-166.
Weidhaas, J., Lin, L.-S., & Buzby, K. (2017). A case study for orphaned chemicals: 4-
methylcyclohexanemethanol (MCHM) and propylene glycol phenyl ether (PPH) in riverine sediment and water treatment processes. Science of The Total Environment, 574, 1396-1404.
Wu, G.-D., & Lo, S.-L. (2010). Effects of data normalization and inherent-factor on
decision of optimal coagulant dosage in water treatment by artificial neural network. Expert Systems with Applications, 37(7), 4974-4983.
Xiao, P., Xiao, F., Wang, D.-s., Qin, T., & He, S.-p. (2012). Investigation of organic
foulants behavior on hollow-fiber UF membranes in a drinking water treatment plant. Separation and Purification Technology, 95, 109-117.
Xiaoyi, W., Junyang, Y., Yan, S., Tingli, S., Li, W., & Jiping, X. (2016). Research on
hybrid mechanism modeling of algal bloom formation in urban lakes and reservoirs. Ecological Modelling, 332, 67-73.
Xiarchos, I., Doulia, D., Gekas, V., & Tragardh, G. (2003). Polymeric ultrafiltration
membranes and surfactants. Separation and Purification Technology, 32(2), 215-278.
Xu, T., Zhu, Q., Chen, X., & Li, W. (2008). Equivalent Cake Filtration Model. Chinese
Journal of Chemical Engineering, 16(2), 214-217.
Univers
ity of
Mala
ya

212
Yahyapour, S., Golshan, A., & Ghazali, A. H. b. (2014). Removal of total suspended solids and turbidity within experimental vegetated channel: optimization through response surface methodology. Journal of Hydro-environment Research, 8(3), 260-269.
Yan, Z., Liu, B., Qu, F., Ding, A., Liang, H., Zhao, Y., & Li, G. (2017). Control of
ultrafiltration membrane fouling caused by algal extracellular organic matter (EOM) using enhanced Al coagulation with permanganate. Separation and Purification Technology, 172, 51-58.
Ye, Y., Chen, V., & Le-Clech, P. (2011). Evolution of fouling deposition and removal
on hollow fibre membrane during filtration with periodical backwash. Desalination, 283, 198-205.
Yi, X. S., Yu, S. L., Shi, W. X., Wang, S., Sun, N., Jin, L. M., & Ma, C. (2013).
Estimation of fouling stages in separation of oil/water emulsion using nano-particles Al2O3/TiO2 modified PVDF UF membranes. Desalination, 319, 38-46.
Yu, W.-z., Graham, N., Liu, H.-j., & Qu, J.-h. (2013). Comparison of FeCl3 and alum
pre-treatment on UF membrane fouling. Chemical Engineering Journal, 234, 158-165.
Yu, W., Campos, L. C., & Graham, N. (2016). Application of pulsed UV-irradiation and
pre-coagulation to control ultrafiltration membrane fouling in the treatment of micro-polluted surface water. Water Res, 107, 83-92.
Yu, W., & Graham, N. J. D. (2015). Application of Fe(II)/K2MnO4 as a pre-treatment
for controlling UF membrane fouling in drinking water treatment. Journal of Membrane Science, 473, 283-291.
Zahrim, A. Y., & Hilal, N. (2013). Treatment of highly concentrated dye solution by
coagulation/flocculation-sand filtration and nanofiltration. Water Resources and Industry, 3, 23-34.
Zaman, M., & Lee, J. H. (2015). Optimization of the various modes of flexible
operation for post-combustion CO2 capture plant. Computers & Chemical Engineering, 75, 14-27.
Zhang, L., & Suganthan, P. N. (2016). A survey of randomized algorithms for training
neural networks. Information Sciences, 364–365, 146-155.
Univers
ity of
Mala
ya

213
Zhang, W., Ding, L., Zhang, Z., Wei, J., Jaffrin, M. Y., & Huang, G. (2016). Threshold flux and limiting flux for micellar enhanced ultrafiltration as affected by feed water: experimental and modeling studies. Journal of Cleaner Production, 112, 1241-1251.
Zhang, Y.-F., Liu, L., Du, J., Fu, R., Van der Bruggen, B., & Zhang, Y. (2017). Fracsis:
Ion fractionation and metathesis by a NF-ED integrated system to improve water recovery. Journal of Membrane Science, 523, 385-393.
Zhao, Y. X., Gao, B. Y., Zhang, G. Z., Phuntsho, S., & Shon, H. K. (2014). Coagulation
by titanium tetrachloride for fulvis acid removal: Factors influencing coagulation efficiency and floc characteristics. Desalination, 335, 70-77.
Zhou, L., Xia, S., & Alvarez-Cohen, L. (2015). Structure and distribution of inorganic
components in the cake layer of a membrane bioreactor treating municipal wastewater. Bioresour Technol, 196, 586-591.
Zouboulis, A., Traskas, G., & Samaras, P. (2007). Comparison of single and dual media
filtration in a full-scale drinking water treatment plant. Desalination, 213(1-3), 334-342.
Zuo, X., Wang, L., He, J., Li, Z., & Yu, S. (2014). SEM-EDX studies of SiO2/PVDF
membranes fouling in electrodialysis of polymer-flooding produced wastewater: Diatomite, APAM and crude oil. Desalination, 347, 43-51.
Zupančič, M., Novak, D., Diaci, J., & Golobič, I. (2014). An evaluation of industrial
ultrafiltration systems for surface water using fouling indices as a performance indicator. Desalination, 344, 321-328.
Univers
ity of
Mala
ya

214
LIST OF PUBLICATIONS AND PAPERS PRESENTED
ISI-Cited Journal Articles
1. Chun Ming Chew, M.K. Aroua, & M.A. Hussain (2017). A practical hybrid modelling approach for the prediction of potential fouling parameters in ultrafiltration membrane water treatment plant. Journal of Industrial and Engineering Chemistry, 45, 145 – 155.
2. Chun Ming Chew, M.K. Aroua, & M.A. Hussain (2016), Key issues of ultrafiltration membrane water treatment plant scale-up from laboratory and pilot plant results, Water Science and Technology: Water Supply, 16(2), 438 – 444.
3. Chun Ming Chew, M.K. Aroua, M.A. Hussain, & W.M.Z. Wan Ismail (2016),
Evaluation of ultrafiltration and conventional water treatment systems for sustainable development: an industrial scale case study, Journal of Cleaner Production, 112, 3152 – 3163.
4. Chun Ming Chew, M.K. Aroua, M.A. Hussain, & W.M.Z. Wan Ismail (2015), Practical performance analysis of an industrial-scale ultrafiltration membrane water treatment plant, Journal of the Taiwan Institute of Chemical Engineers, 46, 132 – 139.
5. Chun Ming Chew, M.K. Aroua & M.A. Hussain (2017), Advanced process control for ultrafiltration membrane water treatment system, Journal of Cleaner Production (Under review)
International Conference/Symposium Articles
1. Chun Ming Chew, M.K. Aroua, M.A. Hussain, A novel filtration model for industrial-scale ultrafiltration membrane water treatment plant, 12th World Filtration Congress, 11th – 15th April 2016, Taipei International Convention Centre, Taiwan
2. Chun Ming Chew, M.K. Aroua, M.A. Hussain, Joint collaboration of academia-industry in mobile ultrafiltration water treatment system for flood disaster areas, 14th Association of Pacific Rim Universities Doctoral Students Conference, 23rd – 26th November 2015, Zhejiang University, China
Univers
ity of
Mala
ya

215
3. Chun Ming Chew, M.K. Aroua, M.A. Hussain, Ultrafiltration membrane systems for industrial-scale and portable scale drinking water supply, 10th Asia-Oceania Top University League on Engineering Student Conference, 1st – 3rd November 2015, Nanyang Technological University, Singapore
4. Chun Ming Chew, M.K. Aroua, M.A. Hussain, Utilizing results from laboratory
and pilot plant for the design of industrial-scale ultrafiltration membrane water treatment plant, 10th Asia Pacific Conference on Sustainable Energy & Environmental Technologies, 2nd – 5th July 2015, University of Seoul, Korea
5. Chun Ming Chew, M.K. Aroua, M.A. Hussain, Comparison between bench-scale, pilot-scale and industrial-scale studies of ultrafiltration systems performance, 27th Symposium of Malaysian Chemical Engineers and 21st Regional Symposium on Chemical Engineering, 28th – 31st Oct 2014, Taylor’s University, Malaysia
6. Chun Ming Chew, M.K. Aroua, M.A. Hussain, Factors affecting operations of ultra-filtration systems in industrial-scaled drinking water plants, 4th International Congress on Green Process Engineering, 7 – 10 April 2014, Sevilla, Spain
Univers
ity of
Mala
ya


![[ PRESENTATION SESSION ] - pimm.my · PDF file3 Refleksi Guru Praktikal UPSI terhadap Kaedah Pengajaran Sirah Muhd Abd Hadi Bin Ismail](https://static.fdocuments.us/doc/165x107/5a77563c7f8b9ad22a8e1c39/-presentation-session-pimmmy-a-3-refleksi-guru-praktikal-upsi-terhadap.jpg)