EVALUATION AND CHARACTERIZATION OF MAGNETS … · STATIC TESTING ... supply, thermocouple...
32
U.S. Department of Energy FreedomCAR and Vehicle Technologies, EE-2G 1000 Independence Avenue, S.W. Washington, D.C. 20585-0121 FY 2007 EVALUATION AND CHARACTERIZATION OF MAGNETS AND CAPACITORS Prepared by: Oak Ridge National Laboratory Mitch Olszewski, Program Manager Submitted to: Energy Efficiency and Renewable Energy FreedomCAR and Vehicle Technologies Vehicle Systems Team Susan A. Rogers, Technology Development Manager October 2006
Transcript of EVALUATION AND CHARACTERIZATION OF MAGNETS … · STATIC TESTING ... supply, thermocouple...
U.S. Department of Energy FreedomCAR and Vehicle Technologies, EE-2G
1000 Independence Avenue, S.W. Washington, D.C. 20585-0121
FY 2007 EVALUATION AND CHARACTERIZATION OF MAGNETS AND CAPACITORS Prepared by: Oak Ridge National Laboratory Mitch Olszewski, Program Manager Submitted to: Energy Efficiency and Renewable Energy FreedomCAR and Vehicle Technologies Vehicle Systems Team Susan A. Rogers, Technology Development Manager October 2006
ORNL/TM-2006/570
Engineering Science and Technology Division
EVALUATION AND CHARACTERIZATION OF
MAGNETS AND CAPACITORS
L. E. Seiber J. P. Cunningham
S. S. Golik, ORISE G. Armstrong, Maverick Systems
Publication Date: October 2006
Prepared by the OAK RIDGE NATIONAL LABORATORY
Oak Ridge, Tennessee 37831 managed by
UT-BATTELLE, LLC for the
U.S. DEPARTMENT OF ENERGY Under contract DE-AC05-00OR22725

DOCUMENT AVAILABILITY
Reports produced after January 1, 1996, are generally available free via the U.S. Department of Energy (DOE) Information Bridge:
Web site: http://www.osti.gov/bridge Reports produced before January 1, 1996, may be purchased by members of the public from the following source:
National Technical Information Service 5285 Port Royal Road Springfield, VA 22161 Telephone: 703-605-6000 (1-800-553-6847) TDD: 703-487-4639 Fax: 703-605-6900 E-mail: [email protected] Web site: http://www.ntis.gov/support/ordernowabout.htm
Reports are available to DOE employees, DOE contractors, Energy Technology Data Exchange (ETDE) representatives, and International Nuclear Information System (INIS) representatives from the following source:
Office of Scientific and Technical Information P.O. Box 62 Oak Ridge, TN 37831 Telephone: 865-576-8401 Fax: 865-576-5728 E-mail: [email protected] Web site: http://www.osti.gov/contact.html
This report was prepared as an account of work sponsored by an agency of the United States Government. Neither the United States government nor any agency thereof, nor any of their employees, makes any warranty, express or implied, or assumes any legal liability or responsibility for the accuracy, completeness, or usefulness of any information, apparatus, product, or process disclosed, or represents that its use would not infringe privately owned rights. Reference herein to any specific commercial product, process, or service by trade name, trademark, manufacturer, or otherwise, does not necessarily constitute or imply its endorsement, recommendation, or favoring by the United States Government or any agency thereof. The views and opinions of authors expressed herein do not necessarily state or reflect those of the United States Government or any agency thereof.
ii
CONTENTS
Page
LIST OF FIGURES .............................................................................................................................. iii LIST OF TABLES................................................................................................................................ iii ACRONYMS AND ABBREVIATIONS ............................................................................................. iv 1. INTRODUCTION.......................................................................................................................... 1 1.1 TESTING FACILITIES ....................................................................................................... 1 1.2 OBJECTIVE......................................................................................................................... 1 1.3 APPROACH......................................................................................................................... 1 2. CAPACITOR TEST STAND DESCRIPTION.............................................................................. 2 2.1 DATA ACQUISITION IN THE STATIC MODE............................................................... 3 2.2 DATA ACQUISITION IN THE DYNAMIC MODE.......................................................... 5 3. STATIC TESTING ........................................................................................................................ 7 3.1 SINGLE FILM CAPACITOR FROM THE PRIUS MODULE .......................................... 7 3.2 KEMET CERAMIC CAPACITOR...................................................................................... 10 3.3 PENN STATE CERAMIC CAPACITOR............................................................................ 11 4. DYNAMIC TESTING ................................................................................................................... 12 4.1 SINGLE PRIUS FILM CAPACITOR RIPPLE CURRENT TESTS................................... 12 4.2 SINGLE PRIUS FILM CAPACITOR LEAKAGE CURRENT TEST..................... 13 4.3 SINGLE PRIUS FILM CAPACITOR ESL TEST............................................................... 13 5. MAGNET TEST DESCRIPTION ................................................................................................. 15 5.1 SINTERED MAGNET EVALUATION.............................................................................. 16 5.2 BONDED MAGNET EVALUATION................................................................................. 19 6. SUMMARY ................................................................................................................................... 24 6.1 CAPACITOR TESTING...................................................................................................... 24 6.2 MAGNET TESTING ........................................................................................................... 24

iii
LIST OF FIGURES
Figure Page
2.1 An ac amplifier and signal generator used to produce ripple current ................................... 3 2.2 Static test input screen .......................................................................................................... 4 2.3 Ripple current test schematic................................................................................................ 5 2.4 Dynamic test input screen..................................................................................................... 6 3.1 A single Prius film capacitor tested in the static mode at 5 kHz .......................................... 7 3.2 A single Prius 140 uF 600 Vdc film capacitor...................................................................... 8 3.3 A single Prius film capacitor ESR frequency response ........................................................ 9 3.4 A single Prius film capacitor DF frequency response .......................................................... 9 3.5 A single Prius film capacitor frequency response ................................................................ 10 3.6 Kemet ceramic capacitor static test at 5 kHz........................................................................ 10 3.7 Penn State ceramic high temperature static test at 5 kHz ..................................................... 11 4.1 Temperature rise over ambient at 5 kHz............................................................................... 12 4.2 A single Prius film capacitor leakage current vs. temperature ............................................. 13 4.3 Circuit used to calculate ESL ............................................................................................... 14 5.1 A Walker Scientific AMH-40 hysteresisgraph..................................................................... 15 5.2 Hysteresis plot of the Prius sintered benchmark magnet at 183ºC....................................... 17 5.3 Hysteresis plot of the Shin-Etsu N43TS sintered magnet at 182ºC...................................... 18 5.4 Hysteresis plot of the ANL sintered magnet at 175ºC.......................................................... 19 5.5 Hysteresis plot of Arnold Magnetics Plastiform 2205 bonded benchmark magnet at 200ºC ................................................................................................................................ 21
5.6 Hysteresis plot of the Ames MQP-11 HTP magnet at 200ºC............................................... 22 5.7 Hysteresis plot of the Ames MQP-O bonded magnet at 202ºC............................................ 23
LIST OF TABLES
Table Page
4.1 Maximum ripple current ....................................................................................................... 13 5.1 Sintered magnet test results .................................................................................................. 16 5.2 Bonded magnet test results ................................................................................................... 20 6.1 Capacitor evaluation 5 kHz static test summary................................................................... 24
iv
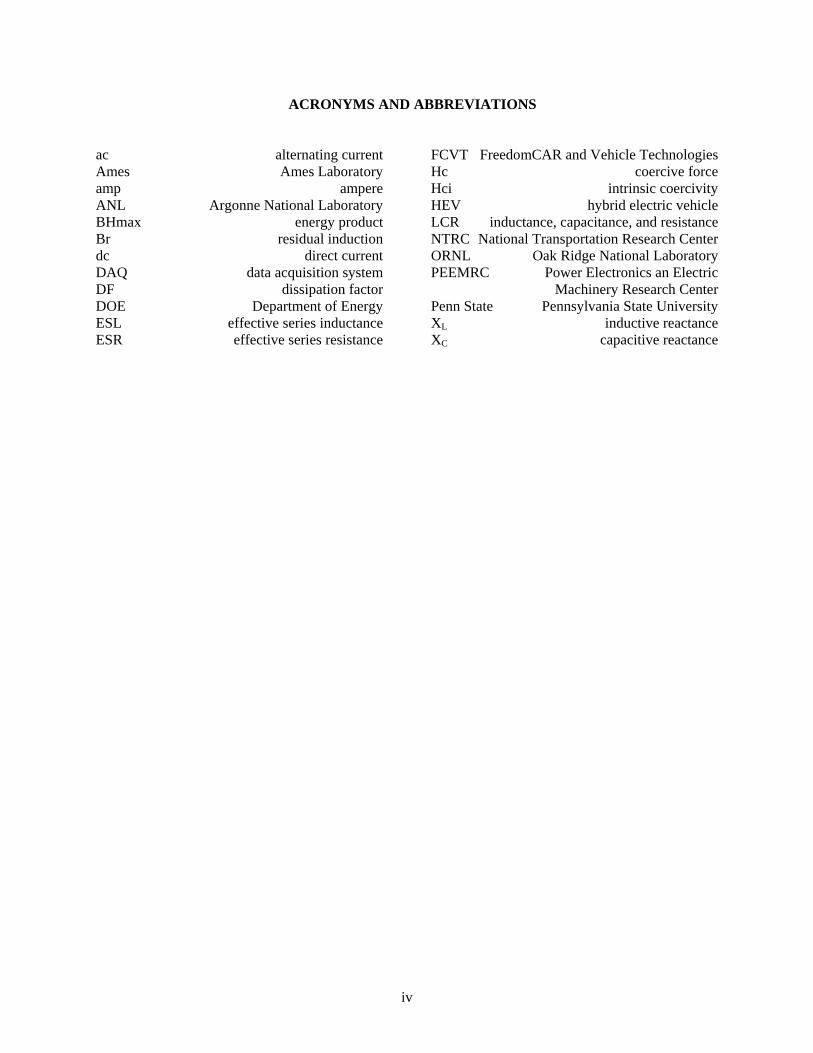
ACRONYMS AND ABBREVIATIONS
ac alternating current Ames Ames Laboratory amp ampere ANL Argonne National Laboratory BHmax energy product Br residual induction dc direct current DAQ data acquisition system DF dissipation factor DOE Department of Energy ESL effective series inductance ESR effective series resistance
FCVT FreedomCAR and Vehicle Technologies Hc coercive force Hci intrinsic coercivity HEV hybrid electric vehicle LCR inductance, capacitance, and resistance NTRC National Transportation Research Center ORNL Oak Ridge National Laboratory PEEMRC Power Electronics an Electric Machinery Research Center Penn State Pennsylvania State University XL inductive reactance XC capacitive reactance
1
1. INTRODUCTION
Advanced vehicle, fuel cell, hybrid electric vehicle (HEV), and plug in hybrid research and development is conducted by the U.S. Department of Energy (DOE) through its FreedomCAR and Vehicle Technologies (FCVT) program. The mission of this program is to develop more energy efficient and environmentally safe highway transportation technologies. Program activities include research, development, testing, technology validation, and technology transfer. These activities are done at the system and component levels. This report will discuss component level testing of prototype capacitors and magnets. 1.1 TESTING FACILITIES The evaluation of prototype capacitor technologies involved both static and dynamic tests at elevated temperatures. The capacitor testing was done by the Oak Ridge National Laboratory (ORNL) personnel at its Power Electronics and Electric Machinery Research Center (PEEMRC) located at the National Transportation Research Center (NTRC). The PEEMRC has over 9000 square feet of space for developing and building the next generation of inverters and electric machine technology. The evaluation of prototype magnet technologies was also done by ORNL personnel at the ORNL main campus using a Walker Scientific AMH 40 hysteresisgraph which is capable of providing a full four-quadrant hysteresis graph as well as minor loop recoil tests at elevated temperatures. 1.2 OBJECTIVE As capacitor and magnet technologies mature, it is important to ascertain the limitations of these new technologies by subjecting the components to standardized tests to evaluate their capabilities. Test results will assist in the determination of their ability to provide improvements in power electronics and motor designs to meet the FCVT goals. 1.3 APPROACH Capacitor performance data must be acquired for analysis; therefore, it was necessary to develop a test stand that logs data at predetermined temperature extremes and controls thermal cycling between these extremes. This test stand includes: a data acquisition system (DAQ) operating on a Dell workstation; an environmental chamber; an alternating current (ac) amplifier, signal generator, direct current (dc) power supply, thermocouple interface, wattmeter, inductance capacitance and resistance (LCR) meter, infrared camera, and a megohmmeter. A full four-quadrant hysteresis graph was used to evaluate the new magnet technologies over the full range of temperatures from 20°C –235°C.

2
2. CAPACITOR TEST STAND DESCRIPTION Capacitors were tested in two modes, statically and dynamically. The static test mode does not require a dc bias voltage and ripple current to be applied. The capacitor parameters that are measured in the static mode are: (1) effective series resistance (ESR), (2) dissipation factor (DF), and (3) capacitance value. The capacitor is placed in an environmental chamber and the temperature is cycled between the temperature limits using steps of 20ºC. The three parameters are measured at each temperature step. The dynamic test mode requiresa dc bias voltage and ripple current to be applied. When a capacitor is used on a dc bus, the maximum ripple current capability is an important specification. The dynamic test determines the maximum ripple current at different ambient temperatures. Capacitor testing in the static mode requires a thermal cycling process that must continue uninterrupted for extended periods of time. To accomplish this long term testing, a DAQ using LABView was developed to control the environmental chamber and log data from the measuring instruments. This DAQ allows the operator to input upper and lower temperature limits as well as temperature steps to be used during the evaluation. The program commands a target temperature to the environmental chamber and, when that temperature has been reached, it monitors a capacitor parameter for stability. After this parameter is stable, the program logs the capacitor data from the LCR meter at predefined test frequencies before another temperature step is commanded. Capacitor testing in the dynamic mode uses the DAQ to receive ripple current and bias voltage input from the operator and command a target temperature to the environmental chamber. The following instruments can also be selected from the LABView control panel at each temperature step: wattmeter, infrared camera, thermocouples, LCR meter, and a megohmmeter. These instruments are included in the test at the appropriate time. An ac amplifier, shown in Fig. 2.1, is used in conjunction with a signal generator to apply ripple current to the capacitor during the dynamic test.

3
Fig. 2.1. An ac amplifier and signal generator used to produce ripple current. 2.1 DATA ACQUISITION IN THE STATIC MODE The DAQ consists of a Dell Precision 380 Workstation running LABView 7.1. In the static mode, the instruments used to log data are an Espec environmental chamber and an Agilent 4284 LCR meter. The static input screen is shown in Fig. 2.2. At the beginning of the static thermal cycling test, after all temperature steps and test frequencies have been entered, the program turns on the environmental chamber and commands a target temperature to the chamber. After the target temperature has been reached and a pre-programmed delay time has been met, the program sends a command to the LCR meter to output the first test frequency and then begins to monitor the ESR from the capacitor under test. When that value is stable, the ESR is recorded and the next parameter is measured and recorded. After the values for ESR, DF, and capacitance are recorded at the first test frequency, the command is given to the LCR meter to output the next test frequency, and the monitoring and recording process is repeated. After all data are recorded at all test frequencies, the next temperature step is commanded to the environmental chamber and the process is repeated.

4
Fig. 2.2. Static test input screen.
The pre-programmed delay discussed earlier is to ensure that the temperature of the dielectric has equalized once the target temperature of the environmental chamber has been reached. When a temperature difference between the ambient temperature of the chamber and the target temperature of the chamber is 40ºC or greater, the pre-programmed delay is invoked after the target temperature is reached. The amount of delay is determined by the operator and is based on the size of the capacitor. A larger capacitor will require a larger delay to ensure that the temperature of the dielectric is uniform. Following the delay, the program monitors the ESR for a stable reading before the value is recorded. This helps to ensure that ESR data are accurate.
5
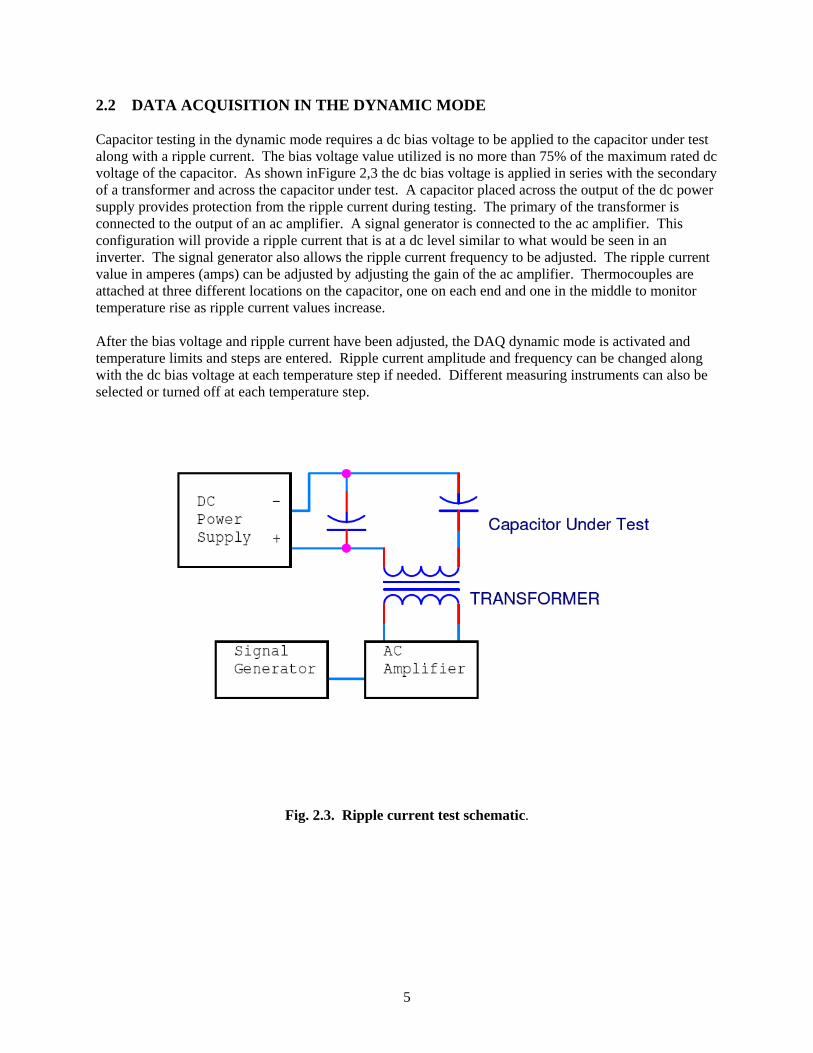
2.2 DATA ACQUISITION IN THE DYNAMIC MODE Capacitor testing in the dynamic mode requires a dc bias voltage to be applied to the capacitor under test along with a ripple current. The bias voltage value utilized is no more than 75% of the maximum rated dc voltage of the capacitor. As shown inFigure 2,3 the dc bias voltage is applied in series with the secondary of a transformer and across the capacitor under test. A capacitor placed across the output of the dc power supply provides protection from the ripple current during testing. The primary of the transformer is connected to the output of an ac amplifier. A signal generator is connected to the ac amplifier. This configuration will provide a ripple current that is at a dc level similar to what would be seen in an inverter. The signal generator also allows the ripple current frequency to be adjusted. The ripple current value in amperes (amps) can be adjusted by adjusting the gain of the ac amplifier. Thermocouples are attached at three different locations on the capacitor, one on each end and one in the middle to monitor temperature rise as ripple current values increase. After the bias voltage and ripple current have been adjusted, the DAQ dynamic mode is activated and temperature limits and steps are entered. Ripple current amplitude and frequency can be changed along with the dc bias voltage at each temperature step if needed. Different measuring instruments can also be selected or turned off at each temperature step.
Fig. 2.3. Ripple current test schematic.

6
After all temperature steps and test frequencies have been entered, the program turns on the environmental chamber, commands a target temperature, and begins monitoring the chamber temperature. When the target temperature is reached, the program waits for operator input before logging ripple current, chamber temperature, and thermocouple data. The next temperature step will then be commanded. The dynamic input screen is shown in Fig. 2.4.
Fig. 2.4. Dynamic test input screen.

7
3. STATIC TESTING Single film capacitors were extracted from the 2004 Prius capacitor module for benchmark testing in the static mode. No prototype film capacitors were received from developers for evaluation during this reporting period. All static tests were done using an Agilent 4284 LCR meter. No dc bias voltage or ac ripple current was applied during static testing. A Kemet 1 uF capacitor was identified and tested as the ceramic benchmark. Pennsylvania State University (Penn State) supplied a 90 nF prototype high-temperature ceramic capacitor for testing. 3.1 SINGLE FILM CAPACITOR FROM THE PRIUS MODULE A single 140 uF film capacitor was extracted from the Prius module to use as a benchmark. The module was taken to a materials laboratory to be x-rayed in order to identify the layout of the 10 capacitors in the module. The film was brought back to the PEEMRC laboratory and several single capacitors were extracted for testing. A static test of this capacitor at 5 kHz is shown in Fig. 3.1. The capacitor is rated at 600 VDC.
Single Prius Film Capacitor
150.00
151.00
152.00
153.00
154.00
155.00
156.00
157.00
158.00
159.00
160.00
-40 -20 0 20 40 60 80 100 120 140 160
Temp (Celsius)
Cap
acita
nce
(uF)
0.00
0.50
1.00
1.50
2.00
2.50
3.00
3.50
4.00
4.50
5.00
ES
R (M
illiO
hms)
, Dis
sipa
tion
Fact
or (%
).
Capacitance (uF) ESR (MilliOhms) Dissipation Factor (%)
Fig. 3.1. A single Prius film capacitor tested in the static mode at 5 kHz.
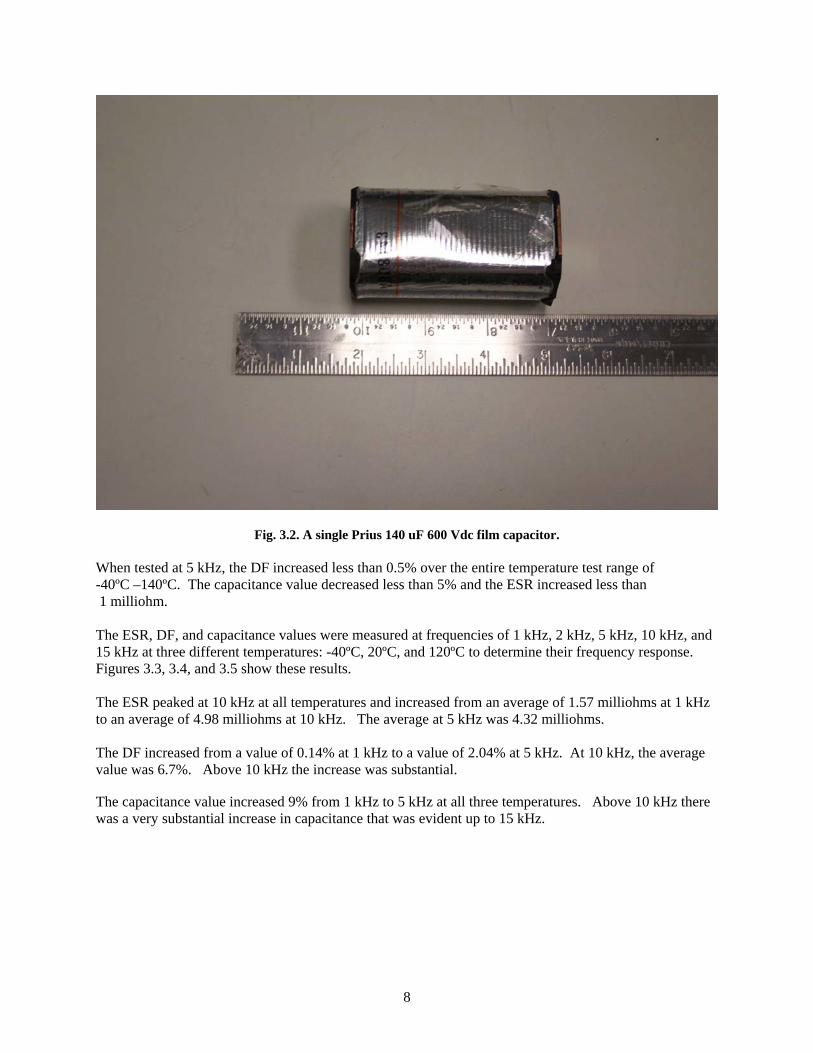
Figure 3.2 shows a single Prius 140 uF capacitor with the potting material removed.
8
Fig. 3.2. A single Prius 140 uF 600 Vdc film capacitor. When tested at 5 kHz, the DF increased less than 0.5% over the entire temperature test range of -40ºC –140ºC. The capacitance value decreased less than 5% and the ESR increased less than 1 milliohm. The ESR, DF, and capacitance values were measured at frequencies of 1 kHz, 2 kHz, 5 kHz, 10 kHz, and 15 kHz at three different temperatures: -40ºC, 20ºC, and 120ºC to determine their frequency response. Figures 3.3, 3.4, and 3.5 show these results. The ESR peaked at 10 kHz at all temperatures and increased from an average of 1.57 milliohms at 1 kHz to an average of 4.98 milliohms at 10 kHz. The average at 5 kHz was 4.32 milliohms.
The DF increased from a value of 0.14% at 1 kHz to a value of 2.04% at 5 kHz. At 10 kHz, the average value was 6.7%. Above 10 kHz the increase was substantial. The capacitance value increased 9% from 1 kHz to 5 kHz at all three temperatures. Above 10 kHz there was a very substantial increase in capacitance that was evident up to 15 kHz.

9
ESR vs Frequency
1.28
3.23
4.004.61
3.23
1.46
3.26
4.20
4.84
3.49
1.98
3.89
4.77
5.49
4.18
0.00
1.00
2.00
3.00
4.00
5.00
6.00
0 5000 10000 15000 20000Frequency (Hz)
ES
R (M
illiO
hms)
-40 Celsius 20 Celsius 120 Celsius
Fig. 3.3. A single Prius film capacitor ESR frequency response.
Dissipation Factor vs Frequency
0.00
5.00
10.00
15.00
20.00
25.00
30.00
0 5000 10000 15000 20000Frequency (Hz)
Dis
sipa
tion
Fact
or (%
)
-40 Celsius 20 Celsius 120 Celsius
Fig. 3.4. A single Prius film capacitor DF frequency response.

10
Capacitance Value vs Frequency
0.00
100.00
200.00
300.00
400.00
500.00
600.00
700.00
800.00
0 5000 10000 15000Frequency (Hz)
Cap
acita
nce
(uF)
-40 Celsius 20 Celsius 120 Celsius
Fig. 3.5. A single Prius film capacitor frequency response.
3.2 KEMET CERAMIC CAPACITOR A Kemet 1 uF 500 Vdc ceramic capacitor was tested in the static mode as a ceramic benchmark. The capacitor is rated at 200ºC. Figure 3.6 shows ESR, DF, and capacitance values over the temperature range of -40ºC –180ºC.
Kemet Ceramic Capacitor
0.00
0.50
1.00
1.50
2.00
2.50
-40.0 -20.0 0.0 20.0 40.0 60.0 80.0 100.0 120.0 140.0 160.0 180.0Temp (Celsius)
Cap
acita
nce
(uF)
, D
issi
patio
n Fa
ctor
(%)
0.00
100.00
200.00
300.00
400.00
500.00
600.00
700.00
800.00
ESR
(Milli
Ohm
s)
Capacitance (uF) Dissipation Factor (%) ESR (MilliOhms)
Fig. 3.6. Kemet ceramic capacitor static test at 5 kHz.

11
The Kemet 1 uF ceramic capacitor was tested as the benchmark in the static mode over the temperature range of -40ºC –180ºC. The DF decreased from 1.96% to 0.21% and the ESR changed from 671 milliohms to 111 milliohms. The capacitance value was basically flat up to 140ºC, at that point it changed from .93 uF to .61 uF at 180ºC. 3.3 PENN STATE CERAMIC CAPACITOR
Penn State supplied a 90 nF 500 Vdc ceramic prototype high temperature capacitor for evaluation. The capacitor is rated at 300ºC. The static test of this capacitor at 5 kHz is shown in Fig. 3.7.
Penn State 90nF Capacitor
0.00
10.00
20.00
30.00
40.00
50.00
60.00
70.00
-40.0 -20.0 0.0 20.0 40.0 60.0 80.0 100.0 120.0 140.0 160.0 180.0
Temp (Celsius)
Cap
acita
nce
(nF)
0.00
20.00
40.00
60.00
80.00
100.00
120.00
140.00
160.00
ES
R (O
hms)
, Dis
sipa
tion
Fact
or (%
).
Capacitance (nF) Dissipation Factor (%) ESR (Ohms)
Fig. 3.7. Penn State ceramic high temperature static test at 5 kHz.
The Penn State prototype ceramic capacitor was tested in the static mode at 5 kHz over the temperature range of -40ºC –180ºC. The DF decreased from 6.39% to 1.8% and the ESR decreased from 144 ohms to 8.68 ohms. The capacitance value increased from 14.1–66.5 nF.
12
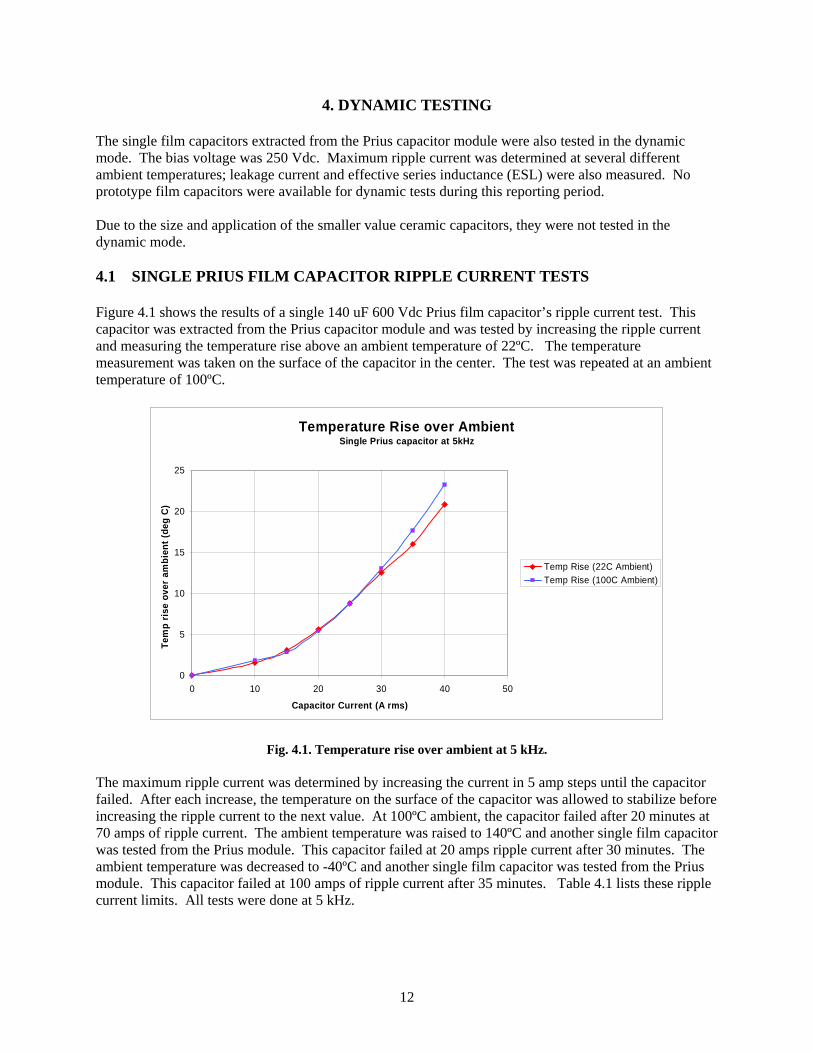
4. DYNAMIC TESTING The single film capacitors extracted from the Prius capacitor module were also tested in the dynamic mode. The bias voltage was 250 Vdc. Maximum ripple current was determined at several different ambient temperatures; leakage current and effective series inductance (ESL) were also measured. No prototype film capacitors were available for dynamic tests during this reporting period. Due to the size and application of the smaller value ceramic capacitors, they were not tested in the dynamic mode. 4.1 SINGLE PRIUS FILM CAPACITOR RIPPLE CURRENT TESTS Figure 4.1 shows the results of a single 140 uF 600 Vdc Prius film capacitor’s ripple current test. This capacitor was extracted from the Prius capacitor module and was tested by increasing the ripple current and measuring the temperature rise above an ambient temperature of 22ºC. The temperature measurement was taken on the surface of the capacitor in the center. The test was repeated at an ambient temperature of 100ºC.
Temperature Rise over AmbientSingle Prius capacitor at 5kHz
0
5
10
15
20
25
0 10 20 30 40 50
Capacitor Current (A rms)
Tem
p ri
se o
ver
ambi
ent (
deg
C)
Temp Rise (22C Ambient)Temp Rise (100C Ambient)
Fig. 4.1. Temperature rise over ambient at 5 kHz.
The maximum ripple current was determined by increasing the current in 5 amp steps until the capacitor failed. After each increase, the temperature on the surface of the capacitor was allowed to stabilize before increasing the ripple current to the next value. At 100ºC ambient, the capacitor failed after 20 minutes at 70 amps of ripple current. The ambient temperature was raised to 140ºC and another single film capacitor was tested from the Prius module. This capacitor failed at 20 amps ripple current after 30 minutes. The ambient temperature was decreased to -40ºC and another single film capacitor was tested from the Prius module. This capacitor failed at 100 amps of ripple current after 35 minutes. Table 4.1 lists these ripple current limits. All tests were done at 5 kHz.
13
Table 4.1. Maximum ripple current
Ambient Temperature
20 amps 70 amps 100 amps
-40ºC Failure after 35 minutes
100ºC Failure after 20 minutes
140ºC Failure after 30 minutes
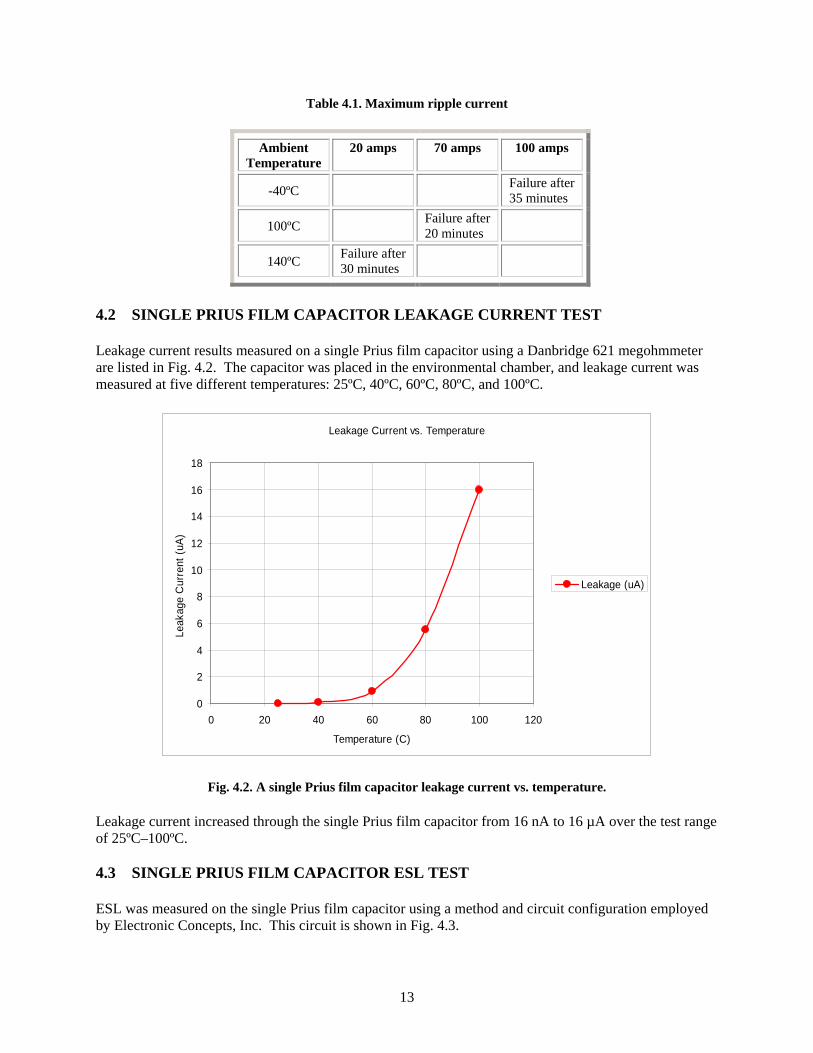
4.2 SINGLE PRIUS FILM CAPACITOR LEAKAGE CURRENT TEST Leakage current results measured on a single Prius film capacitor using a Danbridge 621 megohmmeter are listed in Fig. 4.2. The capacitor was placed in the environmental chamber, and leakage current was measured at five different temperatures: 25ºC, 40ºC, 60ºC, 80ºC, and 100ºC.
Leakage Current vs. Temperature
0
2
4
6
8
10
12
14
16
18
0 20 40 60 80 100 120
Temperature (C)
Leak
age
Cur
rent
(uA)
Leakage (uA)
Fig. 4.2. A single Prius film capacitor leakage current vs. temperature. Leakage current increased through the single Prius film capacitor from 16 nA to 16 µA over the test range of 25ºC–100ºC. 4.3 SINGLE PRIUS FILM CAPACITOR ESL TEST ESL was measured on the single Prius film capacitor using a method and circuit configuration employed by Electronic Concepts, Inc. This circuit is shown in Fig. 4.3.

14
Capacitor under test
Fig. 4.3. Circuit used to calculate ESL. After finding the resonant frequency using the circuit in Fig 4.3, the ESL is derived as a function of the inductive reactance (XL) and the capacitive reactance (XC). At resonant frequency, the two are equal such that XL = XC; therefore, 2πfL = 1/(2πfC) and from this the equation for inductance is ESL = L = 1/(4π2f2c). The ESL of the single Prius film capacitor was found to be 147 nH at an ambient temperature of 22ºC.
50 ohm resistor
Oscilloscope
A-input B-input
SIGNAL GENERATOR

15
5. MAGNET TEST DESCRIPTION
Magnet samples were evaluated using a Walker Scientific AMH-40 automatic hysteresisgraph. This computer controlled system is used for testing, analyzing, and evaluating the hysteresis properties of hard magnetic materials. The system consists of a PC-based control console, two computer interfaced integrating flux meters, a gauss meter, B and B-H coil sets, two 7-inch diameter variable-gap water-cooled electromagnets with cobalt-iron tipped poles, and a 5 kW 50 amp programmable power supply. The 1200-pound electromagnets are capable of generating demagnetizing forces up to 30,000 Orsteds. This system allows the operator to perform five different types of tests; (1) manual H-Field sweep, (2) second quadrant demagnetization curves, (3) complete four-quadrant full hysteresis loops, (4) recoil minor loops after saturation in the first quadrant, and (5) first quadrant saturation or demagnetization of the samples. Also complementing the system is a pulse charger capable of saturating very hard magnetic materials and a Model TCS2 temperature-controlled, water-cooled fixture for testing materials at temperatures ranging from -100 to +300°C. This fixture is used with a compatible, high-temperature coil set with integral thermocouples. The basic magnetic properties measured using the AMH-40 automatic hysteresisgraph are: residual induction (Br), coercive force (Hc), intrinsic coercivity (Hci), and energy product (BHmax). The Walker Scientific AMH-40 automatic hysteresisgraph is shown in Fig. 5.1.
Fig. 5.1. A Walker Scientific AMH-40 hysteresisgraph.
16
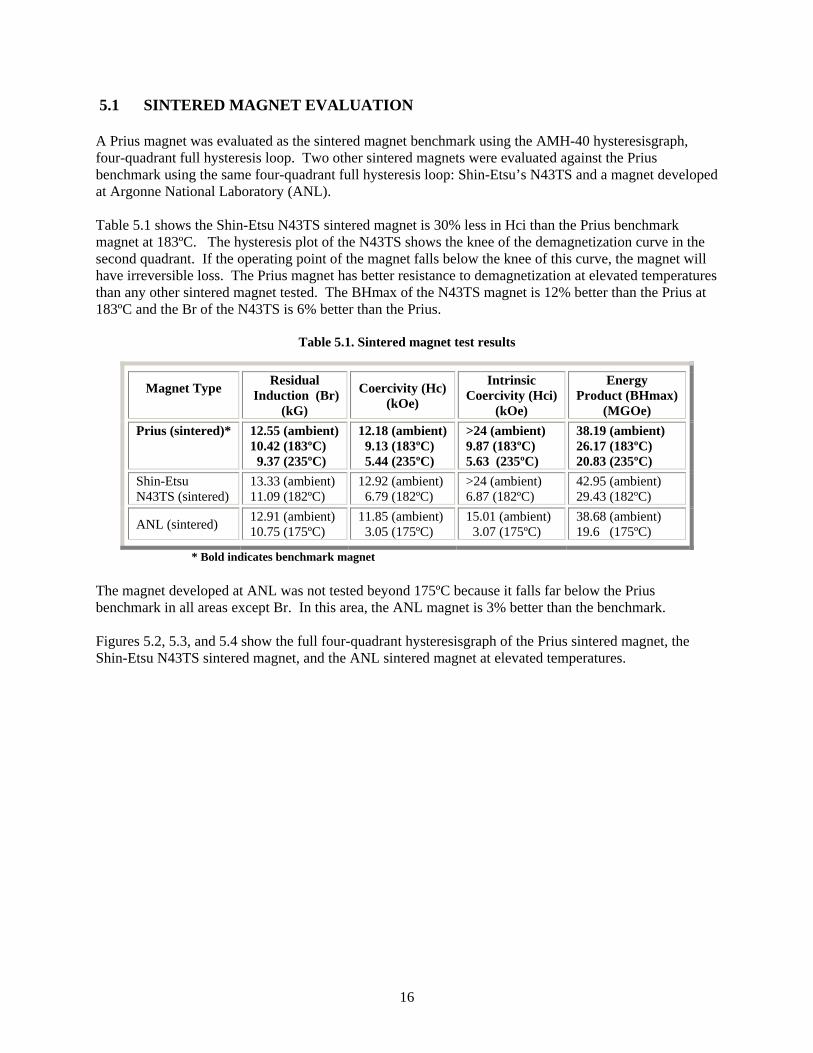
5.1 SINTERED MAGNET EVALUATION A Prius magnet was evaluated as the sintered magnet benchmark using the AMH-40 hysteresisgraph, four-quadrant full hysteresis loop. Two other sintered magnets were evaluated against the Prius benchmark using the same four-quadrant full hysteresis loop: Shin-Etsu’s N43TS and a magnet developed at Argonne National Laboratory (ANL). Table 5.1 shows the Shin-Etsu N43TS sintered magnet is 30% less in Hci than the Prius benchmark magnet at 183ºC. The hysteresis plot of the N43TS shows the knee of the demagnetization curve in the second quadrant. If the operating point of the magnet falls below the knee of this curve, the magnet will have irreversible loss. The Prius magnet has better resistance to demagnetization at elevated temperatures than any other sintered magnet tested. The BHmax of the N43TS magnet is 12% better than the Prius at 183ºC and the Br of the N43TS is 6% better than the Prius.
Table 5.1. Sintered magnet test results
Magnet Type Residual Induction (Br)
(kG)
Coercivity (Hc) (kOe)
Intrinsic Coercivity (Hci)
(kOe)
Energy Product (BHmax)
(MGOe) Prius (sintered)* 12.55 (ambient)
10.42 (183ºC) 9.37 (235ºC)
12.18 (ambient) 9.13 (183ºC) 5.44 (235ºC)
>24 (ambient) 9.87 (183ºC) 5.63 (235ºC)
38.19 (ambient) 26.17 (183ºC) 20.83 (235ºC)
Shin-Etsu N43TS (sintered)
13.33 (ambient) 11.09 (182ºC)
12.92 (ambient) 6.79 (182ºC)
>24 (ambient) 6.87 (182ºC)
42.95 (ambient) 29.43 (182ºC)
ANL (sintered) 12.91 (ambient) 10.75 (175ºC)
11.85 (ambient) 3.05 (175ºC)
15.01 (ambient) 3.07 (175ºC)
38.68 (ambient) 19.6 (175ºC)
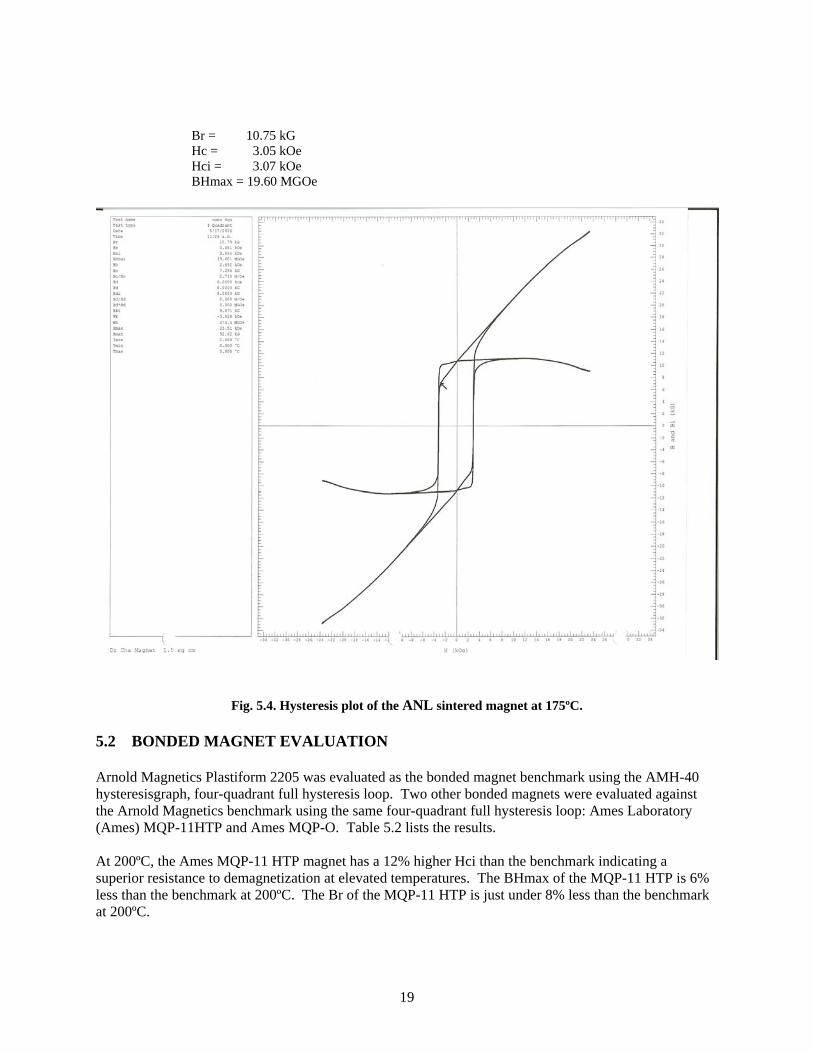
* Bold indicates benchmark magnet The magnet developed at ANL was not tested beyond 175ºC because it falls far below the Prius benchmark in all areas except Br. In this area, the ANL magnet is 3% better than the benchmark. Figures 5.2, 5.3, and 5.4 show the full four-quadrant hysteresisgraph of the Prius sintered magnet, the Shin-Etsu N43TS sintered magnet, and the ANL sintered magnet at elevated temperatures.

17
Br = 10.42 kG Hc = 9.13 kOe Hci = 9.87 kOe BHmax = 26.17 MGOe
Fig. 5.2. Hysteresis plot of the Prius sintered benchmark magnet at 183ºC.

18
Br = 11.09 kG Hc = 6.79 kOe Hci = 6.87 kOe BHmax = 29.43 MGOe
Fig. 5.3. Hysteresis plot of the Shin-Etsu N43TS sintered magnet at 182ºC.
19
Br = 10.75 kG
Hc = 3.05 kOe Hci = 3.07 kOe BHmax = 19.60 MGOe
Fig. 5.4. Hysteresis plot of the ANL sintered magnet at 175ºC. 5.2 BONDED MAGNET EVALUATION Arnold Magnetics Plastiform 2205 was evaluated as the bonded magnet benchmark using the AMH-40 hysteresisgraph, four-quadrant full hysteresis loop. Two other bonded magnets were evaluated against the Arnold Magnetics benchmark using the same four-quadrant full hysteresis loop: Ames Laboratory (Ames) MQP-11HTP and Ames MQP-O. Table 5.2 lists the results. At 200ºC, the Ames MQP-11 HTP magnet has a 12% higher Hci than the benchmark indicating a superior resistance to demagnetization at elevated temperatures. The BHmax of the MQP-11 HTP is 6% less than the benchmark at 200ºC. The Br of the MQP-11 HTP is just under 8% less than the benchmark at 200ºC.

20
Table 5.2. Bonded magnet test results
Magnet Type Residual
Induction (Br) (kG)
Coercivity (Hc) (kOe)
Intrinsic Coercivity (Hci)
(kOe)
Energy Product (BHmax)
(MGOe) Arnold Magnetics Plastiform 2205 (bonded)*
5.03 (ambient) 3.70 (200ºC)
4.24 (ambient) 2.85 (200ºC)
11.49 (ambient) 5.10 (200ºC)
5.29 (ambient) 2.68 (200ºC)
Ames MQP-11HTP (bonded)
3.93 (ambient) 3.41 (200ºC)
3.56 (ambient) 2.89 (200ºC)
11.87 (ambient) 5.72 (200ºC)
3.49 (ambient) 2.51 (200ºC)
Ames MQP-O (bonded)
4.46 (ambient) 3.15 (200ºC)
4.03 (ambient) 2.55 (200ºC)
12.23 (ambient) 5.25 (200ºC)
4.53 (ambient) 2.03 (200ºC)
Bold indicates benchmark magnet At 200ºC, the Ames MQP-O magnet has a 3% higher Hci than the benchmark indicating a slightly better ability to resist demagnetization at elevated temperatures. The BHmax of the MQP-O magnet is 24% less than the benchmark at 200ºC. The Br of the MQP-O magnet is 15% less that the benchmark at 200ºC. Figures 5.5, 5.6, and 5.7 show the full four-quadrant hysteresisgraph of the Arnold Magnetics Plastiform 2205 bonded benchmark magnet, the Ames MQP-11 HTP bonded magnet, and the Ames MQP-O bonded magnet at 200ºC.
21
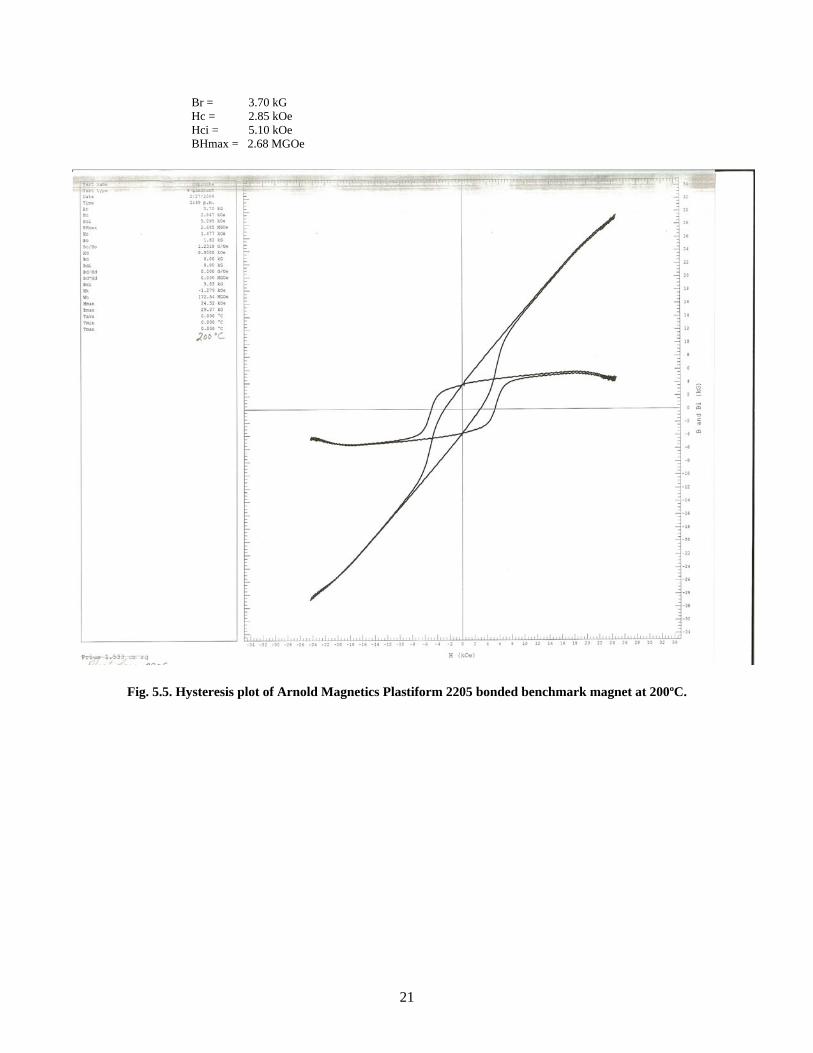
Br = 3.70 kG Hc = 2.85 kOe
Hci = 5.10 kOe BHmax = 2.68 MGOe
Fig. 5.5. Hysteresis plot of Arnold Magnetics Plastiform 2205 bonded benchmark magnet at 200ºC.
22
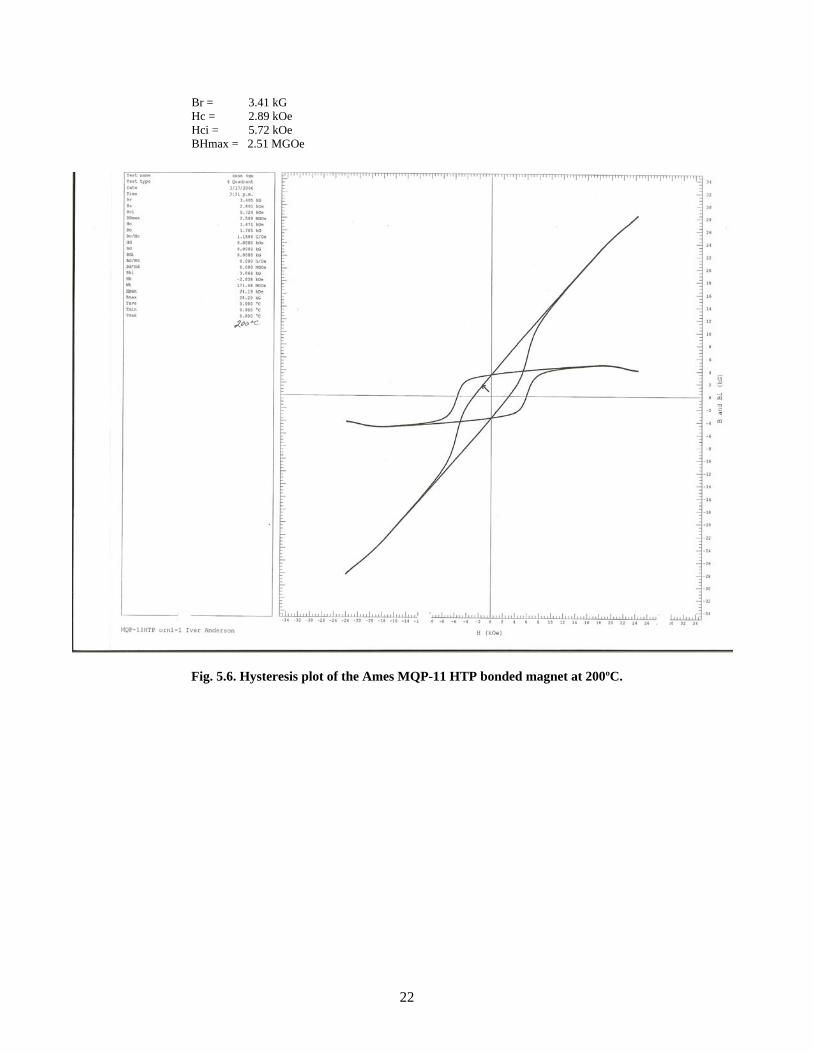
Br = 3.41 kG Hc = 2.89 kOe
Hci = 5.72 kOe BHmax = 2.51 MGOe
Fig. 5.6. Hysteresis plot of the Ames MQP-11 HTP bonded magnet at 200ºC.

23
Br = 3.15 kG Hc = 2.55 kOe
Hci = 5.25 kOe BHmax = 2.03 MGOe
Fig. 5.7. Hysteresis plot of the Ames MQP-O bonded magnet at 202ºC.

24
6. SUMMARY
The evaluation and characterization of capacitor and magnet technologies was accomplished through the testing of these components at elevated temperatures and in simulated operating conditions. 6.1 CAPACITOR TESTING There were no prototype film capacitors available for evaluation during this reporting period. The film capacitor evaluated as the benchmark was taken from the Prius HEV capacitor module. The Prius capacitor module contains 10 film capacitors in parallel. Several of these were extracted and used in the evaluation process. A Kemet 1 uF 500 Vdc ceramic capacitor was evaluated as the ceramic benchmark. Penn State supplied a prototype 90 nF 500 Vdc ceramic capacitor for evaluation. Table 6.1 shows the results of a static test at 5 kHz of the benchmark capacitors and the ceramic prototype. No other prototype ceramic capacitors were received from developers for evaluation during this reporting period.
Table 6.1. Capacitor evaluation 5 kHz static test summary
Capacitor Type
Prius Single Film Capacitor
140 uF
Kemet Ceramic
1 uF
Penn State Ceramic
90 nF ESR (ohms)
.004 (-40ºC) .0049 (140ºC)
.671 (-40ºC) .111 (180ºC)
144 (-40ºC) 8.6 (180ºC)
DF (%) 2.0 (-40ºC) 2.3 (140ºC)
1.9 (-40ºC) .21 (180ºC)
6.4 (-40ºC) 1.8 (180ºC)
Capacitance value (uF)
156 (-40ºC) 150 (140ºC)
.93 (-40ºC) .61 (180ºC)
.0141 (-40ºC) .0665 (180ºC)
. The Kemet capacitor performed worse in the area of capacitance value and ESR as the temperature approached its rated value; whereas the Penn State capacitor started out poorly in both of those areas at lower temperatures, but as the temperature increased the ESR improved over 70% and the capacitance value improved over 370%. 6.2 MAGNET TESTING Several magnets, both sintered and bonded, were evaluated using the hysteresisgraph machine at elevated temperatures. Before these data could be logged, the Walker Scientific hysteresisgraph machine needed the pole pieces replaced to ensure accurate data while using the high temperature fixture. Permadure pole tips were added to the HV-7V electromagnet to allow accurate measurements to be made up to 300ºC. The Prius sintered magnet was used as the benchmark and proved to be the best sintered magnet at elevated temperatures. The Shin-Etsu N43TS was better at ambient than the Prius, but did poorly at elevated temperatures. The only prototype sintered magnet tested was by ANL, and it did poorly at elevated temperatures. Two prototype bonded magnets were evaluated against the Arnold Magnetics Plastiform 2205 bonded magnet benchmark. The Ames MQP-11 HTP was 12% better than the benchmark only in Hci, and the

25
Ames MQP-O was 3% better in Hci. The benchmark was better in all other parameters evaluated. The Ames bonded magnets appear to be better in their ability to resist demagnetization at ambient and elevated temperatures than the benchmark.
26
DISTRIBUTION
Internal
1. D. J. Adams 2. J. P. Cunningham 3. E. C. Fox 4. K. P. Gambrell
5. S. S. Golik 6. L. D. Marlino 7. M. Olszewski 8. Laboratory Records
External
9. G. Armstrong, Maverick Systems, Inc., 165 Woods Lane, Kingston, Tennessee 37763. 10. R. Al-Attar, DCX, [email protected]. 11. T. Q. Duong, U.S. Department of Energy, EE-2G/Forrestal Building, 1000 Independence
Avenue, S.W., Washington, D.C. 20585. 12. R. R. Fessler, BIZTEK Consulting, Inc., 820 Roslyn Place, Evanston, Illinois 60201-1724. 13. K. Fiegenschuh, Ford Motor Company, Scientific Research Laboratory, 2101 Village Road, MD-
2247, Dearborn, Michigan 48121. 14. V. Garg, Ford Motor Company, 15050 Commerce Drive, North, Dearborn, Michigan 48120-
1261. 15. G. Hagey, Sentech, Inc., 501 Randolph St., Williamsburg, Virginia 23185. 16. E. Jih, Ford Motor Company, Scientific Research Laboratory, 2101 Village Road, MD-1170, Rm.
2331, Dearborn, Michigan 48121. 17. K. J. Kelly, National Renewable Energy Laboratory, 1617 Cole Boulevard
Golden, CO 80401 18. A. Lee, Daimler Chrysler, CIMS 484-08-06, 800 Chrysler Drive, Auburn Hills, Michigan 48326-
2757. 19. F. Liang, Ford Motor Company, Scientific Research Laboratory, 2101 Village Road, MD1170,
Rm. 2331/SRL, Dearborn, Michigan 48121. 20. M. W. Lloyd, Energetics, Inc., 7164 Columbia Gateway Drive, Columbia, Maryland 21046. 21. M. Mehall, Ford Motor Company, Scientific Research Laboratory, 2101 Village Road, MD-2247,
Rm. 3317, Dearborn, Michigan 48124-2053. 22. Jean A. Montemarano–Naval Surface Warfare Center, Carderock Division; Code 642, NSWCD,
9500 MacArthur Boulevard; West Bethesda, Maryland 20817 23. N. Olds, United States Council for Automotive Research (USCAR), [email protected] 24. J. Rogers, Chemical and Environmental Sciences Laboratory, GM R&D Center, 30500 Mound
Road, Warren, Michigan 48090-9055. 25. S. A. Rogers, U.S. Department of Energy, EE-2G/Forrestal Building, 1000 Independence
Avenue, S.W., Washington, D.C. 20585. 26. G. S. Smith, General Motors Advanced Technology Center, 3050 Lomita Boulevard, Torrance,
California 90505. 27. E. J. Wall, U.S. Department of Energy, EE-2G/Forrestal Building, 1000 Independence Avenue,
S.W., Washington, D.C. 20585. 28. B. Welchko, General Motors Advanced Technology Center, 3050 Lomita Boulevard, Torrance,
California 90505. 29. P. G. Yoshida, U.S. Department of Energy, EE-2G/Forrestal Building, 1000 Independence Avenue,
S.W., Washington, D.C. 20585.