Evaluating Visual Analytics with Eye...
9
Evaluating Visual Analytics with Eye Tracking Kuno Kurzhals 1 , Brian Fisher 2 , Michael Burch 1 , and Daniel Weiskopf 1 1 University of Stuttgart, Germany 2 Simon Fraser University, Canada ABSTRACT The application of eye tracking for the evaluation of humans’ viewing behavior is a common approach in psychological re- search. So far, the use of this technique for the evaluation of visual analytics and visualization is less prominent. We investigate recent scientific publications from the main visu- alization and visual analytics conferences and journals that include an evaluation by eye tracking. Furthermore, we pro- vide an overview of evaluation goals that can be achieved by eye tracking and state-of-the-art analysis techniques for eye tracking data. Ideally, visual analytics leads to a mixed- initiative cognitive system where the mechanism of distribu- tion is the interaction of the user with visualization environ- ments. Therefore, we also include a discussion of cognitive approaches and models to include the user in the evalua- tion process. Based on our review of the current use of eye tracking evaluation in our field and the cognitive theory, we propose directions of future research on evaluation method- ology, leading to the grand challenge of developing an eval- uation approach to the mixed-initiative cognitive system of visual analytics. Categories and Subject Descriptors Human-centered computing [Visualization]: Empirical stud- ies in visualization General Terms Evaluation Keywords Eye tracking, visual analytics, visualization, evaluation meth- ods, visual cognition Permission to make digital or hard copies of all or part of this work for personal or classroom use is granted without fee provided that copies are not made or distributed for profit or commercial advantage and that copies bear this notice and the full citation on the first page. Copyrights for components of this work owned by others than ACM must be honored. Abstracting with credit is permitted. To copy otherwise, or republish, to post on servers or to redistribute to lists, requires prior specific permission and/or a fee. Request permissions from [email protected]. BELIV’14, November 10, 2014, Paris, France Copyright is held by the owner/author(s). Publication rights licensed to ACM. ACM 978-1-4503-3209-5/14/11. . . $15.00 http://dx.doi.org/10.1145/2669557.2669560 1. INTRODUCTION Eye tracking has been widely used to measure the distri- bution of visual attenuation, often in connection with ana- lyzing how well participants perform with certain tasks on visual stimuli. The task might be dependent on the envi- ronment in which eye tracking is applied. Traditionally, eye tracking has been applied in areas like psychology and mar- keting research [14]. The canonical early eye tracking work was that of Alfred Yarbus [55], who demonstrated that the path taken by the gaze of his observer across paintings of various naturalistic scenes was determined by the interaction of scene informa- tion and the nature of the observer’s task. For example, after an initial inspection of the painting “They Did Not Expect Him”, Yarbus asked the viewer to“Estimate the ma- terial circumstances of the family in the picture”, “Surmise what the family had been doing before the arrival of the ‘un- expected visitor”’, and “Estimate how long the ‘unexpected visitor’ had been away from the family”. This led to differ- ent patterns of eye movement (scanpaths) across the scene as the observer sought the required information. In natu- ralistic scenes such as these, it is thought that the “gist” of the entire scene is perceived quickly, and interacts with the observer’s task and top-down knowledge to determine what areas are to be fixated and in what order [4, 33]. As eye tracking technology became more available, a large number of studies were conducted using a variety of technologies, scenes, tasks, etc. [4, 13, 49]. However, only recently eye tracking has become increas- ingly popular in visualization research—as a means of eval- uating visualization techniques, but also as a source of data for which visualization can be used for analysis [6]. For eval- uation purposes, one typically records the eye movements of study participants when they perform a given task with a visual stimulus depicting some kind of data visualization. It is thought that the measurement of spatio-temporal eye movement data may well be more diagnostic than popular summative performance variables, such as completion time and accuracy, recorded in traditional user studies. In ad- dition, because eye movements are recorded in an ongoing basis throughout the visualization task, they can provide insight into the process of working with a visualization en- vironment. On the challenging side, however, this spatio- temporal aspect of the eye movement data requires more sophisticated data analysis and visualization methods tai- lored to the tasks and stimuli of interest. A simple mapping of the psychology research methods mentioned above onto the interpretation of eye position in
Transcript of Evaluating Visual Analytics with Eye...
Evaluating Visual Analytics with Eye Tracking
Kuno Kurzhals1, Brian Fisher2, Michael Burch1, and Daniel Weiskopf11University of Stuttgart, Germany2Simon Fraser University, Canada
Submission ID 4 Brian FisherSimon Fraser University
Michael BurchUniversity of Stuttgart
ABSTRACTThe application of eye tracking for the evaluation of humans’viewing behavior is a common approach in psychological re-search. So far, the use of this technique for the evaluationof visual analytics and visualization is less prominent. Weinvestigate recent scientific publications from the main visu-alization and visual analytics conferences and journals thatinclude an evaluation by eye tracking. Furthermore, we pro-vide an overview of evaluation goals that can be achievedby eye tracking and state-of-the-art analysis techniques foreye tracking data. Ideally, visual analytics leads to a mixed-initiative cognitive system where the mechanism of distribu-tion is the interaction of the user with visualization environ-ments. Therefore, we also include a discussion of cognitiveapproaches and models to include the user in the evalua-tion process. Based on our review of the current use of eyetracking evaluation in our field and the cognitive theory, wepropose directions of future research on evaluation method-ology, leading to the grand challenge of developing an eval-uation approach to the mixed-initiative cognitive system ofvisual analytics.
Categories and Subject DescriptorsHuman-centered computing [Visualization]: Empirical stud-ies in visualization
General TermsEvaluation
KeywordsEye tracking, visual analytics, visualization, evaluation meth-ods, visual cognition
Permission to make digital or hard copies of all or part of this work forpersonal or classroom use is granted without fee provided that copies are notmade or distributed for profit or commercial advantage and that copies bearthis notice and the full citation on the first page. Copyrights for componentsof this work owned by others than ACM must be honored. Abstracting withcredit is permitted. To copy otherwise, or republish, to post on servers or toredistribute to lists, requires prior specific permission and/or a fee. Requestpermissions from [email protected]’14, November 10, 2014, Paris, FranceCopyright is held by the owner/author(s). Publication rights licensed toACM.ACM 978-1-4503-3209-5/14/11. . . $15.00http://dx.doi.org/10.1145/2669557.2669560
1. INTRODUCTIONEye tracking has been widely used to measure the distri-
bution of visual attenuation, often in connection with ana-lyzing how well participants perform with certain tasks onvisual stimuli. The task might be dependent on the envi-ronment in which eye tracking is applied. Traditionally, eyetracking has been applied in areas like psychology and mar-keting research [14].
The canonical early eye tracking work was that of AlfredYarbus [55], who demonstrated that the path taken by thegaze of his observer across paintings of various naturalisticscenes was determined by the interaction of scene informa-tion and the nature of the observer’s task. For example,after an initial inspection of the painting “They Did NotExpect Him”, Yarbus asked the viewer to “Estimate the ma-terial circumstances of the family in the picture”, “Surmisewhat the family had been doing before the arrival of the ‘un-expected visitor”’, and “Estimate how long the ‘unexpectedvisitor’ had been away from the family”. This led to differ-ent patterns of eye movement (scanpaths) across the sceneas the observer sought the required information. In natu-ralistic scenes such as these, it is thought that the “gist” ofthe entire scene is perceived quickly, and interacts with theobserver’s task and top-down knowledge to determine whatareas are to be fixated and in what order [4, 33]. As eyetracking technology became more available, a large numberof studies were conducted using a variety of technologies,scenes, tasks, etc. [4, 13, 49].
However, only recently eye tracking has become increas-ingly popular in visualization research—as a means of eval-uating visualization techniques, but also as a source of datafor which visualization can be used for analysis [6]. For eval-uation purposes, one typically records the eye movements ofstudy participants when they perform a given task with avisual stimulus depicting some kind of data visualization.It is thought that the measurement of spatio-temporal eyemovement data may well be more diagnostic than popularsummative performance variables, such as completion timeand accuracy, recorded in traditional user studies. In ad-dition, because eye movements are recorded in an ongoingbasis throughout the visualization task, they can provideinsight into the process of working with a visualization en-vironment. On the challenging side, however, this spatio-temporal aspect of the eye movement data requires moresophisticated data analysis and visualization methods tai-lored to the tasks and stimuli of interest.
A simple mapping of the psychology research methodsmentioned above onto the interpretation of eye position in

visualization tasks is complicated by a number of perceptualand cognitive factors. Both natural scenes and the reduced-cue experiments used in laboratory studies by psychologiststend to be composed of discrete objects about which a deci-sion can be made, e.g., the material circumstances questionin the Yarbus example might be answered by inspection ofclothing and room decor. In contrast, understanding a visu-alization often requires a judgment to be made based on theconfiguration of multiple objects or aspects of a given object(e.g., seeking clusters of points in a scatterplot), chromaticpatterns as in a color map used for scalar-data visualiza-tion, the orientation of elongated objects such as in a linechart, or the relative area of sections of a pie chart. Whileit is clear that these kinds of tasks are not processed inthe same way as object categorization [5], it is not obviouswhere one would expect an observer to look in order to per-form tasks based on important aspects of a visualization, orhow a given scanpath might be interpreted as a predictorof some particular cognitive operation. Some studies in thepsychology literature have used scenes that were entirely ar-tificial (e.g., counting and subitizing in point cloud displays[56]), and these may provide a basis for investigation. How-ever, the problems are further complicated when interactivevisualization is evaluated because dynamic stimuli requireeven more advanced models and evaluation methods. Evenmore so, the evaluation of visual analytics is challenging be-cause it, in the ideal case, forms a mixed-initiative cognitivesystem—with the user interacting with the visualization en-vironment.
These problems might be one of the reasons that the num-ber of eye tracking studies is much smaller than the numberof other user studies in visualization and visual analytics (seeSection 5). In the past, high prices of eye tracking hardwareand technology might have been another roadblock. Sincehardware components become cheaper and cheaper and eas-ier to handle, the potential of this technology for an exten-sion of the evaluation in our research community is consid-erable. Another issue might be that it is not clear to whatclass of evaluation problems in visualization and visual ana-lytics eye tracking is applied best, and which analysis meth-ods can be employed to derive knowledge from the recordedgaze data.
In this position paper, we provide an overview of howeye tracking is currently used in the evaluation of visual-ization techniques and how the gaze data is analyzed. Asanother contribution, we describe existing cognitive modelsand how they can be related to eye tracking for visual ana-lytics. Based on these ingredients, we propose a number ofpromising areas in which eye tracking could advance evalua-tion methods, sketch ways how to approach these evaluationproblems, and identify open research challenges. We hopethat we can stimulate other researchers to work with eyetracking in visualization and visual analytics.
2. RELATED WORKThe evaluation of visualization techniques is challenging,
but it has been acknowledged in our research communitythat we need good ways of assessing visualization [11, 35]and visual analytics [53]. In particular, the series of BELIVWorkshops addresses the issue of how we can evaluate vi-sualization, going beyond traditional measurements of taskaccuracy and completion time. For example, in the 2012BELIV Workshop, Elmqvist and Yi [15] proposed a general
approach to evaluating visualizations based on a collectionof patterns. For a most recent overview of user study-basedevaluation in visualization, we refer to Tory [50]. She pro-vides her reflection on user studies and a categorization oftesting methods, based on major goals such as understand-ing vs. evaluation as well as common methodological ap-proaches such as quantitative experiment, qualitative obser-vational study, inspection, and usability study. In anotherrecent publication, Freitas et al. [17] discuss usability evalu-ation for information visualizations by particularly lookingat it from a user-centered perspective.
Although eye tracking has a very long tradition and hasbeen widely used in many fields, as discussed in Section 1,there is remarkably little work in the visualization literaturethat would address eye tracking as a means of evaluatingvisualization or visual analytics. For example, the paper byGoldberg and Helfman [19] is the only paper from any of theprevious BELIV Workshops that would specifically addressthe issue of eye tracking evaluation methodology. Goldbergand Helfman present how eye tracking can be applied toevaluate simple information graphics, such as bar charts andline graphs. They focus on statistical analysis of commoneye tracking metrics and visual analysis of scanpaths. Basedon our research on similar user studies that included eyetracking for the evaluation of visualization techniques, wewill provide a broader overview of analysis methods appliedfor different research questions.
Despite such little prior work on eye tracking-based test-ing methodology in our community, we have been witnessinga rapid increase in the number of user studies that, at leastin parts, use eye tracking. One contribution of our paperis a summary and categorization of such papers; see Sec-tion 5. The majority of the papers were published in the last4 years, showing a steep gradient of related papers. Despitethe still small absolute number of such studies, we believethat this strong increase shows that eye tracking evaluationmethodology is a timely topic for our research community.
Our paper is in line with previous work that reflects onhow visualization is evaluated. In the context of evaluatinginformation visualization in general, Lam et al. [31] describeseven scenarios, based on an extensive literature review ofmore than 800 visualization papers. They consider the “un-derstanding of environments and work practices” and theevaluation of “visual data analysis and reasoning”, “commu-nication through visualization”, “collaborative data analy-sis”, “user performance”, “user experience”, and “visualiza-tion algorithms” in their survey. In a follow-up paper, Isen-berg et al. [24] extend the literature review to include pa-pers from scientific visualization. Isenberg et al. adopt thecoding scheme by Lam et al., with only minor changes andextensions: they add a new category “qualitative result in-spection” and change the evaluation of “visualization algo-rithms”to“algorithm performance”. One result of both Lamet al.’s and Isenberg et al.’s reflection on the research field isthat we have been witnessing a strong increase in the por-tion of user-related evaluation—across the different subfieldsof visualization. Another observation is the dominating roleof the categories “user performance” and “user experience”.Our paper builds a link in particular to “user performance”because eye tracking is most often used in controlled labo-ratory experiments that aim to measure and understand theperformance of users with visualization.

Statistical-kDescriptive
-kInferential
-kModeling
Visual-kExplorativekSearch
-kVisualkAnalytics
Stimulus-kInformationkVis.
-kScientifickVis.
Task-kSearchkQkReport
-kInterpretation
Standard-kCompletionkTime
-kErrorkRate
-kProtocolkAnalysis
EyekTracking-kSpatio-TemporalkData
-kPhysiologicalkData
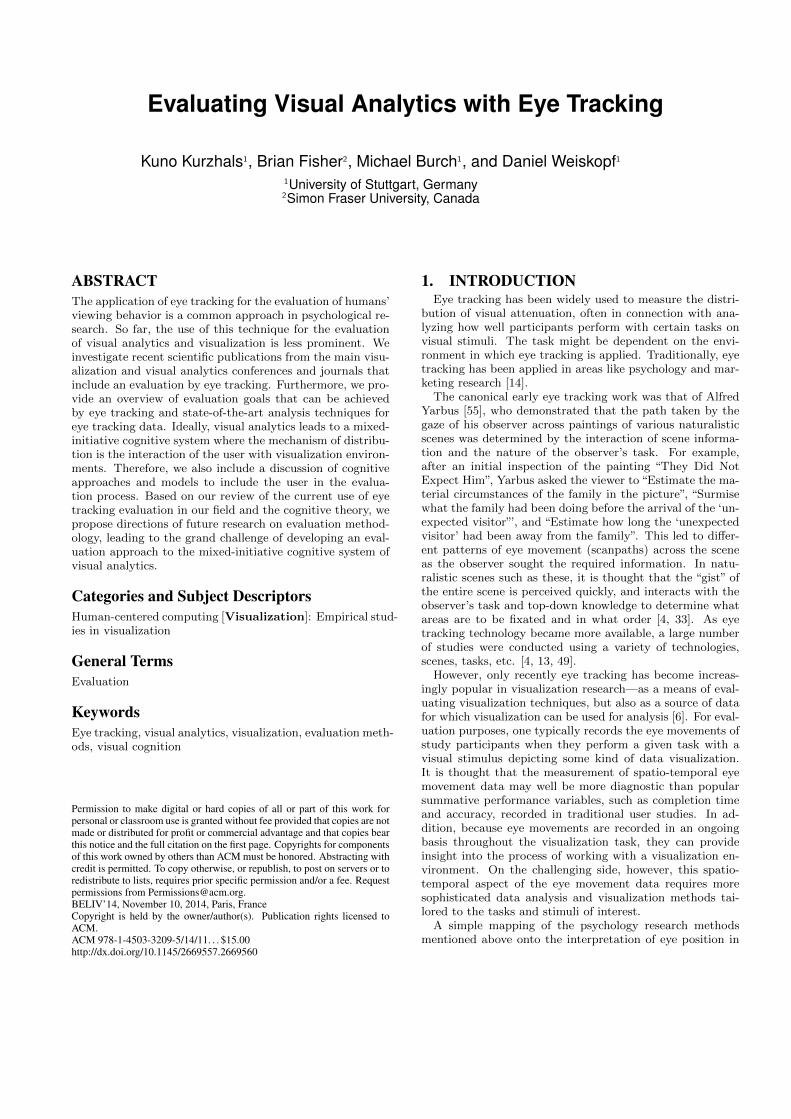
Figure 1: Pipeline of user-oriented evaluation. Stimulus and task represent the independent variables, mea-surements from a user study represent the dependent variables. The data analysis can then be performedwith statistical methods, or in combination with a visual data analysis.
However, we also want to go beyond the traditional userperformance with (isolated) visualization: in fact, we targetthe evaluation of visual analytics in the sense of the “sci-ence of analytical reasoning facilitated by interactive visualinterfaces” [48]. As Ribarsky et al. [39] discuss, there is thegeneral need for a science of analytical reasoning, includinga human cognitive model, but they do not detail any evalu-ation methodology. We describe in Section 6 some cognitivemodels and how they relate to the evaluation of the com-bined cognitive system of user and visualization interface.In this sense, our paper addresses the evaluation scenario“visual data analysis and reasoning” identified by Lam et al.and Isenberg et al. However, as discussed in their papers,there is little previous work that would address the com-bined evaluation of such distributed cognition; much of theprevious evaluation is based on case studies.
Except for the aforementioned paper by Goldberg andHelfman [19], none of the above papers deals with eye track-ing evaluation in detail. With our paper, we want to fill thisgap. We provide reflections on the current state of how eyetracking is used for evaluation in visualization and visual an-alytics; and we discuss the directions for future research thatwill allow for a broader use of eye tracking. We focus on eyetracking evaluation in the context of controlled laboratoryexperiments.
It should be noted that there is yet another aspect of eyetracking related to visualization and visual analytics: theiruse for the visual analysis of eye tracking data. This paperdoes not focus on this connection between eye tracking andvisualization or visual analytics. Instead, we refer the readerto a recent state of the art report by Blascheck et al. [6] anda review of visual analytics techniques for eye tracking databy Andrienko et al. [2]. However, we do discuss some of theanalysis problems for eye tracking data as far as they areconcerned with analyzing the results of eye tracking studieswith visualization and visual analytics; see Section 4.
3. EVALUATION PIPELINEA typical user study for visualization techniques can be
described by a pipeline as shown in Figure 1. Here, we as-sume a controlled laboratory experiment, even though manyaspects carry over to other variants of user studies. A taskis given to the study participant, that is to be solved byusing visualization or visual analytics. The visual stimuliand choice of tasks serve as independent variables of the
study. In this context, different visualization techniquesand/or variations of one technique provide the basis for thevisual stimuli. The task often requires the user to searchand report certain aspects, or interpret the stimulus.
The performance with the task is assessed in the form ofdependent variables. Standard measurements are the com-pletion time and accuracy. However, protocol analysis isoften employed as well, in particular, the “think aloud” pro-tocol analysis [16]. Finally, the data acquired through thedependent variables is analyzed, eventually leading to con-clusions regarding the study. Very well accepted is dataanalysis in the form of statistical inference for hypothesistesting. However, descriptive statistics and statistical mod-eling might be employed, too. To some degree, visually ori-ented data analysis might appear here as well. Nonetheless,the standard procedure for the overall user study process isoriented along the goal of hypothesis testing with statisticalmethods.
With eye tracking, the evaluation pipeline is extended; seethe color highlighting in Figure 1. First, eye tracking pro-vides additional dependent variables, in particular, spatio-temporal data that provides information about the partic-ipant’s viewing behavior or physiological data by the pupildiameter, which can be an indicator of cognitive load [1, 27].Due to the complexity of the spatio-temporal gaze data, weusually have to derive other, more simplified dependent vari-ables from the raw gaze data in order to perform data anal-ysis. Section 4 reviews typical examples of such aggregatedmetrics for eye tracking data. However, with data aggre-gation, we lose much of the information about the spatio-temporal nature of the eye tracking data. Therefore, as sec-ond major change, eye tracking studies often come with vi-sual spatio-temporal analysis of the gaze data.
In fact, eye tracking experiments and the accompanyingvisual data analysis may often be used for hypothesis build-ing, not just hypothesis testing, because they allow for adetailed “window” into how the participant works with thevisualization over time. The data analysis methods suitablefor eye tracking data are reviewed in the next section.
It should also be noted that the pipeline from Figure 1targets the evaluation of visualization techniques. For vi-sual analytics, the much more complex distributive cogni-tive system that includes the user and machine needs to beevaluated. To this end, we also have to include cognitivemodeling of the user, as discussed in Section 6.

4. EYE TRACKING DATA ANALYSISWith the spatio-temporal eye tracking data recorded in
a user study, the data analysis can be performed by twodifferent approaches: statistical and visual analysis.
4.1 Statistical AnalysisThe raw gaze data is usually preprocessed by an appro-
priate filter algorithm to detect fixations and saccades; forfurther reading on eye tracking terminology, we refer toHolmqvist et al. [22] and Blascheck et al. [6]. The prepro-cessed data can then undergo statistical analysis. Typically,the data has to be further aggregated to allow for the appli-cation of statistical methods. An important class of analysisapproaches is based on eye tracking metrics computed fromthe (preprocessed) eye tracking data. Objects or specificregions on a stimulus can be of special interest. By defin-ing boundary shapes around these Areas of Interest (AOIs),fixation data can be mapped to the areas. The commoneye tracking metrics can be separated in three categories,according to Poole and Ball [37]:
• Fixation-derived metrics: Fixations with or with-out AOI information can be processed. A commonmetric is defined by the number of fixations per AOI,which indicates the relevance of the AOI for the users.To compare the distribution of attention between AOIs,the sum of fixation durations may be used.
• Saccade-derived metrics: The characteristics of thesaccades may indicate the quality of visual cues in thestimulus or the extent of visual searching. For exam-ple, large saccade amplitude can indicate meaningfulcues that draw the attention from a distance, or ahigh frequency of saccades could come from much vi-sual searching. Therefore, saccade-derived metrics canserve to indicate difficulties with the visual encoding.
• Scanpath-derived metrics: The scanpath consistsof the full sequence of fixations and saccades. There-fore, scanpath-derived metrics can acquire informa-tion about visual reading strategies or pinpoint spe-cific problems with the visualization design during thetask. The transition matrix is the common approachto analyzing transition patterns between AOIs, albeitit does not represent the full sequence but only thecollection of pairs of fixations from the sequence.
Once we have values from any of these metrics, we can di-rectly apply statistical methods, including inferential or de-scriptive statistics as well as statistical modeling. Therefore,these metrics can serve as a basis for hypothesis testing.
A major problem is that the eye tracking metrics haveto be interpreted with caution because they are no unam-biguous indicator for certain characteristics of cognitive orperceptual processing. In fact, they provide a rather coarseand aggregated perspective on the participant’s viewing be-havior. Therefore, they are best accompanied by comple-mentary indicators, or the eye tracking study is specificallydesigned to evoke and test clearly specified hypotheses. An-other problem is that the metrics were typically developedfor visual stimuli that are different from those from visual-ization; therefore, it still needs to be demonstrated that themetrics are indicators for the same characteristics.
Eye tracking data usually contains much more informationthan represented by the above, aggregated metrics. There-
fore, statistical analysis can also be applied to data that iscloser to the original gaze data. In particular, statisticalmodeling to predict and classify scanpaths on stimuli pro-vides a promising approach for a more complete analysis forvisualization stimuli. Here, one issue is to generate the ap-propriate model for the scanpath (e.g., define the appropri-ate AOIs) and employ the appropriate statistical methods.In this context, one can use data-mining techniques suchas scanpath clustering [19], layered hidden Markov mod-els [12], or measures for the similarity between aggregatedscanpaths [21].
4.2 Visual AnalysisIn general, visualization can complement statistical anal-
ysis by providing additional insight into the data by ex-ploratory search, building hypotheses, or the presentationof confirmed analysis results [41]. The same is true of thespecial cases of eye tracking data analysis. In particular,visualization is a very good means of examining the spatial,temporal, or spatio-temporal aspects of the data [6].
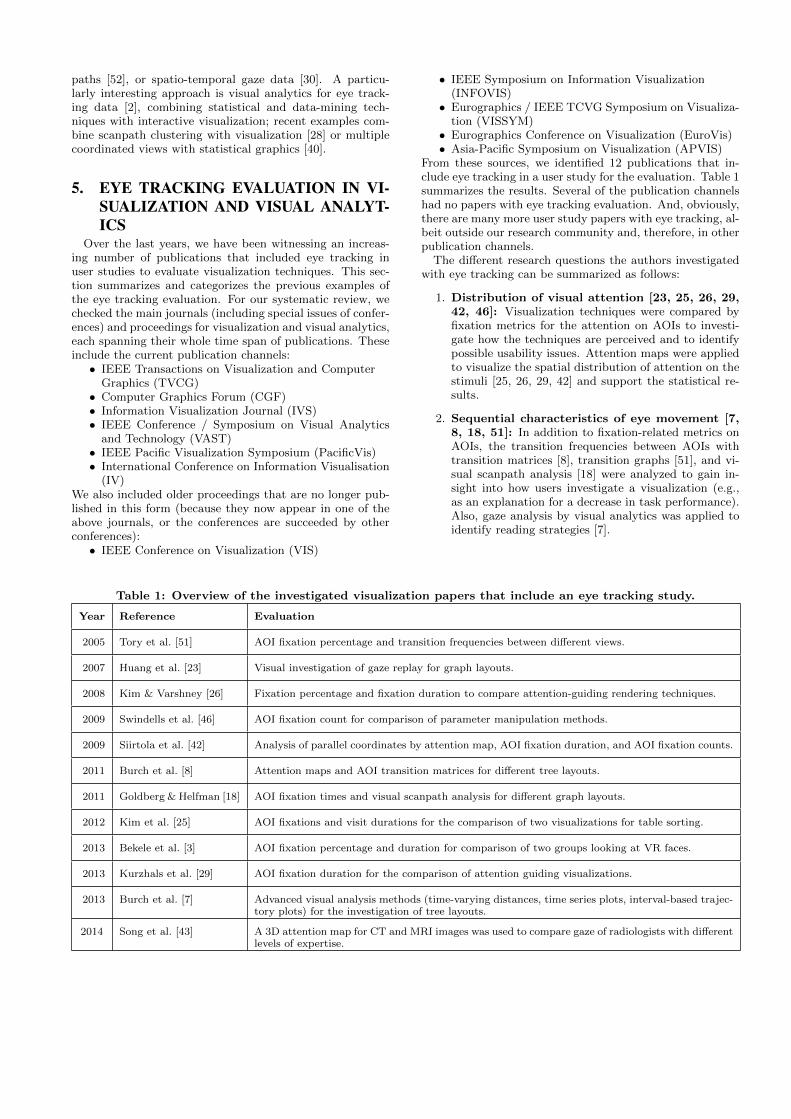
Figure 2: Attention map (left) and gaze plot (right).
The most common visualization techniques are attentionmaps and gaze plots (see Figure 2). Attention maps displaythe spatial distribution of eye tracking data on a stimulus.The data can be aggregated over time for one participant ormultiple participants. Although attention maps can providea good overview of important areas of interest on a staticstimulus, the temporal component of the data is lost. Incontrast, gaze plots provide a spatio-temporal perspective onfixation sequences and can be investigated to identify poten-tial reading strategies. However, with increasing length ofthe scanpath, or with scanpaths from multiple participants,the visualization becomes cluttered and hard to interpret.Alternatively, transition matrices allow us to analyze tran-sition patterns but lack the interpretation of longer transi-tion sequences (beyond just pairs of fixations). In summary,the traditional visualization techniques are well prepared toprovide a qualitative picture of the distribution of atten-tion aggregated over time (attention maps) or of the shortscanpath of a single participant—both for static stimuli. Inthese cases, they can be used also for eye tracking experi-ments with visualization or visual analytics, in particular,for exploratory data analysis and hypothesis building.
However, for more challenging research questions—includ-ing ones that work with dynamic stimuli, many participantsor groups of participants, and coupled spatial and temporalstructures of the gaze data—the above visualization tech-niques are not sufficient. Therefore, there is much, mostlyrecent, work in the visualization community to develop im-proved visualization techniques, for example, for display-ing time-oriented AOI data [9], complete sequences of scan-
paths [52], or spatio-temporal gaze data [30]. A particu-larly interesting approach is visual analytics for eye track-ing data [2], combining statistical and data-mining tech-niques with interactive visualization; recent examples com-bine scanpath clustering with visualization [28] or multiplecoordinated views with statistical graphics [40].
5. EYE TRACKING EVALUATION IN VI-SUALIZATION AND VISUAL ANALYT-ICS
Over the last years, we have been witnessing an increas-ing number of publications that included eye tracking inuser studies to evaluate visualization techniques. This sec-tion summarizes and categorizes the previous examples ofthe eye tracking evaluation. For our systematic review, wechecked the main journals (including special issues of confer-ences) and proceedings for visualization and visual analytics,each spanning their whole time span of publications. Theseinclude the current publication channels:
• IEEE Transactions on Visualization and ComputerGraphics (TVCG)
• Computer Graphics Forum (CGF)• Information Visualization Journal (IVS)• IEEE Conference / Symposium on Visual Analytics
and Technology (VAST)• IEEE Pacific Visualization Symposium (PacificVis)• International Conference on Information Visualisation
(IV)We also included older proceedings that are no longer pub-lished in this form (because they now appear in one of theabove journals, or the conferences are succeeded by otherconferences):
• IEEE Conference on Visualization (VIS)
• IEEE Symposium on Information Visualization(INFOVIS)
• Eurographics / IEEE TCVG Symposium on Visualiza-tion (VISSYM)
• Eurographics Conference on Visualization (EuroVis)• Asia-Pacific Symposium on Visualization (APVIS)
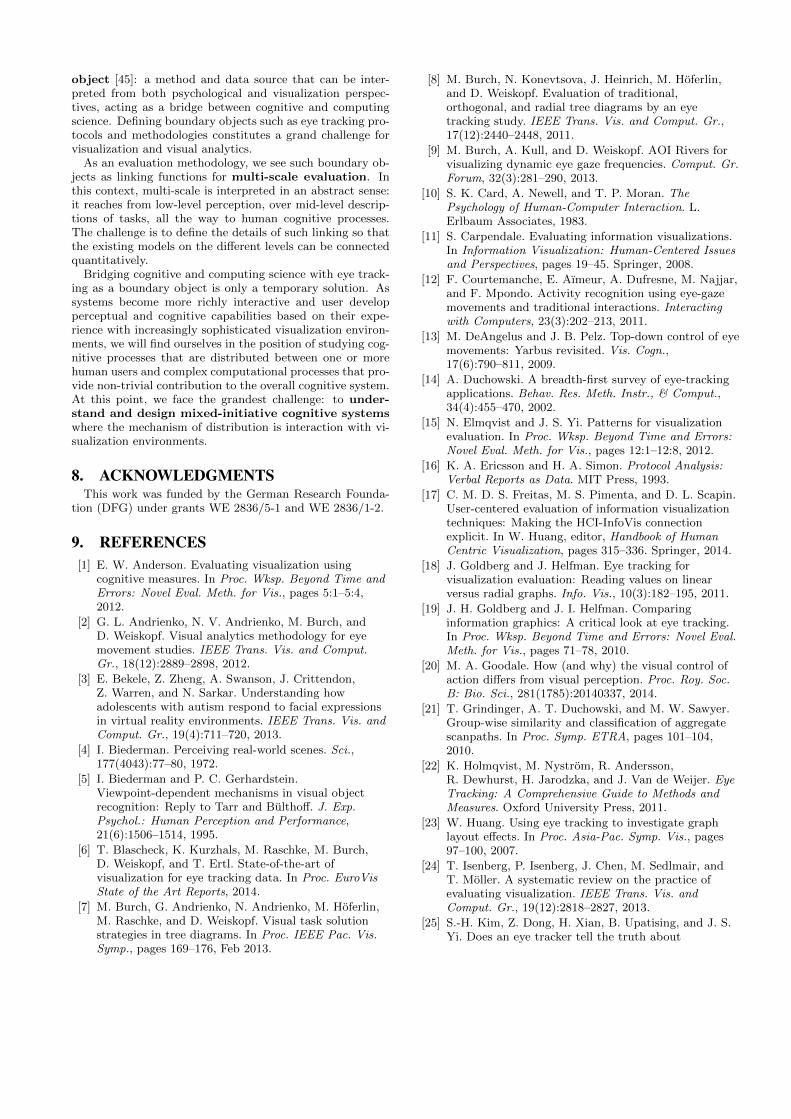
From these sources, we identified 12 publications that in-clude eye tracking in a user study for the evaluation. Table 1summarizes the results. Several of the publication channelshad no papers with eye tracking evaluation. And, obviously,there are many more user study papers with eye tracking, al-beit outside our research community and, therefore, in otherpublication channels.
The different research questions the authors investigatedwith eye tracking can be summarized as follows:
1. Distribution of visual attention [23, 25, 26, 29,42, 46]: Visualization techniques were compared byfixation metrics for the attention on AOIs to investi-gate how the techniques are perceived and to identifypossible usability issues. Attention maps were appliedto visualize the spatial distribution of attention on thestimuli [25, 26, 29, 42] and support the statistical re-sults.
2. Sequential characteristics of eye movement [7,8, 18, 51]: In addition to fixation-related metrics onAOIs, the transition frequencies between AOIs withtransition matrices [8], transition graphs [51], and vi-sual scanpath analysis [18] were analyzed to gain in-sight into how users investigate a visualization (e.g.,as an explanation for a decrease in task performance).Also, gaze analysis by visual analytics was applied toidentify reading strategies [7].
Table 1: Overview of the investigated visualization papers that include an eye tracking study.
Year Reference Evaluation
2005 Tory et al. [51] AOI fixation percentage and transition frequencies between different views.
2007 Huang et al. [23] Visual investigation of gaze replay for graph layouts.
2008 Kim & Varshney [26] Fixation percentage and fixation duration to compare attention-guiding rendering techniques.
2009 Swindells et al. [46] AOI fixation count for comparison of parameter manipulation methods.
2009 Siirtola et al. [42] Analysis of parallel coordinates by attention map, AOI fixation duration, and AOI fixation counts.
2011 Burch et al. [8] Attention maps and AOI transition matrices for different tree layouts.
2011 Goldberg & Helfman [18] AOI fixation times and visual scanpath analysis for different graph layouts.
2012 Kim et al. [25] AOI fixations and visit durations for the comparison of two visualizations for table sorting.
2013 Bekele et al. [3] AOI fixation percentage and duration for comparison of two groups looking at VR faces.
2013 Kurzhals et al. [29] AOI fixation duration for the comparison of attention guiding visualizations.
2013 Burch et al. [7] Advanced visual analysis methods (time-varying distances, time series plots, interval-based trajec-tory plots) for the investigation of tree layouts.
2014 Song et al. [43] A 3D attention map for CT and MRI images was used to compare gaze of radiologists with differentlevels of expertise.

3. Comparison between user groups [3, 43]: Com-plementary to the previous two points, the distributionof attention between different groups was investigated.Group comparisons were performed between healthyand mentally disordered persons, or between noviceand expert groups. Comparisons were based on a sta-tistical analysis of AOI fixation metrics [3] or visualcomparison of gaze point distributions [43].
These eye tracking studies mainly relied on the statisticalanalysis of AOI-based fixation metrics. If performed, thevisual data analysis was often limited to the investigation ofattention maps and scanpath visualizations. For the iden-tification of visual reading strategies, more advanced visualanalytics techniques were applied. However, none of theabove studies investigated the full sequence length of scan-paths or any complex spatio-temporal characteristics of eyetracking for dynamic stimuli, let alone any cognitive aspectsrelated to the mixed-initiative distribution of cognition invisual analytics.
6. COGNITIVE MODELSMany of the psychology studies discussed in Section 1 were
designed to build an understanding of human cognitive ar-chitecture, i.e., the aspects of human information processingthat are thought to generalize across a wide range of individ-uals, environments, and tasks. For example, the two visualsystems theory of Trevarthen (see, e.g., [20, 34]) is thoughtto predict changes in response to a range of visual illusionswhen tasks are motor vs. cognitive in nature. In order to ef-fectively utilize eye movement information as a window ontocognitive processes in dynamic visualization environmentswe must move beyond naturalistic studies and laboratoryinvestigations abstracted from those environments to focusmore closely on the artificial scenes (e.g., dashboards) thatwe generate and the analytical cognitive processes that ourvisualizations are meant to support. This does not meanthat we limit our evaluation to visualization systems andtasks per se, but that stimuli and tasks used in our studiesshould demonstrate aspects of human cognitive architecturethat are important for the design and evaluation of visu-alization systems and the ways in which they are used tounderstand situations and make decisions.
One approach is to advance fundamental theories of hu-man cognition in areas that relate to the perceptual situa-tions and cognitive tasks that are important for the evalua-tion of visual information systems. Directed fundamentalresearch studies provide knowledge of human capabilitiesand limitations that can be used by designers of systemsfor a variety of applications. The goal here is in essence tobuild a basic “science of analytical reasoning” specific to thekinds of operations that might be “facilitated by interactivevisual interfaces” [48]. This kind of study will necessarilybuild upon general theories, frameworks, and methods frompsychology, and many findings that result will be of inter-est to those conferences and journals. The specific researchquestions addressed, however, will be those that are mostinformative for the evaluation of those interfaces.
For example, Liu et al. [32] used reduced-cue experimen-tal methods typical for psychology studies. However, itsfocus on transformations of the visual environment that areimportant for graphical visualization environments, in thiscase for air traffic control, suggests that it may also be of
use in the design and analysis of these environments. Liu etal. began by replicating studies by Pylyshyn et al. [38] thatdiscovered a new fundamental aspect of human cognitive ar-chitecture, the FINST (“fingers of instantiation”) attentionaltoken mechanism. This new form of attention is describedas a “spatial index” that tracks multiple moving objects inthe visual scene in order to support performance in a varietyof tasks that depend on rapid access to information aboutthose objects. Liu et al. hypothesized that FINSTS wereimportant for air traffic controllers’ ability to associate in-formation from memory (such as being low on fuel) with aspecific aircraft representation displayed on their screen. Ifthe FINST link to a particular display object were to fail,the controller must then put cognitive effort into recallingthe information and reestablishing its relationship with theproper display object. One possible threat to the FINSTmechanism might be camera movement in the simulated3D “fishtank VR” scenes that were to be used in proposed“NextGen”Air Traffic Control systems. Liu et al. found thatparticipants in their experiments were able to track multiplemoving targets through a surprising range of display trans-formations, even when those scenes were displayed in 2D.The lack of effect of these transformations on participants’psychophysical tracking functions suggested that their usein NextGen ATC systems was not contraindicated. Becausethe study extended previous fundamental research and wasconducted using similar laboratory stimuli and tasks, theresults should generalize across a range of applications.
While eye moment methods can make substantial contri-butions to (directed) fundamental research, they are likelyto be particularly useful for translational studies that buildupon what is known about the cognitive architecture to ex-amine how it is utilized in specific situations and tasks thatare more similar to a visualization approach. These studiesare intended not to contribute to the psychology literaturenor to evaluate a specific visualization but rather constitutean intermediate “translational” study whose results wouldcome in the form of more structured guidance—guidelines,visual queries [54], or design actions [44] that might be of usein the design and evaluation of a class of visualizations or vi-sual information systems. An example of this type of studyis that of Po et al. [36] that mapped the two visual systemstheory of Trevarthen onto the kinds of displays used in CADof large aircraft. The results of this study were interpretedwith respect to the impact of individual differences on thedesign of interaction with these displays.
It is worthwhile to note that these methods are in addi-tion to the summative evaluation of a specific application orvisualization in the context of use, i.e., usability evaluation.Such laboratory study of the full application must of coursebe done for each mapping of cognitive architecture onto areal-world application design.
7. FUTURE DIRECTIONSWith the availability of cheap eye tracking hardware and
its ease of use, there are no longer any technological obstaclesfor using eye tracking in user-based evaluation; in particular,in controlled laboratory studies, we can essentially recordgaze data for free along with any traditional study proce-dure that aims to test task performance. Therefore, the bigoverall challenge is to make sense out of the eye trackingdata and relate this data to something we want to learnabout the visualization tested and the cognitive processes

involved. As discussed before, there are already several ex-amples of eye tracking studies in visualization: they mostlywork with statistical analysis of quite aggregated data, forwell defined hypotheses, and with traditional visual analysisby attention maps and gaze plots. In fact, many other lab-oratory studies could adopt these approaches to testing anddata evaluation, adding a better understanding of reasonsfor task performance. Therefore, our general recommenda-tion is that eye tracking should be considered as a testingmethod whenever you plan and design a laboratory study.
However, we see the real value of eye tracking going be-yond what is possible now. Based on our reflections on thestate of the art in the previous sections, we discuss rele-vant directions for future research on evaluation methodol-ogy. We begin with more technologically oriented researchquestions asking for short term action, and end with longterm grand challenges.
7.1 Exploratory Data Analysis and Hypothe-sis Building
Well known statistical methods can be applied once wehave a clearly defined hypothesis and an eye tracking exper-iment set up accordingly. The interesting question is how wecan design such an eye tracking experiment, in particular,for the complex visual representations and tasks in appli-cations of visualization and visual analytics. Here, we seea great potential for improved data analysis methods thatcould work on eye tracking data acquired in less constrainedpreliminary studies. In fact, visual analytics will certainlyplay a major role here [2], in particular, for the complexspatio-temporal nature of the eye tracking data and the(dynamic) stimulus data, and by combining data-mining,statistical, and interactive visualization methods.
One analysis aspect is most relevant, albeit difficult: im-proved scanpath analysis. So far, the studies focused onthe spatial aspect of the recorded gaze data. Temporal as-pects of the data, such as AOI sequences, provide impor-tant information about reading strategies but were often ne-glected completely or only partially covered through tran-sition matrices. Therefore, better visual analysis for longsequence information needs to be developed.
Another relevant analysis aspect is concerned with groupcomparisons. The comparison of different user groups,especially the comparison of experts and novices, providesvaluable information about different viewing behavior. Tothis point, group comparisons with eye tracking for visual-ization techniques are rare but could help improve the learn-ing curve for visualization techniques by guiding noviceswith the knowledge from experts’ gaze patterns. Therefore,there should be support for comparative visual analysis be-tween groups.
A third aspect is the combination of eye tracking datawith additional time-oriented data. For example, thetemporal evolution of the dynamic stimuli needs to be un-derstood to build the context for the gaze data. Or, theeye tracking data can be combined with information aboutlogged interaction such as mouse or key-stroke data, as toobtain deeper insights in the usability of interactive visual-ization applications and visual analytics systems.
A practical aspect is concerned with making the newlydeveloped analysis methods available to other researchers.Reflecting a general discussion in our community, we see theneed for disseminating codes, tools, and systems so
that improved analysis can be adopted quickly. One way isto have advanced analysis methods included in professionalsoftware by the vendors of eye tracking hardware; however,this approach might not always work due to the latency inthis software development process and because not all ofour analysis problems will be sufficiently relevant for thebroader eye tracking audience. Therefore, there should alsobe dissemination of software (prototypes) developed, includ-ing complete analysis systems but also partial codes. For ex-ample, we have already shared our system “ISeeCube” [28]with other eye tracking researchers and plan a public releasefor the future.
7.2 Evaluation ProceduresWe not only see the need for improved data analysis but
also for extended evaluation procedures and protocols.The “think aloud” protocol analysis [16] is a method com-
monly used by HCI researchers to elicit user reports of sub-tasks that take place in the course of accomplishing a giventask with a specific user interface. This approach has muchto recommend it when the goal is to produce a GOMS(Goals, Operators, Methods, and Selection rules [10]) modelof the task as it takes place in a particular interface, todetect operational errors, and to document the process ofrepair of those errors. Since many perceptual processes areunconscious, user reports of how they detect known pat-terns and discover new patterns in data are not well elicitedby this method. Taken in the context of cognitive modelsof task performance, the analysis of eye movement patternsmay provide greater insight into unconscious aspects of taskperformance. The combination of think aloud proto-col analysis and eye tracking may well lead to insightinto both task performance using visual information systemsand the perceptual processes that allow users to understandinformation presented by those systems.
One approach to this could be taken from the work ofTanenhaus et al. [47]. By interpreting eye movements asthey occur in response to verbal task instructions, they wereable to show a much tighter integration of linguistic under-standing and overt attention to objects in the environment.Tanenhaus et al. showed that spoken instructions can guideeye movements in real time, with close coupling of hearingand eye position. The application of this method to visual-ization tasks might support a deeper theoretical understand-ing of visualization use as well as guidance for the designand evaluation of visualization environments. A transla-tional approach to the use of eye movement research thatmight be productive for visualization researchers would beto adapt the methods used by Tanenhaus et al., leading touser studies with verbal task instructions in combina-tion with eye tracking.
7.3 Translational Evaluation of Human Cog-nition
To move beyond the evaluation of usability and the tech-niques of visualization we must build an understanding ofhuman cognition as it is shaped by visual information sys-tems. This builds upon work done in psychology and cog-nitive sciences. Since these studies are not well-suited forapplication to visualization stimuli and tasks, we must movebeyond off-the-shelf psychology and build translational stud-ies in partnership with interested cognitive scientists. Eyemovement records are a strong candidate for a boundary
object [45]: a method and data source that can be inter-preted from both psychological and visualization perspec-tives, acting as a bridge between cognitive and computingscience. Defining boundary objects such as eye tracking pro-tocols and methodologies constitutes a grand challenge forvisualization and visual analytics.
As an evaluation methodology, we see such boundary ob-jects as linking functions for multi-scale evaluation. Inthis context, multi-scale is interpreted in an abstract sense:it reaches from low-level perception, over mid-level descrip-tions of tasks, all the way to human cognitive processes.The challenge is to define the details of such linking so thatthe existing models on the different levels can be connectedquantitatively.
Bridging cognitive and computing science with eye track-ing as a boundary object is only a temporary solution. Assystems become more richly interactive and user developperceptual and cognitive capabilities based on their expe-rience with increasingly sophisticated visualization environ-ments, we will find ourselves in the position of studying cog-nitive processes that are distributed between one or morehuman users and complex computational processes that pro-vide non-trivial contribution to the overall cognitive system.At this point, we face the grandest challenge: to under-stand and design mixed-initiative cognitive systemswhere the mechanism of distribution is interaction with vi-sualization environments.
8. ACKNOWLEDGMENTSThis work was funded by the German Research Founda-
tion (DFG) under grants WE 2836/5-1 and WE 2836/1-2.
9. REFERENCES[1] E. W. Anderson. Evaluating visualization using
cognitive measures. In Proc. Wksp. Beyond Time andErrors: Novel Eval. Meth. for Vis., pages 5:1–5:4,2012.
[2] G. L. Andrienko, N. V. Andrienko, M. Burch, andD. Weiskopf. Visual analytics methodology for eyemovement studies. IEEE Trans. Vis. and Comput.Gr., 18(12):2889–2898, 2012.
[3] E. Bekele, Z. Zheng, A. Swanson, J. Crittendon,Z. Warren, and N. Sarkar. Understanding howadolescents with autism respond to facial expressionsin virtual reality environments. IEEE Trans. Vis. andComput. Gr., 19(4):711–720, 2013.
[4] I. Biederman. Perceiving real-world scenes. Sci.,177(4043):77–80, 1972.
[5] I. Biederman and P. C. Gerhardstein.Viewpoint-dependent mechanisms in visual objectrecognition: Reply to Tarr and Bulthoff. J. Exp.Psychol.: Human Perception and Performance,21(6):1506–1514, 1995.
[6] T. Blascheck, K. Kurzhals, M. Raschke, M. Burch,D. Weiskopf, and T. Ertl. State-of-the-art ofvisualization for eye tracking data. In Proc. EuroVisState of the Art Reports, 2014.
[7] M. Burch, G. Andrienko, N. Andrienko, M. Hoferlin,M. Raschke, and D. Weiskopf. Visual task solutionstrategies in tree diagrams. In Proc. IEEE Pac. Vis.Symp., pages 169–176, Feb 2013.
[8] M. Burch, N. Konevtsova, J. Heinrich, M. Hoferlin,and D. Weiskopf. Evaluation of traditional,orthogonal, and radial tree diagrams by an eyetracking study. IEEE Trans. Vis. and Comput. Gr.,17(12):2440–2448, 2011.
[9] M. Burch, A. Kull, and D. Weiskopf. AOI Rivers forvisualizing dynamic eye gaze frequencies. Comput. Gr.Forum, 32(3):281–290, 2013.
[10] S. K. Card, A. Newell, and T. P. Moran. ThePsychology of Human-Computer Interaction. L.Erlbaum Associates, 1983.
[11] S. Carpendale. Evaluating information visualizations.In Information Visualization: Human-Centered Issuesand Perspectives, pages 19–45. Springer, 2008.
[12] F. Courtemanche, E. Aımeur, A. Dufresne, M. Najjar,and F. Mpondo. Activity recognition using eye-gazemovements and traditional interactions. Interactingwith Computers, 23(3):202–213, 2011.
[13] M. DeAngelus and J. B. Pelz. Top-down control of eyemovements: Yarbus revisited. Vis. Cogn.,17(6):790–811, 2009.
[14] A. Duchowski. A breadth-first survey of eye-trackingapplications. Behav. Res. Meth. Instr., & Comput.,34(4):455–470, 2002.
[15] N. Elmqvist and J. S. Yi. Patterns for visualizationevaluation. In Proc. Wksp. Beyond Time and Errors:Novel Eval. Meth. for Vis., pages 12:1–12:8, 2012.
[16] K. A. Ericsson and H. A. Simon. Protocol Analysis:Verbal Reports as Data. MIT Press, 1993.
[17] C. M. D. S. Freitas, M. S. Pimenta, and D. L. Scapin.User-centered evaluation of information visualizationtechniques: Making the HCI-InfoVis connectionexplicit. In W. Huang, editor, Handbook of HumanCentric Visualization, pages 315–336. Springer, 2014.
[18] J. Goldberg and J. Helfman. Eye tracking forvisualization evaluation: Reading values on linearversus radial graphs. Info. Vis., 10(3):182–195, 2011.
[19] J. H. Goldberg and J. I. Helfman. Comparinginformation graphics: A critical look at eye tracking.In Proc. Wksp. Beyond Time and Errors: Novel Eval.Meth. for Vis., pages 71–78, 2010.
[20] M. A. Goodale. How (and why) the visual control ofaction differs from visual perception. Proc. Roy. Soc.B: Bio. Sci., 281(1785):20140337, 2014.
[21] T. Grindinger, A. T. Duchowski, and M. W. Sawyer.Group-wise similarity and classification of aggregatescanpaths. In Proc. Symp. ETRA, pages 101–104,2010.
[22] K. Holmqvist, M. Nystrom, R. Andersson,R. Dewhurst, H. Jarodzka, and J. Van de Weijer. EyeTracking: A Comprehensive Guide to Methods andMeasures. Oxford University Press, 2011.
[23] W. Huang. Using eye tracking to investigate graphlayout effects. In Proc. Asia-Pac. Symp. Vis., pages97–100, 2007.
[24] T. Isenberg, P. Isenberg, J. Chen, M. Sedlmair, andT. Moller. A systematic review on the practice ofevaluating visualization. IEEE Trans. Vis. andComput. Gr., 19(12):2818–2827, 2013.
[25] S.-H. Kim, Z. Dong, H. Xian, B. Upatising, and J. S.Yi. Does an eye tracker tell the truth about

visualizations?: Findings while investigatingvisualizations for decision making. IEEE Trans. Vis.and Comput. Gr., 18(12):2421–2430, 2012.
[26] Y. Kim and A. Varshney. Persuading visual attentionthrough geometry. IEEE Trans. Vis. and Comput.Gr., 14(4):772–782, 2008.
[27] J. Klingner, R. Kumar, and P. Hanrahan. Measuringthe task-evoked pupillary response with a remote eyetracker. In Proc. Symp. ETRA, pages 69–72, 2008.
[28] K. Kurzhals, F. Heimerl, and D. Weiskopf. ISeeCube:Visual analysis of gaze data for video. In Proc. Symp.ETRA, pages 43–50, 2014.
[29] K. Kurzhals, M. Hoferlin, and D. Weiskopf.Evaluation of attention-guiding video visualization.Comput. Gr. Forum, 32(3):51–60, 2013.
[30] K. Kurzhals and D. Weiskopf. Space-time visualanalytics of eye-tracking data for dynamic stimuli.IEEE Trans. Vis. and Comput. Gr., 19(12):2129–2138,2013.
[31] H. Lam, E. Bertini, P. Isenberg, C. Plaisant, andS. Carpendale. Empirical studies in informationvisualization: Seven scenarios. IEEE Trans. Vis. andComput. Gr., 18(9):1520–1536, 2012.
[32] G. Liu, E. L. Austen, K. S. Booth, B. D. Fisher,R. Argue, M. Rempel, and J. T. Enns. Multiple-objecttracking is based on scene, not retinal, coordinates. J.Exp. Psychol.: Human Perception and Performance,31(2):235–247, 2005.
[33] G. R. Loftus and N. H. Mackworth. Cognitivedeterminants of fixation location during pictureviewing. J. Exp. Psychol.: Human Perception andPerformance, 4(4):565–572, 1978.
[34] A. D. Milner and M. A. Goodale. Two visual systemsre-viewed. Neuropsychologia, 46(3):774–785, 2008.
[35] C. Plaisant. The challenge of information visualizationevaluation. In Proc. Adv. Vis. Interf., pages 109–116,2004.
[36] B. A. Po, B. D. Fisher, and K. S. Booth. Pointing andvisual feedback for spatial interaction in large-screendisplay environments. In Proc. Third Int’l Symp.Smart Gr., volume 2733 of Lect. Notes Comp. Sci.,pages 22–38. Springer, 2003.
[37] A. Poole and L. Ball. Eye tracking in human-computerinteraction and usability research: Current status andfuture prospects. In C. Ghaoui, editor, Encyclopedia ofHuman-Computer Interaction, pages 211–219. IdeaGroup Inc., 2006.
[38] Z. W. Pylyshyn. Situating vision in the world. TrendsCogn. Sci., 4(5):197–207, 2000.
[39] W. Ribarsky, B. D. Fisher, and W. M. Pottenger.Science of analytical reasoning. Info. Vis.,8(4):254–262, 2009.
[40] G. Ristovski, M. Hunter, B. Olk, and L. Linsen. EyeC:coordinated views for interactive visual exploration ofeye-tracking data. In Proc. Conf. Info. Vis. (IV),pages 239–248, 2013.
[41] H.-J. Schulz, T. Nocke, M. Heitzler, and H. Schumann.A design space of visualization tasks. IEEE Trans.Vis. and Comput. Gr., 19(12):2366–2375, 2013.
[42] H. Siirtola, T. Laivo, T. Heimonen, and K.-J. Raiha.Visual perception of parallel coordinate visualizations.
In Proc. Conf. Info. Vis. (IV), pages 3–9, 2009.
[43] H. Song, J. Yun, B. Kim, and J. Seo. GazeVis:interactive 3D gaze visualization for contiguouscross-sectional medical images. IEEE Trans. Vis. andComput. Gr., 20(5):726–739, 2014.
[44] B. Spence. The broker. In A. Ebert, A. Dix, N. D.Gershon, and M. Pohl, editors, Human Aspects ofVisualization, volume 6431 of Lect. Notes Comp. Sci.,pages 10–22. Springer, 2011.
[45] S. L. Star. The structure of ill-structured solutions:Boundary objects and heterogeneous distributedproblem solving. In M. Huhns and L. Gasser, editors,Readings in Distributed AI. Morgan Kaufmann, 1988.
[46] C. Swindells, M. Tory, and R. Dreezer. Comparingparameter manipulation with mouse, pen, and slideruser interfaces. Comput. Gr. Forum, 28(3):919–926,2009.
[47] M. K. Tanenhaus, M. J. Spivey-Knowlton, K. M.Eberhard, and J. C. Sedivy. Integration of visual andlinguistic information in spoken languagecomprehension. Sci., 268(5217):1632–1634, 1995.
[48] J. J. Thomas and K. A. Cook, editors. Illuminatingthe Path: The Research and Development Agenda forVisual Analytics. IEEE Computer Society Press, 2005.
[49] A. Torralba, A. Oliva, M. S. Castelhano, and J. M.Henderson. Contextual guidance of eye movementsand attention in real-world scenes: The role of globalfeatures in object search. Psychol. Rev.,113(4):766–786, 2006.
[50] M. Tory. User studies in visualization: A reflection onmethods. In W. Huang, editor, Handbook HumanCentric Visualization, pages 411–426. Springer, 2014.
[51] M. Tory, M. S. Atkins, A. E. Kirkpatrick,M. Nicolaou, and G.-Z. Yang. Eyegaze analysis ofdisplays with combined 2D and 3D views. In Proc.IEEE Vis. Conf., pages 519–526, 2005.
[52] H. Y. Tsang, M. Tory, and C. Swindells. eSeeTrack –visualizing sequential fixation patterns. IEEE Trans.Vis. and Comput. Gr., 16(6):953–962, 2010.
[53] J. J. van Wijk. Evaluation: A challenge for visualanalytics. IEEE Comput., 46(7):56–60, 2013.
[54] C. Ware. Visual queries: The foundation of visualthinking. In S.-O. Tergan and T. Keller, editors,Knowledge and Information Visualization, volume3426 of Lect. Notes Comp. Sci., pages 27–35. Springer,2005.
[55] A. L. Yarbus. Eye Movements and Vision. PlenumPress, 1967.
[56] G. J. Zelinsky, R. P. N. Rao, M. M. Hayhoe, andD. H. Ballard. Eye movements reveal thespatiotemporal dynamics of visual search. Psychol.Sci., 8(6):448–453, 1997.