Evaluating the QME Process: Is it Equitable and Efficient? · PDF fileThe California...
31
The California Commission on Health and Safety and Workers’ Compensation Evaluating the QME Process: Is it Equitable and Efficient? Prepared by Frank Neuhauser Institute for the Study of Societal Issues University of California, Berkeley CHSWC Members Angie Wei (2010 Chair) Catherine Aguilar Faith Culbreath Sean McNally Kristen Schwenkmeyer Robert B. Steinberg Darrel “Shorty” Thacker Executive Officer Christine Baker State of California Labor and Workforce Development Agency Department of Industrial Relations September 2010
Transcript of Evaluating the QME Process: Is it Equitable and Efficient? · PDF fileThe California...

The California Commission on Health and Safety
and Workers’ Compensation
Evaluating the QME Process: Is it Equitable and Efficient?
Prepared by Frank Neuhauser Institute for the Study of Societal Issues
University of California, Berkeley
CHSWC Members Angie Wei (2010 Chair)
Catherine Aguilar Faith Culbreath Sean McNally
Kristen Schwenkmeyer Robert B. Steinberg
Darrel “Shorty” Thacker
Executive Officer Christine Baker
State of California
Labor and Workforce Development Agency Department of Industrial Relations
September 2010
QME Report 2010 1
Executive Summary
The Qualified Medical Examiner (QME) process is at the heart of the California workers’ compensation dispute resolution process. The current process is the result of a series of reforms over the past 15 years, reforms that were meant to deliver medical‐legal evaluations expeditiously and equitably for both parties. This report examines how well the process is operating in fulfillment of those important goals. The study used extensive electronic administrative data made available by the Division of Workers’ Compensation (DWC) Medical Unit and Disability Evaluation Unit supplemented with samples of paper records. The study covers the period from January, 2005 through June of 2010. This period covers the 2004 reforms which introduced utilization and treatment guidelines, a new permanent disability rating schedule based on the AMA Guides, and changes to the manner parties in represented cases can select QMEs. Key results include:
The number of providers registered as QMEs declined by about 45% between 2005 and 2010, but this decline was nearly the same as the decline in disabling injuries. The decline in registered QMEs likely did not lead to scheduling problems and delays.
There was a dramatic spike in the number of panel‐QME assignments starting in late 2007 and ending in early 2009. This spike likely is the cause of most complaints about difficulty and delay in obtaining QME appointments.
The spike was not caused by an increase in medical‐legal evaluations related to permanent disability (PD), which remained constant over this period. Most likely, the spike was a result of disputes over medical treatment and the use of QMEs to resolve these disputes. The Sandhagen decision clarified the path for medical treatment disputes and substantially reduced the use of QMEs in these cases.
The perception of delays in the QME process is likely partially the result of this temporary spike in panel requests that has since resolved.
Remaining problems in scheduling QMEs are the result of mismatches in the demand and supply of specific specialties. Orthopedic specialists account for only 25% of registered QMEs, but an orthopedic specialty is requested 45%‐65% of the time. While this ratio has remained stable, it does suggest that efforts should be made to expand the pool of orthopedists willing to participate as QMEs.
Other specialties with potential for delays are pain specialists and hand specialists (usually orthopedists) who are underrepresented, like orthopedists, relative to the number of requests. Pain specialists are also in an area where requests have been increasing dramatically over that past several years.
Chiropractors and acupuncturists are heavily overrepresented in QME registrations relative to the fraction of requests for these providers.
Psychologists and psychiatrists are somewhat over represented in registrations, but there may be an increasing problem with scheduling these specialists. Their evaluations typically require more face‐to‐face time, and the number of requests for psych specialists has increased dramatically since 2005, currently representing over 12.5% of all panel‐QME requests.
By assigning panel QMEs randomly, the reforms hoped to reduce the incentive of QMEs to favor the party that was selecting them for the evaluation. Reputation was thought to lead parties to select QMEs that perceived medical‐legal issues in a way that favored the party’s case. Any feedback loop, it was feared, could lead to increasingly disparate reports for similar cases. However, there is evidence that

QME Report 2010 2
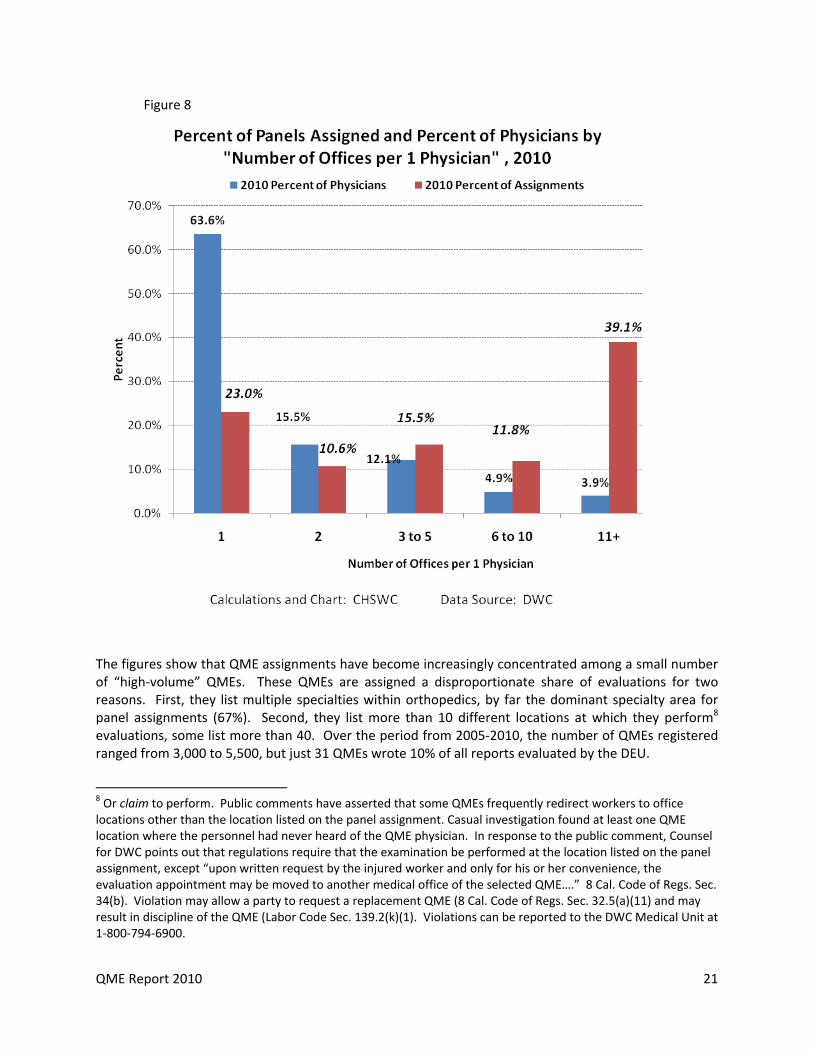
the system for assigning QMEs to panels has resulted in a distribution of assignments and ratings that stakeholders may find inequitable across parties and inconsistent with the objectives of the reforms. Panels are assigned by identifying QMEs with registered addresses near an injured worker’s residence and selecting randomly from those within a prescribed radius. QMEs can increase their probability of assignment by registering at more locations and, to a lesser extent, registering under more specialties. A small number of QMEs have registered at a very large number of addresses, dominating assignments. Most of these QMEs are assisted in scheduling and possibly developing locations by a small number of facilitating services:
63% of QMEs are registered at only one location. These QMEs are assigned to 23% of panels.
3.9% of QMEs are registered at 11 or more addresses. This small number of QMEs conducts nearly 40% of all evaluations, mainly because the large number of locations makes them much more likely to be assigned.
This distribution of assignments is not necessarily problematic. A select group of high‐volume QMEs may be very skilled and may execute the assignments quickly and assign ratings in a consistent and equitable manner. However, the evidence in this report supports a different conclusion. The study examined the ratings of 31 very high‐volume QMEs who accounted for 10% of the reports rated by the Disability Evaluation Unit (DEU). There were no advantages in terms of the time from assignment to DEU rating. However:
The ratings assigned to reports by these very high‐volume QMEs were, on average, substantially and significantly lower than the ratings assigned to the reports of all other QMEs.
The ratings were 7% to 19% lower on high‐volume QME reports.
This tendency towards conservative evaluation was not limited to QME evaluations; reports by high‐volume QME were rated 10% to 21% lower than similar reports rated by DEU when the high‐volume QMES were acting as Agreed Medical Evaluators (AMEs) or writing reports as primary treating physicians (PTPs).
The conservative tendency also predates the current AMA Guides‐based schedule. On average, high‐volume QMEs write reports that result in ratings substantially lower than other QMEs on both the 1997 and 2005 schedules.
The conservative tendency of very high‐volume QMEs is consistent across the group; only 2 of the 31 QMEs wrote reports that resulted in higher‐than‐average ratings. Virtually all of the others were conservative and nearly always statistically significantly for all types of reports (QME, AME, PTP) for which they wrote a large enough number of reports to evaluate.
The results of this study suggest some potential changes to the system to improve both timeliness and equity. First, overall, the number of QMEs has tracked the number of disabling injuries. Any general problems with delays that the system experienced were likely resolved by the Sandhagen decision and other changes to the application of utilization and treatment guidelines. Ongoing problems are likely generated more narrowly by a mismatch in the supply of and demand for specific specialties.
The Division of Workers’ Compensation (DWC) could conduct outreach efforts to specific specialties (orthopedic, pain, and psych, for example) to increase the registration of these providers.
DWC could also modify the Official Medical‐Legal Fee Schedule to increase reimbursement for underrepresented specialties relative to overrepresented specialties. The opportunity cost for orthopedists and similar specialties is almost surely higher than for less specialized providers like chiropractors and acupuncturists or even family practice physicians. Reimbursing at
QME Report 2010 3
different rates would reflect the same public policy decisions reflected in the planned move to a Resource‐Based Relative Value Scale (RBRVS) for treatment reimbursement.
If stakeholders perceive the increasing concentration of QME assignments among a small number of very high‐volume providers as inconsistent with legislative intent and/or public policy, DWC could place restrictions on the number of locations at which any QME can register.
Limiting the concentration of reports among a small number of high‐volume QMEs could also increase the willingness of more providers to participate as QMEs. The concentration of assignments among a few QMEs means fewer assignments for the large number of remaining providers. This may explain why CHSWC has heard a number of concerns about QMEs dropping out due to too few assignments, despite the increasing number of panel requests relative to the number of QMEs.
Acknowledgments
This study would not have been possible without extensive assistance from the Division of Workers’ Compensation. Carrie Nevans, Acting Administrative Director, generously granted access to data and the effort of her staff in developing the data resources. Jeff Seeman and Suzanne Honor‐Vangerov were critical to obtaining data on the QME process from the Medical Unit administrative database and paper records. Blair Megowan, Kathy Patterson and Elizabeth Nisperos gave invaluable assistance with the DEU data. Keven Star and April Klein gave insight in to many of the issues that arose during the analysis. Most important, Commission on Health and Safety and Workers’ Compensation (CHSWC) staff, particularly Judge Lachlan Taylor, Nurgul Toktogonova, Nabeela Khan and Chris Bailey, did tremendous work on a difficult project. Much of the data used in this study were organized specifically for this project and required extensive and thoughtful application of new techniques, to which the staff made a significant contribution. Finally, most of the credit for this research and other similar efforts relies on the vision of Christine Baker, Executive Officer of CHSWC, and the continuing dedication of the Commissioners to supporting independent research on important issues affecting the California workers’ compensation system and the workers and employers who rely on it.
QME Report 2010 4
Evaluating the QME Process: Is it Equitable and Efficient? Introduction The delivery of workers’ compensation benefits ordinarily depends on medical findings, and medical findings are often disputed. The medical dispute resolution process is therefore fundamental to the administration of the workers’ compensation system and to the ability of the system to meet its goals. For example, the initial determination that a condition arose out employment is fundamentally a medical determination.1 Similarly, the extent and necessity of medical treatment, the existence and duration of temporary disability, and the existence and degree of residual PD are fundamentally medical determinations. All of these issues can be and frequently are disputed. When disputes arise, the system is charged with accomplishing substantial justice in all cases expeditiously and inexpensively.2 Because the role of one or two medical professionals is crucial to offering or withholding benefits from a worker, California’s workers’ compensation system recognizes a special obligation to protect both workers and employers from potential abuses. Medical professionals can have honest differences of opinion on issues. These differences among doctors can be known to one side and not the other. One side or the other may even be able to influence these opinions by virtue of controlling the selection or payment of the doctor. Consequently, when knowledge of doctors’ tendencies is asymmetrical and/or when one side in a dispute has control over the selection of the medical evaluator upon whose opinion a decision is likely to rest, the outcome may be in part predetermined in a manner that stakeholders in the system would view as potentially unfair. For these reasons, the California Legislature has placed the Qualified Medical Evaluator, or QME, at the core of California’s occupational injury and illness dispute resolution system. Physicians are certified as QMEs after passing a test and meeting requirements spelled out in regulations.3 These requirements are intended to assure that a QME has the expertise to address the issues that will be presented to the QME. The qualification of QMEs is important in that many of the questions addressed by QMEs are
1 The determination of whether a condition arose in the course of employment is frequently a strictly legal question. 2 Excerpted and paraphrased from California Constitution, Article 14, Section 4. The first paragraph of that Section reads, in full, “The Legislature is hereby expressly vested with plenary power, unlimited by any provision of this Constitution, to create, and enforce a complete system of workers' compensation, by appropriate legislation, and in that behalf to create and enforce a liability on the part of any or all persons to compensate any or all of their workers for injury or disability, and their dependents for death incurred or sustained by the said workers in the course of their employment, irrespective of the fault of any party. A complete system of workers' compensation includes adequate provisions for the comfort, health and safety and general welfare of any and all workers and those dependent upon them for support to the extent of relieving from the consequences of any injury or death incurred or sustained by workers in the course of their employment, irrespective of the fault of any party; also full provision for securing safety in places of employment; full provision for such medical, surgical, hospital and other remedial treatment as is requisite to cure and relieve from the effects of such injury; full provision for adequate insurance coverage against liability to pay or furnish compensation; full provision for regulating such insurance coverage in all its aspects, including the establishment and management of a state compensation insurance fund; full provision for otherwise securing the payment of compensation; and full provision for vesting power, authority and jurisdiction in an administrative body with all the requisite governmental functions to determine any dispute or matter arising under such legislation, to the end that the administration of such legislation shall accomplish substantial justice in all cases expeditiously, inexpensively, and without incumbrance of any character; all of which matters are expressly declared to be the social public policy of this State, binding upon all departments of the state government.”
3 Title 8, California Code of Regulations, Division 1, Chapter 1, Article 2 (commencing with Section 10).
QME Report 2010 5
unique to the workers’ compensation system or at least outside the customary practice of most physicians.4 To protect both parties from possible bias, QMEs are meant to be assigned randomly to individual case disputes. The process selects a random (within certain restrictions) panel of three QMEs, from which one or both parties determine a selection. The selected QME then performs the evaluation.5 This process is intended to assure that a QME is not biased by working relationships developed with either party. Statutes and regulations prescribe various requirements and routes to obtain a QME, depending on the type of dispute and the legal representation of the injured worker (see the appendix for a more complete discussion). The design of the system reflects efforts to swiftly obtain medically sound and unbiased evaluations of disputed issues as they arise. Experience with the system suggests, however, that it may be time‐consuming and subject to unsound and biased outcomes. This study evaluates several aspects of the dispute resolution system and how well it meets the goals of delivering fair decisions about the extent of benefits in a timely and inexpensive manner. Specifically, we examine the time required to obtain a QME evaluation, the manner in which assignments are distributed among QMEs, and any indications of bias or inconsistency that would make the outcome of a case vary according to the selection of QMEs. In the next section, the criteria for measuring the success of the system and the basic analytic approach to obtaining the outcome measures are discussed. Following that, basic descriptive data on the dispute process and overall trends are presented. In section four, data on the assignment of QMEs are discussed. Section five discusses the time frames observed for the different dispute resolution steps requiring QME evaluations. Section six examines how the consistency and fairness of the QME process as it pertains to disability ratings are characterized. The final section discusses the implications of the findings. System description and criteria for successful dispute resolution A successful dispute resolution system would resolve questions or disputes rapidly and fairly so that appropriate medical treatment and indemnity benefits are delivered as intended by statute and the Constitution, without delay or unnecessary cost. This statement allows us to suggest criteria against which to judge the success of the current system. First, consider the issue of “fairness.” In the sense used here, a fair outcome means two things. It means similar cases should result in similar outcomes for the parties involved, that is, they are predictable. It also means neither party should have undue control over the outcome; it would not be sufficient to obtain similar outcomes if the outcomes consistently favor a single party because that party controls the process. It should be noted that fairness in this context does not mean that the outcomes are necessarily fair in the normative sense, such as that the compensation is adequate to cover the losses. That is an issue that is dealt with separately by statutorily set compensation levels.
4 For simplicity, we will often refer to all QMEs as physicians, consistent with the Labor Code definition that includes diverse practitioners such as chiropractors and acupuncturists. 5 8 Cal. Code Regs §30 et seq.

QME Report 2010 6
Next, consider the issue of timeliness. Delays in the dispute resolution process can mean substantial losses for one or both parties. Sometimes, delays mean losses for one party and gains for the other. An example of the latter is when payments to a worker are delayed by the dispute resolution process, meaning a worker loses the use of the money during an extended period, but the insurer/employer retains that money and the investment return generated. Generally, though, we expect the delays to impose losses on both sides that are larger than most gains from delay. Cases remain open, administrative costs continue to accumulate, and uncertainty remains. Fairness If all QMEs are evaluating according to the same standards, the outcome of a particular case should not depend on which QME performs the evaluation. In a successful system, a QME report would deserve to be accepted and recognized as authoritative. On the other hand, if different QMEs would give consistently and substantially different evaluations of the same case, then the parties are participating in an unpredictable game of chance that depends on the outcome of the QME “drawing.” This violates the first criteria for fairness. This issue is dramatically increased in importance if one side can manipulate the choice of the QME to consistently disadvantage the other side. This is the main reason for setting up the random assignment of the QME in statute. However, within this “random” process there may be systematic bias that favors one party over the other. In addition, even if not systematic, parties may be able to manipulate the outcomes in individual cases. We will offer an example of each. Systematic bias could arise if the QME pool becomes dominated by evaluators with a particular insurer or worker bias. There is evidence, which we will evaluate, that a subset of QMEs tends to dominate assignment because they register multiple offices in different geographical locations. This process may be facilitated by a small number of agents that handle the administration for the multiple QMEs with multiple offices. Aggregation of the QME process to fewer providers threatens the random assignment and offers more opportunity for bias in assignment and opinion to creep into the process. We will evaluate a number of measures that should help answer the question of whether the QME assignment process concentrates assignments among a subset of QMEs and whether any such concentration produces outcomes favoring one of the parties. Another form of manipulation and potential bias arises when one party manipulates the QME process to try to obtain a more favorable evaluator. A prime example is requesting a new QME panel because the prior panel resulted in missing a statutory deadline, even when that deadline did not materially affect the process for either party. The study evaluated the frequency and nature of subsequent requests for a replacement QME panel, including the type of case, the requesting party, and the reason for the request. In addition, the study evaluated whether QME evaluations, over all, are consistent in their measurement. Here we will examine the whole pool of reports for each QME and evaluate whether some QMEs are consistently high or low in their measurement. If individual QMEs have different perceptions of the application of the AMA Guides, then the results across all cases are not necessarily biased, but the outcomes would be unpredictable in individual cases. Again, we do not want the parties to be entering a lottery, the outcome of which is determined by the luck of which QME is drawn in a particular case.
QME Report 2010 7
The reader should note that fairness in treatment does not mean, for example, that all requested treatments are provided nor that treatment costs are minimized. Appropriate treatment should be provided according to the best available medical science and practice experience. In addition, fairness is not measured by the size of permanent disability awards, either large or small. An individual worker may perceive it to be in his or her best interest to maximize the amount of compensation, but it is not always in the best interest of workers generally for disability compensation to be increased. Economic reality places limits on the total amount that employers can pay. The interests of working people as a whole are best served by a social bargain that allocates an appropriate share of resources to disability compensation and a dispute resolution system that distributes this finite sum equitably among disabled workers in some proportion to the likely economic consequences of their injuries. By the same token, an individual employer may perceive it to be in the employer’s best interest to minimize the amount of compensation, but employers generally face pressure to liberalize compensation if awards are too small. This pressure may result in legislative increases in compensation across the board or in judicial interpretations that drive up the compensation case by case. It is not important whether disability ratings are uniformly high or uniformly low, provided that the Legislature assigns the appropriate amount of compensation to these ratings. The essential characteristics of the rating system are that ratings are proportionate to the probable economic consequences of the medical impairment being evaluated, and the impairments are objectively ascertainable with a minimum of conflict, bias, and delay. The job of the QME process and the QME reporting is not to correct for perceived deficiencies in legislative and regulatory decisions. QME: supply and demand – overall trends An overarching issue concerning the QME process is the balance between the supply of QMEs and the demand for QME evaluations. CHSWC has heard from both stakeholders the following concerns:
The situation of too few QMEs is leading to scheduling problems, delays in evaluation, and requests for subsequent panels.
QMEs are dropping out of the process because the number of assignments is too low to justify the time and expense of becoming and/or maintaining QME status.
These opinions seem, on the surface to be at odds. However, there are several ways in which they can be complementary rather than contradictory. There is the possibility that certain types of QMEs are in high demand (orthopedic surgeons, hand specialists) because of very frequent requests. Other specialties may be very infrequently requested (acupuncture, allergy and immunology). The match between available specialties and the number of specialties requests could be out of balance. For example, a substantial fraction of requests could be for chiropractic specialists, but the fraction of QMEs with a chiropractic specialty may be even higher, resulting in fewer referrals for chiropractors relative to other specialties. How well the distribution of requests matches the distribution of active specialists is an important determinant of how smoothly and quickly the system operates. In addition, the forces determining the supply and demand of QMEs may be in the long‐term balanced. However, short‐term changes in claim rates, case law, and statute or regulation may disrupt the equilibrium for limited periods by substantially changing the number of QME requests. The study begins by examining how QME supply and demand has changed over time.

QME Report 2010 8
Figure 1
Number of Unique Physicians Registered as QME, as of Date Indicated.
0
1000
2000
3000
4000
5000
6000
Jan-
05
May
-05
Sep
-05
Jan-
06
May
-06
Sep
-06
Jan-
07
May
-07
Sep
-07
Jan-
08
May
-08
Sep
-08
Jan-
09
May
-09
Sep
-09
Jan-
10
May
-10
Date of count
# o
f U
niq
ue
ph
ysic
ian
s
Looking first at the supply, Figure 1 plots the number of physicians acting as QMEs over the past 5 1/2 years. It is clear from the chart that the number of physicians registered as QMEs has declined over this period. The decline has had the effect of reducing the number of active physicians by 45%. That decline has slowed since the first 12 months and may have become stable or even begun to increase slightly in the last 12 months. There are two ways to present the trend in demand. The first is the underlying trend in claim frequency. In particular, we are concerned about the trend in PD claims, the claims most likely to require a QME evaluation. Unfortunately, there is a very substantial delay in the reporting of PD claims, with mature data only available through the 2006 policy year. Consequently, the study uses the frequency of disability claims as a proxy for the number of PD claims.

QME Report 2010 9
Figure 2
Disability Claim Trend
0%
20%
40%
60%
80%
100%
2003 2004 2005 2006 2007 2008 2009
Accident Year
Per
cen
t o
f A
Y 2
003
Disability Claims
Source: WCIS
Figure 2 plots the trend in disability claim frequency, starting with the 2003 accident year (AY). QME requests will lag the AY by 1‐4 years depending on the issue. Issues related to compensability of the injury will occur early in a claim, probably during the first year. Medical treatment issues may arise early, in the medium‐term, or even very late [future medical needs after permanent and stationary status (P&S)]. PD evaluations will occur near P&S dates and are concentrated around the 2nd and 3rd year after injury. We lag the accident year data by two years in subsequent comparisons, for example, matching AY 2003 disability claim frequency to 2005 QME requests. For simplicity, we present claim frequency relative to the first year of observation (2003 = 100%). Interestingly, the trend in disability claim frequency tracks closely the trend in QME registration. Over the period 2003 to 2008, disabling injuries declined about 40%. The second way to present the demand for QMEs is to plot the frequency of requests for QME evaluations. While the long‐term trend in QME requests should track the trend in injuries, short‐term trends will be reflected in short‐term changes in the frequency of QME requests. In Figure 3, we plot all three measures: number of QMEs, number of injuries and number of panel requests. We start each value at 100 percent (AY 2003 for disabling injuries, and Calendar Year 2005 for QMEs and QME requests).

QME Report 2010 10
Figure 3
Trend in Injuries, QMEs, and Panel Assignments
0%
20%
40%
60%
80%
100%
120%
140%
160%
Jan-
05
Jul-0
5
Jan-
06
Jul-0
6
Jan-
07
Jul-0
7
Jan-
08
Jul-0
8
Jan-
09
Jul-0
9
Jan-
10
Jul-1
0
Calendar year (Disabling injuries lag 2 years)
Pe
rce
nt
of
20
05
Number of Panels Number of physicians Number of disabling injuries
The trends in the number of disabling injuries and practicing QMEs are tracking closely, both declining substantially, but the injury decline is slightly greater. However, the number of QME panel assignments has increased over this period with a substantial spike in assignments between the first 6 months of 2008 and the first 6 months of 2009. Something happened during this period which increased the number of panel requests relative to the number of injuries. Since the number of QMEs has been tracking injuries, this certainly affected the number of panels assigned to each physician. In turn, this may have caused scheduling problems and delays. The reasons for the spike and the impact on delays will be examined in more detail below. Reason for QME panel requests The spike in QME requests may have been driven by a specific type of request. The reasons for QME requests fall into several major categories: compensability of the claim; PD and apportionment; medical treatment issues; and a combination of PD and medical treatment. We will aggregate a bit more and divide the issues into PD determination and medical treatment decisions. Unfortunately, the reason a QME panel was requested has not been recorded by DWC in the panel assignment database. The study’s sampling of paper records from several time periods is not large enough to allow the issues to be analyzed reliably by separate time periods. Consequently, the trend in one type of request vs. others from these data sources cannot be observed directly. However, patterns in QME processes for PD evaluations using data extracted from the Disability Evaluation Unit (DEU) can be observed. The data from DEU should show the trends in the demand for QMEs for PD evaluations, but would not reflect changes in evaluation of medical treatment issues. This should allow us to identify or exclude PD evaluations as at least one source of the spike in QME requests.

QME Report 2010 11
Figure 4
Figure 4 shows the distribution of DEU ratings by the quarter of rating and the type of physician writing the report. Evaluating physicians are divided into four groups: primary treating physicians (PTP); Agreed Medical Evaluators (AME); and Panel QMEs who are further divided according to whether the injured worker is represented (QMR) or unrepresented (QMU). QMR and QMU evaluations involve a request for a QME through DWC. AME and PTP evaluations do not involve panel requests. The data used here combine ratings under the pre‐2005 PDRS and the AMA Guides‐based schedule adopted 1/1/2005. Nearly all ratings done in the early months of 2005 were still for evaluations based on the pre‐2005 schedule. Gradually, a higher proportion of the ratings were done under the AMA Guides‐based schedule. This likely explains much of the decline in the fraction of reports by PTPs. The AMA Guides introduced a complex new system that primary treating physicians (PTPs) may have been unwilling or slow to become familiar with. The decline in DEU ratings based on PTPs should have triggered an off‐setting increase in reports by other evaluating physicians. Prior to reforms, parties in represented cases could obtain evaluations from competing physicians. For injuries on or after 1/1/2005, parties in represented cases were required to request a QME if they could not agree on an AME. This meant that AMEs, panel QMEs in represented cases or both should have increased or at least decreased more slowly than injury trends. Substantial increases are seen in the fraction of DEU ratings based on both AME and QMR evaluations. QMU evaluations, after showing an early spike, return to approximately the initial level. This suggests that the initial increase in QME requests relative to the decline in underlying injury rates is explained at least in part by the change in the rules in represented cases and to the introduction of the AMA Guides‐based rating schedule. If we look at the same time period, but use numbers of ratings rather than the fraction of ratings (Figure 5), the combined effect in the changes in the fraction of reports done by panel QMEs and the decline in

QME Report 2010 12
injuries can be seen. The number of DEU evaluations has been trending down slightly with the trend in injury rates since mid‐2006, despite the adoption of the AMA Guides and the use of panel QMEs in represented cases. The number of QME requests in represented cases initially increased dramatically then began to decline along with unrepresented QME panels after mid to late‐2007. AMEs became the dominant type of rating done by DEU in early 2007.
Figure 5
The main points for analysis in this study include:
PD evaluations likely explain much of the initial increase in QME requests relative to injury trends.
PD evaluations likely explain the current higher level of QME requests relative to injury trends.
PD evaluations do not explain the spike in requests for panels observed during the period 2007 to early‐2009 and the subsequent decline to the current level.
Consequently, we conclude that medical treatment issues that required the intervention of QME evaluations were responsible for the large increase in panel assignments starting in late 2007 and peaking in late 2008. Similarly, a subsequent decline in medical treatment issues resolved through the QME process is probably responsible for the decline in requests after late 2008. This trend in medical treatment issue‐driven QME requests is likely explained by the introduction of utilization and treatment guidelines and, ultimately, the Sandhagen decision. Utilization and treatment guidelines changed medical treatment and, at least initially, led to an increase in disputes over the extent of appropriate treatment. The Sandhagen decision requires insurers and employers to use utilization review, and not the qualified medical examiner (QME) process, to reject requests for medical treatment. The high court's decision clarified a long‐standing ambiguity after passage of Senate Bill 228 in 2003, which required workers' compensation carriers to institute utilization review programs. If we accept these conclusions, then we should expect the current lower level of QME requests relative to injuries to continue and to subsequently track injury rates closely. The significant problems

QME Report 2010 13
experienced by workers and employers in 2007 to early 2009 likely reflect problems that became acute in mid‐to‐late 2008 and have subsequently eased.
QME registry and panel assignment analysis Many factors determine the frequency that any QME will be assigned to a panel, for example, the distribution of injured workers relative to QMEs or the distribution of injury types and the distribution of medical specialists. These factors are not typically within the statutory or regulatory power of the Legislature and agency to control. However, some factors are within the control of public policy decisions; for example, how finely the agency defines specialties; how much flexibility QMEs have to identify multiple offices; and how having multiple offices and multiple specialties might affect a QME’s probability of assignment. Random sample of panels issued To obtain a picture of the panel request, reasons, and source of requests we selected a random sample of panels issued from among all panels issued during the two‐month period, February 1, 2010, through March 31, 2010.6 We selected every 50th panel generating a sample of 203 panels issued. The sample size indicates that 10,150 panels were issued during the two‐month period, approximately 5,075/month. Summary statistics on these panels are presented in the tables below.
6 The sampling method involved selecting every 50th panel issued starting with the n‐th panel from the beginning (2/1/2010) with the n‐th panel randomly generated. This resulted in an ‘n’’ of 203 for the period.

QME Report 2010 14
Table 1 : Random sample—2/1/10—3/31/10
Issues in dispute by type of request and type of case
Issues included in request (Percent within row)
Percent of Panels Issued
4060 Compensa‐bility of the whole claim
4061 PD,
apportion‐ment
4062 All other, (Med treatment, disputed
additional body parts, TD )
Both 4061 and 4062 are asserted
Unknown
Initial requests 85.2% 30.1% 8.1% 18.0% 41.0%
Represented 49.7% 32.6% 5.8% 11.6% 48.8%
Applicant 15.0% 3.8% 3.8% 3.8% 88.5%
Defense 34.7% 45.0% 6.7% 15.0% 31.7%
Unrepresented Injured worker
48.6% 28.6% 10.7% 25.0% 33.3%
WCJ 1.2% n/a n/a n/a n/a
Unknown 0.6% n/a n/a n/a n/a
(Percent within column)
Reason for Subsequent Request (Percent within row)
% of reports
Change specialty
Additional Specialty
QME unavailable
QME conflict
Other
Subsequent requests
14.8% 20.0% 16.6% 33.3% 13.3% 16.6%
Represented 76.7% 13.0% 17.4% 34.8% 13.0% 21.7%
Applicant1 30.0%
Defense1 16.6%
Unrepresented 6.7%
Unknown 16.6%
WCJ (independent of representation)
36.6% 16.6% 44.0% 8.8% 8.8% 26.4%
1 Applicant and defense not always identified, ratio (2:1, applicant to defense) is more important statisticn/a Statistics unavailable or sample too small for appropriate application
The majority of requests (85.2%) are for the first panel in the case. A much smaller number are for a subsequent panel (second or possibly 3rd or 4th). In addition, at a very basic level, these two types of requests come from very different sources. Original panels are requested about half of the time by unrepresented injured workers or claims administrators submitting a request on an unrepresented claim. Subsequent panel requests are dominated by represented cases, with at least three‐quarters of requests from represented claims. More likely, the fraction of represented second requests is higher (closer to 90%) since only 6.7% are identified as unrepresented, and for the reminder (16.7%), representation was not clear, but the 76.7/6.7 split suggests most “unknown” cases were likely represented. The best estimate of the percent of subsequent requests that are represented is the split on the known cases of 92% represented, 8% unrepresented.

QME Report 2010 15
Another area where subsequent requests differ is that a large fraction (36.6%) of subsequent requests are generated by Workers’ Compensation Judges (WCJs) as an effort to expand the record on a case with additional specialties or to respond to inadequacies of the original doctor’s report, likely at the request of attorneys for whom a direct request to the DWC for an additional QME panel would not have been granted. Only about 1% of original requests were generated by WCJs. There is no defined level of subsequent reports that can be considered ideal. However, between 15% and 20% of cases requiring a subsequent report seems high. This suggests that in nearly a fifth of cases, resolution is delayed due to some problem with the original request or report, missed statutory timeframes, incomplete reports, need for additional specialties, etc. This should be the focus of additional research, including interviews with parties on claims with a subsequent request. DWC may be able to significantly streamline the process. Specialties requested As we discussed above, one reason for problems in scheduling QMEs could be a mismatch between the supply of a specialty and the demand for evaluations. This comparison by specialty is presented in two ways. First, we look at how the demand for specific specialties has changed over time. Second, we look at current demand relative to current supply. Both issues potentially increase or relax pressure on specific specialties, highlighting potential areas of system stress. Table 2 presents the change in the distribution by specialty of all panel assignments from the first half of 2005 to the first half of 2010. Orthopedic specialties are by far the dominant request with 45% of assignments. This fraction has remained constant. Chiropractic and family practice specialists have seen the steepest decline in the fraction of panels assigned, with hand specialists also seeing a large, absolute decline. In contrast internal medicine, and to an even greater extent, pain specialists and psychiatrist/psychologists have seen substantial increases in the fraction of requests for their specialties. If problems arise in scheduling and completing evaluations, specialties with growing demand (pain, psychiatric, internal medicine) are likely to face the most severe constraints. Those specialties with declining demand (chiropractic, family medicine, and hand) are like to pose the fewest problems.

QME Report 2010 16
Table 2‐‐Panel Request: Top Specialties
1/1/2005 1/1/2010
Name Percent Rank Percent Rank
Orthopedic Surgery 45.3% 1 45.8% 1
Chiropractic 13.1% 2 5.4% 5
Hand 11.9% 3 9.5% 3
Psychology/Psychiatry 6.5% 4 12.7% 2
Internal medicine 4.6% 5 6.6% 4
Physical Medicine & Rehabilitation 3.1% 6 3.8% 7
Occupational Medicine 2.1% 7 1.7% 9
Neurology‐‐Neurological surgery 4.6% 8 3.4% 8
Pain Management ‐ Pain Medicine 1.6% 9 4.5% 6
Podiatry 1.5% 10 1.4% 10
Family Practice 1.4% 11 0.4% 17
Otolaryngology 1.0% 12 1.0% 11
In addition to changing demand, the supply of specialists relative to the demand at a point in time can be evaluated. Figure 6 and Table 3 present data on the balance between requests for and the supply of specialists for all specialties with at least 1% of the requests or 1% of the registered QMEs by specialty. Looking at Figure 6, we see that over all specialties, there is a reasonably close relationship between supply and demand (the 45⁰ line represents a balance). However, even if the balance across all specialties fell on the 45⁰ line, the supply could still be too high or too low for all specialties. The chart and table highlight the most potentially problematic mismatch, orthopedics. Orthopedics is by far the most common request at 46%,7 but represents only 25% of registered QMEs. Not only may this lead to scheduling problems, but it may also affect a large fraction of cases. Pain and hand specialties represent two other areas where specialists are underrepresented relative to the fraction of requests.
7 If all orthopedic specialties are aggregated, then orthopedists account for almost two‐thirds of all requests. Since in many cases, orthopedists are registered in multiple orthopedic specialties, the mismatch between the supply and demand for orthopedists is probably substantially more dramatic than tabulated here.

QME Report 2010 17
Figure 6
Specialties: Fraction of Registrations vs. Fraction of Assignments (2010)
0%
5%
10%
15%
20%
25%
0% 5% 10% 15% 20% 25%
Registration
As
sig
nm
en
t
Psych
ChiroInternal Medicine
Hand
Acupuncture
Pain
Ortho
Table 3
Specialty Registered 5/2010
Assigned 1/1/10‐5/22/10
Orthopedic Surgery 25.00% 45.8%
Chiropractic 20.70% 5.4%
Psychology/Psychiatry 16.90% 12.7%
Internal Medicine 8.80% 6.6%
Hand 7.50% 9.5%
Neurology/Neurological Surgery 3.80% 3.4%
Physical Medicine & Rehabilitation 3.10% 3.8%
Podiatry 2.20% 1.4%
Pain Medicine 2.10% 4.5%
Acupuncture 1.70% 0.1%
Occupational Medicine 1.20% 1.7%
Dentistry 1.00% 0.3%
Otolaryngology 0.90% 1.0%
Family Practice 0.80% 0.4%
Ophthalmology/Optometry 0.70% 0.6%
Surgery 1.00% 0.7%
Chiropractors are heavily over‐represented among registered QMEs, with nearly four times the fraction of specialists relative to the fraction of requests. Acupuncturists are one of the top ten specialties registered as QMEs but are only rarely requested for panels. Psychologists and psychiatrists are also over‐represented as QMEs relative to requests.

QME Report 2010 18
The two most severe problem areas appear to be orthopedics because of the frequent requests and the large under‐representation and pain specialists because pain specialists are both under‐ represented and in increasing demand. The rapid increase in demand for psychiatric QMEs may be somewhat offset by their over –representation. One additional concern with psychiatric/psychologist supply is that these evaluations may take significantly more “face‐to‐face time” than other evaluations leading to greater requirements for specialists. This could be another area of concern. Chiropractic and acupuncture specialties are areas where we should see no scheduling problems. The tables and figures above show only the specialties with at least 1% of the registrations or assignments. A number of the other specialized categories are very infrequently requested and have limited registration. This can lead to several challenges. The specialty may be relatively rare especially outside urban areas (internal medicine cardiovascular, allergy & immunology). There may be few doctors applying because the specialty is infrequently requested (e.g., Family Practice). Consider also that the some specialties were not requested at all in some six‐month periods. A question should be raised about the need for so many subspecialties. Can questions about treatment and impairment be answered by less specialized providers? Are some specialties even sensible? For example, Family Medicine seems an odd specialty to define for occupational conditions. Similarly, Emergency Medicine seems an odd specialty for disputes about treatment. Psychiatric specialties might usefully be aggregated and the same could probably be said for internal medicine. In any case, nothing precludes a QME from asking for consults by a specialist when necessary. Time frames analysis Some time frames are dictated by statue and regulation, such as the time for DWC to issue a panel, the time for parties to select or strike a QME from a panel, and the time for the QME to complete the evaluation. The statutory dictates indicate a normative statement by the Legislature as to what constitutes an acceptable time frame for completing each step of this process. We can evaluate some of these steps and the success of the system at meeting the legislative expectations. Some time frames are not dictated. The most important of these are the time taken by represented parties to review QME reports before they submit them to the DEU for rating and the time required for DEU to complete the rating of a report once submitted. Timeliness of the process may vary by the type of claim and claimant. The most obvious example would be variation by whether the injured work is represented. If timeliness varies across this type of dimension, the system should be considered less equitable. Workers should not have to get an attorney to pursue a dispute expeditiously, nor should getting an attorney result in administrative delays in the dispute resolution process. The study distinguishes the represented and unrepresented cases at each stage of the QME process and measures timeliness and thus fairness, for each group and between the two groups.
QME Report 2010 19
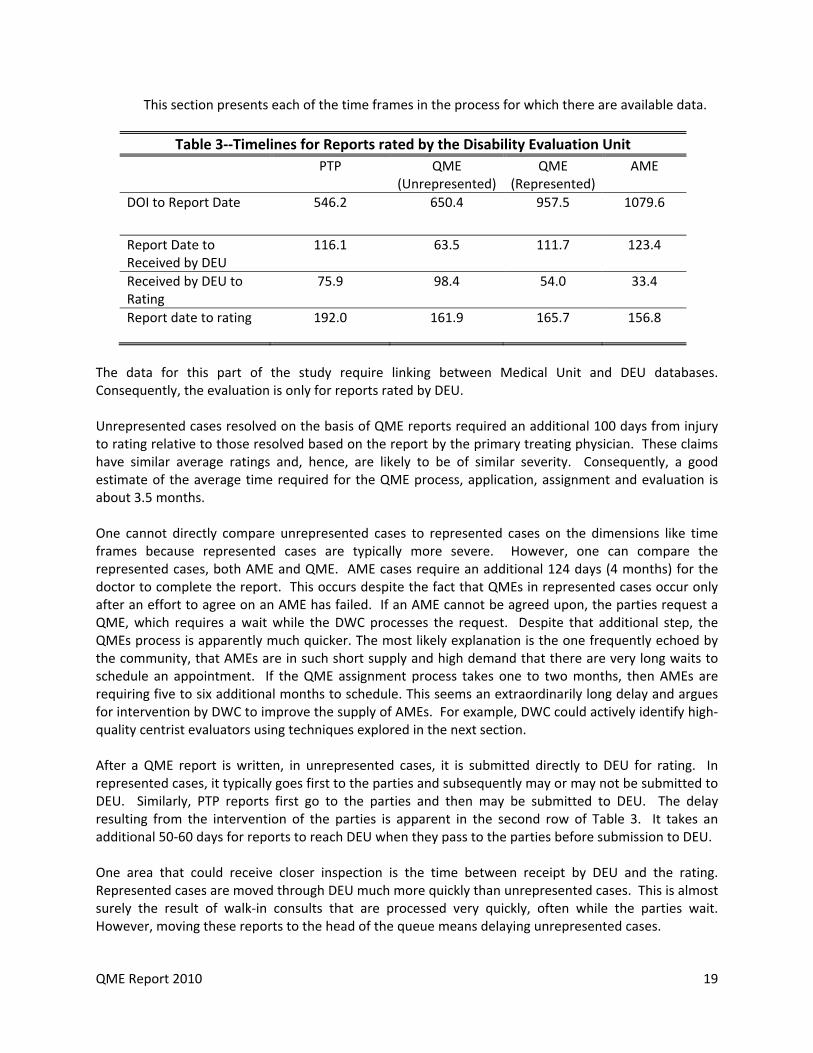
This section presents each of the time frames in the process for which there are available data.
Table 3‐‐Timelines for Reports rated by the Disability Evaluation Unit
PTP QME (Unrepresented)
QME (Represented)
AME
DOI to Report Date 546.2 650.4 957.5 1079.6
Report Date to Received by DEU
116.1 63.5 111.7 123.4
Received by DEU to Rating
75.9 98.4 54.0 33.4
Report date to rating 192.0 161.9 165.7 156.8
The data for this part of the study require linking between Medical Unit and DEU databases. Consequently, the evaluation is only for reports rated by DEU. Unrepresented cases resolved on the basis of QME reports required an additional 100 days from injury to rating relative to those resolved based on the report by the primary treating physician. These claims have similar average ratings and, hence, are likely to be of similar severity. Consequently, a good estimate of the average time required for the QME process, application, assignment and evaluation is about 3.5 months. One cannot directly compare unrepresented cases to represented cases on the dimensions like time frames because represented cases are typically more severe. However, one can compare the represented cases, both AME and QME. AME cases require an additional 124 days (4 months) for the doctor to complete the report. This occurs despite the fact that QMEs in represented cases occur only after an effort to agree on an AME has failed. If an AME cannot be agreed upon, the parties request a QME, which requires a wait while the DWC processes the request. Despite that additional step, the QMEs process is apparently much quicker. The most likely explanation is the one frequently echoed by the community, that AMEs are in such short supply and high demand that there are very long waits to schedule an appointment. If the QME assignment process takes one to two months, then AMEs are requiring five to six additional months to schedule. This seems an extraordinarily long delay and argues for intervention by DWC to improve the supply of AMEs. For example, DWC could actively identify high‐quality centrist evaluators using techniques explored in the next section. After a QME report is written, in unrepresented cases, it is submitted directly to DEU for rating. In represented cases, it typically goes first to the parties and subsequently may or may not be submitted to DEU. Similarly, PTP reports first go to the parties and then may be submitted to DEU. The delay resulting from the intervention of the parties is apparent in the second row of Table 3. It takes an additional 50‐60 days for reports to reach DEU when they pass to the parties before submission to DEU. One area that could receive closer inspection is the time between receipt by DEU and the rating. Represented cases are moved through DEU much more quickly than unrepresented cases. This is almost surely the result of walk‐in consults that are processed very quickly, often while the parties wait. However, moving these reports to the head of the queue means delaying unrepresented cases.

QME Report 2010 20
Concentration of QME registry and panel assignment Many factors determine the frequency that any QME will be assigned to a panel, for example the distribution of injured workers relative to QMEs locations or the distribution of injury types and the distribution of medical specialists. These factors are not typically within the regulatory or statutory power of the Legislature and DWC to control. However, some factors are within the range of legislative and regulatory action. For example, statute and regulation can affect how finely the agency defines specialties, how much flexibility QMEs have to identify multiple offices, and how having multiple offices and multiple specialties might affect a QME’s probability of assignment. The QME panel assignment process originally introduced in the 1989 reforms and later modified by the 1993 and 2003/4 reforms was meant to rely on random assignment of QMEs to avoid bias that can result when one or both parties select QMEs based on reputation. In addition, the legislation anticipated practicing doctors acting as QMEs while maintain a regular practice. Initially, this process operated as anticipated, at least to the extent that QME panel assignments were widely distributed across QMEs. The wide distribution and large number of QMEs also meant that the impact of any tendencies for subsets of QMEs to interpret (PD) schedules, apportionment, and the need for current or future medical treatment would tend to be minimized. However, the landscape of QME panel assignments has changed dramatically, even just since 2005. This change is highlighted by Figures 7 and 8 below.
Figure 7
QME Report 2010 21
Figure 8
The figures show that QME assignments have become increasingly concentrated among a small number of “high‐volume” QMEs. These QMEs are assigned a disproportionate share of evaluations for two reasons. First, they list multiple specialties within orthopedics, by far the dominant specialty area for panel assignments (67%). Second, they list more than 10 different locations at which they perform8 evaluations, some list more than 40. Over the period from 2005‐2010, the number of QMEs registered ranged from 3,000 to 5,500, but just 31 QMEs wrote 10% of all reports evaluated by the DEU.
8 Or claim to perform. Public comments have asserted that some QMEs frequently redirect workers to office locations other than the location listed on the panel assignment. Casual investigation found at least one QME location where the personnel had never heard of the QME physician. In response to the public comment, Counsel for DWC points out that regulations require that the examination be performed at the location listed on the panel assignment, except “upon written request by the injured worker and only for his or her convenience, the evaluation appointment may be moved to another medical office of the selected QME….” 8 Cal. Code of Regs. Sec. 34(b). Violation may allow a party to request a replacement QME (8 Cal. Code of Regs. Sec. 32.5(a)(11) and may result in discipline of the QME (Labor Code Sec. 139.2(k)(1). Violations can be reported to the DWC Medical Unit at 1‐800‐794‐6900.

QME Report 2010 22
While the concentration of QME evaluations among a small number of high‐volume doctors was not anticipated, that does not mean the outcome is contrary to public policy. Evaluating the outcome depends on how it affects one or more dimensions of the goals of the policy, for example, equity and timeliness. An equitable process in this case is defined as one resulting in outcomes for workers and employers, as measured by PD ratings, that are not affected by the concentration of evaluations among a limited set of QMEs. This would be true if, on average, evaluations by the high‐volume QMEs were the same as those by the all QMEs. If on the other hand, high‐volume QMEs as a group tended to interpret the PD schedule and other issues more generously or more conservatively, the tendency towards concentration would advantage one party or the other, in this case workers or employers, respectively. To evaluate this issue, we reviewed all rating done by DEU between 1/1/2005 and 6/12/2010 where all necessary data elements could be identified (approximately 451,000 ratings). We identified the doctor and the type of evaluation [PTP, AME, QME (represented), QME (unrepresented) and missing]. We also controlled for 20 categories of impairments and time trends in average ratings. The analysis was run separately for ratings done under the 1997 PD Schedule and the 2005 AMA‐based schedule. In all, this was ten separate regressions (two rating schedules and five types of evaluations, including the “missing” category). The results are presented in several different ways. Table 4 presents the regression results for the high‐volume QMEs relative to all other QMEs. The top rows of the table present coefficients for regressions where the dependent variable is the natural log of the final rating. This is just a fancy way of obtaining coefficients that give the percent impact of the key variables on the dependent variable. The coefficients presented are the impact of high‐volume QMEs. For example, high‐volume QMEs in represented cases under the 2005 schedule, on average, gave ratings that were 17.8% lower than other QMEs. On unrepresented cases using a QME, high‐volume QMEs gave ratings that were 7.3% lower. This pattern holds for both the new and old schedules and both represented and unrepresented cases. In addition, even when not acting in the role of QME, these doctors consistently rated substantially and significantly lower. This can be seen in the large negative coefficients on AME and PTP evaluations. The only two coefficients that are not significant at least at the p < .01 level are the “missing” category under the new schedule and the PTP evaluations under the 1997 schedule. With the introduction of the 2005 PD schedule, DEU has worked hard at improving the coding of rating information, and the number ratings with missing data on the type of report has declined substantially. PTP cases were likely the least frequently identified and dominate the missing category. The statistic on the PTP under the new schedule is significant at the .005 level; all other values are significant at <.001 or better. The second set for results in the table give the absolute (percentage point) impact of the high‐volume QME tendency. The significant impacts range from just less than one percentage point difference for unrepresented QME panels under the new schedule to over six percentage points difference for AME evaluations under the 1997 schedule. The reader should keep in mind that these absolute differences also reflect the very different averages of ratings between the 1997 and 2005 schedules and between represented and unrepresented cases. The percentage differences presented at the top of the table are probably more appropriate for comparisons of the impact of high‐volume QMEs across schedules and between represented and unrepresented cases.

QME Report 2010 23
Table 4‐‐Overall Difference High‐Volume QMEs vs. All Other Evaluators (within type of evaluation)
ln (rating) AME PTP QME
represented
QME unrepresented
Missing
2005 Schedule ‐0.135*** ‐0.098** ‐0.178*** ‐0.073*** ‐0.030
1997 Schedule ‐0.214*** ‐0.039 ‐0.190*** ‐0.147*** ‐0.122***
Adj. R2 (2005) .213 .298 .229 .205 .281 Adj. R2 (1997) .024 .123 .067 .075 .077
Rating AME PTP QME represented
QME unrepresented
Missing
2005 Schedule ‐3.19*** ‐1.67*** ‐2.99*** ‐0.97*** ‐1.03
1997 Schedule ‐6.02*** ‐0.07 ‐4.49*** ‐3.30*** ‐3.69***
Adj. R2 .190 .250 .186 .165 .274
Adj. R2 .039 .097 .055 .056 .065
n (2005) 42,532 45,215 21,207 27,073 6,035
n (1997) 47,116 48,831 26,751 21,522 77,607
** indicates p < .01 *** indicates p < .001
The differences between high‐volume QMEs and all other QMEs are striking for both their size and their consistency across schedules and types of evaluations. We were concerned about the potential for a few, very high‐volume QMEs to drive this result. Consequently, each of the high‐volume QMEs was analyzed separately within the same regression framework to evaluate the extent to which this pattern reflected a concentration among a few doctors or only a general pattern across all high‐volume doctors. Tables 5 & 6 give the results of this analysis. This analysis creates a large number of cells, some of which have only a small number of observations. For presentation purposes, only the results that are statistically significant are presented. In addition, the results are colored, light gray for above average ratings and dark gray for below average ratings. Again, the results are both striking and compelling. Nearly every high‐volume QME shows the same tendency towards conservative ratings.9 This tendency is apparent for all types of ratings and across both schedules.
9 In response to a public comment on how an injured worker can determine if a QME listed on the panel has numerous locations, Counsel for DWC informed us that the QME database can be searched by name to obtain a list of all of a QME’s listed locations. The search page is at http://www.dir.ca.gov/databases/dwc/qmestartnew.asp.

QME Report 2010 24
Table 5‐‐ High‐Volume QMEs Statistically Significant Differences From Mean of all Evaluations Within Type (1997 Schedule)
Unknown AME PTP QMR QMU
QME_1 -9.71 -6.11 -6.92
QME_2
QME_3 -7.26
QME_4 -8.88 -17.03 -17.56 -5.72
QME_5 -7.07 -11.3
QME_6 -28.77 -9.31
QME_7 -5.41
QME_8 -14.85 -10 -15.92
QME_9 -18.88 -14.18
QME_10 18.72
QME_11 -14.67 -21.26 -12.29 -5.83
QME_12 -19.87
QME_13 -12.24 -27.63 -10.4 -6.53
QME_14 -20.63 -39.92 -10.6 -8.84
QME_15 -20.5 -22.62 -16.84 -6.01
QME_16
QME_17 -15.16 -32.89 -17.04 -15.09 -8.52
QME_18 3.33 10.95 4.67 1.76
QME_19 48.82
QME_20 -9.89 -11.3 -7.93
QME_21 -11.54 -19.63 -9.66 -2.72
QME_22 -10.76 -13.74
QME_23 6.7 8.61 12.19
QME_24 11.94
QME_25 -30.97 22.7
QME_26 -12.05 -37.18 -12.65 -4.92
QME_27 -7.44 -28.41 -6.96 -5.49
QME_28 -16.25 -17.64 -5.05
QME_29 -7.86 -15.37
QME_30 -9.85 -38.93 -5.67 -15.04 -9.05
QME_31

QME Report 2010 25
Table 6‐‐High‐Volume QMEs Statistically Significant Differences From Mean of all Evaluations Within Type (2005 Schedule)
Unknown AME PTP QMR QMU
QME_1
QME_2
QME_3
QME_4 -2.1
QME_5
QME_6 -4.31 -2.16
QME_7 -11.42 -6.35 -2.21
QME_8 -3.32 -5.89 -1.64
QME_9 -6.55
QME_10 -3.55 -1.68
QME_11 -10.58 -2.54
QME_12 -20.18 -4.16 -2.59
QME_13 -2.9
QME_14 5.18
QME_15 -6.33 -3.98 -1.21
QME_16 -4.84 -3.39
QME_17 -14.45 -3.47 -1.61
QME_18 8.5 6.3 5.36
QME_19 3.59
QME_20 -6.45 -3.283
QME_21 -5.88 -1.494
QME_22 -5.87 -6
QME_23 2.9 3.15
QME_24 -3.11 -5.58 -4.3
QME_25 -2.66
QME_26 -5.9 -3.24
QME_27 -3.87 -2.15
QME_28 -6.86 -7.87 -3.93
QME_29 -4.2
QME_30 -5.71 -3.83
QME_31

QME Report 2010 26
One important dimension which can be affected by the increasing concentration of QME assignments is the time required to schedule appointments and get reports finished and submitted to the parties or DEU for evaluation. Concentration of QME assignments within a small group of high‐volume QMEs could theoretically shorten or lengthen the time required to get reports submitted to the parties. High‐volume QMEs may be skilled and efficient at examinations and report writing. In addition, their reports might be more readily accepted by parties because they are consistently well written and complete. On the other hand, multiple offices and a high volume of injured workers may make scheduling difficult and lead to delays in obtaining appointments and an increased need for second or even third requests for panels. Fortunately, we have data that allow us to examine how quickly various groups of QMEs see a patient and submit a report once a panel is assigned. For this work, DEU data was linked to the data on all panel assignments obtained from the DWC Medical Unit. In a significant fraction of cases, we were able to identify all the key milestones in QME reporting: date of panel assignment; the report date assigned by the doctor (could be either the appointment date or the date the report was written); the date received by DEU (either directly from the doctor in unrepresented cases or through the parties in represented cases); and the date the report was rated by DEU.
Table 7‐‐Median Times for Different Portions of QME Evaluations and Ratings
High‐volume QMEs All other QMEs Panel Assignment to Report Date 92 days 82 days Report Date to date Received by DEU 38 days 43 days Panel Assignment to received by DEU 133 days 131 days Received by DEU to Rating Date 77 days 81 days
Median times were used to minimize the impact of errors in identification of dates. These results show no particular advantage or disadvantage for high‐volume QMEs. For the medians, high‐volume QMEs may require somewhat longer to schedule the appointment, indicated by time to Report Date, but overall, the time from panel assignment to rating by DEU is not substantially affected by which group of QMEs is performing the evaluation. Discussion The results of this study suggest some potential changes to the system to improve both timeliness and equity. First, overall, the number of QMEs has tracked the number of disabling injuries. Any general problems with delays that the system experienced were likely resolved by the Sandhagen decision and other changes to the application of utilization and treatment guidelines. Ongoing problems are likely generated more narrowly by a mismatch in the supply of and demand for specific specialties:
DWC could conduct outreach efforts to specific specialties (orthopedic, pain, and psych, for example) to increase the registration of these providers.
DWC could also modify the Official Medical‐Legal Fee Schedule to increase reimbursement for underrepresented specialties relative to overrepresented specialties. The opportunity cost for orthopedists and similar specialties is almost surely higher than for less specialized providers like chiropractors and acupuncturists or even family practice physicians. Reimbursing at different rates would reflect the same public policy

QME Report 2010 27
decisions that moving to a Resource‐Based Relative Value Scale (RBRVS) for treatment reimbursement.
If stakeholders perceive the increasing concentration of QME assignments among a small number of very high‐volume providers as inconsistent with legislative intent and/or public policy, DWC could place restrictions on the number of locations at which any QME can register.
Limiting the concentration of reports among a small number of high‐volume QMEs could also increase the willingness of more providers to participate as QMEs. The concentration of assignments among a few QMEs means fewer assignments for the large number of remaining providers. This may explain why CHSWC has heard a number of concerns about QMEs dropping out due to too few assignments, despite the reasonably stable relationship between the number of panel requests and the number of QMEs.
QME Report 2010 28
Appendix Dispute Resolution Paths Two tracks to the QME are established: one for workers who are represented by attorneys;10 and one for workers who are unrepresented.11 The rationale for these separate tracks is that an unrepresented worker could be misled or out‐maneuvered by a sharp claims adjuster, but attorney representation puts a worker on an equal footing with the claims administrator. In a represented case, the parties can select an agreed medical evaluator (AME) and, failing agreement, each party has an equal right to reject one of the three randomly assigned QMEs. If the worker is unrepresented, there is no option for an AME, and only the worker is given the first chance to select the specialty of the QME and to select one QME from a randomly assigned panel of three. All of this is intended to assure that the selection process does not encourage bias on the part of the medical evaluator. Both the represented track and the unrepresented track lay out specific timelines for each step leading to the selection of the evaluator. The 2004 legislation generally re‐cast the unrepresented track without substantial change. The 2004 legislation fundamentally changed the represented track by requiring that a QME be selected from a three‐member randomly assigned panel if the parties did not select an AME. Until 2004, represented parties who did not agree on an AME could each select their own evaluator from among all the QMEs. The change to a single QME put additional stress on the QME panel resources, and it placed new importance on the quality of the pool of QMEs. These two tracks are overlaid on the three major routes into medical dispute resolution. The three major routes differ in terms of when different types of disputes arise over the course of a claim and who can initiate the dispute resolution process. The three major routes were laid out by legislation passed in 1989 and 1993, followed by a special route for spinal surgery issues enacted in 2003 and another system for treatment issues in medical provider networks (MPNs) in 2004. Section 4060 applies to disputes over whether a compensable injury12 has occurred. A claims administrator may initiate the process if the claims administrator needs the evaluation to determine compensability, a decision which the claims administrator is required to make within 90 days of receipt of the claim. If the claims administrator has denied the claim, perhaps on the basis of other medical evidence, then the worker can initiate the dispute resolution process. Section 4060 does not apply if any part of the claim has been accepted, such as an accepted claim for a knee injury combined with a disputed claim of a back injury arising from the same event. The rationale for Section 4060 is that the initial determination of compensability should be made by a neutral doctor, not by one who is chosen for his or her bias. While the majority of medical evaluations at the outset of claims might have been fair and unbiased, the policy decisions were driven by the egregious abuses. On the defense side, there were some medical evaluators who were routinely chosen because their reports would reliably lay the groundwork for denial of the claims. On the applicant’s side, there were doctors who would just as reliably find multiple compensable conditions in every case, sometimes running up thousands of dollars in expenses before the employer was even informed of the claim. The 2004 revisions of Section 4060 reflect the assumption that an unbiased evaluator would give a more credible assessment of the existence of a compensable injury, and that the process would
10 Labor Code §4062.2. 11 Labor Code §4062.1. 12 “Injury” includes both injury and disease, per Labor Code Section 3208.

QME Report 2010 29
reduce the incentives for litigation. The claims administrator can initiate the process if it needs a medical evaluation to decide whether to accept or deny the claim, a decision which must be made within 90 days after receiving a claim form. The employee can initiate the process if the claims administrator has denied the claim without going through the Section 4060 process.
Section 4061 applies to disputes over PD, also called permanent impairment and limitations, and it includes apportionment. Either the employee or the claims administrator may initiate the dispute resolution process.
The parties are free to agree on a PD evaluation based on the treating physician’s evaluation. If they do not agree, either party may initiate the medical dispute resolution process. There is no fixed timeline for the parties to seek agreement before initiating the process.
Section 4062 (a) applies to any other issue requiring medical determination, with certain exceptions. For example, 4062 applies to nature and extent of injury such as the case of a disputed claim of back injury in conjunction with an accepted knee injury. Other examples could include a question of whether the employee’s current medical condition is compatible with the demands of a job, or a question of whether the condition has reached maximum medical improvement. The issues that are not subject to Section 4062(a) are the issues that are covered by Sections 4060, 4061, 4062(b), or certain medical treatment issues. Medical treatment issues are some of the most common issues presented under Section 4062, but only if presented by the injured worker. An employer’s only avenue for disputing the medical appropriateness of a treating doctor’s treatment plan is through utilization review under Section 4610.13 If the employee takes issue with a treating doctor’s recommendation, or if the employee takes issue with the employer’s utilization review decision, Section 4602(a) is the employee’s path to dispute resolution. All of these issues are assumed to begin with an opinion of the treating physician which is contested by either the employee or the employer. Whichever party wants to initiate the dispute resolution process must do so within 20 days of receipt of the contested report of the treating physician if the worker is represented by an attorney, or 30 days if the employee is not represented.
The rationale for Section 4062(a) is to promptly and clearly identify disputes and bring them to an unbiased evaluator. Employer objections to treatment recommendations are excluded because utilization review was specifically designed to establish a process where employer decisions on medical treatment issues would be made in accordance with recognized guidelines, where the authorization decisions would be made swiftly so that appropriate treatment could proceed and inappropriate treatment could be avoided, and where only a physician and not a claims adjuster would have the authority to reject another physician’s appraisal of medical appropriateness.
Section 4062(b) applies only to employer objections to a report of a treating physician recommending spinal surgery. The employer has ten days in which to object and initiate the separate dispute resolution process in which a spinal surgery second opinion physician is appointed from a specialized panel. If the applicant is represented, there is a ten‐day period for the parties to seek agreement on an AME before requesting the appointment of a second opinion physician. The examinations are to be expedited and focused on this one issue.
13 State Compensation Insurance Fund v. WCAB (Sandhagen) (2008) 44 Cal.4th 230.
QME Report 2010 30
The rationale for Section 4062(b) is that spinal surgeries are high‐stakes procedures which should not be conducted if there is any doubt, unless the necessity is confirmed by an independent specialist qualified to address these particular issues. It was believed that a significant number of spinal surgeries were inappropriate and were causing harm to patients. The dispute resolution process was intended to prevent unnecessary spinal surgeries while approving appropriate surgeries with less delay than any dispute resolution process previously adopted. Subsequent research has found no significant difference in the rate at which spinal surgeries were performed after second opinions were obtained under Section 4602(b) and the rate at which they are performed after employers objected but missed the strict requirements to obtain second opinions under this subdivision.14 The implication is that either the mere existence of this process deters inappropriate recommendations for spinal surgery or that this process is redundant because of other safeguards adopted around the same time. This path is not well coordinated with other dispute resolution processes despite judicial efforts to harmonize various statutes. A wholly separate medical dispute resolution system is prescribed for injured workers who dispute the treatment decisions of doctors in medical provider networks (MPNs). Over half of all workers’ compensation medical care is now being delivered through MPNs which are established by either the self insured employers or the insurers that cover the injuries. If the patient disputes the diagnosis or treatment prescribed by the MPN doctor, the patient can request a second and third opinion within the MPN,15 and if the patient’s request is still not satisfied, the patient can request an independent medical review.16 This process is adapted, or bastardized, from the independent medical review process which performs quite admirably in group health settings. Weighted down with the adaptations to make it seem compatible with the workers’ compensation setting, however, this cumbersome process has been used only a handful of times. It appears that dissatisfied patients simply switch doctors within the MPN until they find someone they are satisfied with. There are also a number of cases in which patients procure treatment from a doctor of their choice outside of the MPN and contend that they were not required to stay within the MPN. Some MPNs may have achieved the ideal of providing such high‐quality care that patients have no reason to dispute the doctors’ advice. It is outside the scope of this project to evaluate the MPN dispute resolution process or the quality of treatment in MPNs.
14 CHSWC Report and Recommendations on the Spinal Surgery Second‐Opinion Process, April 27, 2007 15 Labor Code §4616.3(c). 16 Labor Code §4616.4.